validated and transparent energy storage valuation and ...€¦ · appendix . energy research and...
TRANSCRIPT
Energy Research and Development Division
FINAL PROJECT REPORT
Validated and Transparent Energy Storage Valuation and Optimization Tool
Appendix C: Energy Storage Valuation in California: Policy, Planning and Market Information Relevant to the StorageVET™ Model
California Energy Commission
Edmund G. Brown Jr., Governor March 2017 | CEC-500-2017-016-APC
Energy Storage Valuation in California: Policy, Planning and Market Information Relevant to the StorageVET™
Model
3002008901 Technical Update, December 2016
EPRI Project Manager
B. Kaun
ELECTRIC POWER RESEARCH INSTITUTE 3420 Hillview Avenue, Palo Alto, California 94304-1338 PO Box 10412, Palo Alto, California 94303-0813 USA
800.313.3774 650.855.2121 [email protected] www.epri.com

DISCLAIMER OF WARRANTIES AND LIMITATION OF LIABILITIES THIS DOCUMENT WAS PREPARED BY THE ORGANIZATION(S) NAMED BELOW AS AN ACCOUNT OF WORK SPONSORED OR COSPONSORED BY THE ELECTRIC POWER RESEARCH INSTITUTE, INC. (EPRI). NEITHER EPRI, ANY MEMBER OF EPRI, ANY COSPONSOR, THE ORGANIZATION(S) BELOW, NOR ANY PERSON ACTING ON BEHALF OF ANY OF THEM:
(A) MAKES ANY WARRANTY OR REPRESENTATION WHATSOEVER, EXPRESS OR IMPLIED, (I) WITH RESPECT TO THE USE OF ANY INFORMATION, APPARATUS, METHOD, PROCESS, OR SIMILAR ITEM DISCLOSED IN THIS DOCUMENT, INCLUDING MERCHANTABILITY AND FITNESS FOR A PARTICULAR PURPOSE, OR (II) THAT SUCH USE DOES NOT INFRINGE ON OR INTERFERE WITH PRIVATELY OWNED RIGHTS, INCLUDING ANY PARTY'S INTELLECTUAL PROPERTY, OR (III) THAT THIS DOCUMENT IS SUITABLE TO ANY PARTICULAR USER'S CIRCUMSTANCE; OR
(B) ASSUMES RESPONSIBILITY FOR ANY DAMAGES OR OTHER LIABILITY WHATSOEVER (INCLUDING ANY CONSEQUENTIAL DAMAGES, EVEN IF EPRI OR ANY EPRI REPRESENTATIVE HAS BEEN ADVISED OF THE POSSIBILITY OF SUCH DAMAGES) RESULTING FROM YOUR SELECTION OR USE OF THIS DOCUMENT OR ANY INFORMATION, APPARATUS, METHOD, PROCESS, OR SIMILAR ITEM DISCLOSED IN THIS DOCUMENT.
REFERENCE HEREIN TO ANY SPECIFIC COMMERCIAL PRODUCT, PROCESS, OR SERVICE BY ITS TRADE NAME, TRADEMARK, MANUFACTURER, OR OTHERWISE, DOES NOT NECESSARILY CONSTITUTE OR IMPLY ITS ENDORSEMENT, RECOMMENDATION, OR FAVORING BY EPRI.
THE ELECTRIC POWER RESEARCH INSTITUTE (EPRI) PREPARED THIS REPORT.
This is an EPRI Technical Update report. A Technical Update report is intended as an informal report of continuing research, a meeting, or a topical study. It is not a final EPRI technical report.
NOTE For further information about EPRI, call the EPRI Customer Assistance Center at 800.313.3774 or e-mail [email protected].
Electric Power Research Institute, EPRI, and TOGETHER…SHAPING THE FUTURE OF ELECTRICITY are registered service marks of the Electric Power Research Institute, Inc.
Copyright © 2016 Electric Power Research Institute, Inc. All rights reserved.
iii
ACKNOWLEDGMENTS The Electric Power Research Institute (EPRI) prepared this report.
Principal Investigators U. Helman (Helman Analytics)
B. Kaun G. Damato A. Cortes R. Entriken
This report describes research sponsored by EPRI.
The authors would like to thank the California Energy Commission (CEC) for generous funding and support of this research. Without this project, the development of StorageVET™ (Storage Value Estimation Tool), a publicly available optimization and simulation tool for energy storage benefit-cost analysis, would not have been possible.
Related to CEC Project: “Validated and Transparent Energy Storage Valuation and Optimization Tool” EPC14-019.
This publication is a corporate document that should be cited in the literature in the following manner:
Energy Storage Valuation in California: Policy, Planning and Market Information Relevant to the StorageVET™ Model. EPRI, Palo Alto, CA: 2016. 3002008901.

iv

v
ABSTRACT This report provides descriptions and technical details related to the valuation of energy storage operated in the California electric power system. It reviews policies, programs, and markets relevant to the use and treatment of energy storage implemented by the California Public Utility Commission (CPUC), California Independent System Operator (CAISO), electric utilities, and others. The research provides important background for the development of the Storage Value Estimation Tool (StorageVET™). It is also intended to provide information of use for other energy storage modeling efforts. StorageVET is a publicly accessible and customizable cost-benefit model of stand-alone storage technologies and certain aggregations of storage with other distributed resources, such as solar photovoltaics (PV). The latest information about the model and its supporting documentation are available at www.storagevet.com. Although initially developed for applications in California, the tool can be adapted for other regions and utilities, with an update of certain model parameters and data sets. This report covers a range of California applications for storage resources deployed at different sizes and voltage levels. It should help StorageVETTM users to gain confidence in model configuration and interpretation of results. Depending on the location and storage attributes, applications may include provision of wholesale market services (both day-ahead and real-time markets), resource adequacy (RA) capacity, transmission and distribution deferral, distribution services, customer-bill reductions, backup power, increased solar utilization, and other benefits. StorageVET may be utilized by regulators, policy analysts, researchers, and various market participants—including investor-owned utilities (IOUs), publicly-owned utilities (POUs), and independent storage developers and operators. Each of these entities will need to adjust the inputs to the tool to reflect the relevant project characteristics. The report also explains how modeling approaches in StorageVET could affect estimates of storage value, and how users and other entities can estimate such errors via operational validation of actual storage technologies. It discusses potential interfaces between the tool and various types of power-system models, such as production-cost models and power flow models used for distribution planning and operations. This report is intended to make relevant information from other sources accessible to the StorageVET user, but it is not intended to replace detailed primary source information. Market rules change fairly frequently, and experience with modeling and operating advanced energy storage in California is nascent. Therefore, it is anticipated that this report will be updated periodically. Keywords California power markets Energy storage Energy storage valuation StorageVET Integrated grid


vii
EXECUTIVE SUMMARY This report provides general descriptions and technical details about the California policy, program and market contexts for energy storage use-cases and applications modeled in the Storage Value Estimation Tool (StorageVETTM) and other storage valuation tools. StorageVET and supporting documentation are available at www.storagevet.com. The purpose of the report is to allow StorageVET users to gain understanding of how storage valuation is conducted in California, and how the quantitative results available through the tool should be interpreted. Notably, this includes details on how storage resources will be modeled, operated, and valued by California entities when providing one or more wholesale market services and resource adequacy capacity, distribution integration capacity analysis and distribution services, transmission and distribution deferral, and customer-sited services such as retail rate reductions and backup power. In addition, the report explains the correspondence between the StorageVETTM model structure and actual storage operations. Most of the relevant regulatory rules, market designs, and utility rates are summarized, along with guidance on key references for further consultation. However, because rules and pricing mechanisms change fairly often, the user should also check the most recent versions of the relevant documentation to ensure accuracy.
This executive summary does not include references, which can be found in the relevant sections of the report. The objective of this report is not to substitute for source documentation, but to help make it accessible to the StorageVET user.
Description of StorageVET StorageVET is a cost-benefit analysis model of stand-alone storage technologies and certain aggregations of storage with other distributed resources. The model includes a financial analysis for the annual fixed cost requirement of different storage technologies, and estimates net benefits from market revenues and avoided costs, depending on the storage application. Table ES-1 shows the list of services currently represented in StorageVET for the California and Western U.S. market context. The rest of this summary describes the sources of the data inputs for modeling the services and the interpretation of StorageVET results. The financial model can include revenues from state and federal financial incentives. These inputs and outputs are described further in several associated documents, notably the StorageVE Software User Guide, and referenced in this report.
StorageVET reflects the requirements of different applications through the use of several constraints – minimum and maximum charge, discharge, and state-of-charge (SOC) – each of which can be time-varying. Storage technologies can be further characterized by parameters such as charging and discharging efficiency, ramp rates, and real and reactive power constraints. When multiple services are eligible to be provided, StorageVET can use prices, costs and fixed operating requirements to develop optimal schedules for providing each service.
StorageVET does not directly evaluate the impact of storage operations on power system operations or markets, or on the utilization of other components of power systems. It can directly consider certain external power system constraints on storage operations, such as those resulting from capacity and reliability constraints on distribution elements. It can also be used in tandem with different types of power system models to calculate forecast storage revenues or to obtain additional possible storage operational solutions to use in those models. For that reason, there is selected description of power system operations and models in this report. Many of these

viii
potential uses of StorageVET or similar tools are still in the research stages and will take time to become standard components in resource planning and transmission and distribution planning. Hence, some uses of the tool described in this report should be interpreted as proposals which need demonstration.
Table ES–1 StorageVET modeled applications with source of market price, retail rate or avoided cost
StorageVET Modeled Services
CAISO Markets/Tariff Rates
Bilateral Markets or Internal Utility Dispatch Costs
Utility Rates/ Customer-sited Applications
T&D Investment and Operations
Resource Adequacy Capacity Day Ahead Energy Time Shift Real Time Energy Dispatch Flexible Ramping Product Frequency Regulation Spinning Reserve Non-Spinning Reserve Black Start T&D Investment Deferral Transmission Congestion Relief
Transmission Voltage/Reactive Power Support
Equipment Life Extension Losses Reduction Voltage Control Retail Demand Charge Reduction
Retail Energy Time Shift Power Quality Backup Power Demand Response Program Participation
PV Self-Consumption (FITC Eligibility)
California Power Markets, Policies, and Programs How storage projects are evaluated is in part a function of the entity planning or procuring the project, and for which purposes it is being deployed. The structure of the California power market includes investor-owned utilities (IOUs) subject to partial restructuring in the 1990s, several types of publicly owned utilities (POUs), several other types of load-serving entities (LSEs), and independent resource owners. These entities can own storage assets under applicable regulatory rules, or enter into long-term contracts with storage projects developed by other parties. Depending on the attributes of the storage resources, these entities and others can participate in competitive wholesale markets for energy and ancillary services as well as enter into bilateral transactions for these products and Resource Adequacy capacity. Certain POUs will operate storage within a vertically integrated utility structure while others will operate them through the wholesale markets. In addition, there are several types of transmission owners and

ix
providers, including IOUs, POUs and non-utility entities, as well as utility distribution companies. Storage may be developed solely as a transmission or distribution asset, as well as providing multiple use applications across these domains, where allowed.
The incentives to develop energy storage in California flow through a variety of state and federal policies, regulatory programs, and in response to retail rates and wholesale market products and prices. Several of the State policies and programs which create incentives for storage development require compliance by load-serving entities (LSEs), which include IOUs, POUs, and other entities such as community-choice aggregators (CCAs) and energy service providers (ESPs). These entities can either own or contract with storage projects, subject to regulatory rules. The programs target storage in three primary domains – transmission-connected, distribution-connected, and customer-sited – for both applications in one domain as well as multiple use applications which include more than one domain.
The California storage policies enacted by legislation are currently the primary drivers of storage procurement in California. The policy enacted by Assembly Bill (AB) 2514 in 2011 requires that regulatory entities evaluate the cost-effectiveness of storage to meet system needs and establish procurement targets for jurisdictional LSEs. To date, the primary component of this policy is a requirement that CPUC-jurisdictional IOUs must procure at least 1,325 MW of new, eligible storage by 2020; for CCAs and ESPs, the requirement is sufficient storage procured to meet 1% of 2020 annual peak load. More recently, the CPUC and state legislature have added new storage procurement requirements which may be additional to the prior mandate. The POUs are required to comply with the policy, and report to the California Energy Commission (CEC), but can utilize their own board-approved procurement decisions to make determinations on the quantity and type of storage projects. Subject to regulatory approval, the costs of these types of utility projects can be included in retail rates.
Other policies and programs which can elicit storage include the Renewable Portfolio Standard (RPS), the Small Generator Incentive Program (SGIP), the Net Energy Metering (NEM) program, and Demand Response (DR) programs. Depending on the program rules, storage projects developed under these other programs may count towards the procurement requirements.
Storage projects can also be developed on a merchant or independent power producer basis within the CAISO footprint. Such projects earn market-based revenues or can enter into bilateral forward contracts with buyers to sell their services. However, they may not have access to all storage market benefits under current pricing rules and take market risk resulting from changes in market prices.
Storage projects located outside California can also potentially sell services into the California and regional market using a variety of evolving mechanisms, notably dynamic scheduling with the CAISO and real-time energy operations in the Energy Imbalance Market (EIM) which also affects market operations within California. Expansion of the CAISO day-ahead market is also under consideration, which would offer direct participation for a wider range of market services across a wider region.
Finally, storage projects are components of evolving mechanisms for distribution resource planning and transmission planning. Distributed energy resources, including storage, are required to be evaluated as alternatives to distribution upgrades, as well as to affect DER hosting capacity

x
analysis. Storage projects may participate within the transmission planning processes of California transmission planning entities, including the CAISO and the POUs. In the CAISO process, storage projects, individually or through an aggregation of resources, can request generation interconnection and can participate as alternatives to otherwise needed transmission projects, which fall into several categories, notably reliability, policy-driven and economic transmission projects.
Storage Valuation Requirements under California Policies There are several types of storage valuation which take place in the California markets, including:
• Analysis conducted for resource procurement and long-term planning by LSEs under both regulatory requirements for standardized analysis and internal utility proprietary methods;
• Analysis conducted by non-utility entities of storage value, including opportunities to install and operate storage in response to combinations of wholesale markets, state financial incentives and retail rate benefits;
• Analysis of policy implementation by regulatory agencies, such as review of utility procurement decisions and variants on cost-effectiveness analysis for programs which affect long-term demand.
StorageVET can be used to calculate valuation components of these analyses, providing greater accuracy when conducting joint optimization among multiple services.
Storage Domains and Applications Storage can be operated through a variety of resource types utilized by California market entities. Table ES-2 (adapted from [1]) shows the matrix of possible applications by in-front-of-meter (IFOM) resources and behind-the-meter (BTM) resources in the transmission-connected, distribution-connected, and customer-sited domains. Columns with only one check indicate a resource dedicated to a single type of domain service; for example, a resource which is either IFOM or BTM but is only providing wholesale market services. Columns with 2 or 3 checks indicate what the CPUC and CAISO have called multiple-use applications (MUA).
Table ES–2 Matrix of single use and multiple use application use-case categories
Types of Applications
Storage Domains
Transmission Connected
Distribution Connected Customer-Sited
In-Front-Of-Meter (IFOM) Behind-The-Meter (BTM)
Retail Customer Services
Distribution Grid Services

xi
Wholesale Market/Resource Adequacy
Distributed Energy Resource Programs Distributed energy resources (DER) are generally classified as small resources under 20 MW connected to the transmission system, along with distribution-connected and customer-sited resources. In June 2016, the CEC calculates that California has 8,240 MW of renewable distributed energy resources. Table ES-3 identifies how distributed storage can enter under different policies, in addition to storage procured under utility storage procurements.
Table ES–3 DER technologies eligible under different programs
Program Eligible Technologies Storage as Stand-alone or
Integrated DER
Demand Response (DR) programs Load reduction technologies DR can include BTM storage as stand-alone or integrated with other DER technologies; see further discussion below.
Self-Generation Incentive Program (SGIP)
Wind turbines, waste heat to power technologies, pressure reduction turbines, internal combustion engines, microturbines, gas turbines, fuel cells, and advanced energy storage systems
Stand-alone or integrated
Net Energy Metering (NEM) Solar, wind, biogas, and fuel cell generation facilities (1 MW or less)
Integrated only
Renewable Portfolio Standard (RPS)
Solar, wind, geothermal, small hydro, biomass, biogas
Integrated only
Demand Response (DR) is provided by load reductions in response to retail rates, market prices or reliability conditions on the power system. Table ES-3 shows how the CPUC has bifurcated different DR programs among its jurisdictional LSEs. The programs can be further divided among interruptible/reliability programs and market price responsive programs. In 2015, these two categories each provided about half of the 2,100 MW of IOU DR capacity. Also in 2015, approximately 200 MW, were offered into the CAISO market as price responsive, and of that, about 5% was dispatched.
Table ES–4 CPUC Demand Response programs

xii
Load Modifying Resources Supply Resources Critical Peak Pricing (CPP) Time of Use (TOU) Rates Permanent Load Shifting (PLS) Real Time Pricing (RTP) Peak Time Rebate (PTR)
Aggregator Managed Programs (AMP) Demand Bidding Program, (DBP) Capacity Bidding Program (CBP) Air Conditioner (AC) Cycling Agricultural Pumping Interruptible (API) Base Interruptible Program (BIP)
StorageVET can model storage supporting several of these programs. The operation of relevant load-modifying resources is modeled via the use of retail rate structures and/or wholesale prices to replicate or anticipate real-time pricing. The relevant supply resources are translated into the CAISO market participation models for DR – Proxy Demand Response (PDR) and Reliability Demand Response Resource (RDRR) – discussed below. DR resources provide wholesale energy and reserves entirely through load management (i.e., they cannot supply energy as an injection to the CAISO system). DR resources qualify as capacity resources for the capacity that can sustain a 4 hour demand drop. StorageVET can be used to size the storage capacity for a particular load profile, given a set of expected peak load hours.
Wholesale Markets Wholesale markets operated by ISOs provide open access to transmission and transparent market prices for the sale and purchase of a set of defined products, including energy and certain ancillary services. The CAISO operates the California wholesale markets, as well as the Energy Imbalance Market (EIM) which incorporates several other utilities external to California in the WECC region.
The CAISO markets include a Day-Ahead Market (DAM) and the Real-Time Market (RTM). The DAM process consists of a market power mitigation step, followed by the Integrated Forward Market (IFM) and the Reliability Unit Commitment (RUC). The RTM includes the Hour-Ahead Scheduling Procedures (HASP) as well as a Fifteen Minute Market (FMM) and a five-minute real-time economic dispatch (RTED) solution. The CAISO markets jointly optimize energy and market-based ancillary services, along with a Flexible Ramping Product in the RTM, while respecting fixed operating schedules which reflect participant decisions. The EIM consists of a RTM, with similar rules and procedures to the CAISO RTM. The EIM only optimizes real- time Energy and the Flexible Ramping Product; reserves are maintained by each participating balancing area authority (BAA).
CAISO Market Participation Requirements and Models
Participants in the CAISO markets must follow one of several different market participation models. These models are written generally, but in some cases are specific to certain technologies. In each case, the market participation model embodies certain modeling and operational requirements. Storage technologies can potentially utilize several of these models, as summarized in Table ES-5.
Table ES–5 CAISO market participation models with relevant storage technologies
Market Participation Model Types of Resources Eligible to
Utilize Model Types of Storage Technologies Which Are or Could Be Eligible
Non-Generator Resource (NGR) Storage technologies, Demand Energy-limited electrical storage –

xiii
Response, Microgrid longer duration batteries, flywheels NGR-Regulation Energy Management (REM)
Storage technologies Short duration, limited energy storage used for Regulation only –
batteries, flywheels Distributed Energy Resource (DER) Aggregation
Aggregation of Distributed Energy Resources, including storage
Any technologies that are within the size and locational constraints of a
DERP Proxy Demand Response (PDR) Demand Response technologies Storage utilized to provide demand
response. Behind-the-meter storage sufficient to qualify for non-spinning
reserve or RA capacity Reliability Demand Response Resource (RDRR)
Demand Response technologies Storage utilized to provide demand response. Behind-the-meter storage
sufficient to qualify for non-spinning reserve or RA capacity
Pumped Storage Pumped Storage Pumped Storage Participating Generator Hydro, Steam Turbines, Renewable
Generation Any storage integrated with a
generator which does not consume energy from the grid (e.g.,
concentrating solar power with thermal energy storage;
conventional steam generation with thermal storage; PV with integrated storage which charges from the PV
Constrained Output Generation Combustion Turbines N/A Multi-Stage Generating Resources Combined Cycle Gas Turbine
(CCGT) N/A
Participating Load Mostly Pumping Loads, including associated with Pumped Storage
Pumped Storage during pumping; agricultural pumps
System Resources Generators located outside the CAISO Balancing Authority Area
(BAA)
Storage technologies located outside the CAISO BAA
CAISO and EIM Market Products
Table ES-6 shows the seven current bid-based products transacted in the CAISO Day-Ahead Markets and the CAISO and EIM Real-Time Markets, with procurement intervals in the IFM and RTM and selected characteristics and participation requirements. Capacity products are discussed in the next section. Storage can provide these services via the participation models shown in Table ES-5 and Table ES-7 Some key characteristics are discussed next and pricing details are the following sections. In addition, to these products, the CAISO has markets for Congestion Revenue Rights (CRRs), which are not discussed extensively in this report.
Table ES–6 CAISO and EIM Market Products – procurement interval and selected requirements
Market Products
CAISO Markets
EIM Market Procurement Interval
Market Procurement Quantity
Minimum Continuous Energy Req.
Resource Eligible Range
Energy
IFM 60 min. MWh 60 min. Output sustainable for 60 mins
RTM – FMM
15 min. MWh 60 min Output sustainable for

xiv
60 mins RTM – RTED
5 min. MWh 60 min Output sustainable for 60 mins
RUC Availability Capacity
DAM – RUC
60 min. MW 60 min Capacity reserved for energy dispatch
Flexible Ramping Product
RTM - FMM
15 min. MW 60 min Output sustainable for up to 60 mins
RTM - RTED
5 min MW 60 min Output sustainable for up to 60 mins
Spinning Reserves
IFM 60 min. MW 30 min. RR × 10 min. RTM 60 min. MW 30 min. RR × 10 min.
Non-Spinning Reserves
IFM 60 min. MW 30 min. RR × 10 min. RTM 60 min. MW 30 min. RR × 10 min.
Regulation Up
IFM 60 min. MW (capacity, mileage)
60 min.; 15 min for NGR-REM
RR × 10 min.
RTM 60 min. MW (capacity, mileage)
30 min.; 15 min for NGR-REM
RR × 10 min.
Regulation Down
IFM 60 min. MW (capacity, mileage)
60 min.; 15 min for NGR-REM
RR × 10 min.
RTM 60 min. MW (capacity, mileage)
30 min.; 15 min for NGR-REM
RR × 10 min.
Acronyms: RR – ramp rate.
Table ES–7 CAISO market participation models eligibility to provide wholesale market services
IFM-Energy RTM-Energy,
FRP Regulation
Up/Regulation Down
Spinning Reserves
Non-Spinning Reserves
NGR NGR-REM DER Aggregation
Pumped Storage
PDR RDRR Participating Generator
Participating Load
Energy
Energy is defined as injections and withdrawals of real power (MWh). Energy is transacted in both the IFM and RTM, where sufficient energy is procured or scheduled to meet load and compensate for line losses. Both markets have a minimum continuous energy requirement of 60 minutes. Depending on the market participation model, storage resources may have different

xv
options to provide Energy and to represent operational attributes or constraints. Storage resources can bid a starting state-of-charge for the IFM, represent a maximum and minimum stored energy limit, as well as a lower and upper charge limit for each trading day, along with other operational parameters. They have the option to self-manage state-of-charge in the RTM. StorageVET can represent both storage operated in the IFM and in the Fifteen Minute Market.
Flexible Ramping Product
The Flexible Ramping Product (FRP) is a ramping reserve product procured in the RTM through the application of a flexible ramping constraint which targets a ramping range for committed system resources in both the FMM and RTED. The FRP is subdivided into two components: the Forecast Movement award, which is the energy difference between energy dispatch intervals (15 minute and 5 minute); and the Uncertainty Award, which is capacity reserved to meet uncertain ramping requirements during energy dispatch intervals (15 minute and 5 minute). The FRP is procured on a co-optimized basis with real-time Energy and ancillary services, and all dispatchable resources with ramping range are paid for FRP when the FRP price is positive. StorageVET can co-optimize Energy and the FRP in the FMM.
Regulation
Regulation is a balancing service in which eligible resources follow an automatic 4 second signal on a fairly continuous basis. In the CAISO markets, Regulation Up and Regulation Down are separate market products. CAISO procures 100% of the daily requirement in the IFM, with any residual requirements in the RTM. The Regulation product has two components: a capacity component (MW) which defines the range of Regulation Up and Regulation Down on a particular resource; and a mileage component, which is defined as the absolute sum of the upwards and downwards change in MW when providing Regulation. The CAISO procures Regulation capacity on an hourly basis and uses a mileage estimate to adjust the type of resources procured to meet the capacity requirement on a least cost basis.
A resource’s eligible range for Regulation is its Regulation ramp rate × 10 minutes. If ramp rate unconstrained, a storage resource’s eligible Regulation capacity depends on the participation model: a resource operated under the NGR-REM model can offer the range it can sustain for 15 minutes, while a resource under the NGR or other models must be able to sustain regulation up or down for 60 minutes for capacity awarded in the IFM and 30 minutes for capacity awarded in the RTM. Other types of storage technologies, such as pumped storage, will be operated more like conventional generation, with the regulation dispatched around a generation energy dispatch point.
Regulation requires continuous charging and discharging of energy when following the Regulation control signal. As noted above, resources clear Regulation capacity and mileage in both the day-ahead and real-time markets, but then pay for energy charged to account for discharging and efficiency losses during real time operations. Under the SOC management method for the NGR-REM model, a resource is not required to participate in the Energy markets; however, for all other participation models, resources must submit an Energy bid. StorageVET can represent Regulation as a single service or co-optimized with other services in the IFM. The tool allows for calculation of energy make-up costs due to efficiency losses when providing Regulation using FMM energy prices.
xvi
Spinning and Non-Spinning Reserve
Spinning and Non-Spinning Reserves are reserve capacity held to address contingencies. These reserves are thus rarely dispatched for Energy. The CAISO procures sufficient contingency reserves to meet an hourly formula based on the higher of the single largest contingency or 3% of the sum of forecast load, internal generation and net pseudo and dynamic schedules. The CAISO procures 100% of its contingency reserves in the IFM, with any residual requirements in the RTM. Spinning Reserves must account for at least 50% of procurement, and can substitute for Non-Spinning Reserves, but not vice-versa. A resource’s eligible range for contingency reserves is its ramp rate times 10 minutes, up to its maximum operating level, with a minimum continuous energy requirement of 30 minutes. In other words, a 1 MW, 0.5 MWh device when fully charged could provide 1 MW of contingency reserves. A resource offering these reserves must also submit an Energy bid into the IFM or RTM. StorageVET can model contingency reserves in the IFM, co-optimized with other services.
Frequency Response
The CAISO is required to meet a Frequency Response Obligation to support frequency control in the WECC. Currently, this obligation is being met primarily through additional requirements to conventional generation, procurement of capability from outside the CAISO, and enhanced utilization of contingency reserves. Evaluation of a market mechanism, including development of a reserve product, will begin in 2017. In the interim, users of StorageVET could use the representation of Spinning Reserves as a proxy for a frequency responsive reserve.
Operating and Bid Parameters for Different Applications
StorageVET includes a number of operating parameters, including upper and lower operating levels, charging rate, discharging rate, efficiency loss, state of charge for identified intervals. These parameters are generally consistent with those required for actual operations.
The CAISO allows a unit to “bid” its SOC for the initial interval of an award in the IFM. For the NGR-REM model, the CAISO aims to maintain a 50% SOC at the start of each 15 minute interval when providing Regulation.
When calculating market revenues, StorageVET can be operated as either a “price-taker” (meaning that it optimizes storage operations using market price and cost inputs) – which is functionally equivalent to offering at a very low price for discharging (e.g., -$150/MWh) and bidding a very high price (e.g., $1,000/MWh) for charging – or can include reservation prices for certain services below which the storage resource will not provide the service. Either of these approaches replicates aspects of resource bidding behavior. However, the model does not let the storage resource set the market price through an offer or bid.
Calculating Eligible Storage Capacity for Wholesale Market and Capacity Offers or Schedules
For each type of market product, the capacity eligible to be offered or scheduled into the markets is a function of the resource upper and lower operating limits, the unit ramp rate, and the continuous energy requirement for that market product. Generally, short-duration energy storage

xvii
resources offering into the day-ahead energy and Regulation markets can offer less capacity because these products are transacted day-ahead on an hourly basis. There is one exception to this rule: a resource utilizing the NGR-REM participation model is provided with SOC management by the CAISO in real-time operations, and so can offer its full range of Regulation capacity on a 15 minute time-frame. StorageVET allows the user to represent the eligible capacity range for each service, and the user can refer to this report for additional details.
Resource Adequacy Program The state Resource Adequacy (RA) program establishes requirements that LSEs must procure sufficient resource capacity to meet monthly peak loads plus a 15-17% reserve margin. The CPUC has jurisdiction over compliance by the IOUs, CCAs, and ESPs; the CEC provides oversight over compliance by the POUs. Currently, CPUC RA requirements are subdivided among system, local and flexible capacity. For the CPUC-jurisdictional LSEs, LSE compliance requirements and rules for supply resource eligibility and obligations are established by the CPUC and the CAISO. RA capacity can be self-provided or procured under bilateral contracts of different terms. In addition, the CAISO has tariff authority to procure additional “backstop” capacity under its Capacity Procurement Mechanism (CPM). For the POUs, compliance is subject to CEC oversight.
RA capacity can be provided directly by storage or demand response resources pre-qualified as RA suppliers; RA capacity requirements can be offset by behind-the-meter DER and storage resources which can modify a LSE’s load profile. StorageVET can analyze both types of applications. Capacity value is reviewed below.
Storage Eligibility Rules
For system and local RA capacity, the eligible capacity of a storage resource is currently the maximum output (MW) which can be sustained for 4 hours. Similarly, a DR resource is required to support a demand drop for 4 hours. For flexible capacity, the eligible capacity (MW) of a storage resource which can charge and discharge symmetrically is 3 hours: 1.5 hours charging and 1.5 hours discharging. In StorageVET, determination of eligible capacity is done prior to conducting economic dispatch and the resource can be constrained to only offer its rated capacity for availability. In other words, if a 1 MW, 2 MWh storage resource gets a local capacity rating of 0.5 MW, then only that capacity is required to be made available to the market, as per the scheduling and bidding obligations discussed below.
Scheduling and Bidding Obligations
CPUC or CAISO jurisdictional RA resources are required to schedule or offer (bid) their full range of capacity into the CAISO energy and ancillary service markets. In addition, system and local RA capacity availability is required during CAISO Availability Assessment Hours while flexible capacity must be available during set hours associated with high ramp requirements. For use-limited resources, these requirements are to be consistent with their use-plan.
As a price-taker model, StorageVET implicitly assumes that storage resources are essentially “always available” for economic dispatch when net revenues are positive, unless availability is otherwise constrained. If the storage resource does not operate economically in a particular set of intervals, then to require it to be dispatched for capacity availability could mean uneconomic dispatch, and potentially operating at an economic loss.

xviii
To examine the different potential interpretations of RA requirements, StorageVET provides three alternatives for dispatch of storage capacity resources:
• Optimal economic dispatch for energy and ancillary services, to determine market revenues when not otherwise constrained by capacity obligations;
• An “availability” dispatch, to ensure that the resource is available (i.e., at a prescribed SOC or energy level), but not necessarily operating uneconomically, during a set of pre-defined peak hours;
• A “must-run” dispatch, to force the resource to provide energy at qualifying capacity during a set of pre-defined peak hours.
These alternative approaches to developing storage dispatches can provide a range of estimates of the market revenues associated with meeting bidding and scheduling obligations as a capacity resource.
Optimal Capacity Sizing
StorageVET can be used to test different sizes (power and energy capacities) of a storage resource intended to provide RA capacity as well as wholesale market services.
Market Prices and Costs and Financial Settlements This section first defines market price and cost data relevant to StorageVETTM and then describes how financial settlements are constructed. Settlements refer to all payments and deductions to resources in the actual markets, including those through the market clearing prices, those through additional payments (e.g., uplift), and various penalties for non-performance. StorageVETTM can calculate some but not all of these settlements.
StorageVET uses historical or simulated future prices and/or costs to determine optimized market net revenues by a configured storage resource, at a defined location and over a defined period. For wholesale market products, StorageVET uses historical CAISO or EIM market prices.
All CAISO market prices are available on the CAISO OASIS website. Market prices can be pre- loaded or uploaded by the StorageVET user. StorageVET includes some pre-loaded simulated future prices for the CAISO system.
Table ES–8 Key characteristics of CAISO market and Resource Adequacy pricing and performance requirements
Market Products Markets Market
Pricing Interval
Market Pricing Aggregation
Product Components With Prices
Performance Requirements
Energy
IFM 60 min. LMP, DLAP, SLAP
Energy None
RTM – FMM
15 min. LMP, DLAP, SLAP
Energy Response to dispatch instructions
RTM – RTED
5 min. LMP, DLAP, SLAP
Energy Response to dispatch instructions

xix
RUC Availability Capacity
RUC 60 min. RUC LMP Reserved Capacity
Response to dispatch instructions
Flexible Ramping Product
RTM - FMM
15 min. System (Balancing Area)
Energy and Reserved Capacity
Response to dispatch instructions
RTM – RTED
5 min. System (Balancing Area)
Energy and Reserved Capacity
Response to dispatch instructions
Spinning Reserves
IFM 60 min. AS region Reserved Capacity and dispatched Energy
Response to dispatch instructions; Rescission of payments for failure to perform
RTM 60 min. AS region Reserved Capacity and dispatched Energy
Non-Spinning Reserves
IFM 60 min. AS region Reserved Capacity and dispatched Energy
Response to dispatch instructions; Rescission of payments for failure to perform
RTM
60 min.
AS region
Reserved Capacity and dispatched Energy
Regulation Up IFM 60 min. AS region Reserved Capacity and Regulation Mileage
Capability to meet awarded range; Rescission of payments for failure to perform
RTM 60 min. AS region Regulation Down IFM 60 min. AS region
RTM 60 min. AS region
CPUC Resource Adequacy Capacity
System Monthly Resource-specific Capacity Availability Assessment
Local Annual Resource-specific Capacity Flexible Monthly Resource-specific Capacity
Energy LMPs
Energy Locational Marginal Prices (LMP) are calculated at over 3,000 pricing nodes (PNodes) within the CAISO and pricing nodes in the EIM. These prices are calculated on 1 hour time- frames in the day-ahead market and both 15-minute and 5-minute time-frames in the real-time market. LMPs consist of three components: Marginal Cost of Energy (MCE) + Marginal Cost of Congestion (MCC) + Marginal Cost of Losses (MCL). The MCC and MCL vary by location, and can be positive or negative.
When using StorageVET, the full LMP is conventionally used to calculate the value of energy time-shift/arbitrage in the energy markets or energy usage for provision of ancillary services. The LMP marginal congestion and marginal loss costs could be used as indicators of whether storage operations are likely to impact those components. However, a network model is required to fully evaluate the impact of new resources on marginal congestion or losses.
There are several CAISO Aggregate Nodes (ANodes), notably the Load Aggregation Points (LAP) used to calculate energy charges to load. The LAPs are calculated as load-weighted

xx
average LMPs. While storage pays LMP when charging, the LAP prices can be used as indicators of average nodal energy prices across the wider region.
Flexible Ramping Product Prices
The Flexible Ramping Product (FRP) prices are system prices calculated for each balancing area (CAISO and EIM BAs) as the shadow price of the flexible ramping constraint in both the FMM and RTED. The FRP price is paid to both the Forecast Movement and the Uncertainty Award. In the actual markets, CAISO will settle Forecast Movement awards during real-time market operations, but will only settle the Uncertainty Awards on a monthly basis. In addition, the CAISO will enforce rescission of any payments for uninstructed imbalance energy that is within the Uncertainty Award reserve capacity.
Ancillary Service Market Clearing Prices
Ancillary Service market clearing prices are calculated for up to eight sub-regions that make up the full CAISO system, including suppliers internal and external to the CAISO BAA. Each region has a minimum and maximum procurement level, although these requirements may not be active. Ancillary Services clearing prices are on 1 hour time-frames in both the IFM and real- time markets. These prices are for capacity reserved to meet ancillary service requirements. For Regulation, there are also Regulation Mileage Up and Regulation Mileage Down clearing prices, which are paid on the basis of actual performance.
Resource Adequacy (RA) Capacity Prices
The monetary value of a capacity resource (typically in $/kW-year or converted to $/MWh based on energy capacity factor) is based on the future period being evaluated and whether the value is based on procurement from existing resources or as a cost or avoided cost of a new resource.
Over the near-term, i.e., months or several years forward, California utilities first credit all generation and storage which is self-owned and under long-term contract (including renewable generation) towards their RA obligations. Any residual requirements are then procured through shorter-term bilateral contracts. These contract prices remain confidential, but are periodically summarized and made public by the CPUC for its jurisdictional utilities.
Under its tariff authority, the CAISO can procure additional “backstop” capacity under its Capacity Procurement Mechanism (CPM). These prices are public but such procurement is only periodic.
Over the long-term, utilities and market participants use forward capacity price curves to estimate capacity value. These curves typically begin with estimates of bilateral capacity prices over a 3-6 year period, followed by costs of new capacity when supply-demand forecasts indicate that utilities will need to either build new capacity or procure it from new projects.
StorageVET includes short-term and long-term capacity prices which are awarded to the eligible capacity of the technology being modeled, and create capacity obligations when calculating joint provision of other services. The user can also substitute other capacity prices.

xxi
Financial Settlements Financial settlements refer to the full set of payments, charges, and penalties associated with transactions in the wholesale markets, excluding any costs of becoming a market participant. StorageVET can calculate some aspects of financial settlements internally to the model calculation, but other aspects may need to be estimated by the user.
Energy Arbitrage Settlements
Energy arbitrage can be scheduled in the IFM, where it would be the result of the market optimization using bids or self-schedules, or in the RTM, where it would require that the user self-manage operations including state of charge across operating hours. Within the RTM operating hour, CAISO will charge and discharge the resource based on bids but does not provide state-of-charge management. Energy arbitrage settlements are the sum of the costs of charging at LMPs and the revenues from discharging at LMPs.
The CAISO energy market is operated as a sequence of three markets, each with financial settlement: IFM, FMM, and RTED. If a resource gets a day-ahead (IFM) award for charging and discharging but does not perform on the awarded schedule in real-time, its energy settlements are re-settled at real-time FMM energy prices. Similarly, if a resource gets an award in the FMM but does not perform as instructed in the RTED, it is penalized for uninstructed deviations.
StorageVET calculates day-ahead energy arbitrage and FMM dispatch separately, and does not financially re-settle the day-ahead and real-time solutions. However, users of StorageVET can manually calculate the solutions for the two markets and calculate the full financial settlements using a spreadsheet or other tool.
Flexible Ramping Product/Real-Time Energy Operations Settlements
The Flexible Ramping Product (FRP) is a real-time energy ramping reserve procured in the FMM and RTED. Resources selected for Energy dispatch are simultaneously eligible to meet the FRP requirement, and they are paid separately for this ramping reserve. All resources are paid when they ramp, and for any ramping range that they provide towards the FRP. Selection of awards is on the basis of existing offers; there are no separate offers to provide FRP.
StorageVETTM can calculate value in the FMM either for Energy only, or for both Energy and FRP simultaneously. In the actual RTM, all dispatchable resources with offers will be paid for both services when there is a positive FRP shadow price. However, resources self-scheduled are not eligible for an Uncertainty Award. StorageVET will model perfect foresight co-optimization of energy and the FRP in the FMM. StorageVET cannot explicitly evaluate rescission of awards in final settlements.
Regulation Settlements
Resources providing Regulation Up and Regulation Down are paid a capacity clearing price as well as a mileage payment. Both the capacity clearing price and the mileage clearing price are determined prior to real-time operations, but the mileage payment is calculated on the basis of actual performance in the RTM. In addition, storage resources providing Regulation are settled for real-time energy charged for maintaining state of charge to provide the Regulation capacity awarded. The procedure for determining this make-up energy cost is as follows:
xxii
• Regulation sold in the IFM pays for energy charged to provide the award in real-time at FMM LMPs.
• Regulation sold in the FMM pays for energy charged to provide the award at RTED 5-minute LMPs.
Failure to provide the full Regulation capacity awarded will result in rescission of payments. In addition, resources providing Regulation are subject to control standards, capability standards and availability standards. These factors are not considered within StorageVET.
Spinning and Non-Spinning Reserve Settlements
Resources providing Spinning or Non-Spinning Reserves are paid the market clearing price for market awards. In addition, resources providing energy on CAISO dispatch instruction from reserve capacity are financially settled at the real-time LMP. Failure to provide the reserve capacity awarded will result in rescission of payments.
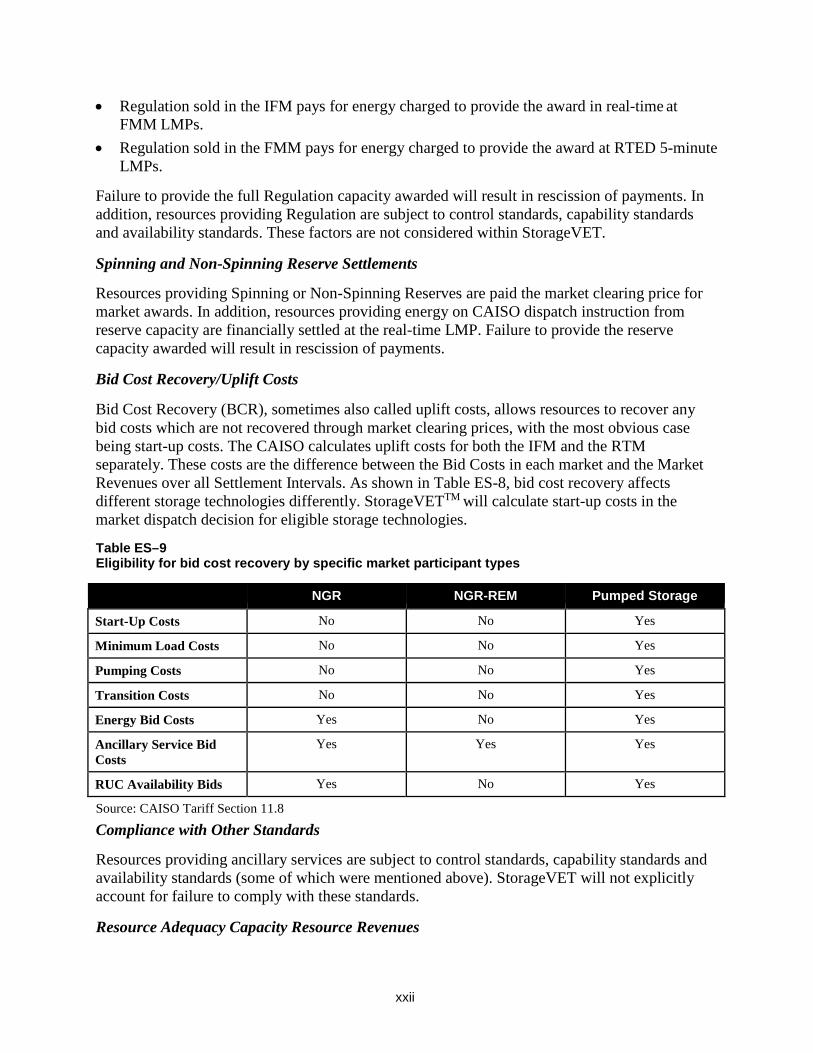
Bid Cost Recovery/Uplift Costs
Bid Cost Recovery (BCR), sometimes also called uplift costs, allows resources to recover any bid costs which are not recovered through market clearing prices, with the most obvious case being start-up costs. The CAISO calculates uplift costs for both the IFM and the RTM separately. These costs are the difference between the Bid Costs in each market and the Market Revenues over all Settlement Intervals. As shown in Table ES-8, bid cost recovery affects different storage technologies differently. StorageVETTM will calculate start-up costs in the market dispatch decision for eligible storage technologies.
Table ES–9 Eligibility for bid cost recovery by specific market participant types
NGR NGR-REM Pumped Storage
Start-Up Costs No No Yes
Minimum Load Costs No No Yes
Pumping Costs No No Yes
Transition Costs No No Yes
Energy Bid Costs Yes No Yes
Ancillary Service Bid Costs
Yes Yes Yes
RUC Availability Bids Yes No Yes
Source: CAISO Tariff Section 11.8
Compliance with Other Standards
Resources providing ancillary services are subject to control standards, capability standards and availability standards (some of which were mentioned above). StorageVET will not explicitly account for failure to comply with these standards.
Resource Adequacy Capacity Resource Revenues

xxiii
Avoided costs or bilateral market revenues for RA capacity are added separately to the solution, subject to enforcing the operational constraints noted above. That is, as long as the resource is determined to be eligible for capacity value, StorageVET adds that value or assumed market revenue based on resource characteristics.
A common benchmark calculation for capacity resource value is the “net cost” of new entry. Net cost generally refers to the difference between the resource’s annual fixed cost requirement and its estimated annual market revenues. StorageVET can be used to calculate this difference for storage resources as an estimate of the capacity payments needed for market entry.
Transmission Planning Storage resources can be evaluated in transmission planning in several ways. For certain types of upgrades, such as reliability or economic upgrades, they can be evaluated as potential lower cost non-transmission alternatives to new or upgraded transmission lines. For other types of transmission projects, such as policy-driven transmission, the presence of storage projects could affect the cost-effectiveness of the transmission projects. Table ES-10 summarizes these possible roles of storage; each type of transmission project is currently allowed in the CAISO transmission planning process although some types of projects in the table are rarely proposed.
Transmission planning inherently requires analysis of changes in power flows due to the addition of alternative transmission solutions, whether to address the effect on reliability or economics of proposed transmission elements. However, most transmission planning models may not produce accurate estimates of storage operations, particularly if the storage resource is providing multiple applications. Hence, StorageVET could be used to provide both operational schedules which could be used in larger system models, such as production cost models, or to estimate a wider range of project benefits, using inputs from different long-term price forecasts. StorageVET can also represent energy losses by storage not co-located with the transmission asset being deferred. This is represented by a multiplier applied to the storage discharge.
Table ES–10 Types of transmission projects and potential role of storage
Type Of Transmission Project Role Of Storage/Storage Modeling GIP Storage interconnection; storage impacting transmission utilization by
shifting renewable generation interconnected to the transmission facility Reliability Storage as component of non-transmission alternatives Policy-driven solutions Storage impacting transmission utilization; transmission affecting storage
utilization Economic upgrades Storage dispatch affecting congestion cost estimates Location-Constrained Renewable Interconnection Facility (LCRIF)
Storage modifying renewable production
Merchant Large storage projects as potential subscribers Long-term Congestion Revenue Rights (CRRs)
Storage as component of non-transmission alternative; storage impacting transmission utilization
Distribution Services and Distribution Resource Planning Storage can provide a set of defined distribution services and functions, and is evaluated in the process of long-term distribution resource planning (DRP). The latter can includes consideration of multiple-use applications for distribution-connected storage as well as advancements in distribution system operations, in which storage would be one of the primary dispatchable

xxiv
distributed resources. Generally, the use of StorageVET when evaluating distributed storage and other DER is through an iterative process depicted in the figure below, in which the tool would be used in tandem with other distribution and transmission system planning tools to evaluate operations of different storage solutions.
Figure ES–1 Process flow for distribution storage valuation analysis
This section begins with a brief definition of the services and functions, followed by current requirements in California utility DRP. This report initially only provides selected details on distribution services and planning (in an appendix), with the expectation of additional information in subsequent versions.
Distribution Services and Functions
Distribution Investment Deferral
Distribution investment deferral utilizes storage, demand response and other distributed energy resources to shave transformer peak load to delay a bulky investment on the substation. Transformer peak is defined as the highest load hour in base, or reference year load on the substation. The investment is deferred for as long as the storage is able to keep annual peak under the base year load peak or a defined threshold percent of base year load peak.
StorageVET can be used to optimize storage operations to shave a transformer peak load, as well as providing other applications with the residual storage capability. This is done by representing a maximum threshold for net load (original load plus storage dispatch) on the asset. StorageVET can also represent energy losses by storage not co-located with the asset being deferred (e.g., a substation). This is represented by a multiplier applied to the storage discharge.

xxv
Distribution Voltage Control
Distribution-connected storage resources can be used to provide volt-var support, primarily to address PV integration. StorageVET does not explicitly model voltage support but can be provided with operating constraints for storage when providing voltage control, as a basis for evaluating other applications with the residual storage capability.
Distribution Loss Reduction
Distribution losses are experienced in delivery of power on the distribution network. DERs can reduce distribution losses by reducing peak loads and increasing generation on the distribution network. These changes at the distribution level can also be reflected in the loss components of LMPs at the transmission network level. StorageVET can evaluate the impact of distribution- connected storage operations on losses either by considering the marginal loss component of the LMP at a transmission network bus, or by developing storage dispatch profiles in association with power system models which calculate distribution losses.
DER Hosting
For certain configurations of incremental DER projects (as opposed to long-term DER planning, discussed next), StorageVET includes the option to include a PV generation curve, which can be used by storage for charging from curtailed PV energy. The tool can allow for reverse power flow or meet a no export constraint.
Incorporation of Distribution Constraints: Voltage, Thermal, Protection
StorageVET can be provided with operating requirements reflecting other operating constraints on distribution operations, such as voltage, thermal or protection constraints on distribution infrastructure, as a basis for evaluating other applications with the residual storage capability.
Distribution Resource Planning
Distribution Resource Planning (DRP) refers to the long-term analysis of how continued interconnection and integration of DERs affect planning for distribution upgrades and distribution system operations. This considers the services discussed above, as well as effects of increasing DER penetration and multiple-use applications. In California, the CPUC has been developing a series of procedures and methods for the IOUs when conducting DRP. Two main components of these procedures are Integration Capacity Analysis (ICA) and Locational Net Benefits Analysis (LNBA). Similar procedures are undertaken by other utilities in California (and around the country).
StorageVET can be used as a component of both ICA and LNBA to augment other tools or data sources. For ICA, StorageVET can be used to evaluate distribution-connected storage operations when providing multiple-use applications of both distribution and wholesale services. For LNBA, StorageVET can be used to analyze project benefits using both historical and future market prices.
For utilities conducting ICA and LNBA, StorageVET would be a tool integrated into their planning functions. Similar uses could be made by non-utility entities attempting to estimate the impact of storage on distribution circuit hosting capacity, and calculate estimates of net benefits.

xxvi
Retail Customer Services and Functions Customer-sited storage, depending on its location, can provide a number of services, including retail rate reductions, backup power, and power quality. StorageVET can model these services, individual or jointly, as well as multi-use applications which combine retail customer services with distribution deferral and wholesale market services. StorageVET can also incorporate constraints for customer-sited DERs, such as non-export. This report initially only provides selected details on customer services, with the expectation of additional information in subsequent versions.
Demand Charge Management
Demand charges are fixed rate charges associated with hours of highest usage. They can take several structures, including time-related charges associated with demand during particular hours of the month and/or season, and facilities-related charges which are assigned to the highest demand hours in the month or other billing cycle.
StorageVET assumes that demand charges are billed monthly, and can vary by up to a three tier of peak hours, including seasonal differences. There can also be a facilities related demand charge component, which is independent of time. StorageVET can co-optimize demand charge mitigation jointly with wholesale market services. StorageVET assumes that time-related demand charges are billed monthly, and can vary by up to a three tier of peak hours, including seasonal differences.
Time-of-Use (TOU) Rate Time-Shift
Time-of-use (TOU) utility rates offer a variable rate for energy consumption different times of day, to better reflect wholesale system marginal costs. For utilities which offer TOU rates, StorageVET can be used to evaluate the customer benefits of energy time-shift to reduce rates.
There are other variants on TOU rates. Real-time pricing refers to retail rates which are consistent with actual real-time wholesale energy prices. StorageVET can be used to evaluate whether different variants on TOU rates correspond to optimal utilization of storage resources, and whether some variants are more supportive of optimal multiple-use applications.
Since some customers may face TOU rates and demand charges, StorageVET can allow for co- optimization between these two rate structures.
Backup Power
Customers may install storage in part to provide backup power. The scheduling of the device for this purpose could require that a minimum state of charge is maintained at all times, or that the storage operator forecasts the highest probability times for outages and develops a time-varying schedule for backup power. In either case, StorageVET can be further used to evaluate multiple applications or multiple-use applications.

xxvii
CONTENTS ABSTRACT ............................................................................................................................... V EXECUTIVE SUMMARY ......................................................................................................... VII 1 INTRODUCTION AND OVERVIEW ...................................................................................... 1-1
1.1 Description of StorageVET ........................................................................................... 1-2 1.2 Key Objectives of this Report ....................................................................................... 1-4
1.2.1 Market and Program Participation Rules .............................................................. 1-4 1.2.2 Market Prices, Retail Rates, and Financial Incentives .......................................... 1-4 1.2.3 Interpretation of StorageVET Valuation and Operational Results ......................... 1-5
1.3 Scope and Outline of Report ........................................................................................ 1-5 1.4 Key Policy and Program Uses and Milestones for Storage Model Needs and Deployment ........................................................................................................................ 1-6 1.5 Documentation in Support of StorageVET and Other References ................................ 1-8
2 STORAGE DOMAINS AND APPLICATIONS ....................................................................... 2-1 2.1 Storage Domains and Location with respect to Retail Meter ......................................... 2-1 2.2 Types of Services or Applications ................................................................................. 2-1
2.2.1 Grid Operations and Resource Adequacy ............................................................ 2-1 2.2.2 Distribution Services ............................................................................................2-2 2.2.3 Customer Services ..............................................................................................2-3
2.3 Multiple-Use Applications ............................................................................................. 2-3 3 BACKGROUND ON THE CALIFORNIA POWER MARKETS, POLICIES AND PROGRAMS3-1
3.1 Structure of California Power Sector ............................................................................. 3-1 3.1.1 Load Serving Entities ........................................................................................... 3-1 3.1.2 Resource Suppliers ............................................................................................. 3-2 3.1.3 Transmission and Distribution Assets .................................................................. 3-3
3.2 System Operators and Regional Markets ..................................................................... 3-3 3.2.1 Balancing Area Authorities (BAAs)....................................................................... 3-3 3.2.2 California ISO ......................................................................................................3-4 3.2.3 Energy Imbalance Market (EIM) and CAISO Expansion ...................................... 3-4
3.3 California Electric Power Load and Resources, 2016-2030 .......................................... 3-5 3.3.1 Loads and Resources in 2016 ............................................................................. 3-5 3.3.2 Load and Resource Forecasts to 2030 ................................................................ 3-9
3.4 Overview of State Policies and Programs ................................................................... 3-12 3.4.1 California Storage Policy under AB 2514 ........................................................... 3-13 3.4.2 Renewable Portfolio Standard ........................................................................... 3-15 3.4.3 Distributed Energy Resource (DER) Policies and Programs Relevant to Storage3-15 3.4.4 Distribution Resource Planning and Operations ................................................. 3-16 3.4.5 Integrated Resource Planning ............................................................................ 3-18
4 STORAGE VALUATION BY CALIFORNIA UTILITIES ........................................................ 4-1

xxviii
4.1 CPUC Cost-Benefit Guidelines for Storage Procurement ............................................. 4-1 4.1.1 CPUC Consistent Evaluation Protocol ................................................................. 4-1 4.1.2 Descriptive Information Included in the CEP Spreadsheet ................................... 4-2 4.1.3 Quantitative Information Included in the CEP Spreadsheet .................................. 4-3 4.1.4 IOU Proprietary Valuation Methods for Storage Procurement .............................. 4-3
4.2 CPUC Cost-Effectiveness Tests for Demand Side Programs and Projects ................... 4-5 4.3 CPUC Locational Net Benefits Analysis ....................................................................... 4-6 4.4 POU Storage Evaluation .............................................................................................. 4-7
4.4.1 Storage Services ................................................................................................. 4-8 4.4.2 Energy Storage Procurement Targets reports ...................................................... 4-9
5 DISTRIBUTED STORAGE RESOURCE TYPES, REQUIREMENTS AND DEMONSTRATION PROJECTS ............................................................................................................................. 5-1
5.1 Distributed Energy Resources with Storage ................................................................. 5-1 5.1.1 DER Resource Types and Characteristics ........................................................... 5-1 5.1.2 SGIP Size Requirements ..................................................................................... 5-2 5.1.3 NEM-Paired Storage System Requirements ........................................................ 5-2
5.2 DER Demonstration Projects with Storage ................................................................... 5-3 5.2.1 Utility Market or Distribution Demonstration Projects ........................................... 5-3 5.2.2 IOU DRP Demonstration Projects ........................................................................ 5-4
5.3 Demand Response Programs ...................................................................................... 5-6 5.3.1 CPUC Demand Response Programs ...................................................................5-6 5.3.2 Demand Response Current Operations and Forecasts ........................................ 5-8 5.3.3 Demand Response Pilots .................................................................................... 5-9
6 CAISO MARKET PARTICIPATION REQUIREMENTS AND MODELS ................................6-1 6.1 Overview of CAISO Market Participation Models ..........................................................6-1
6.1.1 CAISO Market Participation Agreements .............................................................6-4 6.2 Non-Generator Resource ............................................................................................. 6-4
6.2.1 Non-Generator Resource..................................................................................... 6-5 6.2.2 Non-Generator Resource – Regulation Energy Management .............................. 6-6
6.3 Pumped Storage .......................................................................................................... 6-8 6.4 Participating Generator................................................................................................. 6-8 6.5 Participating Load ........................................................................................................ 6-8 6.6 Demand Response ....................................................................................................... 6-9
6.6.1 Proxy Demand Response .................................................................................. 6-10 6.6.2 Reliability Demand Response Resource ............................................................ 6-11 6.6.3 Customer Baseline Methodologies .................................................................... 6-11
6.7 Distributed Energy Resource Aggregation .................................................................. 6-12 6.7.1 Minimum and Maximum Resource Size ............................................................. 6-12 6.7.2 Locational Requirements ................................................................................... 6-12 6.7.3 Dispatch Response ........................................................................................... 6-12 6.7.4 Regulatory Limits ............................................................................................... 6-12

xxix
6.8 System Resources ..................................................................................................... 6-12 7 CAISO MARKET AND SCHEDULING PROCEDURES........................................................ 7-1
7.1 CAISO Market Participation Rules ................................................................................ 7-1 7.1.1 Market Participation Methods .............................................................................. 7-1
7.2 Day-Ahead Market Processes ...................................................................................... 7-4 7.2.1 Market Power Mitigation (MPM) ........................................................................... 7-5 7.2.2 Integrated Forward Market (IFM) ......................................................................... 7-5 7.2.3 Residual Unit Commitment (RUC) ....................................................................... 7-5
7.3 Real-Time Market (RTM) Processes – CAISO ............................................................. 7-6 7.3.1 Market Power Mitigation (MPM) ........................................................................... 7-6 7.3.2 Hour-Ahead Scheduling Process (HASP) ............................................................ 7-6 7.3.3 Real-Time Unit Commitment (RTUC) .................................................................. 7-6 7.3.4 Fifteen Minute Market (FMM) ............................................................................... 7-7 7.3.5 Short-Term Unit Commitment (STUC) ................................................................. 7-7 7.3.6 Real-Time Economic Dispatch (RTED) ................................................................ 7-7 7.3.7 Other Real-Time Dispatch Procedures ................................................................7-7 7.3.8 Real-Time Intertie Scheduling Options .................................................................7-7
7.4 Real-Time Market (RTM) Processes – Energy Imbalance Market ................................7-8 8 ENERGY AND RAMPING RESERVE MARKETS – PRODUCT DEFINITIONS AND BIDDING RULES .................................................................................................................................... 8-1
8.1 Energy Product Definition ............................................................................................. 8-2 8.2 IFM Energy Market ....................................................................................................... 8-2
8.2.1 Eligibility Requirements ....................................................................................... 8-2 8.2.2 Self-Schedules .................................................................................................... 8-2 8.2.3 Bidding Rules ...................................................................................................... 8-2 8.2.4 State of Charge Management .............................................................................. 8-3
8.3 RTM Energy Market Operations ................................................................................... 8-4 8.3.1 Eligibility Requirements ....................................................................................... 8-4 8.3.2 Bidding Rules ...................................................................................................... 8-4 8.3.3 State of Charge Management .............................................................................. 8-4
8.4 Energy Time-Shift in All Markets................................................................................... 8-4 8.4.1 Day-Ahead Energy Arbitrage ............................................................................... 8-5 8.4.2 Real-Time Energy Operations ............................................................................. 8-5
8.5 Energy Charging to Provide Other Services .................................................................8-5 8.6 Flexible Ramping Product ............................................................................................8-5
8.6.1 Product Definition ................................................................................................ 8-6 8.6.2 FRP Regions ....................................................................................................... 8-6 8.6.3 FRP Total Requirement ....................................................................................... 8-6 8.6.4 Resource Forecasted Movement ......................................................................... 8-7 8.6.5 Resource Uncertainty Awards ............................................................................. 8-7 8.6.6 Co-Optimization of Products ................................................................................ 8-7
xxx
8.6.7 Eligibility Requirements ....................................................................................... 8-7 8.6.8 Bidding Rules ...................................................................................................... 8-8 8.6.9 State of Charge Management .............................................................................. 8-8
9 ANCILLARY SERVICES – PRODUCT DEFINITIONS, REQUIREMENTS, AND BIDDING RULES .................................................................................................................................... 9-1
9.1 General Features of Ancillary Service Markets ............................................................. 9-2 9.1.1 Ancillary Service Procurement Requirements and Processes .............................. 9-2 9.1.2 Ancillary Service Regions .................................................................................... 9-2 9.1.3 Ancillary Service Imports ..................................................................................... 9-3 9.1.4 Ancillary Service Supply Options ......................................................................... 9-3
9.2 Regulation .................................................................................................................... 9-8 9.2.1 Regulation System Requirement ......................................................................... 9-8 9.2.2 Product Definition ................................................................................................ 9-9 9.2.3 Regulation Capacity Procurement ....................................................................... 9-9 9.2.4 Regulation Mileage Procurement ....................................................................... 9-10 9.2.5 Evaluation of Capacity and Mileage ................................................................... 9-10 9.2.6 Offer Components ............................................................................................. 9-11 9.2.7 Bidding Rules .................................................................................................... 9-12 9.2.8 Calculation of Resource-Specific Regulation Capacity ....................................... 9-13 9.2.9 Regulation Dispatch Management ..................................................................... 9-13 9.2.10 Performance Requirements ............................................................................. 9-14 9.2.11 Summary of Regulation Market Rules and Examples ...................................... 9-15
9.3 Operating Reserves ................................................................................................... 9-17 9.3.1 Operating Reserves Requirement ...................................................................... 9-17 9.3.2 Spinning Reserves ............................................................................................ 9-18 9.3.3 Non-Spinning Reserves ..................................................................................... 9-19 9.3.4 Spinning and Non-Spinning Reserve Example .................................................. 9-19 9.3.5 Performance Audits ........................................................................................... 9-20
9.4 Frequency Response ................................................................................................. 9-20 9.5 Tariff-Based Ancillary Services ................................................................................... 9-21
9.5.1 Voltage Support ................................................................................................. 9-21 9.5.2 Blackstart Service .............................................................................................. 9-22
9.6 Additional Operating Standards .................................................................................. 9-22 10 RESOURCE ADEQUACY ................................................................................................ 10-1
10.1 CPUC Resource Adequacy Program - Overview ...................................................... 10-2 10.2 Determination of Resource Adequacy Requirements ............................................... 10-3
10.2.1 System RA Requirements ................................................................................ 10-3 10.2.2 Local Capacity Requirements .......................................................................... 10-3 10.2.3 Flexible Capacity Requirements ...................................................................... 10-3 10.2.4 Compliance Deadlines ..................................................................................... 10-4 10.2.5 Other Procurement Allocations ........................................................................ 10-4
xxxi
10.3 Resource Capacity Ratings ...................................................................................... 10-4 10.3.1 Categorization of Storage Technologies .......................................................... 10-4 10.3.2 Qualifying Capacity .......................................................................................... 10-5 10.3.3 Effective Flexible Capacity (EFC) .................................................................... 10-6 10.3.4 Net Qualifying Capacity ................................................................................... 10-7 10.3.5 Obligations and Compliance by RA Resources ................................................ 10-7
10.4 CAISO Capacity Procurement Mechanism ............................................................. 10-11
11 WHOLESALE MARKET PRICES, FINANCIAL SETTLEMENTS, AND PRICE FORECASTS11-1 11.1 CAISO OASIS Website and Data ............................................................................. 11-2 11.2 Energy Market Prices ............................................................................................... 11-3
11.2.1 Pricing Nodes .................................................................................................. 11-3 11.2.2 Locational Marginal Prices ............................................................................... 11-3 11.2.3 LMP Aggregations ........................................................................................... 11-5 11.2.4 Historical CAISO LMPs .................................................................................... 11-6 11.2.5 Historical EIM LMPs ........................................................................................ 11-7 11.2.6 Forward Price Curves for Energy ..................................................................... 11-7
11.3 Flexible Ramping Product Prices and Settlements ................................................... 11-8 11.3.1 FRP Shadow Prices ......................................................................................... 11-8 11.3.2 Settlement of Forecasted Movement ............................................................... 11-9 11.3.3 Settlement of Uncertainty Awards .................................................................... 11-9 11.3.4 Adjustments to Market Payments .................................................................. 11-10
11.4 Ancillary Service Prices and Charges ..................................................................... 11-10 11.4.1 Ancillary Service Market Clearing Prices ....................................................... 11-10 11.4.2 Ancillary Service Imports ............................................................................... 11-10 11.4.3 Historical Regulation Prices ........................................................................... 11-10 11.4.4 Settlement of Energy Provided or Consumed on Regulation ......................... 11-13 11.4.5 Adjustments to Market Payments .................................................................. 11-13 11.4.6 Spinning and Non-Spinning Reserve Prices .................................................. 11-13 11.4.7 Settlement of Energy Provided when Dispatched from Spinning and Non- Spinning Reserves ................................................................................................... 11-14 11.4.8. Adjustments to Market Payments ................................................................. 11-14 11.4.9 Forward Curves for Ancillary Service Prices and Costs ................................. 11-14
11.5 Bid Cost Recovery/Uplift Costs ............................................................................... 11-15 11.6 Resource Adequacy Capacity ................................................................................ 11-16
11.6.1 Bilateral Prices for Resource Adequacy Capacity .......................................... 11-16 11.6.2 CAISO CPM Prices ........................................................................................ 11-17 11.6.3 Cost of New Generation Resources ............................................................... 11-17 11.7.4 Forward Price Curves for Capacity ................................................................ 11-17
12 CAISO TRANSMISSION PLANNING ............................................................................... 12-1 12.1 GIP Processes ......................................................................................................... 12-1 12.2 TPP Processes......................................................................................................... 12-2
xxxii
12.3 Types of Transmission Solutions .............................................................................. 12-2 12.3.1 Reliability Projects ........................................................................................... 12-3 12.3.2 Generation Interconnection Projects ................................................................ 12-3 12.3.3 Policy-Driven Projects ...................................................................................... 12-3 12.3.4 Economic Studies and Mitigation Solutions ...................................................... 12-3 12.3.5 Projects to Maintain Long-Term CRRs ............................................................. 12-3 12.3.6 LCRIF Projects ................................................................................................ 12-4 12.3.7 Merchant Transmission Projects ...................................................................... 12-4
12.4 Non-Transmission Alternatives ................................................................................. 12-4 12.4.1 Demand Response .......................................................................................... 12-4 12.4.2 Generation or Other Non-Transmission Alternatives ........................................ 12-5 12.4.3 Cost Responsibility for Non-Transmission Alternatives .................................... 12-5
13 REFERENCES ................................................................................................................. 13-1 A ACRONYMS .......................................................................................................................A-1 B DISTRIBUTION APPLICATIONS WITH STORAGE AND HOSTING CAPACITY ANALYSISB-1
B.1 Process Flow for Distribution Storage Valuation Analysis ........................................... B-1 B.2 Distribution and Transmission Investment Deferral ..................................................... B-2
B.2.1 Sub-Transmission, Substations, and Feeders .................................................... B-2 B.2.2 Distribution Voltage and Power Quality .............................................................. B-3 B.2.3 Distribution Reliability and Resiliency ................................................................. B-3
B.2.4 Transmission Deferral and Services................................................................... B-3 B.3 Integration Capacity Analysis ...................................................................................... B-3 B.4
Distribution Operations................................................................................................ B-4 B.4.1 Voltage Control .................................................................................................. B-4 B.4.2 Scheduling Maintenance or Outages.................................................................. B-4

xxxiii
LIST OF FIGURES Figure 8–1 CAISO Flexible Ramping Product procurement (MW) in the FMM, November 15,
2016 ................................................................................................................................... 8-7 Figure 11–1 SCE IFM LMPs JOHANNA_2_001 PNODE, April 10, 2016 ................................ 11-4 Figure 11–2 SCE IFM LMPs JOHANNA_2_001 PNODE, May 10, 2016 ................................ 11-5 Figure 11–3 SCE LAP prices in the IFM, FMM and RTED, July 7, 2016................................. 11-6 Figure 11–4 SCE LAP or zonal hourly prices in the IFM for 2015 and simulated for 2030 ...... 11-8 Figure 11–5 CAISO Flexible Ramping Constraint Up FMM shadow prices, October 26, 201611-9 Figure 11–6 Average CAISO day-ahead regulation capacity clearing prices, 2008-2015 ..... 11-11 Figure 11–7 Average CAISO hourly day-ahead Regulation clearing prices, 2014 ................ 11-12 Figure 11–8 CAISO Regulation Mileage prices, February 1-3, 2016 .................................... 11-12 Figure 11–9 Average CAISO day-ahead spinning reserve and non-spinning reserve clearing
prices, 2008-2015 .......................................................................................................... 11-14 Figure 11–10 CAISO Regulation Up prices for 2015 and Regulation Up prices simulated for
2030 ............................................................................................................................... 11-15


xxxv
LIST OF TABLES Table 1–1 StorageVET modeled applications ........................................................................... 1-3 Table 1–2 Report outline .......................................................................................................... 1-5 Table 1–3 Description and milestones for major policies and programs which utilize storage
valuation ............................................................................................................................. 1-6 Table 2–1 Wholesale market services and other grid services ................................................. 2-2 Table 2–2 CPUC Resource Adequacy capacity types .............................................................. 2-2 Table 2–3 Matrix of single use and multiple use application use-case categories .....................2-3 Table 3–1 Current and planned participation in EIM .................................................................3-4 Table 3–2 California generation in-state capacity (MW) and energy production (GWh) by fuel
type, 2010-2015 ................................................................................................................. 3-6 Table 3–3 Existing and planned California pumped storage plants ........................................... 3-7 Table 3–4 Renewable distributed generation resources in California, June 2016 .....................3-8 Table 3–5 CEC California Energy Demand (CED) 2015 Revised Forecasts of Statewide
Electricity Demand .............................................................................................................. 3-9 Table 3–6 CPUC forecasts of IOU energy storage portfolio composition, 2014 LTPP, and
residual requirement update in 2016 LTPP .......................................................................3-10 Table 3–7 Total energy storage procurement to‐date (based on IOU data received in early
2016) ................................................................................................................................3-11 Table 3–8 Statewide Amounts of DER Deployment by 2025 ..................................................3-11 Table 3–9 Major California energy policy initiatives and functions of California state energy
agencies ...........................................................................................................................3-12 Table 3–10 Cumulative energy storage capacity procurement targets (MW) for California
IOUs .................................................................................................................................3-13 Table 4–1 Descriptive information included in the CEP Spreadsheet .......................................4-2 Table 4–2 Quantitative information included in the CEP Spreadsheet ......................................4-3 Table 4–3 Cost-effectiveness tests ......................................................................................... 4-5 Table 4–4 Selected potential uses of StorageVET in LBNA ...................................................... 4-7 Table 4–5 Storage services evaluated under SCPPA storage solicitation ................................4-8 Table 4–6 Storage applications and tools used in selected POU storage assessments ............4-9 Table 5–1 DER technologies eligible under different programs ................................................ 5-2 Table 5–2 IOU DRP pilot projects as of November 2016 .......................................................... 5-4 Table 5–3 Types of DER profiles to be evaluated for ICA ......................................................... 5-5 Table 5–4 CPUC categorization of Demand Response programs ............................................ 5-7 Table 5–5 IOU Demand Response supply resource programs, 2015 ....................................... 5-7 Table 5–6 CAISO Average hourly Proxy Demand Response (PDR) dispatched and
frequency, June – November 2015 ..................................................................................... 5-8 Table 5–7 OPRA project technologies ...................................................................................... 5-9 Table 5–8 OPRA project market revenue, October 2014 to October 2015 .............................. 5-10 Table 6–1 CAISO market participation models with relevant storage technologies ...................6-2 Table 6–2 CAISO market participation models eligibility to provide market services .................6-3 Table 6–3 CAISO market participation models – size and aggregation ....................................6-4 Table 6–4 CAISO Demand Response product characteristics .................................................. 6-9 Table 7–1 CAISO market bid components with relevant storage technologies .........................7-2 Table 7–2 Comparison of different market participation models ............................................... 7-4 Table 7–3 Market offer timelines ............................................................................................. 7-5 Table 8–1 Summary of Energy market participation options and impacts for storage in
different domains ................................................................................................................ 8-1 Table 8–2 CAISO energy market participation model parameters compared to StorageVET ...8-3

xxxvi
Table 9–1 Summary of Ancillary Service participation options and impacts for storage in different domains ................................................................................................................ 9-1
Table 9–2 Summary of initial as regions ................................................................................... 9-3 Table 9–3 Bidding parameters for Pumped Storage and NGRs ............................................... 9-5 Table 9–4 Day-ahead CAISO regulation procurement, average MW per hour.......................... 9-9 Table 9–5 CAISO regulation market parameters (non-REM) .................................................. 9-15 Table 9–6 Hypothetical NGR storage resource parameters and eligible capacity ................... 9-15 Table 9–7 CAISO regulation energy management (REM) parameters ................................... 9-16 Table 9–8 NGR example parameters for REM regulation eligibility ........................................ 9-16 Table 9–9 Day-ahead CAISO operating reserve procurement, average MW per hour, 2013-
14 ..................................................................................................................................... 9-17 Table 9–10 Summary of CAISO spinning reserve market parameters .................................... 9-18 Table 9–11 CAISO non-spinning reserve market parameters ................................................ 9-19 Table 9–12 NGR example parameters for Spinning and Non-spinning Reserve eligibility ...... 9-20 Table 9–13 CAISO frequency response performance, 2012 – Jan. 2016 ............................... 9-21 Table 9–14 Ancillary service control, capability, and availability standards ............................. 9-22 Table 10–1 Key CPUC and CAISO roles and responsibilities in the resource adequacy
program ............................................................................................................................ 10-2 Table 10–2 CPUC Resource Adequacy compliance deadlines .............................................. 10-4 Table 10–3 CPUC and CAISO flexible capacity ratings for storage ........................................ 10-6 Table 10–4 Summary of bidding requirements for system and local RA capacity resources
with storage ...................................................................................................................... 10-8 Table 10–5 Summary of bidding requirements for flexible RA capacity resources .................. 10-8 Table 10–6 Availability assessment hours starting in compliance year 2010 ........................ 10-10 Table 10–7 Flexible capacity required bidding hours ............................................................ 10-10 Table 11–1 Key characteristics of CAISO market and Resource Adequacy pricing and
performance requirements ............................................................................................... 11-1 Table 11–2 Eligibility for bid cost recovery by specific market participant types .................... 11-16 Table 11–3 CPUC capacity prices by compliance year, 2013-2017...................................... 11-16 Table 12–1 Types of transmission projects and potential role of storage ................................ 12-2

1-1
1 INTRODUCTION AND OVERVIEW This report provides general descriptions of policies and programs relevant to storage technologies, and technical details about market rules and storage applications in the transmission-connected, distribution-connected, and customer-sited domains in California. The report focuses on data and other technical information relevant to energy storage use-cases and applications modeled in the Storage Value Estimation Tool (StorageVET™) and other storage valuation tools. It explains the correspondence between the StorageVET model structure and how storage resources will actually be operated and valued by California entities. These details are required to specify StorageVET’s representation of storage parameters and operations, and to interpret model results.
The report is structured to provide these details on storage functions and eligible services across each of the domains and including multiple-use applications. The basic framework is presented in section 2. There are three primary categories of applications. First, there are applications associated with supply of wholesale market products and services. The California Independent System Operator (CAISO) wholesale markets include energy, ramping reserves, and ancillary services. In addition, the Energy Imbalance Market (EIM) includes energy and ramping reserves. The State’s Resource Adequacy (RA) program is also included in this category, with most compliance done through bilateral contracts and self-ownership. Each of the market services has market participation rules, market pricing at particular times and locations, and financial settlements which incorporate both market revenues and other payments or deductions. California utilities not participating in the wholesale markets can use internal utility cost and price data.
Second, there are transmission and distribution deferral solutions, with benefits measured as the difference in cost between alternative and conventional solutions to transmission and distribution upgrades, including stand-alone storage and storage aggregated with other DERs. Storage can also provide distribution services, including voltage control and outage management.
Finally, customer-sited storage, which is typically behind-the-meter (BTM), can offer customer services. These include reduction of rates through self-generation or shifting of consumption in response to time-differentiated retail rates, such as time-of-use rates and demand charges, and possibly other services, such as backup power. These applications can also include aggregations of distributed energy resources, both with and without the ability to export back to the power system.
StorageVET can be used to conduct cost-benefit analysis on combinations of existing applications for which storage is eligible, including when providing certain types of multiple use applications. Multiple use applications refer to storage projects located in one of these domains, which can provide services across several categories of applications. For example, a distribution- connected storage resource used for distribution investment deferral, but which is also used to provide wholesale ancillary services.

1-2
Some Reader Guidelines
While this report is fairly comprehensive, it also attempts to limit itself to definitions and descriptions directly relevant to the implementation of StorageVET and to the interpretation of the tool results. As such, it is not intended as a substitute for the more detailed explanations available in the relevant cited documents and elsewhere. Technical and operational details on certain applications, notably distribution services and planning and customer services, are expected to be added in subsequent iterations of the report. In addition, the report will need to be updated periodically to reflect ongoing changes to the relevant policies, programs, markets and planning processes.
The policies, programs and wholesale markets, and other mechanisms discussed in this report have specific, defined terminology. Both in the wholesale markets and state or utility programs, definitions may differ between regions; for example, a generic name for a wholesale ancillary service product found in the U.S. wholesale markets may not reflect the unique characteristics of the product in California. Where it is appropriate, this report uses terms defined in California regulatory and market rules. StorageVET users uploading data from other U.S. markets or regions should check the rules which apply to the particular programs and markets which they are modeling.
The remainder of this section includes the following:
Section 1.1 – A brief description of StorageVET;
Section 1.2 – Key objectives of this report;
Section 1.3 – An annotated outline of this report;
Section 1.4 – An overview of the major policy and programs in California which could utilize models such as StorageVET for storage analysis, and milestones for those uses over the coming years; and
Section 1.5 – A list of documentation supporting StorageVET and other key references. 1.1 Description of StorageVET StorageVET is a cost-benefit model of stand-alone storage technologies and certain aggregations of storage with other distributed resources. StorageVET and supporting documentation are available at www.storagevet.com. The model includes a financial analysis for the annual fixed cost requirement of different storage technologies, and estimates benefits from provision of eligible market services and avoided costs, depending on the storage application. Table 1-1 shows the list of services currently represented in StorageVET for the California and Western U.S. market context. The rest of this summary describes the sources of the data inputs for modeling the services and the interpretation of StorageVET results. The financial model can include revenues from state and federal financial incentives. These inputs and outputs are described further in several associated documents described at the end of this section, and referenced in this report.
StorageVET reflects the requirements of different applications through the use of the several constraints – minimum and maximum charge, discharge, and state-of-charge (SOC); each of

1-3
these can be time-varying. Storage technologies can be further characterized by parameters such as charging and discharging efficiency, ramp rates, and real and reactive power constraints. When multiple services are eligible to be provided simultaneously, StorageVET can use prices, costs and fixed operating requirements to develop an optimal benefit. When operating requirements are developed from other models, e.g., to provide distribution deferral, StorageVET can assign priority levels for each constraints and ensure that lower priority services do not conflict with higher priority ones.
StorageVET does not directly evaluate the impact of storage operations on power system operations or markets, or on the utilization of other components of power systems. Nor does it directly consider any external power system constraints on storage operations. However, it can be used in tandem with different types of power system models to calculate forecast storage revenues or to obtain additional possible storage operational solutions to use in those models. For that reason, there is selected description of power system operations and models in this report.
Table 1–1 StorageVET modeled applications
StorageVET Modeled Services
CAISO Markets/Tariff Rates
Bilateral Markets or Internal Utility Dispatch Costs
Utility Retail Rates/ Customer-Sited Applications
T&D Investment and Operations
Resource Adequacy Capacity Day Ahead Energy Time Shift Real Time Energy Dispatch Flexible Ramping Product Regulation Spinning Reserve Non-Spinning Reserve Black Start T&D Investment Deferral Transmission Congestion Relief
Transmission Voltage/Reactive Power Support
Equipment Life Extension Losses Reduction Distribution Voltage Control Retail Demand Charge Reduction
Retail Energy Time Shift Power Quality Backup Power Demand Response Program Participation
PV Self-Consumption (FITC Eligibility)

1-4
1.2 Key Objectives of this Report As noted, the purpose of this report is to support the representation of resource attributes, model objective functions and constraints, and optimization procedures in StorageVET. Further, the report also explains how the structure of StorageVET compares to the actual market mechanisms used by California entities and other valuation tools. To these ends, the report is organized to provide the following details.
1.2.1 Market and Program Participation Rules Many sections of the report are devoted to defining the participation models and rules under both programs which allow storage, such as incentive programs for different customer applications, and the wholesale markets. These details are critical to ensure that StorageVET users are correctly specifying the storage resources being used for particular services. These include:
• Definitions of how storage can participate through existing programs for distributed energy resources, with associated relevant technical requirements.
• Definitions of wholesale market participation models1 used for storage technologies in different settings, including factors such as minimum size, rules for aggregation, required representations of operational attributes, and other relevant factors.
• Detailed definitions of wholesale market products and reliability services. These definitions include how the product is utilized, its operational attributes, and timing and location of how the product is procured.
• The current rules for determining the eligible quantity of market and reliability services for different types of storage, if defined, under particular market participation models. For example, this includes the quantity of ancillary services a limited energy storage technology would be eligible to provide in the CAISO day-ahead and real-time markets.
• Rules for how different services are jointly provided, and what limitations may be currently enacted. For example, how resource can provide capacity, energy and ancillary service optimally, including any constraints on shifting between services during actual operations.
1.2.2 Market Prices, Retail Rates, and Financial Incentives StorageVET allows the user to upload time-series on price and cost data, financial incentives, and other operating constraints. This report provides details on market prices and their interpretation. These include:
• Explanation of historical and forecast wholesale market prices and bilateral prices and cost estimates for existing and new resource adequacy capacity, along with relevant details on price formation.
• Current retail rates structures and financial incentives relevant to behind-the-meter storage valuation.
1 FERC defines a participation model as “a set of tariff provisions that accommodate the participation of resources with particular physical and operational characteristics in the organized wholesale electric markets of the RTOs and ISOs,” [2], pg. 2

1-5
1.2.3 Interpretation of StorageVET Valuation and Operational Results Finally, in each of the sections, there may be discussion of the strengths and limitations of StorageVET and similar tools, as well as possible extensions of the model. These could include:
• Explanation of costs and benefits which fall outside the ability of StorageVET to model. • Comparison of objective function and constraints used in actual market optimization and
scheduling processes to those used in StorageVET. • Description of opportunities for using StorageVET to evaluate alternative future market
rules. • Evidence of market value from publicly reported storage demonstration programs, some of
which could be replicated within the StorageVET.
1.3 Scope and Outline of Report The report is organized in 13 sections and one appendix. Sections 2 and 3 are intended primarily as background. Section 4 outlines aspects of storage valuation by state agencies and utilities. Section 5 provides details on how distributed energy resources, including storage, are defined and treated in key regulatory programs and demonstration projects. Sections 6 – 11 focus on the wholesale markets, although with some reference also to internal processes of utilities not participating in those markets. Section 12 discusses storage in transmission planning. Finally, appendix B provides some further details on data and modeling processes relevant to distribution services and planning.
Table 1–2 Report outline
Section Title Section Objectives
Section 2 Storage Domains and Applications An overview of the matrix of storage domains and applications.
Section 3 Background On The California Power Markets, Policies And Program
A review of the key entities in the California power sector, their roles and responsibilities, and the current and forecast resource mix.
Section 4 Storage Valuation by California Utilities
Selected valuation frameworks and methods currently being utilized in storage valuation and procurement by California utilities and regulators.
Section 5 Distributed Storage Resource Requirements And Demonstration Projects
Description of storage requirements under distributed energy resource programs; CAISO demand response rules are in section 6.
Section 6 CAISO Market Participation Requirements and Models
Defines the various market participation models and how they are relevant to storage – e.g., Non-Generator Resource (NGR), Pumped Storage, Participating Generator, Participating Load, Proxy Demand Resource (PDR), Reliability Demand Response Resource (RDRR).

1-6
Section 7 CAISO Market And Scheduling Procedures
Description of the processes in the Day-Ahead Markets and Real-Time Markets.
Section 8 Energy Markets – Product Definitions And Bidding Rules
Description of how energy would be transacted in the day- ahead and real-time Energy markets and Flexible Ramping Product.
Section 9
Ancillary Service Markets – Product Definitions, Requirements, And Bidding Rules
Description of the procurement methods and participation rules in Regulation up and down capacity and mileage, and Spinning and Non-spinning reserves.
Frequency response, Voltage support and Black start compensation
Tariff rates and scheduling procedures for other ancillary services.
Section 10 Resource Adequacy Description of system, local, and flexible capacity, definitions of capacity ratings for storage resources, scheduling obligations in CAISO markets.
Section 11 Market Prices, Financial Settlements And Forecasts
Description of market pricing and financial settlements for wholesale market products and forward prices.
Section 12 CAISO Transmission Planning The key elements of CAISO’s transmission planning process and how storage is represented.
Section 13 References A list of all documents referenced in this report.
Appendix A Acronyms A list of all acronyms used in this report and their meanings
Appendix B Distribution Applications With Storage And Hosting Capacity Analysis
Aspects of the analysis and valuation of distribution- connected storage within the utility distribution planning and distribution operations functions
1.4 Key Policy and Program Uses and Milestones for Storage Model Needs and Deployment StorageVET is intended to be supportive of both market participants (utility and non-utility entities) and the regulatory agencies and organizations with oversight over storage procurement, wholesale market design, resource planning, and transmission planning – all of which affect the evolution of California’s storage portfolio. Table 1-2 summarizes some of the major policies and programs along with the roles of storage valuation and known milestones for such valuation, while subsequent sections provide more details. These are possible applications of StorageVET; the actual use of the tool in these processes will be evaluated over time.
Table 1–3 Description and milestones for major policies and programs which utilize storage valuation
Entity Program or Process Role of Valuation or
Operational Analysis Known Dates
Energy Storage Procurement Framework and Design Program, in compliance with AB 2514
Storage procurement review Reviews will take place in 2015-16, 2017-18, 2019-20

1-7
Entity Program or Process Role of Valuation or Operational Analysis
Known Dates
CPUC
Demand Response DR procurement review
Self-Generation Incentive Program (SGIP)
SGIP cost-effectiveness assessment
2015 evaluation completed; would be used for interim assessment or next full evaluation
Long-term Procurement Planning (LTPP)
Assessment of long-term (10-years ahead) storage contribution to transmission system operational needs, notably renewable integration
Two year cycle
Distribution Resource Planning
Assessment of distributed storage impact, value and operations
Review of IOU applications
Integrated Resource Planning (IRP)
Assessment of storage within resource scenarios
TBD
Investor-Owned Utilities
(CPUC jurisdiction)
Dedicated storage procurement in compliance with CPUC storage procurement targets
Storage procurement planning, bid ranking and selection, Consistent Evaluation Protocol (CEP)
Before storage procurements in 2016, 2018, 2020 or on other time-frames
Storage procurement in other types of resource procurements, such as all- source or preferred resource procurement
Storage procurement planning, bid ranking and selection in the context of multiple resource bids; bid ranking and selection
Periodic
Distribution Resource Planning
Valuation of distribution- connected storage, resource aggregations
Annual cycle with interim project timelines (e.g., pilot projects)
Publicly-Owned Utilities
Storage procurement in compliance with AB 2514, with oversight by the CEC
Storage procurement planning, RFO bid ranking and selection, utility project development
Next compliance report in 2017; final compliance report 2021
Integrated Resource Planning (IRP)
Valuation of storage within long-term resource planning
Semi-annual cycles
CAISO
Transmission planning process
Assessment of non- transmission alternatives; storage as transmission assets
Annual cycles
Wholesale market design Assessment of DER and Several ongoing and

1-8
Entity Program or Process Role of Valuation or Operational Analysis
Known Dates
storage market participation and storage optimization
planned initiatives
1.5 Documentation in Support of StorageVET and Other References This report is one of several developed directly as references for users of StorageVET, or available otherwise for consultation. Other documents include:
• Electric Power Research Institute (EPRI), StorageVET Software User Guide: User and Technical Documentation for the Storage Value Estimation Tool [3] – provides detailed descriptions of a range of ways in which users are expected to use this software, including processes for evaluating storage projects, whether existing or future. The Use Cases are presented at a higher degree of abstraction than in the present report, and hence they can be used in tandem to support user understanding of storage value in California.
• Energy Storage Integration Council (ESIC), Cost-Benefit Analysis of Distribution-Connected Storage Projects: Analytical Frameworks, Models and Tools – a detailed forthcoming guide to the selection of storage modeling tools, by type of model, as well as to the interpretation of model results; this includes extensive discussion of optimization models for analyzing storage technology operations and economic benefits such as StorageVET.
• Electric Power Research Institute (EPRI), Integrated Grid: Cost-Benefit Framework [4] – although not developed specifically for StorageVET, this publicly available EPRI report provides a comprehensive analytical framework for valuation of resources at all levels of connection on the electric power system.
In addition to the StorageVET documentation, users can consult several other detailed studies which illustrate uses and results of similar tools in the evaluation of storage applications in the California power system. Several of these studies also provide valuation results which can be compared to StorageVET results given the same inputs. These include:
• Electric Power Research Institute (EPRI), Cost-Effectiveness of Energy Storage in California: Application of the EPRI Energy Storage Valuation Tool to Inform the California Public Utility Commission Proceeding R. 10-12-007, June 2013 [5] – a detailed storage valuation analysis using EPRI’s Energy Storage Valuation Tool (ESVT), which was the predecessor to StorageVET.
• DNV-GL, Energy Storage Cost ,‐eAfufegcutsivt e2n0e1s3s [M6]e–thodology and Re analysis of several energy storage applications in California using both production cost models and subhourly operational models to evaluate costs and benefits.
• Pacific Gas and Electric Company (PG&E), “EPIC Final Report - EPIC Project 1.01, Energy Storage End Uses: Energy Storage for Market Operations,” September 13, 2016 [7] – the final report on the PG&E demonstration project bidding its Vaca-Dixon and Yerba Buena Battery Energy Storage Systems into the CAISO wholesale markets. Includes discussion of how actual market results compared to prior ESVT results.
• Eichman, J., et al., “Operational Benefits of Meeting California’s Energy Storage Targets,” National Renewable Energy Laboratory (NREL), December 2015 [8] – this study uses a

1-9
price-taker model along with the production cost model used in the CPUC LTPP proceeding to evaluate both historical storage value (2013, 2014) and forecasts for 2024 under different renewable scenarios.
Other storage studies cited in this report primarily use power system models, such as production cost models studies (e.g., [9,10]), but may also show simulated storage market revenue based on the dispatches developed within those models.


2-1
2 STORAGE DOMAINS AND APPLICATIONS This section briefly explains the storage domains and types of applications as they are typically presented in California storage policies as well as utility procurement and planning processes. Subsequent sections provide details on the market and regulatory rules and procedures across these domains and applications. The section includes the following:
Section 2.1 – brief description of storage domains;
Section 2.2 – categorization of the types of storage services and applications; and
Section 2.3 – definition of Multiple Use Applications. 2.1 Storage Domains and Location with respect to Retail Meter Transmission-connected storage is connected to a facility on the high-voltage transmission network, such as a substation. All these resources are also in-front-of-meter (IFOM).
Distribution-connected storage is connected to a facility on the low-voltage distribution network, such as a substation or integrated into another distribution-connected resource, such as a PV plant, and all resources are IFOM.
Customer-sited storage is connected at the customer location, typically an industrial, commercial, or residential customer. Customer-sited storage can affect flow and operations on the distribution and transmission networks, as well as capacity decisions. A customer-sited storage device can be either IFOM or behind-the-meter (BTM), depending on the type of installation and market rules.
2.2 Types of Services or Applications A service or application refers to a particular defined aspect of the electric power system. There are several different categories of these services and applications. Generally, a service is defined by a regulator, utility, or market operator, and has specific requirements for storage resource eligibility and operations.
A “use-case” is a combination of services or applications, including the joint operation of storage with other technologies, which can be analyzed in a cost-benefit framework. For example, the CPUC storage policy ([11] p. 14) identifies a set of use-cases for storage in the different domains identified above.
2.2.1 Grid Operations and Resource Adequacy Grid operations and resource adequacy requires the services generally categorized as energy, ancillary services, and capacity. Energy and ancillary services can be bought and sold through the CAISO wholesale markets, or self-provided by utilities. Table 2-1 identifies the individual market products transacted through the CAISO market and the Energy Imbalance Market (EIM). In the CAISO markets, these are bought through the Day-ahead Market (DAM), which includes the Integrated Forward Market (IFM) and the Reliability Unit Commitment (RUC), and the Real-
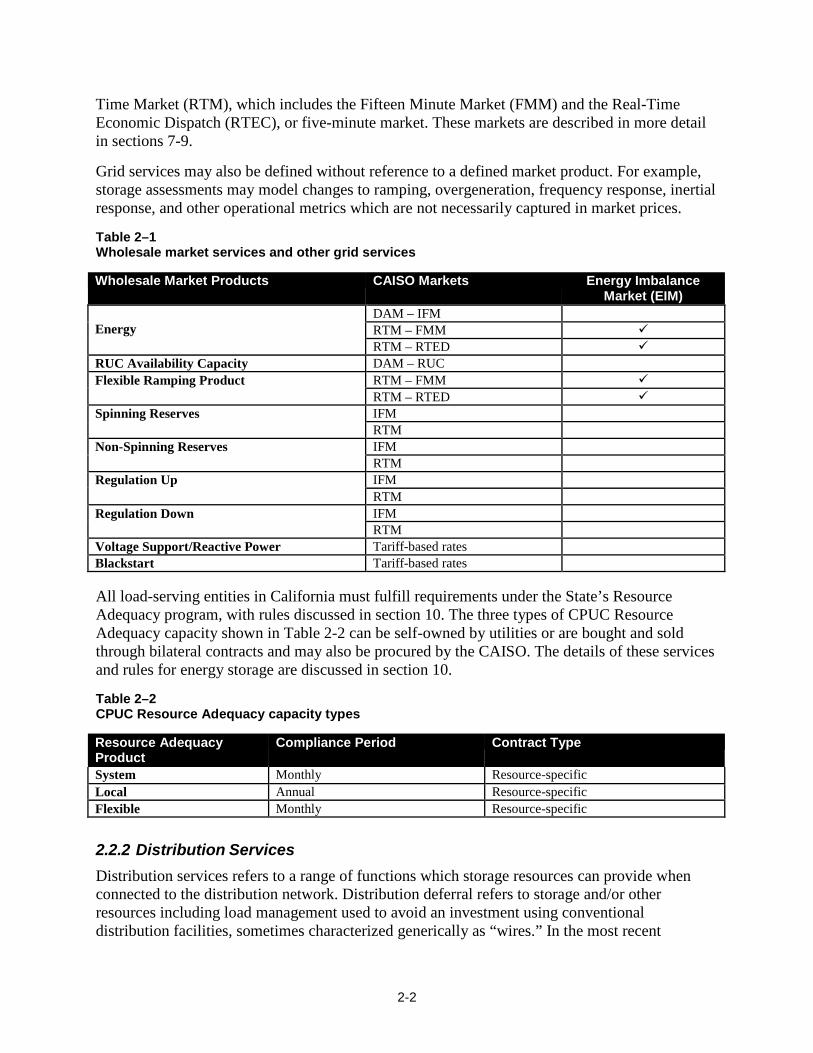
2-2
Time Market (RTM), which includes the Fifteen Minute Market (FMM) and the Real-Time Economic Dispatch (RTEC), or five-minute market. These markets are described in more detail in sections 7-9.
Grid services may also be defined without reference to a defined market product. For example, storage assessments may model changes to ramping, overgeneration, frequency response, inertial response, and other operational metrics which are not necessarily captured in market prices.
Table 2–1 Wholesale market services and other grid services
Wholesale Market Products CAISO Markets Energy Imbalance
Market (EIM) Energy
DAM – IFM RTM – FMM RTM – RTED
RUC Availability Capacity DAM – RUC Flexible Ramping Product RTM – FMM
RTM – RTED Spinning Reserves IFM
RTM Non-Spinning Reserves IFM
RTM Regulation Up IFM
RTM Regulation Down IFM
RTM Voltage Support/Reactive Power Tariff-based rates Blackstart Tariff-based rates
All load-serving entities in California must fulfill requirements under the State’s Resource Adequacy program, with rules discussed in section 10. The three types of CPUC Resource Adequacy capacity shown in Table 2-2 can be self-owned by utilities or are bought and sold through bilateral contracts and may also be procured by the CAISO. The details of these services and rules for energy storage are discussed in section 10.
Table 2–2 CPUC Resource Adequacy capacity types
Resource Adequacy Product
Compliance Period Contract Type
System Monthly Resource-specific Local Annual Resource-specific Flexible Monthly Resource-specific
2.2.2 Distribution Services Distribution services refers to a range of functions which storage resources can provide when connected to the distribution network. Distribution deferral refers to storage and/or other resources including load management used to avoid an investment using conventional distribution facilities, sometimes characterized generically as “wires.” In the most recent

2-3
categorization used by the CPUC and IOUs, these include deferral of upgrades needed for (1) sub-transmission, substations and feeders, (2) maintenance of distribution voltage and power quality, and (3) to ensure distribution reliability and resiliency. Storage resources may also play a role in distribution operations, which refers to both controllable and autonomous resources used to maintain voltage and manage flows created by DERs.
Storage located on the distribution network may also be able to provide wholesale market services and Resource Adequacy capacity, to the extent that it is qualified and that these applications are consistent with distribution services.
Since high voltage transmission upgrades and expansion may also be affected by utility investments and other installations on the distribution network, there may be also be a high voltage transmission deferral benefit.
2.2.3 Customer Services Customer services refers to a range of applications at the customer location, primarily for BTM resources. These services can include retail rate reductions through energy shifting or building peak shaving, installation or augmentation of facilities which are eligible for direct financial incentives or production-based incentives, such as net energy metering, and resources which participate in the wholesale markets or are otherwise compensated, such as demand response. With the expansion of distributed energy resources (DER), these applications could include many potential other combinations.
2.3 Multiple-Use Applications A Multiple-Use Application is the term used by the CPUC and CAISO to designate resource providing services in multiple domains, which in some cases require modifications to existing regulatory rules and operational methods.
Table 2-3 (adapted from [1]) summarizes the range of possible applications by IFOM resources and BTM resources in the transmission-connected, distribution-connected, and customer-sited domains. Columns with only one check indicate a resource dedicated to a single type of domain service; for example, a resource which is only providing wholesale market services. Columns with 2 or 3 checks indicate what the CPUC and CAISO have called Multiple-Use Applications (MUA). This matrix does not include representation of deferral of transmission upgrades.
Table 2–3 Matrix of single use and multiple use application use-case categories
Types of Applications
Storage Domains
Transmission Connected
Distribution Connected Customer-Sited
In-Front-Of-Meter (IFOM) Behind-The-Meter (BTM)
Retail Customer

2-4
Services
Distribution Grid Services
Wholesale Market/Resource
Adequacy

3-1
3 BACKGROUND ON THE CALIFORNIA POWER MARKETS, POLICIES AND PROGRAMS This section provides a brief overview of the California power sector and markets, focused on the structure of the power sector, the CAISO wholesale markets, and the CPUC Resource Adequacy program. The section also identifies which types of entities are required to fulfill storage policy requirements, and which ones can own and operate storage technologies. Additional details on market rules and pricing are then provided in subsequent sections.
The California power markets are in a process of continued evolution, reflecting state policies, other regulatory drivers, and market needs, primarily to reflect the increased integration of wind and solar resources but also additional new technologies and resource types, such as energy storage, demand response (DR) and other aggregations of distributed energy resources (DERs). These developments will create new requirements for users of StorageVET over time.
This section is organized as follows:
Section 3.1 – Structure of the California power sector, including load-serving entities, owners of resources, and transmission providers;
Section 3.2 – Operators of the California power system, with a focus on the role of the CAISO
Section 3.3 – California resource mix, 2016 – 2026 and public tools for resource evaluation
Section 3.4 – California state policies relevant to storage
3.1 Structure of California Power Sector This section provides a brief overview of the structure of the California power sector and identifies the key types of entities which could be developers or contractors with storage projects. The type of entity will affect how storage value is assessed, depending on the types of assets owned by the entity, the rules for cost recovery, and wholesale market participation.
In California, retail load is primarily served by the investor-owned utilities (IOUs) and publicly- owned utilities (POUs); a useful comparison of these two types of utilities is found in [12]. Both types of utilities are required to comply with the storage policy under AB 2514 [13]. In addition, there are other types of load-serving entities (LSEs) subject to these requirements, including community choice aggregators (CCAs) and energy service providers (ESPs). These different entities are described further below, grouped by their functions as LSEs, as suppliers of wholesale energy services and as transmission providers.
3.1.1 Load Serving Entities A Load-Serving Entity (LSE) is defined as an entity, or representative of an entity, which serves end users (load), including residential customers, commercial and industrial customers, and agricultural customers with pumping loads. The CEC maintains a list of California LSEs [14]. In

3-2
addition, the CAISO includes federal power marketing authorities and the State Water Resources Development System (or State Water Project) as LSEs.
Under California legislation AB 2514, state regulators have established storage procurement requirements for LSEs. There are several types of LSEs, which are reviewed below along with some details on their regulatory oversight. The compliance requirements for each of these types of LSEs are discussed further in section 3.4.
Investor-owned utilities (IOUs) are privately-owned, regulated utilities which serve load in a defined territory. The three major California-based IOUs are Pacific Gas & Electric (PG&E), Southern California Edison (SCE), and San Diego Gas & Electric (SDG&E). The CPUC regulates the IOUs, and authorizes retail rates to allow cost recovery and returns on investment. Under its AB 2514 storage policy, the CPUC has established storage procurement requirements on the IOUs, which can be met both through long-term contracts and storage ownership. There are many other policies which affect how the IOUs may procure and utilize storage.
Community choice aggregators (CCAs) are non-utility entities authorized to aggregate community loads (previously served by the IOUs) and purchase energy, other services and transmission access on their behalf. The CPUC has certain regulatory and reporting functions related to CCAs. Energy service providers (ESPs) are non-utility LSEs which were allowed to compete with IOUs for customers under California’s competitive retail choice, or Direct Access, rules enacted in 1998 and suspended in 2001. ESPs can no longer expand their retail customers. The CPUC regulates the ESPs. Under its implementation of the AB 2514 storage policy, the CPUC has established storage procurement requirements on CCAs and ESPs.
Publicly-Owned Utilities (POUs) are utilities which are owned by local government as well as possibly customers within the service territory, and can be organized through municipal districts, city departments, irrigation districts, and rural cooperatives. The CEC provides oversight of POU compliance with AB 2514.
3.1.2 Resource Suppliers The California wholesale market is sometimes called a “hybrid” market in that both restructured IOUs and independent power producers (IPPs) or other third-parties are allowed to own and operate electric power resources (generation, storage, demand response). The ownership rules vary by type of electric power resource and program.
Investor-owned utilities (IOUs) own the state’s hydro plants, including the pumped storage plants, and the remaining nuclear plant (as required under the electric power industry restructuring in the 1990s). Since 2002, they are allowed to enter into long-term contracts with existing or new resources procured through RFOs or bilateral agreements, with the type of contract and duration varying by technology type and procurement program. They can also develop and own their own generation, under specific rules. The IOUs have entered into long- term PPAs with the bulk of the new renewable generation procured under the RPS. The IOUs can also develop and own new storage resources, primarily distribution-connected projects which support reliability.
Independent power producers (IPPs), project developers, and other types of third-party ownership of resources take risk on technology and project development, and may enter the

3-3
market as “merchants” which depend solely on revenues through forward contracts and/or CAISO wholesale services. There are several types of contract structures which these types of entities may enter into with both IOUs and POUs.
Publicly-owned utilities (POUs) include vertically integrated utilities and other utilities which do not own transmission, but which can own or contract for resources, subject to board oversight. Storage procurement is conducted through different mechanisms, including storage solicitations. Storage resource objectives are evaluated via storage technology assessments and integrated resource planning processes. Depending on the POU, storage resources may be utilized across all domains, as well as offered into the wholesale markets.
3.1.3 Transmission and Distribution Assets Storage projects, whether stand-alone or within a DER aggregation, may be developed as alternatives to transmission and distribution assets or as part of portfolio optimized to maximize utilization of existing or new transmission and distribution. There are several types of transmission and distribution owners in the California market. The IOUs own most of the high voltage transmission operated by the CAISO (some of which is jointly owned), and this capacity is eligible to obtain a regulated annual revenue requirement through the CAISO transmission access charge. Independent or competitive transmission owners can compete for new projects with rate recovery through the CAISO’s competitive solicitation for selected types of transmission upgrades. Merchant transmission owners develop high-voltage transmission lines on the basis of market revenues and allocation of financial transmission rights. Currently, storage identified as a transmission asset obtaining rate recovery is not allowed to also earn revenues in the wholesale market. Some POUs also own and operate transmission and can evaluate the role of storage within their planning processes.
At the distribution level, the IOUs and some other smaller utilities within in the CAISO footprint are also Utility Distribution Companies (UDC). POUs outside the CAISO are also distribution companies.
3.2 System Operators and Regional Markets System operators are responsible for daily operations of electric power systems, including scheduling and dispatch functions. This section reviews the organization of system operations in California and other parts of the WECC which may participate in the California power market.
3.2.1 Balancing Area Authorities (BAAs) Balancing Area Authority (BAA) is a NERC-defined term for the entity responsible for system operations on the high-voltage transmission system, control of area control error (ACE) and frequency response, and other operational reliability functions. In practice, the BAAs can include utilities, ISOs and RTOs, and some individual generators in remote locations.
California currently has 9 BAAs within state boundaries. These include, roughly from north to south, PacifiCorp, Bonneville Power Administration (BPA), the Balancing Authority of Northern California (BANC), the California ISO (CAISO), NV Energy, Turlock Irrigation District, Los Angeles Department of Water and Power (LADWP), Western Area Lower Colorado (WALC) and Imperial Irrigation District (IID). The CAISO is currently the only BAA in California which

3-4
operates an organized wholesale market. The CAISO is discussed in more detail in the following section.
The rest of the WECC includes 28 other BAAs [15]. The Energy Imbalance Market (EIM) is a real-time balancing market operated by the CAISO which includes several other Western BAAs, and is discussed below.
3.2.2 California ISO The CAISO provides power system operations, implements a wholesale market, has several roles in implementing the State Resource Adequacy program, and conducts long-term transmission planning. The CAISO footprint includes the territory of the three large IOUs, as well as other utilities. There are a number of POUs which serve load within the CAISO footprint, but do not own transmission. CAISO is regulated by the Federal Energy Regulatory Commission (FERC), but also supports the state energy agencies in certain Resource Adequacy and resource planning functions. In turn, the state agencies provide input into certain CAISO functions, such as load and resource forecasts used in transmission planning.
The CAISO began operations in April 1998, but was restricted to real-time operations with zonal energy prices and ancillary services. In April 2009, the CAISO launched a revised market design with a day-ahead market, co-optimization of energy and operating reserves, and locational marginal pricing of energy on an hourly time interval in the day-ahead and a five-minute time interval in the real-time markets. Virtual bidding and scarcity pricing were instituted in 2010. In 2013, CAISO introduced the “non-generation resource” model for technologies such as storage. In 2014, the CAISO began implementation of a Fifteen Minute Market (FMM) and the first participants in the Energy Imbalance Market (EIM). In 2016, it introduced a market participation model for aggregated distributed energy resources and implemented the Flexible Ramping Product (FRP). Most of these market elements are discussed in detail in the remainder of this report.
3.2.3 Energy Imbalance Market (EIM) and CAISO Expansion For storage resources located outside the current CAISO footprint, but with the intention to participate in the CAISO markets, long-term market valuation will be affected by the evolution of a Western regional wholesale market with transparent prices, which currently in development. As of this writing, the first stage of this market is the Energy Imbalance Market (EIM), which is a real-time balancing market operated by the CAISO with participation by other Western BAAs. The current and planned participation in the EIM is shown in Table 3-1.
Table 3–1 Current and planned participation in EIM
Entity States Date of Participation PacifiCorp California, Oregon, Idaho, Utah, Colorado Nov. 2014 NV Energy Nevada Dec. 2015 Valley Electric Nevada, California Arizona Public Service Arizona Oct. 2016 Puget Sound Energy Washington Oct. 2016 Portland General Electric Oregon 2017 Idaho Power Company Idaho, Oregon 2018
3-5
A second phase would be an expansion of the CAISO market to incorporate additional BAAs as full CAISO members, allowing participation in both the current day-ahead and real-time markets, as well as possibly participating under a regional Resource Adequacy program. Under the requirements of California Senate Bill (SB) 350, CAISO and state entities are evaluating the costs and benefits of expanding full CAISO market participation [16].
For storage resources located within the EIM, EIM real-time prices can be used as an indicator of energy and ramping value, although this market is restricted to real-time interchange and does not conduct day-ahead optimization or transact in ancillary services. These prices are discussed further in section 11.
3.3 California Electric Power Load and Resources, 2016-2030 This section discusses the current California resource mix, annual energy by fuel source, and how these affect market prices and storage value, followed by how the resource mix and prices are forecast to evolve over the next 15 years. Additional details on historical and future prices are presented in section 11. The section also discusses the general implications for storage value in different applications, and reviews the public resource assessment tools available for users.
The California power system in 2016 is comprised of a diverse set of resources, with a number of state policies driving fairly rapid changes in this mix over the next 10 years. The most significant supply-side policy is the RPS, which targets 50% renewable energy by 2030, more than double the 2016 production, with the state’s greenhouse gas emissions target of an 80% reduction in 1990 emissions by 2030 creating further incentives to shift to clean energy resources and possibly to significantly increased electrification. There are a number of other policies relevant to storage deployment. The key policies directed at storage are discussed in more detail in the next section.
StorageVET does not incorporate resource scenarios within the tool, but can be used in tandem with other tools which model the future power system, both to specify inputs into resource assumptions and to evaluate storage operations against simulated market prices. StorageVET includes selected California market prices from both historical periods and simulations of future periods, and users can upload other price curves which reflect additional outcomes. In addition, users can review available public data on future scenarios to evaluate other aspects of storage market evolution, such as the forecast scope of market opportunities.
3.3.1 Loads and Resources in 2016 This section describes the current California electricity loads and resources, along with some data on how different types of resources are participating in the wholesale markets and affecting wholesale prices, with implications for storage valuation. Most of the data in this section is from 2015, the last full year of analysis. Additional details on wholesale market prices and operations are found in subsequent sections of this report.
3.3.1.1 Aggregate Electrical Loads, Generation Capacity, and Energy by Fuel Type In 2015, California had a peak non-coincident load of 60,968 MW and an annual energy demand of around 280,000 GWh [17]. Table 3-4 show certain trends; over 2000-2014, California energy demand (GWh) grew by 0.52% on average.

3-6
Table 3-2 shows the in-state generation capacity (MW) and energy production (GWh) by fuel type. Major changes since 2010 include the retirement of one of the state’s nuclear power plants in 2013, the large increase in solar production, and a doubling of wind production. Natural gas production increased in 2012, largely to compensate for the nuclear retirement and the low hydro conditions from 2012-15; gas production began to decline in 2015 due to the rapid increase in solar production and other factors. This trend has continued in 2016.
Table 3–2 California generation in-state capacity (MW) and energy production (GWh) by fuel type, 2010-2015
2010 2011 2012 2013 2014 2015 Coal
MW 589 451 283 283 175 175 GWh 3,410 3,120 1,581 1,018 1,011 538
Biomass
MW 1,104 1,148 1,177 1,208 1,292 1,294 GWh 5,981 6,044 6,199 6,543 6,768 6,362
Geothermal
MW 2,648 2,648 2,703 2,703 2,703 2,716 GWh 12,740 12,685 12,733 12,479 12,186 11,994
Nuclear
MW 4,577 4,647 4,647 2,393 2,393 2,393 GWh 32,214 36,666 18,491 17,860 17,027 18,525
Natural Gas
MW 44,497 44,309 44,925 47,488 46,584 44,880 GWh 109,946 91,277 121,942 121,127 122,066 117,558
Large Hydro
MW 12,105 12,145 12,145 12,155 12,244 12,252 GWh 28,483 35,682 22,737 20,319 13,739 11,569
Small Hydro
MW 1,745 1,744 1,756 1,750 1,749 1,741 GWh 5,706 7,049 4,723 3,778 2,737 2,423
Solar PV
MW 111 216 739 3,032 4,602 5,697 GWh 84 211 964 3,656 8,961 12,600
Solar Thermal
MW 408 408 408 925 1,300 1,249 GWh 879 889 867 686 1,624 2,446
Wind
MW 3,183 3,992 4,967 5,785 5,869 5,998 GWh 6,172 7,598 9,242 11,964 13,074 12,180
Grand Total
MW 70,966 71,710 73,751 77,723 78,910 78,395 GWh 205,614 201,223 199,478 199,430 199,193 196,195
3.3.1.2 Natural Gas-Fired Resources and Energy Prices Gas-fired resources comprise about 57% of the state’s generation capacity and almost 60% of energy production in 2016. They are currently on the margin for most of the hours in the California wholesale energy markets. As such, energy prices largely reflect the price of natural gas and the heat rates of the different classes of gas plants being operated – combined cycles, single cycle combustion turbines and steam turbines. From 2014 to 2015, the natural gas price decreased by 40 percent [18], and the continued reduction in 2016 combined with the increased production by renewable resources has led to a significant further reduction in average hourly energy prices.
With respect to ancillary services, in-state gas-fired resources currently provide the majority of the regulation in the CAISO system, along with about 20% of the spinning reserves and almost all the non-spinning reserves ([18] pgs. 132-133). These plants are also primarily responsible for

3-7
setting the prices of the market-based ancillary service capacity component, through the opportunity cost payment calculated through their bids.
3.3.1.3 Hydroelectric and Nuclear Resources California has significant hydroelectric capacity, both in-state and outside the state under joint ownership or through contracts (notably Hoover dam). However, due to drought conditions, in- state hydroelectric production has declined in recent years. In 2015, CAISO experienced the lowest hydro year on record, with production providing about 5% of total annual energy. In 2015, in-state hydroelectric plants, including pumped storage (listed below), supplied about 25% of the CAISO’s regulation up capacity, and a little over 60% of spinning reserves ([18] pgs. 132- 133). Most of these resources are “self-supplied” into the market.
California has one nuclear power plant, Diablo Canyon Power Plant, owned by PG&E. The 2,240 MW plant is located in Avila Beach in San Luis Obispo County, California, and is currently planned to be retired in 2024-25. The CPUC has begun a process to develop resource replacements for this plant, which will include distributed energy resources (PG&E Application No. A.04-01-009).
3.3.1.4 Large-Scale Renewable Resources California has a diverse set of renewable resources including wind, solar, geothermal, biomass and biofuel, and small hydro resources. Large hydro resources are not classified as renewable resources under the California RPS.
In the CAISO footprint, in 2015 [18] total solar production (large and smaller projects) provided almost 7% of total generation, wind production was about 5%, geothermal production was about 5%, and biogas, biomass, and waste generation collectively provided about 2%. The total was thus about 18%. This does not include Distributed Energy Resources (DER), which are discussed below.
Renewable energy has begun to significantly impact energy market prices, particularly the increasing solar production. In 2016, for the first time, the average hourly wholesale energy price in southern California during the middle of the day – solar production hours – was lower than the average off-peak price.
3.3.1.5 Storage Resources – Transmission Connected California has several existing pumped storage plants, shown in Table 3-2, and an increasing number of advanced energy storage resources connected across the three storage domains.
Table 3–3 Existing and planned California pumped storage plants
Plant Name Location Capacity (MW)
Castaic LADWP 1,271
Eastwood SCE 199
Helms PG&E Valley 1,218
Lake Hodges SDG&E (planned) 40

3-8
SN LS PP 8 (William R. Gianelli hydroelectric plant)
PG&E Valley
374
Total
3,102
3.3.1.6 Imports Imports have historically provided a significant percentage of California’s energy needs, which includes both resources owned or under long-term contract to California utilities located outside the state and bilateral market purchases. For the CAISO, imports include energy from resources within the state of California but outside its BAA. In 2015, 28 percent of CAISO energy was from net imports (i.e., the net of exports and imports during each operating hour) [18].
Resources located outside the CAISO also contribute a fairly large percentage of ancillary services: in 2015, 11% of capacity reserved for regulation down and 23% of regulation up along with 17 % of spinning reserves ([18], pg. 133). As discussed further in section 11, external resources providing ancillary services also pay marginal congestion charges on the relevant transmission paths.
3.3.1.7 Distributed Energy Resources Distributed energy resources (DER) are generally defined as resources connected to the distribution network or customer-sited, or those under 20 MW which are transmission- connected. Although specific technologies are provided incentives under different programs, the overall category of DER includes small-scale gas-fired generation, solar photovoltaic (PV), a large number of non-solar renewable resources (see discussion of SGIP below), Combined Heat and Power (CHP), demand response (DR), energy efficiency (EE), electric vehicles (EVs) and energy storage. This category also includes small renewable resources eligible under the RPS, which in addition to PV includes small hydro (under 20 MW), biomass, biogas and waste energy resources.
Table 3-4 shows that, as of June 2016, the CEC finds that there are 8,240 MW of renewable distributed generation in California with another 1,140 MW installations pending. Additional inventories, down to the country or distribution element level, can be found in the IOU distribution resource plans and in their public data sources.
Table 3–4 Renewable distributed generation resources in California, June 2016
Resource On-line (MW) Pending (MW) Total (MW)
Biomass 420 30 450
Geothermal 130 0 130 Small Hydro 1,010 10 1,020 Solar 6,240 1,060 7,300 Wind 300 50 350 Other 140 0 140
Total 8,240 1,140 9,380

3-9
Source: CEC [19]
Demand Response (DR) is counted either as a peak load reduction or a supply-side resource, depending on the program. The DR programs are discussed in more detail in section 5, as they can incorporate storage. In 2015, DR programs fulfilled about 5 percent of CAISO’s resource adequacy requirements, although these programs were rarely dispatched. They are typically operated by the LSEs, rather than bid into the market.
3.3.2 Load and Resource Forecasts to 2030 The California state agencies and utilities develop several forecasts of the future loads and resource mix. This section provides an overview of these forecasts, with some implications for energy storage.
3.3.2.1 Electrical Load Forecasts The CEC conducts an annual forecast of California state load over a 10-year horizon [17]. Table 3-5 represents selected details from this forecast, which considers three different scenarios for load growth depending on factors such as economic and population growth, energy efficiency programs, load reduction due to behind-the-meter generation and storage (for more details, see the DER forecasts below), and new sources of electrification. In all scenarios, the CEC is forecasting low growth or even negative growth in the event of high policy implementation.
Table 3–5 CEC California Energy Demand (CED) 2015 Revised Forecasts of Statewide Electricity Demand
Consumption (GWh)
CED 2015
Revised High Energy Demand
CED 2015 Revised Mid Energy
Demand
CED 2015 Revised Low Energy
Demand
2014 280,536 280,536 280,536
2020 301,884 296,244 289,085 2025 322,266 311,848 297,618
2026 326,491 314,970 299,372 Average Annual Growth Rates
2000-2014 0.52% 0.52% 0.52% 2014-2020 1.23% 0.91% 0.50% 2014-2026 1.27% 0.97% 0.54%
Noncoincident Peak (MW)
2015* 60,968 60,968 60,968
2020 63,658 62,414 60,560 2026 67,830 64,007 58,835
Average Annual Growth Rates 2000-2015 0.87% 0.87% 0.87%
2015-2020 0.87% 0.47% -0.13% 2015-2026 0.97% 0.44% -0.32%
Actual historical values are shaded.

3-10
3.3.2.2 Renewable Resource Forecasts There are several sources of renewable resource forecasts, generally developed around the state’s RPS requirements and interim targets – 33% by 2020, 40% by 2024, 50% by 2030 – along with renewable energy developed under other policies, such as behind-the-meter renewables.
The CPUC semi-annually develops renewable resource portfolios for its resource planning proceedings and for CAISO transmission planning. The large vertically integrated POUs conduct integrated resource plans which evaluate resource scenarios.
Several storage studies cited above have used different renewable resource portfolios to evaluate their impact on storage value 10-15 years ahead. Generally, they find that in California, increasing solar energy is the major driver of increases in storage value, due to depression of market prices in the middle of the day, over-generation, and increases in system ramps (e.g., [8,9,10]).
In the event of a significant regional market expansion [16], out-of-state renewable resources could have a higher rate of growth than might otherwise be expected. In addition, overgeneration within the state may find external customers more readily. For resource valuation, regional market expansion would impact the evolution of CAISO market prices, possibly increasing internal California prices in some cases (e.g., relieving negative prices) or decreasing them in others (e.g., by providing a larger set of resources to provide energy and ancillary services). There could thus be mixed effects on storage valuation (e.g., [8]).
3.3.2.3 Storage Resource Forecasts Similarly to renewable resource forecasts, long-term storage resource forecasts for California generally begin from a baseline of policy requirements, namely that the IOUs achieve at least 1.325 GW of new storage by 2024, and the POUs are likely to provide at least an additional approximately 200 MW in this time period. Beyond this assumption, recent CAISO transmission planning special studies [9,10] have modeled an additional advanced pumped storage plant with 500 MW generating capacity. To date, most studies of the future California power system which model storage entry beyond these levels do so based on exogenous assumptions about added storage (e.g., [20,21]), but some examine endogenous storage entry under various long-term scenarios (e.g., [22]).
In addition to storage capacity, there are forecasts of storage portfolio attributes. The CPUC includes a forecast of the characteristics and applications of the new storage resources required to meet the CPUC storage target in the LTPP. Table 3-4 shows the 2014 LTPP version of this forecast in the first column and the 2016 LTPP version in the second column, based on utility procurement in the 2014 procurement cycle. Table 3-5 shows the actual storage resources procured to date assumed in the LTPP forecast portfolio; this table does not include additional IOU storage resources approved and procured later in 2016.
Table 3–6 CPUC forecasts of IOU energy storage portfolio composition, 2014 LTPP, and residual requirement update in 2016 LTPP
*Weather normalized: CED 2015 uses a weather-normalized peak value derived from the actual 2015 peak for calculating growth rates during the forecast period.

3-11
Domain Transmission‐ Connected
Distribution‐ Connected
Customer‐Side
2014 LTPP
2016 LTPP
2014 LTPP
2016 LTPP
2014 LTPP
2016 LTPP
Total Installed Capacity 700 580 425 265 200 7
Amount providing RA capacity 700 464 212.5 106 0
0
Amount providing flexibility 700 580 212.5 133 0 0
Amount with 2 hrs of storage 280 232 170 106 100 4
Amount with 4 hrs of storage 280 232 170 106 100 4
Amount with 6 hrs of storage 140 116 85 53 0 0
Table 3–7 Total energy storage procurement to‐date (based on IOU data received in early 2016)
Domain Transmission‐ Connected
Distribution‐ Connected
Customer‐ Side
SDG&E 60 6 13 SCE 0 132 180
PG&E 60 21 0 Totals 120 160 193
Among the POUs, the major anticipated storage resources to date are shown in their 2014 storage procurement updates in compliance with AB 2514 [23] (with the next update due in 2017) and in IRPs. In the 2014 reports, LADWP anticipated an additional 178 MW procured by 2021 [23] and SMUD focused on development of the 400 MW Iowa Hills pumped storage plant, a project which was terminated in 2016. Other POUs have proposed smaller storage projects.
3.3.2.4 Distributed Energy Resource Forecasts California anticipates continued expansion in distributed energy resources, including storage in both stationary and mobile applications, in respond to policies and customer choices. There are several sources of long-term forecasts in DER installations, based on utility and CEC [17] estimates, along with commercial and research estimates.
The California IOU Distribution Resource Plans (DRPs) include scenario-based 10-year DER forecasts, from 2015-2025. Table 3-8 below shows the calculation of state-wide amounts of DERs in 2025 in 3 scenarios, calculated by SCE. We show this forecast for illustrative purposes. Note that Scenarios 1 and 2 assume that the IOUs meet the storage procurement targets only, while Scenario 3 examines additional storage penetration.
Table 3–8

3-12
Statewide Amounts of DER Deployment by 2025
DER Type Scenario 1 Scenario 2 Scenario 3
Base Load 60,109 MW 60,109 MW 60,109 MW Solar PV (nameplate AC) 4,812 MW 5,498 MW 13,792 MW AAEE (annual) 22,565 GWh 36,068 GWh 36,655 GWh Demand Response 2,176 MW 3, 570 MW 5,100 MW CHP (annual) 13, 877 GWh 21, 132 GWh 32,112 GWh EV (annual) 4,877 GWh 7,026 GWh 7,026 GWh Storage – Distribution- Connected and Customer- Sited
654 MW 654 MW 1,543 MW
Storage – Transmission- Connected
700 MW 700 MW 1, 651 MW
Source: SCE Distribution Resource Plan 2015 [24].
3.4 Overview of State Policies and Programs This section provides basic descriptions of the state policies relevant to storage technologies. These include policies which establish storage procurement requirements, provide incentives for storage procurement, or establish a framework for procurement of storage among other assets (such as distributed energy resources). Subsequent sections then examine additional details as relevant to users of StorageVET. Section 4 examines valuation methods under some of these policies. Table 3-9 lists some of the major energy policy drivers.
Table 3–9 Major California energy policy initiatives and functions of California state energy agencies
Lead State Agencies
Policy Year Established Established Targets
Other Agency Roles
CPUC, CEC Resource Adequacy (RA)
2004; 2006 first compliance year
Annual peak load plus 15-17 % reserve margin
CAISO conducts deliverability analysis and establishes local capacity areas and requirements; establishes flexible capacity requirements
CPUC
IOU Renewable Portfolio Standard (RPS)
2002; large hydro not eligible
33% RPS by 2020; 50% RPS by 2030
CAISO adjust operations and markets to reflect new conditions
IOU Resource planning: Long-term Procurement Planning (LTPP)/Integrated Resource Planning (IRP)
LTPP 2006; IRP 2015
Bi-annual review of utility procurement to meet policy goals and system conditions; IRP proceeding underway
CAISO supports CPUC in determining operational requirements for utility procurement; CEC provides load forecasts

3-13
IOU Storage procurement policy
2013 IOUs required to procure 1.325 GW of storage by 2020
CAISO supports market integration
IOU Distribution Resource Plans
2014 IOUs required to prepare bi-annual DRPs beginning in 2015
California Air Resources Board
Greenhouse Gas Emissions Reductions
2006, 2016 AB32 [25], 2006: emissions must reach 1990 levels in 2020; Governor Climate Change Framework, 2016: 40% below 1990 levels by 2030.
CPUC has jurisdiction over RPS and other functions.
California State Water Resources Control Board
Removal of once- through cooling systems at coastal generating plants
Full compliance by 2021
Support resource and transmission planning to retire or repower once- through cooling plants
3.4.1 California Storage Policy under AB 2514 The primary policy driver for new storage on the California power system is Assembly Bill (AB) 2514, enacted in 2010 [13]. This section first reviews the CPUC requirements for compliance with this legislation, followed by the POU requirements.
3.4.1.1 CPUC Energy Storage Procurement Framework and Design Program In October 2013, in compliance with AB 2514, the CPUC established storage procurement targets for California’s three large investor-owned utilities as well as other LSEs [11]. The IOU targets are summarized in Table 3-10. In each procurement cycle, the utilities must demonstrate that they have met the minimum targeted requirements, or provide justification for deferring procurement until later cycles ([11] p. 16). Final compliance is required by 2024.
Table 3–10 Cumulative energy storage capacity procurement targets (MW) for California IOUs
Storage Grid Domain Point of Interconnection
2014 2016 2018 2020 Total by 2024
Southern California Edison
Transmission 50 65 85 110 310
Distribution 30 40 50 65 185
Customer 10 15 25 35 85
Cumulative Subtotal SCE 90 120 160 210 580
Pacific Gas & Electric
Transmission 50 65 85 110 310
Distribution 30 40 50 65 185
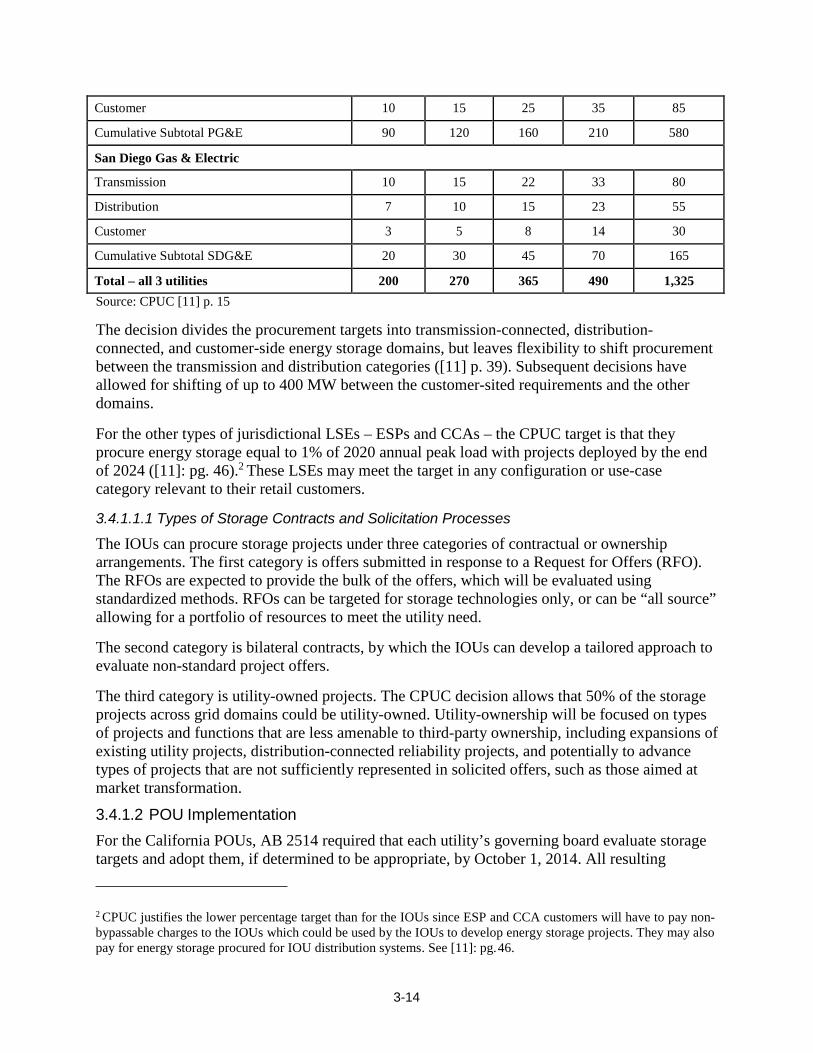
3-14
Customer 10 15 25 35 85
Cumulative Subtotal PG&E 90 120 160 210 580
San Diego Gas & Electric
Transmission 10 15 22 33 80
Distribution 7 10 15 23 55
Customer 3 5 8 14 30
Cumulative Subtotal SDG&E 20 30 45 70 165
Total – all 3 utilities 200 270 365 490 1,325 Source: CPUC [11] p. 15
The decision divides the procurement targets into transmission-connected, distribution- connected, and customer-side energy storage domains, but leaves flexibility to shift procurement between the transmission and distribution categories ([11] p. 39). Subsequent decisions have allowed for shifting of up to 400 MW between the customer-sited requirements and the other domains.
For the other types of jurisdictional LSEs – ESPs and CCAs – the CPUC target is that they procure energy storage equal to 1% of 2020 annual peak load with projects deployed by the end of 2024 ([11]: pg. 46).2 These LSEs may meet the target in any configuration or use-case category relevant to their retail customers.
3.4.1.1.1 Types of Storage Contracts and Solicitation Processes
The IOUs can procure storage projects under three categories of contractual or ownership arrangements. The first category is offers submitted in response to a Request for Offers (RFO). The RFOs are expected to provide the bulk of the offers, which will be evaluated using standardized methods. RFOs can be targeted for storage technologies only, or can be “all source” allowing for a portfolio of resources to meet the utility need.
The second category is bilateral contracts, by which the IOUs can develop a tailored approach to evaluate non-standard project offers.
The third category is utility-owned projects. The CPUC decision allows that 50% of the storage projects across grid domains could be utility-owned. Utility-ownership will be focused on types of projects and functions that are less amenable to third-party ownership, including expansions of existing utility projects, distribution-connected reliability projects, and potentially to advance types of projects that are not sufficiently represented in solicited offers, such as those aimed at market transformation.
3.4.1.2 POU Implementation For the California POUs, AB 2514 required that each utility’s governing board evaluate storage targets and adopt them, if determined to be appropriate, by October 1, 2014. All resulting
2 CPUC justifies the lower percentage target than for the IOUs since ESP and CCA customers will have to pay non- bypassable charges to the IOUs which could be used by the IOUs to develop energy storage projects. They may also pay for energy storage procured for IOU distribution systems. See [11]: pg. 46.

3-15
decisions have been reported to the California Energy Commission (CEC) [23], with most POUs declining to procure new storage at that time. The boards must reevaluate these determinations at least every three years, and the next compliance reports are due to the CEC by January 2017 and January 2021.
3.4.2 Renewable Portfolio Standard California established a Renewable Portfolio Standard in 2002, which targeted a 20% annual renewable energy by 2010, with compliance by LSEs. This target was subsequently updated in 2010 to a 33% target by 2020, and in 2015 to a 50% target by 2030. The RPS rules allow for storage integrated or directly connected to an RPS facility, as defined below. The economic valuation of the storage capability can include wholesale value (the additional energy, ancillary services and capacity), avoided integration cost, and possibly any retained renewable energy that would otherwise be curtailed.
Under current rules, energy storage technologies can be considered an addition or enhancement to an RPS-eligible facility if they meet the following requirements (excerpted directly):
a) Integrated into the facility, such that the energy storage device is capable of storing only energy produced by the facility, either as an intermediary form of energy during the generation cycle or after electricity has been generated.
b) Directly connected to the facility, such that electricity is delivered from the renewable generator to the energy storage device behind the meter used for RPS purposes and any electricity from a source other than the renewable generator is included as an energy input to the facility. The energy storage device must be operated as part of the facility represented in the application and not in conjunction with any other facility, renewable or otherwise.
All applicable energy resource eligibility requirements and facility requirements must be met by the facility as a whole, including the energy storage device. Energy storage devices or facilities not falling into one of these two classifications are not eligible for the RPS as part of a facility and may not receive RPS certification.
StorageVET provides the functionality to model an integrated solar PV with storage resource, which allows the storage device to capture curtailed solar energy while also providing wholesale services otherwise. There are other types of RPS technologies with integrated storage which are not currently reflected in StorageVET, but which can be analyzed using similar types of models (e.g., models of concentrating solar power with integrated thermal storage).
3.4.3 Distributed Energy Resource (DER) Policies and Programs Relevant to Storage California has established a number of legislative requirements and other policies to advance the development, planning, and integration of distributed energy resources (DERs). This section briefly outlines the primary policies and programs relevant to the storage technologies which can be modeled in StorageVET (pending further developments in the tool, we thus exclude programs that support energy efficiency and electric vehicles). Additional details relevant to configuration of particular resource types are found in section 5 and in subsequent sections.

3-16
3.4.3.1 Self-Generation Incentive Program (SGIP) The Self-Generation Incentive Program (SGIP) was established by legislation in 2001 to support customer-sited distributed generation for peak load reductions, but has evolved into a program to promote diverse technologies with the objective of reducing greenhouse gas emissions. Since 2007, the SGIP has been funded at $83 million annually, with authorization extended for years 2015 through 2019 [26].
Eligible technologies include wind turbines, waste heat to power technologies, pressure reduction turbines, internal combustion engines, microturbines, gas turbines, fuel cells, and advanced energy storage systems (solar PV has been incorporated into the CSI). The current SGIP incentive rate for advanced energy storage is $1.46/W. By mid-2016, there were approximately 1,000 small storage projects financed through SGIP.
StorageVET includes the capability to represent the SGIP payment in the cost-benefit analysis of eligible storage technologies, which can then be operated to provide the highest value customer services.
3.4.3.2 Net Energy Metering (NEM) Net energy metering policies allow for residential or commercial distributed resources (primarily rooftop PV) to sell excess energy back to the utility at the prevailing retail rate. The NEM rules relevant to integrated storage are discussed further in section 5. StorageVET includes the capability to represent BTM integrated solar with storage resource.
3.4.3.3 Demand Response (DR) Programs Demand Response programs allow loads to reduce consumption during reliability events or to shave peak loads or address “net load” events. Because there is a wide range of these programs, with different implications for storage participation, they are addressed in detail in section 4.2.
3.4.3.4 CPUC Integrated DER Proceeding The CPUC Integrated Distributed Energy Resources (IDER) proceeding (R.14-10-003) was begun in October 2014, and is intended to develop a unified regulatory framework for all distributed resources (including conventional demand-side resources), utilized to provide additional inputs on DRP, examine changes to utility financial incentives, update DER cost- effectiveness analysis and evaluate frameworks for third-party participation in planning and investment. Several of these functions are relevant to valuation of distributed storage technologies.
3.4.4 Distribution Resource Planning and Operations Distribution planning and operations are utility functions to maintain reliability and meet load growth on utility distribution systems. These functions are under continuous change in California to address policy requirements related to DERs. Assembly Bill 327, approved in 2013, requires reform of utility distribution planning, investment, and operations to support investments in preferred resources, while advancing time- and location-variant pricing and incentives for DER. Storage resources are one of the types of DER, whether as stand-alone or aggregated with other DER, and operated as a single or virtual resource.
3-17
The California Public Utilities Commission (CPUC) began a Distribution Resource Planning (DRP) proceeding in 2014, with a Final Guidance for the first round of IOU plans issued on February 6, 2015 [24]. The initial DRP applications compliant with this guidance were submitted by three large California investor-owned utilities – Pacific Gas & Electric, Southern California Edison, and San Diego Gas & Electric – to the CPUC in July 2015. Key elements of the DRPs of direct relevance to StorageVET users are locational net benefits analysis (LBNA), integration capacity analysis (ICA) and data access. These components are briefly summarized here and additional details are found in section 5.
California POUs conducting DRP will generally use similar methods for most aspects of the distribution planning analysis, but if they are vertically integrated, may also use internal utility dispatch costs for energy valuation. The remainder of this section will focus on the IOU plans.
3.4.4.1 Locational Net Benefits Analysis (LNBA) In response to CPUC guidance and supported by a stakeholder working group, the IOUs are jointly creating a framework for conducting locational net benefits analysis (LNBA). The starting point for the utilities are the cost components and inputs in two Commission approved spreadsheet-based tools for conducting cost-benefit analysis for distributed resources – the Distributed Energy Resource Avoided Cost tool and the Demand Response (DR) cost- effectiveness calculator. For improved cost-benefit analysis, the inputs into these tools are augmented with additional locational analysis. Some details on these methods are presented in section 4. In addition, as discussed further in section 5, improvements in LNBA are also a component of required pilot projects for each utility. StorageVET can be used both with the approved data and to evaluate other sources of market or operational data which could provide improved evaluation.
3.4.4.2 Integration Capacity Analysis (ICA) The CPUC’s guidance requires each IOU to conduct Integration Capacity Analysis (ICA) to determine the hosting or integration capacity of the distribution network, down to the line section or node, using a common methodology across the utilities and making the results on-line and public. In addition, the utilities are to assess current system capability today and including planned investments up to two-years ahead, conduct dynamic analysis, assess the state of DER deployments and forecasts, evaluate circuits with high DER penetration, develop a procedure for updating the analyses, and show how to improve interconnection processes. As discussed further in section 5, improvements in ICA are also a component of required pilot projects for each utility.
StorageVET can be used in ICA as a complement to other tools used to calculate hosting capacity. This could take place in several ways. First, StorageVET can be used to analyze behind-the-meter generation self-utilization while meeting variants on backflow constraints onto the distribution system. Second, for distribution-connected resources, hosting capacity thermal or voltage limits could be converted into constraint requirements in StorageVET, with any residual capability used to provide other services, as appropriate. These applications are anticipated to be examined in more detail in later versions of this report.
3-18
3.4.5 Integrated Resource Planning California State Bill 350 (2015) [27] requires the CPUC to develop a process for each load- serving entity to file an Integrated Resource Plan (IRP) beginning in 2017 that meets the greenhouse gas emissions reduction targets established by ARB, procures at least 50% renewable energy by 2030, and enhances distribution systems and demand-side energy management. A proceeding to achieve this has begun at the CPUC [28], including consideration of resource planning tools which include storage.
SB 350 also requires publicly owned utilities (POUs) with annual demand exceeding 700 GWh to file IRPs with the CEC. Several POUs already conduct IRP (e.g., LADWP), but this bill expands the requirement such that a total of 16 POUs must adopt IRPs and an updating process by January 1, 2019.

4-1
4 STORAGE VALUATION BY CALIFORNIA UTILITIES This section provides additional details on the current valuation methods and requirements used by the load-serving entities (LSEs) which must comply with the California storage policy in compliance with AB 2514, as well as procure storage otherwise to meet resource planning needs. These other applications include storage as a distributed energy resource (DER), both as stand- alone and as a component of aggregated DERs.
While valuation methods have been developed for different types of resources and programs, they typically contain some common elements and some elements unique to the applications. This section does not try to present a unified framework across all applications, but describes the current valuation methods by regulatory program with a focus on elements which could be evaluated using StorageVET™. Subsequent sections provide additional details on how the components of these valuation methods can be calculated within StorageVET.
This section is organized as follows:
Section 4.1 – CPUC storage cost-benefit guidelines and how they are met under both utility proprietary valuation methods and reported in the Consistent Evaluation Protocol (CEP);
Section 4.2 – Basic description of CPUC Standard Practice Manual for Cost-Effectiveness Analysis of Demand-Side Programs and Projects;
Section 4.3 – Overview of Locational Net Benefits Analysis (LNBA) for DER; and
Section 4.4 – Brief review of POU storage valuation. 4.1 CPUC Cost-Benefit Guidelines for Storage Procurement This section briefly reviews the cost-benefit guidelines being used by California utilities in storage procurement (and other resource procurements). The overall methodology includes both qualitative and quantitative factors. The objective in this section is to preview what information from CAISO market products and the Resource Adequacy program is utilized in storage valuation. The IOUs jurisdictional to the CPUC are required to follow certain standard guidelines for reporting purposes, but also conduct proprietary analysis using both proprietary models and commercially available forward price curves. Selected public information on both these types of analysis is reviewed here. The POUs develop their own methods for resource valuation, some of which is reviewed here. Depending on their structure and preferences, the POUs may both use storage resources for internal operational purposes, but also sell services to the CAISO markets.
4.1.1 CPUC Consistent Evaluation Protocol In 2014, the CPUC established a Consistent Evaluation Protocol (CEP) for jurisdictional utilities to provide offer results confidentially for regulatory review in a common data format, for “benchmarking and general reporting purposes”. The protocol does not require that valuation is conducted using the same models or methods, but rather that there is standardization in inputs for calculation of certain common quantitative metrics. This section briefly reviews elements in the
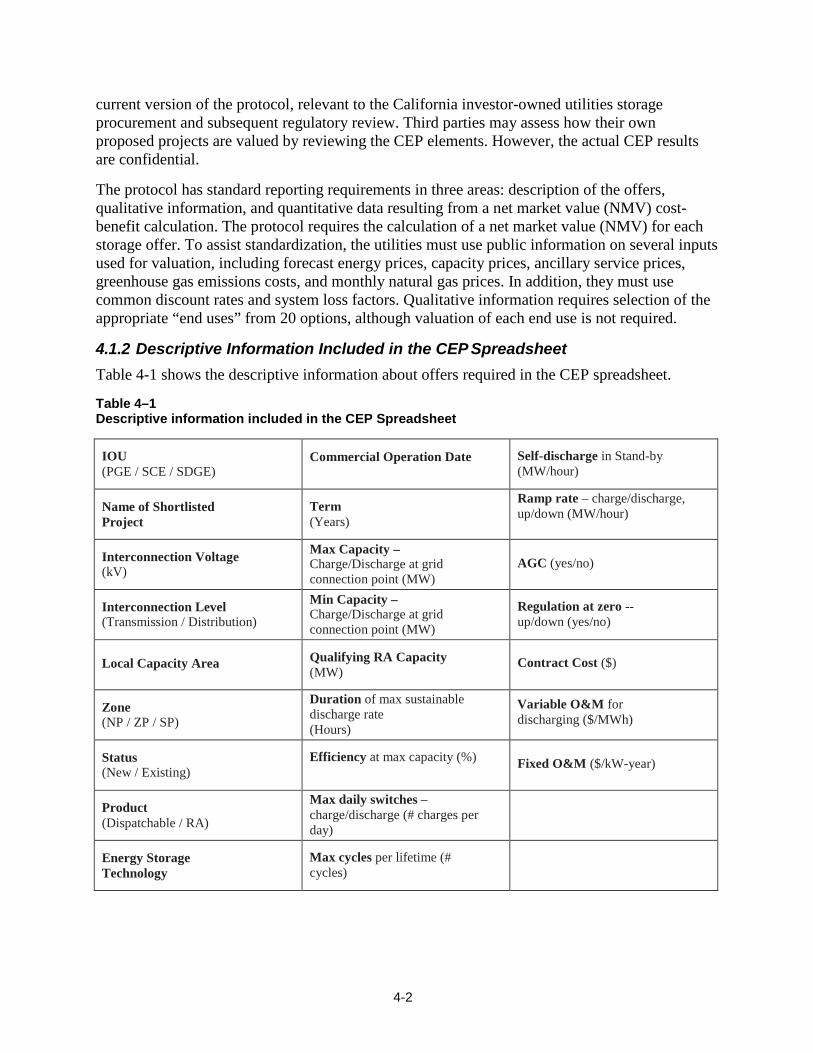
4-2
current version of the protocol, relevant to the California investor-owned utilities storage procurement and subsequent regulatory review. Third parties may assess how their own proposed projects are valued by reviewing the CEP elements. However, the actual CEP results are confidential.
The protocol has standard reporting requirements in three areas: description of the offers, qualitative information, and quantitative data resulting from a net market value (NMV) cost- benefit calculation. The protocol requires the calculation of a net market value (NMV) for each storage offer. To assist standardization, the utilities must use public information on several inputs used for valuation, including forecast energy prices, capacity prices, ancillary service prices, greenhouse gas emissions costs, and monthly natural gas prices. In addition, they must use common discount rates and system loss factors. Qualitative information requires selection of the appropriate “end uses” from 20 options, although valuation of each end use is not required.
4.1.2 Descriptive Information Included in the CEP Spreadsheet Table 4-1 shows the descriptive information about offers required in the CEP spreadsheet.
Table 4–1 Descriptive information included in the CEP Spreadsheet
IOU (PGE / SCE / SDGE)
Commercial Operation Date Self-discharge in Stand-by (MW/hour)
Name of Shortlisted Project
Term (Years)
Ramp rate – charge/discharge, up/down (MW/hour)
Interconnection Voltage (kV)
Max Capacity – Charge/Discharge at grid connection point (MW)
AGC (yes/no)
Interconnection Level (Transmission / Distribution)
Min Capacity – Charge/Discharge at grid connection point (MW)
Regulation at zero -- up/down (yes/no)
Local Capacity Area Qualifying RA Capacity
(MW)
Contract Cost ($)
Zone (NP / ZP / SP)
Duration of max sustainable discharge rate (Hours)
Variable O&M for discharging ($/MWh)
Status (New / Existing)
Efficiency at max capacity (%) Fixed O&M ($/kW-year)
Product (Dispatchable / RA)
Max daily switches – charge/discharge (# charges per day)
Energy Storage Technology
Max cycles per lifetime (# cycles)

4-3
4.1.3 Quantitative Information Included in the CEP Spreadsheet Table 4-2 shows the quantitative information about offers required in the CEP spreadsheet. Additional details about these values are in the next section.
Table 4–2 Quantitative information included in the CEP Spreadsheet
Market Benefits (Levelized $/kW)
Market Costs (Levelized $/kW)
Capacity / Resource Adequacy Value Fixed Capacity Payments and Fixed O&M Cost
Energy Value Charging Costs and Variable O&M Cost
Ancillary Services Value Network Upgrade Cost (paid by CAISO consumers)
Distribution Investment Deferral Value (if applicable to project)
GHG Compliance Cost (if applicable to project)
Debt Equivalency Cost
Market Participation Costs
Net Market Value (NMV) is calculated for each Offer with the following formula:
NMV = (C + E + AR + DD) – (F + V + N + GHG + DE + MPC)
Where:
C = Capacity / Resource Adequacy Value E = Energy Value AR = Ancillary Services Market Value DD = Distribution Investment Deferral Value F = Fixed Capacity Payments and Fixed O&M Cost V= Charging Costs and Variable O&M Cost N = Network Upgrade Cost GHG = GHG Compliance Cost (if applicable to project) DE = Debt Equivalency Cost MPC = Market Participation Costs
4.1.4 IOU Proprietary Valuation Methods for Storage Procurement The IOUs are authorized to develop proprietary methods for storage valuation. These methods are described generally in the utility storage applications, and will be briefly summarized here. In some cases, specific utilities are identified based on statements in their applications (which can be found on the CPUC storage webpage [29] or on their own websites). However, the description here is not intended to reflect the full scope of the utility methods. Further details on the valuation components discussed here can be found in the applications and in other utility filings on their valuation methods for resource procurement.

4-4
Some utilities explicitly separate categories of value to differentiate market price calculations and other non-market priced costs or benefits which may be tied to system effects, whether on the transmission and distribution network or through dispatch of the power system.
4.1.4.1 Net Energy Value The utilities use both commercial and proprietary forward price curves for energy, at the trading hub (PG&E, SDG&E) or down to the nodal level (PG&E, SCE), and including the effect of marginal congestion and marginal losses. SCE develops a probabilistic forecast for day-ahead energy prices and a single point forecast for real-time energy prices. The utilities may run production cost simulations to generate forecasts of future market prices. These values can be used within StorageVET.
4.1.4.2 Ancillary Service Value The utilities develop forward curves for ancillary services. SCE states that these are point forecasts, rather than probabilistic forecasts. The utilities discuss the use of models to co- optimize energy and ancillary services, in some cases across both day-ahead and real-time markets (SCE). PG&E notes that the impact of additional storage operations on market value in ancillary services will also be considered.
PG&E notes that it will examine possible values for flexible ramping product, blackstart, and inertia, if it appears that offers will make a significant contribution to these services.
Ancillary service prices can be used within StorageVET, but impacts of storage on the ancillary service markets are outside the scope of the tool when used in stand-alone mode.
4.1.4.3 Capacity Value The utilities use forward capacity price curves on a monthly basis, which establish the capacity value of an eligible storage resource. These include system, local and flexible capacity. Customer-sited storage is evaluated as a load modifier, and assigned an avoided capacity value similarly to the methodology for demand response. These values can be used within StorageVET.
4.1.4.4 Other Locational Value In addition to calculating locational value of energy and capacity around the California power system, some utilities may provide a further value for projects located within their territory. This may be quantitative or qualitative.
4.1.4.5 System Efficiency Storage may contribute to more efficient operation of the generation fleet, which may indirectly affect market prices and also result in non-market priced benefits, such as avoided generation start-up costs. PG&E calls this category “system efficiency” and includes calculations of such benefits. This is an example of a storage benefit which may be derived without a further simulation of the power system. These types of values would be calculated outside StorageVET optimization.

4-5
4.1.4.6 Transmission and Distribution Investment Costs For storage projects which require transmission or distribution upgrades for interconnection, the utilities will calculate these costs. In solicitations, project offers can include a cap on these costs.
4.1.4.7 Credit and Collateral Adder Cost If project developers requests different credit and collateral terms than under the utility pro forma requirements, the utility may calculate a credit and collateral adder to reflect any additional exposure.
4.1.4.8 Avoided Transmission and Distribution Investment The utilities will calculate avoided transmission and distribution costs for specific distribution or customer-sited storage projects. These costs will be unique to the project site, as compared to the generic costs found in avoided cost calculators.
This preceding list is presented for illustration only and is not complete; readers should consult the utility applications for additional information.
4.2 CPUC Cost-Effectiveness Tests for Demand Side Programs and Projects This section describes the CPUC’s prescribed methodology for customer-sited programs and projects, including demand response, stand-alone storage, and other integrated or aggregated DERs. These methods are defined in the California Standard Practice Manual: Economic Analysis of Demand-Side Programs and Projects [30] and included in the StorageVET tool within the financial analysis module. The advantages and limitations of each type of test are discussed in the manual, and in other similar documents.
The Participant Cost Test quantifies the costs and benefits to customers from installations of DER, including the fixed and variable costs of the DER, and benefits in the form of financial incentives and reductions in retail rates. It excludes any non-quantifiable benefits.
The Program Administrator Cost Test measures the costs and benefits to the program administrator, which could be the utility or other administrator. Benefits include avoided costs otherwise assignable to the administrator.
The Ratepayer Impact Measure (RIM) measures the impact of the DER program on customer rates, taking into account the avoided costs associated with the program.
The Total Resource Cost Test (TRC) measures total costs and benefits across the entities directly affected by the storage or aggregated DER, with the exclusion of incentives provided by the utility to the participant.
StorageVET can assist in improving these calculations through the capability to accurately model multiple-use applications.
Table 4–3 Cost-effectiveness tests
Participant Cost Test
Primary Secondary

4-6
Net present value (all participants)
Discounted payback (years) Benefit-cost ratio Net present value (average participant)
Ratepayer Impact Measure
Lifecycle revenue impact per Unit of energy (kWh or therm) or demand customer (kW) Net present value (NPV)
Lifecycle revenue impact per unit Annual revenue impact (by year, per kWh, kW, therm, or customer) First-year revenue impact (per kWh, kW, therm, or customer) Benefit-cost ratio
Total Resource Cost
Net present value (NPV)
Benefit-cost ratio (BCR) Levelized cost (cents or dollars per unit of energy or demand) Societal (NPV, BCR)
Program Administrator Cost
Net present value (NPV)
Benefit-cost ratio Levelized cost (cents or dollars per unit of energy or demand)
4.3 CPUC Locational Net Benefits Analysis As first noted in section 3, Locational Net Benefits Analysis (LNBA) calculates the avoided wholesale market costs, infrastructure costs and other benefits associated with DER, for use in distribution resource planning, including evaluation of alternatives to investments in T&D capacity.
For CPUC-jurisdictional utilities, LNBA is to be conducted using the cost components and inputs in two Commission approved spreadsheet-based tools for conducting cost-benefit analysis for distributed resources – the Distributed Energy Resource Avoided Cost (DERAC) tool and the Demand Response (DR) cost-effectiveness calculator. The inputs into these tools can be augmented with additional locational analysis, as defined by the CPUC [31].
StorageVET or similar storage optimization modeling tools have not formally been incorporated into the approved LNBA methodology, although utilities will use such tools for internal analysis. However, such tools would in principle allow for more accurate sizing and valuation of distribution-connected storage as stand-alone resources or integrated with other DER. Table 4-4 summarizes selected uses of StorageVET in LNBA. Some relevant demonstration projects for LBNA are discussed in section 5.

4-7
Table 4–4 Selected potential uses of StorageVET in LBNA
Categories of Costs
Specific Costs StorageVET Functions
Avoided Energy LMP or LAP Calculate optimal energy time- shift value of storage resource based on LMPs
Avoided Energy Losses
Average distribution loss factor or marginal loss component of LMP
Calculate value based on marginal loss component of LMP
Avoided Generation Capacity
System and Local RA Calculate storage reduction in peak load on distribution circuit
Flexible RA Calculate storage reduction in net load ramp on distribution circuit
Avoided Ancillary Service (AS) Costs
AS market prices Calculate AS market revenues by distributed storage
Avoided RPS Cost of a marginal renewable resource less the resource’s energy market and capacity value
Modify PV profiles to reduce curtailment
Other avoided costs Renewable Integration Costs Could be used to modify PV profiles as input into integration analysis
Societal avoided costs N/A
Public safety costs N/A
Avoided T&D Sub-Transmission / Substation / Feeder
Use operating requirements for storage to meet distribution deferral objectives while co- optimizing market services. Distribution Voltage / Power Quality
Distribution Reliability / Resiliency
Transmission
4.4 POU Storage Evaluation Publicly-Owned Utilities (POUs) have used a variety of methods and tools to evaluate storage projects in different domains, which have similarities and differences with the evolving CPUC/IOU methodological framework. There are 37 California POUs. This section will not compare the recent storage assessments conducted by each of them, but will examine selected approaches along with implications for StorageVET. In addition, this section does not provide an update on current POU analyses or ongoing storage procurement activities.
Recent POU storage assessment and valuation methods are summarized in the following public sources:

4-8
• Initial Energy Storage Procurement Targets reports under AB 2514; • Integrated Resource Plans (IRPs); and • Demonstration projects which result in public reports.
The next subsections provide some details on the valuation methodologies used in these studies, and readers can refer to the originals for more information.
4.4.1 Storage Services The POUs generally evaluate a similar range of services to the IOUs, with the exception that some energy and ancillary service values may be related to internal utility operations in the vertically integrated POUs. As illustration, Table 4-5 lists the types of services being valued in the Southern California Public Power Authority (SCPPA) storage RFP [32].
Table 4–5 Storage services evaluated under SCPPA storage solicitation
Category of Service Type of Service
Bulk Services Peak Load Shift
Supply Capacity
Ancillary Services Frequency Regulation
Spin and Non-spin
Voltage Support
Black Start
Variable Energy Resource (VER) Load Following
Transmission & Distribution Transmission Deferral
Congestion Relief
Transmission Capacity – support dynamic stability and frequency
Distribution Deferral
Commercial / Industrial Power Quality
Power Reliability
Energy Time Shift
Demand Charge Management
Inc. Cool. Capacity
Residential Power Quality
Power Reliability

4-9
Energy Time Shift
Inc. Cool. Capacity
Source: [32]
4.4.2 Energy Storage Procurement Targets reports In October 2014, the POUs submitted initial determination on energy storage procurement targets to their boards, several of which included detailed reports explaining the technical analysis behind the decisions, including cost-benefit analysis. Table 4-6 summarizes selected applications and tools used in those assessments. All reports are filed with the CEC [23].
Table 4–6 Storage applications and tools used in selected POU storage assessments
Applications Analyzed Commercial Tools Identified
City of Anaheim Distribution deferral; other services evaluated qualitatively
Navigant Consulting, Inc., ES Computational Tool (ESCT) Version 1.2
Los Angeles Department of Water and Power (LADWP)
Generation applications – capacity contribution, capital deferment for new fossil fuel-power peaking generation, peak shaving, peak shifting, ancillary services, reduced cycling cost at thermal generation plants, renewable energy integration support
Black & Veatch SmartES tool
EPRI Energy Storage Valuation Tool (ESVT)
General Electric (GE) PSLF to simulate frequency/voltage impacts in extreme PV ramping scenarios
Transmission-connected – ramp rate control, frequency regulation, capacity firm of the solar PV plant, capacity contribution
Distribution-connected – localized voltage regulation, deferred investments in the distribution system, distributed solar energy time-shift
Customer services – Peak shaving, load shifting, distribution deferral, mitigation of overgeneration, reduced cycling cost at thermal generation plants
Pasadena Wholesale energy market and cost optimization, load following, renewable energy capacity firming, renewable energy ramping, renewable energy smoothing, renewable energy shifting, Black Start Provision, Backup Power, Asset Management,
Navigant Energy Storage Tool, V.1.0

4-10
Sacramento Municipal Utilities District (SMUD)
Renewable energy shifting, wholesale market arbitrage & cost optimization, retail market, asset management, load following, operating reserves, frequency regulation, renewable energy capacity firming, black start, renewable energy ramping, renewable energy smoothing, backup power, power quality
EPRI Energy Storage Valuation Tool (ESVT), other utility tools

5-1
5 DISTRIBUTED STORAGE RESOURCE TYPES, REQUIREMENTS AND DEMONSTRATION PROJECTS This section provides details on resource types and sizing requirements relevant to storage as distributed energy resources (DER). This includes stand-alone distributed storage, storage integrated or aggregated with distributed photovoltaics (PV) and other DER, and storage supporting Demand Response (DR). Each of these applications can be represented in StorageVET™, although aggregation is not a direct feature. This section does not review electric vehicles used to provide grid services.
This section is placed before the description of CAISO market participation models for DER and DR, which follow in section 6, because some distributed resources will not provide wholesale market services or will also qualify for multiple use applications which combine utility and retail customer services as well as wholesale services. As such, their characteristics will be shaped jointly by regulatory program rules and market requirements. However, there is some overlap where these requirements (e.g., minimum size) are the same.
This section is organized as follows:
Section 5.1 – Key characteristics of DER which include storage (other than DR, which is included in the next sections), including sizing requirements under the relevant programs and interconnection requirements;
Section 5.2 – a review of DER demonstration projects, including those being developed to support Distribution Resource Planning (DRP) which may involve procurement of distributed resources including storage.
Section 5.3 – a survey of current DR programs noting those which could in principle include storage, as well as a review of DR demonstration projects involving storage.
Interim and final reports from demonstration projects may include data which users of StorageVET can utilize when validating model results, or when evaluating similar types of storage projects or aggregated DER. This section does not cover other requirements for DERs which may be relevant to constraints modeled in StorageVET, such as resource interconnection standards and requirements, telemetry requirements, and safety standards.
5.1 Distributed Energy Resources with Storage 5.1.1 DER Resource Types and Characteristics DER are defined here to include distribution-connected and customer-sited projects, typically small-scale individual resources but able to be aggregated to multiple MWs. Table 5-1 summarizes the types of eligible technologies under different California programs, indicated which ones allow storage as stand-alone technologies (i.e., eligible without any other DER technologies) and which require that storage is integrated with another eligible technology to improve performance.
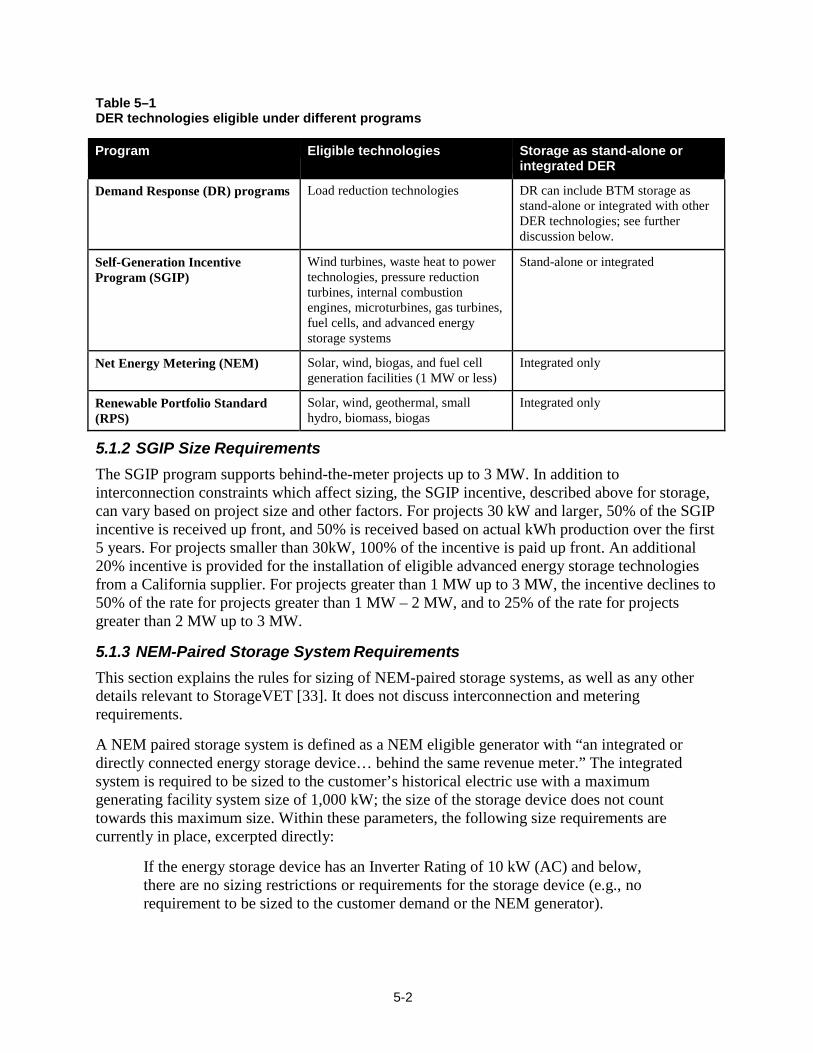
5-2
Table 5–1 DER technologies eligible under different programs
Program Eligible technologies Storage as stand-alone or integrated DER
Demand Response (DR) programs Load reduction technologies DR can include BTM storage as stand-alone or integrated with other DER technologies; see further discussion below.
Self-Generation Incentive Program (SGIP)
Wind turbines, waste heat to power technologies, pressure reduction turbines, internal combustion engines, microturbines, gas turbines, fuel cells, and advanced energy storage systems
Stand-alone or integrated
Net Energy Metering (NEM) Solar, wind, biogas, and fuel cell generation facilities (1 MW or less)
Integrated only
Renewable Portfolio Standard (RPS)
Solar, wind, geothermal, small hydro, biomass, biogas
Integrated only
5.1.2 SGIP Size Requirements The SGIP program supports behind-the-meter projects up to 3 MW. In addition to interconnection constraints which affect sizing, the SGIP incentive, described above for storage, can vary based on project size and other factors. For projects 30 kW and larger, 50% of the SGIP incentive is received up front, and 50% is received based on actual kWh production over the first 5 years. For projects smaller than 30kW, 100% of the incentive is paid up front. An additional 20% incentive is provided for the installation of eligible advanced energy storage technologies from a California supplier. For projects greater than 1 MW up to 3 MW, the incentive declines to 50% of the rate for projects greater than 1 MW – 2 MW, and to 25% of the rate for projects greater than 2 MW up to 3 MW.
5.1.3 NEM-Paired Storage System Requirements This section explains the rules for sizing of NEM-paired storage systems, as well as any other details relevant to StorageVET [33]. It does not discuss interconnection and metering requirements.
A NEM paired storage system is defined as a NEM eligible generator with “an integrated or directly connected energy storage device… behind the same revenue meter.” The integrated system is required to be sized to the customer’s historical electric use with a maximum generating facility system size of 1,000 kW; the size of the storage device does not count towards this maximum size. Within these parameters, the following size requirements are currently in place, excerpted directly:
If the energy storage device has an Inverter Rating of 10 kW (AC) and below, there are no sizing restrictions or requirements for the storage device (e.g., no requirement to be sized to the customer demand or the NEM generator).
5-3
For energy storage devices where the Inverter Rating is >10 kW (AC), the maximum output power of the storage device cannot be larger than 150% of the NEM Renewable Electrical Generating Facility’s (REGF) capacity. For example, if the REGF is sized to load at 20 kW, then the inverter rating for the storage device can be a maximum of 30 kW (AC).
When paired with an NEM-eligible generator, the storage device is considered an addition or enhancement to that NEM-eligible generating facility and is not a separate “generator” as defined under the Rule 21 interconnection tariff, provided the applicable sizing and metering requirements are adhered to.
NEM-eligible resources that are also collecting SGIP rebates must meet the size requirements for both programs to qualify for both NEM payments and rebates.
5.2 DER Demonstration Projects with Storage Distributed storage resources and aggregated DER are the subjects of many IOU and POU demonstration projects over the past years, and this section only reviews a few recent and ongoing projects. For utility users of StorageVET, the tool could be used to calculate results in a format which can be easily conveyed to regulators or project funders. For non-utility users, publicly available results from these projects could provide validation of StorageVET results if the project parameters can be reasonably replicated within the tool.
This section first lists a few selected projects focused on wholesale market, retail and distribution operations, excluding those which are being modeled as Demand Response, which are discussed in the next section. Second, the section describes demonstration projects within the distribution resource planning process. There is some overlap between these two categories. Additional demonstration projects may be described in subsequent version of this report.
5.2.1 Utility Market or Distribution Demonstration Projects 5.2.1.1 PG&E Energy Storage for Market Operations This CEC EPIC-funded demonstration project utilized PG&E’s Vaca-Dixon and Yerba Buena Sodium Sulfur (NAS) Battery Energy Storage Systems (BESSs) to bid energy and ancillary services in the CAISO markets while also providing distribution services, notably that half the energy was reserved for islanding/backup for an adjacent customer facility. The project was authorized in September 2013 and the final report was issued in September 2016 [7]; it includes detailed results from the periods of market participation, as well as recommendations on improvements to these procedures. The project included development of an optimization model, with storage system parameters which could be replicated within StorageVET for comparison.
5.2.1.2 SCE Preferred Resources Pilot (PRP) In 2014, Southern California Edison (SCE) launched a Preferred Resources Pilot (PRP) to evaluate integration of distributed resources on several substations [34]. Associated with this project was an initial RFO for up to 50 MW of new renewable distributed generation in central and south Orange County. Subsequently, in September 2015, a second RFO was issued for 100 MW. Eligible resources include demand response, distributed renewable generation, energy storage, integrated generation with storage, and permanent load shifting. Storage projects

5-4
procured through the PRP solicitations would count towards SCE’s procurement targets. Project data including methodology of portfolio design is available on the project website.
5.2.1.3 SMUD Photovoltaic and Smart Grid Pilot at Anatolia This Sacramento Municipal Utility District (SMUD) pilot project [35] tested lithium ion battery storage at customer and distribution transformer locations in a suburb of Sacramento. The batteries were used for load-shifting of residential demand and PV production smoothing at both the residential and transformer levels. The pilot also tested retail dynamic pricing to facilitate the utilization of PV and storage to manage customer bills. The benefits of energy storage were $88/kW to $215/kW for customer-sited and $67/kW to $176/kW for transformer-sited distributed energy storage.
5.2.2 IOU DRP Demonstration Projects All CPUC orders cited here are available on the CPUC DRP webpage [24]. In its July 2015 Guidance, the CPUC required the IOUs to propose demonstration projects in five areas to advance distribution resource planning and market development. Table 5-2 summarizes the five IOU demonstration projects by location.
Table 5–2 IOU DRP pilot projects as of November 2016
Pilot project/status PG&E SCE SDGE
A. Demonstrate Dynamic Integration Capacity Analysis (ICA) Authorized by CPUC in May 2016, project underway
Chico (Urban/Suburban) and Chowchilla (Rural) distribution planning areas (DPAs).
Johanna (Urban/Suburban) and Rector (Rural) distribution planning areas (DPAs).
Northeast (Urban/Suburban) and Ramona (Rural) distribution planning areas (DPAs).
B. Demonstrate Optimal Location Benefit Analysis (LBNA) Methodology Authorized by CPUC in May 2016, project underway
Chico (Urban/Suburban) and Chowchilla (Rural) distribution planning areas (DPAs).
5 substations within Rector distribution planning area (DPA).
Northeast (Urban/Suburban) and Ramona (Rural) distribution planning areas (DPAs).
C. Demonstrate DER Locational Benefits
Chico area DPA. Orange county. Irvine substation region. Leverage Preferred Resources Pilot (PRP), Johanna and Santiago substations.
Mission substation (Circuit 701), and Felicita substation (Circuit 470)
D. Demonstrate Distribution Operations at High Penetration of DER
Gates DPA, Huron Substation 12 kV bus.
Orange county. Leverage SCE Integrated Grid Project (IGP), Johanna Jr. and Camden sub- stations.
Valley Center substation, San Diego county.
E. Demonstrate DER Dispatch to Meet Reliability Needs
Angel Island electric system (San Francisco bay area) (peak load 100 kW).
Irvine, adjacent to the University of California, Irvine, CA.
Leverage Borrego Springs microgrid project (peak load 12 MW).

5-5
5.2.2.1 DRP Demonstration Projects A & B Demonstration projects A and B – demonstrating Integration Capacity Analysis (ICA) and Locational Net Benefits Analysis (LNBA), respectively – are focused on development of methods and tools, as well as identifying viable locations for conducting analytical testing. On May 2, 2016, the CPUC issued an order refining the ICA and LNBA methodologies and requirements on an interim basis for use in the demonstration projects, and authorizing the projects. On June 16, 2016, the IOUs filed updated Project and Implementation Plans. Working groups on both projects are also meeting, to provide further guidance on methods; these working group reports are due at the end of 2016. On August 26, 2016, the CPUC issued an order approving further modifications to the utility methodologies. Both demonstrations are scheduled to provide final reports by end of 2016.
With respect to Demonstration project A, the May 2, 2016, order outlines four general steps of a “streamlined” ICA methodology, each with specific technical requirements: (1) establish distribution system level of granularity; (2) model and extract power system data; (3) evaluate power system criterion to determine DER capacity; and (4) calculate ICA results and display on online map. Elaborating on these general steps, the order requires that the utilities adopt a range of specific analytical details. This includes quantifying the hosting capacity for 8 different DER profiles shown in Table 5-3 as well as “representative portfolios” of (i) solar, (ii) solar and stationary storage, (iii) solar, stationary storage, and load control, and (iv) solar, stationary storage, load control, and EVs. The utilities must evaluate methods to improve computational efficiency when conducting these analyses. In addition, they must evaluate both DER projects which do not cause reverse flow beyond the busbar, and those which maximize hosting capacity while allowing reverse flow. The analysis must also include 12 general metrics of success. In response to these and other requirements, each utility filing provides a review of methods, tools and an initial set of metrics, along with a schedule and deliverables.
Table 5–3 Types of DER profiles to be evaluated for ICA
DER profile Modeling with StorageVET
Uniform Load N/A
Uniform Generation (machine, inverter) N/A
PV Yes – user will specify profile
PV with Tracker Yes – user will specify profile
Storage – Peak Shaving Yes
PV with Storage Yes – model can dispatch storage against curtailed PV energy; user can also substitute non-PV generation DER profile for analysis.
EV – Workplace No
EV – Residential (EV Rate) No
EV – Residential (TOU rate) No

5-6
For Demonstration B, the CPUC’s May 2, 2016 order provides a detailed table of services on which to conduct valuation for LNBA, as well as identifying which are primary valuation requirements and which are secondary, subject to utility discretion. This is reviewed in section 4. While the Commission aims for a standardized calculation of most services, as requested, the utilities can estimate more specific locational or system wide results for certain defined services or system operational needs. In their final plans, the utilities have defined a process to identify the appropriate location, conduct the LBNA, and provide a method for visualization of the results.
The IOUs will concurrently release a public “simple” tool to conduct LBNA, with standardized values. Each utility filing contains an appendix with a description of this tool and the valuation categories. However, the utilities will also utilize their own data and analytical methods for confidential analysis.
5.2.2.2 DRP Demonstration Projects C, D, & E Demonstration projects C, D & E are intended to conduct DER procurement and operations in various field settings and to achieve particular operational and reliability objectives, in addition to refining analytical methods. In these demonstrations, the utilities will procure DER resources, or include third-party resources, within the project scope. Table 5-2 shows the current locations identified by the utilities. The utilities plan to procure several technologies, notably solar photovoltaic, energy storage, and smart inverters. Each filing lists metrics to be used in each demonstration. Proposed budgets are broken down by component element. Most of the demonstrations are scheduled to begin in Q4 2016, following CPUC approval, and result in a final report in 2020.
5.3 Demand Response Programs Demand Response (DR) encompasses a range of programs which alter the load realized for CAISO or utility operations in response to retail rate incentives or an economic or reliability dispatch instruction. In 2015, DR programs fulfilled about 5% of CAISO’s resource adequacy requirements, although these programs were rarely dispatched. While program rules are in continuous development, storage of various configurations can be used for certain DR programs, whether to modify load or to support the dispatchability of DR resources into the wholesale market. This section provides the current details on the DR programs under the CPUC’s jurisdiction, and potential rules played by storage. Section 6.2.7 defines the different CAISO market participation models, while sections 8-10 examine specific requirements for providing CAISO wholesale services or Resource Adequacy capacity via the DR framework.
StorageVET can be used to evaluate the operations of storage to modify loads and provide market services as DR resources, and to examine multiple uses of the storage resource for other services consistent with meeting DR obligations.
5.3.1 CPUC Demand Response Programs This section defines the different types of CPUC DR programs and their current eligibility to provide different services (peak energy, ancillary services). Section 6 will examine the different corresponding market participation rules in more detail.
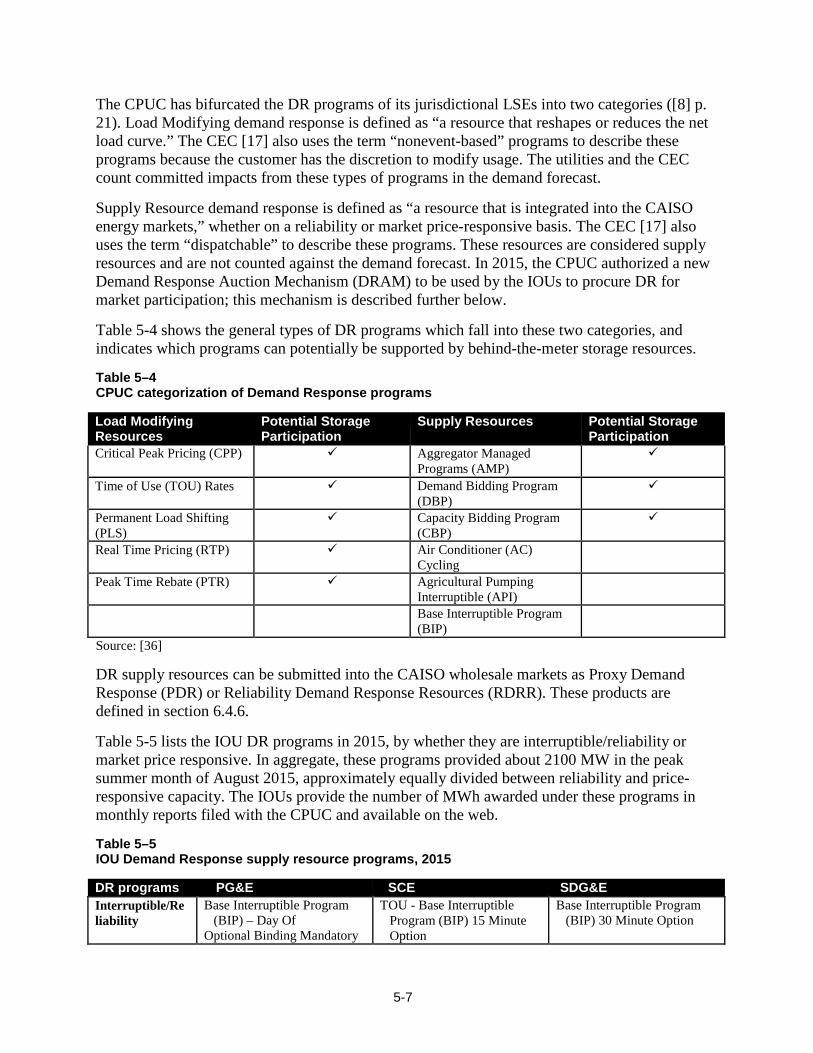
5-7
The CPUC has bifurcated the DR programs of its jurisdictional LSEs into two categories ([8] p. 21). Load Modifying demand response is defined as “a resource that reshapes or reduces the net load curve.” The CEC [17] also uses the term “nonevent-based” programs to describe these programs because the customer has the discretion to modify usage. The utilities and the CEC count committed impacts from these types of programs in the demand forecast.
Supply Resource demand response is defined as “a resource that is integrated into the CAISO energy markets,” whether on a reliability or market price-responsive basis. The CEC [17] also uses the term “dispatchable” to describe these programs. These resources are considered supply resources and are not counted against the demand forecast. In 2015, the CPUC authorized a new Demand Response Auction Mechanism (DRAM) to be used by the IOUs to procure DR for market participation; this mechanism is described further below.
Table 5-4 shows the general types of DR programs which fall into these two categories, and indicates which programs can potentially be supported by behind-the-meter storage resources.
Table 5–4 CPUC categorization of Demand Response programs
Load Modifying Resources
Potential Storage Participation
Supply Resources Potential Storage Participation
Critical Peak Pricing (CPP) Aggregator Managed Programs (AMP)
Time of Use (TOU) Rates Demand Bidding Program (DBP)
Permanent Load Shifting (PLS)
Capacity Bidding Program (CBP)
Real Time Pricing (RTP) Air Conditioner (AC) Cycling
Peak Time Rebate (PTR) Agricultural Pumping Interruptible (API)
Base Interruptible Program (BIP)
Source: [36]
DR supply resources can be submitted into the CAISO wholesale markets as Proxy Demand Response (PDR) or Reliability Demand Response Resources (RDRR). These products are defined in section 6.4.6.
Table 5-5 lists the IOU DR programs in 2015, by whether they are interruptible/reliability or market price responsive. In aggregate, these programs provided about 2100 MW in the peak summer month of August 2015, approximately equally divided between reliability and price- responsive capacity. The IOUs provide the number of MWh awarded under these programs in monthly reports filed with the CPUC and available on the web.
Table 5–5 IOU Demand Response supply resource programs, 2015
DR programs PG&E SCE SDG&E Interruptible/Re liability
Base Interruptible Program (BIP) – Day Of
Optional Binding Mandatory
TOU - Base Interruptible Program (BIP) 15 Minute Option
Base Interruptible Program (BIP) 30 Minute Option

5-8
Curtailment (OBMC) Scheduled Load Reduction
Program (SLRP) SmartAC – Commercial SmartAC - Residential
TOU - Base Interruptible Program (BIP) 30 Minute Option
Optional Binding Mandatory Curtailment (OBMC)
Agricultural Pumping Interruptible (API)
Price Responsive
Aggregator Managed Programs (AMP) – Day Of
Capacity Bidding Program (CBP) – Day Ahead
Capacity Bidding Program (CBP) – Day Of
Demand Bidding Program (DBP)
PDP (≥200 kW) PDP (20 kW – 200 kW) PDP (≤ 20 kW) SmartRate – Residential
Summer Discount Plan (SDP) – Residential
Summer Discount Plan (SDP) – Commercial
Capacity Bidding Program (CBP) – Day Ahead
Capacity Bidding Program (CBP) – Day Of
Demand Bidding Program (DBP)
AMP Contracts/DR Contracts (AMP)
Real Time Pricing (RTP) Save Power Day (SPD/PTR) Scheduled Load Reduction
Program (SLRP)
CPP-D Summer Saver Residential Summer Save Commercial Capacity Bidding Program
(CBP) – Day Ahead Capacity Bidding Program
(CBP) – Day Of PTR Residential SCTD Residential Demand Bidding Program
(DBP) TOU-A-P Small Commercial Permanent Load Shifting
Source: IOU monthly DR reports
5.3.2 Demand Response Current Operations and Forecasts Public data on the DR market can be used to evaluate how StorageVET results compare to historical DR utilization, and also to consider market scope over the coming years.
Most of the utility DR programs are dispatched by the utility. Of the price-responsive DR, approximately 200 MW were offered into the CAISO markets in 2015 as Proxy Demand Response (PDR). As discussed next, additional market-based DR is being procured via several pilot programs. Table 5-6 shows CAISO data on the dispatch of PDR resources over 291 peak hours in June – November 2015 [18]. The CEC provides ten-year forecasts of the impact of DR on peak load [17].
Table 5–6 CAISO Average hourly Proxy Demand Response (PDR) dispatched and frequency, June – November 2015
Month Number of days Average hours per day
Average hourly dispatched (MWh)
June 14 3 4.2 July 22 3 9.0 August 18 3 4.8 September 20 3 6.5 October 16 2 8.0 November 19 2 4.7 Source: [18] p. 31
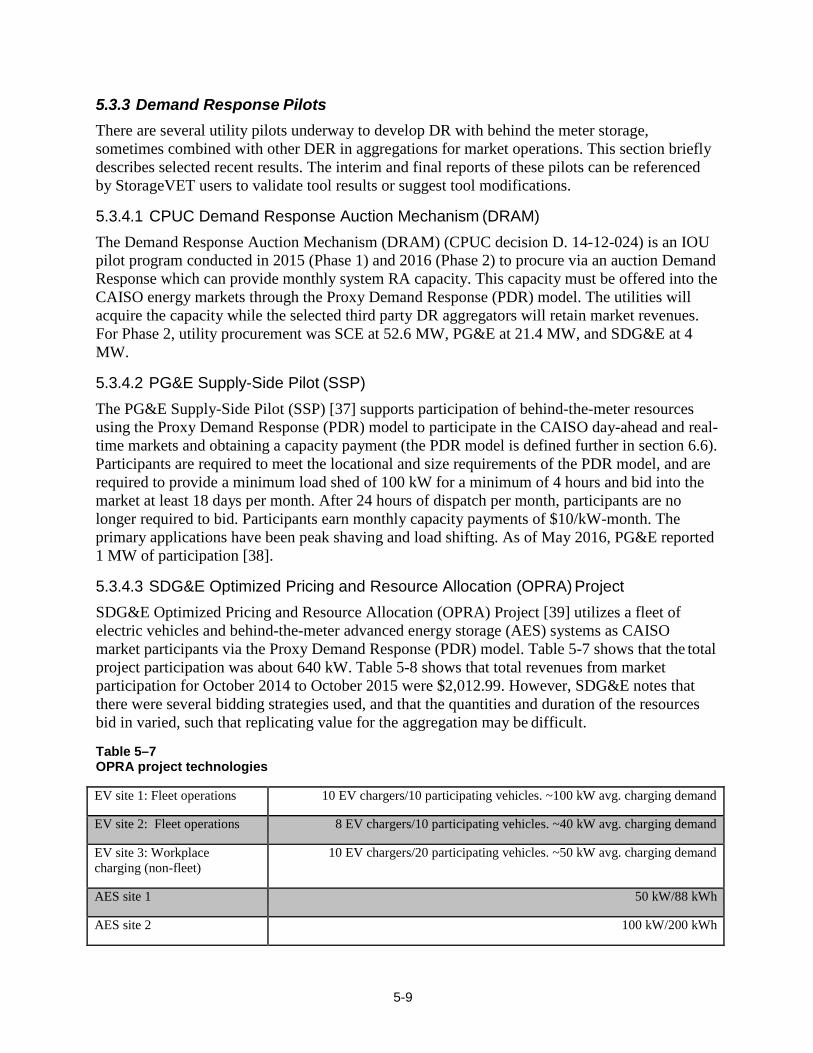
5-9
5.3.3 Demand Response Pilots There are several utility pilots underway to develop DR with behind the meter storage, sometimes combined with other DER in aggregations for market operations. This section briefly describes selected recent results. The interim and final reports of these pilots can be referenced by StorageVET users to validate tool results or suggest tool modifications.
5.3.4.1 CPUC Demand Response Auction Mechanism (DRAM) The Demand Response Auction Mechanism (DRAM) (CPUC decision D. 14-12-024) is an IOU pilot program conducted in 2015 (Phase 1) and 2016 (Phase 2) to procure via an auction Demand Response which can provide monthly system RA capacity. This capacity must be offered into the CAISO energy markets through the Proxy Demand Response (PDR) model. The utilities will acquire the capacity while the selected third party DR aggregators will retain market revenues. For Phase 2, utility procurement was SCE at 52.6 MW, PG&E at 21.4 MW, and SDG&E at 4 MW.
5.3.4.2 PG&E Supply-Side Pilot (SSP) The PG&E Supply-Side Pilot (SSP) [37] supports participation of behind-the-meter resources using the Proxy Demand Response (PDR) model to participate in the CAISO day-ahead and real- time markets and obtaining a capacity payment (the PDR model is defined further in section 6.6). Participants are required to meet the locational and size requirements of the PDR model, and are required to provide a minimum load shed of 100 kW for a minimum of 4 hours and bid into the market at least 18 days per month. After 24 hours of dispatch per month, participants are no longer required to bid. Participants earn monthly capacity payments of $10/kW-month. The primary applications have been peak shaving and load shifting. As of May 2016, PG&E reported 1 MW of participation [38].
5.3.4.3 SDG&E Optimized Pricing and Resource Allocation (OPRA) Project SDG&E Optimized Pricing and Resource Allocation (OPRA) Project [39] utilizes a fleet of electric vehicles and behind-the-meter advanced energy storage (AES) systems as CAISO market participants via the Proxy Demand Response (PDR) model. Table 5-7 shows that the total project participation was about 640 kW. Table 5-8 shows that total revenues from market participation for October 2014 to October 2015 were $2,012.99. However, SDG&E notes that there were several bidding strategies used, and that the quantities and duration of the resources bid in varied, such that replicating value for the aggregation may be difficult.
Table 5–7 OPRA project technologies
EV site 1: Fleet operations 10 EV chargers/10 participating vehicles. ~100 kW avg. charging demand
EV site 2: Fleet operations 8 EV chargers/10 participating vehicles. ~40 kW avg. charging demand
EV site 3: Workplace charging (non-fleet)
10 EV chargers/20 participating vehicles. ~50 kW avg. charging demand
AES site 1 50 kW/88 kWh
AES site 2 100 kW/200 kWh

5-10
AES site 3 100 kW/200 kWh
Total Project Capacity: ~640 kW
Table 5–8 OPRA project market revenue, October 2014 to October 2015
Ancillary Service Revenue $431.09
Day-ahead Energy Revenue $352.58
Real-time Energy Revenue $154.13
Instructed Imbalance Energy Revenue $1,075.18
Total gross market revenue $2,012.99

6-1
6 CAISO MARKET PARTICIPATION REQUIREMENTS AND MODELS The market entities described in section 3 participate in the CAISO markets through a set of defined market participation models, which are specified in the Tariff and business practice manuals. All storage technologies or resource aggregations which include storage technologies must fit into one of these models; there may also be new models developed3. This section provides background and definitions on these models and provides references to additional CAISO documentation.
The section also examines the requirements that can be directly modeled in StorageVET. The descriptions below are intended initially to correspond to initial StorageVET capabilities and may be expanded in later versions of the report as experience is gained with the tool.
This section is organized as follows:
Section 6.1 – Overview of CAISO market participation models
Section 6.2 – Non-Generation Resources
Section 6.3 – Pumped Storage
Section 6.4 – Participating Generator
Section 6.5 – Participating Load
Section 6.6 – Demand Response
Section 6.7 – Distributed Energy Resource Aggregation
Section 6.8 – System Resources
There are several summary tables in this section. Table 6-1 lists the market participation models along with the types of technologies that can use the model. Table 6-2 shows which market services can be provided under each market participation model. Table 6-3 shows additional requirements for each market participation model. Table 6-4 summarizes Demand Response product characteristics.
6.1 Overview of CAISO Market Participation Models The CAISO has a set of defined market participation models intended to facilitate market operations by all resource types currently in the markets and provide the specifications for
3 FERC [2] has recently proposed a new storage market participation model, which would have similarities to the CAISO NGR model described in this section, and a new aggregated distributed energy resource model, which would have similarities to the CAISO DERP model. However, the final FERC rule could require additional components.
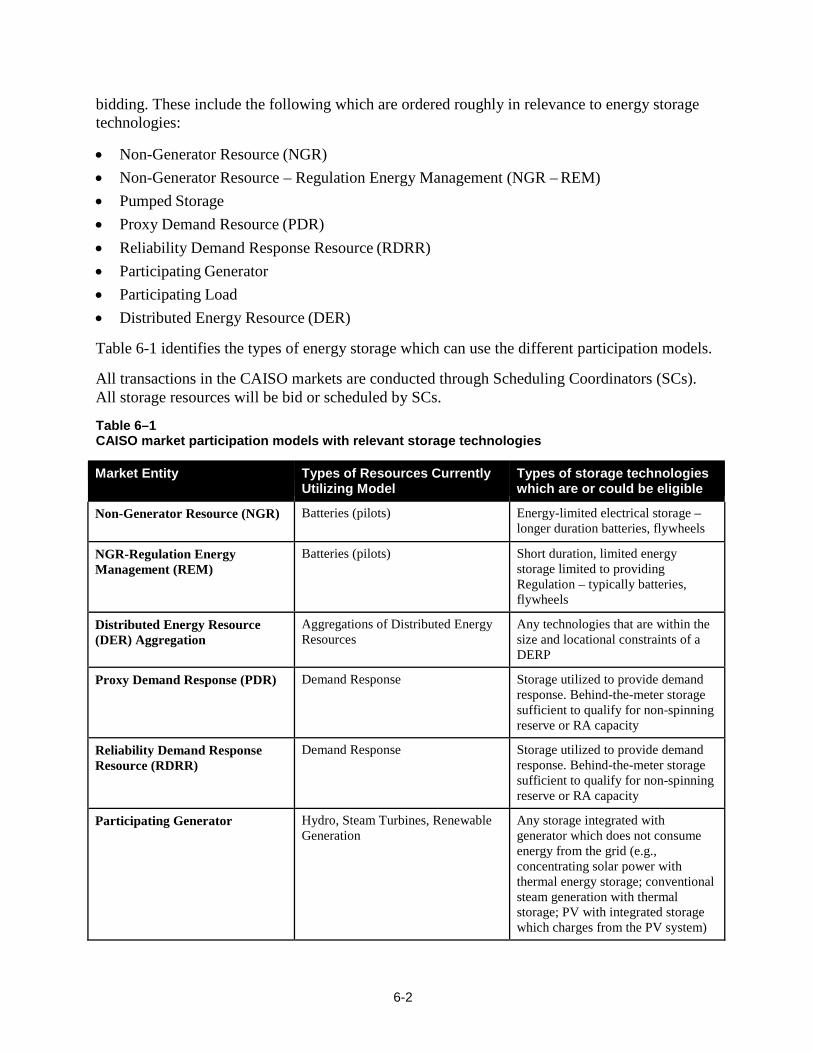
6-2
bidding. These include the following which are ordered roughly in relevance to energy storage technologies:
• Non-Generator Resource (NGR) • Non-Generator Resource – Regulation Energy Management (NGR – REM) • Pumped Storage • Proxy Demand Resource (PDR) • Reliability Demand Response Resource (RDRR) • Participating Generator • Participating Load • Distributed Energy Resource (DER)
Table 6-1 identifies the types of energy storage which can use the different participation models.
All transactions in the CAISO markets are conducted through Scheduling Coordinators (SCs). All storage resources will be bid or scheduled by SCs.
Table 6–1 CAISO market participation models with relevant storage technologies
Market Entity Types of Resources Currently Utilizing Model
Types of storage technologies which are or could be eligible
Non-Generator Resource (NGR) Batteries (pilots) Energy-limited electrical storage – longer duration batteries, flywheels
NGR-Regulation Energy Management (REM)
Batteries (pilots) Short duration, limited energy storage limited to providing Regulation – typically batteries, flywheels
Distributed Energy Resource (DER) Aggregation
Aggregations of Distributed Energy Resources
Any technologies that are within the size and locational constraints of a DERP
Proxy Demand Response (PDR) Demand Response Storage utilized to provide demand response. Behind-the-meter storage sufficient to qualify for non-spinning reserve or RA capacity
Reliability Demand Response Resource (RDRR)
Demand Response Storage utilized to provide demand response. Behind-the-meter storage sufficient to qualify for non-spinning reserve or RA capacity
Participating Generator Hydro, Steam Turbines, Renewable Generation
Any storage integrated with generator which does not consume energy from the grid (e.g., concentrating solar power with thermal energy storage; conventional steam generation with thermal storage; PV with integrated storage which charges from the PV system)

6-3
Constrained Output Generation Combustion Turbines N/A
Multi-Stage Generating Resources
Combined Cycle Gas Turbine (CCGT), other generation with
N/A
Participating Load Mostly Pumping Loads, including associated with Pumped Storage
Pumped Storage during pumping
System Resources Generators located outside the CAISO Balancing Authority Area (BAA)
Storage technologies located outside the CAISO BAA
Table 6-2 shows the eligible market services for each market participation model. Of these models, three have limitations on the types of services offered: The NGR-REM model is currently for Regulation only, and can qualify as Flexible Capacity (section 10); the RDRR model is eligible for energy and RA capacity; and the Participating Load model is eligible for real-time Energy, Non-Spinning Reserves, and RA capacity.
Table 6–2 CAISO market participation models eligibility to provide market services
IFM-
Energy RTM-
Energy Regulation
Up/Regulation Down
Spinning Reserves
Non- Spinning Reserves
RA Capacity
NGR
NGR-REM Flexible capacity
DER Aggregation
Pumped Storage
Demand Response
- PDR
Demand Response - RDRR
Participating Generator
Participating Load
Table 6-3 summarizes some further operational requirements for the market participation models, which are discussed further below.

6-4
Table 6–3 CAISO market participation models – size and aggregation
Minimum size Maximum
size Aggregation Allowed
Locational requirements for Aggregation
NGR 0.5 MW Yes
NGR-REM 0.5 MW Yes
DER Aggregation 0.5 MW 20 MW if located at different PNodes
Yes Located in single Sub-LAP
Pumped Storage N/A
PDR 0.1 MW No Yes Located in single Sub-LAP
RDRR 0.5 MW 50 MW if Yes Located in single Discrete Sub-LAP Real-Time Dispatch Option is selected
Participating Generator
1 MW No Yes
Participating Load
6.1.1 CAISO Market Participation Agreements Market participation agreements specify the obligations of the CAISO and the resource owner or operator when providing energy and ancillary services. Generally, these agreements are not directly relevant to the StorageVET user, but could be reviewed by the user to understand the general requirements of market participation (in addition to the many specific requirements in the CAISO tariff and discussed in this report). There are four current agreements: Participating Load Agreement, Participating Generator Agreement, Demand Response Provider Agreement, and Distributed Energy Resource Provider Agreement. The owner or operator of a stand-alone, transmission-connected storage resource must execute both a Participating Generator Agreement and/or Participating Load Agreement, while those providing demand response or operating as an individual or aggregated distributed resource execute those corresponding agreements. All these agreements are available on the CAISO website.
6.2 Non-Generator Resource The Non-Generator Resource (NGR) model was developed to support resource types with energy limitations and the capability to move instantaneously between charging and discharging,

6-5
including storage and demand response, microgrids and aggregated DERs4. This is the primary model for flexible, short-duration storage technologies which need to charge from the electric power system. An NGR is formally defined in the CAISO tariff as:
Resources that operate as either Generation or Load and that can be dispatched to any operating level within their entire capacity range but are also constrained by a MWh limit to (1) generate Energy, (2) curtail the consumption of Energy in the case of demand response, or (3) consume Energy. ([42]: App. A)
NGRs are, in principle, eligible to provide all CAISO market products as long as they are certified to meet the operating requirements for those products. The NGR model has two categories: resources utilizing Regulation Energy Management (REM) and those not utilizing REM. NGR-REM is an operational method for limited energy storage devices providing Regulation only. The NGR-REM model and requirements are described further in this section.
6.2.1 Non-Generator Resource StorageVET does not have a specific setting for modeling NGR resources, but the user can specify which constraints are to be used. The following are some key operational requirements for NGR resources, which may be relevant to specification in StorageVET.
6.2.1.1 Modeling of Different Modes NGRs are modeled by the CAISO as a generator when discharging and as negative generation when charging.
6.2.1.2 Dispatch Constraints NGRs are currently modeled as if they can dispatch across their entire capacity range without any constraints (including transition times, as discussed next). The CAISO is currently evaluating additional dispatch constraints, including the inter-temporal constraints discussed further below.
6.2.1.3 Energy Limitations NGRs are constrained by an energy (MWh) limit on discharging and charging on a continuous basis.
Minimum continuous energy is defined as energy production as measured from when the resource reaches its awarded energy output.5 The minimum continuous energy required from an NGR depends on the service being provided, and ranges from 15 minutes (for NGR-REM) to 1 hour, depending on the product and the market (see discussion below).
6.2.1.4 State of Charge There are currently two options [43] for how SOC management is conducted in NGR dispatch:
4 The development of the NGR model was initially through the stakeholder process for non-generation resources in the ancillary service markets. See papers and comments for the stakeholder process [40] and draft final proposal [41]. 5 Prior to the development of the NGR model, this measurement began at the end of a 10-minute ramp; for NGRs, this was modified to begin when the resource is at the awarded energy output.

6-6
• The SC can bid a SOC for first interval of the IFM, after which the CAISO will optimize the resource using bids [Tariff, Section 30.5.60].
• The SC can self-manage SOC and energy limits through the bidding strategy.
StorageVET allows the user to specify the starting and ending SOC for each optimization horizon.
6.2.1.5 Inter-Temporal Constraints Currently, NGRs are modeled as if they do not encounter any inter-temporal constraints other than energy limitations. The CAISO is evaluating adding a number of inter-temporal constraints to the NGR model, which could be modeled using StorageVET.
6.2.1.5.1 Transition Time Constraints
NGRs are currently modeled as if they can transition instantaneously from charging to discharging. The CAISO is evaluating allowing transition times for NGRs. StorageVET can be adjusted to reflect either approach.
6.2.1.5.2 Maximum Annual Discharge
CAISO is evaluating allowing NGRs to represent a maximum annual discharge. StorageVET does not currently allow a maximum annual discharge constraint but does allow a limit on number of cycles.
6.2.1.5.3 Maximum or Minimum Numbers of Charge/Discharge Cycles
CAISO is evaluating allowing NGRs to represent minimum and maximum numbers of charge or discharge cycles over the Operating Day.
6.2.1.6 Ramp Rates/Rate of Charge or Discharge Like all resources, NGRs are currently allowed to represent one ramp rate for each service offered. CAISO is evaluating allowing multiple ramp rates as a function of SOC or other factors affecting the performance curve.
Related to ramp rate, the CAISO is also evaluating multiple rates of charging or discharging.
6.2.1.7 Multiple Configuration NGRs An NGR with multiple configurations refers to a single technology or aggregated DER which could have different operating characteristics depending on the mode of operation.
The CAISO is evaluating multiple configurations for an NGR where “each configuration is allowed different operating characteristics and economic bid curves based on physical constraints of the resource.” These configurations “could apply to charge and discharge modes differently.”
6.2.2 Non-Generator Resource – Regulation Energy Management A sub-category of NGR is resources operated under Regulation Energy Management (REM). Under this approach, there are three key differences with conventional NGRs: the resource (1) is required to have only a 15-minute minimum continuous energy capability, (2) is restricted to providing Regulation, and (3) its SOC is managed by the CAISO.
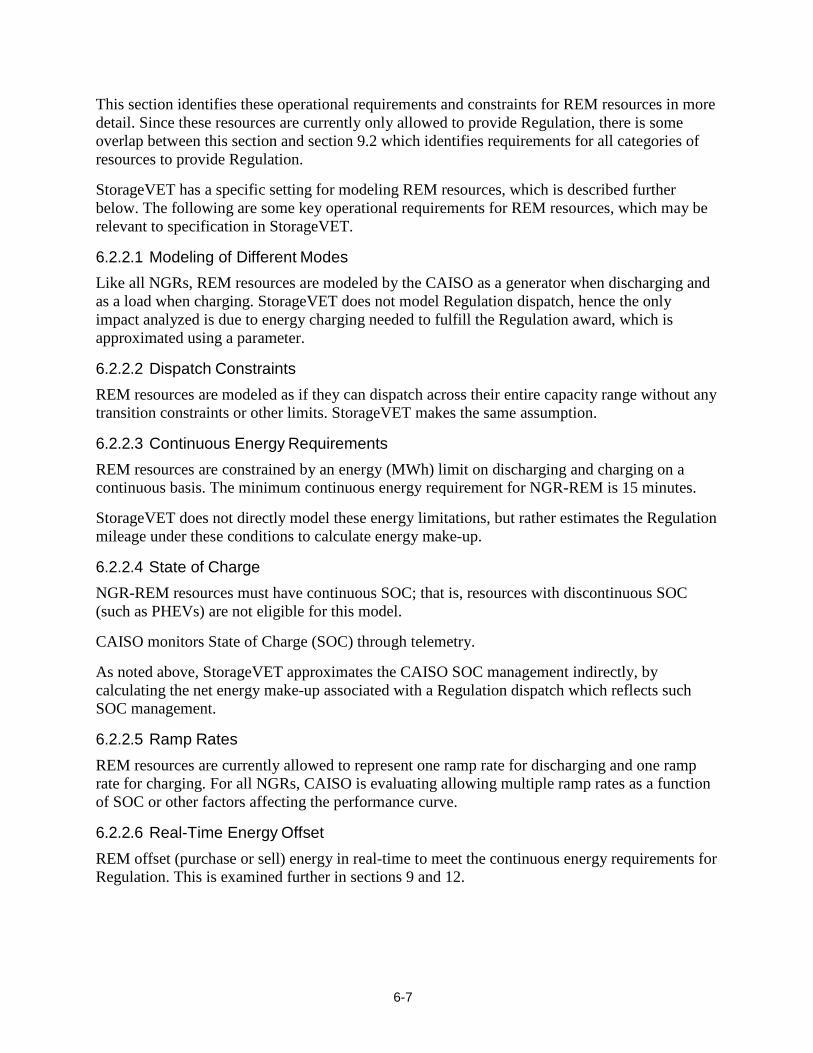
6-7
This section identifies these operational requirements and constraints for REM resources in more detail. Since these resources are currently only allowed to provide Regulation, there is some overlap between this section and section 9.2 which identifies requirements for all categories of resources to provide Regulation.
StorageVET has a specific setting for modeling REM resources, which is described further below. The following are some key operational requirements for REM resources, which may be relevant to specification in StorageVET.
6.2.2.1 Modeling of Different Modes Like all NGRs, REM resources are modeled by the CAISO as a generator when discharging and as a load when charging. StorageVET does not model Regulation dispatch, hence the only impact analyzed is due to energy charging needed to fulfill the Regulation award, which is approximated using a parameter.
6.2.2.2 Dispatch Constraints REM resources are modeled as if they can dispatch across their entire capacity range without any transition constraints or other limits. StorageVET makes the same assumption.
6.2.2.3 Continuous Energy Requirements REM resources are constrained by an energy (MWh) limit on discharging and charging on a continuous basis. The minimum continuous energy requirement for NGR-REM is 15 minutes.
StorageVET does not directly model these energy limitations, but rather estimates the Regulation mileage under these conditions to calculate energy make-up.
6.2.2.4 State of Charge NGR-REM resources must have continuous SOC; that is, resources with discontinuous SOC (such as PHEVs) are not eligible for this model.
CAISO monitors State of Charge (SOC) through telemetry.
As noted above, StorageVET approximates the CAISO SOC management indirectly, by calculating the net energy make-up associated with a Regulation dispatch which reflects such SOC management.
6.2.2.5 Ramp Rates REM resources are currently allowed to represent one ramp rate for discharging and one ramp rate for charging. For all NGRs, CAISO is evaluating allowing multiple ramp rates as a function of SOC or other factors affecting the performance curve.
6.2.2.6 Real-Time Energy Offset REM offset (purchase or sell) energy in real-time to meet the continuous energy requirements for Regulation. This is examined further in sections 9 and 12.

6-8
6.2.2.7 Multiple Use or Configuration REM-NGRs Currently, REM resources are only eligible for Regulation across their full operational range. CAISO is evaluating allowing resources with multiple uses to reserve capacity on the resource for REM dispatch. In other words, a resource could schedule or bid that the CAISO maintain a 70% SOC (e.g., as needed for distribution deferral) and also utilize the remaining capacity with the REM functionality.
StorageVET can evaluate multiple use applications assuming REM for the Regulation component.
6.3 Pumped Storage The CAISO has a specific operating model for Pumped Storage plants. There are three operating modes: generating mode, pumping mode and offline mode. Transitions from pumping to generating and vice-versa must transition through the off-line mode. There is a (single) minimum down-time (minutes) for the offline mode. The generating mode can specify start-up and minimum load costs; in addition, pumping levels, ramp rate, energy limits, hourly pumping costs, and pumping shut-down costs. Pumped Storage must also submit lower and upper charge limits.
StorageVET can represent basic operating functions of a pumped storage plant. Additional details on the CAISO market participation model may be included in this report in response to StorageVET user interest.
6.4 Participating Generator The Participating Generator model is for an individual or aggregated generating resource providing Energy and ancillary services to the CAISO grid. The minimum size of a Participating Generator is 1 MW. The Participating Generator model ([44] p. 23) applies to energy storage resources in two potential ways:
First, storage resources which act as generation are required to register as a Participating Generator.
Second, storage could be integrated with a generator classified as a Participating Generator and under which the operations of the storage component only affects generator operations. For example, this could include: conventional generators with thermal storage used to improve generator efficiency, concentrating solar power with thermal energy storage (CSP-TES), and PV plants with integrated storage which charges completely from the solar field (and is thus eligible as an RPS resource) and share an inverter which provides the operational constraints on how the plant supplies energy to the CAISO system.
StorageVET can represent a behind the meter PV profile utilizing storage to manage excess generation and net load shape. However, it is not currently configured to model these types of storage technologies integrated with generation.
6.5 Participating Load The Participating Load model applies to loads which can participate in the CAISO energy and operating reserve markets by responding to dispatch instructions within time-frames of 5-10

6-9
minutes (depending on the service), which is seen by CAISO system operations as increasing generation.
CAISO identifies three types of Participating Load:
1. Pumping Load that is associated with a Pump-Storage resource; 2. A single Participating Load (i.e. Pumping and non-Pump Load) that is not associated with a
Pump-Storage resource; and 3. Aggregated Participating Load (i.e. aggregated Pumping and non-Pumping Load) that is an
aggregation of individual loads that operationally must be operating in coordination with each other.
Participating Loads can bid Curtailable Demand into the IFM or RTM markets to provide Energy or Non-Spinning Reserve.
Currently, most Participating Loads are Pumping Loads and are operated by the California Department of Water Resources. The CAISO does not release data on the amount of Participating Loads.
6.6 Demand Response This section defines the CAISO Demand Response (DR) products. Demand Response is used to curtail load from CAISO system and market operations during periods of sufficiently high energy market prices and/or periods where reliability may be threatened due to system contingencies or peak loads.
Behind-the-meter storage resources can participate in the wholesale markets through these demand response products. The valuation of this application of storage resources would need to be conducted on a case-by-case basis, given the price for the market services and the expected operation of the DR resource.
There are currently two types of CAISO Demand Response: Proxy Demand Response (PDR) and Reliability Demand Response Resource (RDRR). The key characteristics of these products are summarized in Table 6-2 and explained further below.
Table 6–4 CAISO Demand Response product characteristics
Reliability Demand Response
Resource (RDRR) Proxy Demand Resource (PDR)
Eligible services Energy Energy, non-spin, residual unit commitment (RUC), RA capacity
Minimum load curtailment 0.5 MW 0.5 MW for Non-Spinning Reserve Market; 0.1 MW for Energy
Bid type At 95% of the price ceiling Economic bid above Net Benefits Test price
Use of bid Economic day-ahead, reliability real-time
Economic day-ahead and real-time
Response time Full curtailment within 40 minutes RTM dispatch on 15 minutes or 5

6-10
minutes
Metering Not required for market participation Using AMI
Minimum run time 1 hour 1 hour
Sustained run time Up to 4 hours Up to 4 hours
Dispatch type Discrete (on/off) allowed Dynamic within ramping constraints
Maximum dispatch for discrete loads
50 MW No upper limit
Availability Up to 15 Events and/or 48 hours per term during two 6-month periods: June – Sept. (summer), and Oct. – May (winter).
Up to several times per month or year
6.6.1 Proxy Demand Response A Proxy Demand Resource (PDR) is defined as a load or aggregation of loads (under the same LSE) which can meet the measurement and verification requirements for providing Demand Response. All such resources must sign a Demand Response Provider Agreement. The following are some key operational requirements for PDRs, which may be relevant to specification in StorageVET.
6.6.1.1 Minimum and Maximum Resource Size The minimum resource size for PDR is 100kW or 0.1 MW.
The minimum load curtailment for PDR is 0.1 MW, which can consist of aggregated loads. There is currently no maximum size.
6.6.1.2 Time to Full Response Either 15 minutes or 5 minutes depending on whether it is participating in the FMM or RTED.
6.6.1.3 Minimum Run Time PDR has a minimum run time of 1 hour.
6.6.1.4 Minimum Duration of Response Depends on the market product offered. Capacity resources are provided a Qualifying Capacity rating (MW) measured by the average capacity (MW) available for four consecutive hours, as determined by pre-market testing.
For further discussion of Resource Adequacy requirements and market rules, see section 10.
6.6.1.5 Locational Requirements Aggregated loads comprising a single resource are required to be located in a single sub-Load Aggregation Point (sub-LAP). Sub-LAPs are a set of pricing nodes (Pnodes) defined by the ISO within a default LAP. See discussion in section 11.

6-11
6.6.1.6 Telemetry Telemetry is required for PDR aggregations of ≥ 10 MW as well as resources providing ancillary services.
References: CAISO Tariff 4.13.5
6.6.2 Reliability Demand Response Resource A Reliability Demand Response Resources (RDRR) is a Load or Aggregation of Loads which can meet the measurement and verification requirements for providing Demand Response. RDRR are utilized during specified reliability events, and are not economically dispatched. The CAISO models RDRR as supply resources. CAISO reports that RDRR is submitted into the offer stack at prices between $950/MWh - $1,000/MWh. The following are some key operational requirements for PDRs, which may be relevant to specification in StorageVET (from CAISO Tariff Section 4.13.5).
6.6.2.1 Minimum and Maximum Resource Size The minimum resource size for RDRR is 100kW or 0.1 MW.
The minimum load curtailment for RDRR is 0.5 MW, which can consist of aggregated loads.
6.6.2.2 Time to Full Response RDRR must reach full curtailment within 40 minutes after receiving a dispatch instruction.
6.6.2.3 Minimum Run Time RDRR is not allowed to have a minimum run time of greater than 1 hour.
6.6.2.4 Minimum Duration of Response RDRR must be able to sustain response for at least 4 consecutive hours per Demand Response Event.
6.6.2.5 Term Response Requirements Must be available for up to 15 Events and/or 48 hours per term. A term is a 6 month period (summer and winter): Summer term runs from June through September; winter term runs from October through May.
Economic participation in the day-ahead market will not reduce availability limits.
6.6.2.6 Locational Requirements Loads aggregated into an RDRR are required to be located in a single Sub-LAP.
6.6.2.7 Telemetry RDRR does not require telemetry.
6.6.3 Customer Baseline Methodologies The CAISO has modified the customer baseline methodology used for Demand Response to include the NAESB “metering generator output” method, which includes a second meter or sub-

6-12
meter to measure production of distributed generation or storage which is used to modify the customer net load shape. In addition, the CAISO has adopted the NAESB baseline type II method of statistical sampling.
6.7 Distributed Energy Resource Aggregation The Distributed Energy Resource Aggregation (DERA) [45] is a market participation model implemented in 2016 to facilitate participation in all the CAISO energy and ancillary service markets by aggregations of distributed resources. Prior to executing a participation agreement with the CAISO, it must comply with the tariffs and requirements of the applicable UDC and LRA.
6.7.1 Minimum and Maximum Resource Size The minimum resource size for DERA is 500kW or 0.5 MW. The maximum size of a DERA with resources at different PNodes is 20 MW. Individual DERs within in the DERA must have a rated capacity less than1 MW.
6.7.2 Locational Requirements DERAs are required to be located in a single SLAP.
6.7.3 Dispatch Response A DERA must provide a net response consistent with CAISO dispatch instructions.
6.7.4 Regulatory Limits In addition to the technical requirements, DERA have a number of regulatory limits. Notably, a DER within a DERA cannot participate in NEM metering unless expressly permitted.
6.8 System Resources System Resources are resources (currently primarily generators) located outside the CAISO BAA but which are eligible to participate in the CAISO markets ([44] p. 37).6 Storage resources can be located outside the CAISO BAA, either elsewhere in California or outside California, in which case their valuation will depend on how their services are being delivered to the CAISO. They could also be supporting other external resources (such as variable energy resources), in which case their valuation will be at least partly linked to how those resources are valued to California LSEs.
Dynamic system resources are responsive to the CAISO’s AGC, and can provide Energy and Ancillary Services. They appear to the CAISO operationally as if they are within the CAISO BAA. Static system resources provide non-dispatchable schedules. Both types of resources are also classified as Resource-specific, meaning that there is a single Resource being operated, or Non-Resource specific, meaning that there may be an aggregation of resources or part of a particular resource.
6 Note that this is not the same as a System RA capacity resource, which can be located within the CAISO BAA; see section 9.

6-13
A storage resource located outside the CAISO BAA and designated as a system resource could in principle provide market services when acting as a generator, but would presumably have a separate agreement with non-CAISO entities when charging.


7-1
7 CAISO MARKET AND SCHEDULING PROCEDURES This section reviews the CAISO day-ahead and real-time market procedures, including the different types of participation methods, such as bidding and scheduling. These procedures are relevant because they affect how different storage technologies would be optimized within the markets.
This section helps to clarify the applications and limitations of StorageVET™ when modeling storage operations in these markets. This section is organized as follows:
Section 7.1 – Market participation rules, such as self-scheduling and bidding;
Section 7.2 – Day-Ahead Market processes; and
Section 7.3 – Real-Time Market processes.
The details on how to supply energy and ancillary services are in the following two sections, and other related market procedures, for Resource Adequacy (RA) capacity, are reviewed in section 10.
7.1 CAISO Market Participation Rules 7.1.1 Market Participation Methods This section describes the rules for participating in the CAISO markets. These rules are relevant to how users of StorageVET interpret revenue results. In addition, users of StorageVET can also modify model constraints to mimic types of schedules which could alter market revenues away from an unconstrained optimal market revenue solution.
7.1.1.1 Self-Schedule of Energy A Self-Schedule is a scheduling option by which market participants submit schedules (MW) for injection and withdrawal of Energy at a location on a defined time-frame. In the IFM, Self- Schedules are hourly schedules only; in other words, the scheduling entity cannot provide a subhourly schedule. In the RTM, Self-Schedules can be provided through the Fifteen Minute Market (FMM), allowing for adjustments on a 15 minute basis. However, Self-Schedules are not permitted on a 5-mimute basis.
As discussed further below, self-schedules can also be combined with Bids, which allow the CAISO to adjust the resource’s output in the range outside the self-schedule on an economic basis.
Self-Schedules are given a higher priority in the CAISO market optimization than Bids (through penalties for violating the schedules), but are subject to “uneconomic adjustments” to resolve network constraints, resource operational constraints, or inter-temporal constraints.

7-2
Self-Schedules are financially settled at Locational Marginal Prices for energy. Resources with start-up costs are not eligible to have those costs recovered through Bid Cost Recovery (BCR); see discussion in section 11.
7.1.1.2 Self-Provision of Ancillary Services Eligible resources can be used to “self-provide” ancillary services. This means that the supply of ancillary services from these resources is counted directly against the ancillary service requirements of a specified load-serving entity, reducing its exposure to market-based procurement. For self-provided Regulation, the resource must be a price-taker (i.e., restricted to a $0/MW bid for both capacity and mileage).
7.1.1.3 Bids Resources and loads that submit Offers and Bids (generically called Bids) are selected through the CAISO DAM and RTM processes on the basis of whether those Bids clear the market. Bids are characterized by a $ value for the market service, including start-up ($), energy ($/MWh) and operating reserves ($/MW) as well as for operational parameters. Supply Bids (or offers) that are very low (e.g., $0/MWh or negative) are sometimes called “price-takers.” Demand Bids that are fixed (inelastic) are also effectively price-takers.
Note that Self-Schedules are not eligible to submit $ Bid components for the capacity being scheduled. That is, they must be self-committed and are treated as price-takers in the markets. In other words, if a storage resource submits its full charging and discharging schedule to the CAISO, it cannot also provide bids to adjust that schedule, unless there is some unscheduled capacity on the resource.
A bidding strategy is defined as a set of bids which are intended to increase resource revenues over the short-term or longer-term by increasing (or decreasing) market prices. For example, a storage operator could attempt to increase market prices during discharging intervals by increasing its bids. StorageVET does not support simulation of bidding strategies; its market revenue optimization is structured as a price-taker. However, it can model a reservation price, which would only result in the resource being dispatched if the market price was above the specified level.
Table 7-1 shows all the bid components allowed in the CAISO markets, and indicates to which types of storage technologies these bid components could be relevant.
Table 7–1 CAISO market bid components with relevant storage technologies
Bid components Storage technologies
Start-Up Time and Start-Up Cost CAES, Pumped Storage
Minimum Load Cost CAES
Transition Costs CAES, Pumped Storage
RUC Availability Bid If applicable – longer duration technologies
Regulation Up and Regulation Down Capacity Bids All Regulation certified technologies
Regulation Up and Regulation Down Mileage Bids All Regulation certified technologies
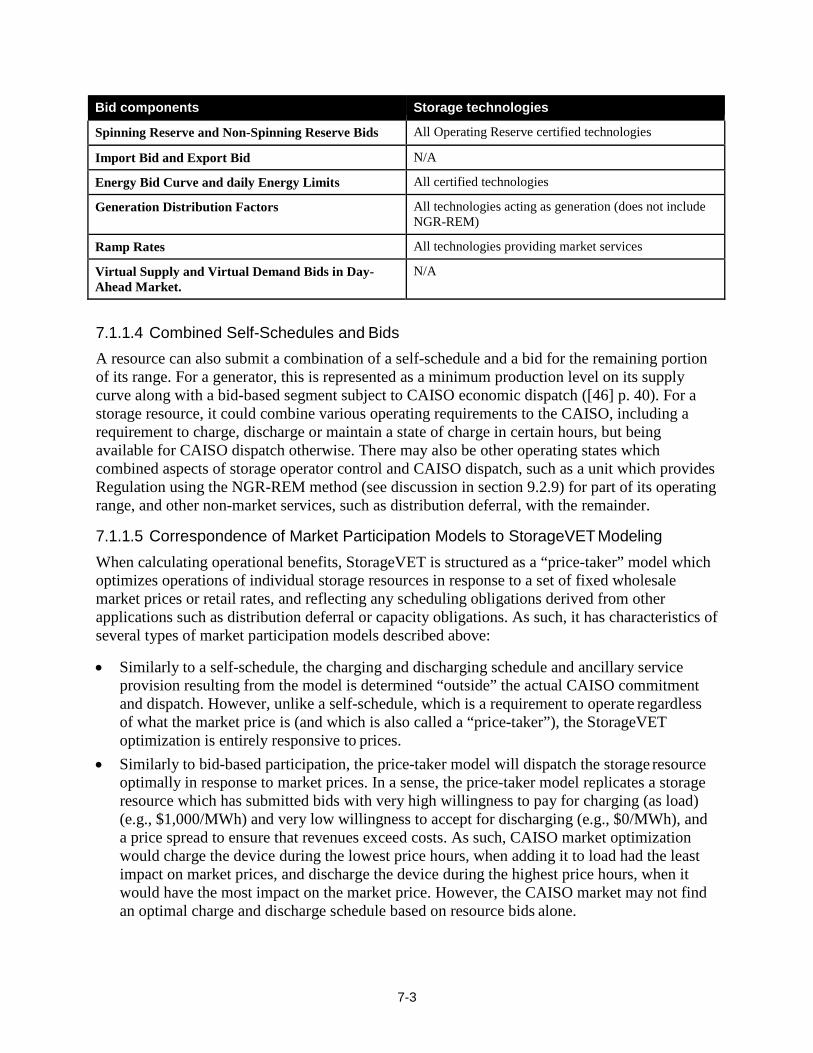
7-3
Bid components Storage technologies
Spinning Reserve and Non-Spinning Reserve Bids All Operating Reserve certified technologies
Import Bid and Export Bid N/A
Energy Bid Curve and daily Energy Limits All certified technologies
Generation Distribution Factors All technologies acting as generation (does not include NGR-REM)
Ramp Rates All technologies providing market services
Virtual Supply and Virtual Demand Bids in Day- Ahead Market.
N/A
7.1.1.4 Combined Self-Schedules and Bids A resource can also submit a combination of a self-schedule and a bid for the remaining portion of its range. For a generator, this is represented as a minimum production level on its supply curve along with a bid-based segment subject to CAISO economic dispatch ([46] p. 40). For a storage resource, it could combine various operating requirements to the CAISO, including a requirement to charge, discharge or maintain a state of charge in certain hours, but being available for CAISO dispatch otherwise. There may also be other operating states which combined aspects of storage operator control and CAISO dispatch, such as a unit which provides Regulation using the NGR-REM method (see discussion in section 9.2.9) for part of its operating range, and other non-market services, such as distribution deferral, with the remainder.
7.1.1.5 Correspondence of Market Participation Models to StorageVET Modeling When calculating operational benefits, StorageVET is structured as a “price-taker” model which optimizes operations of individual storage resources in response to a set of fixed wholesale market prices or retail rates, and reflecting any scheduling obligations derived from other applications such as distribution deferral or capacity obligations. As such, it has characteristics of several types of market participation models described above:
• Similarly to a self-schedule, the charging and discharging schedule and ancillary service provision resulting from the model is determined “outside” the actual CAISO commitment and dispatch. However, unlike a self-schedule, which is a requirement to operate regardless of what the market price is (and which is also called a “price-taker”), the StorageVET optimization is entirely responsive to prices.
• Similarly to bid-based participation, the price-taker model will dispatch the storage resource optimally in response to market prices. In a sense, the price-taker model replicates a storage resource which has submitted bids with very high willingness to pay for charging (as load) (e.g., $1,000/MWh) and very low willingness to accept for discharging (e.g., $0/MWh), and a price spread to ensure that revenues exceed costs. As such, CAISO market optimization would charge the device during the lowest price hours, when adding it to load had the least impact on market prices, and discharge the device during the highest price hours, when it would have the most impact on the market price. However, the CAISO market may not find an optimal charge and discharge schedule based on resource bids alone.
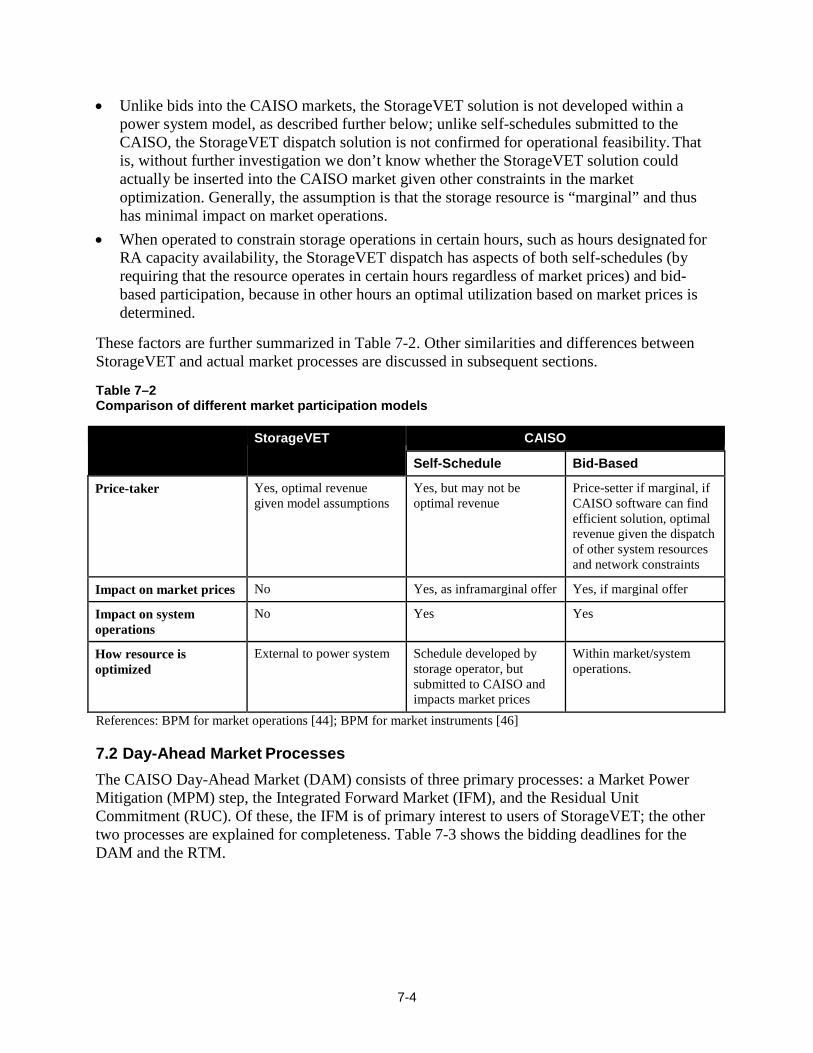
7-4
• Unlike bids into the CAISO markets, the StorageVET solution is not developed within a power system model, as described further below; unlike self-schedules submitted to the CAISO, the StorageVET dispatch solution is not confirmed for operational feasibility. That is, without further investigation we don’t know whether the StorageVET solution could actually be inserted into the CAISO market given other constraints in the market optimization. Generally, the assumption is that the storage resource is “marginal” and thus has minimal impact on market operations.
• When operated to constrain storage operations in certain hours, such as hours designated for RA capacity availability, the StorageVET dispatch has aspects of both self-schedules (by requiring that the resource operates in certain hours regardless of market prices) and bid- based participation, because in other hours an optimal utilization based on market prices is determined.
These factors are further summarized in Table 7-2. Other similarities and differences between StorageVET and actual market processes are discussed in subsequent sections.
Table 7–2 Comparison of different market participation models
StorageVET CAISO
Self-Schedule Bid-Based
Price-taker Yes, optimal revenue given model assumptions
Yes, but may not be optimal revenue
Price-setter if marginal, if CAISO software can find efficient solution, optimal revenue given the dispatch of other system resources and network constraints
Impact on market prices No Yes, as inframarginal offer Yes, if marginal offer
Impact on system operations
No Yes Yes
How resource is optimized
External to power system Schedule developed by storage operator, but submitted to CAISO and impacts market prices
Within market/system operations.
References: BPM for market operations [44]; BPM for market instruments [46]
7.2 Day-Ahead Market Processes The CAISO Day-Ahead Market (DAM) consists of three primary processes: a Market Power Mitigation (MPM) step, the Integrated Forward Market (IFM), and the Residual Unit Commitment (RUC). Of these, the IFM is of primary interest to users of StorageVET; the other two processes are explained for completeness. Table 7-3 shows the bidding deadlines for the DAM and the RTM.
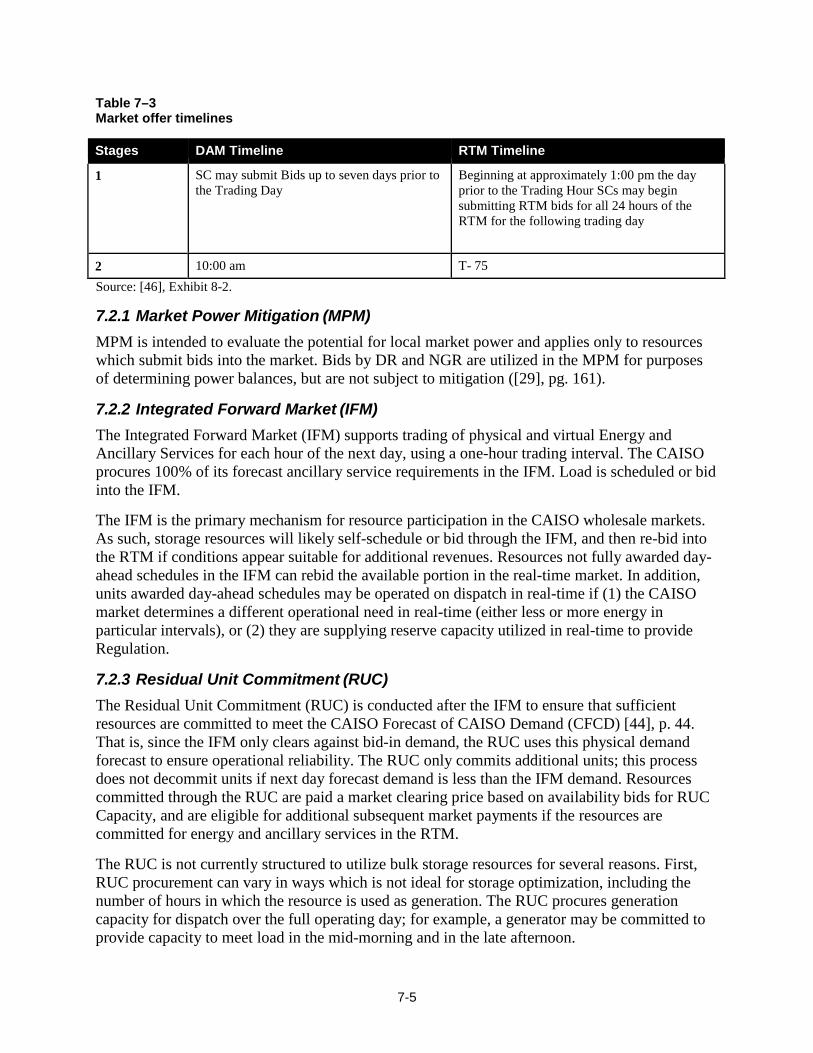
7-5
Table 7–3 Market offer timelines
Stages DAM Timeline RTM Timeline
1 SC may submit Bids up to seven days prior to the Trading Day
Beginning at approximately 1:00 pm the day prior to the Trading Hour SCs may begin submitting RTM bids for all 24 hours of the RTM for the following trading day
2 10:00 am T- 75 Source: [46], Exhibit 8-2.
7.2.1 Market Power Mitigation (MPM) MPM is intended to evaluate the potential for local market power and applies only to resources which submit bids into the market. Bids by DR and NGR are utilized in the MPM for purposes of determining power balances, but are not subject to mitigation ([29], pg. 161).
7.2.2 Integrated Forward Market (IFM) The Integrated Forward Market (IFM) supports trading of physical and virtual Energy and Ancillary Services for each hour of the next day, using a one-hour trading interval. The CAISO procures 100% of its forecast ancillary service requirements in the IFM. Load is scheduled or bid into the IFM.
The IFM is the primary mechanism for resource participation in the CAISO wholesale markets. As such, storage resources will likely self-schedule or bid through the IFM, and then re-bid into the RTM if conditions appear suitable for additional revenues. Resources not fully awarded day- ahead schedules in the IFM can rebid the available portion in the real-time market. In addition, units awarded day-ahead schedules may be operated on dispatch in real-time if (1) the CAISO market determines a different operational need in real-time (either less or more energy in particular intervals), or (2) they are supplying reserve capacity utilized in real-time to provide Regulation.
7.2.3 Residual Unit Commitment (RUC) The Residual Unit Commitment (RUC) is conducted after the IFM to ensure that sufficient resources are committed to meet the CAISO Forecast of CAISO Demand (CFCD) [44], p. 44. That is, since the IFM only clears against bid-in demand, the RUC uses this physical demand forecast to ensure operational reliability. The RUC only commits additional units; this process does not decommit units if next day forecast demand is less than the IFM demand. Resources committed through the RUC are paid a market clearing price based on availability bids for RUC Capacity, and are eligible for additional subsequent market payments if the resources are committed for energy and ancillary services in the RTM.
The RUC is not currently structured to utilize bulk storage resources for several reasons. First, RUC procurement can vary in ways which is not ideal for storage optimization, including the number of hours in which the resource is used as generation. The RUC procures generation capacity for dispatch over the full operating day; for example, a generator may be committed to provide capacity to meet load in the mid-morning and in the late afternoon.

7-6
Second, the RUC can only utilize resources that are not already committed in the IFM. As currently structured, the RUC objective function minimizes the costs of generator start-up and minimum load costs and availability bids. There is no mechanism for a bulk storage resource to charge through this optimization process.
For these reasons, StorageVET does not evaluate opportunities for RUC availability payments. 7.3 Real-Time Market (RTM) Processes – CAISO The Real-Time Market updates schedules and conducts short-term unit commitment and dispatch of market resources to address changes from day-ahead market conditions. Even though the real- time market has significantly less market volume compared to the day-ahead market, it is important as it reflects the true marginal costs associated with subhourly system conditions and influences day-ahead prices through the impact of virtual bidding. In addition, the RTM is used for procurement of the Flexible Ramping Product.
The CAISO RTM processes include five major processes described in more detail below:
• Market Power Mitigation (MPM) • Hour-Ahead Scheduling Process (HASP) • Real-Time Unit Commitment (RTUC)/Fifteen Minute Market (FMM) • Short-Term Commitment • Real-time Economic Dispatch (RTED)
These processes were developed for internal CAISO commitment and dispatch; since 2014, the CAISO has also operated an Energy Imbalance Market (EIM) which operates in real-time.
7.3.1 Market Power Mitigation (MPM) Similarly to the DAM MPM, bids submitted by dispatchable pumps, NGRs, and the different types of bid-in demand are used for evaluation of power flows but not subject to mitigation.
7.3.2 Hour-Ahead Scheduling Process (HASP) The Hour-Ahead Scheduling Process (HASP) is performed immediately after the Real-Time MPM. HASP produces HASP Advisory Schedules and advisory real-time ancillary service awards for most resources except for resources with accepted Self-Schedule Hourly Blocks and awarded Economic Hourly Block Bids (but excluding an Economic Hourly Block Bid with Intra- Hour option), for which HASP Block Intertie Schedules are produced. All HASP Schedules for the Trading Hour are published approximately 45 minutes before the start of each Trading Hour.
7.3.3 Real-Time Unit Commitment (RTUC) The Real-Time Unit Commitment (RTUC) commits fast-start and short-start resources, and is also used to award additional ancillary services needed in real-time to eligible resources. The RTUC process runs every 15 minutes and looks ahead for the remainder of the Trading Hour and the next Trading Hour.
7-7
7.3.4 Fifteen Minute Market (FMM) The Fifteen Minute Market (FMM) is the second interval of the RTUC and results in binding FMM prices for real-time energy, ancillary services and flexible ramping product. This is also called the RTUC pricing run. In addition, advisory prices for the remaining intervals of the FMM are published.
StorageVET models 15 minute LMPs and storage dispatch over defined set of 15 minute intervals, both with and without including the Flexible Ramping Product (FRP). FMM LMPs are also used to settle real-time energy charging by storage awarded Regulation in the IFM.
7.3.5 Short-Term Unit Commitment (STUC) The Short-Term Unit Commitment (STUC) is performed hourly to commit short- and medium start units using a three hour look-ahead in 15 minute intervals. The STUC is not currently used to adjust storage operations.
7.3.6 Real-Time Economic Dispatch (RTED) The Real-Time Economic Dispatch (RTED) is a market process that dispatches Energy and Energy from ancillary services. RTED sends an automated dispatch instruction for energy every 5 minutes, approximately 7.5 minutes prior the start of the next dispatch interval. The resource is expected to reach its operating point by 2.5 minutes into the 5 minute interval. RTED also sends advisory dispatch instructions for up to 12 dispatch intervals over the remainder of the RTD optimization time-horizon. The RTED results in 5-minute LMPs and shadow prices for FRP.
In its initial version, StorageVET will not include any functionality related to RTED dispatch and 5-minute LMPs.
7.3.7 Other Real-Time Dispatch Procedures The CAISO also has operator executed real-time dispatch functions which are used more rarely to adjust unit output. The Real-Time Contingency Dispatch (RTCD) function is used by operators for a 10-minute interval following contingencies, and can draw on all Operating Reserves and Real-Time Energy Bids. The Real-Time Manual Dispatch (RTMD) function is generally used when real-time commitment and dispatch procedures fail to result in a feasible solution. This function is executed every five minutes for the following 5-minute interval.
These types of operator dispatches would not be considered when modeling storage in real-time operations. For operators of storage resources (or other types of resources), they could be financially significant if units are persistently operated in this fashion.
StorageVET does not include any functionality related to these dispatch procedures.
7.3.8 Real-Time Intertie Scheduling Options For storage resources located outside the CAISO BAA but seeking to provide services into the CAISO real-time markets, there are several options for scheduling inter-tie transactions. These include: dynamic schedules operated on a 5-minute basis; FMM economic bids; fixed hourly bids, which are settled at the FMM price, and which can include one intra-hour schedule change; and fixed hourly self-schedules, which are settled at the average FMM price over the hour.

7-8
StorageVET’s representation of the FMM most closely corresponds to the option to model FMM economic bids. Other options which clear against FMM or Hourly average FMM prices could be manually evaluated by the user if they appear useful given constraints on storage operations or the capability to schedule.
7.4 Real-Time Market (RTM) Processes – Energy Imbalance Market The EIM runs a RTM for Energy (but not ancillary services) including an FMM and RTED using procedures similar to those described above for the internal CAISO market. EIM prices are available on the CAISO OASIS website and can be evaluated for basic insight into storage energy operations in the relevant utility regions.
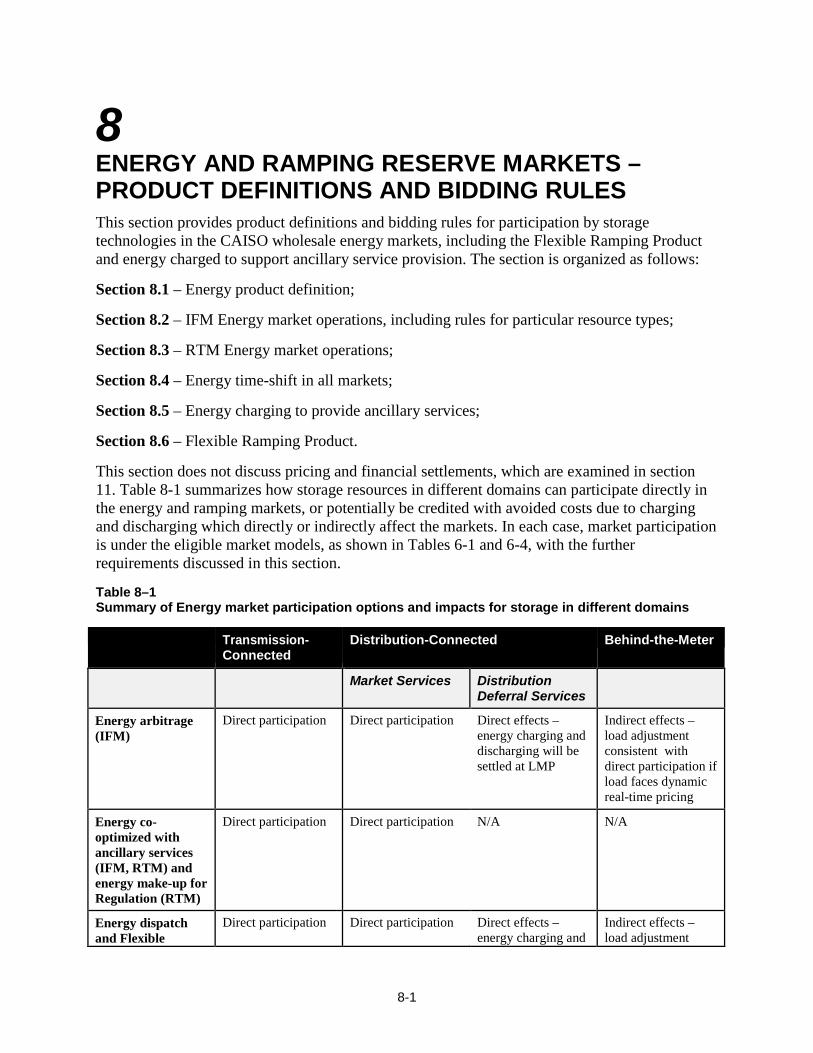
8-1
8 ENERGY AND RAMPING RESERVE MARKETS – PRODUCT DEFINITIONS AND BIDDING RULES This section provides product definitions and bidding rules for participation by storage technologies in the CAISO wholesale energy markets, including the Flexible Ramping Product and energy charged to support ancillary service provision. The section is organized as follows:
Section 8.1 – Energy product definition;
Section 8.2 – IFM Energy market operations, including rules for particular resource types;
Section 8.3 – RTM Energy market operations;
Section 8.4 – Energy time-shift in all markets;
Section 8.5 – Energy charging to provide ancillary services;
Section 8.6 – Flexible Ramping Product.
This section does not discuss pricing and financial settlements, which are examined in section 11. Table 8-1 summarizes how storage resources in different domains can participate directly in the energy and ramping markets, or potentially be credited with avoided costs due to charging and discharging which directly or indirectly affect the markets. In each case, market participation is under the eligible market models, as shown in Tables 6-1 and 6-4, with the further requirements discussed in this section.
Table 8–1 Summary of Energy market participation options and impacts for storage in different domains
Transmission-
Connected Distribution-Connected Behind-the-Meter
Market Services Distribution Deferral Services
Energy arbitrage (IFM)
Direct participation Direct participation Direct effects – energy charging and discharging will be settled at LMP
Indirect effects – load adjustment consistent with direct participation if load faces dynamic real-time pricing
Energy co- optimized with ancillary services (IFM, RTM) and energy make-up for Regulation (RTM)
Direct participation Direct participation N/A N/A
Energy dispatch and Flexible
Direct participation Direct participation Direct effects – energy charging and
Indirect effects – load adjustment

8-2
Ramping Product (RTM)
discharging will be settled at LMP
consistent with direct participation if load faces dynamic real-time pricing
8.1 Energy Product Definition Energy is defined as injections and withdrawals of real power (MWh) at specified locations and in defined time intervals on the CAISO power system. These locations can be particular busses for injections or, for withdrawals, particular busses (for storage) or aggregations of busses (for retail load).
The Energy product is generally utilized by storage technologies either by participating in the Energy markets only, to provide energy time-shifting or arbitrage; or by jointly providing Energy with other market services or for distribution deferral. Energy time-shift value is typically understood as the minimum market value for a storage resource, with all other services implying additional value by jointly providing other services.
8.2 IFM Energy Market As described in section 7.2, the IFM operates an auction for Energy on an hourly time-step over the 24 hours of the next Trading Day. SCs can participate in the IFM Energy market using self- schedules or bids.
8.2.1 Eligibility Requirements To participate in the IFM Energy market, a resource must have a minimum capacity of 1 MW, but which can consist of aggregated resources under specific rules described further below. In addition, there are minimum bid size requirements and other bidding rules described below.
8.2.2 Self-Schedules An Energy Self-Schedule consists of a requirement that the CAISO utilize a resource according to a fixed schedule. For a storage resource, this would entail an hourly schedule for Energy charging (MW) and discharging (MW).
If a resource submits an Energy Self-Schedule, it is not eligible for CAISO Bid Cost Recovery (BCR) payments.
8.2.3 Bidding Rules This section identifies the components of the Energy offers by eligible resources. In addition, the CAISO calculates certain parameters which are used when evaluating offers.
8.2.3.1 Minimum Size The minimum size of a resource offering Energy into the IFM is 1 MW.
8.2.3.2 Upper and Lower Operating Limit (MW) Highest and lowest operating limit allowed on the resource.

8-3
8.2.3.3 Upper and Lower Charge Limits (MWh) Highest and lowest stored energy allowed on the resource.
8.2.3.4 Energy Bid The Energy offer is a 10 segment curve, defined by 11 pairs of operating points (MW) and a corresponding $/MWh offer for each segment. The curve is piece-wise linear. Currently, the maximum offer price is $1,000/MWh, and the minimum offer price is -$150/MWh.
Bids can vary by each Trading Hour of the IFM.
8.2.3.5 State of Charge The starting SOC for the resource in the IFM can be bid into the market. Otherwise, the CAISO may use the prior day-ahead schedules or 50% of the maximum defined energy limit if there are no previous day-ahead schedules for resource optimization.
8.2.3.6 Operational Ramp Rate The Operational Ramp Rate (MW/min) is the resource’s ramp rate when providing Energy (CAISO Tariff, App. A). For conventional resources, it can have up to 4 segments.
The CAISO is currently examining allowing multiple ramp rates for NGRs as a function of SOC and other performance factors.
8.2.3.7 Minimum Continuous Energy Minimum continuous energy is an energy requirement in minutes, as a function of the market in which the Energy (or ancillary service) award is calculated and the market participation model.
Minimum continuous energy is measured from the point at which the resource reaches its awarded production level. That is, if the resource achieves its awarded production level in 1 minute, then the minimum continuous energy requirement is measured for the subsequent minutes.
The minimum continuous energy for an Energy offer in the IFM is 60 minutes.
8.2.4 State of Charge Management There are three options for SOC management when providing Energy: Storage operator self- managed; Bid-based; and CAISO managed. Currently, there is only one product in which the CAISO explicitly manages SOC to a known specification, which is the NGR-REM model providing Regulation (but not Energy). Otherwise, SOC is managed through market bids.
Table 8-2 summarizes the specifications for the Energy markets as supplied by NGR resources. These are compared to the StorageVET parameters.
Table 8–2 CAISO energy market participation model parameters compared to StorageVET
Unit Characteristics CAISO NGR StorageVET Approach
Minimum size 1 MW (can be aggregated) User specified

8-4
Ramp rate Required - specified in MW/min Typically ramp rate unconstrained, but can be specified
Roundtrip efficiency Day-ahead market: Not required Real-time market: Required
User specified
Maximum energy operating level Required - resource specific User specified
Minimum energy operating level Required - resource specific User specified
Minimum continuous energy Day-ahead market: 60 minutes Real-time market: 30 minutes
User can calculate available Energy range based on technology specifications
Eligible capacity Required – resource specific User specified
SOC Day-ahead market: Bid based for first interval; otherwise based on prior day-ahead schedules or 50% of the maximum defined energy limit if there are no previous day ahead schedules; Real-time market: based on telemetry
User specified at start and end of optimization interval
8.3 RTM Energy Market Operations In the RTM, generation and non-generation resources respond to unit commitment (start-up and shut-down) instructions on time-frames from 15 minutes with a look-ahead of 4-7 15 minute intervals, while units respond to 15-minute and 5-minute dispatch instructions. For storage resources, this would require the capability to charge and discharge in these time-frames. StorageVET will only model the FMM initially.
There is as yet no experience of an advanced energy storage device operating in the CAISO real- time market. The PG&E battery demonstration project was able to jointly operate in the real-time Regulation market and energy market, but with mixed results [7]. As such, StorageVET modeling of the FMM will likely be further adjusted.
8.3.1 Eligibility Requirements The eligibility requirements are the same as those for the IFM.
8.3.2 Bidding Rules Resources can submit Energy bids into the FMM and RTED.
8.3.3 State of Charge Management In the RTM, the CAISO monitors SOC through telemetry.
8.4 Energy Time-Shift in All Markets Energy time-shift or arbitrage is not a market product, but is rather a primary application of storage technologies within the energy markets. Energy arbitrage is defined as charging the storage resource during intervals with low (or negative) energy prices and discharging the storage resource during intervals with high energy prices. Energy arbitrage is conducted when
8-5
there are positive net energy market revenues due to charging and discharging net of roundtrip efficiency losses.
Energy time-shift can be co-optimized with ancillary services in StorageVET by allowing a limited range for the capacity assigned to each service.
8.4.1 Day-Ahead Energy Arbitrage Day-ahead energy arbitrage in the IFM could be conducted either by self-scheduling or by bidding into the market. The IFM optimizes bids and schedules over 24 hours to meet bid-in CAISO demand for energy (and reserves). The CAISO allows the storage resource to bid in a SOC for the first hour of the IFM.
StorageVET optimizes day-ahead energy arbitrage using a 48 hour rolling optimization, in which the first 24 hour period is used for financial settlement and the second 24 hour period is used to determine the optimal SOC at the end of the first day. This procedure may change with additional user experience.
8.4.2 Real-Time Energy Operations Energy arbitrage or time-shift in the RTM is substantially different from the IFM, because (as described in section 7.3) the RTM does not conduct multi-hour or intra-hour simultaneous, dynamic optimization with financial settlements across all intervals, but is rather a market that uses load and renewable production forecasts before the operating hour to conduct look-ahead advisory unit commitments, and then rolls forward interval by interval over the Operating Day. Financial settlements are calculated in each pricing interval (15 minute and 5 minute). The prices set in these intervals are derived from the supply curves of already committed resources.
Because energy storage could be capable of responding to both 15-minute and 5-minute dispatch instructions in the upward and downward directions, it could provide the capability to respond to these prices and benefit from price volatility. However, the valuation of such capabilities requires assumptions on how the storage SOC is maintained in anticipation of uncertain future prices over the hour. This will remain a modeling issue for further development.
As of this writing, StorageVET will estimate “perfect foresight” real-time energy arbitrage using a 2 hour rolling optimization, in which the first 2 hour period is used for financial settlement and the second 2 hour period is used to determine the optimal SOC at the end of the first 2 hours.
8.5 Energy Charging to Provide Other Services Storage resources may be utilized for multiple uses, which can include ancillary services and distribution deferral. In each of these cases, energy charging and discharging may be required, but possibly only for support of these other services.
The methods for estimating energy charged to provide ancillary services are discussed further in section 9.
8.6 Flexible Ramping Product Generally, ramping reserves can be defined as the upward and downward ramping range of the power system in real-time intervals, ranging from the next 5 minutes to multiple intervals ahead

8-6
(see section 7). The ramping reserve requirement is based on the forecast net load ramp in a series of real-time intervals. The ramping reserve capability is developed using as inputs the dispatch points of each resource in each interval, the ramp rate of each resource, and the maximum and minimum operating points on each resource (potentially also reflecting any ancillary service capacity reserved on the resource).
CAISO implemented a flexible ramping constraint in 2011. This is an additional constraint implemented in the RTM to allow for additional unit commitment and pre-dispatch to reflect forecast ramping requirements in the real-time dispatch. The Flexible Ramping Product (FRP) was deployed in 2016, and will pay for ramping reserves made available through an updated version of the flexible ramp constraint. The remainder of this section describes the FRP, while details on FRP prices and financial settlements are in section 11.
8.6.1 Product Definition The Flexible Ramping Product is additional reserve capacity (MW) for real-time energy dispatch procured in the FMM and RTED. This section describes how the FRP is defined, and procured. section 12.3 discusses FRP prices and financial settlements.
8.6.2 FRP Regions The FRP will be procured on a BAA basis, for both the CAISO and the EIM balancing authorities, and for the EIM as a whole. As such, there are separate prices for FRP Up and FRP Down each of these areas.
StorageVET users can utilize the CAISO and EIM FRP prices associated with the location of the storage resource.
8.6.3 FRP Total Requirement The hourly FRP requirement (MW) is calculated as the sum of the net demand forecast change across intervals and an additional amount for uncertainty with a 95% confidence interval. The minimum FRP requirement is the forecasted upward or downward ramping need between intervals. The maximum FRP requirement is procured using a demand curve, which uses the calculated supply price of the reserves, based on existing bids in the market, to determine whether additional reserves are cost-effective.
Figure 8-1 shows the CAISO procurement of FRP Up and FRP Down by fifteen minute interval on November 15, 2016. The figure shows FRP Down as a negative value, to show how it covers downward ramping (OASIS data shows it as a positive value). We note here that market clearing prices were zero in each interval of this day, hence the flexible ramping constraint did not cause the redispatch of any resources.
As with other market products, StorageVET does not utilize the FRP requirement as a component of the benefit calculation.

8-7
Figure 8–1 CAISO Flexible Ramping Product procurement (MW) in the FMM, November 15, 2016
8.6.4 Resource Forecasted Movement The first component of the FRP award is called “Forecasted Movement” and reflects the dispatch for the resource determined by the FMM energy dispatch. In other words, this is the change in MW between intervals in the FMM, which would be zero if the resource is not forecast to move, positive MW if the resource is ramping up, and negative MW if the resource is ramping down. For the system, Forecasted Movement is counted towards the ramping requirement; for each resource, Forecasted Movement establishes how much additional ramping range the resource has to meet uncertain ramping needs.
8.6.5 Resource Uncertainty Awards The second component of the FRP award is called “Uncertainty Awards.” This corresponds to ramping capacity available in addition to the Forecasted Movement.
8.6.6 Co-Optimization of Products The FRP procurement is co-optimized with energy and ancillary services. StorageVET will have the capability to conduct such co-optimization.
8.6.7 Eligibility Requirements Resources are not required to be certified for FRP. To be eligible for FRP Uncertainty Awards, resources must have energy bids in the RTM, and be capable of following 5-minute dispatch. The unit’s FRP Up and FRP Down awards together with its regulation, spinning and non- spinning awards must obey its ramp capability constraints.
1500
1000
500
0
-500 Fifteen Minute Market intervals
-1000
-1500
FRP Up MW FRP Down MW
MW
0:15
1:
00
1:45
2:
30
3:15
4:
00
4:45
5:
30
6:15
7:
00
7:45
8:
30
9:15
10
:00
10:4
5 11
:30
12:1
5 13
:00
13:4
5 14
:30
15:1
5 16
:00
16:4
5 17
:30
18:1
5 19
:00
19:4
5 20
:30
21:1
5 22
:00
22:4
5 23
30

8-8
8.6.8 Bidding Rules FRP awards are on the basis of submitted energy bids into the RTM; no separate bids are allowed for the product itself.
8.6.9 State of Charge Management As of this writing, we are not certain about SOC management when providing FRP. StorageVET will jointly optimize Energy and FRP, first by conducting “perfect foresight” real-time energy arbitrage along with FRP capacity reserved in the uncertainty award using the 2 hour rolling optimization described above, followed by ex post settlement of the FRP payment for forecasted movement based on the energy dispatch. This methodology will be reviewed as experience increases.
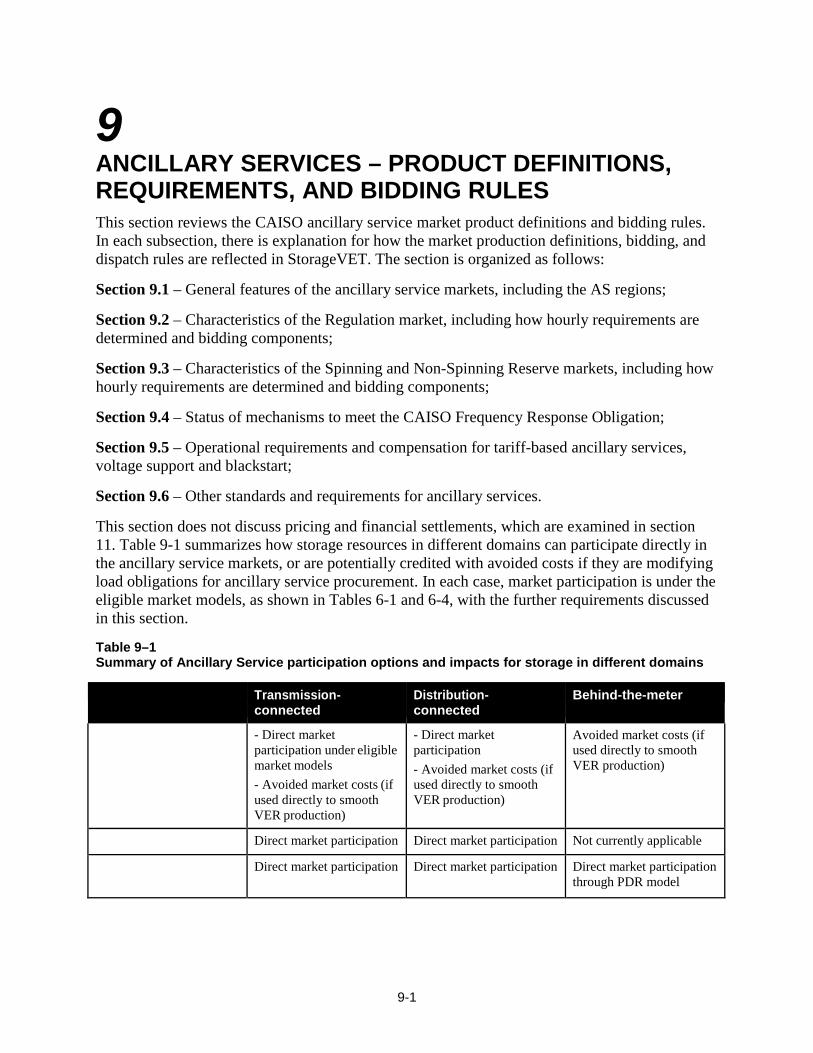
9-1
9 ANCILLARY SERVICES – PRODUCT DEFINITIONS, REQUIREMENTS, AND BIDDING RULES This section reviews the CAISO ancillary service market product definitions and bidding rules. In each subsection, there is explanation for how the market production definitions, bidding, and dispatch rules are reflected in StorageVET. The section is organized as follows:
Section 9.1 – General features of the ancillary service markets, including the AS regions;
Section 9.2 – Characteristics of the Regulation market, including how hourly requirements are determined and bidding components;
Section 9.3 – Characteristics of the Spinning and Non-Spinning Reserve markets, including how hourly requirements are determined and bidding components;
Section 9.4 – Status of mechanisms to meet the CAISO Frequency Response Obligation;
Section 9.5 – Operational requirements and compensation for tariff-based ancillary services, voltage support and blackstart;
Section 9.6 – Other standards and requirements for ancillary services.
This section does not discuss pricing and financial settlements, which are examined in section 11. Table 9-1 summarizes how storage resources in different domains can participate directly in the ancillary service markets, or are potentially credited with avoided costs if they are modifying load obligations for ancillary service procurement. In each case, market participation is under the eligible market models, as shown in Tables 6-1 and 6-4, with the further requirements discussed in this section.
Table 9–1 Summary of Ancillary Service participation options and impacts for storage in different domains
Transmission-
connected Distribution- connected
Behind-the-meter
- Direct market participation under eligible market models - Avoided market costs (if used directly to smooth VER production)
- Direct market participation - Avoided market costs (if used directly to smooth VER production)
Avoided market costs (if used directly to smooth VER production)
Direct market participation Direct market participation Not currently applicable
Direct market participation Direct market participation Direct market participation through PDR model
9-2
9.1 General Features of Ancillary Service Markets This section describes the general features of the CAISO ancillary service markets, including day-ahead and real-time procurement, the definition of the AS regions, and rules for self- provision and bidding.
9.1.1 Ancillary Service Procurement Requirements and Processes For each ancillary service, there is a specific method to calculate the capacity requirements for the Operating Day. These are specified in MW of each service for each Trading Hour, and are described in more detail below. CAISO also imposes a maximum requirement for all upward AS collectively.
9.1.1.1 Day-Ahead Procurement CAISO procures 100% of next day forecast ancillary service needs in the IFM. Methods for calculating the quantity of each ancillary service procured are discussed further below in this section. As such, day-ahead ancillary service prices are the best indicators of ancillary service value for storage.
9.1.1.2 Real-Time Procurement The CAISO may need to replenish ancillary services in the real-time market due to calls on reserves or changes on the status of resources which were selected to provide reserves in the IFM. Requirements are determined in the RTUC process and procured from internal and dynamic system resources through the FMM. Real-time procurement is a very limited market with less impact on storage valuation.
StorageVET™ is not configured to model real-time ancillary service provision; however, the model can schedule fixed “day-ahead” ancillary service awards and conduct real-time energy dispatch with any remaining energy capability.
9.1.2 Ancillary Service Regions The CAISO procures ancillary services in eight sub-regions that make up the full CAISO system, including internal and external resources. Each region has a minimum and maximum procurement level, although these requirements may not be active. These regions were developed primarily to account for forecast congestion on Path 15 and Path 26 which could affect the transfer of ancillary service capability. Table 9-2 summarizes the geographic area in each region. Specific AS prices are determined for each region with a binding constraint. The method for AS pricing is discussed in section 5.3.
Users of StorageVET should note the location for projects being considered and determine the appropriate historical AS prices for that location.

9-3
Table 9–2 Summary of initial as regions
AS Region Name
Description of AS Region (set of resources included in AS Region)
AS Region Status
Internal CAISO Balancing Authority Area
Intertie Resources (current Scheduling Points)
1 Expanded System All internal Generators All Active
2 System All internal Generators None Active
3 South of Path 15 All Generators residing South of Path 15
None Active
4 Expanded South of Path 15
All Generators residing South of Path 15
NW3, SR3, NV3, NV4, AZ2, AZ3, AZ5, LC1, LC2, LC3, MX, LA1, LA2, LA3, LA4, LA7
Active
5 South of Path 26 All Generators residing South of Path 26
None Active
6 Expanded South of Path 26
All Generators residing South of Path 26
NW3, SR3, NV3, NV4, AZ2, AZ3, AZ5, LC1, LC2, LC3, MX, LA1, LA2, LA3, LA4, LA7
Active
7 North of Path 15 All Generators residing North of Path 15
None Active
8 Expanded North of Path 15
All Generators residing North of Path 15
NW1, NW2, SR5, SR2, SMUD, TID, Sutter
Active
9 North of Path 26 All Generators residing North of Path 26
None Active
10 Expanded North of Path 26
All Generators residing North of Path 26
NW1, NW2, SR5, SR2, SMUD, TID, Sutter
Active
Source: Exhibit 4-1 in [44], Section 4.1.1
9.1.3 Ancillary Service Imports Unlike internal resources, external resources providing ancillary services have additional constraints on the eligibility of their bids. These include the minimum requirements for procurement within the ISO system. In addition, ancillary services must compete with energy schedules and bids for transmission capacity on the interties, and are required to pay congestion charges.
9.1.4 Ancillary Service Supply Options 9.1.4.1 Ancillary Self-Provision For AS self-provision, all operational parameters are required to be the same as for AS market bid resources. Generally, resources used for self-provision are required to submit $0/MW bids

9-4
into the markets. That is, they are price-takers. In that sense, StorageVET optimization of ancillary services is similar to ancillary service self-provision.
9.1.4.2 Ancillary Service Offers This section defines bid components that are general to all the ancillary services, with additional components unique to particular services defined in the subsequent sections.
9.1.4.2.1 Start-Up Costs
Start-up Costs ($) refer to the cost of starting a resource and bringing it to a required minimum load prior to supplying energy and ancillary services. These costs are generally only relevant to storage resources when there is a separate fuel component for resource start-up.
StorageVET will not directly model start-up costs; the user will be required to calculate those costs separately based on the resulting energy and ancillary services dispatch. In the CAISO markets, if a resource is selected for energy and/or ancillary services, any bid costs not covered through market revenues will be compensated under Bid Cost Recovery (see section 11).
9.1.4.2.2 Minimum Load Costs
Minimum Load Costs ($) refer to the cost of maintaining a resource at its minimum load prior to supplying energy or ancillary services in response to dispatch instructions. These costs are generally not relevant to current storage technologies (although some renewable generators with integrated storage could have such costs).
9.1.4.2.3 Energy Bid Curve
For all ancillary services which are co-optimized with Energy, the resource must submit an energy bid curve, which is used to determine the optimal dispatch point for the resource consistent with its selection for ancillary services.
9.1.4.2.4 Ancillary Service Capacity Bid
All the ancillary services allow a bid ($/MW) for capacity reserved to provide the service. Under CAISO rules, these are single segment and single price bids. As discussed further below, some ancillary services have additional specific bid components. The same resource can submit separate bids for each ancillary service it offers to the market.
StorageVET allows for a reservation bid, which sets a minimum price for storage operations. While StorageVET is a price-taker model, a reservation bid could potentially reduce the possibility that the resource loses revenues in some hours when providing Regulation due to high energy make-up costs.
9.1.4.2.5 Transition Costs
Transition costs are any costs incurred between charging (or pumping) and discharging (generating) of a storage resource offering energy or both energy and ancillary services. Currently, only pumped storage plants are allowed to bid these costs; incorporation of transition constraints is also under consideration for NGRs.

9-5
9.1.4.2.6 Ramp Rates
As with energy operations, there are several defined ramp rates (MW/min) which can be relevant to provision of ancillary services, depending on the type of resource.
The Operational Ramp Rate is the most general ramp rate used for all resources. Additional ramp rates specific to ancillary service ramping are defined below.
9.1.4.2.7 Minimum Continuous Energy
Minimum continuous energy refers to the period of time for which the resource must follow the CAISO dispatch instruction, once it has achieved its award for the particular service.
9.1.4.2.8 Daily Energy Limit (Maximum and Minimum Daily)
For pumped storage plants, the bid includes a maximum and minimum daily energy limit. This bid parameter could also be used for other types of longer duration, limited energy storage resources which have similar constraints.
9.1.4.2.9 Upper Charge Limit
The Upper Charge Limit is the limited-energy storage resource’s maximum charge (MWh).
9.1.4.2.10 Lower Charge Limit
The Lower Charge Limit is the limited energy storage resource’s minimum charge (MWh) to be available for operations.
As a summary of these rules, Table 9-3 expands on Exhibit 4-3 in the BPM for market instruments.
Table 9–3 Bidding parameters for Pumped Storage and NGRs
Bid component
Pumped storage
NGR (non-REM)
NGR- REM
Comments from CAISO BPM and additional observations on NGRs
StorageVET
Start-Up Costs Yes No No NGRs do not have startup costs.
Yes
Minimum Load Costs
Yes No No NGRs do not have minimum load costs.
No
Transition Costs Yes No, under consideration
No Currently, NGRs do not have transition costs; CAISO is evaluating allowing such costs
Yes
Energy Bid Curve Yes Yes No NGRs selecting the REM option are not allowed to participate in the energy market.
Could be represented through reservation cost
Energy Self- Schedule
Yes Yes No Because NGRs selecting the REM option are not allowed to participate in
Yes – can be modeled in manual mode to charge and discharge regardless

9-6
Bid component
Pumped storage
NGR (non-REM)
NGR- REM
Comments from CAISO BPM and additional observations on NGRs
StorageVET
the energy market, they cannot self-schedule. Non REM NGRs can self-schedule as price takers only.
of market prices.
Ancillary Services – Self Provision
Yes No No NGRs are not allowed to self-provide Ancillary Services; for other self- providing storage resources, the bids are required to be $0/MW for capacity and mileage
Does not distinguish Self-Provision
Regulation Down – Capability Offers
Yes Yes Yes Can enter reservation price
Regulation Up
Yes Yes Yes Can enter reservation price
Spinning Reserve
Yes Yes No NGRs selecting the REM option are only allowed to supply regulation.
Can enter reservation price
Non-Spinning Reserve
Yes Yes No NGRs selecting the REM option are only allowed to supply regulation.
Can enter reservation price
Operational Ramp Rate
Yes Yes Yes NGRs are limited to two segments.
Yes – user can enter ramp rate
Operating Reserve Ramp Rate
Yes
No
No
NGRs are not allowed to submit Operating Reserve Ramp Rates. Operational Ramp rate shall be used for procurement of AS.
Yes – user can enter ramp rate
Regulation Ramp Rate
Yes
No
No
NGRs are not allowed to submit Regulation Ramp Rates. Operational Ramp rate shall be used for procurement of AS.
Yes – user can enter ramp rate
Contingency Dispatch Indicator
Yes Yes N/A Does not apply to REM resources because they cannot supply spinning or non-spinning reserve.
Yes
Intertie Minimum Hourly Block
N/A N/A Does not apply to NGRs because NGRs must be located within the CAISO balancing authority.

9-7
Bid component
Pumped storage
NGR (non-REM)
NGR- REM
Comments from CAISO BPM and additional observations on NGRs
StorageVET
Dispatch Option N/A N/A Does not apply to NGRs because NGRs must be located within the CAISO balancing authority.
Pump Shut-Down Cost
Yes No No By nature NGRs do not have pump shut-down costs.
Yes – for Pumped Storage
Pumping Cost Yes No No By nature NGRs do not have pumping costs.
Yes – for Pumped Storage
Daily Energy Limit (Maximum and Minimum Daily)
Yes No No However NGRs do bid an upper and lower charge limit, which is a similar concept.
Yes
RUC Yes No No
Capacity Limit Yes Yes Yes Yes
Distribution Factors
Yes Yes Assumption is that all underlying resources are operating in the same mode, either all must be in charging mode or all must be in discharging mode.
No
VER Forecast N/A N/A N/A Does not apply to NGRs because NGRs cannot be a VER.
N/A
The following bid components apply to NGRs only
Lower Charge Limit
Yes Yes Lowest stored energy that should be maintained in the device. Cannot be lower than the minimum stored energy value registered in the Master File.
Yes
Upper Charge Limit
Yes Yes Highest stored energy that should be maintained in the device. Cannot be higher than the maximum stored energy value (MSE) registered in the Master File.
Yes

9-8
9.2 Regulation Regulation is a real-time imbalance or “following” ancillary service which provides primary frequency control in the intervals between economic dispatch instructions7. The CAISO Regulation dispatch signal is every 4 seconds. CAISO has two regulation products: Regulation Up and Regulation Down. A resource can elect to provide one or both of these services. The CAISO Regulation market provides both a capacity payment and a mileage payment, with separate hourly market clearing prices for each product.
This section explains how the Regulation requirements are calculated, the definition of the market product, resource offer components, how Regulation capacity and mileage are procured, the Regulation dispatch process for different market participation models, and performance requirements. Section 11 examines Regulation market prices and settlements.
Key references on the CAISO Regulation market rules and market operations include [44,46].
StorageVET allows for several variants when modeling Regulation services, including supplying Regulation only using the CAISO’s Regulation Energy Management (REM) model described below, and co-optimizing Regulation with other services.
9.2.1 Regulation System Requirement The CAISO procures a variable quantity (MW) of Regulation Up and Regulation Down capacity and mileage in each hour through the IFM, with any residual quantities procured in the FMM. The CAISO has evaluated several tools/methods to forecast these Regulation requirements in the IFM [47].
Methods for calculating the Regulation mileage requirements are discussed further below. Procurement of mileage is enforced at the Expanded System Region only.
Table 9-4 shows the annual average hourly day-ahead procurement of Regulation capacity for 2013-2015. Over this period, Regulation procurement did not change significantly, despite the greater quantities of wind and solar being integrated into the CAISO system. However, in 2016, the CAISO increased its procurement of Regulation in the spring period, almost doubling the quantity procured for several months. On November 7, 2016, CAISO implemented a new method for Regulation procurement which is intended to reflect anticipated system conditions.
StorageVET does not represent the quantity of Regulation procured by CAISO, nor calculate the effect of storage operations on Regulation procurement. These factors must be considered separately by the StorageVET user. Some studies have examined the impact of storage operations on the Regulation market (e.g., [8]).
7 In some regions, it is called Frequency Regulation, to distinguish it from Voltage Regulation. However, all US ISOs/RTOs only use the term Regulation to define the wholesale product.
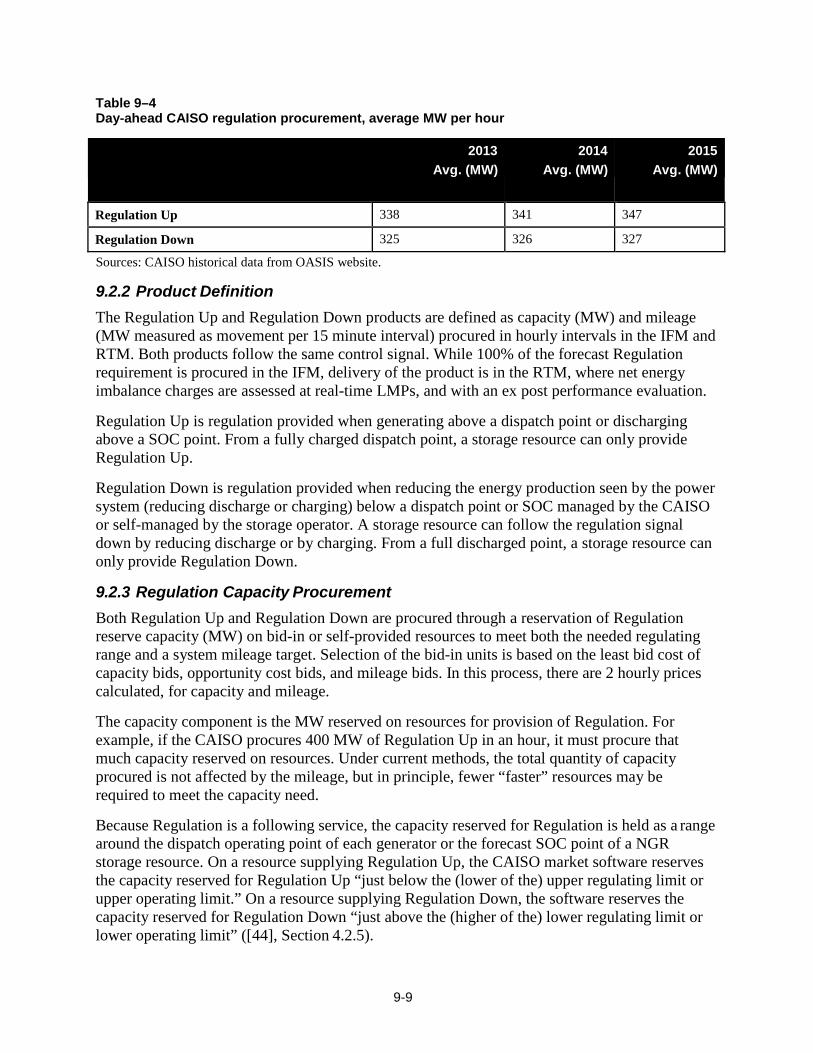
9-9
Table 9–4 Day-ahead CAISO regulation procurement, average MW per hour
2013 Avg. (MW)
2014 Avg. (MW)
2015 Avg. (MW)
Regulation Up 338 341 347
Regulation Down 325 326 327
Sources: CAISO historical data from OASIS website.
9.2.2 Product Definition The Regulation Up and Regulation Down products are defined as capacity (MW) and mileage (MW measured as movement per 15 minute interval) procured in hourly intervals in the IFM and RTM. Both products follow the same control signal. While 100% of the forecast Regulation requirement is procured in the IFM, delivery of the product is in the RTM, where net energy imbalance charges are assessed at real-time LMPs, and with an ex post performance evaluation.
Regulation Up is regulation provided when generating above a dispatch point or discharging above a SOC point. From a fully charged dispatch point, a storage resource can only provide Regulation Up.
Regulation Down is regulation provided when reducing the energy production seen by the power system (reducing discharge or charging) below a dispatch point or SOC managed by the CAISO or self-managed by the storage operator. A storage resource can follow the regulation signal down by reducing discharge or by charging. From a full discharged point, a storage resource can only provide Regulation Down.
9.2.3 Regulation Capacity Procurement Both Regulation Up and Regulation Down are procured through a reservation of Regulation reserve capacity (MW) on bid-in or self-provided resources to meet both the needed regulating range and a system mileage target. Selection of the bid-in units is based on the least bid cost of capacity bids, opportunity cost bids, and mileage bids. In this process, there are 2 hourly prices calculated, for capacity and mileage.
The capacity component is the MW reserved on resources for provision of Regulation. For example, if the CAISO procures 400 MW of Regulation Up in an hour, it must procure that much capacity reserved on resources. Under current methods, the total quantity of capacity procured is not affected by the mileage, but in principle, fewer “faster” resources may be required to meet the capacity need.
Because Regulation is a following service, the capacity reserved for Regulation is held as a range around the dispatch operating point of each generator or the forecast SOC point of a NGR storage resource. On a resource supplying Regulation Up, the CAISO market software reserves the capacity reserved for Regulation Up “just below the (lower of the) upper regulating limit or upper operating limit.” On a resource supplying Regulation Down, the software reserves the capacity reserved for Regulation Down “just above the (higher of the) lower regulating limit or lower operating limit” ([44], Section 4.2.5).
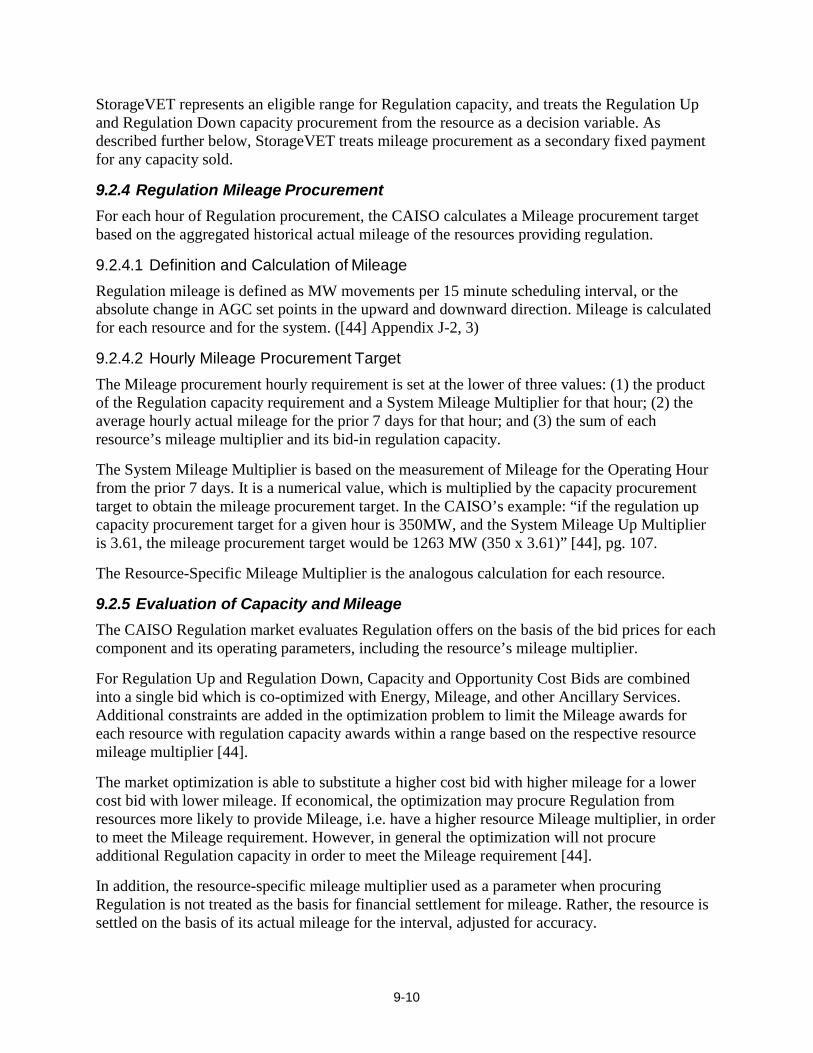
9-10
StorageVET represents an eligible range for Regulation capacity, and treats the Regulation Up and Regulation Down capacity procurement from the resource as a decision variable. As described further below, StorageVET treats mileage procurement as a secondary fixed payment for any capacity sold.
9.2.4 Regulation Mileage Procurement For each hour of Regulation procurement, the CAISO calculates a Mileage procurement target based on the aggregated historical actual mileage of the resources providing regulation.
9.2.4.1 Definition and Calculation of Mileage Regulation mileage is defined as MW movements per 15 minute scheduling interval, or the absolute change in AGC set points in the upward and downward direction. Mileage is calculated for each resource and for the system. ([44] Appendix J-2, 3)
9.2.4.2 Hourly Mileage Procurement Target The Mileage procurement hourly requirement is set at the lower of three values: (1) the product of the Regulation capacity requirement and a System Mileage Multiplier for that hour; (2) the average hourly actual mileage for the prior 7 days for that hour; and (3) the sum of each resource’s mileage multiplier and its bid-in regulation capacity.
The System Mileage Multiplier is based on the measurement of Mileage for the Operating Hour from the prior 7 days. It is a numerical value, which is multiplied by the capacity procurement target to obtain the mileage procurement target. In the CAISO’s example: “if the regulation up capacity procurement target for a given hour is 350MW, and the System Mileage Up Multiplier is 3.61, the mileage procurement target would be 1263 MW (350 x 3.61)” [44], pg. 107.
The Resource-Specific Mileage Multiplier is the analogous calculation for each resource.
9.2.5 Evaluation of Capacity and Mileage The CAISO Regulation market evaluates Regulation offers on the basis of the bid prices for each component and its operating parameters, including the resource’s mileage multiplier.
For Regulation Up and Regulation Down, Capacity and Opportunity Cost Bids are combined into a single bid which is co-optimized with Energy, Mileage, and other Ancillary Services. Additional constraints are added in the optimization problem to limit the Mileage awards for each resource with regulation capacity awards within a range based on the respective resource mileage multiplier [44].
The market optimization is able to substitute a higher cost bid with higher mileage for a lower cost bid with lower mileage. If economical, the optimization may procure Regulation from resources more likely to provide Mileage, i.e. have a higher resource Mileage multiplier, in order to meet the Mileage requirement. However, in general the optimization will not procure additional Regulation capacity in order to meet the Mileage requirement [44].
In addition, the resource-specific mileage multiplier used as a parameter when procuring Regulation is not treated as the basis for financial settlement for mileage. Rather, the resource is settled on the basis of its actual mileage for the interval, adjusted for accuracy.

9-11
StorageVET can utilize the Regulation mileage clearing prices and estimates of resource-specific mileage when providing Regulation to calculate mileage revenues. These data are all input variables, meaning that they are not calculated by the model but are rather fixed, but variable inputs to the model. The mileage revenue is essentially treated as an hourly adder to the capacity award.
References: [44], Section 4.2.6.
9.2.6 Offer Components This section identifies the components of the Regulation offers by eligible resources. In addition, the CAISO calculates certain parameters – such as the historical mileage provision – which are used when evaluating offers.
9.2.6.1 Regulation Capacity Regulation Up and Regulation Down capacity are each currently defined as MW in a single segment. The CAISO market rules include several constraints on the calculation of the capacity offered. For any resource, the Regulation capacity offered must not exceed the maximum Ramp Rate (MW/minute) of that resource times ten (10) minutes. For particular market participation models, such as NGR and NGR-REM, there are additional rules on how eligible capacity is calculated for the DAM and RTM. These are discussed further below.
9.2.6.2 Regulation Capacity Bid The Regulation Up and Regulation Down capacity bid ($/MW) is a single segment, single price bid for capacity reserved to provide the service.
9.2.6.3 Regulation Opportunity Cost Bid The Regulation Up and Regulation Down opportunity cost bid ($/MW) is a single segment, single price bid for the Energy opportunity cost of reserving capacity to provide the service. Opportunity cost is defined as [lost market revenues due to not providing Energy when on Regulation]. For NGR resources which are not operating in the Energy markets (e.g., NGR- REM), there is no Energy opportunity cost, and hence this bid is $0/MW.
9.2.6.4 Regulation Mileage Bid The Regulation Up and Regulation Down mileage bid ($/MW) is a single segment, single price bid for the mileage to provide the service.
9.2.6.5 State of Charge The SOC for the resource can be bid into the market. Otherwise, it is a parameter used by the CAISO for resource optimization.
9.2.6.6 Regulation Ramp Rate The Regulation Ramp Rate (MW/min) is the resource’s ramp rate when providing regulation (CAISO Tariff, App. A).
For all resources other than NGR-REM resources, the Regulation Ramp Rate is a single number; that is, it is not currently allowed to be variable depending on the state of the resource. For REM resources, the CAISO allows different ramp rates for charging and discharging.

9-12
The CAISO is currently examining allowing multiple ramp rates for NGRs as a function of SOC and other performance factors.
StorageVET does not model Regulation dispatch directly, but rather applies an energy-to-power ratio to estimate energy usage when providing Regulation. Hence, Regulation ramp rates would primarily be used by the user exogenously to establish the eligible ramping range.
9.2.6.7 Minimum Continuous Energy Minimum continuous energy is an energy requirement in minutes, as a function of the market in which the Regulation award is calculated and the market participation model. Minimum continuous energy is measured from the point at which the resource reaches its awarded production level. That is, if the resource achieves its awarded production level in 1 minute, then the minimum continuous energy requirement is measured for the subsequent minutes.
In the IFM, for all resources other than NGR-REM, the minimum continuous energy is 60 minutes. The CAISO states that this minimum duration for Regulation Up “aligns with the awarded interval’s time duration and allow for substitution as spinning reserves.” In the RTM, for all resources other than NGR-REM, the minimum continuous energy is 30 minutes.
In the IFM, for NGR-REM, the minimum continuous energy is 15 minutes, but because the resource has its SOC managed by the CAISO in 15 minute intervals, it is allowed to offer its 15- minute range for the full hour, or for four 15 minute intervals.
9.2.6.8 Upper and Lower Charge Limits Highest and lowest stored energy allowed on the resource.
9.2.6.9 Regulation Mileage Multiplier For each resource, the CAISO calculates a resource-specific Mileage Up or Down multiplier, which is used to estimate the resource’s expected mileage contribution (but is not used for settlement of mileage, which is based on actual performance). See the discussion below of how the CAISO procures mileage.
9.2.7 Bidding Rules This section lists additional bidding rules which could affect how the resource offer is structured and optimized.
9.2.7.1 Self-Provided Regulation Resources which are used for self-provision of Regulation are not allowed to set prices in the market, and must submit $0/MW offers for capacity and mileage.
9.2.7.2 NGR-REM As noted above, the NGR-REM option allows short duration, energy limited storage resources such as batteries and flywheels and dispatchable demand response (DDR) the option to participate only in the Regulation markets, without having to submit bids or schedules into the Energy Markets. Resources that provide REM cannot participate in the Energy or Spinning Reserve markets [48].
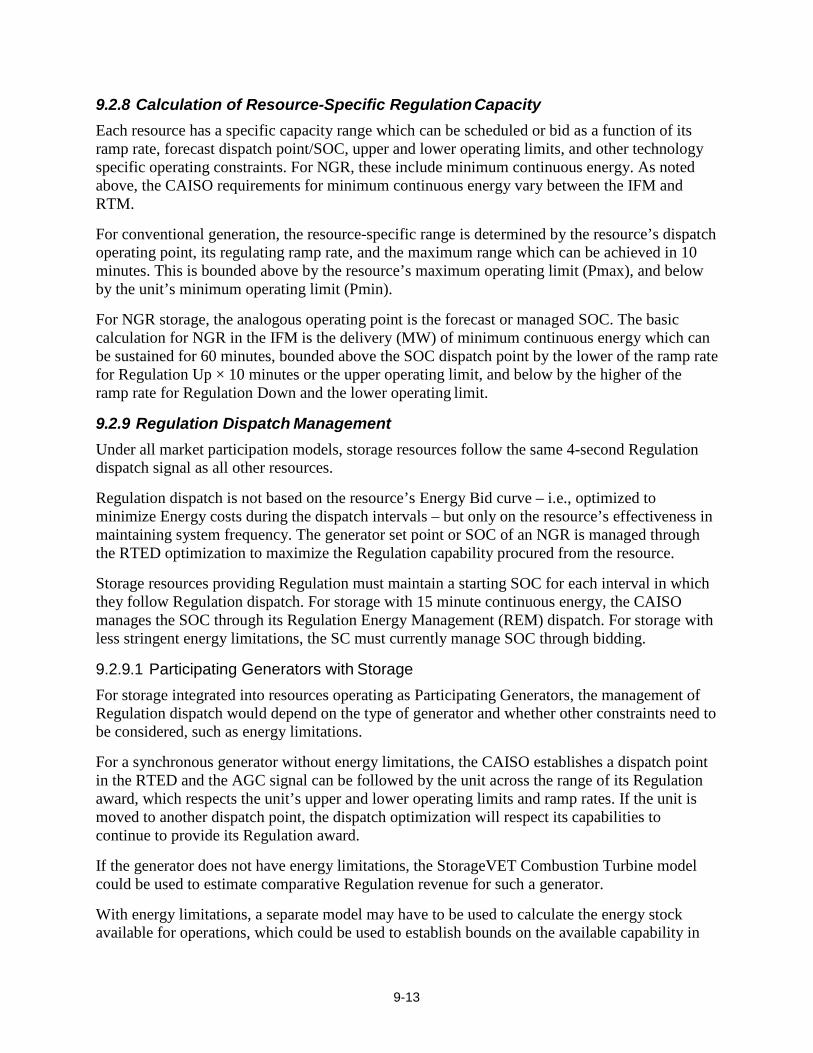
9-13
9.2.8 Calculation of Resource-Specific Regulation Capacity Each resource has a specific capacity range which can be scheduled or bid as a function of its ramp rate, forecast dispatch point/SOC, upper and lower operating limits, and other technology specific operating constraints. For NGR, these include minimum continuous energy. As noted above, the CAISO requirements for minimum continuous energy vary between the IFM and RTM.
For conventional generation, the resource-specific range is determined by the resource’s dispatch operating point, its regulating ramp rate, and the maximum range which can be achieved in 10 minutes. This is bounded above by the resource’s maximum operating limit (Pmax), and below by the unit’s minimum operating limit (Pmin).
For NGR storage, the analogous operating point is the forecast or managed SOC. The basic calculation for NGR in the IFM is the delivery (MW) of minimum continuous energy which can be sustained for 60 minutes, bounded above the SOC dispatch point by the lower of the ramp rate for Regulation Up × 10 minutes or the upper operating limit, and below by the higher of the ramp rate for Regulation Down and the lower operating limit.
9.2.9 Regulation Dispatch Management Under all market participation models, storage resources follow the same 4-second Regulation dispatch signal as all other resources.
Regulation dispatch is not based on the resource’s Energy Bid curve – i.e., optimized to minimize Energy costs during the dispatch intervals – but only on the resource’s effectiveness in maintaining system frequency. The generator set point or SOC of an NGR is managed through the RTED optimization to maximize the Regulation capability procured from the resource.
Storage resources providing Regulation must maintain a starting SOC for each interval in which they follow Regulation dispatch. For storage with 15 minute continuous energy, the CAISO manages the SOC through its Regulation Energy Management (REM) dispatch. For storage with less stringent energy limitations, the SC must currently manage SOC through bidding.
9.2.9.1 Participating Generators with Storage For storage integrated into resources operating as Participating Generators, the management of Regulation dispatch would depend on the type of generator and whether other constraints need to be considered, such as energy limitations.
For a synchronous generator without energy limitations, the CAISO establishes a dispatch point in the RTED and the AGC signal can be followed by the unit across the range of its Regulation award, which respects the unit’s upper and lower operating limits and ramp rates. If the unit is moved to another dispatch point, the dispatch optimization will respect its capabilities to continue to provide its Regulation award.
If the generator does not have energy limitations, the StorageVET Combustion Turbine model could be used to estimate comparative Regulation revenue for such a generator.
With energy limitations, a separate model may have to be used to calculate the energy stock available for operations, which could be used to establish bounds on the available capability in

9-14
StorageVET. An example is a concentrating solar plant with thermal energy storage (CSP-TES), which can provide Regulation from a synchronized steam generator. For CSP, the NREL Solar Advisor Model (SAM) (https://sam.nrel.gov/) has more operational functionality than StorageVET, but does not conduct market dispatch.
9.2.9.2 Pumped Storage A Pumped Storage plant will operate as a Participating Generator when providing ancillary services in generation mode, and as a Participating Load when offering ancillary services in pumping mode. The resource cannot provide ancillary services in transition mode.
The CAISO optimization first calculates a feasible energy dispatch as if there was no Pmin. With that energy dispatch fixed, the CAISO calculates the capacity to provide ancillary services.
9.2.9.3 NGR NGRs are also equipped to respond to control signals, but require management of SOC to ensure that the resource’s Regulation capability is efficiently utilized.
For NGRs, SOC constraints are applied to both binding and non-binding intervals in RTED. At the start of the optimization, the latest SOC for each NGR is received via telemetry, which is used as an initial condition SOC. This is similar to calculation of generator initial operating conditions [44].
9.2.9.4 NGR-REM Similarly for NGR-REM, the optimization objective is to minimize the total weighted violations for each interval in the optimization horizon. Violations are defined as intervals when the SOC does not “fully support” the regulation award. The RTED objective is to “protect the resource’s available regulation capacity as much as possible for the binding interval based on SOC.”
For REM, the AGC applies a “50% rule” that (excerpted from [44], section 7.8.2.5):
• Maintains the SOC at 50% if system conditions are normal and it is not impacting the grid reliability by doing so.
• If SOC is below 50% and the system needs Regulation Down energy, AGC will calculate the MW charge level, and send a set point to NGRs for charging.
• If SOC is above 50% and system needs Regulation Up energy, AGC will calculate the MW charge level, and send a set point to the NGR for discharging.
StorageVET does not model Regulation dispatch directly, but can take into account the efficiency losses when providing Regulation on the SOC in each interval via a parameter.
9.2.10 Performance Requirements Although not a component of Regulation market operations, Regulation suppliers are subject to performance metrics which can determine subsequent participation. There are two metrics:
(i) Monthly regulation performance calculation
(ii) Minimum performance threshold

9-15
The monthly regulation performance calculation uses a weighted average with 15-minute instructed regulation mileage as the weighting factor and the minimum regulation performance threshold is 25% [49].
StorageVET does not evaluate actual regulation performance.
9.2.11 Summary of Regulation Market Rules and Examples 9.2.11.1 NGRs (non-REM) Table 9-5 shows the specifications for the Regulation product as supplied by non-REM NGR resources. These are compared to the StorageVET parameters.
Table 9–5 CAISO regulation market parameters (non-REM)
Unit Characteristics CAISO Regulation Up/Down StorageVET
Minimum size (MW) 500 kW User specified
Ramp rate (MW/Min) Regulation ramp rate specified in MW/min
Ramp rate typically unconstrained
Maximum operating level (PMax) Required - resource specific User specified
Minimum operating level (PMin) Required - resource specific User specified
Minimum continuous energy duration (min.)
IFM: 60 minutes RTM: 30 minutes
User specified; IFM only
Eligible capacity SOC + Minimum continuous energy User specified; typically unconstrained
Roundtrip efficiency (%) Required for real-time operations User specified
SOC IFM: Bid-based for first interval, or based on prior day-ahead schedules or 50% of the maximum defined energy limit if there are no previous day ahead schedules RTM: based on telemetry
User specified
* May need some further clarifications
Table 9-6 shows some parameters for a hypothetical NGR storage resource, using a CAISO example. Note that unlike the NGR-REM resource discussed in the next example, the simple NGR has constrained capacity to offer as Regulation because it cannot utilize the CAISO to ensure energy management for continuous utilization.
Table 9–6 Hypothetical NGR storage resource parameters and eligible capacity
Unit Characteristics Storage Resource
Capacity (MW) 40 MW
Duration (Hours) 10 MWh
Ramp rate (MW/Min) 10 MW/min
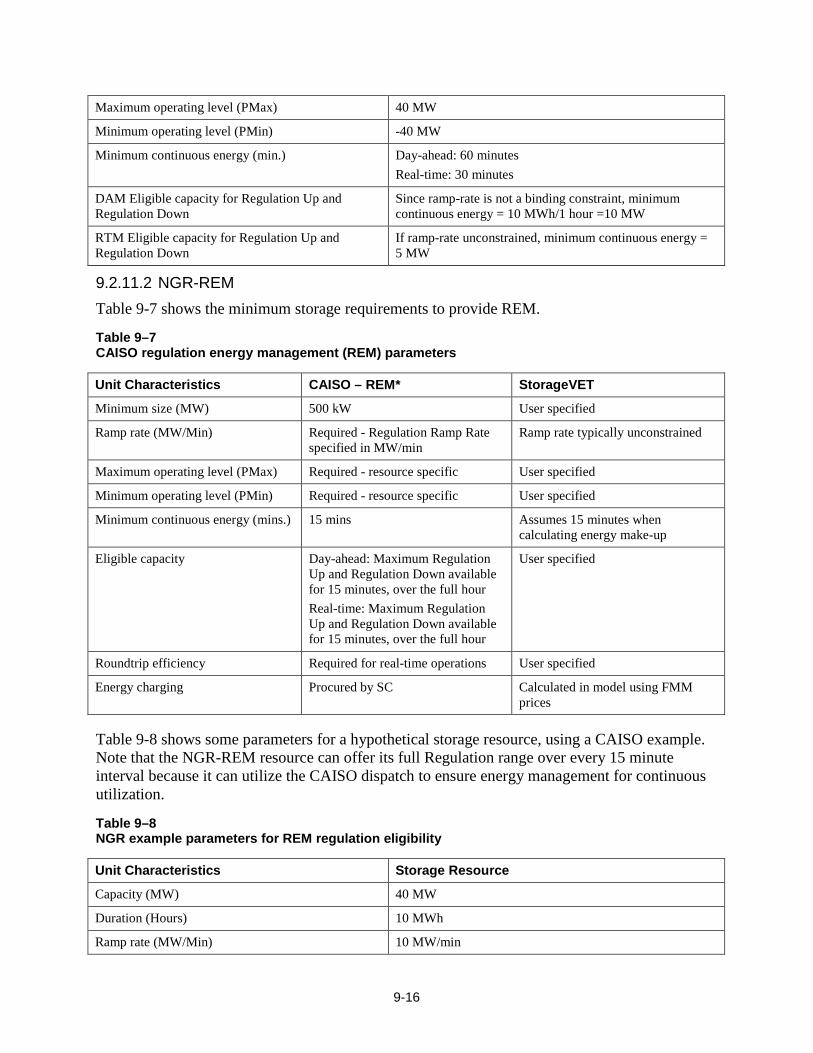
9-16
Maximum operating level (PMax) 40 MW
Minimum operating level (PMin) -40 MW
Minimum continuous energy (min.) Day-ahead: 60 minutes Real-time: 30 minutes
DAM Eligible capacity for Regulation Up and Regulation Down
Since ramp-rate is not a binding constraint, minimum continuous energy = 10 MWh/1 hour =10 MW
RTM Eligible capacity for Regulation Up and Regulation Down
If ramp-rate unconstrained, minimum continuous energy = 5 MW
9.2.11.2 NGR-REM Table 9-7 shows the minimum storage requirements to provide REM.
Table 9–7 CAISO regulation energy management (REM) parameters
Unit Characteristics CAISO – REM* StorageVET
Minimum size (MW) 500 kW User specified
Ramp rate (MW/Min) Required - Regulation Ramp Rate specified in MW/min
Ramp rate typically unconstrained
Maximum operating level (PMax) Required - resource specific User specified
Minimum operating level (PMin) Required - resource specific User specified
Minimum continuous energy (mins.) 15 mins Assumes 15 minutes when calculating energy make-up
Eligible capacity Day-ahead: Maximum Regulation Up and Regulation Down available for 15 minutes, over the full hour Real-time: Maximum Regulation Up and Regulation Down available for 15 minutes, over the full hour
User specified
Roundtrip efficiency Required for real-time operations User specified
Energy charging Procured by SC Calculated in model using FMM prices
Table 9-8 shows some parameters for a hypothetical storage resource, using a CAISO example. Note that the NGR-REM resource can offer its full Regulation range over every 15 minute interval because it can utilize the CAISO dispatch to ensure energy management for continuous utilization.
Table 9–8 NGR example parameters for REM regulation eligibility
Unit Characteristics Storage Resource
Capacity (MW) 40 MW
Duration (Hours) 10 MWh
Ramp rate (MW/Min) 10 MW/min
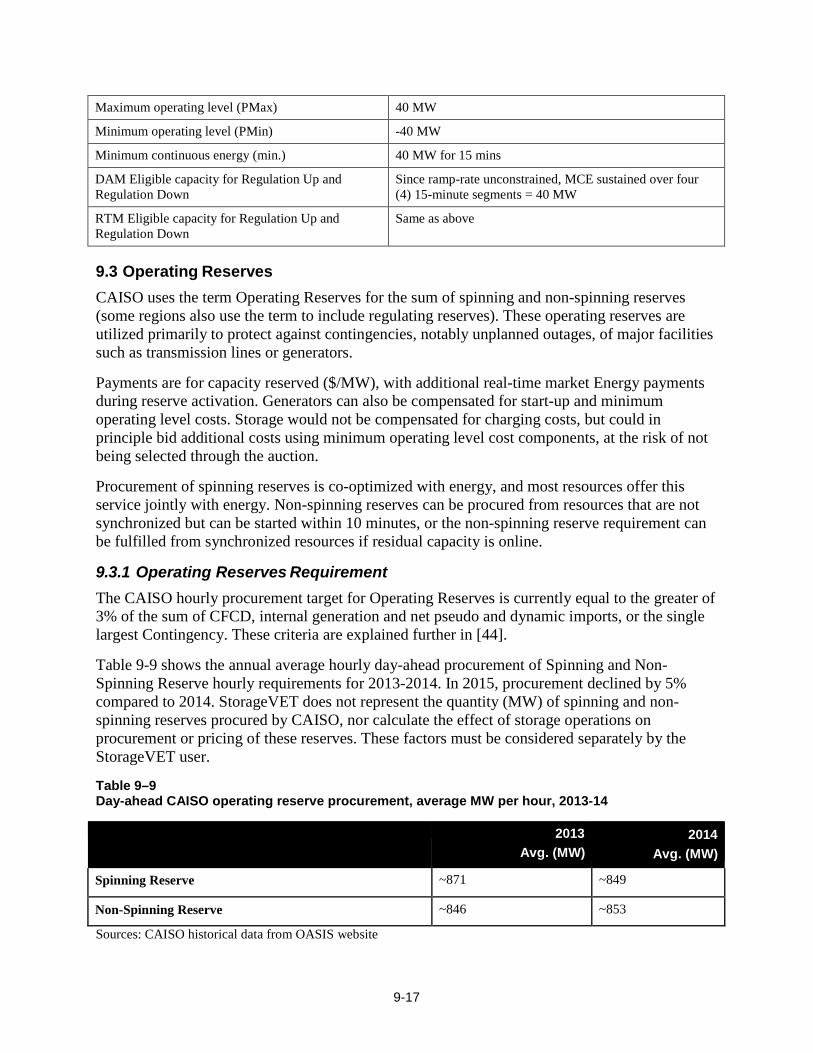
9-17
Maximum operating level (PMax) 40 MW
Minimum operating level (PMin) -40 MW
Minimum continuous energy (min.) 40 MW for 15 mins
DAM Eligible capacity for Regulation Up and Regulation Down
Since ramp-rate unconstrained, MCE sustained over four (4) 15-minute segments = 40 MW
RTM Eligible capacity for Regulation Up and Regulation Down
Same as above
9.3 Operating Reserves CAISO uses the term Operating Reserves for the sum of spinning and non-spinning reserves (some regions also use the term to include regulating reserves). These operating reserves are utilized primarily to protect against contingencies, notably unplanned outages, of major facilities such as transmission lines or generators.
Payments are for capacity reserved ($/MW), with additional real-time market Energy payments during reserve activation. Generators can also be compensated for start-up and minimum operating level costs. Storage would not be compensated for charging costs, but could in principle bid additional costs using minimum operating level cost components, at the risk of not being selected through the auction.
Procurement of spinning reserves is co-optimized with energy, and most resources offer this service jointly with energy. Non-spinning reserves can be procured from resources that are not synchronized but can be started within 10 minutes, or the non-spinning reserve requirement can be fulfilled from synchronized resources if residual capacity is online.
9.3.1 Operating Reserves Requirement The CAISO hourly procurement target for Operating Reserves is currently equal to the greater of 3% of the sum of CFCD, internal generation and net pseudo and dynamic imports, or the single largest Contingency. These criteria are explained further in [44].
Table 9-9 shows the annual average hourly day-ahead procurement of Spinning and Non- Spinning Reserve hourly requirements for 2013-2014. In 2015, procurement declined by 5% compared to 2014. StorageVET does not represent the quantity (MW) of spinning and non- spinning reserves procured by CAISO, nor calculate the effect of storage operations on procurement or pricing of these reserves. These factors must be considered separately by the StorageVET user.
Table 9–9 Day-ahead CAISO operating reserve procurement, average MW per hour, 2013-14
2013
Avg. (MW) 2014
Avg. (MW)
Spinning Reserve ~871 ~849
Non-Spinning Reserve ~846 ~853
Sources: CAISO historical data from OASIS website

9-18
9.3.2 Spinning Reserves Spinning Reserve is acquired from units which must be synchronized and with the full award available in 10 minutes.
9.3.2.1 Product Definition The eligible spinning reserve capacity is measured as the Operating Reserve ramp rate (MW/min) × 10 minutes. Whether procured in the IFM or RTM, energy production in response to a CAISO dispatch instruction must be capable of being maintained for 30 minutes.
9.3.2.2 Spinning Reserves Capacity Procurement Table 9-10 shows the average hourly Spinning Reserve procurement by the CAISO. This quantity has remained fairly stable between years.
9.3.2.3 Offer Components This section identifies the components of the Regulation offers by eligible resources.
9.3.2.3.1 Spinning and Non-Spinning Reserve Capacity Bid
The Spinning and Non-Spinning Reserve capacity bids ($/MW) is a single segment, single price bid for capacity reserved to provide the service.
The CAISO market rules include several constraints on the calculation of the capacity offered. For any resource, the Spinning Reserve and Non-Spinning Reserve capacity offered must not exceed the maximum Ramp Rate (MW/minute) of that resource times ten (10) minutes. There are additional rules on how eligible capacity is calculated for the DAM and RTM. These are discussed below.
9.3.2.3.2 Operating Reserve Ramp Rate
The Operating Reserve Ramp Rate (MW/min) is the resource’s ramp rate when providing spinning reserves (CAISO Tariff, App. A).
9.3.2.4 Spinning Reserve Dispatch Management Because spinning and non-spinning reserves are dispatched for Energy during system contingencies, the market rules require that resources provide an Energy bid for economic dispatch, and to determine the opportunity cost, if any, of reserving capacity.
Table 9–10 Summary of CAISO spinning reserve market parameters
Unit Characteristics CAISO* StorageVET
Minimum size (MW) 500 kW User specified
Ramp rate (MW/Min) Operating Reserve ramp rate specified in MW/min
Ramp rate typically unconstrained
Maximum operating level (PMax) Required - resource specific User specified
Minimum operating level (PMin) Required - resource specific User specified
Minimum continuous energy (mins.) 30 minutes User must specify minimum continuous energy requirement
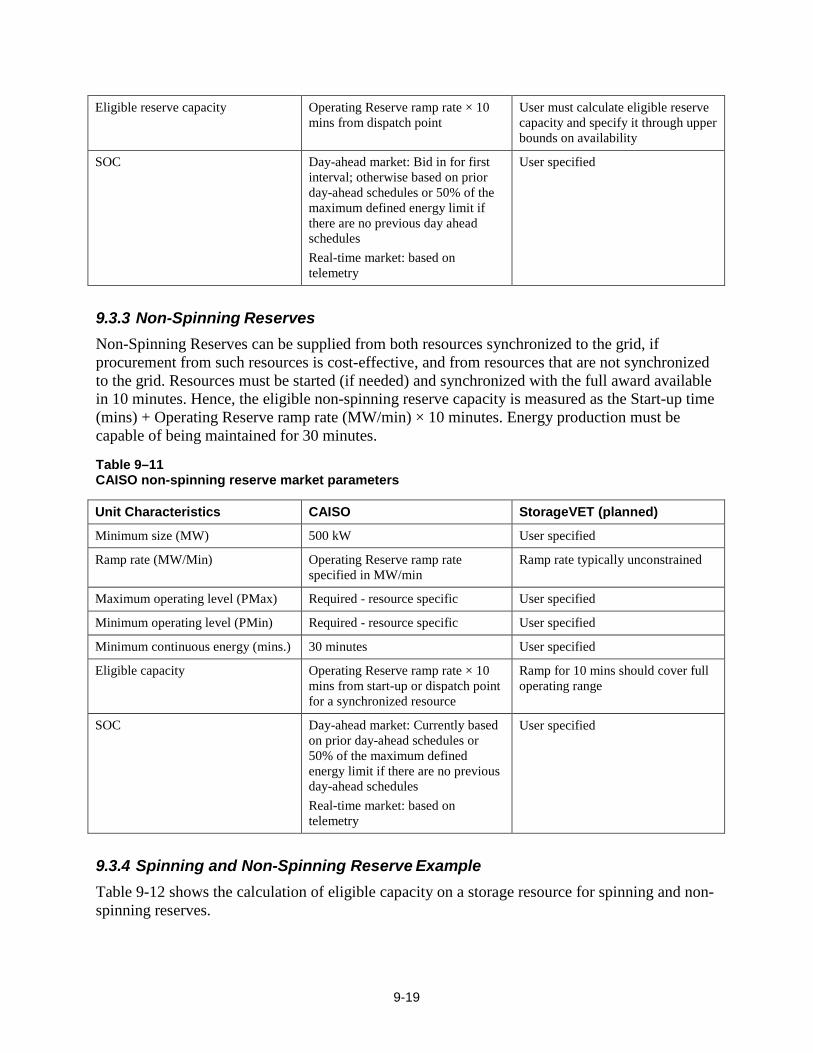
9-19
Eligible reserve capacity Operating Reserve ramp rate × 10 mins from dispatch point
User must calculate eligible reserve capacity and specify it through upper bounds on availability
SOC Day-ahead market: Bid in for first interval; otherwise based on prior day-ahead schedules or 50% of the maximum defined energy limit if there are no previous day ahead schedules Real-time market: based on telemetry
User specified
9.3.3 Non-Spinning Reserves Non-Spinning Reserves can be supplied from both resources synchronized to the grid, if procurement from such resources is cost-effective, and from resources that are not synchronized to the grid. Resources must be started (if needed) and synchronized with the full award available in 10 minutes. Hence, the eligible non-spinning reserve capacity is measured as the Start-up time (mins) + Operating Reserve ramp rate (MW/min) × 10 minutes. Energy production must be capable of being maintained for 30 minutes.
Table 9–11 CAISO non-spinning reserve market parameters
Unit Characteristics CAISO StorageVET (planned)
Minimum size (MW) 500 kW User specified
Ramp rate (MW/Min) Operating Reserve ramp rate specified in MW/min
Ramp rate typically unconstrained
Maximum operating level (PMax) Required - resource specific User specified
Minimum operating level (PMin) Required - resource specific User specified
Minimum continuous energy (mins.) 30 minutes User specified
Eligible capacity Operating Reserve ramp rate × 10 mins from start-up or dispatch point for a synchronized resource
Ramp for 10 mins should cover full operating range
SOC Day-ahead market: Currently based on prior day-ahead schedules or 50% of the maximum defined energy limit if there are no previous day-ahead schedules Real-time market: based on telemetry
User specified
9.3.4 Spinning and Non-Spinning Reserve Example Table 9-12 shows the calculation of eligible capacity on a storage resource for spinning and non- spinning reserves.

9-20
Table 9–12 NGR example parameters for Spinning and Non-spinning Reserve eligibility
Unit Characteristics Storage Resource
Capacity (MW) 40 MW
Duration (Hours) 10 MWh
Ramp rate (MW/Min) 10 MW/min
Maximum operating level (PMax) 40 MW
Minimum operating level (PMin) -40 MW
Minimum continuous energy (min.) Day-ahead: 30 minutes Real-time: 30 minutes
DAM Eligible capacity for Spinning and Non- Spinning Reserves
Ramp rate × Minimum continuous energy = 20 MW
RTM Eligible capacity for Spinning and Non- Spinning Reserves
Ramp rate × Minimum continuous energy = 20 MW
9.3.5 Performance Audits CAISO conducts performance audits of dispatched resources to assess whether they provided at least 90% of their spin/non-spin in 10 minutes. StorageVET will not account for failure to perform.
9.4 Frequency Response Primary frequency control is the immediate autonomous response from synchronized resources that reacts to locally sensed frequency deviations, typically through turbine governors or sometimes automatic load curtailment relays. It is used to stabilize system frequency to some level above the setting of under-frequency load shedding relays.
Related to primary frequency control is synchronous inertia response, which is typically defined as the immediate injection of active power through the stored kinetic energy of the rotating mass of synchronous machines. This response will slow down the rate of change of the frequency decline. The response is critical for avoiding triggering under frequency load shedding as well as avoiding the loss of synchrony which will cause instability. Similar to primary frequency response, there does not exist any ancillary service market for inertial response nor any cost- based recovery mechanism.
In 2015, CAISO began an initiative [50] to determine how to comply with its frequency response obligations under NERC BAL-003-1. Over the past few years, the CAISO has experienced a range of frequency response performance as shown in Table 9-13, with a trend towards deterioration. This initiative has proposed interim measures to improve performance and evaluate whether to implement new market products, with compliance beginning in December 1, 2016 for the 2017 period.

9-21
Table 9–13 CAISO frequency response performance, 2012 – Jan. 2016
FRO (MW/0.1Hz)
Actual Frequency Response (MW/0.1Hz)
Shortfall ∆MW (FRO-FR)
Compliance N Period 2016 Annual Minimum Median Average
2012
27
258
252
56
262.77
-13
2013
26
258
252
95
209.52
24
2014
33
258
285
60
218.80
60
2015
24
258
272
22
184.71
96
2016
1
258
258
141
140.78
117
The initiative is currently structured in two phases. For Phase 1, CAISO has taken measures to (1) clarify requirements for participating generators with governor controls; (2) procure transferred frequency response from external BAAs through a competitive solicitation process; (3) allocate the cost of transferred frequency response to CAISO load; (4) clarify CAISO’s practice of designating operating reserves procured day-ahead as contingency reserves in real- time; and (5) clarify which entities generally issue voltage schedules (list cited verbatim from FERC order [50]). The CAISO will issue a monthly report on primary frequency response performance. Storage resources are not specifically evaluated in this first phase.
For Phase 2, the focus will be on future product definition and market mechanisms aimed at ensuring frequency response performance regardless of the size of the event (i.e., a minimum reserve quantity), or whether procurement should be tuned to the size of the event (i.e., MW/0.1Hz).
At the present time, the best proxy price for a frequency responsive reserve is the CAISO spinning reserve price. Spinning reserve has the similarity with a frequency responsive reserve that it is an upward reserve from units which are already synchronized. The primary difference is that a frequency responsive reserve would require additional resources dedicated to the reserve, which could affect market prices in several ways (prices for reserves could be higher, while energy prices could be lower due to having more units committed).
9.5 Tariff-Based Ancillary Services 9.5.1 Voltage Support Voltage support is typically provided by the injection (or withdrawal) of reactive power. Voltage support is primarily provided by on-line generators but can also be provided by transmission

9-22
devices such as static var compensators or tap-changing transformers. While there is no CAISO ancillary service market for voltage support or reactive power provision, resources are provided cost-based payments or make-whole payments when they are needed and do not earn sufficient revenue from energy markets. Also, if by providing reactive power the resource must adjust its active power output, market rules provide the generator with a lost opportunity cost for the revenue foregone in the energy market, as based on its energy bid or default energy bid price.
9.5.2 Blackstart Service Black-start service is needed from generators for system restoration following blackout events. These resources must be capable of starting without outside power supply, able to maintain frequency and voltage under varying load, and able to maintain rated output for a significant period of time. CAISO requests black-start service proposals and will then have cost-based recovery mechanisms in place for these resources. Each Black Start Generating Unit must be capable of sustaining its output for a minimum period of twelve (12) hours from the time when it first starts delivering Energy. In addition, it must be able to start up with a dead primary and station service bus within ten (10) minutes of issue of a dispatch instruction.
The tariff further requires that “each Black Start Generating Unit must provide sufficient reactive capability to keep the energized transmission bus voltages within emergency Voltage Limits over the range of no load to full load.”
9.6 Additional Operating Standards This section summarizes some additional operational requirements for resources offering ancillary services which are relevant to storage attributes.
Table 9–14 Ancillary service control, capability, and availability standards
Ancillary Service
Control Standards Ancillary Service Capability Standards
Ancillary Service Availability Standards
Regulation Regulation. The Area Control Error will be calculated by the CAISO Energy Management System. Control signals will be sent from the CAISO EMS to raise or lower the output of resources providing Regulation when ACE exceeds the allowable CAISO Balancing Authority Area dead band for ACE;
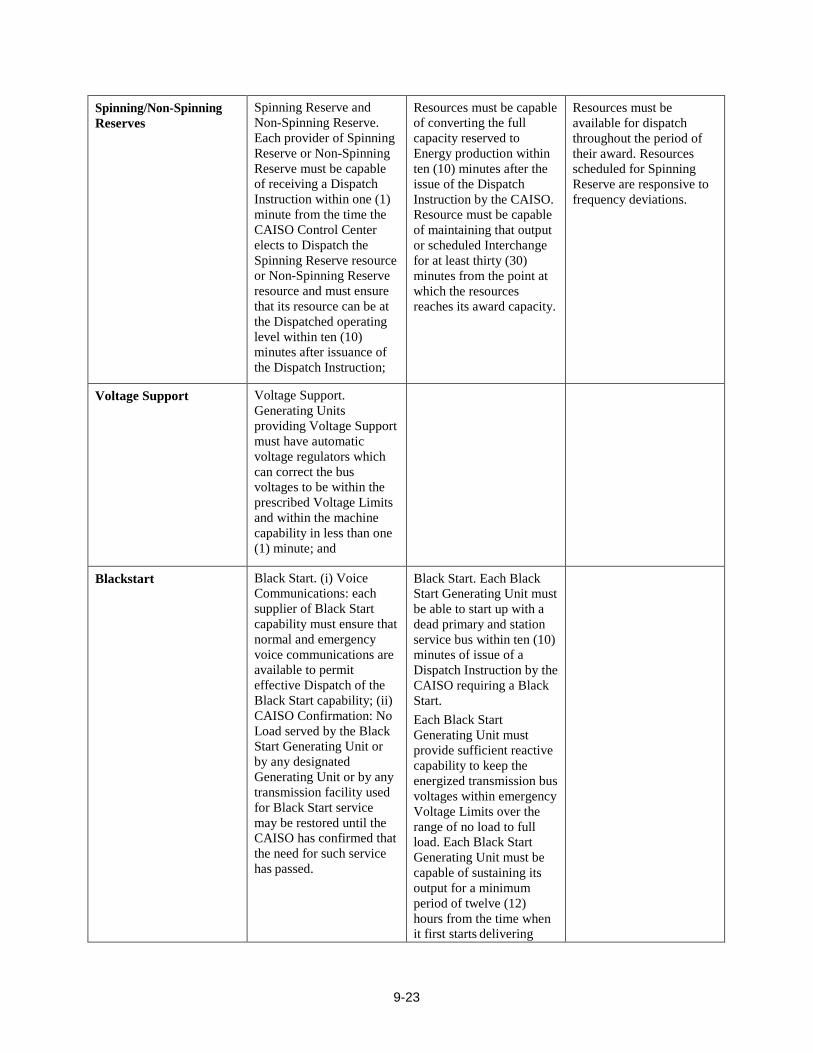
9-23
Spinning/Non-Spinning Reserves
Spinning Reserve and Non-Spinning Reserve. Each provider of Spinning Reserve or Non-Spinning Reserve must be capable of receiving a Dispatch Instruction within one (1) minute from the time the CAISO Control Center elects to Dispatch the Spinning Reserve resource or Non-Spinning Reserve resource and must ensure that its resource can be at the Dispatched operating level within ten (10) minutes after issuance of the Dispatch Instruction;
Resources must be capable of converting the full capacity reserved to Energy production within ten (10) minutes after the issue of the Dispatch Instruction by the CAISO. Resource must be capable of maintaining that output or scheduled Interchange for at least thirty (30) minutes from the point at which the resources reaches its award capacity.
Resources must be available for dispatch throughout the period of their award. Resources scheduled for Spinning Reserve are responsive to frequency deviations.
Voltage Support Voltage Support. Generating Units providing Voltage Support must have automatic voltage regulators which can correct the bus voltages to be within the prescribed Voltage Limits and within the machine capability in less than one (1) minute; and
Blackstart Black Start. (i) Voice Communications: each supplier of Black Start capability must ensure that normal and emergency voice communications are available to permit effective Dispatch of the Black Start capability; (ii) CAISO Confirmation: No Load served by the Black Start Generating Unit or by any designated Generating Unit or by any transmission facility used for Black Start service may be restored until the CAISO has confirmed that the need for such service has passed.
Black Start. Each Black Start Generating Unit must be able to start up with a dead primary and station service bus within ten (10) minutes of issue of a Dispatch Instruction by the CAISO requiring a Black Start. Each Black Start Generating Unit must provide sufficient reactive capability to keep the energized transmission bus voltages within emergency Voltage Limits over the range of no load to full load. Each Black Start Generating Unit must be capable of sustaining its output for a minimum period of twelve (12) hours from the time when it first starts delivering

9-24
Energy.

10-1
10 RESOURCE ADEQUACY This section describes the California Resource Adequacy (RA) program. Storage resources can obtain capacity value directly as suppliers of generic capacity (MW) and operational flexibility, and indirectly as behind-the-meter modifiers of LSE peak loads, which are used to establish LSE capacity obligations. StorageVET can model several variants on how storage would meet capacity obligations or modify a “net load” curve, as well as incorporate both standard and user- defined estimates of avoided capacity value.
Resource adequacy is a reliability function in most regions comprising the U.S. electric power system8, conducted to ensure that there are sufficient generation and non-generation resources available to meet the forecast next-year peak load along with reserve requirements, generally one to three years ahead. Maintaining resource adequacy is also a requirement in resource planning on longer time-frames, such as the CPUC’s LTPP and utility integrated resource plans. Resource adequacy authorities include state regulators, ISOs and RTOs, and other entities. The resource adequacy requirement is set by several methods, typically based on reliability modeling of the resources needed to maintain loss-of-load expectation (LOLE) to a 1-in-10 year standard. For additional general background, see [4].
A Resource adequacy requirement creates obligations to load-serving entities which can be met through self-ownership, For a particular resource, a Resource Adequacy (RA) capacity rating refers to the capacity of the resource, denominated as MW, counted towards meeting a resource adequacy requirement along with performance obligations. The RA capacity rating, which is a percentage of its maximum operating limit for the period being evaluated, is a function of many factors, including location on the transmission or distribution network, technology type, vintage, time of year, operational attributes, and the modeling method used for determining the rating. Depending on the region, LSEs can also use load management – energy efficiency, behind-the- meter energy and storage resources – to reduce the RA obligation.
In California, the resource adequacy authorities include the CPUC, which develops the rules and enforces compliance for its jurisdictional load-serving entities (LSEs), and POUs that are termed Local Regulatory Authorities (LRAs) and have oversight from the CEC. This section focuses on the rules of the CPUC’s Resource Adequacy (RA) program along with the CAISO’s roles in that program as well as its own tariff-based authority to procure capacity. The section uses the definitions and nomenclature developed by the CPUC and CAISO, and attempts to provide more generic explanations where appropriate. The section is organized as follows:
Section 10.1 – CPUC Resource Adequacy program overview;
Section 10.2 – Determination of RA requirements;
Section 10.3 – LSE compliance requirements;
8 The notable exception is the region of the Electricity Reliability Council of Texas (ERCOT).

10-2
Section 10.4 – Resource capacity ratings; and
Section 10.5 – CAISO Capacity Procurement Mechanism.
Section 11 discusses how the RA capacity product is valued in the California power markets.
10.1 CPUC Resource Adequacy Program - Overview The CPUC’s Resource Adequacy (RA) program was established in 2004, and has subsequently undergone many refinements, primarily through an annual proceeding. The first compliance year was 2006. System RA requirements were the first component of the program (beginning in 2006), followed by Local RA requirements in 2007, and Flexible RA requirements in 2015. These types of capacity are discussed further below. Additional details on the program are available on the CPUC RA website, notably in the annual Filing Guide [51] and in the CAISO Business Practice Manual on Reliability Requirements (henceforth Reliability BPM) [52]. Table 10-1 summarizes the key CPUC and CAISO roles and responsibilities for the RA program; in addition, the CEC performs load forecasting.
The remainder of this section examines the four dimensions of the RA program most relevant to analysis of storage value, and describes options for using the StorageVET model for evaluation, as applicable:
• Determination of system, local and flexible capacity requirements; • LSE compliance obligations; • Resource capacity ratings (or counting rules) and adjustments for deliverability; • Obligations of capacity resources in the CAISO markets, along with penalties and incentives.
Table 10–1 Key CPUC and CAISO roles and responsibilities in the resource adequacy program
CPUC CAISO
Resource Adequacy requirements
System Capacity Requirements
Planning Reserve Margin formula; LOLE modeling under development
Local Capacity Requirements
Planning Reserve Margin formula; uses CAISO definitions of Local Capacity Areas
Identifies Local Capacity Areas through power flow modeling and determines local requirements and eligible capacity (annual)
Flexible Capacity Requirements
Defines the allocation of Flexible Capacity as a component of total capacity requirements
Conducts flexible capacity needs assessment (annual)
Resource eligibility
Resource capacity ratings (Qualifying Capacity)
Rules for all resources to determine Qualifying Capacity (QC)
Adjusted resource capacity to reflect transmission constraints on delivery of power to specified loads
Determination of Net Qualifying Capacity (NQC) through deliverability assessment

10-3
RA capacity transactions Reviews LSE contract terms and prices Standard Capacity Product (SCP)
rules to facilitate trading
Validation of supply plans DR, Local RA, Capacity Allocation
Mechanism (CAM), and Reliability Must Run (RMR) allocations
LSE supply plan validation
Backstop capacity procurement Evaluates additional procurement on case-by-
case basis (months) Capacity Procurement Mechanism (CPM) for short-term procurement of additional capacity; tariff-based contract prices and competitive solicitation process
Sources: CPUC Filing Guide [51], CAISO [52]
10.2 Determination of Resource Adequacy Requirements This section briefly explains how Resource Adequacy (RA) requirements are calculated and allocated to jurisdictional LSEs. System and local requirements are denominated in generic MW, while flexible RA requirements are in MW from qualified resources, as discussed below.
10.2.1 System RA Requirements System RA requirements are determined based on the each LSE’s CEC adjusted forecast of the next year’s peak load plus a 15% planning reserve margin for each month and annually. These requirements are then converted into LSE compliance obligations through a series of further sub- allocations into local and flexible capacity requirements (and other adjustments for demand response and the Capacity Allocation Mechanism (CAM)).
The StorageVET model does not explicitly model LSE peak loads, but it can analyze individual building net loads due to the operations of distributed energy resources including storage, and hence could be used to aggregate the impact of small devices on LSE loads.
10.2.2 Local Capacity Requirements Local RA capacity requirements are determined by the CAISO using an annual study which calculates the capacity needed within fixed local areas to meet applicable NERC and WECC reliability standards [53]. A local capacity resource can also meet an LSE’s system RA requirements.
10.2.3 Flexible Capacity Requirements The CAISO’s procedure [54] for determining the flexible capacity requirement (which is under review) is through a six-step assessment process, which develops a minute-by-minute net load forecast for the next year and then calculates the highest monthly system net load ramp of 3 hours duration. The methodology adds additional reserves equal to the higher of the single largest contingency or 3.5% of the peak load. The total requirement is subdivided into Base Ramping, Peak Ramping, and Super-Peak Ramping. As discussed in more detail below, the flexible capacity requirement must be met with resources which are eligible to support the three hour ramp in each month, which can include both short-duration and longer duration storage
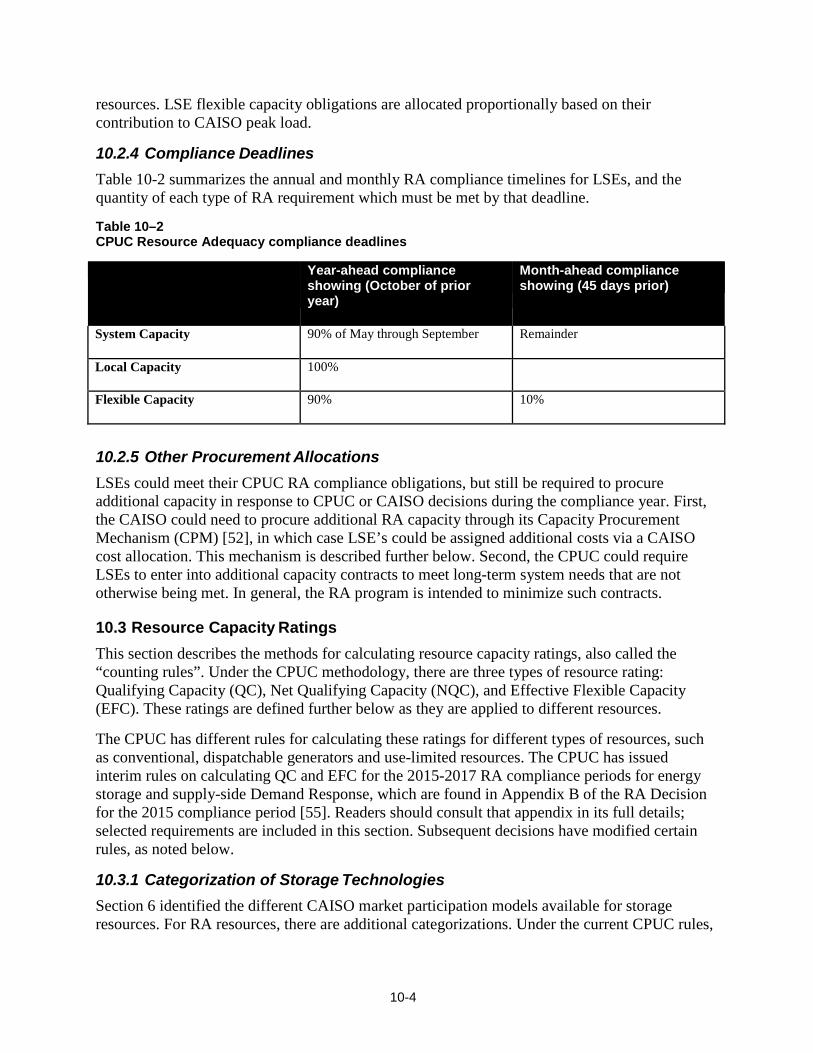
10-4
resources. LSE flexible capacity obligations are allocated proportionally based on their contribution to CAISO peak load.
10.2.4 Compliance Deadlines Table 10-2 summarizes the annual and monthly RA compliance timelines for LSEs, and the quantity of each type of RA requirement which must be met by that deadline.
Table 10–2 CPUC Resource Adequacy compliance deadlines
Year-ahead compliance
showing (October of prior year)
Month-ahead compliance showing (45 days prior)
System Capacity 90% of May through September Remainder
Local Capacity 100%
Flexible Capacity 90% 10%
10.2.5 Other Procurement Allocations LSEs could meet their CPUC RA compliance obligations, but still be required to procure additional capacity in response to CPUC or CAISO decisions during the compliance year. First, the CAISO could need to procure additional RA capacity through its Capacity Procurement Mechanism (CPM) [52], in which case LSE’s could be assigned additional costs via a CAISO cost allocation. This mechanism is described further below. Second, the CPUC could require LSEs to enter into additional capacity contracts to meet long-term system needs that are not otherwise being met. In general, the RA program is intended to minimize such contracts.
10.3 Resource Capacity Ratings This section describes the methods for calculating resource capacity ratings, also called the “counting rules”. Under the CPUC methodology, there are three types of resource rating: Qualifying Capacity (QC), Net Qualifying Capacity (NQC), and Effective Flexible Capacity (EFC). These ratings are defined further below as they are applied to different resources.
The CPUC has different rules for calculating these ratings for different types of resources, such as conventional, dispatchable generators and use-limited resources. The CPUC has issued interim rules on calculating QC and EFC for the 2015-2017 RA compliance periods for energy storage and supply-side Demand Response, which are found in Appendix B of the RA Decision for the 2015 compliance period [55]. Readers should consult that appendix in its full details; selected requirements are included in this section. Subsequent decisions have modified certain rules, as noted below.
10.3.1 Categorization of Storage Technologies Section 6 identified the different CAISO market participation models available for storage resources. For RA resources, there are additional categorizations. Under the current CPUC rules,

10-5
most storage resources are classified as “Use-limited resources.” These are defined as follows ( [56] section 7.6):
Use-limited resources can be classified as resources that can run in all or most hours, but are limited in the total starts or hours they can run; or resources that cannot offer in certain hours (excluding outages). This includes but is not limited to, thermal units limited by starts or emissions, demand response, hydro resources, storage, and variable energy resources (“VERs”).
The next subsections define the requirements for use-limited resources as capacity resources. In the CAISO RA requirements [52], the use-limited resource is also defined, but in addition there are definitions of NGR obligations, which may not have use-limitations but are energy-limited and require specific charging schedules for availability.
10.3.2 Qualifying Capacity Qualifying capacity (QC) is the CPUC term for the MW rating for the RA resource capacity rating (also sometimes called the capacity value), based on the technological and production characteristics of the resource and other relevant factors (such as resource penetration for solar and wind). The QC is represented either as a percentage of the resource’s rated maximum power output, or as a simple MW number [57]. Aggregated resources can also be eligible for a QC, depending on their characteristics and location.
10.3.2.1 Storage Resources The local and system QC of stand-alone storage resources is the maximum power output (PmaxRA) which can be sustained for at least four (4) consecutive hours, and which is available for at least three consecutive days. For types of use-limited resources, the SC submits a use plan which establishes the unit’s availability, which can include a daily energy limit so that the CAISO schedules the unit during the hours of highest value.
For example, if a Storage resource has a Pmax = 40 MW and 4 hours duration at full power, then its PmaxRA = 40 MW. If a Storage resource has a Pmax = 40 MW and 2 hours duration, then its PmaxRA = 20 MW.
Energy storage resources located within a single sub-load aggregation point (Sub-LAP) may be aggregated to form a single, RA-eligible storage resource.
Co-located storage which is integrated into a larger RA eligible resource does not have to meet the requirements of stand-alone storage, but can be factored into the RA rating of the larger resource.
When using StorageVET, the capacity rating of a resource and its assumed charging and discharging schedule to comply with RA obligations would be established as a specification in the model. Further details are provided below.
10.3.2.2 Supply-Side Demand Response Similarly to storage, the local and system QC of Demand Response (DR) resources is the maximum power output (PmaxRA) which can be sustained for at least four (4) consecutive hours, and which is available for at least three consecutive days.

10-6
As discussed in section 7, DR resources located within a single Sub-LAP may be aggregated to form a single, RA-eligible DR resource. The CPUC provides the following example of DR aggregation, between two resources with different availability ([58] p. B-4):
For example, a demand response provider may aggregate one resource that provides up to 1 MW for up to two hours and is available between the hours of 1 and 4 pm with another resource that is able to provide up to 1 MW for up to two hours and is available between the hours of 3 and 6 pm, in order to create an aggregated resource that is able to provide up to 1 MW for up to four hours and is available between the hours of 1 and 6 pm.
10.3.3 Effective Flexible Capacity (EFC) Effective Flexible Capacity (EFC) is the CPUC and CAISO’s capacity rating for resources providing flexible capacity. As noted above, the EFC is a MW rating based on the qualified performance of the type of resource in supporting the CAISO system net load ramps.
The CPUC has established interim rules for the EFC of storage and DR resources [55]. The methodology distinguishes between resources that are “bi-directional”, i.e., can charge and discharge, and those that are restricted to only charging or discharging. Some key characteristics are shown in Table 10-3. All resource types are measured by their capability to ramp over a three hour period. A bidirectional device rated as 1 MW with 1.5 hours duration, would get an EFC = 1 MW, since it can charge and discharge for total of 3 hours at 1 MW. A resource restricted to one direction would get the rating which it could sustain in that direction. The CAISO tariff and Reliability BPM include these rules with some modifications. First, the CAISO tariff does not include a transition time between charging and discharging by a bidirectional resource, while the CPUC allows 45 minutes. Second, for REM resources, the EFC is “the resource’s 15-minute energy output capability” (Tariff section 40.10.4.1). This is currently a one-directional rating, since the device is only given an EFC based on energy output.
Table 10–3 CPUC and CAISO flexible capacity ratings for storage
CPUC CAISO tariff
Minimum continuous energy requirement for ramping
3 hours Base Ramping – 6 hours, Peak Ramping and Super-Peak Ramping – 3 hours
Maximum transition time between charging and discharging
45 minutes instantaneous
Maximum eligible capacity – non REM Maximum output range achieved over 3 hours
Maximum eligible capacity – REM Maximum output for 15 minutes
For analysis using StorageVET, the EFC of the storage device being modeled would be determined based on its attributes before conducting dispatch analysis. Bidding and scheduling obligations and modeling options are discussed further below.

10-7
10.3.4 Net Qualifying Capacity The net qualifying capacity (NQC) is the adjusted capacity (MW) which is determined to be deliverable to aggregate or local CAISO load [57]. This comes in several types:
• Full Capacity Deliverability Status: the resource receives 100% of their QC as NQC. • Partial Deliverability Status: the resource has a specific MW limit that is between 0 and
100% deliverable. • Interim Deliverability Status: the resource is either fully or partially deliverable, but only
temporarily and contingent on other developments such as other generators that will consume deliverability or other transmission that will create additional deliverability.
• Energy-Only Deliverability: the resource is rated as 0% deliverable, and hence is considered an “energy-only” resource with no capacity rating or value.
For each year, the CAISO NQC List is posted under “Current Net Qualifying Capacity (NQC)” on the CAISO website [59] as well as on the CPUC website [60].
For any resource, the deliverability status thus determines the capacity of the resource which is eligible for RA capacity credits.
The StorageVET user could evaluate the obligations of the storage resource as a capacity resource using the NQC, if that is less than the QC. The storage owner only has to meet capacity resource obligations with the rated NQC capacity and could use the remaining capacity, if any, for unrestricted participation in the wholesale markets.
10.3.5 Obligations and Compliance by RA Resources This section reviews the obligations of RA resources in the CAISO markets, as well as incentives for operating in certain hours and penalties in the event of non-compliance. This section also explains how these rules can be represented or interpreted within the StorageVET model. The CAISO rules are found in Tariff Section 37.2.4 on “Resource Adequacy Availability” [42] and in the Reliability BPM [52]. In addition, they are discussed in relevant recent FERC orders [61].
10.3.5.1 Bidding and Scheduling Obligations A RA resource must either be offered or self-scheduled into the CAISO IFM energy markets and, depending on the resource type, also the RUC ([52] sec. 7). Capacity selected in the IFM or RUC must be available in the RTM (i.e., cannot withdraw after the IFM). Actual performance is subject to specified availability standards, penalties, and incentives.
StorageVET is structured as a price-taker model, which means that unless additional constraints are added (or the model is operated with inputs to reflect uncertainty), storage resources are essentially modeled as always available, but only operated when market revenues are positive given a set of prices, which could mean that the storage device does not operate on any particular day (unless forced through additional constraints in the model). This is similar to the obligations to conventional RA generators, which are not required to run unless committed and dispatched through economic bids, but are required to be available unless on an approved outage.
Through its scheduling constraints, StorageVET could be used to evaluate alternative revenues if the plant was operated more conservatively with respect to some subset of reliability hours. For

10-8
example, the user can specify that the resource is charged sufficiently and availability in a defined set of hours, or that the resource is forced to discharge in those hours. Definitions of possible hours are provided below.
Table 10-4 summarizes the bidding requirements for system and local RA capacity resources which are use-limited. Table 10-5 summarizes the bidding requirements for flexible capacity resources which are use-limited or NGRs. These tables are directly excerpted from the Reliability BPM [52], Section 7.
Table 10–4 Summary of bidding requirements for system and local RA capacity resources with storage
Bidding Requirements
Resource Type
Non-Hydro and Dispatchable Use-Limited Resources
Economic Bids or Self- Schedules are to be submitted for all RA Capacity for all hours unit is capable of operating consistent with the use- limitations described in unit’s Use-Plan. RA Capacity from Eligible Intermittent Resources is not required to be offered into the DAM. ISO Tariff Sections 40.6.4.3.1, 40.6.4.3.4.
$0/MW RUC Availability Bids are to be submitted for all RA capacity for all hours unit is capable of operating consistent with the use-limitations described in unit’s Use- Plan. RA Capacity from Eligible Intermittent Resources is not required to be offered into the DAM. ISO Tariff Sections 40.6.4.3.1.
Economic Bids or Self- Schedules are to be submitted for any remaining RA Capacity from resources scheduled in IFM or RUC, consistent with the use-limitations described in unit’s Use- Plan. Energy Bids or Self- Schedules are to be submitted for all RA Capacity from Short-Start Units not scheduled in IFM, consistent with the use-limitations described in unit’s Use-Plan ISO Tariff Sections 40.6.2, 40.6.3, 40.6.4.3.1.
No
Hydro, Pumping Load, and Non- Dispatchable Use-Limited Resources
Economic Bids or Self- Schedules are to be submitted for RA Capacity that the market participant expects to be available Plan ISO Tariff Sections 40.6.4.3.2.
No RUC Availability Bids required ISO Tariff Sections 40.6.4.3.2.
Economic Bids or Self- Schedules are to be submitted for RA Capacity that the market participant expects to be available ISO Tariff Sections 40.6.4.3.2.
No
Table 10–5 Summary of bidding requirements for flexible RA capacity resources
Resource Type
Bidding Requirements
IFM RUC RTM ISO Inserts Required Bids

10-9
Use-Limited Resources
Submit Economic Bids for Energy for the full Flexible RA Capacity MW. Submit Economic Bids for Ancillary Services that are not flagged as Contingency Only for the full Flexible RA Capacity MW certified to provide Ancillary Services. Where Economic Bids are required, resource must submit in at least the required hours for the resource’s committed Flexible RA Capacity categories.
ISO Tariff Sections 40.10.6.1(a) & 40.10.6.1(f)(1)
Consistent with its use- limitations.
ISO Tariff Section 40.10.6.1(e)
Participation of all available flexible RA capacity resources is required. ISO will optimize using $0/MW-hour RUC Availability Bids for all Flexible RA Capacity that is not reflected in an IFM Schedule in only the required hours for the resource’s committed Flexible RA Capacity categories.
ISO Tariff Sections 40.10.6.1(a) & 40.10.6.1(f)(1)
Consistent with its use-limitations.
ISO Tariff Section 40.10.6.1(e)
Consistent with its use limitations: Submit Economic Bids for Energy for the full Flexible RA Capacity MW. Where Economic Bids are required, resource must submit bids for the Trading Hours that it is capable of being economically dispatched.
ISO Tariff Sections 40.10.6.1(e)
IFM: No RUC: Optimized at $0/MW-hour RTM: No
Non- Generator Resources
For resources not flagged as REM: Submit Economic Bids for Energy (includes positive and negative generation) for the full Flexible RA Capacity MW. Submit Economic Bids for Ancillary Services that are not flagged as Contingency Only for the full Flexible RA Capacity MW certified to provide Ancillary Services. Where Economic Bids are required, resource must submit in at least the required hours for the resource’s committed Flexible RA Capacity categories. For resources flagged as REM: Submit Economic Bids for regulation up and down that are not flagged as Contingency Only for the full Flexible RA Capacity MW certified to provide Ancillary Services.
ISO will optimize using $0/MW-hour RUC Availability Bids for all Flexible RA Capacity that is not reflected in an IFM Schedule in only the required hours for the resource’s committed Flexible RA Capacity categories.
ISO Tariff Sections 40.10.6.1(a) & 40.10.6.1(f)(1)
REM: Must submit Bids for Regulation Up and Regulation Down from 05:00 to 22:00 seven days a week. Shall not submit Bids for Energy or other Ancillary Services.
IFM: No RUC: Optimized using $0/MW- hour RTM: No

10-10
10.3.5.2 Local and System RA Capacity Availability For each RA compliance year, the CAISO identifies Resource Adequacy Availability Incentive Mechanism (RAAIM) assessment hours for each month which are applicable for evaluating the performance of all types of RA capacity, and providing incentives and penalties for performance. These hours are defined as:
a pre-defined set of five consecutive hours for each month that –
(A) correspond to the operating periods when high demand conditions typically occur and when the availability of Resource Adequacy Capacity is most critical to maintaining system reliability:
(B) vary by season as necessary so that the coincident peak load hour typically falls within the five-hour range each day during the month, based on historical actual load data; and
(C) apply to each Trading Day that is a weekday and not a federal holiday.
Table 10-6 shows the current RAAIM assessment Hours, excerpted from [52] p. 121.
Table 10–6 Availability assessment hours starting in compliance year 2010
Month Hour Ending Exclusions
January – March November – December
HE 17 - 21
Saturday, Sunday and federal holidays
April – October HE 14 - 18
As noted, the obligation of RA resources is to be available during these hours according to the rules discussed above.
10.3.5.3 Flexible Capacity Availability Table 10-7 shows the required bidding hours for flexible capacity resources. As with system and local capacity resources, StorageVET users can either allow the model to optimally dispatch a flexible capacity resource for energy and ancillary services, or specify that the model reserve capacity to meet these availability hours, or force dispatch of the resource in particular pre-set hours corresponding to high net load ramps.
Table 10–7 Flexible capacity required bidding hours
Flexible RA Capacity Type
Category Designation
Required Bidding Hours
Required Bidding Days
January – April October – December Base Ramping Category 1 05:00 to 22:00 All days Peak Ramping Category 2 15:00 to 20:00 All days Super-Peak Ramping Category 3 15:00 to 20:00 Non-Holiday Weekdays* May – September Base Ramping Category 1 05:00 to 22:00 All days

10-11
Peak Ramping Category 2 07:00 to 12:00 All days Super-Peak Ramping Category 3 07:00 to 12:00 Non-Holiday Weekdays* Source: [52] pg. 108.
10.3.5.4 Availability Standard, Penalties, and Incentive Payments The CAISO sets a standard for availability and offers an incentive payment for RA capacity which exceeds that standard and Non-Availability Charges (penalties) for resources which do not perform to this standard. The current Availability Standard is 96.5% for each month, with a bandwidth of ± 2 percent.
For the capacity of resources which exceed the standard, the CAISO offers an incentive payment which is share of a fund accumulated from Non-Availability Charges from resources which perform below this standard.
Storage resources may offer higher availability and better operational performance than conventional generators. As with other payments and penalties which are dependent on actual behavior, this incentive payment cannot be represented directly in StorageVET, but could be evaluated qualitatively or quantitatively externally to the model based on available market data.
10.4 CAISO Capacity Procurement Mechanism The CAISO CPM procures “backstop” capacity considered to be needed for operational and reliability purposes in addition to the RA resources provided by the LSEs. The CAISO procures potential CPM capacity from non-RA resources in a competitive solicitation process which runs annually, monthly and intra-monthly.
Because there is no centralized capacity market in the CAISO footprint, the CPM prices may be used by market valuation analysts as an indicator of the maximum price for existing capacity.
There is a “soft cap” to the CPM price which is published in the CAISO tariff, and is currently $75.68/kW-year. The CAISO will publish the prices for any CPM capacity procured through the competitive solicitation. However, as discussed above, RA procurement by LSEs has historically taken place on average at lower than the CPM floor price. Hence, the CPM price is at best an upper bound on the bilateral capacity price.


11-1
11 WHOLESALE MARKET PRICES, FINANCIAL SETTLEMENTS, AND PRICE FORECASTS StorageVET can utilize historical prices from the wholesale markets, system lambdas or other internal utility dispatch costs, bilateral market prices, and forecast prices from simulations of future market and power system conditions. This section focuses on the CAISO and EIM markets. Each CAISO and EIM market product has a market clearing price which is paid to all scheduled resources and bid-in resources which clear the market in each day-ahead and real-time market trading interval. Resources may also be eligible for additional bid costs not necessarily covered through market payments, such as start-up costs, which are recovered through Bid Cost Recovery (BCR) or uplift payments. Market participants may also face penalties for non- performance, which are deducted from market revenues. Several of these characteristics are summarized in Table 11-1.
Financial settlement refers to the complete set of charges to buyers and payments to sellers which participate in the CAISO markets. For capacity payments under the CPUC’s RA program, there are also estimates of bilateral resource adequacy capacity costs, as well as of the net cost of new resources for long-term capacity valuation.
This section examines most of these components and explains which are inputs to StorageVET and which would be external calculations. This section is organized as follows:
Section 11.2 – Energy market prices, settlements and forecasts;
Section 11.3 – Flexible Ramping Product prices and settlements;
Section 11.4 – Ancillary service market prices, settlements and forecasts;
Section 11.5 – CAISO uplift costs and impact of storage;
Section 11.7 – Congestion Revenue Right (CRR) prices and settlements;
Section 11.8 – Resource Adequacy capacity prices and long-term valuation.
The CAISO makes available historical market clearing prices for energy and ancillary services at all pricing locations. These prices are found on the CAISO OASIS website, as described further in section 1.
Table 11–1 Key characteristics of CAISO market and Resource Adequacy pricing and performance requirements
Market products
Markets Market pricing interval
Market pricing aggregation
Product components with prices
Performance requirements
Energy
IFM 60 min. LMP, DLAP, SLAP
Energy None
RTM – FMM 15 min. LMP, DLAP, Energy Response to

11-2
SLAP dispatch instructions
RTM –RTED 5 min. LMP, DLAP, SLAP
Energy Response to dispatch instructions
RUC Availability Capacity
RUC 60 min. RUC LMP Reserved Capacity
Response to dispatch instructions
Flexible Ramping Product
RTM - FMM 15 min. System (Balancing Area)
Energy and Reserved Capacity
Response to dispatch instructions
RTM –RTED 5 min. System (Balancing Area)
Energy and Reserved Capacity
Response to dispatch instructions
Spinning Reserves
IFM 60 min. AS region Reserved Capacity and dispatched Energy
Response to dispatch instructions; Rescission of payments for failure to perform
RTM 60 min. AS region Reserved Capacity and dispatched Energy
Non-Spinning Reserves
IFM 60 min. AS region Reserved Capacity and dispatched Energy
Response to dispatch instructions; Rescission of payments for failure to perform
RTM
60 min.
AS region
Reserved Capacity and dispatched Energy
Regulation Up IFM 60 min. AS region Reserved Capacity and Regulation Mileage
Capability to meet awarded range; Rescission of payments for failure to perform
RTM 60 min. AS region Regulation Down
IFM 60 min. AS region RTM 60 min. AS region
CPUC Resource Adequacy Capacity
System Monthly Resource- specific
Capacity Availability Assessment Local Annual Resource-
specific Capacity
Flexible Monthly Resource- specific
Capacity
11.1 CAISO OASIS Website and Data All historical CAISO wholesale price data is available on the CAISO OASIS website. OASIS originally was an acronym for “Open Access Same-Time Information System,” and was included as a requirement for open access transmission providers in FERC Orders 888 and 889. Not all the ISOs and RTOs continue to use this term, which refers to the web-based portal for a range of market and system data.
The CAISO OASIS website is located here: http://oasis.caiso.com/mrioasis/logon.do. Documentation for using OASIS is in that website, or in other CAISO manuals.

11-3
11.2 Energy Market Prices This section begins with a description of the locational energy pricing in the CAISO markets and the EIM. The first subsections provide the formulations of the market prices, while the subsequent sections are examples of actual prices with illustrations of the characteristics relevant to storage valuation.
11.2.1 Pricing Nodes Pricing Nodes (PNodes) are the defined locations on the CAISO grid where market clearing prices for energy and ancillary services are calculated. There are over 3000 PNodes in the CAISO footprint along with additional nodes in the EIM utility regions. Aggregated Pricing Nodes (APNodes) are aggregations of Pricing Nodes, as defined by the CAISO. These are discussed further below.
11.2.2 Locational Marginal Prices Locational marginal prices (LMP) are the market clearing prices for Energy at each PNode or APNode. LMPs are formed by clearing supply and demand for Energy, while also meeting ancillary service requirements and subject to all constraints in the CAISO Full Network Model. The equation for each LMP is shown below. It includes the Marginal Cost of Energy (MCE), a Marginal Cost of Congestion (MCC), and a Marginal Cost of Losses (MCL); the index n indicates pricing node:
LMPn = MCE + MCCn + MCLn .
Each of these components is calculated for each settlement interval in the IFM and RTM. Detailed description of how these components are calculated can be found in [44], section 3.2. Note that the market clearing procedures in the IFM and RTM are different, as discussed in section 7.
11.2.2.1 System Marginal Cost of Energy The System Marginal Cost of Energy (SMCE or MCE) is the component of the LMP that reflects the marginal cost of providing Energy from a CAISO-designated reference location.
The MCE is always positive when marginal generation bid costs are positive, and is adjusted by the MCE and MCL to determine the final nodal LMP. If marginal generation bid costs are negative, the MCE will also be negative.
11.2.2.2 Marginal Cost of Congestion The MCC reflects the effect of the marginal congestion cost on the LMP. When a transmission element is congested, the auction algorithm calculates a Shadow Price on that element, which is the cost of increasing an increment of load on the power system given that no additional power can be delivered over that element. The transmission shadow prices (which are also available on the OASIS website) are then allocated to particular pricing nodes through the use of “shift factors”.
As a price-taker model, StorageVET does not provide insight into the impact of storage entry on MCCs at the locations where the storage is located.

11-4
11.2.2.3 Marginal Cost of Losses The Marginal Cost of Losses (MCL) is the LMP component which represents the cost to suppliers of marginal losses at the PNode, as measured between the CNode and the distributed Load reference. The MCL = SMEC × Marginal Loss Factor, which is calculated by the optimization engine. As a price-taker model, StorageVET generally does not provide insight into the impact of storage entry on MCLs.
For illustration purposes, Figures 11-1 and 11-2 show the IFM LMPs, including the MCCs and MCLs, at the JOHANNA_2_001 PNode in the SCE footprint on April 10 and May 10, 2016. The MCCs are graphed in the purple line on the right hand horizontal axis, and are measured between about $0/MWh and $5/MWh. The MCLs are the blue line measured on the right horizontal axis, and vary between slightly negative and about $1.25/MWh.
Figure 11–1 SCE IFM LMPs JOHANNA_2_001 PNODE, April 10, 2016
40
35
30
25
20
15
10
-1 1 2 3 4 5 6 7 8 9 10 11 12 13 14 15 16 17 18 19 20 21 22 23 24
LMP MCC MCL
$/M
Wh
- LM
P
$/M
Wh
- MCC
and
MCL

11-5
Figure 11–2 SCE IFM LMPs JOHANNA_2_001 PNODE, May 10, 2016
11.2.3 LMP Aggregations As noted, the CAISO calculates aggregated LMPs for defined sub-regions of the CAISO system. These aggregations may be useful for calculating energy value over a larger region prior to identifying which LMPs correspond to where the storage project might be located.
11.2.3.1 Load Aggregation Points (LAP) Load Aggregation Points (LAPs) are load-weighted average LMPs defined over the service territories of the IOUs. LAPs are used for financial settlement of most non-price-responsive loads and the withdrawal points in CRRs in the sub-regions.
Default LAPs (DLAPs) correspond to the full service territories of the large IOUs. There are 3 DLAPs.
Sub-LAPs (SLAPs) are subregions within the DLAPs which historically had similar LMPs and also corresponded to other operational and transmission constraints. SLAPs have two primary purposes: (1) to support aggregation of DR and DERs (each aggregation must be located within one SLAP); and (2) to allow for more granular awards of CRRs. There are currently 23 SLAPs: 16 in the PG&E DLAP, 6 in the SCE DLAP, and 1 in the SDG&E LAP.
CAISO is currently evaluating the SLAP boundaries to allow for better alignment with Local Capacity Areas (LCAs) and new SLAP locations will go into effect in 2017. These may be
60 3.5
50
40 2.5
30
1.5
20 0.5
10
-0.5 1 2 3 4 5 6 7 8 9 10 11 12 13 14 15 16 17 18 19 20 21 22 23 24
LMP MCC MCL
$/M
Wh
- LM
P
$/M
Wh
- MCC
and
MCL
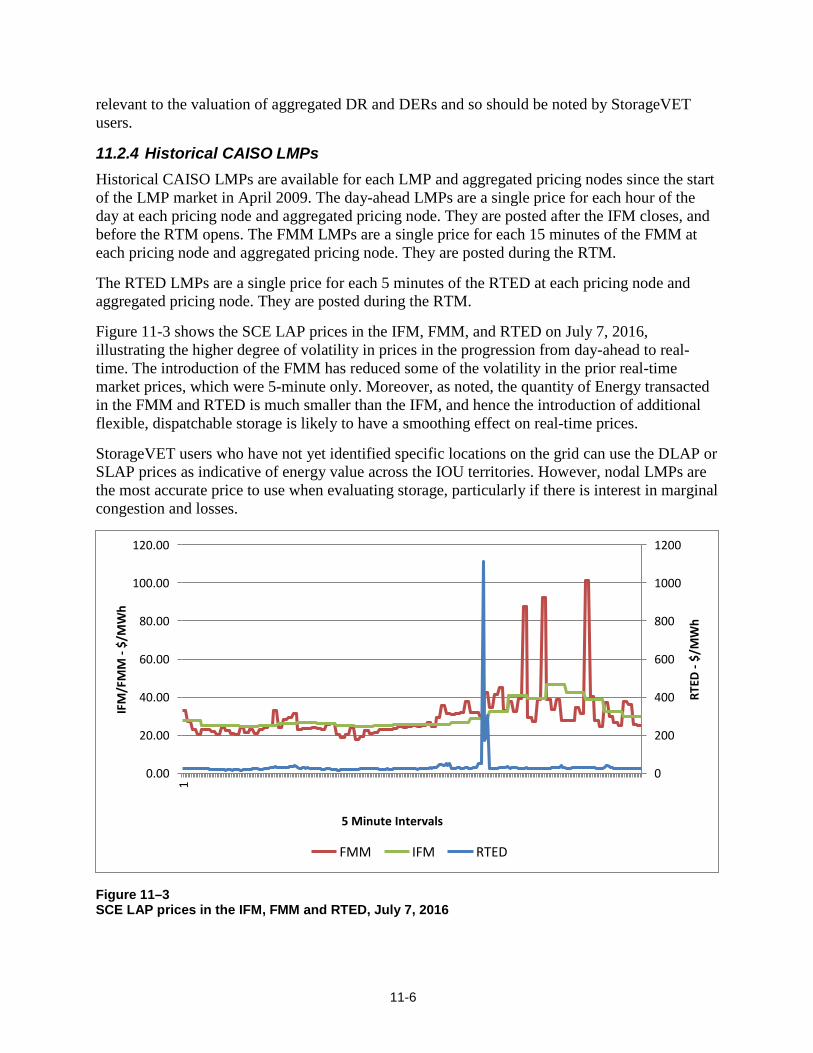
11-6
relevant to the valuation of aggregated DR and DERs and so should be noted by StorageVET users.
11.2.4 Historical CAISO LMPs Historical CAISO LMPs are available for each LMP and aggregated pricing nodes since the start of the LMP market in April 2009. The day-ahead LMPs are a single price for each hour of the day at each pricing node and aggregated pricing node. They are posted after the IFM closes, and before the RTM opens. The FMM LMPs are a single price for each 15 minutes of the FMM at each pricing node and aggregated pricing node. They are posted during the RTM.
The RTED LMPs are a single price for each 5 minutes of the RTED at each pricing node and aggregated pricing node. They are posted during the RTM.
Figure 11-3 shows the SCE LAP prices in the IFM, FMM, and RTED on July 7, 2016, illustrating the higher degree of volatility in prices in the progression from day-ahead to real- time. The introduction of the FMM has reduced some of the volatility in the prior real-time market prices, which were 5-minute only. Moreover, as noted, the quantity of Energy transacted in the FMM and RTED is much smaller than the IFM, and hence the introduction of additional flexible, dispatchable storage is likely to have a smoothing effect on real-time prices.
StorageVET users who have not yet identified specific locations on the grid can use the DLAP or SLAP prices as indicative of energy value across the IOU territories. However, nodal LMPs are the most accurate price to use when evaluating storage, particularly if there is interest in marginal congestion and losses.
Figure 11–3 SCE LAP prices in the IFM, FMM and RTED, July 7, 2016
120.00 1200
100.00 1000
80.00 800
60.00 600
40.00 400
20.00 200
0.00
5 Minute Intervals
FMM IFM RTED
IFM
/FM
M -
$/M
Wh
1
RTED
- $/
MW
h

11-7
11.2.5 Historical EIM LMPs As noted in section 3.2.3, the EIM is a real-time market for Energy only, which calculates binding FMM and 5-minute LMPs using similar operational procedures and optimization methods to the CAISO RTM. EIM LMPs are available on the CAISO OASIS website for each market interval from the start of each EIM utility’s participation.
11.2.6 Forward Price Curves for Energy Forward prices for Energy are forecasted prices, usually on an hourly time-step, for future periods. They are derived from different types of models, including statistical models based on forecasts of fuel costs and correlations between factors which historically have formed market prices, and various types of structural models, such as production cost models.
StorageVET will include some forward Energy price curves for calculation of storage value over multi-year time-frames. Users can also upload price curves from commercial, research or public tools made available for other purposes.
Figure 11-4 graphs two CAISO region price curves included in StorageVET: average hourly historical SCE LAP prices in the IFM from 2015, and the analogous prices from a production cost simulation of that region in 2030 under a 50% RPS assumption9. The 2030 prices assumes a minimum of a -$50/MWh price during overgeneration conditions, which, when averaged with the higher simulated prices during those periods, result in the average prices in hours ending 11:00 to 13:00 of around -$11/MWh to -$14/MWh shown in the figure.
9 50% RPS energy price curve was generated by E3 REFLEX model; other, similar price curves are available through CPUC LTPP scenarios
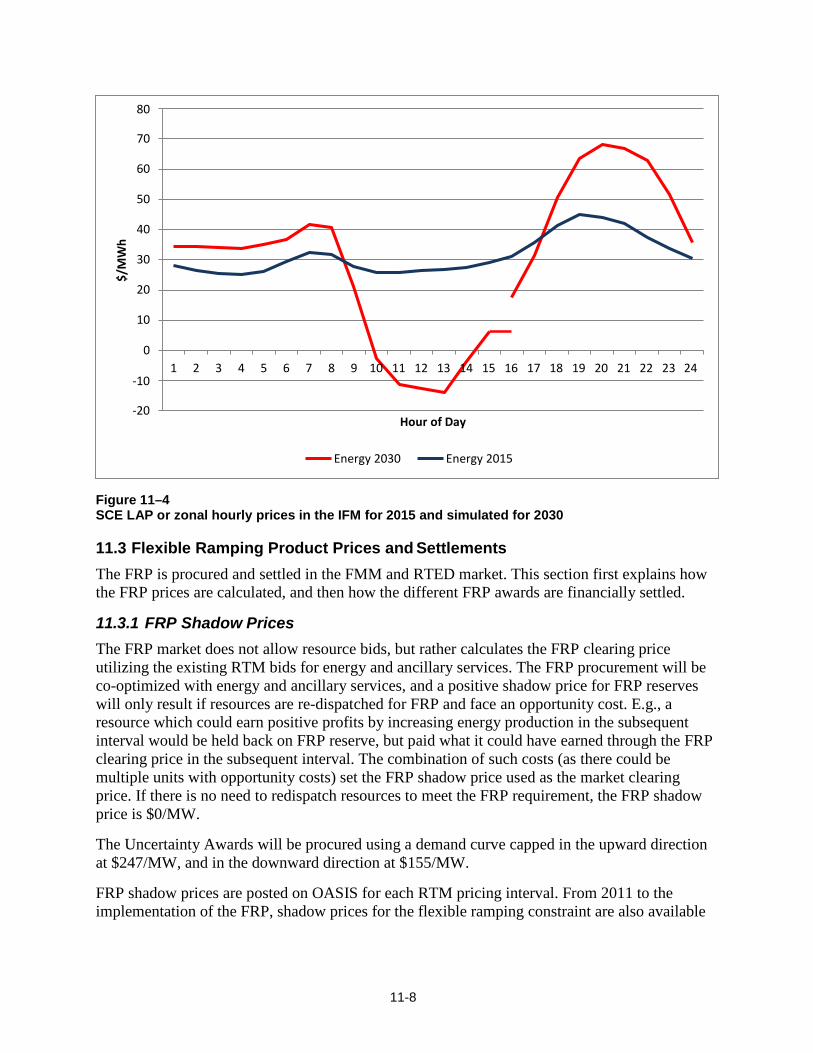
11-8
Figure 11–4 SCE LAP or zonal hourly prices in the IFM for 2015 and simulated for 2030
11.3 Flexible Ramping Product Prices and Settlements The FRP is procured and settled in the FMM and RTED market. This section first explains how the FRP prices are calculated, and then how the different FRP awards are financially settled.
11.3.1 FRP Shadow Prices The FRP market does not allow resource bids, but rather calculates the FRP clearing price utilizing the existing RTM bids for energy and ancillary services. The FRP procurement will be co-optimized with energy and ancillary services, and a positive shadow price for FRP reserves will only result if resources are re-dispatched for FRP and face an opportunity cost. E.g., a resource which could earn positive profits by increasing energy production in the subsequent interval would be held back on FRP reserve, but paid what it could have earned through the FRP clearing price in the subsequent interval. The combination of such costs (as there could be multiple units with opportunity costs) set the FRP shadow price used as the market clearing price. If there is no need to redispatch resources to meet the FRP requirement, the FRP shadow price is $0/MW.
The Uncertainty Awards will be procured using a demand curve capped in the upward direction at $247/MW, and in the downward direction at $155/MW.
FRP shadow prices are posted on OASIS for each RTM pricing interval. From 2011 to the implementation of the FRP, shadow prices for the flexible ramping constraint are also available
80 70 60 50 40 30 20 10
1 2 3 4 5 6 7 8 9 10 11 12 13 14 15 16 17 18 19 20 21 22 23 24
-10 -20
Hour of Day
Energy 2030 Energy 2015
$/M
Wh

11-9
on OASIS. Figure 11-5 shows the flexible ramping constraint up shadow prices on October 26, 2016. All flexible ramping constraint down prices on that day had zero shadow prices.
Figure 11–5 CAISO Flexible Ramping Constraint Up FMM shadow prices, October 26, 2016
11.3.2 Settlement of Forecasted Movement Forecasted Movement will be settled in the FMM at the FMM FRP price, in addition to FMM LMP settlements. Any difference between FRP procured for the FMM forecasted movement and the RTD forecasted movement will be settled at the RTD FRP price.
The CAISO will settle FRP for Forecasted Movement on the same intervals as LMPs, as will StorageVET. Note that in StorageVET, the FRP payment for Forecast Movement will be calculated in post-processing, using the Energy dispatch solution. That is, StorageVET will calculate the FRP reserve and the LMP dispatch, and then also pay resources for movement at the FRP price.
11.3.3 Settlement of Uncertainty Awards Similarly to Forecasted Movement, Uncertainty Awards are paid the FRP price for the applicable interval. StorageVET will “settle” uncertainty awards within the optimization.
The CAISO will settle FRP for Uncertainty Awards at the end of each month through an uplift allocated to load, supply, and intertie resources which are causing the need for FRP. The end of the month payment is largely because of the complex cost allocation.
70
60
50
40
30
20
10
Fifteen Minute Market intervals
$/M
W
0:15
1:
00
1:45
2:
30
3:15
4:
00
4:45
5:
30
6:15
7:
00
7:45
8:
30
9:15
10
:00
10:4
5 11
:30
12:1
5 13
:00
13:4
5 14
:30
15:1
5 16
:00
16:4
5 17
:30
18:1
5 19
:00
19:4
5 20
:30
21:1
5 22
:00
22:4
5 23
30

11-10
11.3.4 Adjustments to Market Payments A resource could both obtain a financial settlement of LMP and a FRP payment in an interval when following CAISO dispatch instructions, but then also increase revenues by increasing output through its own operations (“uninstructed”) if its bid costs are below the LMP. If there is such overlap, the CAISO will rescind the FRP award at the FRP RTED clearing price. StorageVET does not evaluate such instances.
11.4 Ancillary Service Prices and Charges Historical CAISO ancillary service prices are available for each ancillary service subregion (see section 9) since the start of the redesigned market in April 2009. Although prices from prior years are no longer available on OASIS, the average prices can be seen in prior state of the market reports.
The CAISO pays all resources providing Ancillary Services in its markets the market-clearing price plus any additional payments need for performance or for the bid sufficiency guarantee. The CAISO assigns Scheduling Coordinators a share of the costs in procuring ancillary services based on load-ratio share.
11.4.1 Ancillary Service Market Clearing Prices The CAISO calculates a single Ancillary Service Marginal Price (ASMP) for each ancillary service region. The price paid to resources at particular PNodes in that region is the sum of the ASMPs for each nested region. The methods for calculating the ASMP for each particular service are explained further in [44] p. 115. To ensure that the right ancillary service prices are used in StorageVET, the user has to manually sum the values for the relevant RASSPs.
A subset of ASMPs are scarcity prices, which are used when the CAISO power system experiences reserve shortages. In those intervals, supplier bids no longer set the market clearing prices, which are set instead using the scarcity reserve demand curve values; see Exhibit 4-5 in [44]). The CAISO identifies which pricing intervals are set by the scarcity reserve demand curve.
11.4.2 Ancillary Service Imports Ancillary Services can be provided by resources external to the CAISO, but settlement of market payments also reflects congestion costs. In this case, because the import is associated with a particular transmission element, the CAISO uses the Shadow Prices at the Scheduling Points to calculate congestion charges to ancillary service imports. ([44], Section3.1.5)
11.4.3 Historical Regulation Prices The CAISO has operated a Regulation market since 1998. The market underwent major redesigns in April 2009, with the introduction of day-ahead co-optimization of energy and ancillary services, and in 2013, with the addition of mileage pricing. Regulation Up prices are generally closely correlated with energy prices and both up and down prices are also related to the quantity of Regulation procured, which can vary by hour due to operational conditions.
11.4.3.1 Regulation Capacity Prices Regulation capacity prices are posted for each hour of the IFM and for each hour of the RTM (i.e., Regulation prices are not available for subhourly intervals). Figure 11-6 shows the annual

11-11
average Regulation capacity price for the period 2008-2015. Figure 11-7 shows the average hourly Regulation capacity prices in 2014, which reflects the correlation between the Regulation Up price and the hourly energy prices, due to the opportunity cost calculation. Figure 11-8 shows the Regulation Up average hourly capacity prices in 2015 (along with simulated prices in 2030).
11.4.3.2 Regulation Mileage Prices Regulation Up and Regulation Down Mileage Prices are posted for each hour of the IFM and each hour of the RTM. These prices are available only for the Expanded System Region (see section 9); that is, resources located in all subregions are paid the same price. Historically, mileage prices have been fairly low, well under $1/MW on average, and are highly volatile. For illustration, Figure 11–8 shows the hourly mileage prices in the IFM on February 1-3, 2016.
Figure 11–6 Average CAISO day-ahead regulation capacity clearing prices, 2008-2015
20 18 16 14 12 10
2008 2009 2010 2011 2012 2013 2014 2015
Regulation Up Regulation Down
$/M
W

11-12
Figure 11–7 Average CAISO hourly day-ahead Regulation clearing prices, 2014
Figure 11–8
18 16 14 12 10
1 2 3 4 5 6 7 8 9 10 11 12 13 14 15 16 17 18 19 20 21 22 23 24
Hour of Day
Reg Up Reg Down
2.5
1.5
0.5
12 18 24 12
Hour of Day 18 24 12 18 24
Regulation Mileage Up Regulation Mileage Down
$/M
W
$/M
W

11-13
CAISO Regulation Mileage prices, February 1-3, 2016
11.4.4 Settlement of Energy Provided or Consumed on Regulation When generators, including pumped storage generation, provide Regulation, the CAISO dispatches the resources around a dispatch operating point, with Regulation Up being energy provided above that point, and Regulation Down being energy withdrawn below that point.
Limited energy storage resources which charge from the electricity grid both generate and consume Energy when providing Regulation. The procedure for determining this make-up energy cost is as follows:
• Regulation sold in the IFM pays for energy charged to provide the award in real-time at FMM LMPs.
• Regulation sold in the FMM pays for energy charged to provide the award at RTED 5-minute LMPs.
While the SC can submit a starting bid for SOC, the SC is responsible over the course of the day for maintaining sufficient SOC to fulfill the Regulation awards, which are required over the full hour for day-ahead awards, with the exception of NGR-REM resources. For NGR-REM resources, the CAISO manages SOC.
Note that, as with other storage operations, make-up energy charged is not considered Measured Demand (i.e. Load) for purposes of allocating payments and charges (CAISO Tariff, Section 8.4.1.2).
11.4.5 Adjustments to Market Payments Failure to perform after obtaining an award of Regulation and payments through the IFM or RTM markets will result in a rescission of payments. The circumstances for such rescission from conventional resources is listed as the resource becoming undispatchable, unavailable, undelivered, or unsynchronized.
For REM resources, there is the additional constraint that resources awarded Regulation in the IFM or FMM may have MWh constraints which does not allow them to fulfill their Regulation awards. In this case, the CAISO may disqualify a portion of the unit’s Regulation capacity and undertake rescission of any Regulation payments.
Generally, StorageVET will not account for any rescission of payments. However, the user could conduct sensitivities on the capacity offered to examine revenue impacts of any reductions.
11.4.6 Spinning and Non-Spinning Reserve Prices The CAISO has operated Spinning and Non-Spinning Reserve markets since 1998. The market underwent major redesigns in April 2009, with the introduction of day-ahead co-optimization of energy and ancillary services, which affects the Spinning Reserve prices. Figure 11-9 shows the average annual prices ($/MW) for Spinning Reserves from 2008-2015, and Non-Spinning Reserves from 2010-2015. The hourly prices are typically closely correlated with the Regulation Up capacity prices, as shown Figure 11-6. This is because both services reflect the opportunity cost of not providing Energy in the clearing price.

11-14
Figure 11–9 Average CAISO day-ahead spinning reserve and non-spinning reserve clearing prices, 2008-2015
11.4.7 Settlement of Energy Provided when Dispatched from Spinning and Non- Spinning Reserves Energy provided from resources providing spinning and non-spinning reserves is settled at the FMM LMPs. StorageVET calculates the energy value based on a probability of dispatch with the LMP assumed to be $1000/MWh, or as set by the user.
11.4.8. Adjustments to Market Payments Similarly to the Regulation market, failure to perform after obtaining an award of these services and payments through the IFM and RTM markets will result in a rescission of payments (also called “no-pay”). The circumstances for such rescission from conventional resources are listed as the resource becoming undispatchable, unavailable, undelivered, or unsynchronized. As noted above, storage resources could also be subject to rescission if they are not charged when dispatched to provide energy from spinning reserves.
StorageVET will not estimate non-performance, and hence any rescission of payments. When conducting storage optimization, StorageVET will meet any operational constraints when providing services.
11.4.9 Forward Curves for Ancillary Service Prices and Costs Forward prices for ancillary services are typically hourly forecasted prices for future periods derived from different types of models, including statistical models based on correlations
2008 2009 2010 2011 2012 2013 2014 2015
Spinning Reserve Non-Spinning Reserves
$/M
W

11-15
between factors which historically have formed market prices, and various types of structural power system models, such as production cost models. All such models face the difficulty of forecasting ancillary service prices under rapidly changing market and system conditions. As noted above, the ancillary service markets are thin markets, in which prices could be rapidly affected by entry of new types of flexible resources, such as battery storage.
StorageVET will include some forward ancillary service price curves for calculation of storage value over multi-year time-frames. Users can also upload price curves from commercial, research or other public tools made available for other purposes.
Figure 11-10 graphs two CAISO region Regulation Up price curves included in StorageVET: average hourly historical Regulation Up prices in the IFM from 2015, and the analogous average hourly prices based on a production cost simulation of the CAISO region in 2030 under a 50% RPS assumption. The 2030 simulated prices assume that Regulation Up prices will be $0/MWh during overgeneration conditions (because there is no fuel cost to using otherwise curtailed energy to follow the Regulation signal upwards), which contributes to the lower average prices in hours ending 11:00 to 13:00.
Figure 11–10 CAISO Regulation Up prices for 2015 and Regulation Up prices simulated for 2030
11.5 Bid Cost Recovery/Uplift Costs The CAISO calculates uplift costs for both the IFM and the RTM separately. These costs are the difference between the Bid Costs in each market and the Market Revenues over all Settlement Intervals.
18 16 14 12 10
1 2 3 4 5 6 7 8 9 10 11 12 13 14 15 16 17 18 19 20 21 22 23 24
Hour of Day
Regulation Up - 2030 Regulation Up - 2015
$/M
W

11-16
Table 11–2 Eligibility for bid cost recovery by specific market participant types
NGR NGR-REM Pumped Storage
Start-Up Costs No No Yes
Minimum Load Costs No No Yes
Pumping Costs No No Yes
Transition Costs No No Yes
Energy Bid Costs Yes No Yes
Ancillary Service Bid Costs
Yes Yes Yes
RUC Availability Bids Yes No Yes Source: CAISO Tariff Section 11.8
11.6 Resource Adequacy Capacity This section examines the estimates of bilateral market prices for RA capacity, followed by the CAISO tariff rates for CPM capacity, estimates of the cost of new resources, and forward price curves for capacity.
Utility procurements of storage technologies, such as those taking place in California, are typically for 10-20 year contracts which bundle capacity value for the entire contract period. For CPUC-jurisdictional utilities, the capacity value is realized annually in compliance with the state’s Resource Adequacy requirements
11.6.1 Bilateral Prices for Resource Adequacy Capacity The bilateral prices for RA capacity in California can be obtained through direct quotes from suppliers or from statistics made available by the CPUC about average prices for the different locations and types of capacity. Since 2011, the CPUC has published these statistics in bi-annual reports on RA compliance. Table 11-3 shows statistics from the 2013-14 report [62] on aggregated prices from 2013-2017 (the later years are based on smaller samples of existing contracts); additional statistics in these reports include value by local capacity area.
Table 11–3 CPUC capacity prices by compliance year, 2013-2017
2013
Capacity 2014
Capacity 2015
Capacity 2016
Capacity 2017
Capacity Weighted Average Price
$/kW-month $ 3.45 $ 3.41 $ 3.12 $ 2.70 $ 3.16 Average Price $/kW- month
$ 3.28 $ 3.32 $ 2.90 $ 3.29 $ 3.39
Minimum Price $/kW- month
$ 0.11 $ 0.11 $ 0.09 $ 0.27 $ 1.60
Maximum Price $/kW- month
$ 26.54 $ 26.54 $ 26.54 $ 26.54 $ 6.43
85% of MW at or below
$/kW-month $ 7.48 $ 7.81 $ 5.40 $ 3.00 $ 5.10
11-17
Sum of Contracted Capacity
(MW) 104,947 96,712 91,788 54,289 24,887
Percentage of total contracted
MW in data set 28.2% 26.0% 24.6% 14.6% 6.7% Source: CPUC [62]
For the user of StorageVET, these data on bilateral prices can be used to bound estimates of the near term market value of storage capacity. Generally, price quotes for 3-6 years ahead for RA capacity from suppliers of existing capacity remain within these ranges. However, users should consult individual sellers for current commercially viable quotes.
11.6.2 CAISO CPM Prices The CAISO Capacity Procurement Mechanism (CPM) utilizes the following pricing formula, cited directly:
1. A monthly capacity payment for a resource based on a fixed CPM capacity price of $70.88/kW-year under Section 43.7.1;
2. A monthly capacity payment for a resources based on a stated, specific capacity price for a resource in excess of the monthly equivalent of $70.88/kW-year, which must be cost justified in a rate filing at FERC pursuant to Section 43.6.2 (Scheduling Coordinators must advise the ISO of that specific price in their notification); or
3. A monthly capacity payment for a resource based on an unspecified capacity price in excess of $70.88/kW-year that must be cost justified in a rate filing at FERC pursuant to Section 43.7.2.
CAISO posts cost information for CPM capacity procured in its monthly capacity procurement mechanisms reports.
11.6.3 Cost of New Generation Resources When storage resources are displacing other new capacity resources, utility procurement or regulatory valuation will use the cost of new gas-fired generation – combustion turbines or combined cycles – which are assumed to be the new capacity resource in the absence of
The standard reference for costs of new generation in California is the California Energy Commission (CEC) bi-annual survey and model [63] of the capital costs and going forward costs of a range of new generation types. The CEC survey estimates the financial costs of different types of project developers, including IOUs, POUs, and merchant projects.
The large California POUs also use internal estimates of avoided costs of new gas-fired generation in integrated resource planning processes. For Western regional planning, the WECC has issued long-term costs of new generation estimates [64].
11.7.4 Forward Price Curves for Capacity Forward prices curves for capacity generally utilize annual or monthly multi-year forecasts for the periods in which a utility or a region can continue to utilize existing capacity resources, with capacity prices based on bilateral contracts with those resources, and when new resources will be required, with capacity prices based on the cost of new generation.

11-18

12-1
12 CAISO TRANSMISSION PLANNING The CAISO is the transmission planning entity for its territory as well as a participant in regional transmission planning processes. There are two primary processes. The CAISO Generation Interconnection Procedures (GIP) process evaluates the transmission required for interconnection requested by generation and non-generation resources. The CAISO Transmission Planning Process (TPP) incorporates upgrades made or planned under the GIP and examines all other types of transmission requirements and proposals. This section provides an overview of these processes and the manner in which storage is considered, as well as its modeling requirements. The section is organized as follows:
Section 12.1 – GIP Processes;
Section 12.2 – TPP Processes;
Section 12.3 – Transmission Solutions;
Section 12.4 – Non-Transmission Alternatives;
Section 12.5 – Cost Allocation.
Storage resources could potentially be evaluated in these transmission planning processes in several ways. First, storage projects can be proposed as non-transmission alternatives which allow for deferral of transmission upgrades. This type of application could include both large- scale storage and aggregated distributed storage along with other DERs. Second, storage resources co-located with renewable generators could also alter the power flows resulting from a transmission project thereby making it more cost-effective. Third, a transmission upgrade could assist in providing market benefits to an existing or planned large-scale storage project, which could improve the cost-benefit analysis of both the transmission project and the storage project.
StorageVET could be used to evaluate different storage technology options within this planning framework, in tandem with power system models. For sizing of generation interconnection and transmission facilities to interconnect storage facilities, StorageVET could potentially be used to evaluate different storage dispatch solutions and as an adjunct to power flow and production cost models, if those are not adequately optimizing the storage resources. For economic valuation of storage as an alternative to transmission, StorageVET could similarly be used to evaluate storage dispatch solutions and market value. While there have been examples of how such models could be used jointly, this remains an area for further research and development.
This section briefly describes the CAISO transmission planning processes as well as the different types of transmission projects and how storage resources could or could not participate. In addition, the section explains how the different valuation model types can be utilized.
12.1 GIP Processes Generator Interconnection Procedures (GIP) addresses the engineering studies necessary to physically interconnect generation and non-generation resources. These transmission upgrades

12-2
are a part of the project cost. The primary reference for this process is the CAISO Business Practice Manual for Generator Interconnection Procedures (GIP BPM) [65].
For storage resources requesting interconnection, or storage resources aggregated with other resources, StorageVET could be a tool for developing storage dispatch patterns to be used when evaluating the likely utilization of transmission capacity for interconnection given a set of market prices and other services, such as whether the resource is a capacity resource. As such, StorageVET would likely be used by applicants when preparing interconnection requests, rather than by the CAISO.
12.2 TPP Processes The CAISO TPP is conducted in three phases, which are summarized briefly here. The primary reference for this process is the CAISO Business Practice Manual for The Transmission Planning Process [66].
Phase 1 of the annual TPP includes a comment period for stakeholders to submit DR and non- transmission alternatives into the unified planning assumptions. Storage resources which are stand-alone or aggregated with other DER would be submitted in this phase.
Phase 2 runs for 12 months from April of the first year to March of the following year. CAISO conducts technical studies to determine the need for transmission solutions, followed by the posting of the draft transmission plan.
If transmission facilities are approved in Phase 2, the final phase of the process, Phase 3, is a competitive solicitation to select eligible entities to finance, construct, own, operate, and maintain the facilities.
12.3 Types of Transmission Solutions There are several categories of transmission solutions – that is, the purpose for the particular transmission project – which are evaluated at different points in the sequence of the TPP. Storage could evaluated as a component of a transmission solution, or as an alternative to the transmission solution, as discussed in the next section.
Table 12–1 Types of transmission projects and potential role of storage
Type of transmission project Role of storage/storage modeling Reliability Storage as component of non-transmission alternative GIP Storage interconnection; storage impacting transmission utilization by
interconnecting renewable generation Policy-driven solutions Storage impacting transmission utilization; transmission affecting storage
utilization Economic upgrades Storage dispatch affecting congestion cost estimates Long-term CRRs Storage as component of non-transmission alternative; storage impacting
transmission utilization LCRIF Storage modifying renewable production Merchant Large storage projects as potential subscribers

12-3
12.3.1 Reliability Projects Reliability projects are needed to maintain long-term operational reliability and meet load growth in particular locations. Reliability studies are typically conducted using power flow analysis, transient stability analysis, and voltage stability analysis. Stand-alone or distributed storage could provide an alternative to reliability projects.
12.3.2 Generation Interconnection Projects The TPP considers the impact on transmission capability of certain large GIP network upgrades identified in GIP phase II interconnection studies which are not already included in a signed LGIA.
12.3.3 Policy-Driven Projects Policy-driven solutions are those needed “to meet state, municipal, county or federal policy requirements or directives” ([66] sec. 4.8). In California, these include notably the RPS and OTC rules. Because the other types of required transmission projects noted above can help to meet the transmission needs to meet policies, specific policy-driven transmission solutions are considered after those types of projects. That is, the CAISO evaluates whether additional transmission is required to ensure that policy objectives are met.
A number of criteria are used to evaluate the need for particular policy-driven solutions. These include the following criteria which could support storage integrated into the resources being connected, cited directly ([66] section 4.8.1):
• The potential capacity (MW) value and energy (MWh) value of resources in particular zones that will meet the policy requirements, as well as the cost supply function of the resources in such zones.
• Resource integration requirements and the costs associated with these requirements in particular resource areas designated pursuant to policy initiatives.
• The potential for a particular transmission solution to provide access to resources needed for integration, such as pumped storage in the case of renewable resources.
12.3.4 Economic Studies and Mitigation Solutions Following the above-mentioned types of transmission solutions, the CAISO conducts economic studies to evaluate whether additional transmission projects are needed to relieve congestion and provide other economic benefits. Economic projects are eligible for competitive solicitation. These types of upgrades have not been identified in recent years, due to the transmission upgrades for the other purposes. However, in previous years, economic projects have been evaluated that supported increased operations of pumped storage plants.
12.3.5 Projects to Maintain Long-Term CRRs Long-term CRRs allocated by the CAISO to eligible LSEs may become infeasible within the period of the transmission plan. In some cases, the infeasibility may be a small number of MW, making a transmission upgrade costly. In these instances, the CAISO will work with market participants to evaluate lower cost alternatives to transmission solutions, such as demand-side management and interruptible loads. Storage solutions may be cost-effective in such

12-4
applications. StorageVET can be used to examine potential dispatch solutions and direct or indirect market benefits for storage solutions.
12.3.6 LCRIF Projects Location-constrained renewable interconnection projects are transmission facilities developed in anticipation of renewable development in a particular region. Since the development of the policy-driven transmission projects, there have been no LCRIF projects. Storage would not be a component of an alternative to an LCRIF project.
12.3.7 Merchant Transmission Projects Merchant transmission projects recover costs through bilateral contracts for transmission usage and allocations of incremental CRRs associated with the project, rather than through the CAISO transmission access charge. Any proposed merchant transmission projects which meet eligibility requirements are included in the TPP.
Valuation of merchant transmission projects is done by the project sponsors; hence, any cost- benefit analysis of storage facilities associated with the project (e.g., large storage facilities used to manage renewable production or provide services into the CAISO market) would be done outside the CAISO TPP. StorageVET could be used along with power system models to conduct such valuation.
12.4 Non-Transmission Alternatives Non-transmission alternatives include Demand Response, distributed generation, storage, and energy efficiency, on a stand-alone basis or in an aggregated basis. In 2013 [67], the CAISO provided an updated three-step approach to evaluating these resources to address local needs in the TPP. This approach:
(i) provides upfront a catalog or menu of generic resource types that can provide some or all of the required performance characteristics to meet local area needs;
(ii) determines an effective mix of resource types to address specific needs in a particular local area as identified in the ISO’s TPP study process; and,
(iii) monitors the development of the selected mix of non-conventional alternatives to ensure their development is proceeding at the necessary pace.
12.4.1 Demand Response Demand response alternatives must submit the following:
Bus-level model of demand response assumptions for power flow or stability studies and associated planning level costs. In addition, submitters must provide satisfactory evidence showing that the proposed demand response will be reliably operated and controllable by the ISO, as well as having received appropriate regulatory approval as part of the Resource Adequacy or other similar program such as the California Public Utilities Commission long term procurement process.

12-5
12.4.2 Generation or Other Non-Transmission Alternatives Other non-transmission alternatives must provide the following information required for planning studies:
This information includes, but is not limited to, project location, project costs, size, power flow and dynamic models, project scope and detailed descriptions of the characteristics or how the proposed generation or non-transmission alternative will be operated.
12.4.3 Cost Responsibility for Non-Transmission Alternatives Under current tariff rules, if Non-Transmission Alternatives are identified, the CAISO will decline to approve a transmission solution, but does not approve the non-transmission solutions.


13-1
13 REFERENCES 1. California ISO (CAISO), "Issue Paper: Joint Workshop on Multiple-Use Applications and
Station Power for Energy Storage," 2-3 March 2016. [Online]. Available: http://www.caiso.com/informed/Pages/StakeholderProcesses/EnergyStorage_DistributedEner gyResourcesPhase2.aspx.
2. Federal Energy Regulatory Commission (FERC), "Electric Storage Participation in Markets Operated by Regional Transmission Organizations and Independent System Operators," Docket Nos. RM16-23-000; AD16-20-000, 157 FERC ¶ 61,121, November 17, 2016. [Online]. Available: http://elibrary.ferc.gov/idmws/file_list.asp?accession_num=20161117- 3094.
3. Electric Power Research Institute (EPRI), "StorageVET™ Software User Guide: User and Technical Documentation for the Storage Value Estimation Tool," EPRI, Palo Alto, CA: 2016. 3002009357. [Online].
4. Electric Power Research Institute (EPRI), "Integrated Grid initiative," [Online]. Available: http://www.epri.com/Our-Work/Pages/Integrated-Grid.aspx.
5. Electric Power Research Institute (EPRI), "Cost-Effectiveness of Energy Storage in California: Application of the Energy Storage Valuation Tool to Inform the California Public Utility Commission Proceeding R. 10-12-007," EPRI, Palo Alto, CA: 2013. 3002001162. [Online]. Available: http://www.cpuc.ca.gov/General.aspx?id=3462.
6. DNV-GL, "Energy Storage Cost‐effectiveness Methodology and Results," Final Project Report, Energy Research and Development Division, Final Project Report, DNV GL Energy and Sustainability, August 2013, CEC 500-2014-068. [Online]. Available: http://www.energy.ca.gov/2014publications/CEC-500-2014-068/CEC-500-2014-068.pdf.
7. Pacific Gas and Electric Company (PG&E), "EPIC Final Report - EPIC Project 1.01, Energy Storage End Uses: Energy Storage for Market Operations," September 13, 2016. [Online]. Available: https://www.pge.com/pge_global/common/pdfs/about-pge/environment/what-we- are-doing/electric-program-investment-charge/PGE-EPIC-Project-1.01.pdf..
8. Eichman, J., P. Denholm, J. Jorgenson and U. Helman, "Operational Benefits of California's Energy Storage Targets," December 2015 National Renewable Energy Laboratory, Technical Report NREL/TP-5400-65061. [Online]. Available: http://www.nrel.gov/docs/fy16osti/65061.pdf.
9. California ISO (CAISO), "2015-2016 ISO Transmission Plan," March 28, 2016. [Online]. Available: http://www.caiso.com/Documents/Board-Approved2015- 2016TransmissionPlan.pdf.
10. Liu, S., "A Bulk Energy Storage Resource Case Study updated from 40% to 50% RPS," California ISO, 2015-2016 Transmission Planning Process. [Online]. Available: http://www.caiso.com/Documents/BulkEnergyStorageResource-2015- 2016SpecialStudyUpdatedfrom40to50Percent.pdf.
11. California Public Utilities Commission (CPUC)," Decision 13-10-040, Decision adopting energy storage procurement framework and design program," October 17, 2013. [Online].

13-2
Available: http://docs.cpuc.ca.gov/PublishedDocs/Published/G000/M079/K533/79533378.PDF.
12. California Energy Commission (CEC), "Differences Between Publicly and Investor-Owned Utilities (webpage)," [Online]. Available: http://www.energy.ca.gov/pou_reporting/background/difference_pou_iou.html.
13. Assembly Bill 2514, Skinner. Energy Storage Systems, [Online]. Available: http://www.leginfo.ca.gov/pub/09-10/bill/asm/ab_2501- 2550/ab_2514_bill_20100929_chaptered.pdf.
14. California Energy Commission (CEC), "Electric Load-Serving Entities (LSEs) in California (webpage)," [Online]. Available: http://energyalmanac.ca.gov/electricity/utilities.html#100.
15. Western Electricity Coordinating Council (WECC), "WECC BA map," [Online]. Available: https://www.wecc.biz/Administrative/WECC_BAMap.pdf.
16. California ISO (CAISO), "Regional Energy Market webpage," [Online]. Available: http://www.caiso.com/informed/Pages/RegionalEnergyMarket.aspx.
17. Kavalec, Chris, Nick Fugate, Cary Garcia, and Asish Gautam, "California Energy Demand 2016-2026, Revised Electricity Forecast, California Energy Commission. Publication Number: CEC-200-2016-001-V1," 2016. [Online]. Available: http://docketpublic.energy.ca.gov/PublicDocuments/15-IEPR- 03/TN207439_20160115T152221_California_Energy_Demand_20162026_Revised_Electric ity_Forecast.pdf.
18. California ISO (CAISO), Department of Market Monitoring, "2015 Annual Report on Market Issues and Performance," May 2016. [Online]. Available: http://www.caiso.com/Documents/2015AnnualReportonMarketIssuesandPerformance.pdf.
19. California Energy Commission (CEC), "Summary of Renewable Energy Installations, Updated October 11, 2016," [Online]. Available: http://www.energy.ca.gov/renewables/tracking_progress/documents/renewable.pdf.
20. Brinkman, G., J. Jorgenson, A. Ehlen and J. Caldwell, "Low Carbon Grid Study: Analysis of a 50% Emission Reduction in California," National Renewable Energy Laboratory (NREL), NREL/TP-6A20-64884, January 2016. [Online]. Available: http://www.nrel.gov/docs/fy16osti/64884.pdf.
21. Denholm, P., and R. Margolis, "Energy Storage Requirements for Achieving 50% Solar Photovoltaic Energy Penetration in California," August 2016 National Renewable Energy Laboratory (NREL), Technical Report, NREL/TP-6A20-66595. [Online]. Available: http://www.nrel.gov/docs/fy16osti/66595.pdf.
22. Mills, A., and Wiser, R, "Strategies for Mitigating the Reduction in Economic Value of Variable Generation with Increasing Penetration Levels," March 2014 Environmental Energy Technologies Division, Lawrence Berkeley National Laboratory. [Online]. Available: https://emp.lbl.gov/sites/all/files/lbnl-6590e_0.pdf.
23. California Energy Commission (CEC), "AB 2514 - Energy Storage System Procurement Targets from Publicly Owned Utilities," [Online]. Available: http://www.energy.ca.gov/assessments/ab2514_energy_storage.html.
24. California Public Utilities Commission (CPUC), "Distribution Resources Plan (R.14-08-013) webpage," [Online]. Available: http://www.cpuc.ca.gov/General.aspx?id=5071.

13-3
25. California Air Resources Board (CARB), "AB 32 webpage," [Online]. Available: https://www.arb.ca.gov/cc/ab32/ab32.htm.
26. California Public Utilities Commission (CPUC), "SGIP authorization," December 2014. [Online]. Available: http://docs.cpuc.ca.gov/PublishedDocs/Published/G000/M143/K905/143905382.PDF.
27. California Public Utilities Commission (CPUC), "SB 350 Implementation," [Online]. Available: http://www.cpuc.ca.gov/PUC/energy/SB+350.htm.
28. California Public Utilities Commission (CPUC), "Integrated Resource Plan and Long Term Procurement Plan (IRP-LTPP) webpage," [Online]. Available: http://www.cpuc.ca.gov/ltpp/.
29. California Public Utiltiies Commission (CPUC), "Energy Storage webpage," [Online]. Available: http://www.cpuc.ca.gov/General.aspx?id=3462.
30. California Public Utiltiies Commission (CPUC), "California Standard Practice Manual: Economic Analysis of Demand-Side Programs and Projects," October 2001. [Online]. Available: http://www.cpuc.ca.gov/workarea/downloadasset.aspx?id=7741.
31. California Public Utilities Commission (CPUC), "Assigned Commissioner’s Ruling (1) Refining Integration Capacity and Locational Net Benefit Analysis Methodologies and Requirements; and (2) Authorizing Demonstration Projects A and B," Rulemaking 14-08- 013, Filed 5/2/2016. [Online].
32. Southern California Public Power Authority (SCPPA), "Renewables/Resources webpage," [Online]. Available: http://www.scppa.org/page/RFPs-RenewableResource.
33. California Public Utilities Commission (CPUC), "Decision Regarding Net Energy Metering Interconnection," [Online]. Available: http://docs.cpuc.ca.gov/PublishedDocs/Published/G000/M091/K251/91251428.PDF.
34. Southern California Edison (SCE), "Preferred Resources Pilot (PRP)," [Online]. Available: https://www.sce.com/.
35. Rawson, M, and E. Sanchez, Sacramento Municipal Utility District (SMUD), "2014 Sacramento Municipal Utility District − Photovoltaic and Smart Grid Pilot at Anatolia," California Energy Commission. Publication number: CEC-500-2015-047. [Online]. Available: http://www.energy.ca.gov/2015publications/CEC-500-2015-047/CEC-500-2015- 047.pdf.
36. California Public Utilities Commission (CPUC), "Order Instituting Rulemaking to Enhance the Role of Demand Response in Meeting the State’s Resource Planning Needs and Operational Requirements. Rulemaking 13-09-011.," Decision 14-03-026, March 27, 2014 Decision Addressing Foundational Issue of the Bifurcation of Demand Response Programs. [Online].
37. Pacific Gas & Electric (PG&E), "Supply-Side Pilot," [Online]. Available: http://olivineinc.com/ssp/.
38. Pacific Gas & Electric (PG&E), "Yerba Buena Energy Storage Pilot Project and Supply Side Pilot," May 3, 2016 CAISO/CPUC Multiple-Use Applications Workshop. [Online]. Available: http://www.cpuc.ca.gov/General.aspx?id=3462.
39. San Diego Gas & Electric (SDG&E), "Optimized Pricing and Resource Allocation (OPRA) Project, Presentation at CPUC/CAISO Workshop on Multi-Use Applications," May 3, 2016. [Online]. Available: http://www.cpuc.ca.gov/General.aspx?id=3462.
13-4
40. California ISO (CAISO), "Webpage for Non-Generator Resources in Ancillary Service Markets," [Online]. Available: http://www.caiso.com/informed/Pages/StakeholderProcesses/CompletedStakeholderProcesse s/NonGeneratorResourcesAncillaryServicesMarket.aspx.
41. California ISO (CAISO), "Revised Draft Final Proposal for Participation of Non-Generator Resources in California ISO Ancillary Service Markets," 8 March 2010. [Online]. Available: http://www.caiso.com/Documents/RevisedDraftFinalProposal_Participation-Non- GeneratorResourcesinCaliforniaISOAncillaryServicesMarkets3_8_2010.pdf.
42. California ISO (CAISO), "Tariff, subject to continuous revisions," [Online]. Available: http://www.caiso.com/rules/Pages/Regulatory/Default.aspx
43. California ISO (CAISO), "Energy Storage and Distributed Energy Resources (ESDER) Stakeholder Initiative, Revised Draft Final Proposal," 23 December 2015. [Online].
44. California ISO (CAISO), "Business Practice Manual (BPM) for Market Operations," November 24, 2015. [Online]. Available: https://bpmcm.caiso.com/Pages/BPMDetails.aspx?BPM=Market%20Operations.
45. California Independent System Operator (CAISO), "Distributed energy resource provider - stakeholder webpage," [Online]. Available: http://www.caiso.com/participate/Pages/DistributedEnergyResourceProvider/Default.aspx.
46. California ISO (CAISO), "Business Practice Manual (BPM) for Market Instruments," [Online]. Available: https://bpmcm.caiso.com/Pages/BPMDetails.aspx?BPM=Market%20Instruments.
47. California Independent System Operator (CAISO) and North American Electric Reliaility Corporation (NERC), "2013 Special Reliability Assessment: Maintaining Bulk Power System Reliability While Integrating Variable Energy Resources – CAISO Approach," November 2013. [Online].
48. California ISO (CAISO), "Non-Generator Resource (NGR) and Regulation Energy Management (REM) Overview –Phase 1, Client Training Team, Customer Services Department," 2014. [Online].
49. Federal Energy Regulatory Commission (FERC), "Order Accepting Tariff Provisions," January 30, 2015. [Online]. Available: http://www.caiso.com/Documents/Jan30_2015_OrderAcceptingPayForPerformanceYear1Ch anges_ER15-554.pdf.
50. California ISO, "Frequency Response stakeholder initiative homepage," Initiated 2015, ongoing. [Online]. Available: http://www.caiso.com/informed/Pages/StakeholderProcesses/FrequencyResponse.aspx.
51. California Public Utilities Commission (CPUC), "Resource Adequacy homepage," [Online]. Available: http://www.cpuc.ca.gov/RA/.
52. California ISO (CAISO), "Business Practice Manual on Reliability Requirements," Version 30, October 26, 2016. [Online]. Available: https://bpmcm.caiso.com/Pages/BPMDetails.aspx?BPM=Reliability%20Requirements.
53. California ISO (CAISO), "2017 Local Capacity Technical Analysis, Final Report and Study Results," April 29, 2016. [Online]. Available: http://www.caiso.com/Documents/Final2017LocalCapacityTechnicalReportApril292016.pdf.

13-5
54. California Independent System Operator (CAISO), "Final Flexible Capacity Needs Assessment for 2017," April 29, 2016. [Online]. Available: http://www.caiso.com/Documents/FinalFlexibleCapacityNeedsAssessmentFor2017.pdf.
55. California Public Utilities Commission (CPUC), "Decision Adopting Local Procurement and Flexible Capacity Obligations for 2015 and Further Refining the Resource Adequacy Program," Rulemaking 11-10-023, Decision 14-06-050, Issued July 1, 2014. [Online]. Available: http://docs.cpuc.ca.gov/PublishedDocs/Published/G000/M097/K619/97619935.PDF.
56. California Public Utilities Commission (CPUC), "2016 Filing Guide for System, Local and Flexible Resource Adequacy (RA) Compliance Filings," [Online].
57. California Public Utilities Commission (CPUC), "Qualifying Capacity Methodology Manual Adopted 2015," [Online]. Available: http://www.cpuc.ca.gov/General.aspx?id=6311.
58. California Public Utilities Commission (CPUC), "Order Instituting Rulemaking to Oversee the Resource Adequacy Program, Consider Program Refinements, and Establish Annual Local Procurement Obligations.," Rulemaking 11-10-023, Decision 14-06-050, June 26, 2014. [Online].
59. California Independent System Operator (CAISO), "Reliability Requirements webpage," [Online]. Available: http://www.caiso.com/planning/Pages/ReliabilityRequirements/Default.aspx.
60. California Public Utilities Commission (CPUC), "Resource Adequacy compliance materials webpage," [Online]. Available: http://www.cpuc.ca.gov/PUC/energy/Procurement/RA/ra_compliance_materials.html.
61. Federal Energy Regulatory Commission (FERC), "Order Conditionally Accepting Tariff Revisions," 1 October 2015. [Online]. Available: http://www.caiso.com/Documents/Oct1_2015_OrderConditionallyAcceptingTariffRevisions _ReliabilityServicesInitiative_ER15-1825.pdf.
62. California Public Utilities Commission (CPUC), "The 2013 – 2014 Resource Adequacy Report, Energy Division," August 2015. [Online]. Available: http://www.cpuc.ca.gov/General.aspx?id=6307.
63. Rhyne, I., and J. Klein, "Estimated Cost of New Renewable and Fossil Generation in California. California Energy Commission. CEC‐200‐2014‐003‐SD," 2014. [Online]. Available: http://www.energy.ca.gov/2014publications/CEC-200-2014-003/index.html..
64. E3, "Capital Cost Review of Generation Technologies: Recommendations for WECC’s 10- and 20-Year Studies," Prepared for Prepared for the Western Electric Coordinating Council, March 2014. [Online].
65. California Independent System Operator (CAISO), "Business Practice Manual for Generator Interconnection Procedures," [Online].
66. California Independent System Operator (CAISO), "Business Practice Manual for The Transmission Planning Process," updated periodically. [Online].
67. California ISO (CAISO), "Consideration of alternatives to transmission or conventional generation to address local needs in the transmission planning process," September 4, 2013. [Online]. Available: http://www.caiso.com/Documents/Paper-Non- ConventionalAlternatives-2013-2014TransmissionPlanningProcess.pdf.


A-1
A ACRONYMS BAA balancing area authority
CAISO California Independent System Operator
CEC California Energy Commission
CEP consistent evaluation protocol
CFCD CAISO Forecast of CAISO Demand
CPUC California Public Utilities Commission
CRR congestion revenue rights
DAM day-ahead market
DER distributed energy resource
DR demand response
DRP distribution resource planning
EIM energy imbalance market
ELCC effective load-carrying capability
FRP flexible ramping product
ICA integration capacity analysis
IFM integrated forward market
LAP load aggregation point
LMP locational marginal price
LNBA locational net benefits analysis
LSE load serving entity
NERC North American Electric Reliability Council
NGR non-generator resource
NQC net qualifying capacity
PDR proxy demand resource
QC qualifying capacity

A-2
RA resource adequacy
RDRR reliability demand response resource
RPS renewable portfolio standard
RTM real-time market
RUC residual unit commitment
SC scheduling coordinator
SCUC security-constrained unit commitment
SGIP self-generation incentive program
WECC Western Electricity Coordinating Council
B-1
B DISTRIBUTION APPLICATIONS WITH STORAGE AND HOSTING CAPACITY ANALYSIS This appendix provides some preliminary schematics and explanation for utilization of StorageVET or other similar storage or DER optimization tools for distribution applications. This section is expected to be developed further in subsequent versions of this report.
Some primary uses of StorageVET in these applications would be to optimize storage attributes (e.g., sizing), whether stand-alone or within DER aggregations, to provide transmission and distribution deferral, distribution operational services, and increase hosting capacity, or combinations of these applications. In addition, the tool can support valuation of multiple-use applications, such as provision of distribution deferral and wholesale services from the same device. For these applications, StorageVET will typically be implemented in tandem with power flow tools used to calculate constraints on storage system operations when meeting those objectives.
The appendix is organized as follows:
Section B.1 – Briefly outlines the process flow for the interface of StorageVET with distribution planning and operational tools;
Section B.2 – Distribution and Transmission Investment Deferral;
Section B.3 – Integration Capacity Analysis;
Section B.4 – Distribution Operations;
This section does not address some other relevant issues which may be of interest to StorageVET users, including access to utility distribution data and retail customer data.
B.1 Process Flow for Distribution Storage Valuation Analysis This appendix briefly describes the general process flow when using StorageVET in tandem with other models for distribution applications. Additional details are found in the StorageVET Software User and Technical Documentation.
Figure B-1 shows two main steps in this process. First, on the left hand side of the figure, the “primary objectives” – the distribution applications – are analyzed using operational constraints developed externally to the tool to support distribution deferral or reserve capability to provide distribution services. As noted, StorageVET does not model effects of the storage system on exogenous loads, or other elements within a transmission/distribution system, such as power flow or voltage control. Rather, load effects, and interaction with transmission/distribution circuits are modeled as data time-series that are included as requirements for the storage system operation. These are evaluated iteratively to ensure that the storage dispatches are feasible. With these constraints developed, the right hand side of the figure shows the process for “value optimization” given a set of market/bulk system scenarios, such as a set of wholesale market

B-2
prices for eligible services. In this phase, alternative multiple use applications of the storage device are evaluated and solutions validated iteratively if needed. Across these two phases of the analysis, StorageVET can enforce a prioritization of the constraints required to fulfill particular services.
Figure B–1 Process flow for distribution storage valuation analysis
B.2 Distribution and Transmission Investment Deferral Distribution investment deferral refers to the use of “non wire alternatives,” including storage, to avoid capital expenditures and O&M costs of a range of planned investments on the distribution system and possibly also the transmission system. The California IOUs and the CPUC have identified four major categories of such investments for purposes of locational net benefits analysis: Sub-Transmission, Substations and Feeders; Distribution Voltage and Power Quality; Distribution Reliability and Resiliency; and Transmission.
In StorageVET, distribution investment deferral has the higher priority over system and ancillary services because once the storage system fails to keep the load under the load target, the investment must be made.
In addition, it is possible to start deferring the investment a few years after the storage system is installed by making the “Load Target” a number above 100%.
B.2.1 Sub-Transmission, Substations, and Feeders To avoid investments in these facilities, the objective is to shave peak loads to delay investment in a new substation or transformer for a few years. For example, a transformer peak is defined as the highest load hour in base, or reference year load on the substation. The substation investment

B-3
is deferred for as long as the storage is able to keep annual peak under the base year load peak or a defined threshold percent of base year load peak.
To model this service in StorageVET, the storage system is discharged to bring the peak load under the load target. The load target is defined as a percentage of the base year peak load. Based on perfect foresight, the storage system charges to full capacity before the anticipated peak load.
B.2.2 Distribution Voltage and Power Quality Distribution utilities generally invest in capacitors to maintain voltage and power quality on the distribution system. With the advent of inverter-based PV and batteries, these technologies are being evaluated for these services. To model this service in StorageVET, the operating requirements for the storage system is determined and can be represented through dynamic state- of-charge requirements, along with upper and lower operating limits. Based on perfect foresight, the storage system can then be utilized to provide other services.
B.2.3 Distribution Reliability and Resiliency This category of projects includes replacement of aging infrastructure to maintain reliability. At this writing, these types of applications are being evaluated as part of demonstration projects.
B.2.4 Transmission Deferral and Services Upgrades at the distribution level can allow for deferral of high voltage transmission solutions as well as provide services to the transmission level, such as voltage support and reactive power. StorageVET could be used to evaluate the remaining energy discharge capabilities of a storage system when already constrained to provide other distribution services.
B.3 Integration Capacity Analysis Integration Capacity Analysis (ICA) determines the hosting or integration capacity of additional DERs on the distribution network, down to the line section or node. Versions of the EPRI Energy Storage Valuation Tool (ESVT) and now StorageVET have been utilized in ICA by several utilities. This section is expected to include methods and results from these applications in subsequent versions of this report.
In California, the CPUC has established requirements for ICA by the IOUs and there is an ongoing working group developing refinements to the methodology. Under CPUC guidance, ICA must use a common methodology across the utilities with results provided on-line and public. In addition, the utilities are to assess current system capability in each planning iteration and include planned investments up to two-years ahead, conduct dynamic analysis, assess the state of DER deployments and forecasts, evaluate circuits with high DER penetration, develop a procedure for updating the analyses, and show how to improve interconnection processes. In addition, as discussed further below, improvements in ICA is also a component of the required pilot projects for each utility.
The utilities will examine a range of different DER production profiles in hosting capacity analysis. For purposes of demonstration, the CPUC has identified a series of specific profiles which must be analyzed, and which are listed in Table B-1 (also shown in section 5), in addition to representative portfolios of these resources. StorageVET or similar tools can be used in tandem with other hosting capacity tools to model variants on these production profiles when
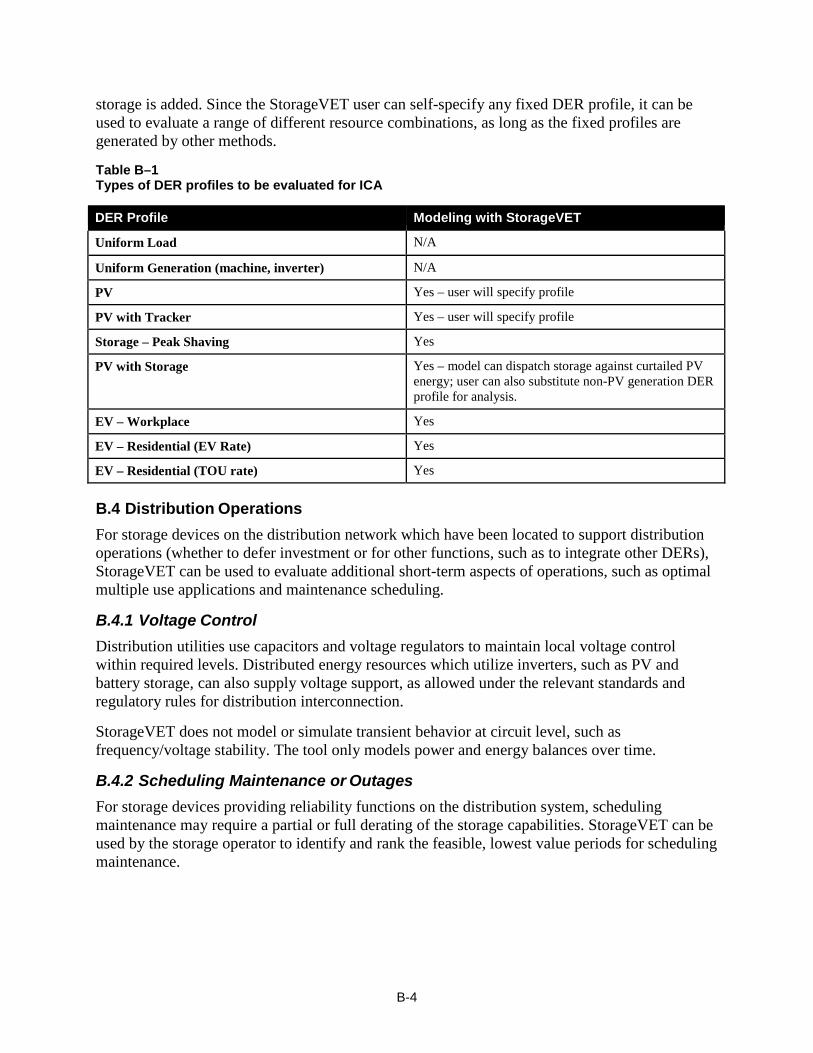
B-4
storage is added. Since the StorageVET user can self-specify any fixed DER profile, it can be used to evaluate a range of different resource combinations, as long as the fixed profiles are generated by other methods.
Table B–1 Types of DER profiles to be evaluated for ICA
DER Profile Modeling with StorageVET
Uniform Load N/A
Uniform Generation (machine, inverter) N/A
PV Yes – user will specify profile
PV with Tracker Yes – user will specify profile
Storage – Peak Shaving Yes
PV with Storage Yes – model can dispatch storage against curtailed PV energy; user can also substitute non-PV generation DER profile for analysis.
EV – Workplace Yes
EV – Residential (EV Rate) Yes
EV – Residential (TOU rate) Yes
B.4 Distribution Operations For storage devices on the distribution network which have been located to support distribution operations (whether to defer investment or for other functions, such as to integrate other DERs), StorageVET can be used to evaluate additional short-term aspects of operations, such as optimal multiple use applications and maintenance scheduling.
B.4.1 Voltage Control Distribution utilities use capacitors and voltage regulators to maintain local voltage control within required levels. Distributed energy resources which utilize inverters, such as PV and battery storage, can also supply voltage support, as allowed under the relevant standards and regulatory rules for distribution interconnection.
StorageVET does not model or simulate transient behavior at circuit level, such as frequency/voltage stability. The tool only models power and energy balances over time.
B.4.2 Scheduling Maintenance or Outages For storage devices providing reliability functions on the distribution system, scheduling maintenance may require a partial or full derating of the storage capabilities. StorageVET can be used by the storage operator to identify and rank the feasible, lowest value periods for scheduling maintenance.


Export Control Restrictions
Access to and use of EPRI Intellectual Property is granted with the specific understanding and requirement that responsibility for ensuring full compliance with all applicable U.S. and foreign export laws and regulations is being undertaken by you and your company. This includes an obligation to ensure that any individual receiving access hereunder who is not a U.S. citizen or permanent U.S. resident is permitted access under applicable U.S. and foreign export laws and regulations. In the event you are uncertain whether you or your company may lawfully obtain access to this EPRI Intellectual Property, you acknowledge that it is your obligation to consult with your company’s legal counsel to determine whether this access is lawful. Although EPRI may make available on a case-by-case basis an informal assessment of the applicable U.S. export classification for specific EPRI Intellectual Property, you and your company acknowledge that this assessment is solely for informational purposes and not for reliance purposes. You and your company acknowledge that it is still the obligation of you and your company to make your own assessment of the applicable U.S. export classification and ensure compliance accordingly. You and your company understand and acknowledge your obligations to make a prompt report to EPRI and the appropriate authorities regarding any access to or use of EPRI Intellectual Property hereunder that may be in violation of applicable U.S. or foreign export laws or regulations.
The Electric Power Research Institute, Inc. (EPRI, www.epri.com) conducts research and development relating to the generation, delivery and use of electricity for the benefit of the public. An independent, nonprofit organization, EPRI brings together its scientists and engineers as well as experts from academia and industry to help address challenges in electricity, including reliability, efficiency, affordability, health, safety and the environment. EPRI members represent 90% of the electric utility revenue in the United States with international participation in 35 countries. EPRI’s principal offices and laboratories are located in Palo Alto, Calif.; Charlotte, N.C.; Knoxville, Tenn.; and Lenox, Mass.
Together…Shaping the Future of Electricity
© 2016 Electric Power Research Institute (EPRI), Inc. All rights reserved. Electric Power Research Institute, EPRI, and TOGETHER…SHAPING THE FUTURE OF ELECTRICITY are registered service marks of the Electric Power Research Institute, Inc.
3002008901
Electric Power Research Institute 3420 Hillview Avenue, Palo Alto, California 94304-1338 • PO Box 10412, Palo Alto, California 94303-0813 • USA
800.313.3774 • 650.855.2121 • [email protected] • www.epri.com