valmet unique offering with process technology, …035 1,055 1,119 1,182 1,225 248 337 358 1,035...
TRANSCRIPT

Valmet – unique offering with process technology, automation and services
Roadshow presentation
September 2017
AgendaValmet roadshow presentation
September 2017 © Valmet | Roadshow presentation2
1 Valmet in brief
2
Financials 3
Investment highlights
4 Conclusion
Valmet in brief
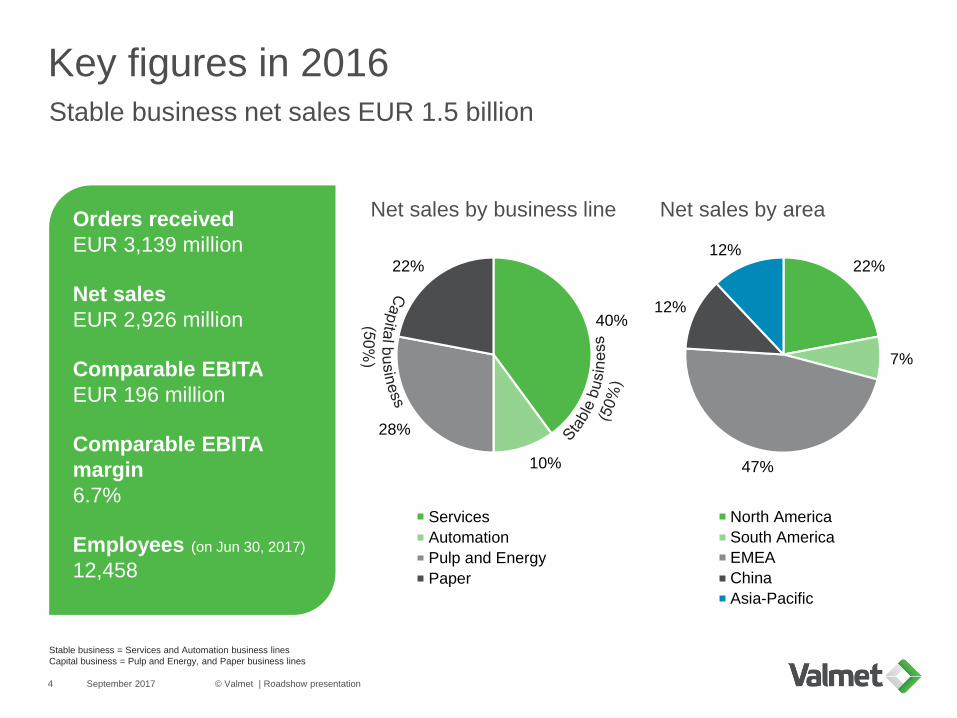
Key figures in 2016
September 2017 © Valmet | Roadshow presentation4
Stable business net sales EUR 1.5 billion
Net sales by business lineOrders received
EUR 3,139 million
Net sales
EUR 2,926 million
Comparable EBITA
EUR 196 million
Comparable EBITA
margin
6.7%
Employees (on Jun 30, 2017)
12,458
40%
10%
28%
22%
Services
Automation
Pulp and Energy
Paper
22%
7%
47%
12%
12%
North America
South America
EMEA
China
Asia-Pacific
Net sales by area
Stable business = Services and Automation business lines
Capital business = Pulp and Energy, and Paper business lines

Valmet’s development
September 2017 © Valmet | Roadshow presentation5
Orders received(EUR million)1
1) 2013 figures on carve-out basis
LTM = Last twelve months (July 1, 2016 – June 30, 2017)
Stable business = Services and Automation business lines
Capital business = Pulp and Energy, and Paper business lines
Net sales(EUR million)1
Comparable EBITA(EUR million)1
Comp. EBITA margin(%)1
Comparable EBITA
target 8–10% from
2017 onwards
54
106
182196 199
2013 2014 2015 2016 LTM
Comparable EBITA
2.1%
4.3%
6.2%6.7% 6.8%
2013 2014 2015 2016 LTM
Comparable EBITA margin
1,035 1,0551,341 1,481 1,539
1,147
2,016 1,537
1,6581,907
2,182
3,0712,878
3,139
3,446
2013 2014 2015 2016 LTM
Capital business
Stable business
1,032 9891,357 1,453 1,447
1,5811,484
1,572 1,473 1,497
2,6132,473
2,928 2,926 2,945
2013 2014 2015 2016 LTM
Capital business
Stable business
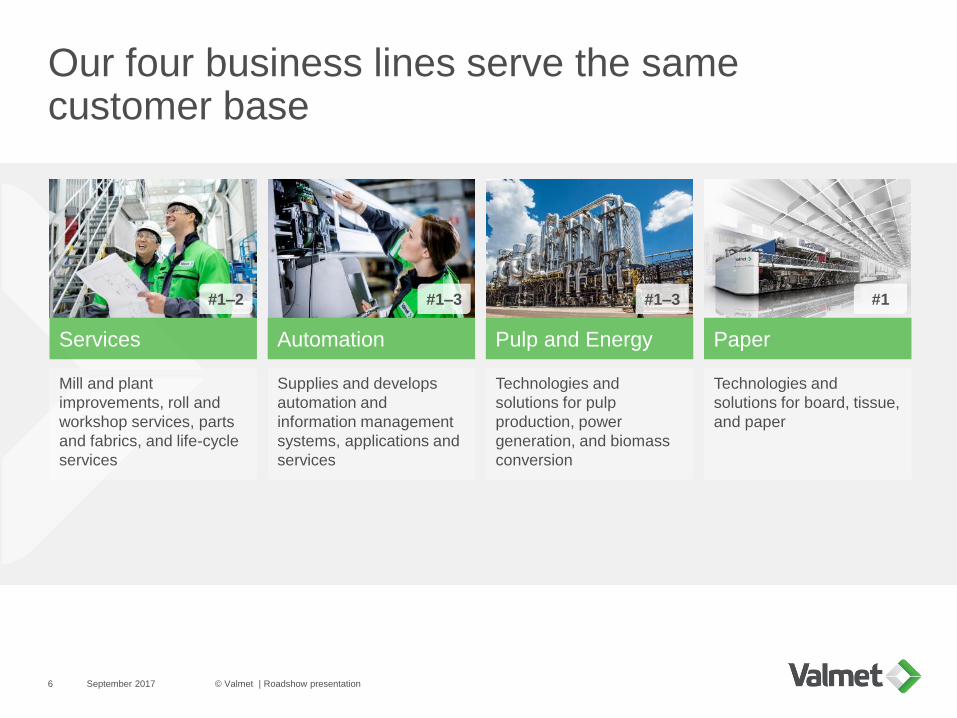
Our four business lines serve the samecustomer base
September 20176 © Valmet | Roadshow presentation
Services Automation Pulp and Energy Paper
#1–2 #1–3 #1–3 #1
Mill and plant
improvements, roll and
workshop services, parts
and fabrics, and life-cycle
services
Supplies and develops
automation and
information management
systems, applications and
services
Technologies and
solutions for pulp
production, power
generation, and biomass
conversion
Technologies and
solutions for board, tissue,
and paper

September 20177 © Valmet | Roadshow presentation
Strong, global presence is a good platform for growth
Over 120 service centers, 86 sales offices, 34 production units, 16 R&D centers
North America
1,262
• 17 service centers
• 7 production units
• 8 sales offices
Asia-Pacific
718
• 10 service centers
• 16 sales offices
EMEA
8,246
• 16 R&D centers
• 63 service centers
• 21 production units
• 54 sales offices
China
1,685
• 8 service centers
• 6 production units
• 3 sales offices
South America
547
• 3 service centers
• 2 production units
• 5 sales offices

Process technology, services and automation Valmet’s unique offering differentiates the company from its competitors
September 2017 © Valmet | Roadshow presentation8
Customer
Process-
technology
Services Automation

Significant, customer focused research and development work
September 2017 © Valmet | Roadshow presentation9
R&D focus areas
• Advanced and competitive technologies and services
• Raw material, water and energy efficiency
• Promotion of renewable materials
EUR 64million
R&D spending
in 2016
16
research and
development
centers
~1,500
protected
inventions

Acknowledged leader in sustainability
• In Dow Jones
Sustainability Index
for the third
consecutive year
• Awarded as an
Industry Mover
2017 in
sustainability
• In CDP Climate A
list for the first year
• In Ethibel
Sustainability Index
Excellence Europe
360°
Corporate
citizenship
Supply
chain
Health,
safety and
environment
Our
people
Our
solutions
We are a trusted partner
and respected corporate
citizen
We develop
sustainable supply
chain practices
We protect the safety of
our people and partners
and minimize our
environmental
impact
We are a responsible
employer and promote
diversity
We develop and provide
solutions that support
sustainability
360° approach to sustainability
September 2017 © Valmet | Roadshow presentation10

Financial targets
September 2017 © Valmet | Roadshow presentation11
Dividend
policy
Profitability
Growth
ROCE
• Net sales for stable business to grow over
two times the market growth
• Net sales for capital business to exceed
market growth
• Comparable EBITA: 8–10%
• Comparable return on capital employed (pre-
tax), ROCE1: 15–20%
• Dividend payout at least 50% of net profit
1) ROCE (pre-tax) = (profit before taxes + interests and other financial expenses) / (balance sheet total - non-interest-bearing liabilities)

Investment highlights
Investment highlight summary
September 2017 © Valmet | Roadshow presentation13
1
2
3
4
Strong market position in markets that grow
Stable business, with EUR 1.5 billion of net sales,
offering stability, growth and profitability
Capital business, with flexible cost structure, offering
growth and profitability potential
Continuous systematic development
5 Technology leader with unique offering

Strong market position in markets that grow
September 2017 © Valmet | Roadshow presentation14
• Capacity
increases in
China,
South America
and Asia-Pacific
• Growth in
energy
consumption
• Demand for
sustainable
energy
• Modernization
of aging plants
• Incentives and
regulation
• Growth in
paper, board,
and tissue
consumption
in Asia
• Need for virgin
wood pulp, as
recycling rates
can not grow
infinitely
• Increased size
of pulp lines and
mills
• World trade, e-
commerce and
emerging
markets growth
drive packaging
• Shift from
plastic
packaging to
renewable
materials
• Demand for
light-weight
board globally
• Growth in
emerging
markets
• Rise in
purchasing
power and living
standards in
emerging
markets
• Increasing role
of digital media
decreases
demand for
printing and
writing papers
• Some growth in
emerging
markets
Anticipated long-term market growthEstimated market size for current offering (EUR)
Source: Leading consulting firms, RISI, management estimates
Market drivers
• Investments in
new pulp and
paper machines
and power
plants
• Ageing
machines and
installed
automation
systems
• Demand for
intelligent
technology
40%of net sales
10%of net sales
20%of net sales
8%of net sales
9%of net sales
9%of net sales
% of net sales (2016)
5%of net sales
1 2 3 4
Services Automation Pulp Energy BoardTissue Paper
EUR
8.0bn
~1-2%p.a.
EUR
2.0bn
~1%p.a.
EUR
1.4bn
~1%p.a.
EUR
2.0bn
~1%p.a.
EUR
1.0bn
~2-3%p.a.
EUR
0.3bn
~-1%p.a.
#1–2 #1–3 #1–2 #1–3 #1#1 #1
EUR
0.7bn
~3%p.a.
5
Stable business, with EUR 1.5 billion of net sales, offering stability, growth and profitability
September 2017 © Valmet | Roadshow presentation15
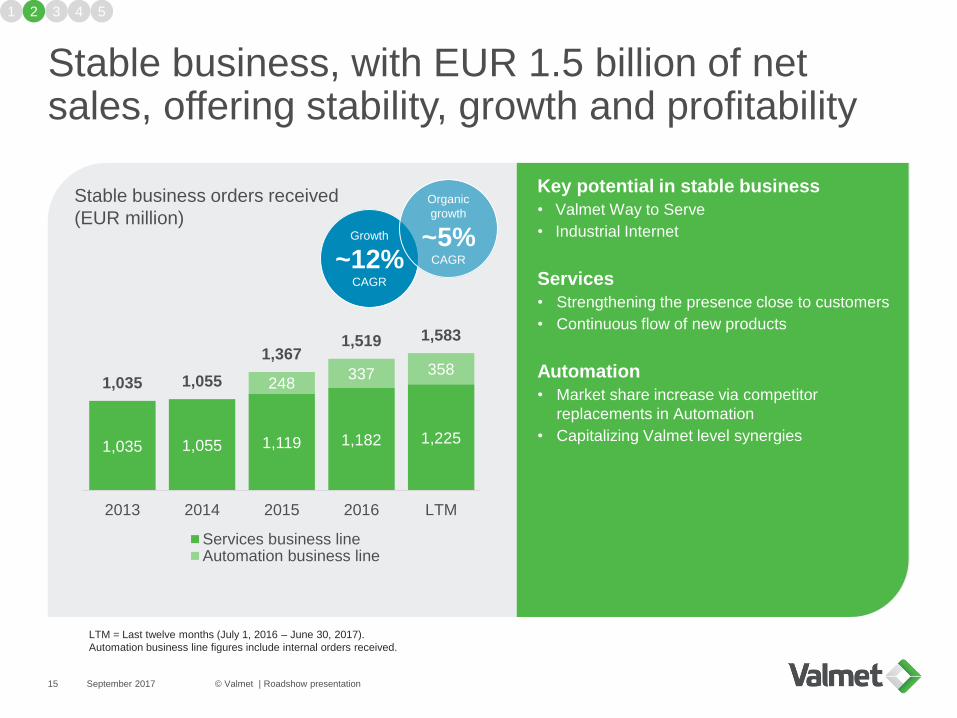
Stable business orders received
(EUR million)
1 2 3 4
1,035 1,055 1,119 1,182 1,225
248337 358
1,035 1,055
1,3671,519 1,583
2013 2014 2015 2016 LTM
Services business lineAutomation business line
Growth
~12%CAGR
Key potential in stable business
• Valmet Way to Serve
• Industrial Internet
Services
• Strengthening the presence close to customers
• Continuous flow of new products
Automation
• Market share increase via competitor
replacements in Automation
• Capitalizing Valmet level synergies
Organic
growth
~5%CAGR
5
LTM = Last twelve months (July 1, 2016 – June 30, 2017).
Automation business line figures include internal orders received.
Capital business, with flexible cost structure, offering growth and profitability potential
September 2017 © Valmet | Roadshow presentation16
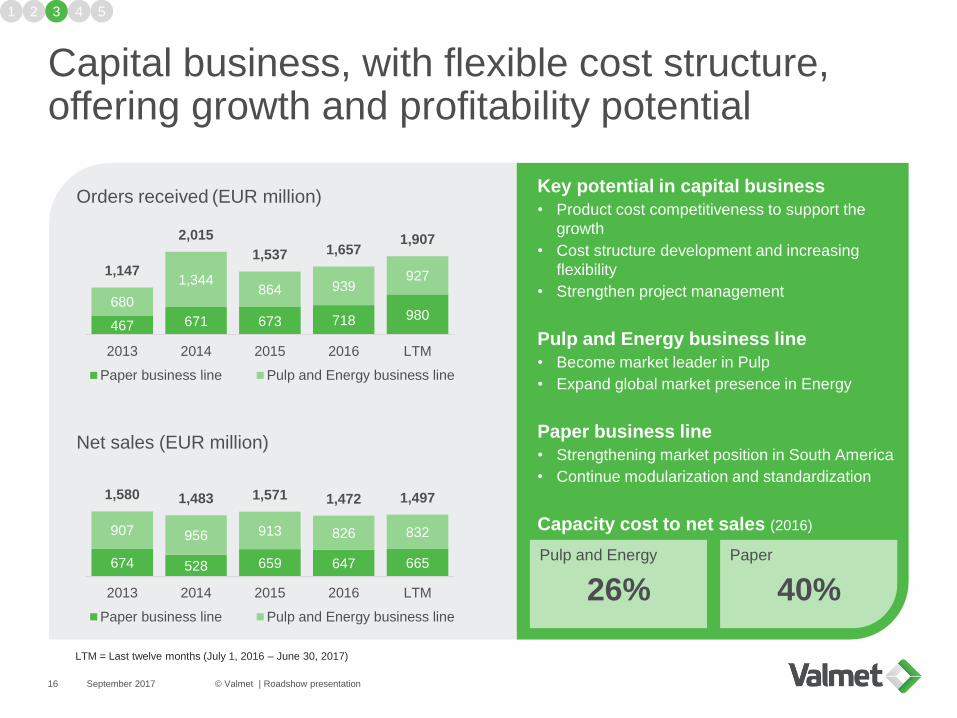
Orders received (EUR million)
Net sales (EUR million)
1 2 3 4
467 671 673 718 980680
1,344864 939
9271,147
2,015
1,537 1,6571,907
2013 2014 2015 2016 LTM
Paper business line Pulp and Energy business line
674 528 659 647 665
907 956 913 826 832
1,580 1,483 1,571 1,472 1,497
2013 2014 2015 2016 LTM
Paper business line Pulp and Energy business line
Key potential in capital business
• Product cost competitiveness to support the
growth
• Cost structure development and increasing
flexibility
• Strengthen project management
Pulp and Energy business line
• Become market leader in Pulp
• Expand global market presence in Energy
Paper business line
• Strengthening market position in South America
• Continue modularization and standardization
Capacity cost to net sales (2016)
Pulp and Energy
26%
Paper
40%
5
LTM = Last twelve months (July 1, 2016 – June 30, 2017)
Continuous systematic development
September 2017 © Valmet | Roadshow presentation17
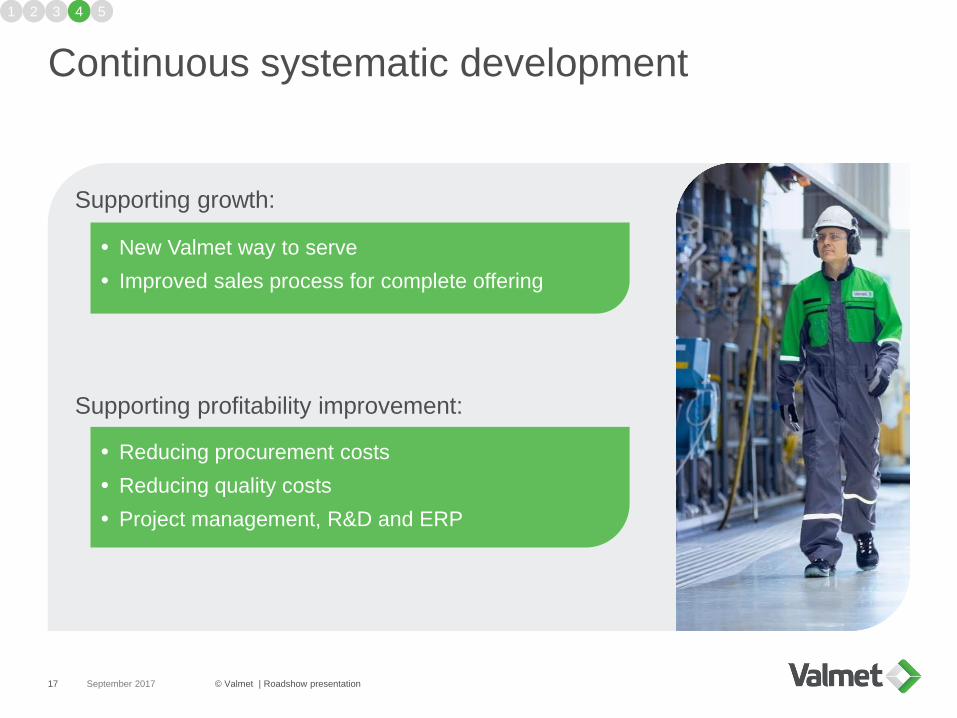
Supporting growth:
Supporting profitability improvement:
1 2 3 4
New Valmet way to serve
Improved sales process for complete offering
Reducing procurement costs
Reducing quality costs
Project management, R&D and ERP
5
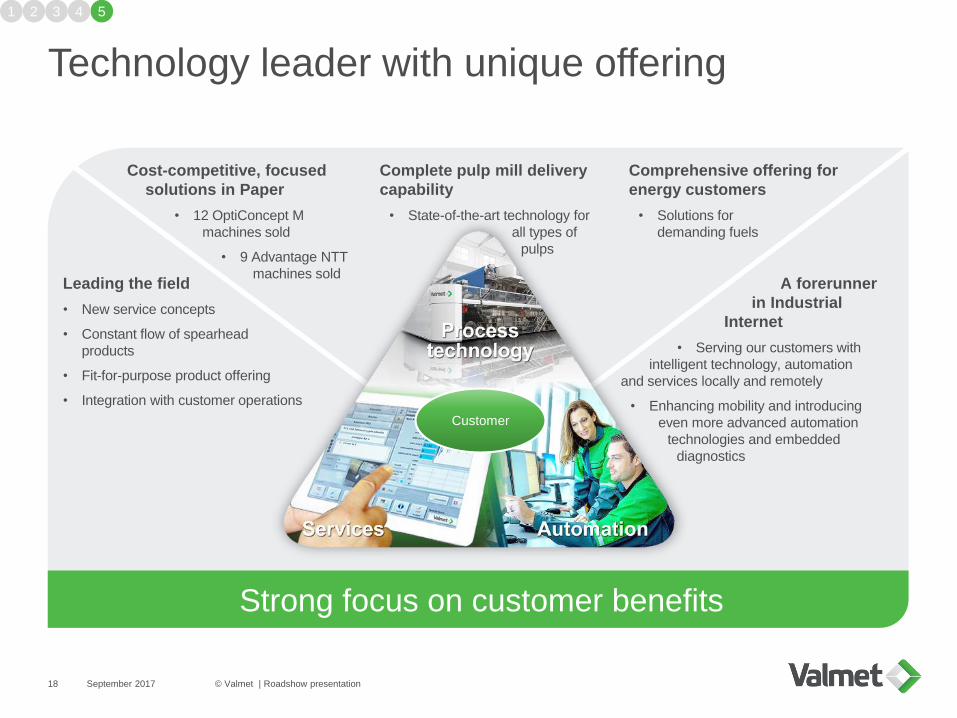
Technology leader with unique offering
September 2017 © Valmet | Roadshow presentation18
Customer
A forerunner
in Industrial
Internet
• Serving our customers with
intelligent technology, automation
and services locally and remotely
• Enhancing mobility and introducing
even more advanced automation
technologies and embedded
diagnostics
Leading the field
• New service concepts
• Constant flow of spearhead
products
• Fit-for-purpose product offering
• Integration with customer operations
Cost-competitive, focused
solutions in Paper
• 12 OptiConcept M
machines sold
• 9 Advantage NTT
machines sold
Complete pulp mill delivery
capability
• State-of-the-art technology for
all types of
pulps
Comprehensive offering for
energy customers
• Solutions for
demanding fuels
Strong focus on customer benefits
1 2 3 54
Financials
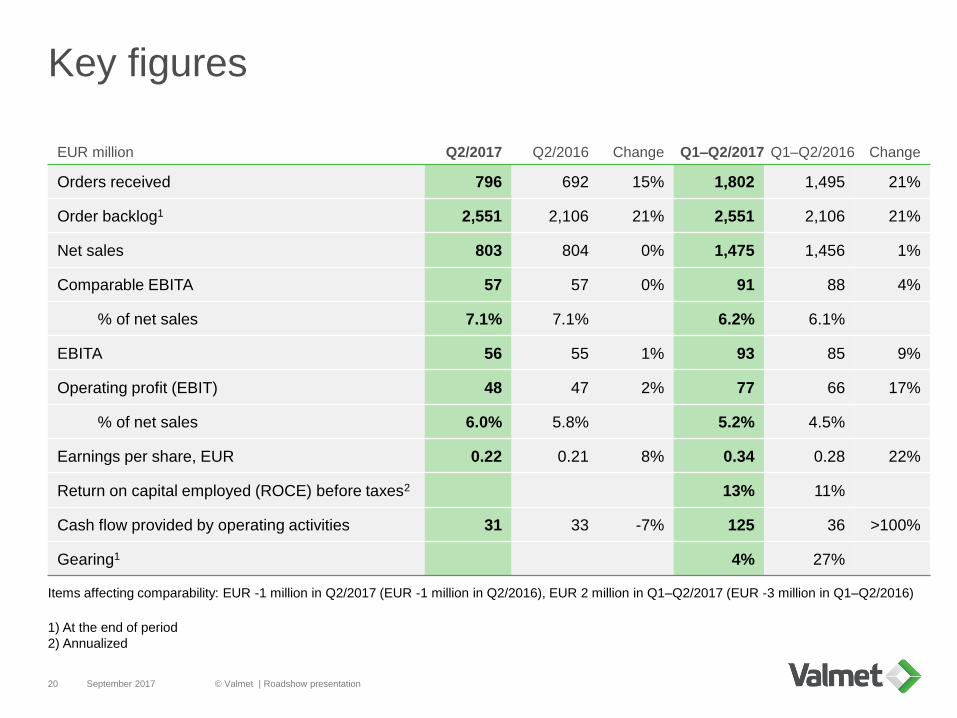
Key figures
September 2017 © Valmet | Roadshow presentation20
EUR million Q2/2017 Q2/2016 Change Q1–Q2/2017 Q1–Q2/2016 Change
Orders received 796 692 15% 1,802 1,495 21%
Order backlog1 2,551 2,106 21% 2,551 2,106 21%
Net sales 803 804 0% 1,475 1,456 1%
Comparable EBITA 57 57 0% 91 88 4%
% of net sales 7.1% 7.1% 6.2% 6.1%
EBITA 56 55 1% 93 85 9%
Operating profit (EBIT) 48 47 2% 77 66 17%
% of net sales 6.0% 5.8% 5.2% 4.5%
Earnings per share, EUR 0.22 0.21 8% 0.34 0.28 22%
Return on capital employed (ROCE) before taxes2 13% 11%
Cash flow provided by operating activities 31 33 -7% 125 36 >100%
Gearing1 4% 27%
Items affecting comparability: EUR -1 million in Q2/2017 (EUR -1 million in Q2/2016), EUR 2 million in Q1–Q2/2017 (EUR -3 million in Q1–Q2/2016)
1) At the end of period
2) Annualized

224251 235
278242
371334
409
314
377351
411
311
374295
337 354498
319
408400
445
338
427334
375
360
429
519
588 590
777
561
779734
854
652
804
685
785
671
803
0.7%
3.7% 5.5%
6.1%
3.5%
6.9%6.4%
7.3%
4.8%
7.1%
7.5%
7.2%
5.1%
7.1%
Q1/14 Q2/14 Q3/14 Q4/14 Q1/15 Q2/15 Q3/15 Q4/15 Q1/16 Q2/16 Q3/16 Q4/16 Q1/17 Q2/17
Capital business
Stable business
Comparable EBITA %
Comparable EBITA margin development
September 2017 © Valmet | Roadshow presentation21
Net sales and Comparable EBITA (EUR million and %)
• Net sales and Comparable EBITA remained at the previous year’s level
Comparable EBITA
(EUR million)19 54 47 63 314 22 32 48 57
Target 8–10%
52 56 35 57
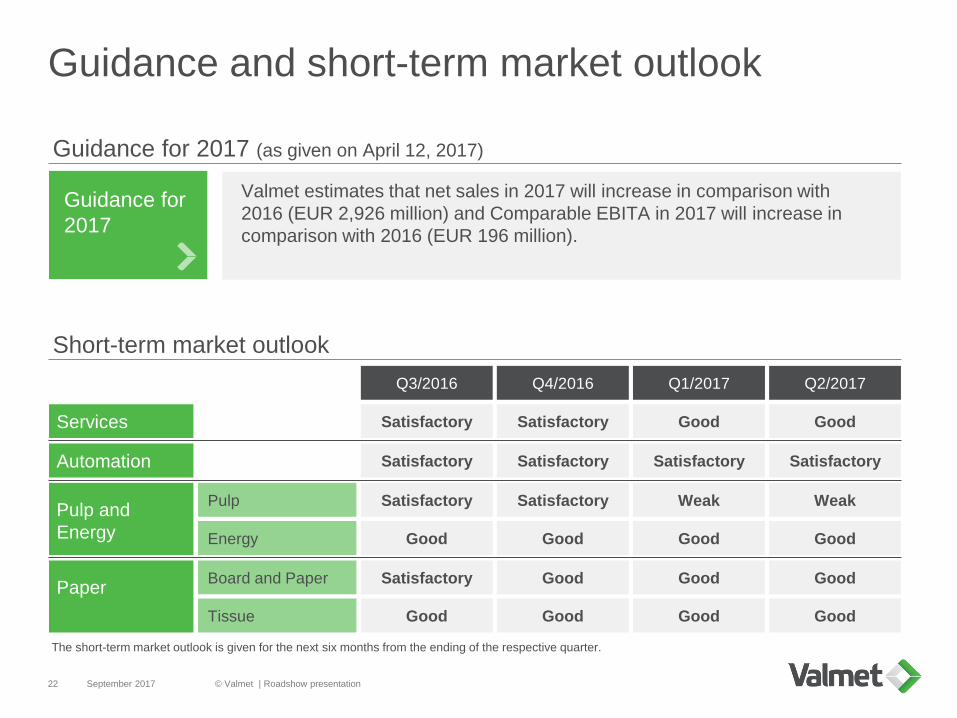
Guidance and short-term market outlook
September 2017 © Valmet | Roadshow presentation22
WeakPulp and
Energy
Paper
Satisfactory
Pulp
Energy
Board and Paper
Tissue
Guidance for
2017
Services
Short-term market outlook
Guidance for 2017 (as given on April 12, 2017)
Satisfactory
Good
Satisfactory
Good
Satisfactory
Satisfactory
Good
Good
Good
Q3/2016 Q4/2016
Good
Weak
Good
Good
Good
Q1/2017
Good
Good
Good
Good
Q2/2017
Valmet estimates that net sales in 2017 will increase in comparison with
2016 (EUR 2,926 million) and Comparable EBITA in 2017 will increase in
comparison with 2016 (EUR 196 million).
Satisfactory Satisfactory Satisfactory SatisfactoryAutomation
The short-term market outlook is given for the next six months from the ending of the respective quarter.

Conclusion

Conclusion
September 2017 © Valmet | Roadshow presentation24
1
2
3
4
Strong market position in markets that grow
Stable business, with EUR 1.5 billion of net sales,
offering stability, growth and profitability
Capital business, with flexible cost structure, offering
growth and profitability potential
Continuous systematic development
5 Technology leader with unique offering
Important notice
September 2017 © Valmet | Roadshow presentation25
It should be noted that certain statements herein which are not historical facts, including, without
limitation, those regarding expectations for general economic development and the market situation,
expectations for growth, profitability and investment willingness, expectations for company development,
growth and profitability and the realization of synergy benefits and cost savings, and statements
preceded by “anticipates”, “believes”, ”estimates”, “expects”, ”foresees” or similar expressions, are
forward-looking statements. Since these statements are based on current decisions and plans, estimates
and projections, they involve risks and uncertainties which may cause the actual results to materially
differ from the results currently expressed. Such factors include, but are not limited to:
1) general economic conditions, including fluctuations in exchange rates and interest levels which
influence the operating environment and profitability of customers of the company or economic growth in
the company’s principal geographic markets.
2) industry conditions, intensity of competition situation, especially potential introduction of significant
technological solutions developed by competitors, financial condition of the customers and the
competitors of the company,
3) the company’s own operating factors, such as the success of production, product development and
project management and the efficiencies therein including continuous development and improvement
4) the success of pending and future acquisitions and restructuring.
Appendix
September 2017 © Valmet | Roadshow presentation26
1 Financials
2 Focus areas and actions
3 Area development
4 Shareholders and share price development
5 Offering
6 Management
AppendixFinancials
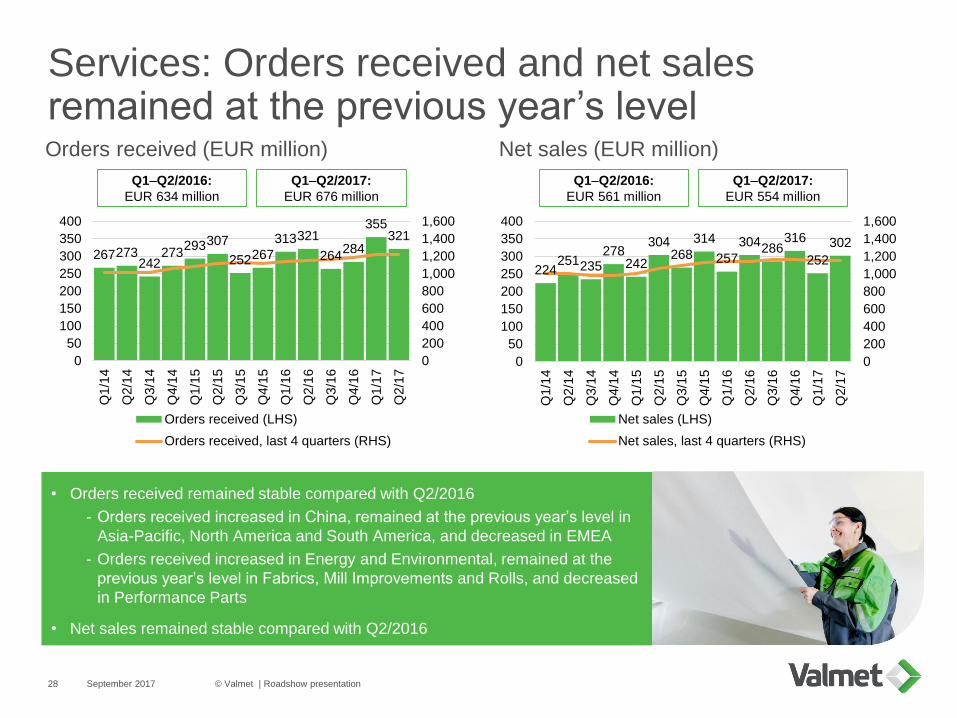
Services: Orders received and net sales remained at the previous year’s level
September 2017 © Valmet | Roadshow presentation28
Net sales (EUR million)Orders received (EUR million)
• Orders received remained stable compared with Q2/2016
- Orders received increased in China, remained at the previous year’s level in
Asia-Pacific, North America and South America, and decreased in EMEA
- Orders received increased in Energy and Environmental, remained at the
previous year’s level in Fabrics, Mill Improvements and Rolls, and decreased
in Performance Parts
• Net sales remained stable compared with Q2/2016
Q1–Q2/2017:
EUR 676 million
Q1–Q2/2017:
EUR 554 million
Q1–Q2/2016:
EUR 634 million
Q1–Q2/2016:
EUR 561 million
267273242
273293307
252267
313321
264284
355321
0
200
400
600
800
1,000
1,200
1,400
1,600
0
50
100
150
200
250
300
350
400
Q1/1
4
Q2/1
4
Q3/1
4
Q4/1
4
Q1/1
5
Q2/1
5
Q3/1
5
Q4/1
5
Q1/1
6
Q2/1
6
Q3/1
6
Q4/1
6
Q1/1
7
Q2/1
7
Orders received (LHS)
Orders received, last 4 quarters (RHS)
224251235
278242
304268
314
257
304286
316
252
302
0
200
400
600
800
1,000
1,200
1,400
1,600
0
50
100
150
200
250
300
350
400
Q1/1
4
Q2/1
4
Q3/1
4
Q4/1
4
Q1/1
5
Q2/1
5
Q3/1
5
Q4/1
5
Q1/1
6
Q2/1
6
Q3/1
6
Q4/1
6
Q1/1
7
Q2/1
7
Net sales (LHS)
Net sales, last 4 quarters (RHS)

Automation: Orders received increased and net sales remained at the previous year’s level
September 2017 © Valmet | Roadshow presentation29
• Orders received increased compared with Q2/2016
- Orders received increased in China, North America and Asia-Pacific, and
decreased in South America and EMEA
- Orders received increased in Pulp and Paper, and decreased in Energy and
Process
• Net sales remained stable compared with Q2/2016
1) Q1/2015 orders received and the underlying figures for ‘Orders received, last 4 quarters’ and ‘Net sales, last 4 quarters’ are calculated based on Metso’s reported figures and pro
forma figures excluding Process Automation Systems and are therefore indicative only.
Q1–Q2/2017:
EUR 192 million
Q1–Q2/2017:
EUR 152 million
Q1–Q2/2016:
EUR 170 million
Q1–Q2/2016:
EUR 148 million
Net sales1 (EUR million)Orders received1 (EUR million)
8570 67 66
82 72 78 7291
10
8 8 156
79 16
12
62
95
78 7581
8880
87 88
103
0
75
150
225
300
375
450
0
20
40
60
80
100
120
Q1/1
5
Q2/1
5
Q3/1
5
Q4/1
5
Q1/1
6
Q2/1
6
Q3/1
6
Q4/1
6
Q1/1
7
Q2/1
7
Orders received, internal (from other business lines)Orders received, externalOrders received, total (including internal)Orders received, last 4 quarters (RHS)
68 66
95
5873 65
94
5973
11 6
6
9
84
5
128
55
7972
101
66
8169
99
7280
0
75
150
225
300
375
450
0
20
40
60
80
100
120
Q1/1
5
Q2/1
5
Q3/1
5
Q4/1
5
Q1/1
6
Q2/1
6
Q3/1
6
Q4/1
6
Q1/1
7
Q2/1
7
Net sales, internal (from other business lines)Net sales, externalNet sales, total (including internal)Net sales, last 4 quarters (RHS)
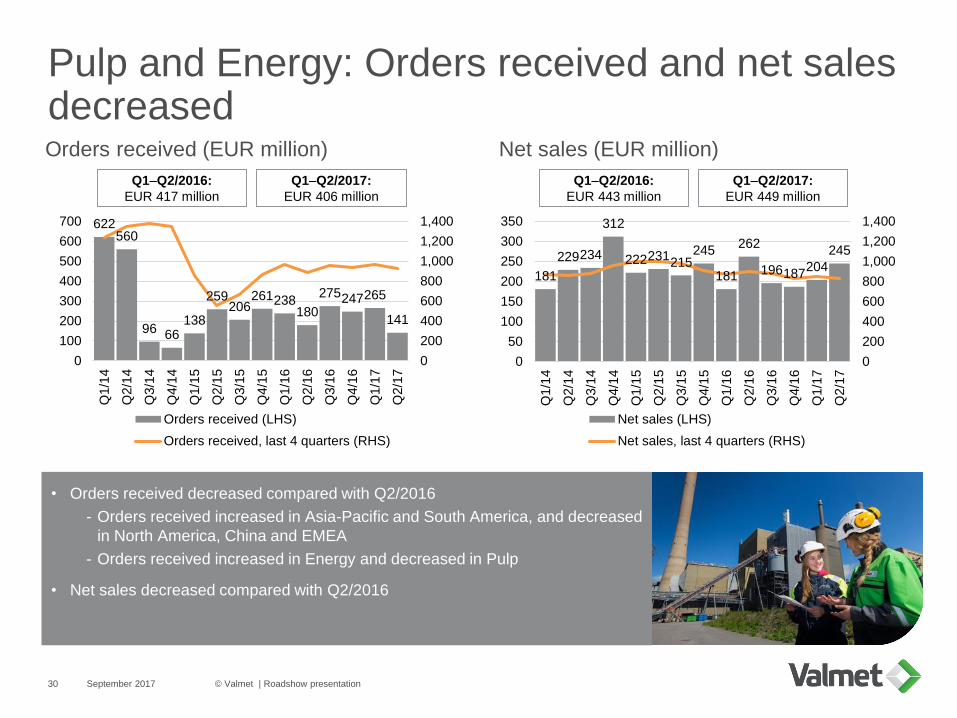
Pulp and Energy: Orders received and net sales decreased
September 2017 © Valmet | Roadshow presentation30
Net sales (EUR million)Orders received (EUR million)
• Orders received decreased compared with Q2/2016
- Orders received increased in Asia-Pacific and South America, and decreased
in North America, China and EMEA
- Orders received increased in Energy and decreased in Pulp
• Net sales decreased compared with Q2/2016
Q1–Q2/2017:
EUR 406 million
Q1–Q2/2017:
EUR 449 million
Q1–Q2/2016:
EUR 417 million
Q1–Q2/2016:
EUR 443 million
622560
96 66138
259206
261238180
275247265
141
0
200
400
600
800
1,000
1,200
1,400
0
100
200
300
400
500
600
700
Q1/1
4
Q2/1
4
Q3/1
4
Q4/1
4
Q1/1
5
Q2/1
5
Q3/1
5
Q4/1
5
Q1/1
6
Q2/1
6
Q3/1
6
Q4/1
6
Q1/1
7
Q2/1
7
Orders received (LHS)
Orders received, last 4 quarters (RHS)
181
229234
312
222231215
245
181
262
196187204
245
0
200
400
600
800
1,000
1,200
1,400
0
50
100
150
200
250
300
350
Q1/1
4
Q2/1
4
Q3/1
4
Q4/1
4
Q1/1
5
Q2/1
5
Q3/1
5
Q4/1
5
Q1/1
6
Q2/1
6
Q3/1
6
Q4/1
6
Q1/1
7
Q2/1
7
Net sales (LHS)
Net sales, last 4 quarters (RHS)
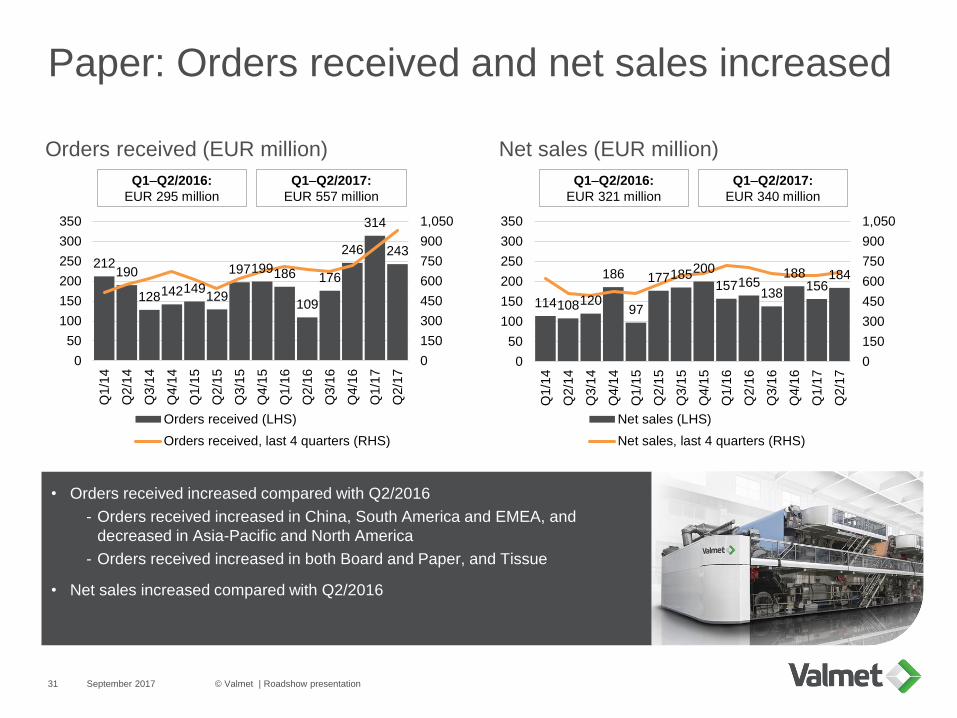
Paper: Orders received and net sales increased
September 2017 © Valmet | Roadshow presentation31
Net sales (EUR million)Orders received (EUR million)
• Orders received increased compared with Q2/2016
- Orders received increased in China, South America and EMEA, and
decreased in Asia-Pacific and North America
- Orders received increased in both Board and Paper, and Tissue
• Net sales increased compared with Q2/2016
Q1–Q2/2017:
EUR 557 million
Q1–Q2/2017:
EUR 340 million
Q1–Q2/2016:
EUR 295 million
Q1–Q2/2016:
EUR 321 million
212190
128142149129
197199186
109
176
246
314
243
0
150
300
450
600
750
900
1,050
0
50
100
150
200
250
300
350
Q1/1
4
Q2/1
4
Q3/1
4
Q4/1
4
Q1/1
5
Q2/1
5
Q3/1
5
Q4/1
5
Q1/1
6
Q2/1
6
Q3/1
6
Q4/1
6
Q1/1
7
Q2/1
7
Orders received (LHS)
Orders received, last 4 quarters (RHS)
114108120
186
97
177185200
157165138
188156
184
0
150
300
450
600
750
900
1,050
0
50
100
150
200
250
300
350
Q1/1
4
Q2/1
4
Q3/1
4
Q4/1
4
Q1/1
5
Q2/1
5
Q3/1
5
Q4/1
5
Q1/1
6
Q2/1
6
Q3/1
6
Q4/1
6
Q1/1
7
Q2/1
7
Net sales (LHS)
Net sales, last 4 quarters (RHS)
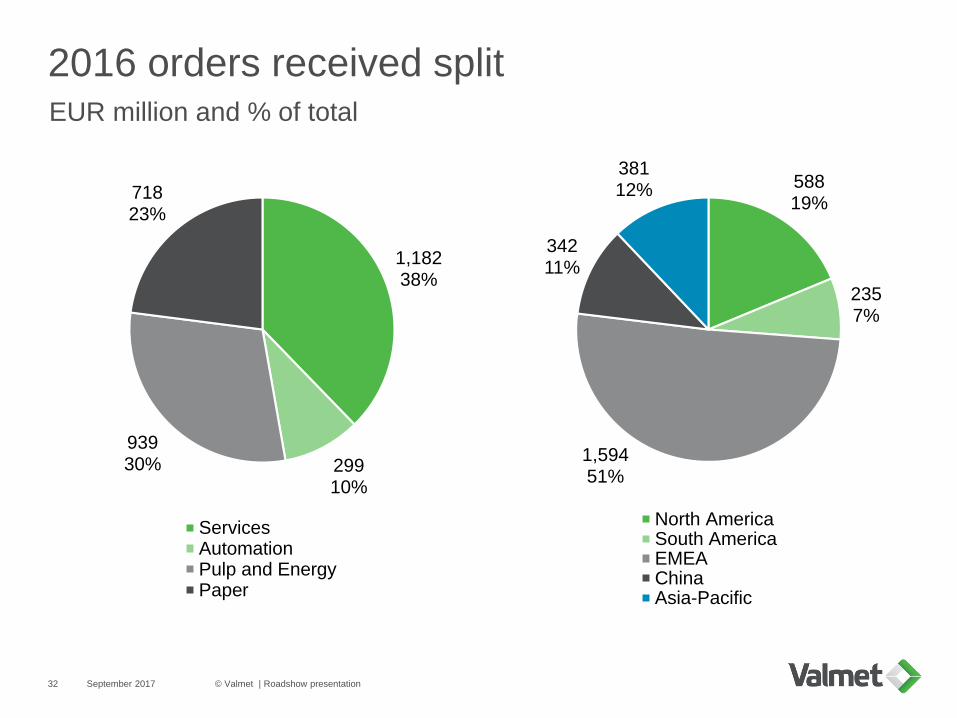
2016 orders received splitEUR million and % of total
September 2017 © Valmet | Roadshow presentation32
58819%
2357%
1,59451%
34211%
38112%
North AmericaSouth AmericaEMEAChinaAsia-Pacific
1,18238%
29910%
93930%
71823%
ServicesAutomationPulp and EnergyPaper
8%
11%
10%
6%
5%
7%3%
20%
8%
9%
9%5%
Rolls
Mill Improvements
Fabrics
Pulp and PaperEnegy and
Process
Pulp
Energy
Tissue
Board
Paper
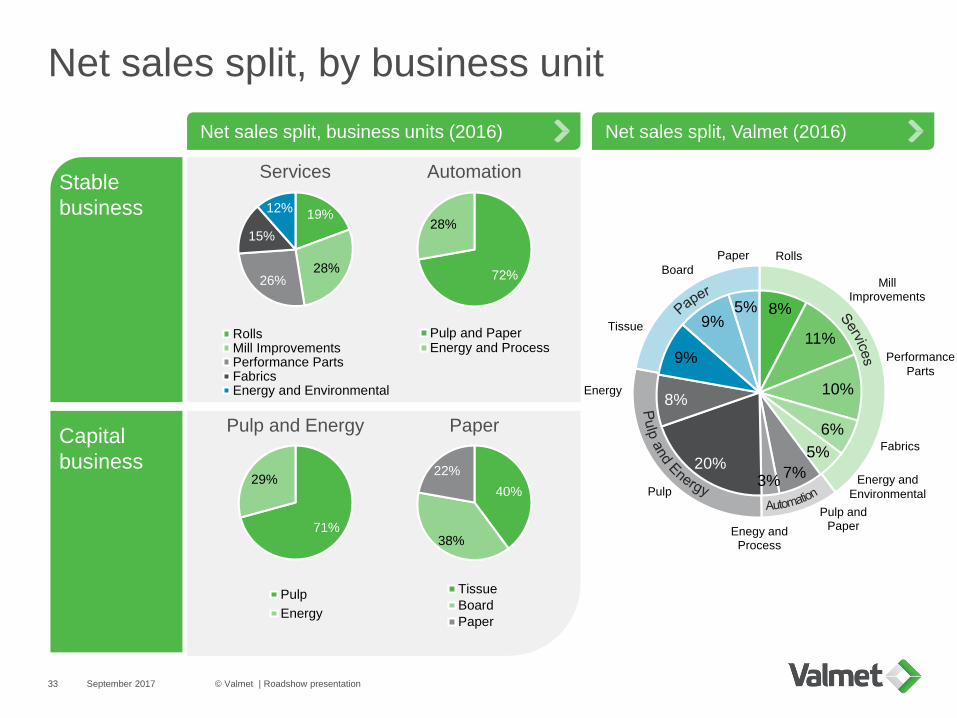
Net sales split, by business unit
September 2017 © Valmet | Roadshow presentation33
Capital
business
Stable
business
Net sales split, business units (2016) Net sales split, Valmet (2016)
Performance
Parts
Energy and
Environmental
19%
28%26%
15%
12%
RollsMill ImprovementsPerformance PartsFabricsEnergy and Environmental
72%
28%
Pulp and PaperEnergy and Process
Services Automation
Pulp and Energy Paper
71%
29%
Pulp
Energy
40%
38%
22%
Tissue
Board
Paper
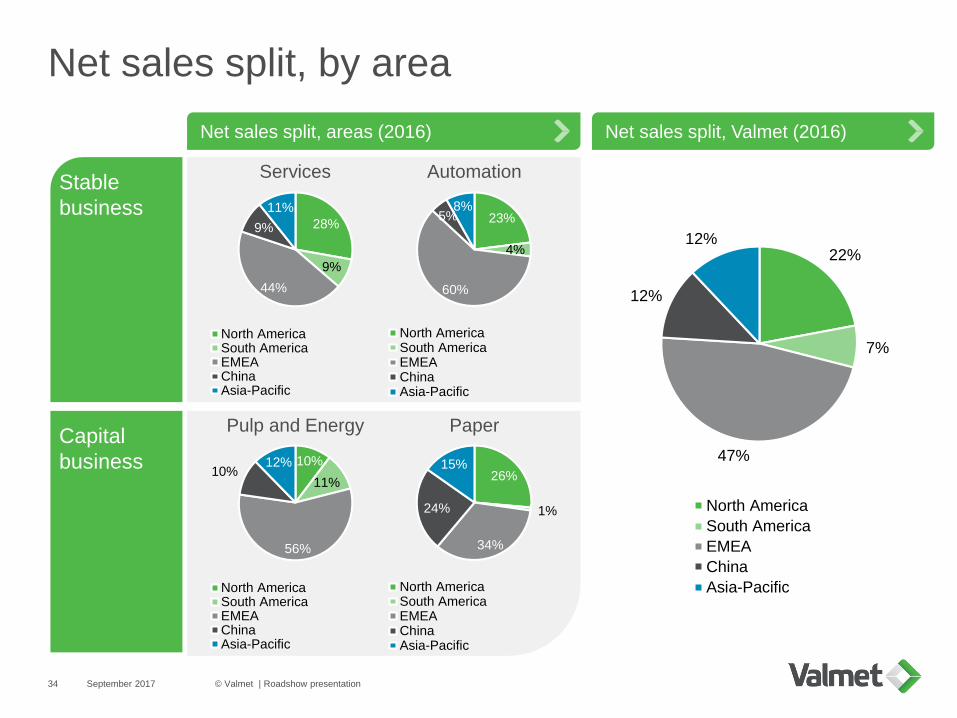
Net sales split, by area
September 2017 © Valmet | Roadshow presentation34
Capital
business
Stable
business
Net sales split, areas (2016) Net sales split, Valmet (2016)
28%
9%
44%
9%
11%
North AmericaSouth AmericaEMEAChinaAsia-Pacific
23%
4%
60%
5%8%
North AmericaSouth AmericaEMEAChinaAsia-Pacific
Services Automation
Pulp and Energy Paper
10%
11%
56%
10%12%
North AmericaSouth AmericaEMEAChinaAsia-Pacific
26%
1%
34%
24%
15%
North AmericaSouth AmericaEMEAChinaAsia-Pacific
22%
7%
47%
12%
12%
North America
South America
EMEA
China
Asia-Pacific

Date Booked
quarter
Description Business line Country Value
Jan 3 Q4 Modernization of a flue gas desulphurization (FGD) at a combined heat
and power (CHP) plant
Pulp and Energy Poland Not disclosed. The value of a project of this size and scope is typically
around EUR 2 million.
Jan 11 Q4 Automation technology to a waste-to-energy facility Automation United Kingdom Not disclosed1
Jan 18 Q4 New evaporation plant, a combustion plant for gases generated in the
production process and related automation systems
Pulp and Energy Russia Not disclosed. The value of an order of this type is typically valued around
EUR 40 million.
Jan 23 Q4 Three board machine rebuilds Paper North America Not disclosed. The combined value of these types of orders is typically
valued at EUR 20-30 million.
Feb 9 Q1 Paper machine rebuild Paper USA Not disclosed. The value of an order of this type is typically EUR 60-70
million.
Feb 14 Q4 Online condition monitoring system Automation China Not disclosed1
Feb 28 Q1 Paper machine rebuild Paper Netherlands Not disclosed.
Mar 2 Q4 Evaporation line Pulp and Energy South Africa Not disclosed. The value of an order of this type is typically below EUR 10
million.
Mar 8 Q4 Two containerboard production lines and related automation systems Paper China Not disclosed. The value of an order of this type and scale is typically valued
around EUR 110-130 million.
Mar 9 Q1 Multifuel power boiler and a flue gas cleaning system Pulp and Energy Japan Not disclosed. The value of this kind of a delivery is usually around EUR 50
million.
Mar 14 Q4 Automation for a RoPax vessel Automation Finland Not disclosed1
Mar 21 Q4 Total solids measurement technology Automation China Not disclosed
Mar 22 Q1 Winder to a board machine Paper China Not disclosed. The value of an order of this type and scope is typically
around EUR 5-10 million.
Mar 28 Q1 Biomass-fired boiler and a flue gas cleaning system Pulp and Energy Japan Not disclosed. The value of an order of this type and scope is typically
around EUR 30-45 million.
Mar 29 Q1 OptiConcept M fine paper machine Paper United Arab Emirates Not disclosed. The value of an order of this type and scope is typically
around EUR 30-45 million.
Mar 30 Q4 Automation system for a chlorine plant Automation Sweden Not disclosed.
Apr 6 Q4 Automation technology Automation Vietnam Not disclosed. The order value of this kind of automation system deliveries
ranges from EUR 3 million to EUR 6 million
Apr 7 Q1 Advantage ThruAir (TAD) machine Paper North America Not disclosed.
Apr 10 Q4 Advantage ThruAir tissue line Paper USA Not disclosed.
Apr 11 Q1 DNA automation systems (DCS) and IQ quality control systems (QCS) Automation China Not disclosed.1
Apr 12 Q1 Automation engineering Automation Nordic countries Not disclosed.
May 2 Q4 Bleaching plant Pulp and Energy Brazil Not disclosed. A typical value for this scope of supply is around EUR 30-50
million
May 17 Q1 Dewatering equipment and an automatic pulper feed system Pulp and Energy Sweden Not disclosed.
May 22 Q2 Off-machine coater rebuild Paper South Korea Not disclosed. The value of an order of this type is typically EUR 10-20
million.
May 30 Q1 DNA automation system for an arctic icebreaking tanker Automation Finland Not disclosed.
Jun 1 Q2 Tissue machine rebuild Paper El Salvador Not disclosed.
Jun 7 Q1 Upgrade of washing process area for fluting mill Paper Finland Not disclosed.
Jun 19 Q1 Advantage NTT tissue production line Paper Spain Not disclosed.
Jun 27 Q2 Advantage DCT tissue line and automation Paper Russia Not disclosed.
Jun 28 Q2 Complete tissue production line and automation Paper Spain Not disclosed.
Jun 29 Q2 Two containerboard machines Paper China Not disclosed. The value of an order of this type and scale is typically around
EUR 100-120 million.
Jun 29 Q2 Automation Automation Nordic countries Not disclosed.
Jun 30 Q2 Biomass power plant and automation Pulp and Energy Denmark The value of the order is approximately EUR 80 million.
Announced orders in H1/2017
September 2017 © Valmet | Roadshow presentation35
1) Typically the order value of automation system deliveries ranges from below EUR 1 million to EUR 3 million

Date Booked
quarter
Description Business line Country Value
Jul 6 Q1 Defibrator system Pulp and Energy China Not disclosed. The value of a project of this size and scope is typically
valued in the rage of EUR 1.5 –5 million.
Announced orders in H2/2017
September 2017 © Valmet | Roadshow presentation36
1) Typically the order value of automation system deliveries ranges from below EUR 1 million to EUR 3 million
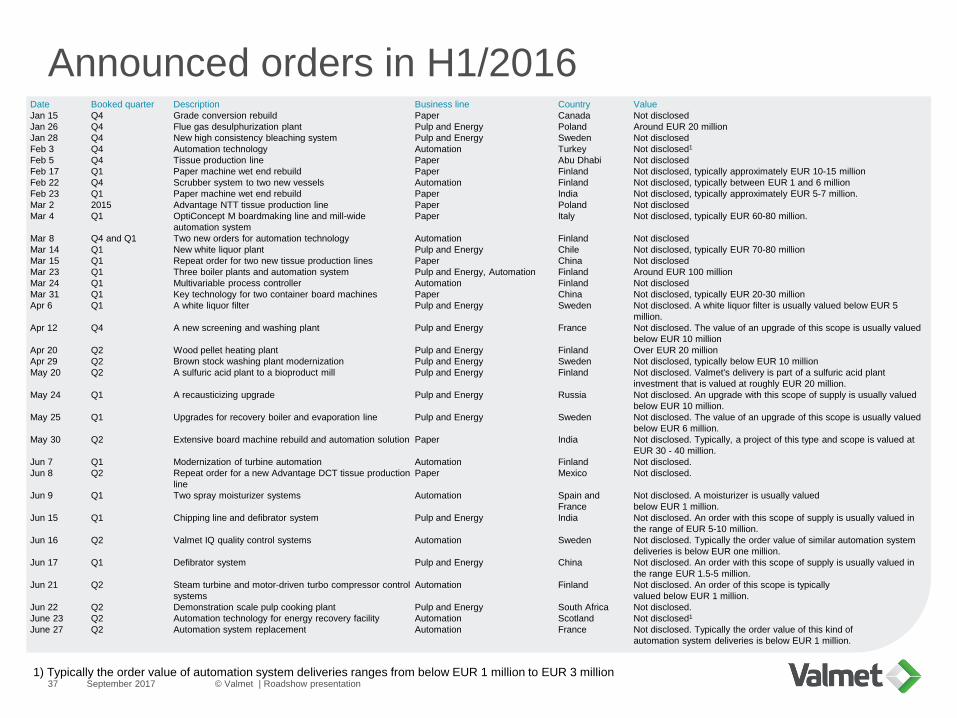
Announced orders in H1/2016
September 2017 © Valmet | Roadshow presentation371) Typically the order value of automation system deliveries ranges from below EUR 1 million to EUR 3 million
Date Booked quarter Description Business line Country Value
Jan 15 Q4 Grade conversion rebuild Paper Canada Not disclosed
Jan 26 Q4 Flue gas desulphurization plant Pulp and Energy Poland Around EUR 20 million
Jan 28 Q4 New high consistency bleaching system Pulp and Energy Sweden Not disclosed
Feb 3 Q4 Automation technology Automation Turkey Not disclosed1
Feb 5 Q4 Tissue production line Paper Abu Dhabi Not disclosed
Feb 17 Q1 Paper machine wet end rebuild Paper Finland Not disclosed, typically approximately EUR 10-15 million
Feb 22 Q4 Scrubber system to two new vessels Automation Finland Not disclosed, typically between EUR 1 and 6 million
Feb 23 Q1 Paper machine wet end rebuild Paper India Not disclosed, typically approximately EUR 5-7 million.
Mar 2 2015 Advantage NTT tissue production line Paper Poland Not disclosed
Mar 4 Q1 OptiConcept M boardmaking line and mill-wide
automation system
Paper Italy Not disclosed, typically EUR 60-80 million.
Mar 8 Q4 and Q1 Two new orders for automation technology Automation Finland Not disclosed
Mar 14 Q1 New white liquor plant Pulp and Energy Chile Not disclosed, typically EUR 70-80 million
Mar 15 Q1 Repeat order for two new tissue production lines Paper China Not disclosed
Mar 23 Q1 Three boiler plants and automation system Pulp and Energy, Automation Finland Around EUR 100 million
Mar 24 Q1 Multivariable process controller Automation Finland Not disclosed
Mar 31 Q1 Key technology for two container board machines Paper China Not disclosed, typically EUR 20-30 million
Apr 6 Q1 A white liquor filter Pulp and Energy Sweden Not disclosed. A white liquor filter is usually valued below EUR 5
million.
Apr 12 Q4 A new screening and washing plant Pulp and Energy France Not disclosed. The value of an upgrade of this scope is usually valued
below EUR 10 million
Apr 20 Q2 Wood pellet heating plant Pulp and Energy Finland Over EUR 20 million
Apr 29 Q2 Brown stock washing plant modernization Pulp and Energy Sweden Not disclosed, typically below EUR 10 million
May 20 Q2 A sulfuric acid plant to a bioproduct mill Pulp and Energy Finland Not disclosed. Valmet's delivery is part of a sulfuric acid plant
investment that is valued at roughly EUR 20 million.
May 24 Q1 A recausticizing upgrade Pulp and Energy Russia Not disclosed. An upgrade with this scope of supply is usually valued
below EUR 10 million.
May 25 Q1 Upgrades for recovery boiler and evaporation line Pulp and Energy Sweden Not disclosed. The value of an upgrade of this scope is usually valued
below EUR 6 million.
May 30 Q2 Extensive board machine rebuild and automation solution Paper India Not disclosed. Typically, a project of this type and scope is valued at
EUR 30 - 40 million.
Jun 7 Q1 Modernization of turbine automation Automation Finland Not disclosed.
Jun 8 Q2 Repeat order for a new Advantage DCT tissue production
line
Paper Mexico Not disclosed.
Jun 9 Q1 Two spray moisturizer systems Automation Spain and
France
Not disclosed. A moisturizer is usually valued
below EUR 1 million.
Jun 15 Q1 Chipping line and defibrator system Pulp and Energy India Not disclosed. An order with this scope of supply is usually valued in
the range of EUR 5-10 million.
Jun 16 Q2 Valmet IQ quality control systems Automation Sweden Not disclosed. Typically the order value of similar automation system
deliveries is below EUR one million.
Jun 17 Q1 Defibrator system Pulp and Energy China Not disclosed. An order with this scope of supply is usually valued in
the range EUR 1.5-5 million.
Jun 21 Q2 Steam turbine and motor-driven turbo compressor control
systems
Automation Finland Not disclosed. An order of this scope is typically
valued below EUR 1 million.
Jun 22 Q2 Demonstration scale pulp cooking plant Pulp and Energy South Africa Not disclosed.
June 23 Q2 Automation technology for energy recovery facility Automation Scotland Not disclosed1
June 27 Q2 Automation system replacement Automation France Not disclosed. Typically the order value of this kind of
automation system deliveries is below EUR 1 million.

Announced orders in H2/2016
September 2017 © Valmet | Roadshow presentation38
Date Booked
quarter
Description Business line Country Value
Jul 1 Q1 Automation technology Automation Malaysia Not disclosed1
Jul 4 Q2 Biomass-fired boiler plant and related automation and
environmental systems
Pulp and Energy Russia Not disclosed
Jul 12 Q1 Advanced process control (APC) systems and analyzers Automation Japan Not disclosed
Aug 10 Q2 Moisturizer system Automation China Not disclosed
Sep 7 Q3 Biomass-fired power boiler, biofuel storage and conveyor
systems
Pulp and Energy Denmark Over EUR 150 million
Sep 9 Q3 Key technologies for new board machine Paper Vietnam Not disclosed. The value of an order of this type is typically
EUR 15–20 millions.
Sep 14 Q3 Biofuel boiler and related environmental systems Pulp and Energy Sweden About EUR 60 million
Sep 16 Q2 Quality control system Automation France Not disclosed. Typically the order value of this kind of
automation system deliveries is below EUR one million.
Sep 19 Q2 Waste to energy boiler plant Pulp and Energy China Not disclosed
Sep 20 Q2 Tissue machine rebuilds Paper Germany and Sweden Not disclosed
Sep 29 Q3 Paper machine modifications and a new winder Paper Austria Not disclosed. The value of an order of this type is typically
EUR 5-10 million.
Sep 30 Q2 Automation solution to boost district heat production Automation Finland Not disclosed
Sep 30 Q2 New rewinder Paper Italy Not disclosed
Oct 3 Q3 Automation and remote control technology Automation Finland Not disclosed1
Oct 4 Q3 Extensive board machine and automation rebuild Paper Russia Not disclosed. The value of an order of this type is typically
EUR 50-60 million.
Oct 13 Q3 Two advantage NTT tissue lines Paper USA Not disclosed
Oct 18 Q4 Multifuel power boiler and flue gas cleaning system Pulp and Energy Japan Around EUR 40 million.
Oct 19 Q3 Automation system modernization Automation Finland Not disclosed
Nov 2 Q3 Headbox upgrade for a paper mill Paper China Around EUR 1 million.
Nov 14 Q3 Repeat order for process and quality vision system Automation Finland Not disclosed. Typically the order value of this kind of
automation system deliveries is below EUR one million.
Dec 7 Q3 Automation technology Automation India Not disclosed. Typically the order value of this kind of
automation system deliveries is below EUR one million.
Dec 14 Q3 Capacity increase update for a board machine Paper Spain Not disclosed. The value of an upgrade of this scope is usually
valued around EUR 4 million excluding the paper machine
clothing agreement.
Dec 16 Q4 Key technology for a new green field dissolving pulp mill Pulp and Energy Laos Around EUR 20 million.
Dec 28 Q3 Automation system Automation Finland Not disclosed
Dec 29 Q3 Defibrator system for a fiberboard line Pulp and Energy China Not disclosed. The value of an order of this type is typically
EUR 1.5-5 million.
Dec 30 Q3 White liquor pressure disc filter for a pulp mill Pulp and Energy Japan Not disclosed. The value of this kind of an order is typically
less than EUR 5 million.
1) Typically the order value of automation system deliveries ranges from below EUR 1 million to EUR 3 million
1,1011,023
466 480580
781 725 793 803692
788 8571,005
796
0
500
1,000
1,500
2,000
2,500
3,000
3,500
0
200
400
600
800
1,000
1,200
1,400
Q1/1
4
Q2/1
4
Q3/1
4
Q4/1
4
Q1/1
5
Q2/1
5
Q3/1
5
Q4/1
5
Q1/1
6
Q2/1
6
Q3/1
6
Q4/1
6
Q1/1
7
Q2/1
7Orders received (LHS) Last 4 quarters (RHS)
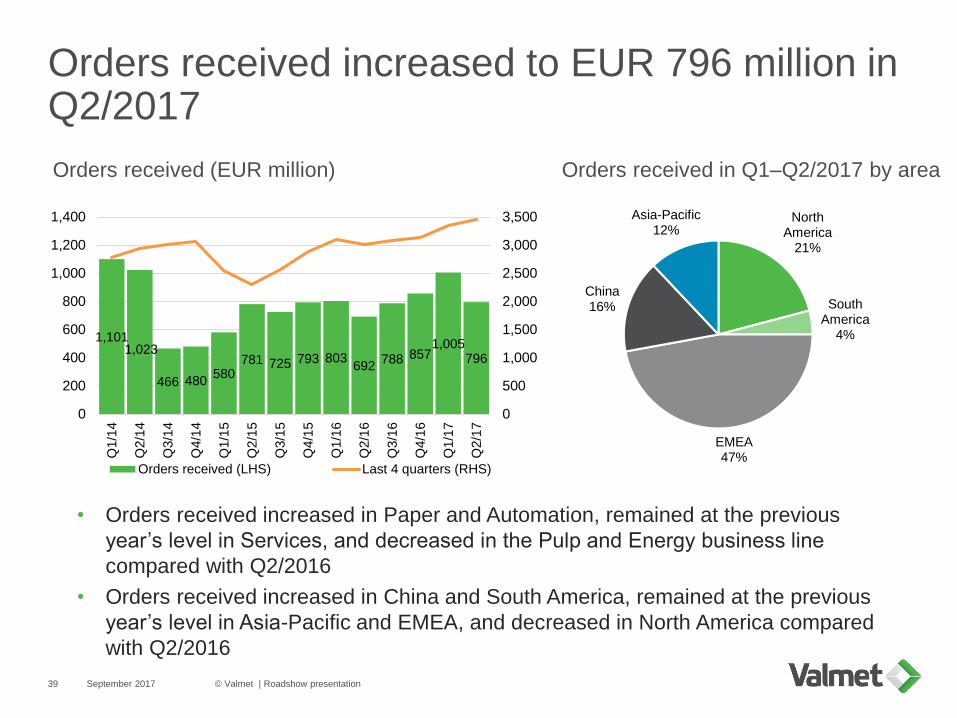
Orders received increased to EUR 796 million in Q2/2017
September 2017 © Valmet | Roadshow presentation39
• Orders received increased in Paper and Automation, remained at the previous
year’s level in Services, and decreased in the Pulp and Energy business line
compared with Q2/2016
• Orders received increased in China and South America, remained at the previous
year’s level in Asia-Pacific and EMEA, and decreased in North America compared
with Q2/2016
Orders received (EUR million) Orders received in Q1–Q2/2017 by area
North America
21%
South America
4%
EMEA47%
China16%
Asia-Pacific12%
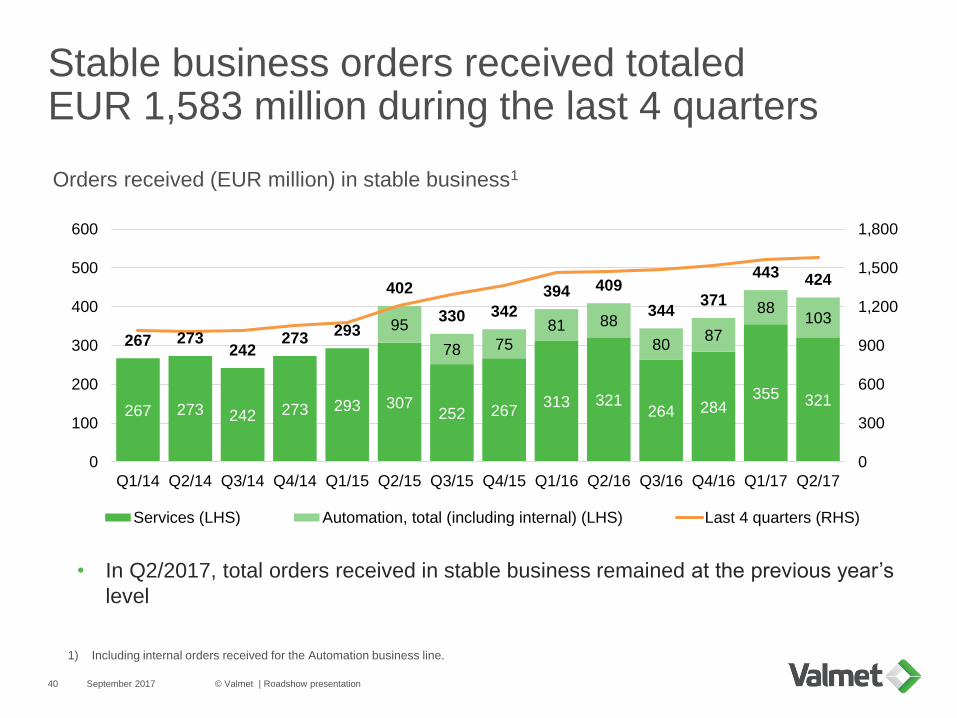
267 273 242 273 293 307252 267
313 321264 284
355 321
95
78 75
81 88
8087
88103
267 273242
273293
402
330 342
394 409
344371
443 424
0
300
600
900
1,200
1,500
1,800
0
100
200
300
400
500
600
Q1/14 Q2/14 Q3/14 Q4/14 Q1/15 Q2/15 Q3/15 Q4/15 Q1/16 Q2/16 Q3/16 Q4/16 Q1/17 Q2/17
Services (LHS) Automation, total (including internal) (LHS) Last 4 quarters (RHS)
Stable business orders received totaled EUR 1,583 million during the last 4 quarters
September 2017 © Valmet | Roadshow presentation40
Orders received (EUR million) in stable business1
• In Q2/2017, total orders received in stable business remained at the previous year’s
level
1) Including internal orders received for the Automation business line.
1,972
2,4062,312
1,998 2,0642,208
2,117 2,0742,207
2,1062,192
2,283
2,613 2,551
0
500
1,000
1,500
2,000
2,500
3,000
Q1/1
4
Q2/1
4
Q3/1
4
Q4/1
4
Q1/1
5
Q2/1
5
Q3/1
5
Q4/1
5
Q1/1
6
Q2/1
6
Q3/1
6
Q4/1
6
Q1/1
7
Q2/1
7
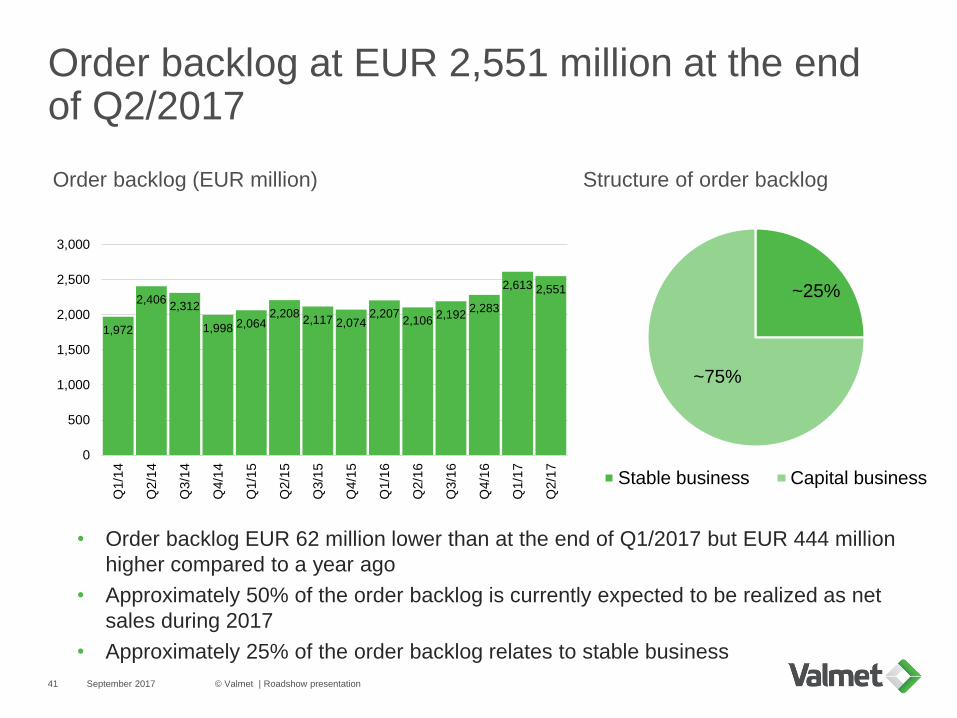
Order backlog at EUR 2,551 million at the end of Q2/2017
September 2017 © Valmet | Roadshow presentation41
• Order backlog EUR 62 million lower than at the end of Q1/2017 but EUR 444 million
higher compared to a year ago
• Approximately 50% of the order backlog is currently expected to be realized as net
sales during 2017
• Approximately 25% of the order backlog relates to stable business
Order backlog (EUR million)
~25%
~75%
Stable business Capital business
Structure of order backlog

Gross profit margin and SG&A development
September 2017 © Valmet | Roadshow presentation42
Gross profit (EUR million and % of net sales)
• Gross profit margin at the previous year’s level at 23%
• Selling, general & administrative (SG&A) expenses at the previous year’s level
at 17% of net sales
• Actions to improve gross profit through Must-Win implementation
SG&A (EUR million and % of net sales)
23%
0%
5%
10%
15%
20%
25%
0
40
80
120
160
200
Q1/2
014
Q2/2
014
Q3/2
014
Q4/2
014
Q1/2
015
Q2/2
015
Q3/2
015
Q4/2
015
Q1/2
016
Q2/2
016
Q3/2
016
Q4/2
016
Q1/2
017
Q2/2
017
EUR million (LHS) % of net sales (RHS)
17%
0%
5%
10%
15%
20%
25%
0
40
80
120
160
200
Q1/2
014
Q2/2
014
Q3/2
014
Q4/2
014
Q1/2
015
Q2/2
015
Q3/2
015
Q4/2
015
Q1/2
016
Q2/2
016
Q3/2
016
Q4/2
016
Q1/2
017
Q2/2
017
EUR million (LHS) % of net sales (RHS)
43 46
117
30
-20
17 16
64
333
122
88 94
31
-40
-20
0
20
40
60
80
100
120
140
Q1/2
01
4
Q2/2
01
4
Q3/2
01
4
Q4/2
01
4
Q1/2
01
5
Q2/2
01
5
Q3/2
01
5
Q4/2
01
5
Q1/2
01
6
Q2/2
01
6
Q3/2
01
6
Q4/2
01
6
Q1/2
01
7
Q2/2
01
7
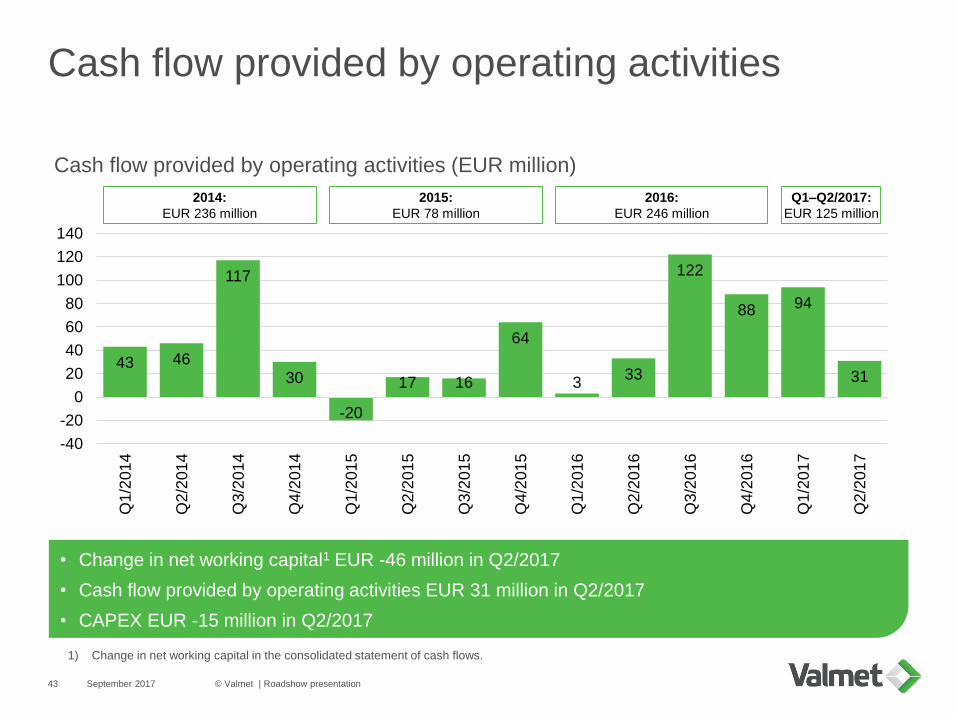
Cash flow provided by operating activities
September 2017 © Valmet | Roadshow presentation43
• Change in net working capital1 EUR -46 million in Q2/2017
• Cash flow provided by operating activities EUR 31 million in Q2/2017
• CAPEX EUR -15 million in Q2/2017
Cash flow provided by operating activities (EUR million)
1) Change in net working capital in the consolidated statement of cash flows.
2014:
EUR 236 million
2015:
EUR 78 million
2016:
EUR 246 million
Q1–Q2/2017:
EUR 125 million

-257 -249 -345 -353 -355 -265 -244 -238 -247 -181 -265 -294 -428 -313
1,101 1,023
466 480 580781 725 793 803
692 788 8571,005
796
-20%
-10%
0%
10%
20%
30%
-1,000
-500
0
500
1,000
1,500
Q1/2
01
4
Q2/2
01
4
Q3/2
01
4
Q4/2
01
4
Q1/2
01
5
Q2/2
01
5
Q3/2
01
5
Q4/2
01
5
Q1/2
01
6
Q2/2
01
6
Q3/2
01
6
Q4/2
01
6
Q1/2
01
7
Q2/2
01
7
Orders received (LHS)Net working capital (LHS)Average net working capital/rolling 12 months orders received (RHS)Net working capital/rolling 12 months orders received (RHS)
Net working capital at -9% of rolling12 months orders received
September 2017 © Valmet | Roadshow presentation44
• Net working capital EUR -313 million, which equals -9% of rolling 12 months orders received
Net working capital and orders received (EUR million)
40%40%41%42%
34%35%35%36%35%36%38%37%37%38%
0%
5%
10%
15%
20%
25%
30%
35%
40%
45%
Q1/1
4
Q2/1
4
Q3/1
4
Q4/1
4
Q1/1
5
Q2/1
5
Q3/1
5
Q4/1
5
Q1/1
6
Q2/1
6
Q3/1
6
Q4/1
6
Q1/1
7
Q2/1
7
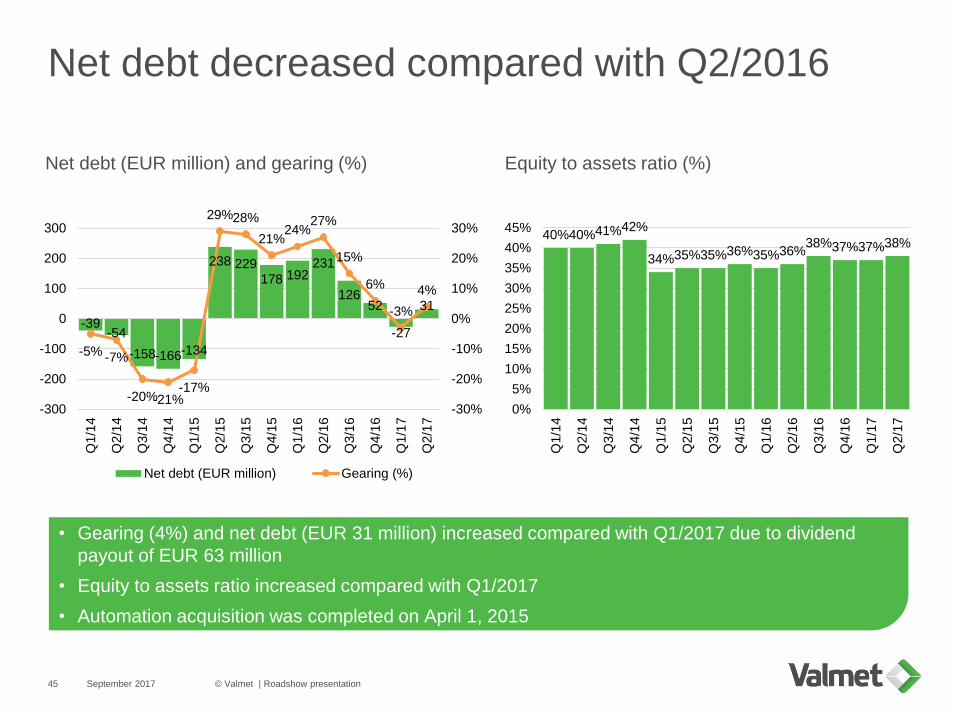
Net debt decreased compared with Q2/2016
September 2017 © Valmet | Roadshow presentation45
Net debt (EUR million) and gearing (%) Equity to assets ratio (%)
• Gearing (4%) and net debt (EUR 31 million) increased compared with Q1/2017 due to dividend
payout of EUR 63 million
• Equity to assets ratio increased compared with Q1/2017
• Automation acquisition was completed on April 1, 2015
-39-54
-158-166-134
238 229178 192
231
12652
-27
31
-5% -7%
-20%-21%-17%
29%28%
21%24%
27%
15%
6%
-3%
4%
-30%
-20%
-10%
0%
10%
20%
30%
-300
-200
-100
0
100
200
300
Q1/1
4
Q2/1
4
Q3/1
4
Q4/1
4
Q1/1
5
Q2/1
5
Q3/1
5
Q4/1
5
Q1/1
6
Q2/1
6
Q3/1
6
Q4/1
6
Q1/1
7
Q2/1
7
Net debt (EUR million) Gearing (%)
985 967902 877
1,239 1,240 1,214 1,2311,184 1,194 1,167 1,195
1,122 1,154
1%2% 2%
10% 10%
12%
14% 14%13%
12%
14%13%
14% 14%
Q1/14 Q2/14 Q3/14 Q4/14 Q1/15 Q2/15 Q3/15 Q4/15 Q1/16 Q2/16 Q3/16 Q4/16 Q1/17 Q2/17
Capital employed Comparable ROCE (before taxes), rolling 12 months
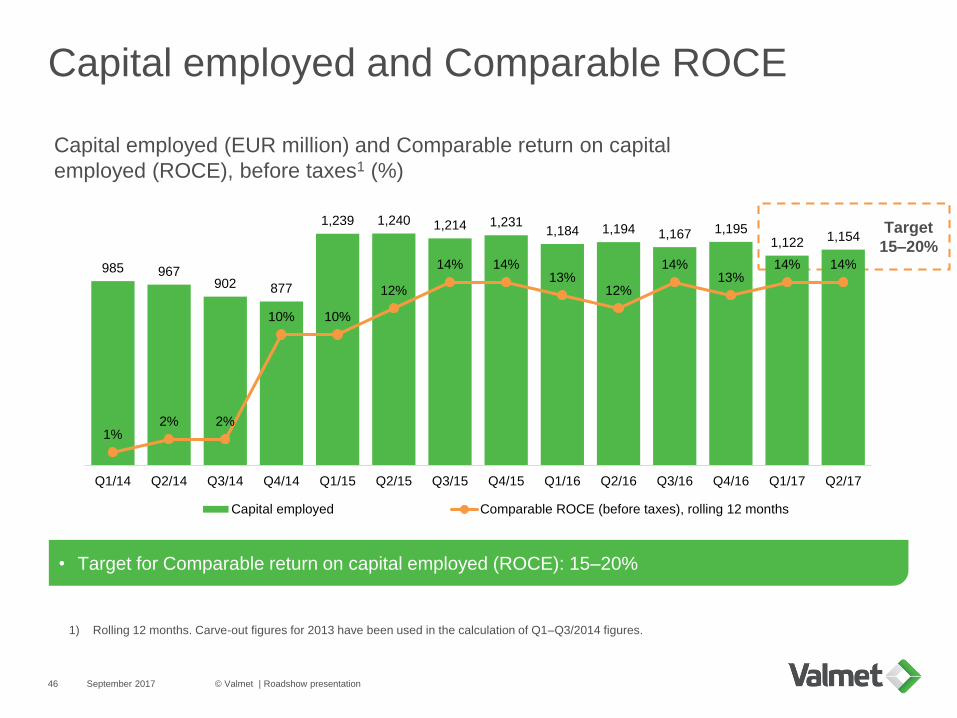
Capital employed and Comparable ROCE
September 2017 © Valmet | Roadshow presentation46
• Target for Comparable return on capital employed (ROCE): 15–20%
Capital employed (EUR million) and Comparable return on capital
employed (ROCE), before taxes1 (%)
1) Rolling 12 months. Carve-out figures for 2013 have been used in the calculation of Q1–Q3/2014 figures.
Target
15–20%

0
50
100
150
200
250
300
2017 2018 2019 2020 2021 2022 2023 2024 2025
Structure of loans and borrowings
September 2017 © Valmet | Roadshow presentation47
Interest-bearing debt EUR 277 million as at June 30, 2017
Amount of outstanding interest-bearing debt
(EUR million)
• Average maturity of long-term loans is 3.7 years- Average interest rate is 1.3%
Loans from banks and
financial institutions
EUR 200 millioncommitted syndicated revolving
credit facility1
EUR 277 million
None outstanding
None outstanding
Source Amount outstanding
EUR 200 milliondomestic commercial
paper program
1) EUR 200 million syndicated revolving credit facility agreement
matures on January 14, 2022 with two 1-year extension options.
Main financing sources and facilities

Strong balance sheet to support large orders
September 2017 © Valmet | Roadshow presentation48
Financial position as of June 30, 2017 (EUR million)
Net debt
Gearing
EUR 31 million
4%
Equity to assets ratio1 38%
• Valmet has a strong balance sheet that enables it to participate in large projects
• Valmet has its long-term liquidity in place
1) Total equity / (Balance sheet total - advances received - billings in excess of cost and earnings of projects under construction)
230
47
206
40
31877
3,038
286427
2,325
636834 847
715877 974 1,011 1,032 989
1,357 1,453
1,4562,091 1,888
1,3461,576 1,729 2,003 1,581 1,484
1,572 1,473
2,092
2,9252,735
2,061
2,4532,703
3,014
2,6132,473
2,928 2,926
5.5%6.3%
7.1%5.6%
6.5%7.6%
6.4% 2.1%
4.3%
6.2% 6.7%
2006 2007 2008 2009 2010 2011 2012 2013 2014 2015 2016
Stable
Capital
EBITA-%
Net sales and profitability development, annual
September 2017 © Valmet | Roadshow presentation49
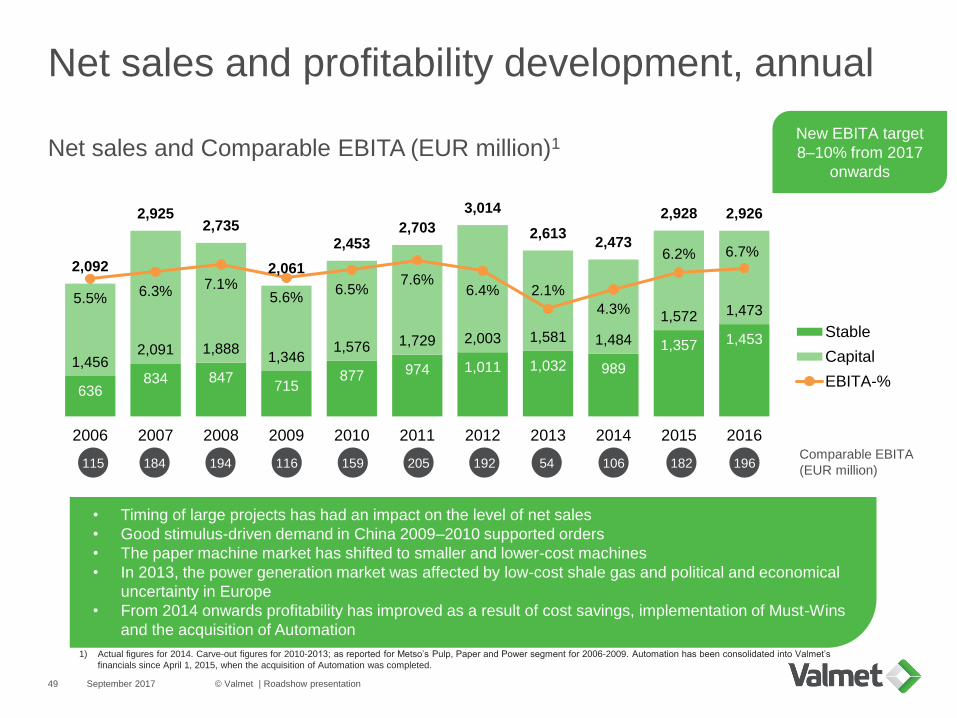
Net sales and Comparable EBITA (EUR million)1
1) Actual figures for 2014. Carve-out figures for 2010-2013; as reported for Metso’s Pulp, Paper and Power segment for 2006-2009. Automation has been consolidated into Valmet’s
financials since April 1, 2015, when the acquisition of Automation was completed.
• Timing of large projects has had an impact on the level of net sales
• Good stimulus-driven demand in China 2009–2010 supported orders
• The paper machine market has shifted to smaller and lower-cost machines
• In 2013, the power generation market was affected by low-cost shale gas and political and economical
uncertainty in Europe
• From 2014 onwards profitability has improved as a result of cost savings, implementation of Must-Wins
and the acquisition of Automation
Comparable EBITA
(EUR million)115 184 194 116 159 205 192 54 106 182
New EBITA target
8–10% from 2017
onwards
196
High volatility in market activity
September 2017 © Valmet | Roadshow presentation50
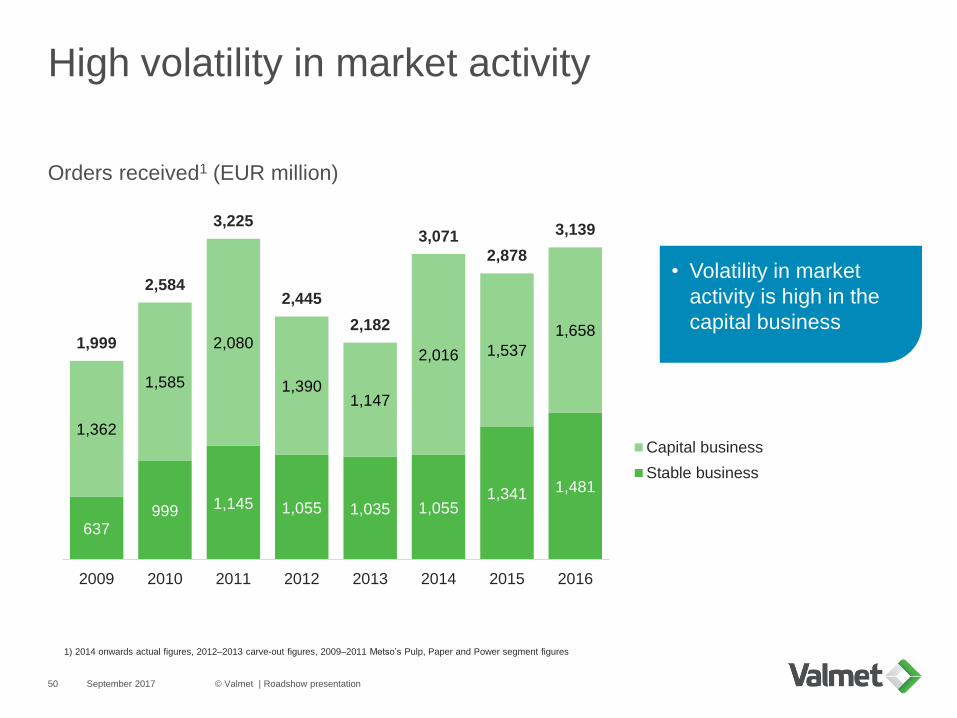
1) 2014 onwards actual figures, 2012–2013 carve-out figures, 2009–2011 Metso’s Pulp, Paper and Power segment figures
637999 1,145 1,055 1,035 1,055
1,341 1,481
1,362
1,585
2,080
1,3901,147
2,016 1,537
1,6581,999
2,584
3,225
2,445
2,182
3,071
2,878
3,139
2009 2010 2011 2012 2013 2014 2015 2016
Capital business
Stable business
Orders received1 (EUR million)
• Volatility in market
activity is high in the
capital business
AppendixFocus areas and actions
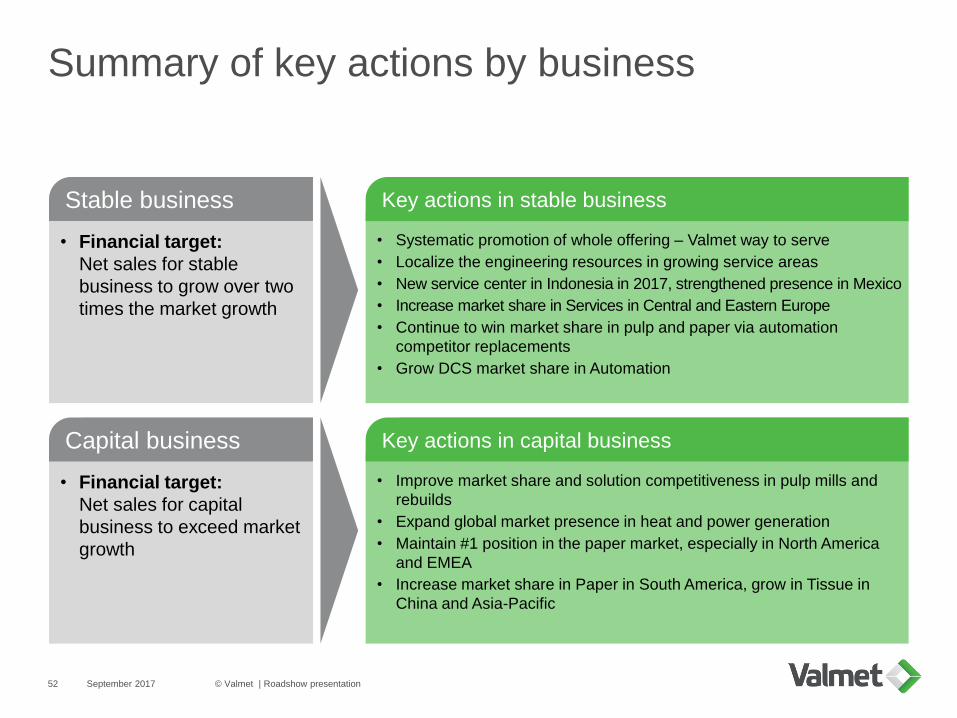
Summary of key actions by business
September 2017 © Valmet | Roadshow presentation52
• Financial target:
Net sales for capital
business to exceed market
growth
• Financial target:
Net sales for stable
business to grow over two
times the market growth
Stable business
Capital business
• Systematic promotion of whole offering – Valmet way to serve
• Localize the engineering resources in growing service areas
• New service center in Indonesia in 2017, strengthened presence in Mexico
• Increase market share in Services in Central and Eastern Europe
• Continue to win market share in pulp and paper via automation
competitor replacements
• Grow DCS market share in Automation
Key actions in stable business
• Improve market share and solution competitiveness in pulp mills and
rebuilds
• Expand global market presence in heat and power generation
• Maintain #1 position in the paper market, especially in North America
and EMEA
• Increase market share in Paper in South America, grow in Tissue in
China and Asia-Pacific
Key actions in capital business
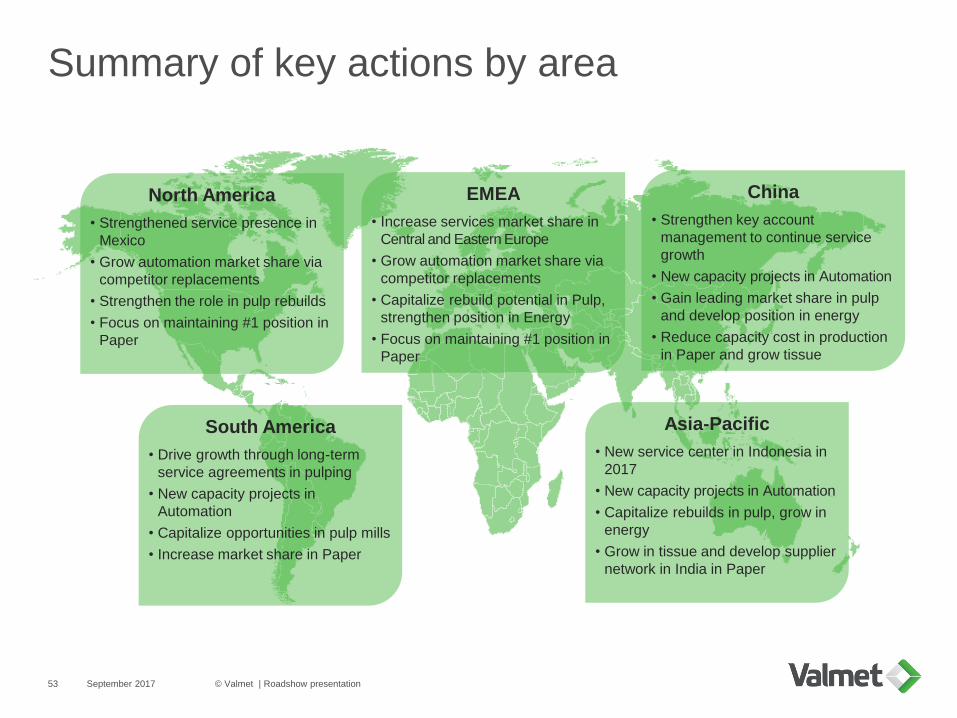
Summary of key actions by area
September 2017 © Valmet | Roadshow presentation53
North America
• Strengthened service presence in
Mexico
• Grow automation market share via
competitor replacements
• Strengthen the role in pulp rebuilds
• Focus on maintaining #1 position in
Paper
South America
• Drive growth through long-term
service agreements in pulping
• New capacity projects in
Automation
• Capitalize opportunities in pulp mills
• Increase market share in Paper
EMEA
• Increase services market share in
Central and Eastern Europe
• Grow automation market share via
competitor replacements
• Capitalize rebuild potential in Pulp,
strengthen position in Energy
• Focus on maintaining #1 position in
Paper
China
• Strengthen key account
management to continue service
growth
• New capacity projects in Automation
• Gain leading market share in pulp
and develop position in energy
• Reduce capacity cost in production
in Paper and grow tissue
Asia-Pacific
• New service center in Indonesia in
2017
• New capacity projects in Automation
• Capitalize rebuilds in pulp, grow in
energy
• Grow in tissue and develop supplier
network in India in Paper

2,613
2,473
2,928 2,926
2.1%
4.3%
6.2% 6.7%
2013 2014 2015 2016
Net sales Comparable EBITA-%
Actions to reach EBITA target
September 2017 © Valmet | Roadshow presentation54
Comparable EBITA margin in 2015 6.2%
Sales process management ~1%
Project management and project
execution
~1%
Procurement & quality ~1%
Technology, R&D and ERP ~1%
Long-term EBITA target 8–10%
Net sales (EUR million) and
Comparable EBITA margin (%)
2013 figures on carve-out basis

Procurement and quality cost development
September 2017 © Valmet | Roadshow presentation55
Implemented procurement savings of
annual direct spend
3.8%4.3% 4.4% 4.3%
>3.0%
2013 2014 2015 2016 Annualgoal
Reaching and exceeding our original
three-year 10% savings target
• Continuing to target >3% annual savings with
new actions- Increasing design-to-cost (DTC) to create
new sources for savings
- More supplier involvement through supplier
relationship management
• Continuing sustainable supply chain
implementation
3.6%3.1%
2.6% 2.7%
<1.3%
2013 2014 2015 Q3/15-Q2/16
Long-termgoal
Original three-year target to reduce quality costs by 50% by the
end of 2016
Quality costs (EUR million and % of net sales)
Progressing in cutting the quality costs by 50%
• Adding focus in root cause analysis of the quality deviations
• Extensive Lean implementation and training
- Over 4,000 Valmet employees completed Lean e-learning
- Lean being deployed in all major locations and businesses
Original three-year target to reduce procurement
costs by 10% by the end of 2016
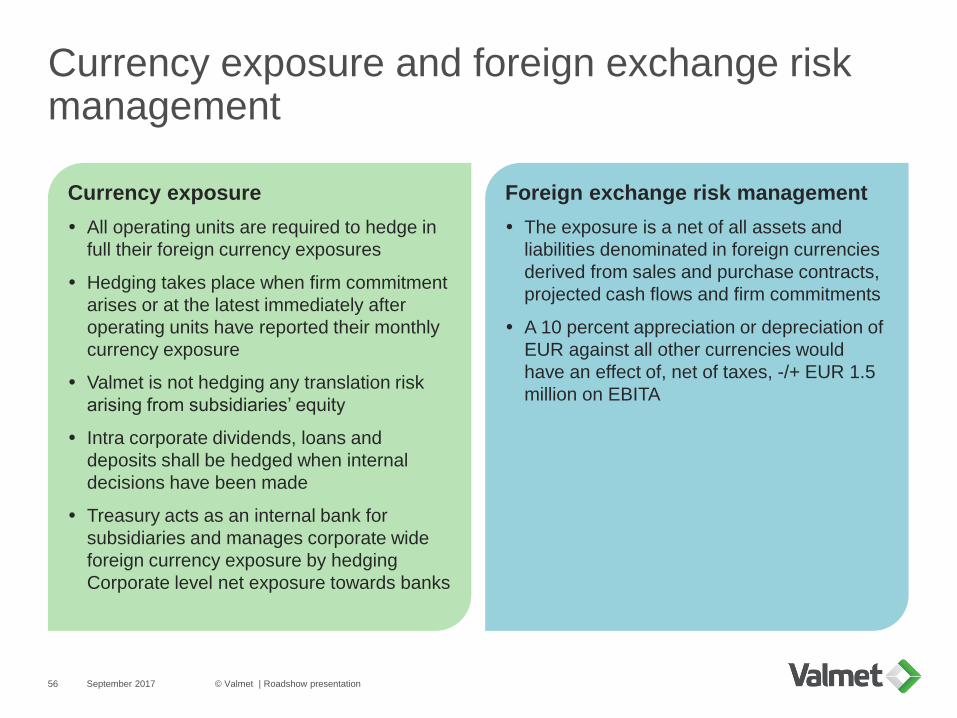
Currency exposure and foreign exchange risk management
September 2017 © Valmet | Roadshow presentation56
Foreign exchange risk management
The exposure is a net of all assets and
liabilities denominated in foreign currencies
derived from sales and purchase contracts,
projected cash flows and firm commitments
A 10 percent appreciation or depreciation of
EUR against all other currencies would
have an effect of, net of taxes, -/+ EUR 1.5
million on EBITA
Currency exposure
All operating units are required to hedge in
full their foreign currency exposures
Hedging takes place when firm commitment
arises or at the latest immediately after
operating units have reported their monthly
currency exposure
Valmet is not hedging any translation risk
arising from subsidiaries’ equity
Intra corporate dividends, loans and
deposits shall be hedged when internal
decisions have been made
Treasury acts as an internal bank for
subsidiaries and manages corporate wide
foreign currency exposure by hedging
Corporate level net exposure towards banks
AppendixArea development

North America
September 2017 © Valmet | Roadshow presentation58
Mature services focused market with recurring opportunities in paper,
tissue and automation
Orders received(EUR million and % of total)
Net sales(EUR million and % of total)
Employees(number and % of total)
Orders received by
business line (2016)
Net sales by business
line (2016)
414490
717
588
19% 16%25%
19%
2013
2014
2015
2016
• Mature, services-focused market addressing large
installed base
• Capacity closures in printing papers partly offset by new
capacity in board and tissue
• Customer service agreements important driver for growth
• Continued high customer focus on availability & reliability
in mills
• Rebuild and new capacity opportunities in board and
tissue grades
• Rebuild projects in pulp mills expected to increase
• Leading position in pulp and paper
process technology projects, a
well-established position in the
services and automation business,
and a dominant position in biomass
boilers
• Key competitors: Voith, Andritz,
Emerson, ABB, Honeywell and US
services players Albany, Xerium,
Kadant, Asten Johnsson
Market characteristics Valmet’s position and competition
422 449
615 644
16% 18% 21% 22%
2013
2014
2015
2016
1,147 1,141
1,3671,274
10% 11% 11% 11%
2013
2014
2015
2016
53%
12%3%
32%
ServicesAutomationPulp and EnergyPaper
50%
10%
13%
26%
ServicesAutomationPulp and EnergyPaper
2013 figures on a carve-out basis. Automation business line figures included as of Q2/2015.1 Valmet’s target market, meaning those geographical markets, product segments and customer industries where Valmet is currently competing or aiming to compete. 2 Figures for 2015 production and 2015-20 growth based on RISI estimates
• Target market size:
EUR 2.9 billion
• P&P annual
production2: 150
million tonnes,
growth +0.2%
Market size1 & growth
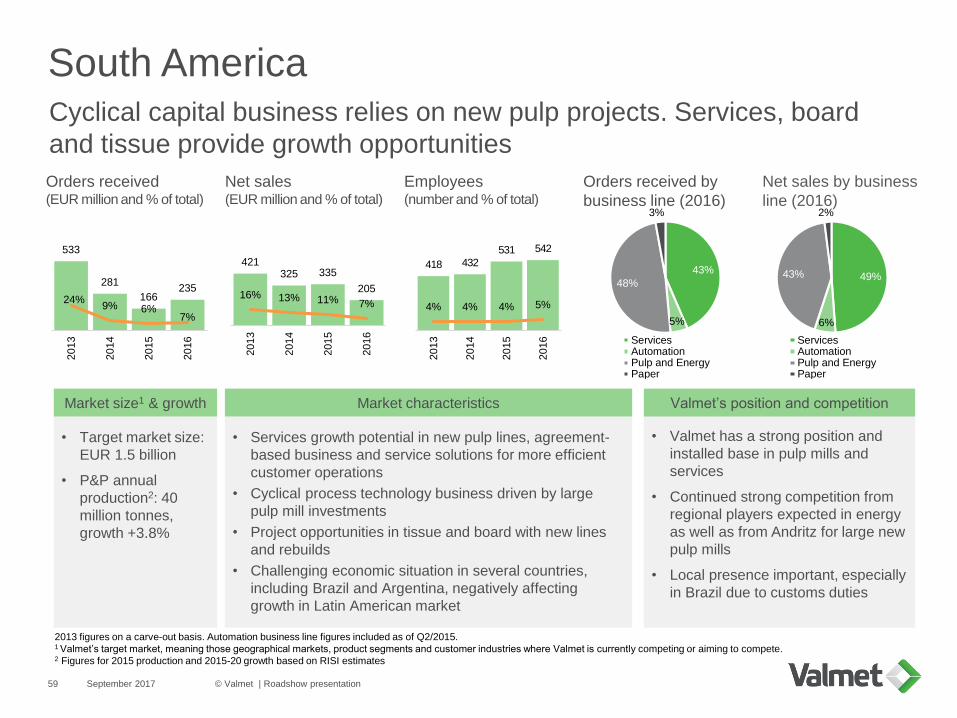
South AmericaCyclical capital business relies on new pulp projects. Services, board
and tissue provide growth opportunities
September 2017 © Valmet | Roadshow presentation59
Orders received(EUR million and % of total)
Net sales(EUR million and % of total)
Employees(number and % of total)
Orders received by
business line (2016)
Net sales by business
line (2016)
533
281
166235
24%9% 6%
7%
2013
2014
2015
2016
421325 335
20516% 13% 11% 7%
2013
2014
2015
2016
418 432
531 542
4% 4% 4% 5%
2013
2014
2015
2016
43%
5%
48%
3%
ServicesAutomationPulp and EnergyPaper
49%
6%
43%
2%
ServicesAutomationPulp and EnergyPaper
• Services growth potential in new pulp lines, agreement-
based business and service solutions for more efficient
customer operations
• Cyclical process technology business driven by large
pulp mill investments
• Project opportunities in tissue and board with new lines
and rebuilds
• Challenging economic situation in several countries,
including Brazil and Argentina, negatively affecting
growth in Latin American market
• Valmet has a strong position and
installed base in pulp mills and
services
• Continued strong competition from
regional players expected in energy
as well as from Andritz for large new
pulp mills
• Local presence important, especially
in Brazil due to customs duties
Market characteristics Valmet’s position and competition
• Target market size:
EUR 1.5 billion
• P&P annual
production2: 40
million tonnes,
growth +3.8%
Market size1 & growth
2013 figures on a carve-out basis. Automation business line figures included as of Q2/2015.1 Valmet’s target market, meaning those geographical markets, product segments and customer industries where Valmet is currently competing or aiming to compete. 2 Figures for 2015 production and 2015-20 growth based on RISI estimates
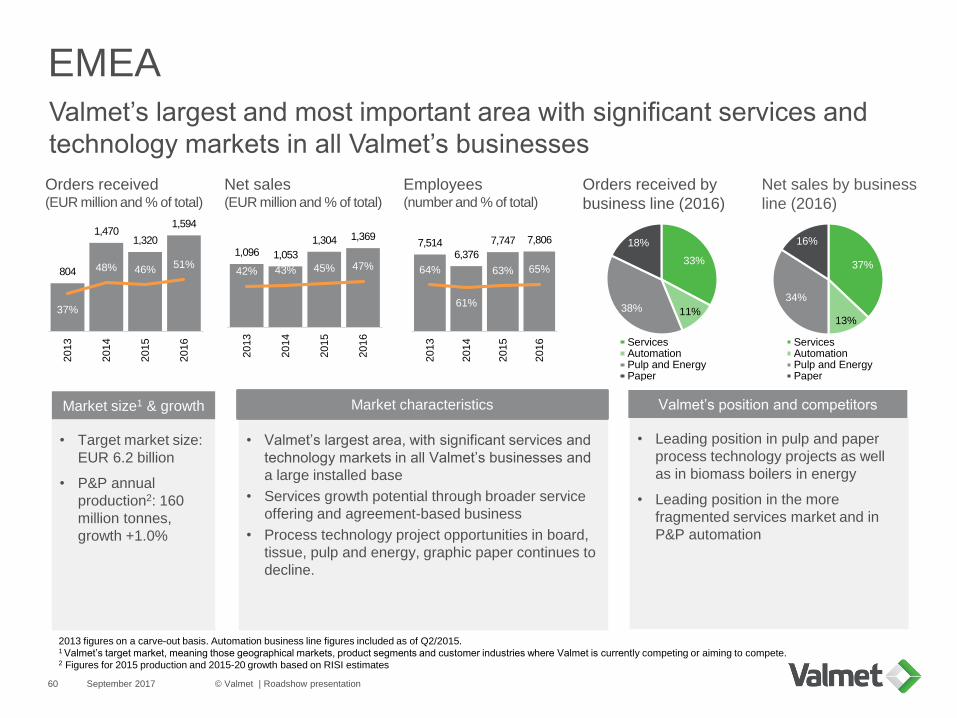
EMEAValmet’s largest and most important area with significant services and
technology markets in all Valmet’s businesses
September 2017 © Valmet | Roadshow presentation60
Orders received(EUR million and % of total)
Net sales(EUR million and % of total)
Employees(number and % of total)
Orders received by
business line (2016)
Net sales by business
line (2016)
804
1,4701,320
1,594
37%
48% 46%51%
2013
2014
2015
2016
1,096 1,053
1,304 1,369
42% 43% 45% 47%
2013
2014
2015
2016
7,5146,376
7,747 7,806
64%
61%
63% 65%
2013
2014
2015
2016
33%
11%38%
18%
ServicesAutomationPulp and EnergyPaper
37%
13%
34%
16%
ServicesAutomationPulp and EnergyPaper
• Valmet’s largest area, with significant services and
technology markets in all Valmet’s businesses and
a large installed base
• Services growth potential through broader service
offering and agreement-based business
• Process technology project opportunities in board,
tissue, pulp and energy, graphic paper continues to
decline.
• Leading position in pulp and paper
process technology projects as well
as in biomass boilers in energy
• Leading position in the more
fragmented services market and in
P&P automation
Market characteristics Valmet’s position and competitors
• Target market size:
EUR 6.2 billion
• P&P annual
production2: 160
million tonnes,
growth +1.0%
Market size1 & growth
2013 figures on a carve-out basis. Automation business line figures included as of Q2/2015.1 Valmet’s target market, meaning those geographical markets, product segments and customer industries where Valmet is currently competing or aiming to compete. 2 Figures for 2015 production and 2015-20 growth based on RISI estimates
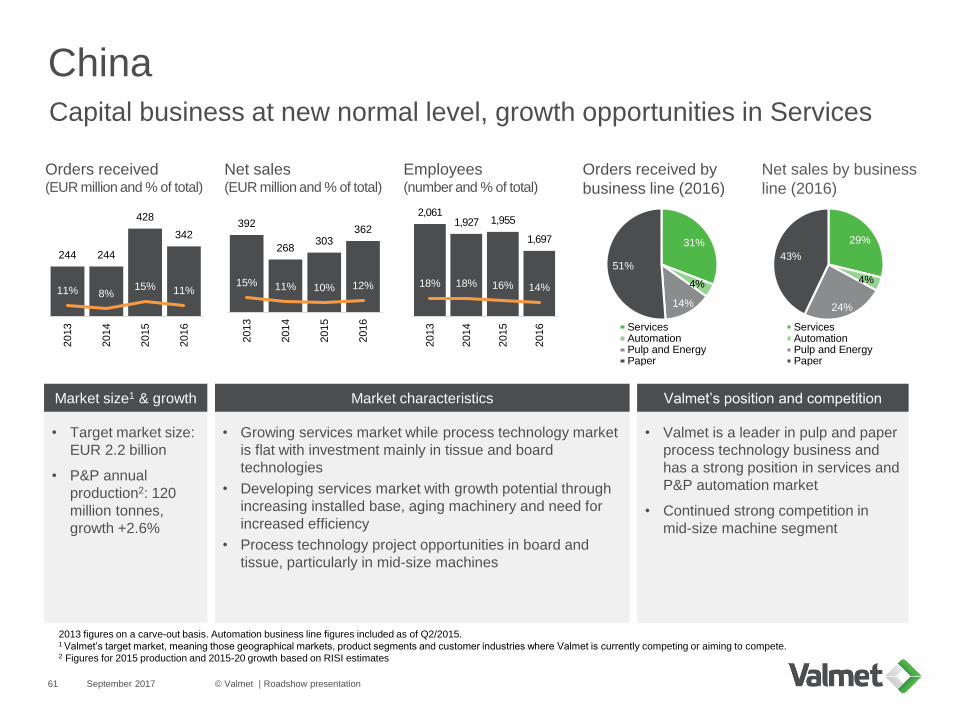
ChinaCapital business at new normal level, growth opportunities in Services
September 2017 © Valmet | Roadshow presentation61
Orders received(EUR million and % of total)
Net sales(EUR million and % of total)
Employees(number and % of total)
Orders received by
business line (2016)
Net sales by business
line (2016)
244 244
428
342
11% 8%15% 11%
2013
2014
2015
2016
392
268303
362
15% 11% 10% 12%
2013
2014
2015
2016
2,0611,927 1,955
1,697
18% 18% 16% 14%
2013
2014
2015
2016
31%
4%
14%
51%
ServicesAutomationPulp and EnergyPaper
29%
4%
24%
43%
ServicesAutomationPulp and EnergyPaper
• Growing services market while process technology market
is flat with investment mainly in tissue and board
technologies
• Developing services market with growth potential through
increasing installed base, aging machinery and need for
increased efficiency
• Process technology project opportunities in board and
tissue, particularly in mid-size machines
• Valmet is a leader in pulp and paper
process technology business and
has a strong position in services and
P&P automation market
• Continued strong competition in
mid-size machine segment
Market characteristics Valmet’s position and competition
• Target market size:
EUR 2.2 billion
• P&P annual
production2: 120
million tonnes,
growth +2.6%
Market size1 & growth
2013 figures on a carve-out basis. Automation business line figures included as of Q2/2015.1 Valmet’s target market, meaning those geographical markets, product segments and customer industries where Valmet is currently competing or aiming to compete. 2 Figures for 2015 production and 2015-20 growth based on RISI estimates
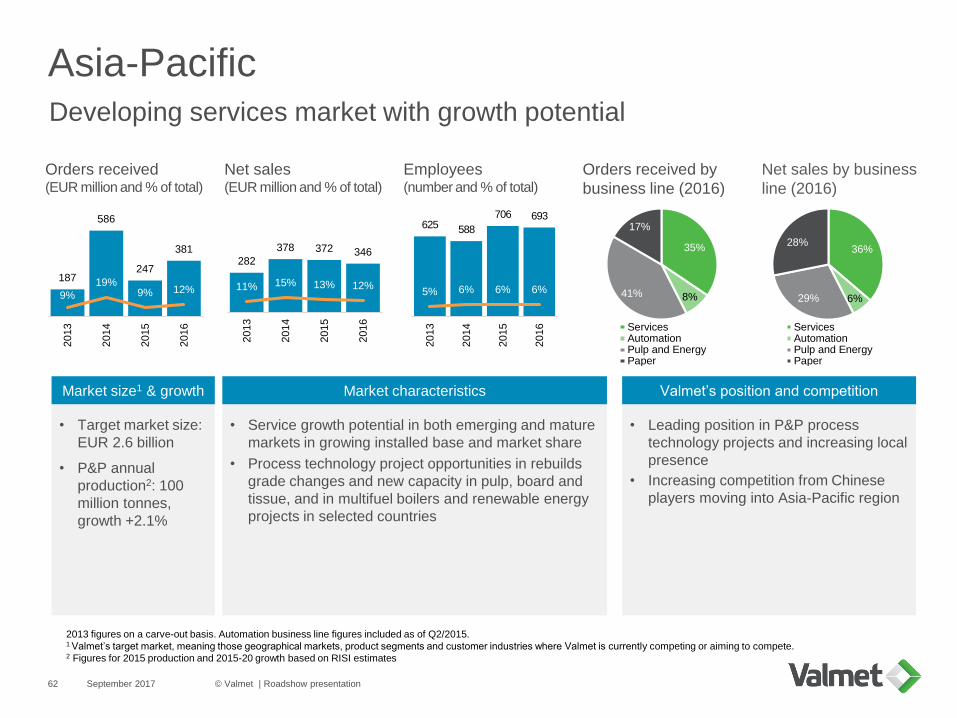
Asia-PacificDeveloping services market with growth potential
September 2017 © Valmet | Roadshow presentation62
Orders received(EUR million and % of total)
Net sales(EUR million and % of total)
Employees(number and % of total)
Orders received by
business line (2016)
Net sales by business
line (2016)
187
586
247
381
9%
19%9% 12%
2013
2014
2015
2016
282
378 372 346
11% 15% 13% 12%
2013
2014
2015
2016
625 588
706 693
5% 6% 6% 6%
2013
2014
2015
2016
35%
8%41%
17%
ServicesAutomationPulp and EnergyPaper
36%
6%29%
28%
ServicesAutomationPulp and EnergyPaper
• Service growth potential in both emerging and mature
markets in growing installed base and market share
• Process technology project opportunities in rebuilds
grade changes and new capacity in pulp, board and
tissue, and in multifuel boilers and renewable energy
projects in selected countries
• Leading position in P&P process
technology projects and increasing local
presence
• Increasing competition from Chinese
players moving into Asia-Pacific region
Market characteristics Valmet’s position and competition
2013 figures on a carve-out basis. Automation business line figures included as of Q2/2015.1 Valmet’s target market, meaning those geographical markets, product segments and customer industries where Valmet is currently competing or aiming to compete. 2 Figures for 2015 production and 2015-20 growth based on RISI estimates
• Target market size:
EUR 2.6 billion
• P&P annual
production2: 100
million tonnes,
growth +2.1%
Market size1 & growth

AppendixShareholders and share price development
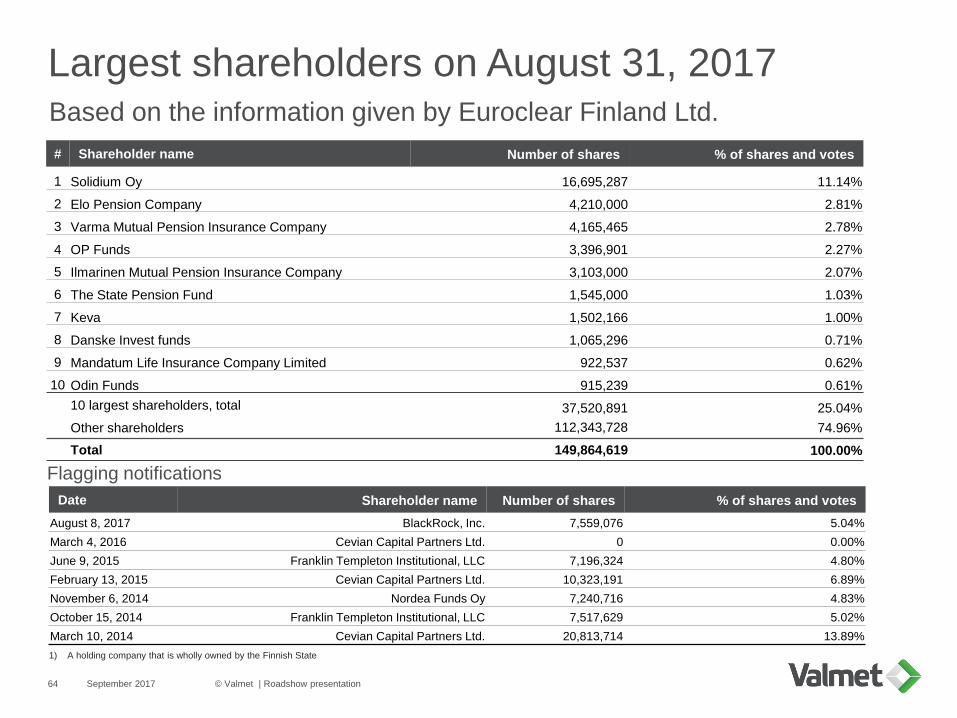
Largest shareholders on August 31, 2017Based on the information given by Euroclear Finland Ltd.
September 2017 © Valmet | Roadshow presentation64
1) A holding company that is wholly owned by the Finnish State
# Shareholder name Number of shares % of shares and votes
1 Solidium Oy 16,695,287 11.14%
2 Elo Pension Company 4,210,000 2.81%
3 Varma Mutual Pension Insurance Company 4,165,465 2.78%
4 OP Funds 3,396,901 2.27%
5 Ilmarinen Mutual Pension Insurance Company 3,103,000 2.07%
6 The State Pension Fund 1,545,000 1.03%
7 Keva 1,502,166 1.00%
8 Danske Invest funds 1,065,296 0.71%
9 Mandatum Life Insurance Company Limited 922,537 0.62%
10 Odin Funds 915,239 0.61%
10 largest shareholders, total 37,520,891 25.04%
Other shareholders 112,343,728 74.96%
Total 149,864,619 100.00%
Date Shareholder name Number of shares % of shares and votes
August 8, 2017 BlackRock, Inc. 7,559,076 5.04%
March 4, 2016 Cevian Capital Partners Ltd. 0 0.00%
June 9, 2015 Franklin Templeton Institutional, LLC 7,196,324 4.80%
February 13, 2015 Cevian Capital Partners Ltd. 10,323,191 6.89%
November 6, 2014 Nordea Funds Oy 7,240,716 4.83%
October 15, 2014 Franklin Templeton Institutional, LLC 7,517,629 5.02%
March 10, 2014 Cevian Capital Partners Ltd. 20,813,714 13.89%
Flagging notifications
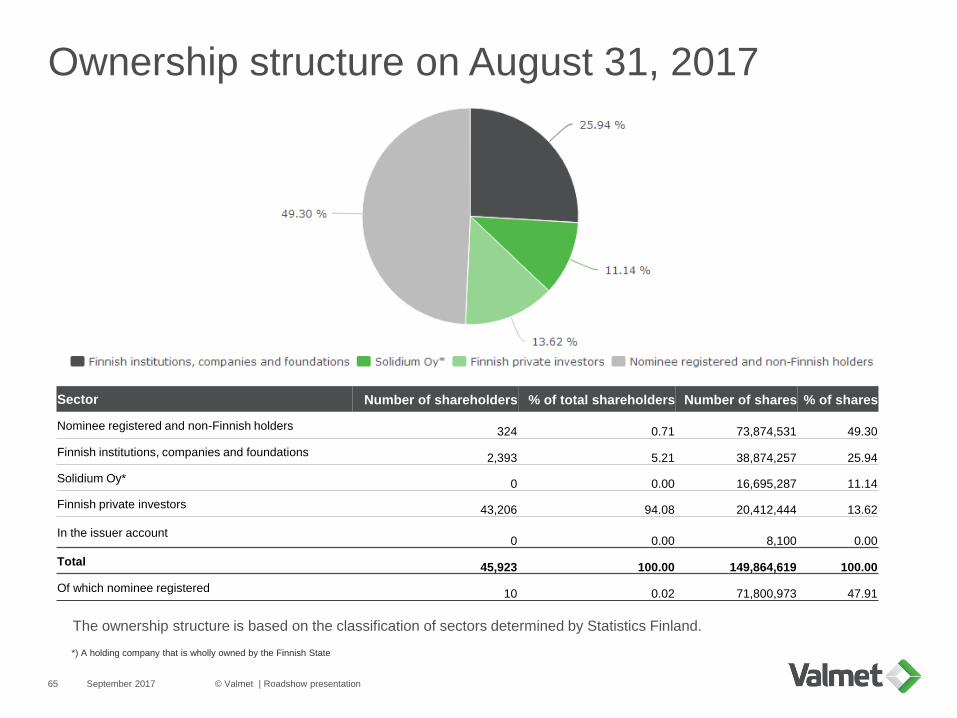
Ownership structure on August 31, 2017
September 2017 © Valmet | Roadshow presentation65
*) A holding company that is wholly owned by the Finnish State
The ownership structure is based on the classification of sectors determined by Statistics Finland.
Sector Number of shareholders % of total shareholders Number of shares % of shares
Nominee registered and non-Finnish holders324 0.71 73,874,531 49.30
Finnish institutions, companies and foundations2,393 5.21 38,874,257 25.94
Solidium Oy* 0 0.00 16,695,287 11.14
Finnish private investors 43,206 94.08 20,412,444 13.62
In the issuer account0 0.00 8,100 0.00
Total45,923 100.00 149,864,619 100.00
Of which nominee registered10 0.02 71,800,973 47.91

Share of non-Finnish holders and area split of shareholders
September 2017 © Valmet | Roadshow presentation66
45%
18%
12%
8%
6%
11%
Finland United States
United Kingdom Norway
France Rest of Europe
Approximate geographical split
of institutional shareholders*
Share of non-Finnish holders
and number of shareholders
*) in December 2016. Source: Nasdaq Corporate
Solutions
44,000
46,000
48,000
50,000
52,000
54,000
56,000
58,000
42%
44%
46%
48%
50%
52%
54%
56%
01/2
01
4
04/2
01
4
07/2
01
4
10/2
01
4
01/2
01
5
04/2
01
5
07/2
01
5
10/2
01
5
01/2
01
6
04/2
01
6
07/2
01
6
10/2
01
6
01/2
01
7
04/2
01
7
07/2
01
7
Non-Finnish holders (LHS)Total number of shareholders (RHS)
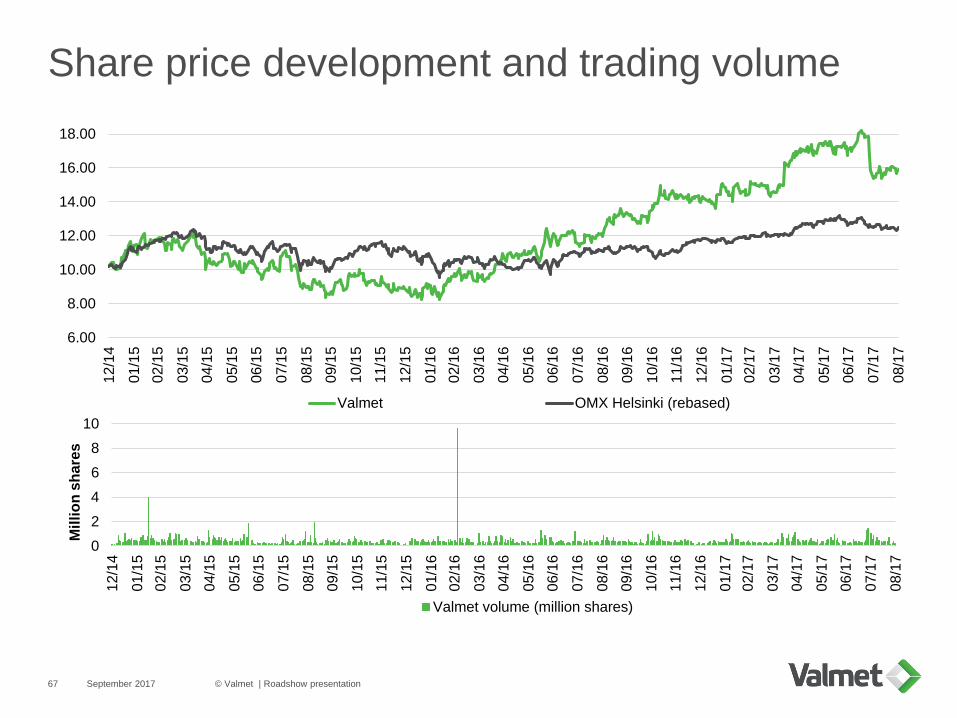
Share price development and trading volume
September 2017 © Valmet | Roadshow presentation67
0
2
4
6
8
10
12/1
4
01/1
5
02/1
5
03/1
5
04/1
5
05/1
5
06/1
5
07/1
5
08/1
5
09/1
5
10/1
5
11/1
5
12/1
5
01/1
6
02/1
6
03/1
6
04/1
6
05/1
6
06/1
6
07/1
6
08/1
6
09/1
6
10/1
6
11/1
6
12/1
6
01/1
7
02/1
7
03/1
7
04/1
7
05/1
7
06/1
7
07/1
7
08/1
7
Mil
lio
n s
hare
s
Valmet volume (million shares)
6.00
8.00
10.00
12.00
14.00
16.00
18.00
12/1
4
01/1
5
02/1
5
03/1
5
04/1
5
05/1
5
06/1
5
07/1
5
08/1
5
09/1
5
10/1
5
11/1
5
12/1
5
01/1
6
02/1
6
03/1
6
04/1
6
05/1
6
06/1
6
07/1
6
08/1
6
09/1
6
10/1
6
11/1
6
12/1
6
01/1
7
02/1
7
03/1
7
04/1
7
05/1
7
06/1
7
07/1
7
08/1
7
Valmet OMX Helsinki (rebased)

Recognition from Dow Jones and CDP
Source: SustainAbility (2013) “Rate the Raters 2013 – Polling the Experts”
September 201768 © Valmet | Roadshow presentation
Valmet is in the Dow
Jones World
Sustainability Index
(DJSI) for the third
consecutive year, in
CDP's Climate A List
for actions and strategy
to mitigate climate
change and in Ethibel
Sustainability Index
(ESI) Excellence
Europe

AppendixOffering
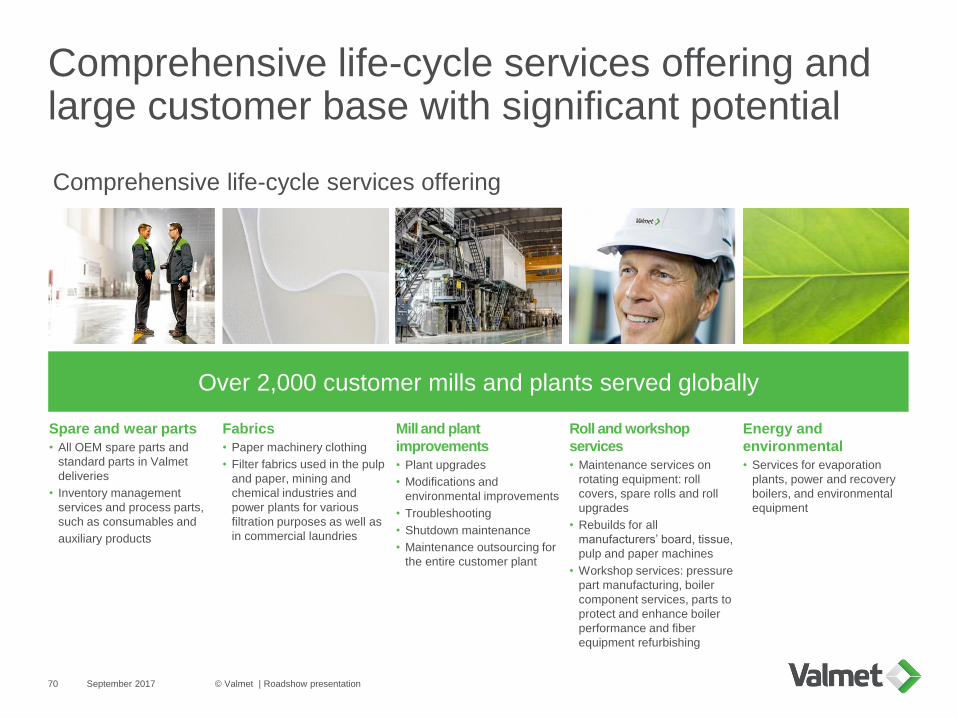
Comprehensive life-cycle services offering and large customer base with significant potential
September 2017 © Valmet | Roadshow presentation70
Comprehensive life-cycle services offering
Spare and wear parts
• All OEM spare parts and
standard parts in Valmet
deliveries
• Inventory management
services and process parts,
such as consumables and
auxiliary products
Fabrics
• Paper machinery clothing
• Filter fabrics used in the pulp
and paper, mining and
chemical industries and
power plants for various
filtration purposes as well as
in commercial laundries
Mill and plant
improvements
• Plant upgrades
• Modifications and
environmental improvements
• Troubleshooting
• Shutdown maintenance
• Maintenance outsourcing for
the entire customer plant
Roll and workshop
services
• Maintenance services on
rotating equipment: roll
covers, spare rolls and roll
upgrades
• Rebuilds for all
manufacturers’ board, tissue,
pulp and paper machines
• Workshop services: pressure
part manufacturing, boiler
component services, parts to
protect and enhance boiler
performance and fiber
equipment refurbishing
Over 2,000 customer mills and plants served globally
Energy and
environmental
• Services for evaporation
plants, power and recovery
boilers, and environmental
equipment

Our automation offering
September 2017 © Valmet | Roadshow presentation71
Pulp and paper Energy Oil and gas Marine
Distributed Control System (DCS) –
Valmet DNA
Performance solutions
Quality Control System (QCS)
Profilers
Analyzers and measurements
Industrial internet solutions
Automation services
Process simulators
Safety systems and solutions
Over 4,500 automation systems and
over 40,000 analyzers and measurements delivered
Advanced automation and process monitoring solutions and services:
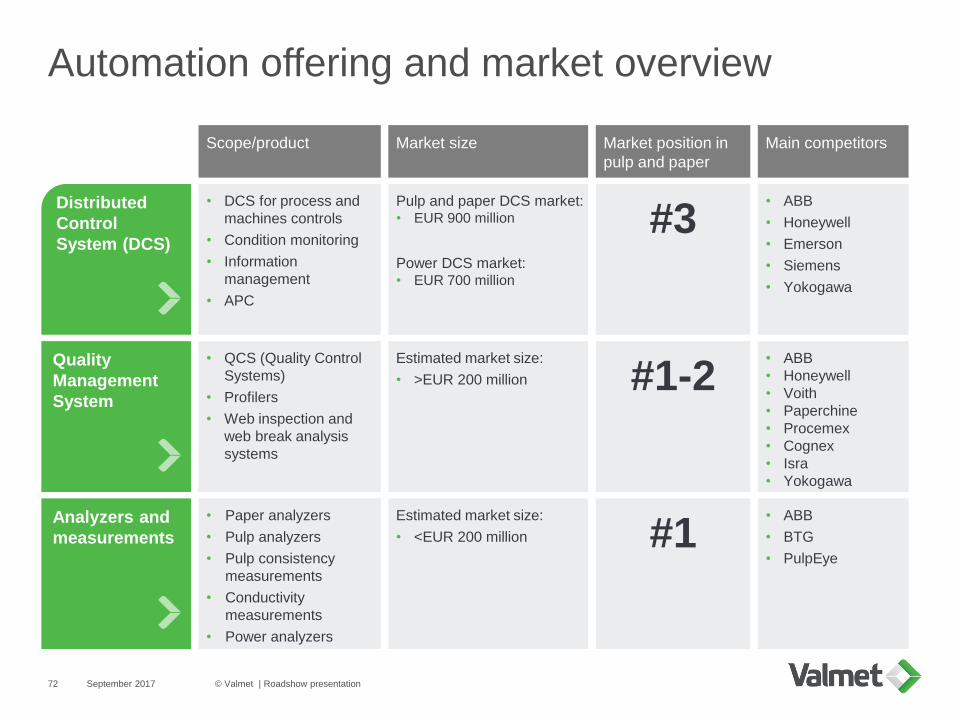
Automation offering and market overview
September 2017 © Valmet | Roadshow presentation72
• DCS for process and
machines controls
• Condition monitoring
• Information
management
• APC
• Paper analyzers
• Pulp analyzers
• Pulp consistency
measurements
• Conductivity
measurements
• Power analyzers
Distributed
Control
System (DCS)
• QCS (Quality Control
Systems)
• Profilers
• Web inspection and
web break analysis
systems
Quality
Management
System
Analyzers and
measurements
Scope/product
Pulp and paper DCS market:• EUR 900 million
Power DCS market:• EUR 700 million
Estimated market size:
• <EUR 200 million
Estimated market size:
• >EUR 200 million
Market size
#3
#1
#1-2
Market position in
pulp and paper
• ABB
• Honeywell
• Emerson
• Siemens
• Yokogawa
• ABB
• BTG
• PulpEye
• ABB
• Honeywell
• Voith
• Paperchine
• Procemex
• Cognex
• Isra
• Yokogawa
Main competitors
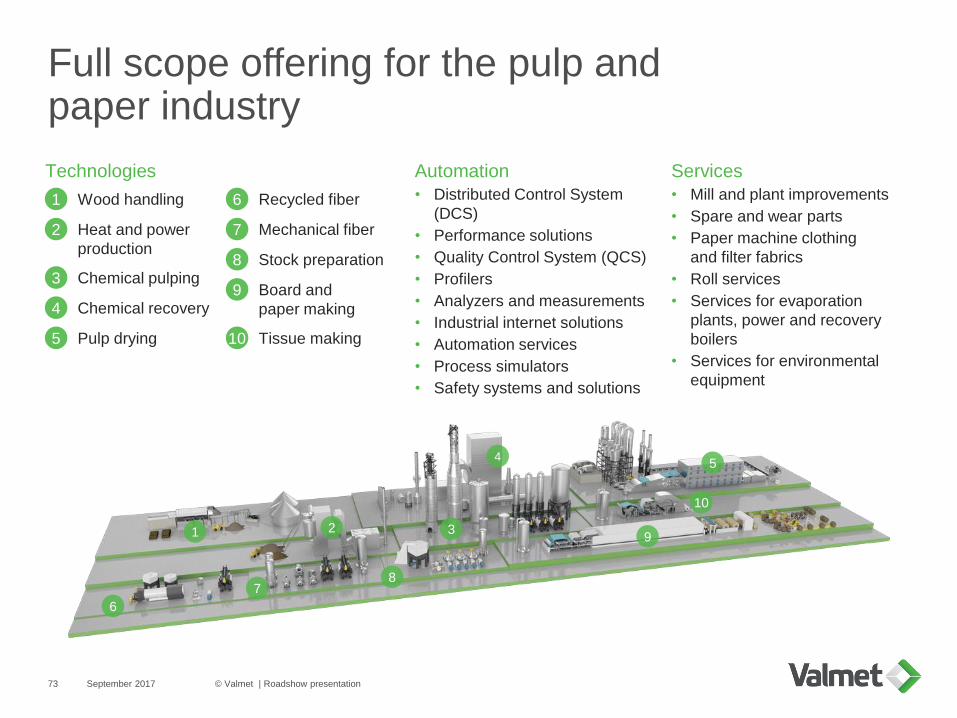
Full scope offering for the pulp andpaper industry
September 2017 © Valmet | Roadshow presentation73
1
6
7
2
8
3
4
9
5
10
1 Wood handling
2 Heat and power
production
3 Chemical pulping
4 Chemical recovery
5 Pulp drying
6 Recycled fiber
7 Mechanical fiber
8 Stock preparation
9 Board and
paper making
10 Tissue making
Automation
• Distributed Control System
(DCS)
• Performance solutions
• Quality Control System (QCS)
• Profilers
• Analyzers and measurements
• Industrial internet solutions
• Automation services
• Process simulators
• Safety systems and solutions
Services
• Mill and plant improvements
• Spare and wear parts
• Paper machine clothing
and filter fabrics
• Roll services
• Services for evaporation
plants, power and recovery
boilers
• Services for environmental
equipment
Technologies

Our offering for energy industry and biotechnologies
September 2017 © Valmet | Roadshow presentation74
Automation
• Distributed Control System
(DCS)
• Performance solutions
• Analyzers and
measurements
• Industrial internet solutions
• Automation services
Services
• Plant improvements
• Rebuilds
• Performance services
• Services for environmental
equipment
• Components and spare parts
• Training
1
2
3
46
5
1 Fuel handling
2 Gasification
3 Boiler and flue
gas cleaning
4 Bio-oil production
5 Modularized
power plants
6 Prehydrolysis
For biofuels,
biomaterials and
biochemicals, and
bio coal production
Technologies
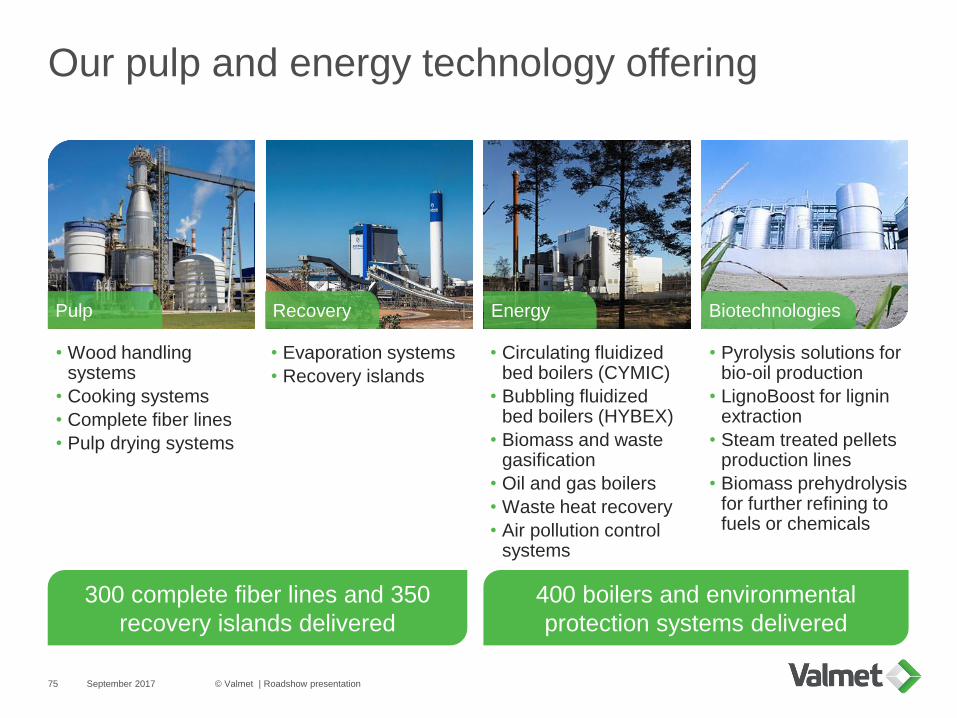
Our pulp and energy technology offering
September 2017 © Valmet | Roadshow presentation75
Pulp Recovery Energy Biotechnologies
400 boilers and environmental
protection systems delivered
300 complete fiber lines and 350
recovery islands delivered
• Wood handling systems
• Cooking systems
• Complete fiber lines
• Pulp drying systems
• Evaporation systems
• Recovery islands
• Circulating fluidized bed boilers (CYMIC)
• Bubbling fluidized bed boilers (HYBEX)
• Biomass and waste gasification
• Oil and gas boilers
• Waste heat recovery
• Air pollution control systems
• Pyrolysis solutions for bio-oil production
• LignoBoost for lignin extraction
• Steam treated pellets production lines
• Biomass prehydrolysisfor further refining to fuels or chemicals
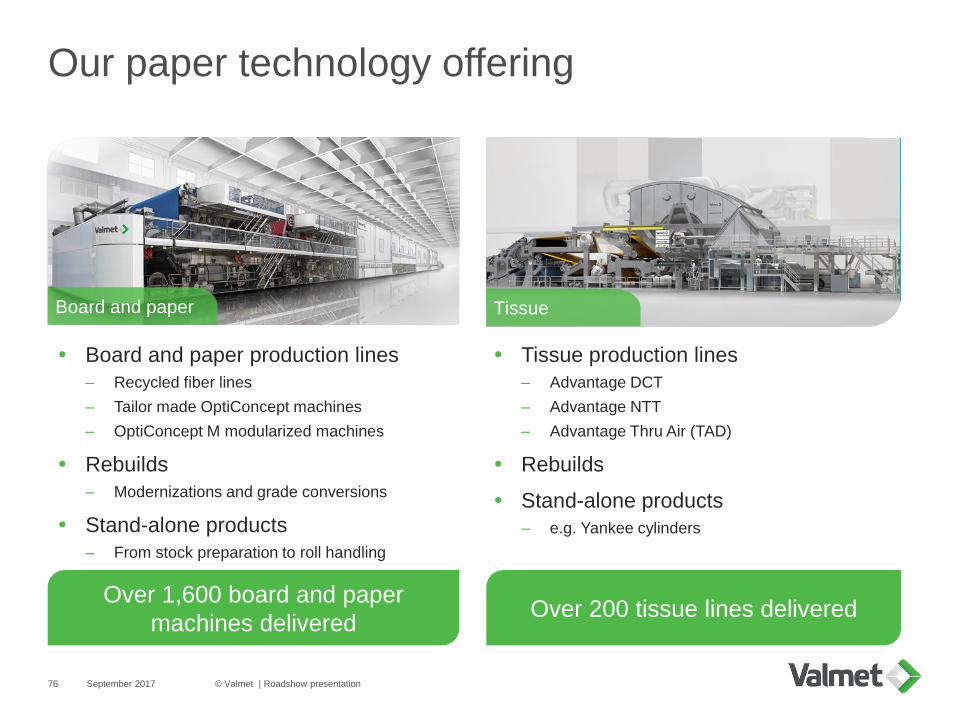
Our paper technology offering
September 2017 © Valmet | Roadshow presentation76
Board and paper Tissue
Board and paper production lines
– Recycled fiber lines
– Tailor made OptiConcept machines
– OptiConcept M modularized machines
Rebuilds
– Modernizations and grade conversions
Stand-alone products
– From stock preparation to roll handling
Over 200 tissue lines delivered
Tissue production lines
– Advantage DCT
– Advantage NTT
– Advantage Thru Air (TAD)
Rebuilds
Stand-alone products
– e.g. Yankee cylinders
Over 1,600 board and paper
machines delivered
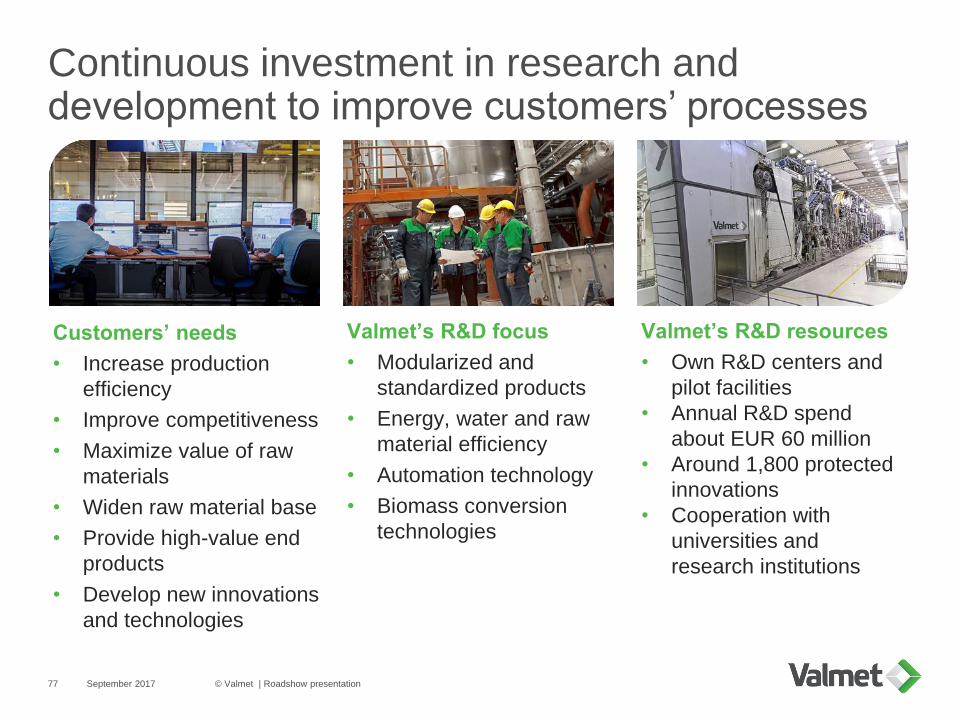
Continuous investment in research and development to improve customers’ processes
September 2017 © Valmet | Roadshow presentation77
Customers’ needs
• Increase production
efficiency
• Improve competitiveness
• Maximize value of raw
materials
• Widen raw material base
• Provide high-value end
products
• Develop new innovations
and technologies
Valmet’s R&D focus
• Modularized and
standardized products
• Energy, water and raw
material efficiency
• Automation technology
• Biomass conversion
technologies
Valmet’s R&D resources
• Own R&D centers and
pilot facilities
• Annual R&D spend
about EUR 60 million
• Around 1,800 protected
innovations
• Cooperation with
universities and
research institutions
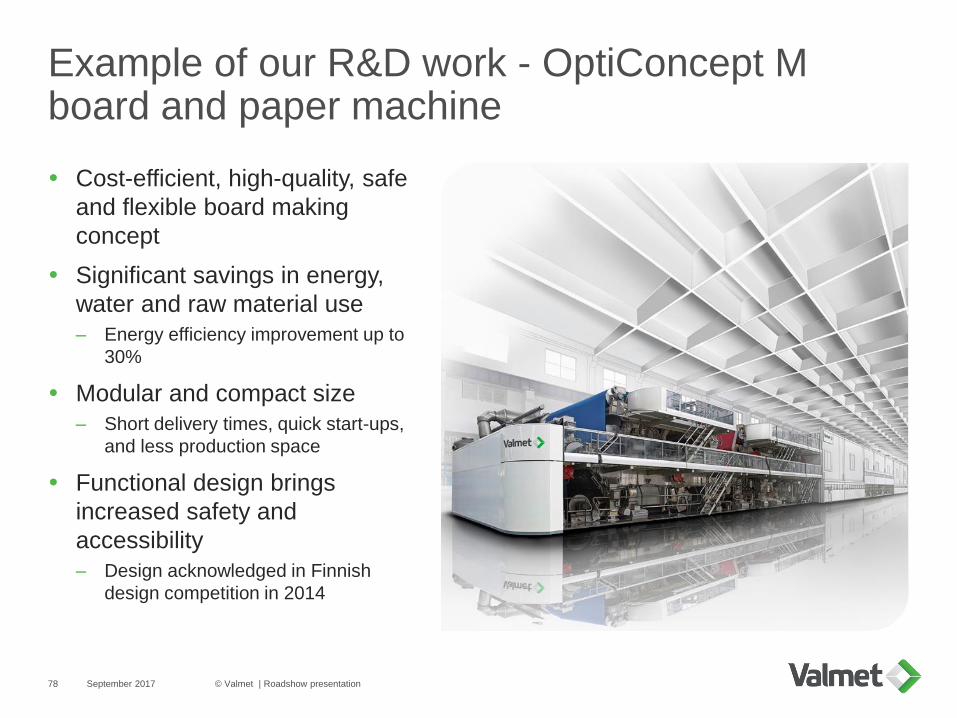
Example of our R&D work - OptiConcept M board and paper machine
September 2017 © Valmet | Roadshow presentation78
Cost-efficient, high-quality, safe
and flexible board making
concept
Significant savings in energy,
water and raw material use
– Energy efficiency improvement up to
30%
Modular and compact size
– Short delivery times, quick start-ups,
and less production space
Functional design brings
increased safety and
accessibility
– Design acknowledged in Finnish
design competition in 2014

AppendixManagement

Experienced Executive Team
September 2017 © Valmet | Roadshow presentation80
1) Includes 100 shares in Valmet owned by Ms. Salonsaari-Posti’s family members
2) Includes 100 shares in Valmet owned by Mr. Tiitinen’s family members
Business
lines
Corporate
Pasi LainePresident and CEO
Share ownership: 101,997
Kari SaarinenCFO
Share ownership: 26,753
Julia MachareySVP, Human Resources
Share ownership: 17,984
Juha LappalainenSVP, Strategy and
Operational Development
Share ownership: 25,597
Jukka TiitinenBusiness Line President,
Services
Share ownership2: 60,388
Bertel KarlstedtBusiness Line President,
Pulp and Energy
Share ownership: 27,045
Jari VähäpesolaBusiness Line President,
Paper
Share ownership: 35,175
Dave KingArea President, North
America
Share ownership: 11,517
Celso TaclaArea President, South
America
Share ownership: 56,449
Vesa SimolaArea President, EMEA
Share ownership: 26,249
Aki NiemiArea President, China
Share ownership: 36,690
Hannu T. PietiläArea President, Asia Pacific
Share ownership: 37,544
Sakari RuotsalainenBusiness Line President,
Automation
Share ownership: 21,088
Areas
Anu Salonsaari-PostiSVP, Marketing &
Communications
Share ownership1: 13,442
The following appointments
have been made as of
October 1, 2017:
Jukka Tiitinen – Area
President, Asia Pacific
Aki Niemi – Business Line
President, Services
Hannu T. Pietilä – Vice
President Sales, Asia
Pacific

Board of Directors
September 2017 © Valmet | Roadshow presentation81
• M.Sc. (Tech.)
• Selected experience:
- CoB of Normet Group Oy, VTT
Technical Research Centre of
Finland Ltd and Affecto Oyj
- Member of the BoD of Solidium
Oy, Federation of Finnish
Technology Industries
• Share ownership: 2,926
• Independent of company: Yes
• Independent of owners: No
Aaro Cantell(b. 1964)
Board member
Finnish citizen
• BSc (Mech. Eng), MBA
• Selected experience:
- CoB of Piab Group Holding
- Vice CoB of Grundfos A/S and
IMD
- Member of the BoD of Norstjernan
AB and Trelleborg AB
• Share ownership: 10,018
• Independent of company: Yes
• Independent of owners: Yes
• M.Sc. (Econ.), Accounting; LL.M.
• Selected experience:
- Member of the BoD of Saxobank
A/S, Volvo PV AB, Schneider SE,
Bilfinger Berger SE, INGKA
Holding B.V. (IKEA Group),
Akastor ASA, Canada Steamship
Lines, Credit Suisse London
• Share ownership: 8,610
• Independent of company: Yes
• Independent of owners: Yes
Bo Risberg(b. 1956)
Chairman of
the Board
Swedish citizen
Lone Fønss
Schrøder(b. 1960)
Board member
Danish citizen
• LL.M.
• Selected experience:
- CoB of Innova Oy and Mandatum
Life Investment Services Ltd
- Member of the BoD Euroben Life
& Pension Limited
• Share ownership: 2,926
• Independent of company: Yes
• Independent of owners: Yes
Tarja Tyni(b. 1964)
Board member
Finnish citizen
• BSc in Business Management, MBA
• Selected experience:
- Member of the BoD Innovatech
Negócios Florestais
• Share ownership: 7,113
• Independent of company: Yes
• Independent of owners: Yes
Rogério Ziviani(b. 1956)
Board member
Brazilian citizen
• M.Sc. (Tech.)
• Selected experience:
- Member of the BoD of Nokia Oyj,
SKF AB, Foundation Board and
Supervisory Board of IMD
business school and International
Advisory Board of Komatsu
Corporation of Japan
• Share ownership: 3,209
• Independent of company: Yes
• Independent of owners: Yes
Jouko Karvinen(b. 1957)
Vice Chairman of the
Board
Finnish citizen
• M.Sc. (Econ.)
• Selected experience:
- CFO of F-Secure Corporation
- Member of the BoD of Comptel
Oyj
• Share ownership: 1,130
• Independent of company: Yes
• Independent of owners: Yes
Eriikka Söderström(b. 1968)
Board member
Finnish citizen
