valuation -...
TRANSCRIPT

Aswath Damodaran 1
ValuationAswath Damodaran
http://www.stern.nyu.edu/~adamodar
The material for this presentation is available under seminars

Aswath Damodaran 2
Some Initial Thoughts
" One hundred thousand lemmings cannot be wrong"
Graffiti

Aswath Damodaran 3
A philosophical basis for Valuation
n Many investors believe that the pursuit of 'true value' based uponfinancial fundamentals is a fruitless one in markets where prices oftenseem to have little to do with value.
n There have always been investors in financial markets who haveargued that market prices are determined by the perceptions (andmisperceptions) of buyers and sellers, and not by anything as prosaicas cashflows or earnings.
n Perceptions matter, but they cannot be all the matter.
n Asset prices cannot be justified by merely using the “bigger fool”theory.

Aswath Damodaran 4
Misconceptions about Valuation
n Myth 1: A valuation is an objective search for “true” value• Truth 1.1: All valuations are biased. The only questions are how much
and in which direction.• Truth 1.2: The direction and magnitude of the bias in your valuation is
directly proportional to who pays you and how much you are paid.
n Myth 2.: A good valuation provides a precise estimate of value• Truth 2.1: There are no precise valuations• Truth 2.2: The payoff to valuation is greatest when valuation is least
precise.
n Myth 3: . The more quantitative a model, the better the valuation• Truth 3.1: One’s understanding of a valuation model is inversely
proportional to the number of inputs required for the model.• Truth 3.2: Simpler valuation models do much better than complex ones.

Aswath Damodaran 5
Approaches to Valuation
n Discounted cashflow valuation, relates the value of an asset to thepresent value of expected future cashflows on that asset.
n Relative valuation, estimates the value of an asset by looking at thepricing of 'comparable' assets relative to a common variable likeearnings, cashflows, book value or sales.
n Contingent claim valuation, uses option pricing models to measurethe value of assets that share option characteristics.

Aswath Damodaran 6
Discounted Cash Flow Valuation
n What is it: In discounted cash flow valuation, the value of an asset isthe present value of the expected cash flows on the asset.
n Philosophical Basis: Every asset has an intrinsic value that can beestimated, based upon its characteristics in terms of cash flows, growthand risk.
n Information Needed: To use discounted cash flow valuation, youneed• to estimate the life of the asset• to estimate the cash flows during the life of the asset• to estimate the discount rate to apply to these cash flows to get present
value
n Market Inefficiency: Markets are assumed to make mistakes inpricing assets across time, and are assumed to correct themselves overtime, as new information comes out about assets.

Aswath Damodaran 7
Valuing a Firm
n The value of the firm is obtained by discounting expected cashflows tothe firm, i.e., the residual cashflows after meeting all operatingexpenses and taxes, but prior to debt payments, at the weightedaverage cost of capital, which is the cost of the different componentsof financing used by the firm, weighted by their market valueproportions.
where,
CF to Firmt = Expected Cashflow to Firm in period t
WACC = Weighted Average Cost of Capital
Value of Firm = CF to Firmt
( 1 +WACC) tt = 1
t = n
∑

Aswath Damodaran 8
Generic DCF Valuation Model
Cash flowsFirm: Pre-debt cash flowEquity: After debt cash flows
Expected GrowthFirm: Growth in Operating EarningsEquity: Growth in Net Income/EPS
CF1 CF2 CF3 CF4 CF5
Forever
Firm is in stable growth:Grows at constant rateforever
Terminal Value
CFn.........
Discount RateFirm:Cost of Capital
Equity: Cost of Equity
ValueFirm: Value of Firm
Equity: Value of Equity
DISCOUNTED CASHFLOW VALUATION
Length of Period of High Growth

Aswath Damodaran 9
Cashflow to FirmEBIT (1-t)- (Cap Ex - Depr)- Change in WC= FCFF
Expected GrowthReinvestment Rate* Return on Capital
FCFF1 FCFF2 FCFF3 FCFF4 FCFF5
Forever
Firm is in stable growth:Grows at constant rateforever
Terminal Value= FCFF n+1/(r-gn)
FCFFn.........
Cost of Equity Cost of Debt(Riskfree Rate+ Default Spread) (1-t)
WeightsBased on Market Value
Discount at WACC= Cost of Equity (Equity/(Debt + Equity)) + Cost of Debt (Debt/(Debt+ Equity))
Value of Operating Assets+ Cash & Non-op Assets= Value of Firm- Value of Debt= Value of Equity
Riskfree Rate :- No default risk- No reinvestment risk- In same currency andin same terms (real or nominal as cash flows
+Beta- Measures market risk X
Risk Premium- Premium for averagerisk investment
Type of Business
Operating Leverage
FinancialLeverage
Base EquityPremium
Country RiskPremium
DISCOUNTED CASHFLOW VALUATION

Aswath Damodaran 10
Current Cashflow to FirmEBIT(1-t) : 123- Nt CpX 11- Chg WC 7= FCFF 105Reinvestment Rate =14.88%
Expected Growth in EBIT (1-t).2502*.3947-=.09889.88 %
Stable Growthg = 5%; Beta = 0.96;Country Premium= 0% ROC=15%Reinvestment Rate=33%
Terminal Value 5= 127/(.0826-.05) = 3,900
Cost of Equity10.47%
Cost of Debt(5.1%+.75+.95%)(1-.2449)= 5.13%
WeightsE = 78.7% D = 21.3%
Discount at Cost of Capital (WACC) = 10.47% (.787) + 5.13% (0.213) = 9.33%
Firm Value: 2,925+ Cash: 65- Debt 586=Equity 2,404-Options 0Value/Share 57.46
Riskfree Rate :Real riskfree rate = 5.1% +
Beta 0.96 X
Risk Premium5.59%
Unlevered Beta for Sectors: 0.80
Firm’s D/ERatio: 27%
Mature riskpremium4%
Country RiskPremium1.59%
Titan Cements: Status Quo Reinvestment Rate39.47%
Return on Capital25.02%
Term Yr191 64127
Avg Reinvestment rate = 39.47%
1 2 3 4 5EBIT(1-t) 135 148 162 173 181 - Reinvestment 53 59 62 62 60 FCFF 82 90 100 111 121

Aswath Damodaran 11
FCFF1 FCFF2 FCFF3 FCFF4 FCFF5
Forever
Terminal Value= FCFF n+1/(r-gn)
FCFFn.........
Cost of Equity Cost of Debt(Riskfree Rate+ Default Spread) (1-t)
WeightsBased on Market Value
Discount at WACC= Cost of Equity (Equity/(Debt + Equity)) + Cost of Debt (Debt/(Debt+ Equity))
Value of Operating Assets+ Cash & Non-op Assets= Value of Firm- Value of Debt= Value of Equity- Equity Options= Value of Equity in Stock
Riskfree Rate :- No default risk- No reinvestment risk- In same currency andin same terms (real or nominal as cash flows
+Beta- Measures market risk X
Risk Premium- Premium for averagerisk investment
Type of Business
Operating Leverage
FinancialLeverage
Base EquityPremium
Country RiskPremium
CurrentRevenue
CurrentOperatingMargin
Reinvestment
Sales TurnoverRatio
CompetitiveAdvantages
Revenue Growth
Expected Operating Margin
Stable Growth
StableRevenueGrowth
StableOperatingMargin
StableReinvestment
Discounted Cash Flow Valuation: High Growth with Negative Earnings
EBIT
Tax Rate- NOLs
FCFF = Revenue* Op Margin (1-t) - Reinvestment

Aswath Damodaran 12
Forever
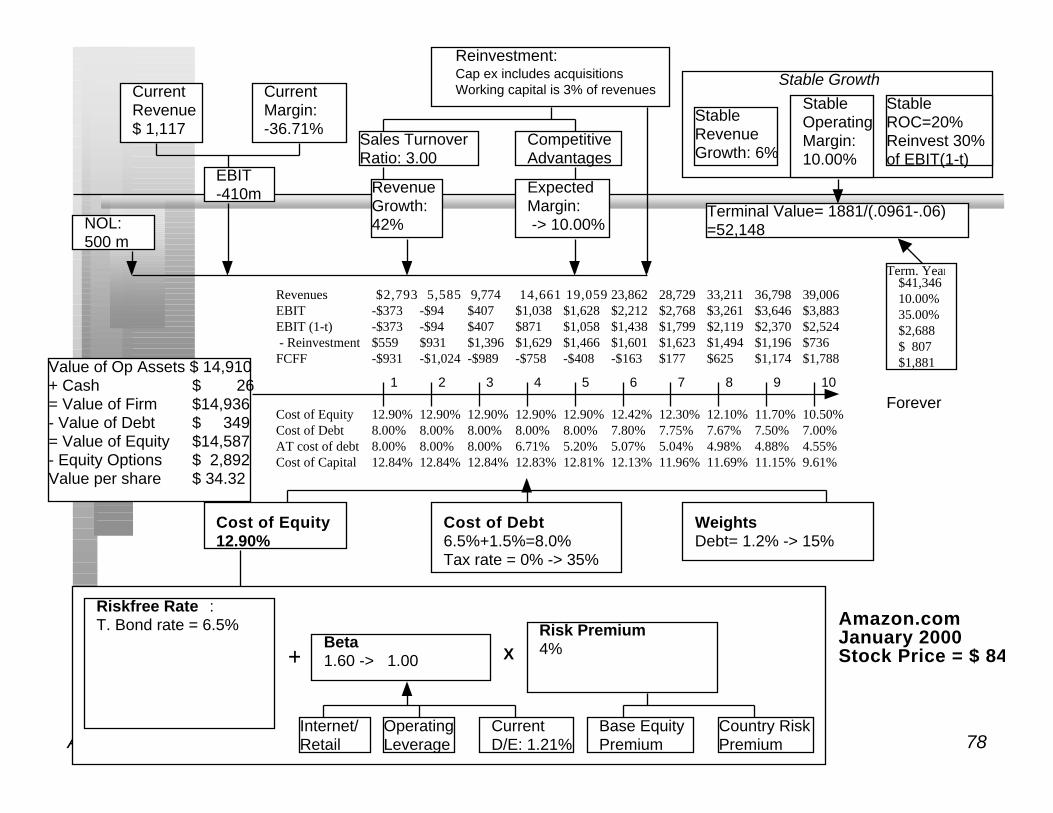
Terminal Value= 1881/(.0961-.06)=52,148
Cost of Equity12.90%
Cost of Debt6.5%+1.5%=8.0%Tax rate = 0% -> 35%
WeightsDebt= 1.2% -> 15%
Value of Op Assets $ 14,910+ Cash $ 26= Value of Firm $14,936- Value of Debt $ 349= Value of Equity $14,587- Equity Options $ 2,892Value per share $ 34.32
Riskfree Rate :T. Bond rate = 6.5%
+Beta1.60 -> 1.00 X
Risk Premium4%
Internet/Retail
Operating Leverage
Current D/E: 1.21%
Base EquityPremium
Country RiskPremium
CurrentRevenue$ 1,117
CurrentMargin:-36.71%
Reinvestment:Cap ex includes acquisitionsWorking capital is 3% of revenues
Sales TurnoverRatio: 3.00
CompetitiveAdvantages
Revenue Growth:42%
Expected Margin: -> 10.00%
Stable Growth
StableRevenueGrowth: 6%
StableOperatingMargin: 10.00%
Stable ROC=20%Reinvest 30% of EBIT(1-t)
EBIT-410m
NOL:500 m
$41,346 10.00% 35.00%$2,688 $ 807 $1,881
Term. Year
2 431 5 6 8 9 107
Cost of Equity 12.90% 12.90% 12.90% 12.90% 12.90% 12.42% 12.30% 12.10% 11.70% 10.50%Cost of Debt 8.00% 8.00% 8.00% 8.00% 8.00% 7.80% 7.75% 7.67% 7.50% 7.00%AT cost of debt 8.00% 8.00% 8.00% 6.71% 5.20% 5.07% 5.04% 4.98% 4.88% 4.55%Cost of Capital 12.84% 12.84% 12.84% 12.83% 12.81% 12.13% 11.96% 11.69% 11.15% 9.61%
Revenues $2,793 5,585 9,774 14,661 19,059 23,862 28,729 33,211 36,798 39,006 EBIT -$373 -$94 $407 $1,038 $1,628 $2,212 $2,768 $3,261 $3,646 $3,883EBIT (1-t) -$373 -$94 $407 $871 $1,058 $1,438 $1,799 $2,119 $2,370 $2,524 - Reinvestment $559 $931 $1,396 $1,629 $1,466 $1,601 $1,623 $1,494 $1,196 $736FCFF -$931 -$1,024 -$989 -$758 -$408 -$163 $177 $625 $1,174 $1,788
Amazon.comJanuary 2000Stock Price = $ 84

Aswath Damodaran 13
I. Discount Rates: Cost of Equity
Cost of Equity = Riskfree Rate + Beta * (Risk Premium)
Has to be in the samecurrency as cash flows, and defined in same terms(real or nominal) as thecash flows
Preferably, a bottom-up beta,based upon other firms in thebusiness, and firm’s own financialleverage
Historical Premium1. Mature Equity Market Premium:Average premium earned bystocks over T.Bonds in U.S.2. Country risk premium =Country Default Spread* ( σEquity/σCountry bond)
Implied PremiumBased on how equitymarket is priced todayand a simple valuationmodel
or

Aswath Damodaran 14
Short term Governments are not risk free
n On a riskfree asset, the actual return is equal to the expected return.Therefore, there is no variance around the expected return.
n For an investment to be riskfree, then, it has to have• No default risk
• No reinvestment risk
n Thus, the riskfree rates in valuation will depend upon when the cashflow is expected to occur and will vary across time
n A simpler approach is to match the duration of the analysis (generallylong term) to the duration of the riskfree rate (also long term)
n In emerging markets, there are two problems:• The government might not be viewed as riskfree (Brazil, Indonesia)
• There might be no market-based long term government rate (China)

Aswath Damodaran 15
Estimating a Riskfree Rate
n Estimate a riskfree rate in local terms:• Approach 1: Government bond rate in local currency terms - Default
spread for Government in local currency
• Approach 2: Use forward rates and the riskless rate in an index currency(say Euros or dollars) to estimate the riskless rate in the local currency.
n Do the analysis in real terms (rather than nominal terms) using a realriskfree rate, which can be obtained in one of two ways –• from an inflation-indexed government bond, if one exists
• set equal, approximately, to the long term real growth rate of the economyin which the valuation is being done.
n Do the analysis in another more stable currency, say US dollars.

Aswath Damodaran 16
A Simple Test
n You are valuing a Greek company in Euros and are attempting toestimate a risk free rate to use in the analysis. The risk free rate thatyou should use is
o The interest rate on a nominal drachma-denominated Greekgovernment bond
o The interest rate on a Euro-denominated Greek government bond
o The interest rate on a Euro-denominated bond issued by a governmentwith no perceived default risk

Aswath Damodaran 17
In Practice: Choose your riskfree rate
n What riskfree rate will you use in your valuation?• Nominal or real
• Currency
n Why?

Aswath Damodaran 18
Everyone uses historical premiums, but..
n The historical premium is the premium that stocks have historically earnedover riskless securities.
n Practitioners never seem to agree on the premium; it is sensitive to• How far back you go in history…• Whether you use T.bill rates or T.Bond rates• Whether you use geometric or arithmetic averages.
n For instance, looking at the US:Historical period Stocks - T.Bills Stocks - T.Bonds
Arith Geom Arith Geom1928-2000 8.41% 7.17% 6.53% 5.51%1962-2000 6.41% 5.25% 5.30% 4.52%1990-2000 11.42% 7.64% 12.67% 7.09%

Aswath Damodaran 19
If you choose to use historical premiums….
n Go back as far as you can. A risk premium comes with a standarderror. Given the annual standard deviation in stock prices is about25%, the standard error in a historical premium estimated over 25years is roughly:
Standard Error in Premium = 25%/√25 = 25%/5 = 5%n Be consistent in your use of the riskfree rate. Since we argued for long
term bond rates, the premium should be the one over T.Bondsn Use the geometric risk premium. It is closer to how investors think
about risk premiums over long periods.n Never use historical risk premiums estimated over short periods.n For emerging markets, start with the base historical premium in the US
and add a country spread, based upon the country rating and therelative equity market volatility.

Aswath Damodaran 20
Assessing Country Risk Using CurrencyRatings: Western Europe
• Country Rating Typical Spread Actual Spread• Austria Aaa 0• Belgium Aaa 0• Denmark Aaa 0• Finland Aaa 0• France Aaa 0• Germany Aaa 0• Greece A3 95 50• Ireland AA2 65 35• Italy Aa3 70 30• Netherlands Aaa 0• Norway Aaa 0• Portugal A3 95 55• Spain Aa1 60 30• Sweden Aa1 60 25• Switzerland Aaa 0

Aswath Damodaran 21
Assessing Country Risk using Ratings: TheRest of Europe
Country Rating Default SpreadCroatia Baa3 145Cyprus A2 90Czech Republic Baa1 120Hungary A3 95Latvia Baa2 130Lithuania Ba1 250Moldova B3 650Poland Baa1 120Romania B3 650Russia B2 550Slovakia Ba1 250Slovenia A2 90Turkey B1 450

Aswath Damodaran 22
Using Country Ratings to Estimate EquitySpreads
n Country ratings measure default risk. While default risk premiums andequity risk premiums are highly correlated, one would expect equityspreads to be higher than debt spreads.• One way to adjust the country spread upwards is to use information from
the US market. In the US, the equity risk premium has been roughly twicethe default spread on junk bonds.
• Another is to multiply the bond spread by the relative volatility of stockand bond prices in that market. For example,
– Standard Deviation in Greek ASE(Equity) = 26.87%
– Standard Deviation in Greek Euro Bond = 16.1%
– Adjusted Equity Spread = 0.95% (26.87%/16.1%) = 1.59%
n Ratings agencies make mistakes. They are often late in recognizingand building in risk.

Aswath Damodaran 23
From Country Spreads to Corporate Riskpremiums
n Approach 1: Assume that every company in the country is equallyexposed to country risk. In this case,E(Return) = Riskfree Rate + Country Spread + Beta (US premium)Implicitly, this is what you are assuming when you use the local
Government’s dollar borrowing rate as your riskfree rate.
n Approach 2: Assume that a company’s exposure to country risk issimilar to its exposure to other market risk.E(Return) = Riskfree Rate + Beta (US premium + Country Spread)
n Approach 3: Treat country risk as a separate risk factor and allowfirms to have different exposures to country risk (perhaps based uponthe proportion of their revenues come from non-domestic sales)E(Return)=Riskfree Rate+ β (US premium) + λ (Country Spread)

Aswath Damodaran 24
Estimating Company Exposure to Country Risk
n Different companies should be exposed to different degrees to country risk.For instance, a Greek firm that generates the bulk of its revenues in the rest ofWestern Europe should be less exposed to country risk than one that generatesall its business within Greece.
n The factor “λ” measures the relative exposure of a firm to country risk. Onesimplistic solution would be to do the following:λ = % of revenues domesticallyfirm/ % of revenues domesticallyavg firm
For instance, if a firm gets 35% of its revenues domestically while the averagefirm in that market gets 70% of its revenues domestically
λ = 35%/ 70 % = 0.5n There are two implications
• A company’s risk exposure is determined by where it does business and not bywhere it is located
• Firms might be able to actively manage their country risk exposures

Aswath Damodaran 25
Estimating E(Return) for Titan Cements
n Assume that the beta for Titan Cements is 0.96, and that the riskfree rate usedis 5.1%.
n Approach 1: Assume that every company in the country is equally exposed tocountry risk. In this case,
E(Return) = 5.10% + 1.59% + 0.96 (5.51%) = 11.98%n Approach 2: Assume that a company’s exposure to country risk is similar to
its exposure to other market risk.E(Return) = 5.10% + 0.96 (5.51%+ 1.59%) = 11.92%n Approach 3: Treat country risk as a separate risk factor and allow firms to
have different exposures to country risk (perhaps based upon the proportion oftheir revenues come from non-domestic sales)
E(Return)= 5.10% + 0.96(5.51%) + 0.70 (1.59%) = 11.50%Titan is less exposed to country risk than the typical Greek firm since it gets about
50% of its revenues in Greece; the average for Greek firms is 70%.

Aswath Damodaran 26
Implied Equity Premiums
n If we use a basic discounted cash flow model, we can estimate theimplied risk premium from the current level of stock prices.
n For instance, if stock prices are determined by the simple GordonGrowth Model:• Value = Expected Dividends next year/ (Required Returns on Stocks -
Expected Growth Rate)• Plugging in the current level of the index, the dividends on the index and
expected growth rate will yield a “implied” expected return on stocks.Subtracting out the riskfree rate will yield the implied premium.
n The problems with this approach are:• the discounted cash flow model used to value the stock index has to be the
right one.• the inputs on dividends and expected growth have to be correct• it implicitly assumes that the market is currently correctly valued

Aswath Damodaran 27
Implied Premium for US Equity Market
0.00%
1.00%
2.00%
3.00%
4.00%
5.00%
6.00%
7.00%
1960
1962
1964
1966
1968
1970
1972
1974
1976
1978
1980
1982
1984
1986
1988
1990
1992
1994
1996
1998
2000
Year
Implied P
rem
ium

Aswath Damodaran 28
An Intermediate Solution
n The historical risk premium of 5.51% for the United States is too higha premium to use in valuation. It is• As high as the highest implied equity premium that we have ever seen in
the US market (making your valuation a worst case scenario)
• Much higher than the actual implied equity risk premium in the market
n The current implied equity risk premium is too low because• It is lower than the equity risk premiums in the 60s, when inflation and
interest rates were as low
n The average implied equity risk premium between 1960-2000 in theUnited States is about 4%. We will use this as the premium for amature equity market.

Aswath Damodaran 29
Implied Premium for Greek Market: May 15,2001
n Level of the Index = 3389
n Dividends on the Index = 3.6% of 3389 (Used weighted yield)
n Other parameters• Riskfree Rate = 5.10% (Euros)
• Expected Growth (in Euros)– Next 5 years = 8% (Used expected growth rate in Earnings)
– After year 5 = 5.10%
n Solving for the expected return:• Expected return on Equity = 9.39%
• Implied Equity premium = 9.39% - 5.10% = 4.29%

Aswath Damodaran 30
The Effect of Using Different Equity Premiumson Value
n Titan’s value per share (using historical premium for US (4%) +country risk adjustment) = 57.46 Euros
n Titan’s value per share (using implied equity premium of 4.22%) =55.11 Euros
n Titan’s stock price (at the time of the valuation) = 51.84 Euros

Aswath Damodaran 31
In Practice: Estimate a risk premium
n If you were using a historical risk premium, what would your estimateof the premium be?
n If you were estimating an implied risk premium, what would yourestimate be for your market?
n What would you use as your risk premium in valuation?

Aswath Damodaran 32
Estimating Beta
n The standard procedure for estimating betas is to regress stock returns(Rj) against market returns (Rm) -
Rj = a + b Rm
• where a is the intercept and b is the slope of the regression.
n The slope of the regression corresponds to the beta of the stock, andmeasures the riskiness of the stock.
n This beta has three problems:• It has high standard error
• It reflects the firm’s business mix over the period of the regression, notthe current mix
• It reflects the firm’s average financial leverage over the period rather thanthe current leverage.

Aswath Damodaran 33
Beta Estimation for Titan Cement: The IndexEffect

Aswath Damodaran 34
Beta Estimation: Amazon

Aswath Damodaran 35
Determinants of Betas
n Product or Service: The beta value for a firm depends upon the sensitivity ofthe demand for its products and services and of its costs to macroeconomicfactors that affect the overall market.
• Cyclical companies have higher betas than non-cyclical firms• Firms which sell more discretionary products will have higher betas than firms that
sell less discretionary products
n Operating Leverage: The greater the proportion of fixed costs in the coststructure of a business, the higher the beta will be of that business. This isbecause higher fixed costs increase your exposure to all risk, including marketrisk.
n Financial Leverage: The more debt a firm takes on, the higher the beta willbe of the equity in that business. Debt creates a fixed cost, interest expenses,that increases exposure to market risk. The beta of equity alone can be writtenas a function of the unlevered beta and the debt-equity ratio
βL = βu (1+ ((1-t)D/E)where
βL = Levered or Equity Beta βu = Unlevered Betat = Corporate marginal tax rate D = Market Value of DebtE = Market Value of Equity

Aswath Damodaran 36
The Solution: Bottom-up Betas
n The bottom up beta can be estimated by :• Taking a weighted (by sales or operating income) average of the
unlevered betas of the different businesses a firm is in.
(The unlevered beta of a business can be estimated by looking at other firms inthe same business)
• Lever up using the firm’s debt/equity ratio
n The bottom up beta will give you a better estimate of the true betawhen• It has lower standard error (SEaverage = SEfirm / √n (n = number of firms)• It reflects the firm’s current business mix and financial leverage• It can be estimated for divisions and private firms.
j
j =1
j =k
∑ Operating Income j
Operating IncomeFirm
levered = unlevered1+ (1− tax rate) (Current Debt/Equity Ratio)[ ]

Aswath Damodaran 37
Titan’s Bottom-up Beta
Business Unlevered D/E Ratio Levered Proportion of
Beta Beta Value
Cement .80 27.02% 0.96 100%
Levered Beta = Unlevered Beta ( 1 + (1- tax rate) (D/E Ratio))
= 0.80 ( 1 + (1-.2449) (.2702)) = 0.96
Notes on calculating debt to equity ratioMarket value was used for equity
Book value of debt is assumed equal to market value of debt

Aswath Damodaran 38
Amazon’s Bottom-up Beta
Unlevered beta for firms in internet retailing = 1.60
Unlevered beta for firms in specialty retailing = 1.00
n Amazon is a specialty retailer, but its risk currently seems to be determined bythe fact that it is an online retailer. Hence we will use the beta of internetcompanies to begin the valuation but move the beta, after the first five years,towards to beta of the retailing business.

Aswath Damodaran 39
In Practice: Estimating a Beta
n What is the regression beta for your firm? What would your concernsbe about using this beta?
n Estimate a bottom-up beta for your firm.• Bottom-up unlevered beta =• Market Equity =• Debt =• Debt/ Equity ratio =• Tax rate =• Levered beta = Unlevered Beta ( 1 + (1- tax rate) (D/E Ratio))
n Cost of Equity = Riskfree rate + Beta * Risk Premium

Aswath Damodaran 40
From Cost of Equity to Cost of Capital
Cost of Capital = Cost of Equity (Equity/(Debt + Equity)) + Cost of Borrowing (1-t) (Debt/(Debt + Equity))
Cost of borrowing should be based upon(1) synthetic or actual bond rating(2) default spreadCost of Borrowing = Riskfree rate + Default spread
Marginal tax rate, reflectingtax benefits of debt
Weights should be market value weightsCost of equitybased upon bottom-upbeta

Aswath Damodaran 41
Cost of Debt
n If the firm has bonds outstanding, and the bonds are traded, the yieldto maturity on a long-term, straight (no special features) bond can beused as the interest rate.
n If the firm is rated, use the rating and a typical default spread on bondswith that rating to estimate the cost of debt.
n If the firm is not rated,• and it has recently borrowed long term from a bank, use the interest rate
on the borrowing or
• estimate a synthetic rating for the company, and use the synthetic rating toarrive at a default spread and a cost of debt
n The cost of debt has to be estimated in the same currency as the cost ofequity and the cash flows in the valuation.

Aswath Damodaran 42
Estimating Synthetic Ratings
n The rating for a firm can be estimated using the financialcharacteristics of the firm. In its simplest form, the rating can beestimated from the interest coverage ratio
Interest Coverage Ratio = EBIT / Interest Expenses
n For Titan’s interest coverage ratio, we used the interest expenses andEBIT from 2000.
Interest Coverage Ratio = 162.75/ 11.82= 13.77
n Amazon.com has negative operating income; this yields a negativeinterest coverage ratio, which should suggest a low rating. Wecomputed an average interest coverage ratio of 2.82 over the next 5years.

Aswath Damodaran 43
Interest Coverage Ratios, Ratings and DefaultSpreads
If Interest Cov Ratio is Bond Rating Default Spread(1/00) Default Spread(1/01)> 8.50 AAA 0.20% 0.75%6.50 - 8.50 AA 0.50% 1.00%5.50 - 6.50 A+ 0.80% 1.50%4.25 - 5.50 A 1.00% 1.80%3.00 - 4.25 A– 1.25% 2.00%2.50 - 3.00 BBB 1.50% 2.25%2.00 - 2.50 BB 2.00% 3.50%1.75 - 2.00 B+ 2.50% 4.75%1.50 - 1.75 B 3.25% 6.50%1.25 - 1.50 B – 4.25% 8.00%0.80 - 1.25 CCC 5.00% 10.00%0.65 - 0.80 CC 6.00% 11.50%0.20 - 0.65 C 7.50% 12.70%< 0.20 D 10.00% 15.00%

Aswath Damodaran 44
Estimating the cost of debt for a firm
n The synthetic rating for Titan is AAA. The default spread is 0.75%.Pre-tax Cost of Debt= Riskfree Rate + Company Default Spread+ Country Spread= 5.10% + 0.75% + 0.95%= 6.80%
n The synthetic rating for Amazon.com is BBB (in January 2000). The defaultspread for BBB rated bond is 1.50%
Pre-tax cost of debt = Riskfree Rate + Default spread = 6.50% + 1.50% = 8.00%• After-tax cost of debt right now = 8.00% (1- 0) = 8.00%: The firm is paying no
taxes currently. As the firm’s tax rate changes and its cost of debt changes, the aftertax cost of debt will change as well.1 2 3 4 5 6 7 8 9 10
Pre-tax 8.00% 8.00% 8.00% 8.00% 8.00% 7.80% 7.75% 7.67% 7.50% 7.00%Tax rate 0% 0% 0% 16.13% 35% 35% 35% 35% 35% 35%
After-tax 8.00% 8.00% 8.00% 6.71% 5.20% 5.07% 5.04% 4.98% 4.88% 4.55%
Aswath Damodaran 45
In Practice: Estimating a Cost of Debt
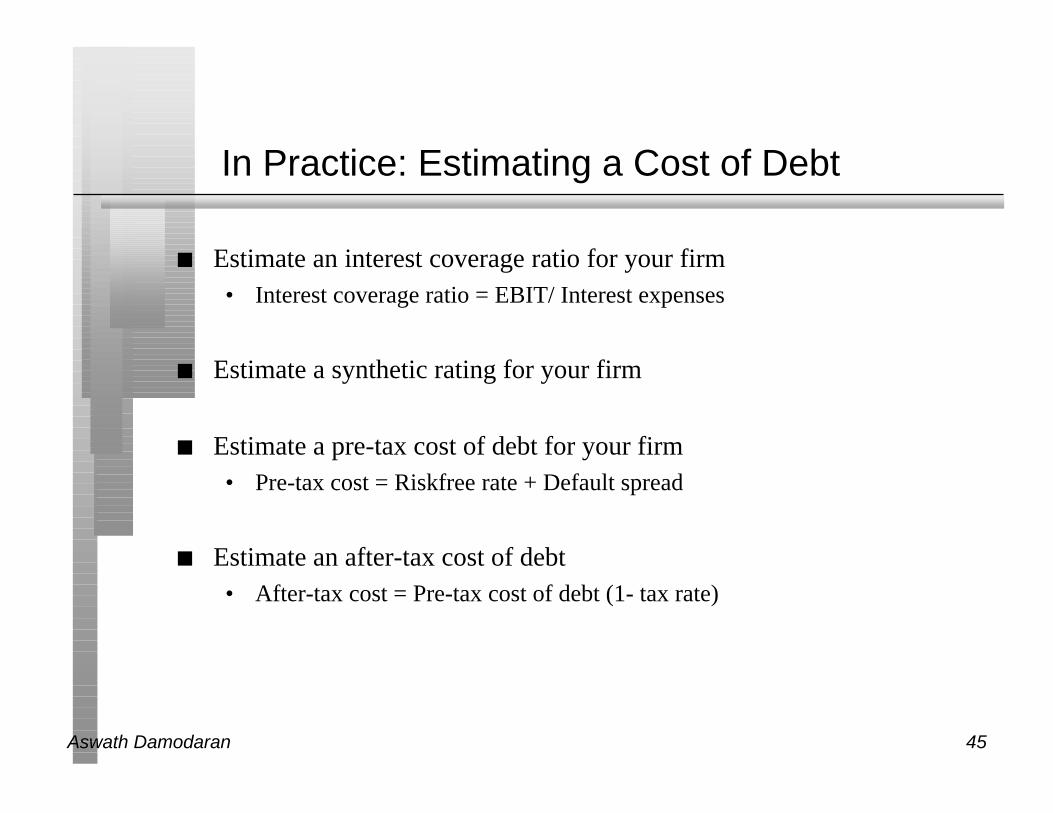
n Estimate an interest coverage ratio for your firm• Interest coverage ratio = EBIT/ Interest expenses
n Estimate a synthetic rating for your firm
n Estimate a pre-tax cost of debt for your firm• Pre-tax cost = Riskfree rate + Default spread
n Estimate an after-tax cost of debt• After-tax cost = Pre-tax cost of debt (1- tax rate)

Aswath Damodaran 46
Weights for the Cost of Capital Computation
n The weights used to compute the cost of capital should be the marketvalue weights for debt and equity.
n There is an element of circularity that is introduced into everyvaluation by doing this, since the values that we attach to the firm andequity at the end of the analysis are different from the values we gavethem at the beginning.
n As a general rule, the debt that you should subtract from firm value toarrive at the value of equity should be the same debt that you used tocompute the cost of capital.

Aswath Damodaran 47
Estimating Cost of Capital: Amazon.com
n Equity• Cost of Equity = 6.50% + 1.60 (4.00%) = 12.90%
• Market Value of Equity = $ 84/share* 340.79 mil shs = $ 28,626 mil(98.8%)
n Debt• Cost of debt = 6.50% + 1.50% (default spread) = 8.00%
• Market Value of Debt = $ 349 mil (1.2%)
n Cost of Capital
Cost of Capital = 12.9 % (.988) + 8.00% (1- 0) (.012)) = 12.84%

Aswath Damodaran 48
Amazon.com: Book Value Weights
n Amazon.com has a book value of equity of $ 138 million and a bookvalue of debt of $ 349 million. Estimate the cost of capital using bookvalue weights instead of market value weights.
n Is this more conservative?

Aswath Damodaran 49
Estimating Cost of Capital: Titan Cements
n Equity• Cost of Equity = 5.10% + 0.96 (4%+1.59%) = 10.47%
• Market Value of Equity = 739,217 million GDr (78.7%)
n Debt• Cost of debt = 5.10% + 0.75% +0.95%= 6.80%
• Market Value of Debt = 199,766 million GDr (21.3 %)
n Cost of Capital
Cost of Capital = 10.47 % (.787) + 6.80% (1- .2449) (0.213)) = 9.33 %
The book value of equity at Titan Cement is 135,857 million GDr.

Aswath Damodaran 50
In Practice: Estimate the cost of capital
n Cost of Equity = See page 39
n After-tax cost of debt = See page 45
n Debt = Equity =
n D/ (D+E) = E/(D+E) =
n Cost of capital =

Aswath Damodaran 51
II. Estimating Cash Flows to Firm
Earnings before interest and taxes
- Tax rate * EBIT
= EBIT ( 1- tax rate)
- (Capital Expenditures - Depreciation)
- Change in non-cash working capital
= Free Cash flow to the firm (FCFF)
Update- Trailing Earnings- Unofficial numbers
Normalize- History- Industry
Cleanse operating items of- Financial Expenses- Capital Expenses- Non-recurring expenses
Operating leases- Convert into debt- Adjust operating income
R&D Expenses- Convert into asset- Adjust operating income
Tax rate- can be effective for near future, but move to marginal- reflect net operating losses
Include- R&D- Acquisitions
Defined asNon-cash CA- Non-debt CL

Aswath Damodaran 52
The Importance of Updating
n The operating income and revenue that we use in valuation should beupdated numbers. One of the problems with using financial statementsis that they are dated.
n As a general rule, it is better to use 12-month trailing estimates forearnings and revenues than numbers for the most recent financial year.This rule becomes even more critical when valuing companies that areevolving and growing rapidly.
Last 10-K Trailing 12-month
Revenues $ 610 million $1,117 million
EBIT - $125 million - $ 410 million

Aswath Damodaran 53
Normalizing Amazon’s EBIT
Year Revenues Operating Margin EBITTr12m $1,117 -36.71% -$4101 $2,793 -13.35% -$3732 $5,585 -1.68% -$943 $9,774 4.16% $4074 $14,661 7.08% $1,0385 $19,059 8.54% $1,6286 $23,862 9.27% $2,2127 $28,729 9.64% $2,7688 $33,211 9.82% $3,2619 $36,798 9.91% $3,64610 $39,006 9.95% $3,883TY(11) $41,346 10.00% $4,135 Industry Average

Aswath Damodaran 54
Operating Leases at The Home Depot in 1998
n The pre-tax cost of debt at the Home Depot is 6.25%Yr Operating Lease Expense Present Value 1 $ 294 $ 277 2 $ 291 $ 258 3 $ 264 $ 220 4 $ 245 $ 192 5 $ 236 $ 174 6-15 $ 270 $ 1,450 (PV of 10-yr annuity)
Present Value of Operating Leases =$ 2,571
n Debt outstanding at the Home Depot = $1,205 + $2,571 = $3,776 mil(The Home Depot has other debt outstanding of $1,205 million)
n Adjusted Operating Income = $2,016 + 2,571 (.0625) = $2,177 mil

Aswath Damodaran 55
Capitalizing R&D Expenses: ShirePharmaceuticals
n To capitalize R&D,• Specify an amortizable life for R&D (2 - 10 years)• Collect past R&D expenses for as long as the amortizable life• Sum up the unamortized R&D over the period. (Thus, if the amortizable life is 5
years, the research asset can be obtained by adding up 1/5th of the R&D expensefrom five years ago, 2/5th of the R&D expense from four years ago...:
n R & D was assumed to have a 5-year life.Year R&D Unamortized R&D AmortizationCurrent £48.12 1.00 £48.12 £0.00-1 £37.42 0.80 £29.94 £7.48-2 £28.99 0.60 £17.39 £5.80-3 £17.88 0.40 £7.15 £3.58-4 £8.18 0.20 £1.64 £1.64
-5 £4.56 0.00 £0.00 £0.91 £104.24 £19.41
Value of research asset = £104.24Amortization of research asset in 2000 = £19.41Adjustment to Operating Income = Add back R&D and subtract Amortization of R&D
Adjusted Operating Income = £41.03 + £48.12 - £19.41 = £69.74

Aswath Damodaran 56
What about S, G & A expenses?
n Many internet companies are arguing that selling and G&A expensesare the equivalent of R&D expenses for a high-technology firms andshould be treated as capital expenditures.
n If we adopt this rationale, we should be computing earnings beforethese expenses, which will make many of these firms profitable. It willalso mean that they are reinvesting far more than we think they are. Itwill, however, make not their cash flows less negative.
n Should Amazon.com’s selling expenses be treated as cap ex?

Aswath Damodaran 57
The Effect of Net Operating Losses
Year 1 2 3 4 5
EBIT -$373 -$94 $407 $1,038 $1,628
Taxes $0 $0 $0 $167 $570
EBIT(1-t) -$373 -$94 $407 $871 $1,058
Tax rate 0% 0% 0% 16.13% 35%
NOL $500 $873 $967 $560 $0
After year 5, the tax rate becomes 35%.

Aswath Damodaran 58
Net Capital expenditures should include
n Research and development expenses, once they have been re-categorized as capital expenses. The adjusted cap ex will beAdjusted Net Capital Expenditures = Capital Expenditures + Current year’s
R&D expenses - Amortization of Research Asset
n Acquisitions of other firms, since these are like capital expenditures.The adjusted cap ex will beAdjusted Net Cap Ex = Capital Expenditures + Acquisitions of other firms -
Amortization of such acquisitionsTwo caveats:1. Most firms do not do acquisitions every year. Hence, a normalized
measure of acquisitions (looking at an average over time) should be used2. The best place to find acquisitions is in the statement of cash flows,
usually categorized under other investment activities

Aswath Damodaran 59
Estimating FCFF: Titan Cement
n EBIT = 162.75 million Eurosn Tax rate = 24.49%n Net Capital expenditures = 11.39 million Eurosn Change in Working Capital =6.89 million Euros (normalized)*Estimating FCFF (2000)Current EBIT * (1 - tax rate) = 162.75 (1-.2449) = 122.89 Million Euros- (Capital Spending - Depreciation) 11.39 - Change in Working Capital 6.89Current FCFF 104.61 Million Euros
• Working capital actually dropped in 2000. We normalized the working capitalchange by taking working capital as a percent of revenues(11.47%) in 2000and applying this to the change in revenues in 2000.

Aswath Damodaran 60
Estimating FCFF: Amazon.com
n EBIT (Trailing 1999) = -$ 410 million
n Tax rate used = 0% (Assumed Effective = Marginal)
n Capital spending (Trailing 1999) = $ 243 million
n Depreciation (Trailing 1999) = $ 31 million
n Non-cash Working capital Change (1999) = - 80 million
n Estimating FCFF (1999)Current EBIT * (1 - tax rate) = - 410 (1-0) = - $410 million
- (Capital Spending - Depreciation) = $212 million
- Change in Working Capital = -$ 80 million
Current FCFF = - $542 million

Aswath Damodaran 61
In Practice: Estimate FCFF
n Earnings before interest and taxes =
n Tax rate =
n Capital Expenditures =
n Depreciation =
n Change in non-cash working capital =
n Estimate FCFF
EBIT (1-t)
- (Capital expenditures - Depreciation)
- Change in non-cash working capital
= FCFF

Aswath Damodaran 62
IV. Estimating Growth
n Reinvestment Rate and Return on CapitalgEBIT = (Net Capital Expenditures + Change in WC)/EBIT(1-t) * ROC
= Reinvestment Rate * ROCn For Titan Cement
• ROC = EBIT (1- tax rate) / (BV of Equity + BV of Debt)
= 162.75(1-.2449)/(354.50+136.56) = 25.02%• Reinv. Rate = (Net Cap Ex + Chg in WC)/EBIT (1-t)
= (11.39+6.89)/ 162.75(1-.2449) = 14.88%• Expected Growth Rate = (.2502)*(.1488) = 3.72%
n Proposition: No firm can expect its operating income to grow over timewithout reinvesting some of the operating income in net capital expendituresand/or working capital.
n Proposition: The net capital expenditure needs of a firm, for a given growthrate, should be inversely proportional to the quality of its investments.

Aswath Damodaran 63
Normalizing Net Cap Ex: Titan Cements1996 1997 1998 1999 2000 Total
Cp Ex 46.78 25.09 37.10 136.63 50.52 296.12Depreciation 16.33 13.52 20.08 89.51 39.25 178.70EBIT 62.51 86.37 100.62 122.52 162.75 0.00EBIT(1-t) 47.20 65.22 75.98 92.51 122.89 403.80Net Cap Ex as % of EBIT(1-t)64.51% 17.73% 22.40% 50.93% 9.17% 29.08%

Aswath Damodaran 64
Expected Growth Estimate: Titan Cement
n Normalized Change in working capital = (Working capital as percentof revenues) * Change in revenues in 2000 = .1127 (212177-191710)= 2,447
n Normalized Net Cap Ex
= Net Cap ex as % of EBIT(1-t) * EBIT (1-t) in 2000
= .2908*(162.75(1-.2449)) = 35.73
n Normalized reinvestment rate = (35.73+6.89)/(162.75(1-.2449)) =39.47%
n Expected growth rate = .3947*.2502 = 9.88%

Aswath Damodaran 65
Expected Growth and Amazon.com
n With negative operating income and a negative return on capital, thefundamental growth equation is of little use for Amazon.com
n For Amazon, the effect of reinvestment shows up in revenue growthrates and changes in expected operating margins:
Expected Revenue Growth in $ = Reinvestment (in $ terms) * (Sales/Capital)
n The effect on expected margins is more subtle. Amazon’sreinvestments (especially in acquisitions) may help create barriers toentry and other competitive advantages that will ultimately translateinto high operating margins and high profits.

Aswath Damodaran 66
Growth in Revenues, Earnings andReinvestment: Amazon
Year Revenue Chg in Reinvest Chg Rev/ Chg Reinvest ROC
Growth Revenue1 150.00% $1,676 $559 3.00 -76.62%2 100.00% $2,793 $931 3.00 -8.96%3 75.00% $4,189 $1,396 3.00 20.59%4 50.00% $4,887 $1,629 3.00 25.82%5 30.00% $4,398 $1,466 3.00 21.16%6 25.20% $4,803 $1,601 3.00 22.23%7 20.40% $4,868 $1,623 3.00 22.30%8 15.60% $4,482 $1,494 3.00 21.87%9 10.80% $3,587 $1,196 3.00 21.19%
10 6.00% $2,208 $736 3.00 20.39%Assume that firm can earn high returns because of established economies of scale.

Aswath Damodaran 67
Not all growth is equal: Disney versus HansolPaper
n Disney• Reinvestment Rate = 50%
• Return on Capital =18.69%
• Expected Growth in EBIT =.5(18.69%) = 9.35%
n Hansol Paper• Reinvestment Rate = (105,000+1,000)/(109,569*.7) = 138.20%
• Return on Capital = 6.76%
• Expected Growth in EBIT = 6.76% (1.382) = 9.35%
n Both these firms have the same expected growth rate in operatingincome. Are they equivalent from a valuation standpoint?

Aswath Damodaran 68
In Practice: Estimating Expected Growth
n EBIT (1-t) = See page 61n Reinvestment= (Capital Expenditures - Depreciation + Change in non-cash working
capital)=n Reinvestment Rate =
n Book value of debt from previous year =n Book value of equity from previous year =n Return on capital = EBIT (1-t)/ (BV of Debt + BV of Equity)
n Expected Growth = Reinvestment rate * ROC =

Aswath Damodaran 69
V. Growth Patterns
n A key assumption in all discounted cash flow models is the period ofhigh growth, and the pattern of growth during that period. In general,we can make one of three assumptions:• there is no high growth, in which case the firm is already in stable growth
• there will be high growth for a period, at the end of which the growth ratewill drop to the stable growth rate (2-stage)
• there will be high growth for a period, at the end of which the growth ratewill decline gradually to a stable growth rate(3-stage)
Stable Growth 2-Stage Growth 3-Stage Growth

Aswath Damodaran 70
Determinants of Growth Patterns
n Size of the firm• Success usually makes a firm larger. As firms become larger, it becomes
much more difficult for them to maintain high growth rates
n Current growth rate• While past growth is not always a reliable indicator of future growth,
there is a correlation between current growth and future growth. Thus, afirm growing at 30% currently probably has higher growth and a longerexpected growth period than one growing 10% a year now.
n Barriers to entry and differential advantages• Ultimately, high growth comes from high project returns, which, in turn,
comes from barriers to entry and differential advantages.• The question of how long growth will last and how high it will be can
therefore be framed as a question about what the barriers to entry are, howlong they will stay up and how strong they will remain.

Aswath Damodaran 71
In Practice; Estimating a Growth Period
n Based upon• Firm size, relative to market
• Earnings growth momentum
• Barriers to entry
n How long do you expect growth to continue?
q No high growth
q 5 years of high growth
q 10 years of high growth
n Do you expect a transition to stable growth?
q Yes
q No

Aswath Damodaran 72
Stable Growth Characteristics
n In stable growth, firms should have the characteristics of other stablegrowth firms. In particular,• The risk of the firm, as measured by beta and ratings, should reflect that
of a stable growth firm.– Beta should move towards one
– The cost of debt should reflect the safety of stable firms (BBB or higher)
• The debt ratio of the firm might increase to reflect the larger and morestable earnings of these firms.
– The debt ratio of the firm might moved to the optimal or an industry average
– If the managers of the firm are deeply averse to debt, this may never happen
• The reinvestment rate of the firm should reflect the expected growth rateand the firm’s return on capital
– Reinvestment Rate = Expected Growth Rate / Return on Capital

Aswath Damodaran 73
Titan and Amazon.com: Stable Growth Inputs
High Growth Stable Growthn Titan Cement
• Beta 0.96 1.00• Debt Ratio 21.27% 21.27%• Return on Capital 25.02% 15% (industry average)• Expected Growth Rate 9.88% 5%• Reinvestment Rate 39.47% 5%/15% = 33.33%
n Amazon.com• Beta 1.60 1.00• Debt Ratio 1.20% 15%• Return on Capital Negative 20%• Expected Growth Rate NMF 6%• Reinvestment Rate >100% 6%/20% = 30%

Aswath Damodaran 74
In Practice: Estimating stable growth inputs
High Growth Stable Growth• Beta
• Debt Ratio
• Return on Capital
• Expected Growth Rate
• Reinvestment Rate

Aswath Damodaran 75
Dealing with Cash and Marketable Securities
n The simplest and most direct way of dealing with cash and marketablesecurities is to keep it out of the valuation - the cash flows should bebefore interest income from cash and securities, and the discount rateshould not be contaminated by the inclusion of cash. (Use betas of theoperating assets alone to estimate the cost of equity).
n Once the firm has been valued, add back the value of cash andmarketable securities.• If you have a particularly incompetent management, with a history of
overpaying on acquisitions, markets may discount the value of this cash.

Aswath Damodaran 76
Dealing with Cross Holdings
n When the holding is a majority, active stake, the value that we obtainfrom the cash flows includes the share held by outsiders. While theirholding is measured in the balance sheet as a minority interest, it is atbook value. To get the correct value, we need to subtract out theestimated market value of the minority interests from the firm value.
n When the holding is a minority, passive interest, the problem is adifferent one. The firm shows on its income statement only the shareof dividends it receives on the holding. Using only this income willunderstate the value of the holdings. In fact, we have to value thesubsidiary as a separate entity to get a measure of the market value ofthis holding.
n Proposition 1: It is almost impossible to correctly value firms withminority, passive interests in a large number of private subsidiaries.

Aswath Damodaran 77
In Practice: Mopping up
n Estimate cash and marketable securities possessed by your firm
n Are there any cross holdings that have to be valued? If yes, is theresufficient information to value them?
Aswath Damodaran 78
Forever
Terminal Value= 1881/(.0961-.06)=52,148
Cost of Equity12.90%
Cost of Debt6.5%+1.5%=8.0%Tax rate = 0% -> 35%
WeightsDebt= 1.2% -> 15%
Value of Op Assets $ 14,910+ Cash $ 26= Value of Firm $14,936- Value of Debt $ 349= Value of Equity $14,587- Equity Options $ 2,892Value per share $ 34.32
Riskfree Rate :T. Bond rate = 6.5%
+Beta1.60 -> 1.00 X
Risk Premium4%
Internet/Retail
Operating Leverage
Current D/E: 1.21%
Base EquityPremium
Country RiskPremium
CurrentRevenue$ 1,117
CurrentMargin:-36.71%
Reinvestment:Cap ex includes acquisitionsWorking capital is 3% of revenues
Sales TurnoverRatio: 3.00
CompetitiveAdvantages
Revenue Growth:42%
Expected Margin: -> 10.00%
Stable Growth
StableRevenueGrowth: 6%
StableOperatingMargin: 10.00%
Stable ROC=20%Reinvest 30% of EBIT(1-t)
EBIT-410m
NOL:500 m
$41,346 10.00% 35.00%$2,688 $ 807 $1,881
Term. Year
2 431 5 6 8 9 107
Cost of Equity 12.90% 12.90% 12.90% 12.90% 12.90% 12.42% 12.30% 12.10% 11.70% 10.50%Cost of Debt 8.00% 8.00% 8.00% 8.00% 8.00% 7.80% 7.75% 7.67% 7.50% 7.00%AT cost of debt 8.00% 8.00% 8.00% 6.71% 5.20% 5.07% 5.04% 4.98% 4.88% 4.55%Cost of Capital 12.84% 12.84% 12.84% 12.83% 12.81% 12.13% 11.96% 11.69% 11.15% 9.61%
Revenues $2,793 5,585 9,774 14,661 19,059 23,862 28,729 33,211 36,798 39,006 EBIT -$373 -$94 $407 $1,038 $1,628 $2,212 $2,768 $3,261 $3,646 $3,883EBIT (1-t) -$373 -$94 $407 $871 $1,058 $1,438 $1,799 $2,119 $2,370 $2,524 - Reinvestment $559 $931 $1,396 $1,629 $1,466 $1,601 $1,623 $1,494 $1,196 $736FCFF -$931 -$1,024 -$989 -$758 -$408 -$163 $177 $625 $1,174 $1,788
Amazon.comJanuary 2000Stock Price = $ 84

Aswath Damodaran 79
Forever
Terminal Value= 1064/(.0876-.05)=$ 28,310
Cost of Equity13.81%
Cost of Debt5.1%+4.75%= 9.85%Tax rate = 0% -> 35%
WeightsDebt= 27.38% -> 15%
Value of Op Assets $ 7,967+ Cash & Non-op $ 1,263= Value of Firm $ 9,230- Value of Debt $ 1,890= Value of Equity $ 7,340- Equity Options $ 748Value per share $ 18.74
Riskfree Rate :T. Bond rate = 5.1%
+Beta2.18-> 1.10 X
Risk Premium4%
Internet/Retail
Operating Leverage
Current D/E: 37.5%
Base EquityPremium
Country RiskPremium
CurrentRevenue$ 2,465
CurrentMargin:-34.60%
Reinvestment:Cap ex includes acquisitionsWorking capital is 3% of revenues
Sales TurnoverRatio: 3.02
CompetitiveAdvantages
Revenue Growth:25.41%
Expected Margin: -> 9.32%
Stable Growth
StableRevenueGrowth: 5%
StableOperatingMargin: 9.32%
Stable ROC=16.94%Reinvest 29.5% of EBIT(1-t)
EBIT-853m
NOL:1,289 m
$24,912$2,322$1,509$ 445$1,064
Term. Year
2 431 5 6 8 9 107
Debt Ratio 27.27% 27.27% 27.27% 27.27% 27.27% 24.81% 24.20% 23.18% 21.13% 15.00%Beta 2.18 2.18 2.18 2.18 2.18 1.96 1.75 1.53 1.32 1.10 Cost of Equity 13.81% 13.81% 13.81% 13.81% 13.81% 12.95% 12.09% 11.22% 10.36% 9.50%AT cost of debt 10.00% 10.00% 10.00% 10.00% 9.06% 6.11% 6.01% 5.85% 5.53% 4.55%Cost of Capital 12.77% 12.77% 12.77% 12.77% 12.52% 11.25% 10.62% 9.98% 9.34% 8.76%
Amazon.comJanuary 2001Stock price = $14
Revenues $4,314 $6,471 $9,059 $11,777 $14,132 $16,534 $18,849 $20,922 $22,596 $23,726 $24,912EBIT -$703 -$364 $54 $499 $898 $1,255 $1,566 $1,827 $2,028 $2,164 $2,322EBIT(1-t) -$703 -$364 $54 $499 $898 $1,133 $1,018 $1,187 $1,318 $1,406 $1,509 - Reinvestment $612 $714 $857 $900 $780 $796 $766 $687 $554 $374 $445FCFF -$1,315 -$1,078 -$803 -$401 $118 $337 $252 $501 $764 $1,032 $1,064

Aswath Damodaran 80
Variations on DCF Valuation
n A DCF valuation can be presented in two other formats:• In an adjusted present value (APV) valuation, the value of a firm can be
broken up into its operating and leverage components separatelyFirm Value = Value of Unlevered Firm + (PV of Tax Benefits - Exp.
Bankruptcy Cost)• In an excess return model, the value of a firm can be written in terms of
the existing capital invested in the firm and the present value of the excessreturns that the firm will make on both existing assets and all newinvestments
Firm Value = Capital Invested in Assets in Place + PV of Dollar ExcessReturns on Assets in Place + PV of Dollar Excess Returns on All FutureInvestments
n Done right, slicing a DCF valuation and presenting it differentlyshould not change the value of the firm.
Aswath Damodaran 81
Value Enhancement: Back to Basics
Aswath Damodaran
http://www.stern.nyu.edu/~adamodar

Aswath Damodaran 82
Price Enhancement versus ValueEnhancement

Aswath Damodaran 83
The Paths to Value Creation
n Using the DCF framework, there are four basic ways in which the value of afirm can be enhanced:
• The cash flows from existing assets to the firm can be increased, by either– increasing after-tax earnings from assets in place or
– reducing reinvestment needs (net capital expenditures or working capital)
• The expected growth rate in these cash flows can be increased by either– Increasing the rate of reinvestment in the firm
– Improving the return on capital on those reinvestments
• The length of the high growth period can be extended to allow for more years ofhigh growth.
• The cost of capital can be reduced by– Reducing the operating risk in investments/assets
– Changing the financial mix
– Changing the financing composition

Aswath Damodaran 84
A Basic Proposition
n For an action to affect the value of the firm, it has to• Affect current cash flows (or)
• Affect future growth (or)
• Affect the length of the high growth period (or)
• Affect the discount rate (cost of capital)
n Proposition 1: Actions that do not affect current cash flows, futuregrowth, the length of the high growth period or the discount ratecannot affect value.

Aswath Damodaran 85
Value-Neutral Actions
n Stock splits and stock dividends change the number of units of equity in afirm, but cannot affect firm value since they do not affect cash flows, growthor risk.
n Accounting decisions that affect reported earnings but not cash flows shouldhave no effect on value.
• Changing inventory valuation methods from FIFO to LIFO or vice versa infinancial reports but not for tax purposes
• Changing the depreciation method used in financial reports (but not the tax books)from accelerated to straight line depreciation
• Major non-cash restructuring charges that reduce reported earnings but are not taxdeductible
• Using pooling instead of purchase in acquisitions cannot change the value of atarget firm.
n Decisions that create new securities on the existing assets of the firm (withoutaltering the financial mix) such as tracking stock cannot create value, thoughthey might affect perceptions and hence the price.

Aswath Damodaran 86
Value Creation 1: Increase Cash Flows fromAssets in Place
n The assets in place for a firm reflect investments that have been madehistorically by the firm. To the extent that these investments werepoorly made and/or poorly managed, it is possible that value can beincreased by increasing the after-tax cash flows generated by theseassets.
n The cash flows discounted in valuation are after taxes andreinvestment needs have been met:EBIT ( 1-t)- (Capital Expenditures - Depreciation)- Change in Non-cash Working Capital= Free Cash Flow to Firm
n Proposition 2: A firm that can increase its current cash flows, withoutsignificantly impacting future growth or risk, will increase its value.

Aswath Damodaran 87
Ways of Increasing Cash Flows from Assets inPlace
Revenues
* Operating Margin
= EBIT
- Tax Rate * EBIT
= EBIT (1-t)
+ Depreciation- Capital Expenditures- Chg in Working Capital= FCFF
Divest assets thathave negative EBIT
More efficient operations and cost cuttting: Higher Margins
Reduce tax rate- moving income to lower tax locales- transfer pricing- risk management
Live off past over- investment
Better inventory management and tighter credit policies

Aswath Damodaran 88
Value Creation 2: Increase Expected Growth
n Keeping all else constant, increasing the expected growth in earningswill increase the value of a firm.
n The expected growth in earnings of any firm is a function of twovariables:• The amount that the firm reinvests in assets and projects
• The quality of these investments

Aswath Damodaran 89
Value Enhancement through Growth
Reinvestment Rate
* Return on Capital
= Expected Growth Rate
Reinvest more inprojects
Do acquisitions
Increase operatingmargins
Increase capital turnover ratio

Aswath Damodaran 90
Value Creation 3: Increase Length of HighGrowth Period
n Every firm, at some point in the future, will become a stable growthfirm, growing at a rate equal to or less than the economy in which itoperates.
n The high growth period refers to the period over which a firm is ableto sustain a growth rate greater than this “stable” growth rate.
n If a firm is able to increase the length of its high growth period, otherthings remaining equal, it will increase value.
n The length of the high growth period is a direct function of thecompetitive advantages that a firm brings into the process. Creatingnew competitive advantage or augmenting existing ones can createvalue.

Aswath Damodaran 91
3.1: The Brand Name Advantage
n Some firms are able to sustain above-normal returns and growthbecause they have well-recognized brand names that allow them tocharge higher prices than their competitors and/or sell more than theircompetitors.
n Firms that are able to improve their brand name value over time canincrease both their growth rate and the period over which they canexpect to grow at rates above the stable growth rate, thus increasingvalue.

Aswath Damodaran 92
Illustration: Valuing a brand name: Coca Cola
Coca Cola Generic Cola CompanyAT Operating Margin 18.56% 7.50%Sales/BV of Capital 1.67 1.67ROC 31.02% 12.53%Reinvestment Rate 65.00% (19.35%) 65.00% (47.90%)Expected Growth 20.16% 8.15%Length 10 years 10 yeaCost of Equity 12.33% 12.33%E/(D+E) 97.65% 97.65%AT Cost of Debt 4.16% 4.16%D/(D+E) 2.35% 2.35%Cost of Capital 12.13% 12.13%Value $115 $13

Aswath Damodaran 93
3.2: Patents and Legal Protection
n The most complete protection that a firm can have from competitivepressure is to own a patent, copyright or some other kind of legalprotection allowing it to be the sole producer for an extended period.
n Note that patents only provide partial protection, since they cannotprotect a firm against a competitive product that meets the same needbut is not covered by the patent protection.
n Licenses and government-sanctioned monopolies also provideprotection against competition. They may, however, come withrestrictions on excess returns; utilities in the United States, forinstance, are monopolies but are regulated when it comes to priceincreases and returns.

Aswath Damodaran 94
3.3: Switching Costs
n Another potential barrier to entry is the cost associated with switchingfrom one firm’s products to another.
n The greater the switching costs, the more difficult it is for competitorsto come in and compete away excess returns.
n Firms that devise ways to increase the cost of switching from theirproducts to competitors’ products, while reducing the costs ofswitching from competitor products to their own will be able toincrease their expected length of growth.

Aswath Damodaran 95
3.4: Cost Advantages
n There are a number of ways in which firms can establish a cost advantage overtheir competitors, and use this cost advantage as a barrier to entry:
• In businesses, where scale can be used to reduce costs, economies of scale can givebigger firms advantages over smaller firms
• Owning or having exclusive rights to a distribution system can provide firms with acost advantage over its competitors.
• Owning or having the rights to extract a natural resource which is in restrictedsupply (The undeveloped reserves of an oil or mining company, for instance)
n These cost advantages will show up in valuation in one of two ways:• The firm may charge the same price as its competitors, but have a much higher
operating margin.
• The firm may charge lower prices than its competitors and have a much highercapital turnover ratio.

Aswath Damodaran 96
Gauging Barriers to Entry
n Which of the following barriers to entry are most likely to work forTitan?
p Brand Namep Patents and Legal Protectionp Switching Costsp Cost Advantagesn What about for Amazon.com?p Brand Namep Patents and Legal Protectionp Switching Costsp Cost Advantages

Aswath Damodaran 97
Value Creation 4: Reduce Cost of Capital
n The cost of capital for a firm can be written as:Cost of Capital = ke (E/(D+E)) + kd (D/(D+E))
Where, ke = Cost of Equity for the firm kd = Borrowing rate (1 - tax rate)
n The cost of equity reflects the rate of return that equity investors in the firmwould demand to compensate for risk, while the borrowing rate reflects thecurrent long-term rate at which the firm can borrow, given current interestrates and its own default risk.
n The cash flows generated over time are discounted back to the present at thecost of capital. Holding the cash flows constant, reducing the cost of capitalwill increase the value of the firm.

Aswath Damodaran 98
Estimating Cost of Capital: Amazon.com
n Equity• Cost of Equity = 6.50% + 1.60 (4.00%) = 12.90%
• Market Value of Equity = $ 84/share* 340.79 mil shs = $ 28,626 mil(98.8%)
n Debt• Cost of debt = 6.50% + 1.50% (default spread) = 8.00%
• Market Value of Debt = $ 349 mil (1.2%)
n Cost of Capital
Cost of Capital = 12.9 % (.988) + 8.00% (1- 0) (.012)) = 12.84%

Aswath Damodaran 99
Estimating Cost of Capital: Titan Cements
n Equity• Cost of Equity = 5.10% + 0.96 (4%+1.59%) = 10.47%
• Market Value of Equity = 739,217 million GDr (78.7%)
n Debt• Cost of debt = 5.10% + 0.75% +0.95%= 6.80%
• Market Value of Debt = 199,766 million GDr (21.3 %)
n Cost of Capital
Cost of Capital = 10.47 % (.787) + 6.80% (1- .2449) (0.213)) = 9.33 %

Aswath Damodaran 100
Reducing Cost of Capital
Cost of Equity (E/(D+E) + Pre-tax Cost of Debt (D./(D+E)) = Cost of Capital
Change financing mix
Make product or service less discretionary to customers
Reduce operating leverage
Match debt to assets, reducing default risk
Changing product characteristics
More effective advertising
Outsourcing Flexible wage contracts &cost structure
Swaps Derivatives Hybrids

Aswath Damodaran 101
Amazon.com: Optimal Debt Ratio
Debt Ratio Beta Cost of Equity Bond Rating Interest rate on debt Tax Rate Cost of Debt (after-tax) WACC Firm Value (G)0% 1.58 12.82% AAA 6.80% 0.00% 6.80% 12.82% $29,192
10% 1.76 13.53% D 18.50% 0.00% 18.50% 14.02% $24,56620% 1.98 14.40% D 18.50% 0.00% 18.50% 15.22% $21,14330% 2.26 15.53% D 18.50% 0.00% 18.50% 16.42% $18,50940% 2.63 17.04% D 18.50% 0.00% 18.50% 17.62% $16,41950% 3.16 19.15% D 18.50% 0.00% 18.50% 18.82% $14,71960% 3.95 22.31% D 18.50% 0.00% 18.50% 20.02% $13,31170% 5.27 27.58% D 18.50% 0.00% 18.50% 21.22% $12,12580% 7.90 38.11% D 18.50% 0.00% 18.50% 22.42% $11,11290% 15.81 69.73% D 18.50% 0.00% 18.50% 23.62% $10,237

Aswath Damodaran 102
Titan : Optimal Capital Structure
Debt Ratio Beta Cost of Equity Bond Rating Interest rate on debt Tax Rate Cost of Debt (after-tax) WACC Firm Value (G)0% 0.81 9.61% AAA 5.85% 30.00% 4.10% 9.61% $855,714
10% 0.87 9.96% AAA 5.85% 30.00% 4.10% 9.38% $908,54320% 0.95 10.40% A- 7.10% 30.00% 4.97% 9.32% $923,19430% 1.05 10.97% B 11.60% 30.00% 8.12% 10.11% $760,99740% 1.19 11.74% CCC 15.10% 29.34% 10.67% 11.31% $598,41950% 1.44 13.16% CC 16.60% 21.35% 13.06% 13.11% $448,49160% 1.82 15.26% C 17.80% 16.59% 14.85% 15.01% $350,49470% 2.42 18.64% C 17.80% 14.22% 15.27% 16.28% $304,03080% 3.63 25.42% C 17.80% 12.44% 15.58% 17.55% $267,22690% 7.27 45.73% C 17.80% 11.06% 15.83% 18.82% $237,352

Aswath Damodaran 103
Current Cashflow to FirmEBIT(1-t) : 123- Nt CpX 11- Chg WC 7= FCFF 105Reinvestment Rate =14.88%
Expected Growth in EBIT (1-t).2502*.50-=.12512.5 %
Stable Growthg = 5%; Beta = 0.96;Country Premium= 0% ROC=15%Reinvestment Rate=33%
Terminal Value 5= 137/(.0791-.05) = 4,710
Cost of Equity10.47%
Cost of Debt(5.1%+.75+.95%)(1-.2449)= 5.13%
WeightsE = 78.7% D = 21.3%
Discount at Cost of Capital (WACC) = 10.47% (.787) + 5.13% (0.213) = 9.33%
Firm Value: 3,451+ Cash: 65- Debt 586=Equity 2,930-Options 0Value/Share 70.02
Riskfree Rate :Real riskfree rate = 5.1% +
Beta 0.96 X
Risk Premium5.59%
Unlevered Beta for Sectors: 0.80
Firm’s D/ERatio: 27%
Mature riskpremium4%
Country RiskPremium1.59%
Titan Cements: Restructured Reinvestment Rate50%
Return on Capital25.02%
Term Yr206 69137
Avg Reinvestment rate = 39.47%
1 2 3 4 5EBIT(1-t) 138 156 173 187 196 - Reinvestment 69 78 81 75 65 FCFF 69 78 92 112 131

Aswath Damodaran 104
Amazon.com: Break Even Points
6% 8% 10% 12% 14%30% (1.94)$ 2.95$ 7.84$ 12.71$ 17.57$ 35% 1.41$ 8.37$ 15.33$ 22.27$ 29.21$ 40% 6.10$ 15.93$ 25.74$ 35.54$ 45.34$ 45% 12.59$ 26.34$ 40.05$ 53.77$ 67.48$ 50% 21.47$ 40.50$ 59.52$ 78.53$ 97.54$ 55% 33.47$ 59.60$ 85.72$ 111.84$ 137.95$ 60% 49.53$ 85.10$ 120.66$ 156.22$ 191.77$