valuation of electric utility generating assets in a
TRANSCRIPT

Graduate Theses, Dissertations, and Problem Reports
2001
Valuation of electric utility generating assets in a competitive Valuation of electric utility generating assets in a competitive
environment environment
Mary Barbara Cain West Virginia University
Follow this and additional works at: https://researchrepository.wvu.edu/etd
Recommended Citation Recommended Citation Cain, Mary Barbara, "Valuation of electric utility generating assets in a competitive environment" (2001). Graduate Theses, Dissertations, and Problem Reports. 1278. https://researchrepository.wvu.edu/etd/1278
This Thesis is protected by copyright and/or related rights. It has been brought to you by the The Research Repository @ WVU with permission from the rights-holder(s). You are free to use this Thesis in any way that is permitted by the copyright and related rights legislation that applies to your use. For other uses you must obtain permission from the rights-holder(s) directly, unless additional rights are indicated by a Creative Commons license in the record and/ or on the work itself. This Thesis has been accepted for inclusion in WVU Graduate Theses, Dissertations, and Problem Reports collection by an authorized administrator of The Research Repository @ WVU. For more information, please contact [email protected].

Valuation of Electric Utility Generating Assets in a Competitive Environment
by
Mary B. Cain
Thesis
Submitted to the College of Agriculture, Forestry and Consumer Sciences
At West Virginia University
In partial fulfillment of the requirements for the degree of
Master of Science in
Agricultural and Resource Economics
Thomas F. Torries, Ph.D., Co-Chair Jerald J. Fletcher, Ph.D., Co-Chair
Gerard E. D’Souza, Ph.D. Alan R. Collins, Ph.D.
Department of Agricultural and Resource Economics
Morgantown, WV
2001
Keywords: Electricity deregulation, property taxation, asset valuation methods
Electricity industry restructuring, technological advances, and changing environmental laws and regulations are providing opportunities for many electricity companies to substantially lower their cost of doing business. One such cost is property tax, which in a majority of states is based upon the fair market value of property. Traditionally, assets of a regulated utility were valued at fair market value based upon the regulated price of electricity or “rate base”. The use of rate bases as benchmarks for valuation of assets is quickly becoming irrelevant. Valuation methods such as the income approach, replacement cost approach, comparable sales approach, and the stock & debt approach are common assessment methods for property tax (ad valorem) purposes. In this research, data are provided by the West Virginia state tax office, public testimony, and the Energy Information Administration. The appropriateness of each valuation method is examined for the purpose of valuing electricity generation assets in a competitive environment. The ability of companies to compete across state lines will depend on their costs. Different states employ different methods of valuation. Some states do not tax intangible property and most valuation methods include intangible property value. This aspect is addressed in the different valuation methods. The income approach to valuation is probably the best approach from the standpoint of the utility because it reflects the company’s ability to compete. For the purpose of purchasing a power plant, the comparable sales approach is best while the replacement cost provides the best-cost estimate for new technology. The comparable sales approach would provide the largest amount of tax revenue. The stock and debt approach would be more reliable if not for the lack of consistent and viable market trading.

iii
Acknowledgements
The completion of this thesis would not have been possible without the assistance and
encouragement of many people. First, I would like to thank my family and friends who have
given me the necessary support throughout my graduate studies. I would especially like to thank
my husband, Gregory, who has been ever patient with me and provided unwavering support
without question or doubt as to my abilities.
I would especially like to thank my committee chair, Dr. Tom Torries, for his guidance,
support and insight into the economic aspects of the energy industry. Without his industry and
academic experience I would not have been able to appropriately explore such a complicated
issue. This was especially important due to the lack of professional literature concerning
deregulation, valuation, and taxation. In addition, I would also like to thank my other committee
members, Dr. Gerard D’Souza, Dr. Alan Collins, and Dr. Jerald Fletcher for their patience,
support and guidance.
I would also like to thank all the rest of the Resource Management faculty and staff for
their support, concern and above all their good nature toward the student population. And to Dr.
Jerry Fletcher who has provided me continued financial support while completing my thesis
work. And to all the students that I have shared my time with, Sarah, Kathleen, Dan, Elyce,
Huilan Li and many others who have passed through this department. Without the support of
these people I have mentioned the successful completion of this thesis would not have been
possible.

iv
Table of Contents
CHAPTER 1 INTRODUCTION .................................................................................................... 1
1.0 PROBLEM STATEMENT.................................................................................................... 1 1.1 RESEARCH OBJECTIVES .................................................................................................. 2 1.2 THESIS OVERVIEW............................................................................................................ 4
CHAPTER 2 BACKGROUND ...................................................................................................... 6
2.0 DEREGULATION ................................................................................................................ 6 2.1 PROPERTY VALUATION................................................................................................... 7 2.2 VALUATION IN A COMPETITIVE ENVIRONMENT..................................................... 9 2.3 TYPES OF ELECTRICITY PROVIDERS AND RELATED TAX ISSUES..................... 10
CHAPTER 3 LITERATURE REVIEW ....................................................................................... 13
3.0 PROPERTY TAX REFORM .............................................................................................. 13 3.1 VALUATION METHODS FOR DEREGULATED ELECTRICITY GENERATORS .... 14 3.2 VALUATION ISSUES........................................................................................................ 17 3.3 STATE TAXATION ISSUES ............................................................................................. 24 3.4 CONSUMPTION TAX ....................................................................................................... 34 3.5 RISK .................................................................................................................................... 35
CHAPTER 4 THEORY ................................................................................................................ 37
4.0 AD VALOREM TAXATION ............................................................................................. 37 4.1 LOCATION THEORY........................................................................................................ 39 4.2 MARKET POWER.............................................................................................................. 40 4.3 INTANGIBLE ASSETS...................................................................................................... 44 4.4 ECONOMIC RENTS .......................................................................................................... 51 4.5 RISK .................................................................................................................................... 53 4.6 CAPITALIZATION RATE................................................................................................. 54
CHAPTER 5 ASSET VALUATION METHODS ....................................................................... 55
5.0 BASICS OF ASSET VALATION ...................................................................................... 55 5.1 VARIABLES AFFECTING THE VALUE OF A UTILITY.............................................. 55 5.2 VALUATION METHODS.................................................................................................. 61
5.2.1 COST APPROACH........................................................................................................ 61 5.2.2 INCOME APPROACH .................................................................................................. 64 5.2.3 COMPARABLE SALES APPROACH............................................................................ 71 5.2.4 STOCK AND DEBT APPROACH ................................................................................. 74
CHAPTER 6 POWER PLANT VALUATION ............................................................................ 78
6.0 INTRODUCTION ............................................................................................................... 78 6.1 VALUATION OF APPALACHIAN POWER PLANTS IN WEST VIRGINIA ............... 78
6.1.1 COST APPROACH........................................................................................................ 78 6.1.2 INCOME APPROACH .................................................................................................. 79 6.1.3 STOCK AND DEBT APPROACH ................................................................................. 81
6.2 CURRENT APPALACHIAN POWER VALUES.............................................................. 82

v
6.3 COMPARABLE SALES AND REPLACEMENT COST APPROACHES....................... 83 6.3.1 COMPARABLE SALES ................................................................................................. 83 6.3.2 REPLACEMENT COST APPROACH........................................................................... 84
6.4 SUMMATION OF VALUES.............................................................................................. 85
CHAPTER 7 SUMMARY & CONCLUSIONS........................................................................... 87
7.0 SUMMARY......................................................................................................................... 87 7.2 FURTHER RESEARCH REQUIRED ................................................................................ 92
REFERENCES CITED................................................................................................................. 93

vi
List of Tables
TABLE 3.1. TAX REVENUE LOSS FROM OHIO UTILITIES 32
TABLE 3.2. OHIO UTILITY TAX BURDEN 33
TABLE 4.1. INTANGIBLE ASSETS 49
TABLE 5.1. CAPITALIZATION RATE 60
TABLE 6.1. COST APPROACH FOR AP ASSETS 79
TABLE 6.2. INCOME APPROACH FOR AP ASSETS 80
TABLE 6.3. CAPITALIZATION RATE AND WORKING CAPITAL 81
TABLE 6.4. STOCK & DEBT APPROACH FOR AP ASSETS 82
TABLE 6.5. COMPARABLE SALES APPROACH FOR AP ASSETS 84
TABLE 6.6. REPLACEMENT COST APPROACH FOR AP ASSETS 85
TABLE 6.7. COMPARATIVE VALUES FOR AP ASSETS 86

vii
List of Abbreviations
AEP American Electric Power
AP Appalachian Power
CAPM Capital asset pricing model
CCGT Combined-cycle gas turbine
DCF Discounted cash flow
DFB Discounted future benefits
DOE Department of Energy
EEI Edison Electric Institute
EIA Energy Information Administration
FERC Federal Energy Regulatory Commission
FMV Fair market value
GCV Going concern value
IOU Investor owned utility
MV Market value
NPV Net present value
PUC Public Utility Commission
PUHCA Public Utility Holding Company Act
PURPA Public Utilities Regulatory Policy Act
PSNH Public Service New Hampshire
ROI Return on investment
RCNLD Replacement cost new less depreciation
TVA Tennessee Valley Authority
WACC Weighted average cost of capital

1
Chapter 1
Introduction
1.0 PROBLEM STATEMENT
Restructuring, technology, and environmental factors have created reasons and
opportunities for electric utilities to lower their property taxes, which often make up a
substantial cost of doing business. Property tax valuation is not a straightforward activity. Most
states compute property taxes on the basis of “fair market value” (FMV) or what a hypothetical
buyer and seller would agree the property is worth with both parties having knowledge of the
relevant facts and neither compelled to buy or sell (Hayward and Schmidt, 1999). The property
tax burden for electric utilities is significant but they have been allowed to recover these taxes in
their rate base. Historically, the cost approach valuation method was used to establish property
values for electric utilities. Thus, a regulated utility became guaranteed tax collectors for state
and local governments. Local governments and school districts benefited from these property
taxes. With deregulation, this traditional approach to property valuation will have to change and
new methods of valuation applied. This could mean a significant reduction in property tax
revenue for school districts. In Pennsylvania several court cases involving school districts and
property assessment boards have occurred where school boards have appealed for utilities’ assets
to be valued based on a comparable sales approach. This approach would guarantee a continued
high level of tax revenue as utilities move from a regulated to a deregulated environment. The
problem with the cost approach is that in today’s transitional market power plant sale prices tend
to be overvalued. This is due to the anticipation by investors of capturing more of the power
market share and anticipated earnings.

2
In March 1998 the legislature enacted HB 4277, which authorizes the Public Service
Commission (PSC) to develop a deregulation plan if the PSC finds that retail choice is in the
public interest. Included in the public interest principles are preserving tax revenues for state and
local government, no shifting of the tax burden and a tax system that does not place any
competitor at a disadvantage (American Public Power Association, 2000). Then, in March
2000, the West Virginia Legislature passed HCR 27, which approves the PSC restructuring plan
for deregulation. However, the resolution does not allow the plan to take effect until tax changes
are made. The PSC will propose tax legislation, which the legislature is to consider in its 2001
season.
This thesis addresses different valuation methods since the rate base of a regulated utility
will become irrelevant in a competitive market and the cost approach to valuation will no longer
apply. The demise of rate regulation will cause some states using unit valuations to shift to
valuations of individual plants. In order to determine fair market value (FMV), many valuation
issues will have to be resolved by the courts to include the influence of above-market power
purchase contracts on plant value, recovery of stranded costs, and the continued legitimacy of the
unit approach to value. Currently, West Virginia (WV) utilizes the unit value method and the
income approach. New approaches to valuation could mean significant loss of tax revenues for
WV school districts. WV is currently studying the tax revenue issue as it applies to proposed
electricity restructuring plans.
1.1 RESEARCH OBJECTIVES
Economic theory, asset valuation methods, and competitive market conditions are
addressed in this thesis relative to electricity generation in a competitive environment. Current

3
asset valuation methods examined in this thesis are concerned with property appraisal for ad
valorem tax1 purposes. These four methods include replacement cost, income approach,
comparable sales approach, and the stock & debt approach. The cost approach applied to a
regulated utility is used as a comparison. One of the key discriminators in valuing electricity
generation plants is the fact that some states consider intangible property non-taxable. This is
important in choosing the proper valuation method. Currently, with restructuring taking place in
many states, school districts stand to lose tax revenues. Regulated electricity generators were
essentially tax collectors for the state as this cost was incorporated into their rate base and added
to the cost of electricity.
A competitive environment will exist across state boundaries as electricity producers
attempt to increase their customer base. An important aspect of competitiveness is costs. An
instate power plant may not be able to compete with out of state providers if out of state
providers have lower costs. Costs can be affected by property assessments. Many states are
addressing the tax revenue issue to achieve tax neutrality. This may require legislatively
amending their property valuation methods. Successful competition can only be achieved if
there is a “level playing field”. A “level playing field” refers to tax treatment in bordering states
that is equivalent in its property tax methods and assessments to surrounding states. States that
tax intangible property will tend to have higher valuations for their power plants if they use such
methods as comparable cost since this method is based on current market sales and also includes
intangible value. The comparable sales method is the valuation method advocated by school
districts, as it will result in higher revenues.
Valuation of electric utilities and their assets is important to many audiences. Utility
stockholders may be concerned about the sale of utility assets at prices below the utility’s
1 Ad Valorem refers to that portion of value that is used for property tax purposes as a percentage of that value.

4
balance sheet (book value). This is often known as “stranded assets”. A stranded asset is the
difference between a utility’s value as recorded in the books versus its market value. Decisions
about who absorbs or pays for these possible losses are of great concern. State legislators are
also concerned about the effect of deregulation on utility prices to customers. They are
simultaneously concerned with loss of tax revenue and the ability of the electricity generator to
compete.
The debate concerning restructuring is underway in many states. This thesis presents a
case study designed to identify those valuation issues that are related to the different methods of
valuation.
1.2 THESIS OVERVIEW
This thesis is presented in seven chapters beginning with this introduction. The thesis
presents a case study of West Virginia (WV) Appalachian Power (AP) assets to emphasis the
different approaches to valuation and use the AP case for comparison. A brief description of the
remaining chapters follows.
Chapter 2 consists of background information on utility deregulation and the problems
associated with valuation and property taxation. The valuation methods used during regulation
and the need to review current and alternative methods of valuation and taxation are discussed.
A literature review is contained in Chapter 3. An extensive review of the professional
literature revealed that information in this area is lacking. Most information was obtained from
special studies and reports from government agencies. Professional journals in accountancy and
taxation were consulted. A review of state taxation issues that arise from tax revenue loss is also
included.

5
Chapter 4 addresses economic and valuation theory to support the basic principles
underlying valuation methods and competitive market forces. Current methods of valuation
apply to regulated electric utilities while the alternative valuation approaches addressed in this
thesis concern a deregulated industry.
A discussion of the four valuation methods is contained in Chapter 5. Chapter 6 presents
an application of these four methods to AP plants that operate in West Virginia. Chapter 7 is
summary and conclusions of the appropriateness of the different valuation methods and the
problems associated with them. Further research is advised.

6
Chapter 2
Background
2.0 DEREGULATION
The Federal Energy Regulatory Commission (FERC) issued Order #888 and #889 in
August of 1996 calling for wholesale competition in the electricity generation sector. In some
states, retail electricity customers can now choose their electricity company. New wholesale
electricity trading markets, which were previously nonexistent, are now operating in many
regions of the country. The number of independent power producers and power marketers
competing in these new retail and wholesale power markets has increased substantially over the
past few years. To better support a competitive industry, the power transmission system is being
reorganized from a system with many transmission system operators to one where only a few
organizations operate the system. (EIA, 2000)
The introduction of competition has not been without its problems. California introduced
retail competition in 1998 and is experiencing power shortages along with increased fuel prices.
Although other states like New Hampshire and Pennsylvania have not been experiencing the
problems of California’s market, the lessons learned in California should not be overlooked.
California’s problems involve supply and demand issues, continued regulation of customer
prices, and rising fuel costs. As of spring 2001, the state of WV has adopted an electricity
restructuring plan but is holding off until further research is conducted. One of the areas for
research is the tax revenue issue. (State electricity profiles, 2000)
During the era of regulation, electric utility companies became vertically integrated and
were granted predefined and exclusive territories for providing electricity at a regulated rate of

7
return on invested capital. Vertically integrated means that the same entity owns and operates all
three basic functions of generating, transmitting, and distributing electricity to customers. The
restructuring of the utility industry consists of deregulating the generation activities of electricity
supply. Major issues surrounding the deregulation of electricity generation involve open access,
competitive dispatch, retail wheeling, divestitures, mergers and acquisition, privatization,
universal service, municipalization, and stranded assets.
2.1 PROPERTY VALUATION
While the concept is straightforward, determining fair market value can be difficult.
Several valuation methods are used to estimate fair market value. They consist of the income
approach, replacement cost, stock and debt approach, and the sales comparison approach.
Changes anticipated in the electric industry as a result of restructuring will redefine the
traditional connection between property valuation and the utility base rate, the traditional method
by which utilities and local governments have calculated property taxes in the past. Deregulation
will affect earnings, which will impact rate base and the method of asset valuation. Advances in
natural gas turbine technology will force a re-evaluation of the cost, efficiency, and capability of
existing plants. According to the Energy Information Administration (EIA, 2000), gas turbine
technology has traditionally been utilized to meet excess capacity demands. The recent trend in
new power plant construction has been the utilization of gas turbines for primary power
production. The prospect of new environmental legislation and regulation, coupled with
deregulation, means the end of the captive market (ratepayers) through which compliance and
abatement costs were recovered. While these changes will affect future adjustments in tax

8
assessments, they will also affect investor expectations and the value of generation facilities.
(Schneider, 1998).
Assets are valued differently in regulated and competitive environments. In a pure
regulated environment, an asset’s market value will equal its book value. Regulated prices are
set to recover costs, pay debt, and provide a reasonable return to shareholders. In principle, the
future revenues from an asset should equal the investment made in the asset plus the
shareholder’s return on investment (ROI). Regulators in most jurisdictions use original cost
methods to determine the value of a utility’s assets (Bonbright, Danielson, and Kamerschen,
1988). Public utilities may recover only the asset’s original cost through rates. Book value is
simply an asset’s original cost minus depreciation.
In a competitive environment, the value of an asset equals the expected present value of
the profits an asset can generate under its best use. (Copeland and Murin, 1990). Asset value is
directly related to the market price that can be obtained for the goods or services that the asset
produces. Value is not fixed but changes over time in response to market conditions. In
competitive markets, the prices of services that flow from an asset are determined by numerous
exchanges between willing buyers and willing sellers. Economic theory tells us that in perfectly
competitive markets, efficient resource allocation criteria are met when the price of a good or
service equals its marginal production cost. Yet these marginal-cost-based prices may have no
relationship to the historical average costs of individual firms. At a given equilibrium price,
some firms may enjoy temporary profits, where price exceeds their average costs, while others
may face temporary losses. (Baxter and Hirst, 1995).
9
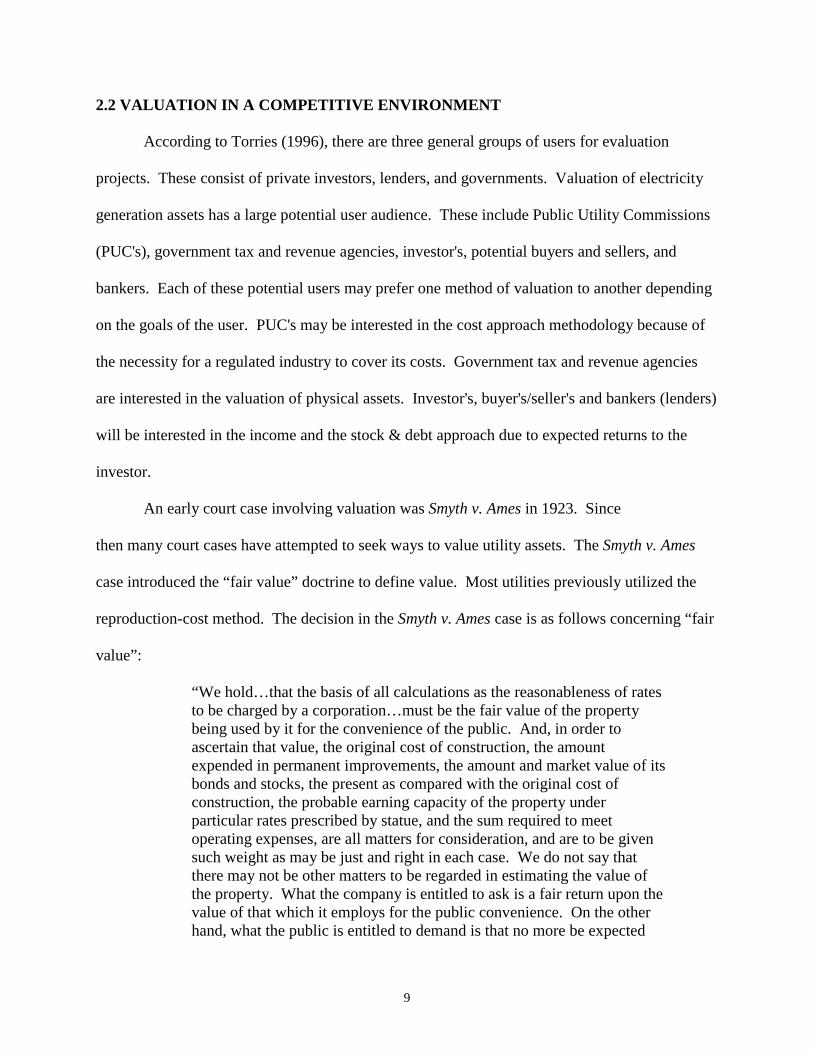
2.2 VALUATION IN A COMPETITIVE ENVIRONMENT
According to Torries (1996), there are three general groups of users for evaluation
projects. These consist of private investors, lenders, and governments. Valuation of electricity
generation assets has a large potential user audience. These include Public Utility Commissions
(PUC's), government tax and revenue agencies, investor's, potential buyers and sellers, and
bankers. Each of these potential users may prefer one method of valuation to another depending
on the goals of the user. PUC's may be interested in the cost approach methodology because of
the necessity for a regulated industry to cover its costs. Government tax and revenue agencies
are interested in the valuation of physical assets. Investor's, buyer's/seller's and bankers (lenders)
will be interested in the income and the stock & debt approach due to expected returns to the
investor.
An early court case involving valuation was Smyth v. Ames in 1923. Since
then many court cases have attempted to seek ways to value utility assets. The Smyth v. Ames
case introduced the “fair value” doctrine to define value. Most utilities previously utilized the
reproduction-cost method. The decision in the Smyth v. Ames case is as follows concerning “fair
value”:
“We hold…that the basis of all calculations as the reasonableness of rates to be charged by a corporation…must be the fair value of the property being used by it for the convenience of the public. And, in order to ascertain that value, the original cost of construction, the amount expended in permanent improvements, the amount and market value of its bonds and stocks, the present as compared with the original cost of construction, the probable earning capacity of the property under particular rates prescribed by statue, and the sum required to meet operating expenses, are all matters for consideration, and are to be given such weight as may be just and right in each case. We do not say that there may not be other matters to be regarded in estimating the value of the property. What the company is entitled to ask is a fair return upon the value of that which it employs for the public convenience. On the other hand, what the public is entitled to demand is that no more be expected

10
from it…than the services rendered…are reasonably worth. (Hayward and Schmidt, 1999, pg 16).”
2.3 TYPES OF ELECTRICITY PROVIDERS AND RELATED TAX ISSUES
According to Anderson (1999), electricity is provided by four types of organizations. Each
of these organizations has been taxed differently in a regulatory environment. Investor owned
utilities (IOU) serve approximately 77 percent of U.S. customers and are taxed as corporations.
Publicly owned utilities provide electricity for 14 percent of U.S. customers. Publicly owned
utilities are primarily municipal utilities which are part of state and local governments and are
not subject to local or state taxes. Rural electric cooperatives are owned by the customer and
provide electricity to 8 percent of U.S. customers. They do not pay federal and state income
taxes but do pay other types of taxes. The federal government also operates 10 federal electric
utilities including the Tennessee Valley Authority (TVA) and the Bonneville Power
Administration. Federally owned utilities are exempt from federal, state, and local taxes. In a
deregulated environment, IOU’s will have to compete with these other types of utilities which
typically pay little or no taxes.
The move from a regulated to a competitive environment will have an affect on state and
local taxes paid by IOU’s. In 1996, IOU’s paid $13.865 billion in state and local taxes
nationwide. This comprises 60% of the taxes that go to state and local governments and
constitutes approximately 8% of IOU’s operating revenues. Compared to the 8% of operating
revenue paid by IOU’s, other utility companies pay only 2.7 percent of their operating revenue in
state and local taxes. Due to deregulation and competition in the electricity generation industry,
many utilities are appealing to state and local governments to lower their taxes to a level
comparable to those paid by other industries. (Anderson, 1999). WV is currently studying the

11
tax revenue issue in an effort to maintain tax revenue neutrality. This effort is aimed at
maintaining revenue when taxes decline due to decreased gross receipts tax or lower plant
valuations. Some states have instituted or are planning to institute a consumption tax at the
distribution level to make up for any loss in tax revenue.
Depending on the state, a variety of taxes are levied on utilities. These taxes can include
gross receipt taxes, kilowatt-hours taxes, capacity taxes, regulatory assessment fees and license
taxes. Tax rate calculations vary considerably among states and result in large differences in the
state and local tax burden of IOU’s. One of the special taxes that are imposed on utilities is the
gross receipts tax. This tax consists of a single or graduated rate applied to a utility’s gross
revenues. There are 19 states that currently levy this tax compared to 40 states in 1990. Many
states will lose gross tax revenues with deregulation because most restructuring plans call for
immediate rate reductions of 10% to 50% for in-state customers. If the demand for electricity is
inelastic, this decrease in gross tax receipts will reduce state tax revenues. (Anderson, 1999)
Property tax is one of the largest taxes imposed on electric utilities and comprises a
significant portion of the taxes received by local governments. Thus, many public school
districts are highly dependent on utility tax dollars resulting in concern for maintaining school
funding in a deregulated environment if property tax laws change. Electric utility property taxes
have historically been based on cost rather than FMV because it is (1) considered difficult to
determine FMV of an electric power plant and (2) the utilities profit is based on costs in a
regulated environment. Unit valuation has been the preferred method as opposed to individual
power plant valuations. Tax assessors first determine the “unit value” of the entire utility based
on the cost of the utility’s taxable assets, income earned, and the value of the utility’s securities.

12
This unit value is divided among the various tax jurisdictions in which the utility operates. Many
states utilize this method while other states assess electric utility property locally.
The classification of electric utility property as personal or real property also affects the
rate at which property is taxed. The state of New York classifies property as taxable real
property if owned by a regulated utility whereas the same property would be considered
nontaxable personal property if owned by another entity. Eleven states tax property owned by an
electric utility at a higher rate than identical property owned by a nonutility. In Mississippi,
electric utility property is assessed at 30% of its market value, while other business property is
assessed at 15% of market value. Since independent power producers are not considered to be
utilities, they are not subject to higher tax rates. The amount of property taxes is likely to
decrease under deregulation since the cost of most power plants is greater than their market
value. (Deloitte and Touche, 1996).
Many utilities are asking for compensation for their stranded costs in the transition to
deregulation. These stranded costs are estimates of the costs that a deregulated utility will not be
able to cover if the competitive price for electricity is lower than the regulated price. Stranded
costs across the country are estimated to range from $50 billion to $300 billion for all electric
utilities. (Anderson, 1999).

13
Chapter 3
Literature Review
3.0 PROPERTY TAX REFORM
In a competitive market with utility properties valued at fair market value most state and
local governments would incur significant tax revenue reductions. According to a study by
Deloitte and Touche (1996), competition in the electric utility industry will likely cause tax
revenues to decline in many jurisdictions (based on the cost approach valuation method applied
during regulation) due to lower electricity prices and a shift in market share from more heavily
taxed to less heavily taxed providers. Taxes that have been passed through to electric utility
customers will be borne, at least in part, by the utility itself and will affect who provides
electricity and where it is generated. In order to facilitate the transition to a competitive market,
Deloitte and Touche recommend:
•Replacing existing utility taxes with electricity consumption taxes. •Reforming property taxes to remove the differential treatment of utility
and nonutility property. • Increasing the reliance on income taxes rather than gross receipts taxes.
A recent report by the Federation of Tax Administrators (Deloitte and Touche, 1996) proposes that states shift to consumption-based energy tax. The study cites three advantages of this form of taxation:
o Tax revenues are not dependent on the price of electricity.
o No problems with nexus (Nexus is the minimum connection
the taxing state must have with the corporation or the activity being taxed) exist if the tax is imposed on the distribution company.
o The distinction between whether the power is provided by a
utility or independent generator would be irrelevant since the tax is on distribution.

14
Electric utility deregulation presents a challenge for state legislatures as they attempt to
introduce competition while maintaining a steady level of tax revenues. The existing framework
of complex taxes that differ significantly among states makes the problem more difficult. An
increased awareness of the differences between state tax structures and their resulting impact on
utility tax burdens is necessary in order to develop a “level playing field” whereby all electric
utilities face fairly equal state and local taxes. (Anderson, 1999)
3.1 VALUATION METHODS FOR DEREGULATED ELECTRICITY GENERATORS
In some states, taxable real property for utilities includes all immovable machinery or
equipment. Notably, immovable machinery or equipment owned by other types of industries in
the state is considered non-taxable personal property. Local governments are responsible for the
determination of the value of taxable real property. Usually state law requires that local
governments value generation facilities under the reproduction cost new less depreciation
(RCNLD) approach because generation facilities are considered “specialty property”. Under this
method, the value of the property equals the reproduction cost minus incurable and curable
physical depreciation, functional depreciation, and external depreciation. In comparison to other
methods of real property valuation, Murray believes that the RCNLD method results in the
maximum valuation of the property. This is not necessarily true when considering such variables
as market power or intangible property. Establishing the maximum valuation for generation
facilities may reduce the tax burden on other taxpayers in the locality but could affect a utilities
costs and competitiveness. (Murray, undated)

15
Many of the valuation approaches for utilities considered “specialty property” will no
longer be valid once these utilities complete their transition to a competitive market. This is
because criteria such as marketability (ability to be sold) will no longer categorize utilities as
special property.
According to Murray (undated), there are two other valuation methods besides the
RCNLD approach that a local assessor may apply: the income approach and the market
approach. With the income approach, the property is valued based on the amount of net income
the property is expected to produce. This approach would create fair and competitive tax
burdens on utility generation facilities for two reasons. First, many utility generation facilities
have excess generating capacity. If the income approach is applied, the taxable valuation of
utility generation facilities will not include that portion of the facility consisting of capital assets
used to produce income. This means that electricity rates will not include taxes on the cost of
excess capacity. Secondly, valuation under the income approach will result in lower valuation
than under the RCNLD approach. The income approach may result in a lower valuation and this
may promote the goals of creating a competitive energy market by lowering electricity prices and
placing utilities on a level playing field.
Under the market approach, an assessor establishes a value for the property by comparing
the property being appraised to similar properties that have been recently sold. While this
approach should also result in a lower valuation of utility generation facilities than the RCNLD
approach, it will involve elements of comparison that are artificial given that no two properties
are the same. (Murray, undated). If a fossil fuel steam plant’s value is calculated by RCNLD, the
appropriate replacement cost will likely be a gas-fired turbine generator. The cost of replacing
generation capacity will depend on the most feasible technology.

16
Compared to the technology oriented RCNLD approach, the price oriented income
approach or the market approach may result in lower assessed values for electricity generation
facilities depending on the technology used to provide the same generation capacity. This will
be to the benefit of the electricity generation facility and the competitive environment. Without
intervention by the electricity industry, it is contended that local assessors may continue their
valuation assessments based on the methods used under a regulated environment such as the
RCNLD method. According to Murray (undated), utilities should propose legislation to provide
a form of central assessment, which would treat all generation facilities the same as other
industries in the state. This kind of legislation may face strong lobbying against it because of the
loss or the chance of loss of revenues by local governments.
Schneider (1999) addresses the different valuation methods citing that the rate base of a
regulated utility will become irrelevant in a competitive market. The demise of rate regulation
will cause some states using unit valuations to shift to valuations of individual plants. In order
to determine FMV, many valuation issues will have to be resolved by the courts such as the
influence of above-market power purchase contracts on plant value, recovery of stranded costs,
and the continued legitimacy of the unit approach to value. Currently, West Virginia utilizes the
unit value method and the income approach (West Virginia Public Service Commission Report,
1997). Schneider (1999), states that practitioners litigating power plant valuations must consider
several strategies. In the replacement model, a power plant can be readily valued by comparing
its performance characteristics to a new, state-of-the-art facility. That facility, in today’s market,
is the combined-cycle gas turbine power plant. In such plants, pollution abatement costs are
generally lower than coal fired plants.

17
3.2 VALUATION ISSUES
In James Bonbright’s book, The Valuation of Property, he states that property can be
valued in many different ways:
Not only in law, but in business, accountancy, commercial appraisal, and economics, “Value,” in the language of Justice Brandeis. “is a word of many meanings.”(pg.17)
According to Bonbright (1937), there are 89 definitions to describe value as it relates to
property. The difficulty of arriving at the appropriate value for a property is often based on the
reason for the valuation. Legal issues dating back to the early part of the century are repeated in
the courts today due to the different concepts of value. Lower and higher courts continue to hear
arguments concerning the appraised value of property as a property owner’s definition of value
may differ from the appraiser’s valuation.
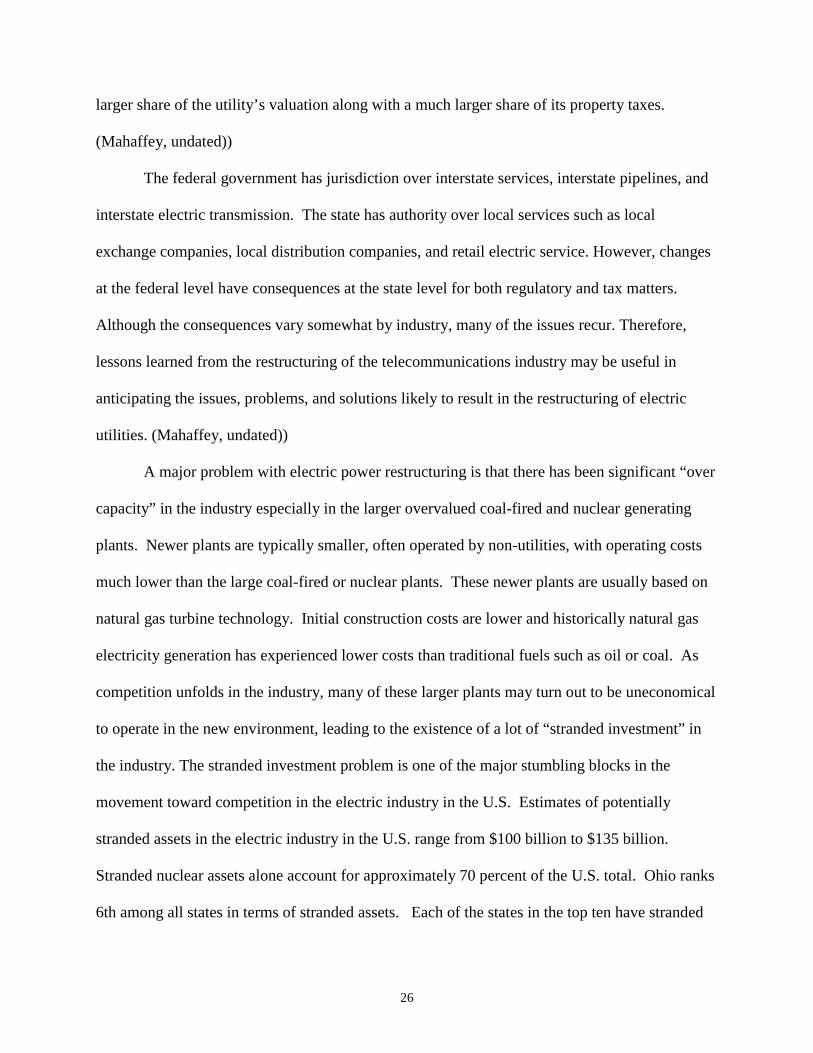
Examining the theories behind valuation is essential to understanding the valuation
process. It is possible to arrive at many different appraised values. Bonbright (1937) states that,
of the 89 varieties of value, four concepts are stressed as being fundamental to all. These
include: market value, value to the owner, intrinsic value (in the sense of “justified selling
price”), and normal value. Of these concepts, the first two are primary; the last two are called
hypothetical market values. In Bonbright’s (1937) words, “no fundamental definition of value is
attempted other than the favorable importance of property, as distinct from all other
characteristics (such as bigness, cost, color, utility, scarcity) which merely have a bearing on this
importance” (pg.38). Furthermore, one must analyze the concept of value with relation to the
purpose of each valuation, the techniques of appraisal adopted, and the nature of the property
appraised.

18
Each method of valuation should be critically appraised as to its advantages and
limitations. Much of the confusion as to valuation methods is due to the fact that different
concepts of value require different methods of valuation; “that the evidence of value, like value
itself, is often expressed in monetary terms; and that there are many legal situations in which the
evidence of value is superior to value itself as a standard for legal judgments.” (Bonbright, 1937,
pg.40).
Bonbright (1937) argues that actual sales prices are generally thought the most obvious
measure of value. On theoretical grounds that method can be challenged if the market is not
highly organized, the sale is not representative, the transaction is too distant in time or place, the
property is essentially different, the transaction occurs in a different market (wholesale rather
than retail), or different quantities are involved. Bonbright (1937) believes that the actual or
original cost is a better measure of value to the owner than of market value. Actual or original
cost measures market value only when it coincides with the replacement cost of the property in
question. Contrary to popular belief, original cost is more often a matter of opinion or estimate
than a precise fact derived from the accountant’s books, particularly if the pertinent records are
missing or the circumstances surrounding the acquisition of the specific property fail to reveal its
true cost. A close approximation of original cost to present value may exist for utilities whose
original cost is a “legally accepted factor in the determination of ‘fair value’ and may therefore
have a bearing on the commercial value of the property, through its influence on rates and
thereby on earnings” (Bonbright, 1937, pg. 146). Much consideration has been paid to
replacement cost and the theories behind its relevance as a measure of value. According to
economic theories of competitive prices, “that the value of commodities produced and marketed
under conditions of competition tends to equal the production (or reproduction) costs”, is

19
rejected because of frequent discrepancies between market values and production costs. The
justification for the use of replacement costs is found in the principle of substitution in that, “no
given property can be worth more than the cost of acquiring equally desirable substitute
property” (Bonbright 1937, pg. 175).
According to Bonbright (1937) there are two basic truisms that are often disregarded: that
replacement costs can be accepted as evidence of value only for such properties as are worth
replacing, and that replacement costs should normally be measured by the cost of an equally
desirable substitute, the cost of identical replacement being relevant only in that rare situation
where an identical property would be reconstructed.
Schneider (1999) states that practitioners litigating power plant valuations must consider
several strategies. In the replacement model, a power plant can be readily valued by comparing
its performance characteristics to a new, state-of-the-art facility such as the Combined Cycle Gas
Turbine (CCGT) plant. In such plants, both pollution abatement and initial construction costs are
generally lower than those of coal fired plants.
Power plant valuation litigation should also include a projection of market prices of
electricity. Such projections are necessary for the income approach and for determining
economic obsolescence under the cost approach. With deregulation, rate-base multiplied by a
permitted rate of return can no longer be a reliable means for predicting income earned by an
electric utility. With competition at the wholesale level, there now exist observable market
prices for electricity. Theoretically (with competition) these prices should be below current
utility prices and below prices guaranteed in PURPA2 contracts. Although this is not the case in
California, it theoretically should be, as competition will drive down prices because it will bring
PURPA is the Public Utilities Regulatory Policy Act that was passed in 1978. This act required utilities to purchase power from nonutility generators.

20
about cost efficiencies. An appraiser may be able to determine a market area price projection by
examining the average cost of production of the utilities in the market. In a competitive market,
historical average costs will not set market prices, but rather, the marginal cost of production of
the most efficient plant available to produce a given demand. Competitive plants will produce as
long as their marginal cost of generating electricity is covered. Competition will force cost
cutting and increased efficiency that will lower overall market costs. (Schneider, 1999)
With disaggregation and competition, sales of power plants are occurring frequently. In
some states (California, Maine and Massachusetts), current laws favor utility divestiture of
generation assets. Independent power producers are also consolidating on geographic or
technology lines and consequently restructuring their portfolios. Using a comparable sales
approach can be difficult as not all plants have similar property values. Power plant sales can
include the transfer of power purchase agreements, expectations that a utility’s customer base
will follow, stranded cost recovery rights, environmental liabilities, other intangible contract
rights, and other assets or costs not directly related to the tangible or taxable property.
(Schneider, 1999).
Other issues of litigation involve intangibles, value-in-use, stranded cost recovery rights,
and the demise of the unit. Two related issues can be litigated under either intangible property or
the value-in-use concept depending on the law of a particular jurisdiction. These issues involve
PURPA contracts and whether they can be used to value a plant, and whether a utility’s stranded
cost recovery rights can be used to value its generating plants. The issue is whether a PURPA
facility contract and its income can be used to value the underlying plant. Arguments for and
against using PURPA to determine FMV depend on jurisdiction. A taxpayer will argue that the
contract is a separate asset with a separate value apart from the physical plant. Arguments

21
against including the value will be strongest where intangible property (or business value) is not
subject to property taxation and there is case law requiring real property to be valued through
estimating current market rent and not through income from long-term leases. The taxing
jurisdiction will argue that the PURPA contract and the physical plant cannot be separated
because if it wasn’t for PURPA the plant may not have been built or maintained its existence. A
taxing jurisdiction will argue that franchises, permits and contracts be considered in valuing
property. A current court case of a PURPA facility in Michigan involves a coal-fired plant. The
taxpayer is relying on a replacement cost analysis and a projection of market prices of electricity
to establish FMV. Intangible property is not taxable in Michigan and the state’s statutes specify
that market income rather than lease income must be used to value real property. (Schneider,
1999).
The cost approach considers the investment in current labor and materials required to
assemble an independent power project possessing comparable utility to the subject property.
Comparable utility implies that an asset generates similar economic satisfaction but does not
necessarily require that an asset be an exact duplicate of the subject. An asset is perceived as
being an equivalent asset if it possesses comparable utility. To employ the cost approach,
expenditures for equipment such as turbines, generators, boilers, fuel-handling equipment, ash-
handling equipment, cooling towers, and additional items such as engineering, financing, fees,
permits, legal, and other indirect costs must be determined. The individual component costs are
then added to estimate the original facility-construction cost. (Ellsworth, 1994).
The income method approach assumes that property is worth the present value of the
income stream it can generate. Under traditional regulation, utilities project future income based
on the rate of return on the rate base discounted by the market cost of capital. If the market cost

22
of capital approximates the allowed (and assumed achieved) rate of return, the income indicator
will approximate the rate base. Under deregulation, an appraiser must estimate the prospective
income that a utility’s generating plant is expected to earn based on a reasonable projection of
electricity market prices and how they will affect the plants dispatch. Operating costs, such as
fuel prices, also are projected and discounted to present value. To make these projections, an
appraiser can commission studies from energy and economic forecasting firms specifically for
the plant at issue or use reports from the Energy Information Administration or the Gas Research
Institute, which provide a more global perspective. The utility can also use price projections that
it has used to conduct studies of stranded cost recovery.
These studies typically provide the portion of net book cost the utility would likely not
recover, and by extension, what an investor likely would not purchase. If the assessment is
based on net book value, such studies will prove useful to benchmark property values.
Depending upon the quality of the study, it may be combined with competent appraisal evidence
and used to prove a value reduction in court. A truncated projection is also possible with an
income based on a rate base multiplied by permitted rate of return for several years, converting
to a market-price income projection for those portions of the load that will be sold in competitive
markets. If the plant is already producing primarily for a wholesale market then competitive
prices could be projected. State law should be examined to determine if using an income stream
based on rate base or including stranded cost recovery allowances would improperly set the
value of the property based on the owner’s use rather than its fair market value or by valuing
intangible assets. Fair market value is based on hypothetical buyers and sellers in the
marketplace. If the only buyers would be independent power producers, their purchase price
would be based only on the value of the tangible assets. Only the utility (not an independent

23
power producer) would have the ability to collect both the income from rate base or stranded
costs. Under most state laws, prices from above-market power purchase agreements should not
be used to project income, since doing so will value the non-taxable intangible contract rights
rather than the tangible property comprising the power plant. (Schneider, 1998).
Blacconiere, Johnson, and Johnson (1999), predict that deregulation can decrease the
importance of book value and possibly increase the importance of earnings. This study was
conducted by examining changes during a 1988-1996 time period for a sample of large investor
owned utilities. The time frame in the study covers firms during and after deregulation. The
study’s hypothesis is that the trend toward deregulation triggered by the 1992 Act is associated
with changes in the market’s use of accounting information.
According to theory (Blacconiere, Johnson, and Johnson, 1999), if all costs are eventually
recoverable and the allowed return on investment is equal to the cost of equity capital, the market
value of equity for an electric utility should be approximately equal to book value under
regulation. Assuming that there is little uncertainty about the allowed return and little
measurement error in book value, earnings are expected to explain little variation in market value
incremental to that explained by book value. In contrast, in a competitive environment where
utilities are not assured a return on book value, earnings signal a firm’s ability to generate future
abnormal earnings and should have greater importance. Based on this study, the authors predict
that book value will become a less important determinant of market value following
deregulation.

24
3.3 STATE TAXATION ISSUES
Few deregulating states have studied the issue of the effect on property tax revenue from
deregulation as has Ohio. Historically the tax treatment of public utilities was not an issue. In the
case of Ohio, public utilities were monopolies that were allowed to earn consistent rates of return
and were taxed heavily. Utilities did not have to compete for customers (i.e., rate payers) and
could easily pass all taxes through to their ratepayers in the form of higher rates. The utility
industry was an effectively regulated monopoly. The state, therefore, collected monopoly rents
through taxation.
In Ohio electricity is supplied by 8 IOUs, 80 municipal utilities, and 30 rural electric
cooperatives. The investor-owned utilities have guaranteed territories and so face little
competition except from the municipal utilities. Ohio Power [part of the American Electric
Power (AEP) system], which serves the southeastern region of the state, relies heavily on coal-
fired generators and has among the lowest rates in the nation; Cleveland Electric and Toledo
Edison rely heavily on nuclear power and have rates that are among the most expensive. The
high rates stem from the high cost of the nuclear power plants and the rate-of-return-based rates,
which are set to recover their cost over a period of 40years. Toledo Edison ranks 6th among all
IOUs in the country in terms of percentage of plant-in-service tied up in stranded nuclear assets.
Advances in technology are providing ever more opportunities for competition in
industries that were once thought to be irretrievably monopolistic. Traditional distinctions
between the industries are becoming blurred. In this context, the rationale for the separate tax
treatment of utilities and other businesses is vanishing. Continuing to pursue such policies will
result in larger and larger distortions in economic decision-making. Experience with MCI, a
telephone service provider, has shown that differential tax-treatment with competitors in the

25
same industry cannot be maintained in the long run. With or without a policy change, the impact
of public-utility restructuring on local revenues is expected to be particularly problematic since
public utility specific taxes account for 8% of all local revenues and 14% of local revenues to
school districts even though they account for only 5.3% of state Gross Receipts Fund revenue.
For the purpose of the property tax, Ohio assesses general business tangible property at 25%. In
Ohio many industries classified as public utilities are assessed greatly in excess of that. A natural
gas company, for example, would pay over three times as much tax as a non-public utility (such
as an energy broker would pay on the exact same property). This treatment is jeopardizing the
ability of Ohio’s utilities to compete and may prevent Ohio from reaping many of the benefits of
the new competitive environment. (Mahaffey, undated)
The public utility property tax is, however, an important source of revenue for local
governments, particularly schools. In 1995, Ohio public utilities paid $1,026.6 million in
property taxes to local governments of which $718.7 million went to schools. This was the
equivalent of 32% of the state basic aid paid to school districts over the same time period.
Ohio’s electric utilities contributed the largest share of taxes with electric utility property
accounting for 55.8% of total assessed value. The property of telephone and telecommunication
companies accounted for the next largest share (24.7%) followed by the property of natural gas
companies (10.9%) and pipelines (4.9%). The remainder (the property of railroad companies,
rural electric co-ops, waterworks, etc.) accounted for 3.7%. Local dependence on public utility
property tax revenue varies greatly throughout the state. Although the property of utilities is
apportioned among all the taxing districts in which the utility operates (by wire miles in the case
of telephone companies, for example), inevitably certain districts such as those with a large
electric generating plant, a substation, or a concentration of heavy electrical users receive a much
26
larger share of the utility’s valuation along with a much larger share of its property taxes.
(Mahaffey, undated))
The federal government has jurisdiction over interstate services, interstate pipelines, and
interstate electric transmission. The state has authority over local services such as local
exchange companies, local distribution companies, and retail electric service. However, changes
at the federal level have consequences at the state level for both regulatory and tax matters.
Although the consequences vary somewhat by industry, many of the issues recur. Therefore,
lessons learned from the restructuring of the telecommunications industry may be useful in
anticipating the issues, problems, and solutions likely to result in the restructuring of electric
utilities. (Mahaffey, undated))
A major problem with electric power restructuring is that there has been significant “over
capacity” in the industry especially in the larger overvalued coal-fired and nuclear generating
plants. Newer plants are typically smaller, often operated by non-utilities, with operating costs
much lower than the large coal-fired or nuclear plants. These newer plants are usually based on
natural gas turbine technology. Initial construction costs are lower and historically natural gas
electricity generation has experienced lower costs than traditional fuels such as oil or coal. As
competition unfolds in the industry, many of these larger plants may turn out to be uneconomical
to operate in the new environment, leading to the existence of a lot of “stranded investment” in
the industry. The stranded investment problem is one of the major stumbling blocks in the
movement toward competition in the electric industry in the U.S. Estimates of potentially
stranded assets in the electric industry in the U.S. range from $100 billion to $135 billion.
Stranded nuclear assets alone account for approximately 70 percent of the U.S. total. Ohio ranks
6th among all states in terms of stranded assets. Each of the states in the top ten have stranded

27
nuclear assets in excess of $3 billion. While FERC rule 888 called for full recovery of stranded
assets incurred before June 11, 1994, its jurisdiction is limited to interstate matters, i.e., the
wholesale market and the transmission system. Well over 90 percent of strandable assets are
located at the generation level, which falls under state jurisdiction. Regardless of how states
decide to handle stranded costs, decisions to close plants will be based on marginal and variable
costs, not the sunk costs of the value of stranded capital assets.
The District of Columbia, like most state and local governments, has taxed its utilities
more heavily than other industries. Deregulation of the utility industries therefore presents
significant tax revenue issues for the District, including highly political concerns about a
possibly uneven playing field where utilities and their nonutility competitors would face different
tax burdens. As deregulation proceeds, several tax policy challenges in the electricity industry
must be met. These include:
• maintaining an even playing field in taxation policy within and between industries affected by deregulation;
• offsetting lower tax revenues resulting from lower energy prices, which restructuring is expected to facilitate;
• addressing increased tax collection administration costs that might emerge in the utility industries as many suppliers of natural gas and electricity are allowed to enter the local market; and
• counteracting or compensating for possible reductions in the energy industries’ commitment to social programs due to competitive pressures. (Coopers and Lybrand, 1997).
The optimum size of power plant has decreased greatly over the past 15 years from plants
in excess of 500-megawatt capacity to plants in the 50 to 150 megawatt range. The smaller gas-

28
fired turbine plants can be put into operation within a year of initial investment compared to the
10 years on average it takes to bring the larger fossil fuel or nuclear plants on line. The cost of
operating these new plants is much smaller so that the variable cost of bringing on additional
plants at the new technology is less than the variable cost of operating most plants constructed in
previous decades. For example, it costs 3 to 5 cents per kilowatt hour (kWh) to operate the
smaller gas-fired combined-cycle generating facility compared to the 4 to 7 cents per kWh for
coal-fired plants and the 9 to 15 cents per kWh for nuclear power plants. (Mahaffey, undated)
The more expensive utilities are the ones that face the greatest competition from the
municipals. Since the municipals buy electric power in the wholesale market, they can purchase
power from lower cost utilities or generators, which may be located in a different service
territory, a different state, or even a different country. The municipals are also exempt from the
property tax. Competition occurs as either municipalities annex territories and extend their
services to these new territories or as new municipal utilities are formed to provide large
industrial users in their jurisdiction with lower-priced energy. As industrial users leave (or
threaten to leave) the IOU’s service for the cheaper power, IOUs may in turn offer them lower
rates. These rates are known as “economic development” rates. The shareholders and remaining
customers of the utility are left to make up the difference. The advent of competition and retail
wheeling is expected to expand this type of pressure to reduce rates and shift burdens statewide
among utilities in general, not just between municipal utilities and IOUs. Although taxes are not
the sole cause of the differences in rates among IOUs, they do contribute to the problem.
Property taxes and required rates to recoup taxes increase as the value of a utility’s property
increases.

29
While the high cost of the nuclear power plants have been a major aggravation to utility
consumers in northern Ohio, they have been a boon to schools in the area that receive a large
share of their funds from property taxes on the plants. Most notable are Benton Carroll Salem
Local School District in Ottawa County (site of the Davis Besse nuclear power plant) and Perry
in Lake County (site of the Perry nuclear power plant). In 1995 both received 62% of their total
property tax revenue from taxes on electric utility tangible property.
For the purposes of public utility property taxation, the production or generating
equipment of electric power plants is assessed at 100% of true value, and the non-generating
equipment is assessed at 88% of true value. True value is defined as 50% of original cost, where
original cost equals book value minus the allowance for funds used during construction. While
not included in the property tax base, original cost is included in a firm’s rate base, where it is
considered a “regulatory asset.” In some cases it may become a stranded regulatory asset. For
the most part, 70% of the tax revenues derived from generating plants are allocated to the taxing
district where the plant is “sitused;” while the remainder, along with the non-generating plant, is
apportioned throughout the utility’s territory in accordance with the value of the firm’s
transmission and distribution system. However, in the case of a utility valued in excess of one
billion dollars, any valuation in excess of $420 million is apportioned like the nongeneration
property. This provision affects the apportionment of property associated with the Perry nuclear
power plant and the Zimmer coal-fired power plant in Clermont County. Nevertheless, school
districts, which host an electric power plant, receive a disproportionate share of the public utility
property tax. (Mahaffey, undated). Levin and Driscoll (1996) note that 40% of the electric utility
tangible property value is located in the 35 school districts (out of a total 611) which have power
plants. The districts containing the largest amount of utility property valuation are Perry and the

30
New Richmond Exempted Village School District. The erosion of electric utility property tax
revenues in Ohio is likely to come from two main sources:
• existing utilities writing down their overvalued assets, and
• the disincentives for non-utilities (and ultimately utilities) to locate new plants in Ohio.
In comparing the property tax per kilowatt-hour incurred by Ohio electric utilities with
that incurred by utilities in the surrounding states, only Michigan has a comparable property tax
burden on electric utilities. However, this observation would now be somewhat misleading.
Unlike Ohio, utility property in Michigan was (and is) treated like industrial property for taxation
purposes. The high tax burden in Michigan simply reflects a relatively high property tax burden
on business property in general. Moreover, since 1995, taxes on business property in Michigan
have been reduced by about 20%. For the purposes of property taxation, non-utility generators
are treated like utilities. In other words, the “exempt” in exempt wholesale generators just means
that the firm is exempt from the Public Utility Holding Company Act (PUHCA); it is not exempt
from Ohio’s public utility property tax. (Mahaffey, undated).
The Ohio Revised Code, defines for the purposes of public utility property taxation, an
electric company as “Any person... when engaged in the business of generating, transmitting, or
distributing electricity within this state for use by others...” This provision results in a significant
tax disadvantage for non-utility generators in Ohio compared to their situation in other states.
Such entities would typically be assessed for taxation at 100% of true value. However, since
they are not regulated public utilities, they cannot be assured of recovering the higher tax
assessments in rates. Consequently, it makes little sense for them to locate such facilities in Ohio
particularly when the property tax burden is generally much lower in the surrounding states.

31
(Moreover, if competition means that generators belonging to IOUs can no longer be assured of
recovering the higher taxes in their rates, then IOUs will not locate future investment here,
either.) Given the unfavorable climate, it is not surprising that in 1991 non-utility generators in
Ohio provided less than 2% of the state’s total electricity generation. In comparison, non-utility
generators account for over 10% of electricity generation in Pennsylvania and Michigan. Ohio is
not only losing property tax revenues as utilities write down the assets of the older electric power
plants; it is also not gaining revenues from the newer facilities that are being built. (Mahaffey,
undated).
In either case, local governments in Ohio stand to lose revenue. This has already begun to
happen in certain Ohio school districts that depend heavily on the revenues from nuclear power
plants. Public utility property values fell by 2.7% in Perry school district in 1992-93 and by 0.6%
in 1993-94. This erosion can only be expected to continue and spread to districts dependent on
large electric generating facilities however powered as the process of electric utility restructuring
continues and utilities position themselves to survive. (Mahaffey, undated).
Doing nothing about the public utility property tax is not a long-term option for states
like Ohio. In one scenario such a policy would result in a continuing erosion of the tax base as
assets are taken out of service or written down and their generating capacity replaced by facilities
located in other states. Adjacent states would generally benefit from investments in generating
capacity that would otherwise have taken place in Ohio. Alternatively, a disgruntled utility
might launch another legal challenge in either state or federal court arguing that it was denied
equal protection due to differential tax treatment. Losing such a challenge could prove quite
costly to both local governments and the state.

32
Calculations based on Ohio State Tax Department data detailing the assessed value of
public utility personal property were developed by type of utility. The Ohio Legislative Budget
Office also used the Tax Department’s estimate that 47% of electric utility property in 1995 was
generating plant (i.e., valued at 100% of true value). An effective tax rate on all public utility
property of 67.83 million was calculated based on the assessed values and total public utility
property tax revenue for 1995. The revenue loss presented in table 1 is based on the tax rate
being reduced to 25%. True value estimates for each class of utilities were found by dividing the
assessed value by the appropriate assessment rate (which was 93% for electric utilities). The true
value multiplied by an assessment rate of 25% times the 67.83 million is contained in table 1.
Table 3.1. Tax revenue loss from Ohio utilities
Cost of Reducing Assessment Rate on Public Utility Property by Class
(Revenue loss) Natural Gas $77.3 Pipeline $34.7 Electric Power $402.6 Other public utility property $11.6 Total $526.3 *Values are in millions of dollars/year.
Source: Mahaffey, undated.

33
Table 3.2. Ohio utility tax burden
Source: Mahaffey, undated.
Consequently, restructuring of the electric power industry is not likely to result in a
hemorrhaging of property tax revenues as in the case of deregulated industries like natural gas.
The drawback is that the law is likely to hamper growth and could ultimately increase the
likelihood of bankruptcy for Ohio utilities.
Property Tax Burden Comparison Property Tax per Retail kWh (Cents)
Ohio Cleveland Electric .66 Toledo Edison .59 Ohio Edison .50 Cincinnati Gas & Electric .47 Columbus Southern Power .40 Dayton Power & Light .37 Ohio Power .24 Michigan Detroit Edison .44 Consumers Power .33 Indiana Indiana Power .14 Pennsylvania Pennsylvania Electric .19 Pennsylvania Power . 17 West Virginia Appalachian Power 10 Wheeling Power .03 Kentucky Kentucky Power .09 Kentucky Utilities .05

34
3.4 CONSUMPTION TAX
The Tax Focus Group from the state of Georgia has concluded that Georgia’s present
system of taxing electric utilities would be counterproductive to an open, competitive electricity
market (PSC Georgia, 1997). The Tax Focus Group has proposed several plausible changes
based upon modifications to the state and local tax laws. As a minimum the criteria for these
changes should focus on allocative efficiency, horizontal equity, vertical equity, revenue
adequacy and stability, economic growth and development, and administrative ease. Allocative
efficiency means that tax revenues are raised without unduly affecting the patterns of production
and consumption that would occur in the absence of taxation. Horizontal equity means that
equivalent businesses should be treated the same. Disparate tax treatments of electricity
providers would violate both of these principles. The Tax Focus Group has proposed several tax
methods to meet these criteria but notes that they are worth further study. These include a tax on
imported electricity, energy sales and use tax (excise tax) on the supplier, and an energy
consumption tax on the consumer. (PSC, Georgia, 1997).
The tax on imported electricity and the energy sales and use tax would not necessarily
effect property valuation or property taxes whereas the consumption tax could be used to replace
lost municipal revenue and property taxes by imposing a tax on consumers of electricity, gas,
and other forms of energy. Enactment could be coupled with the simultaneous elimination of
one or more of (i) the sales/use tax on generating fuels, (ii) franchise fees, (iii) property taxes on
utilities, and (iv) any tax(es) on gas that may cause problems given the restructuring of that
industry. The consumption tax rate could be set at a level expected to produce the same amount
of revenues as those being lost through the elimination of these other taxes. The tax could be
based on volume such as kilowatt hours of electricity or on price. The law could provide for a

35
true-up mechanism designed to adjust the rate periodically to ensure revenue neutrality. (PSC,
Georgia, 1997).
3.5 RISK
There is increased risk associated with the introduction of competition into the generation
of electricity. In a regulated environment fluctuations in demand and random equipment failure
were dealt with by carrying excess capacity and redundant backup capacity. With competition
private producers of electricity will seek to earn profits. Operations will be regulated by market
competition that will govern prices and rates of return. As a result producers will monitor costs
more closely at all margins and offer electricity at prices determined by marginal costs Because
the cost of generating electricity will vary by reliability of service and whether demand falls on a
peak or off-peak period, it can be expected that a more elaborate pricing system will emerge
under competitive conditions. Competitive generation produces at least two additional sources of
risk: a more complex pricing structure and loop flow problems when independent producers put
electricity into the transmission network. Industrial customers, residential customers,
distribution companies and transmission services will determine competitive pricing of
electricity. Industrial customers can purchase electricity from regional distributors or directly
from generators via bulk wheeling. The prices will be negotiable and subject to long-term
contract. Residential customers may be in a position to contract for the most desired type of
service and price. Distributors will be the most important shoppers for electricity in the system.
Distribution companies will likely purchase their base and expected peak-loads by long-term
contract with shortfalls and emergency requirements met in the spot market. In Florida, Energy
Brokers operate a wholesale spot market for electricity and post prices hourly. In the

36
transmission sector, long-term contracts setting forth transmission rights for each generator and
fees for transmission services will have to be established. Fees might include an access charge
covering capital costs and a fee set equal to the marginal cost of providing service. Because the
latter includes maintenance and congestion costs, fees would vary with the volume and distance
power is transferred. (Moorhouse, 1995).
Electricity generators will face the risk of uncertain prices for electricity due to the
competitive market. The futures market for electricity is really a market for future generating
capacity. The generator is said to be “long on capacity”; therefore, the firm will hedge by selling
future contracts for the amounts and periods corresponding to its desired sales profile. (Shogren
and Crocker, 1999)
The electric power industry is currently characterized by excess capacity in electric
power generation. At the same time, improvements in the transmission system make it easier to
rely on more distant energy sources. Assets valued in excess of the market price will not survive
in a competitive environment. Either the facilities will be retired from service or their values will
have to be written down.

37
Chapter 4
Theory
4.0 AD VALOREM TAXATION
An ad valorem tax is based on the principle that the amount of tax paid should depend on
the value of the property owned. Property tax is a major source of government revenue in the
United States and is the major source of revenue for financing local government services
including schools. In particular, the property taxes paid by electric generating facilities have
been a major source of public school funding. With deregulation, the value of electric generating
facilities may be determined by the valuation methods normally used for commercial/industrial
property rather than by the cost approach used under regulation.
According to the Property Appraisal and Assessment Administration (Eckert,1990) real
property appraisal is applied economic analysis. Basic economic principles are important to
property appraisal as they apply to value, price, supply and demand, markets, equilibrium,
anticipation, substitution, model specification, and model calibration. There are six basic rights
associated with the private ownership of property: (1) the right to use, (2) the right to sell, (3) the
right to lease or rent, (4) the right to enter or leave (real property), (5) the right to give away, and
(6) the right to refuse to do any of these. These rights are known as the bundle of rights, which is
the ownership of all the legal rights obtained with fee simple title. (Eckert, 1990).
The first step in the economic analysis of property appraisal is a broad study of the
workings of the regional and local economy as relates to the parcel being assessed. The result is
an understanding of the highest and best use of the land, i.e., the most profitable use at a specific
time given legal, physical, and financial limitations. Highest and best use of the land/property is

38
similar to general equilibrium analysis in economic theory. Equilibrium analysis determines
how consumer preferences are translated through the price system into demand for goods and
services and then to demand for the factors of production. (Eckert, 1990). This is important if
the value of the plant depends on the market price of electricity.
The second step in economic analysis is the study of supply and demand for the identified
highest and best use. The purpose of such an analysis is to develop a model that represents the
behavior at a particular time of the supply and demand factors in the market being analyzed.
Appraisers often use models for property that they value. All appraisal models either directly or
indirectly estimate the present value of the future benefits of property. In this sense, models
represent the workings of an efficient market. A model can also be a statement, formula or an
equation. “The value of a property with a new building is the sum of the land value and the
improvement value.” (Eckert, 1990, pg 24) This statement is a model that expresses one
approach to valuation, the cost approach. Expressed as an equation, this model becomes
V = LV + IV,
Where; V is the estimated value of the property with a new building, LV is the value of the land and, IV is the improvement value. The formal development of a model in a statement or equation is called model specification. The
model statement above for a cost approach is only adequate for new improvements and
represents the supply side of the market. A valuation model for improvements in general would
need a depreciation term:
V = LV + (IV – D),
Where;

39
D is depreciation.
A simple model for another approach to value is the income approach:
V = I/R,
Where;
I is the income it produces and, R is a capitalization rate.
Historically, there have been three approaches to specifying valuation models that
represent the market. The cost and income approach have been mentioned above. The third is
the sales comparison approach. The model statement is, “The market value of a subject property
is equal to the sale price of a comparable property plus adjustments to the sale price for
differences between the attributes of the comparable and subject properties”. Expressed as an
equation,
MV = Sc + ADJc ,
Where;
MV is the estimated market value of the subject property, Sc is the sale price of a comparable property, and ADJc is the total dollar amount of adjustments to the sale price of the comparable
property. Appraisers normally use three to five comparable properties to estimate the market value
of a subject property. (Eckert, 1990)
4.1 LOCATION THEORY
Location is a fundamental economic aspect important to the valuation of electricity
generation assets. The location of a generation facility relative to a transmission grid and the

40
location of other facilities is an important consideration of value. Other aspects of location
include access to fuel sources and transportation such as roads, rivers, and rail.
The father of location theorists, von Thunen, (Isard, 1949), developed his theory based on
Hicksian general equilibrium theory. General equilibrium analysis is a very special case of a
general theory of location and space-economy which concerns itself with the local distribution of
factors and resources as well as with local variations in price, and thus with the immobilities and
spatial inelasticities of factors and goods. According to Englander (Isard, 1949), any
entrepreneur, in choosing a location at which to produce or render a service, considers not only
the supply prices of local inputs but also the ability to transport goods for consumption. A
pattern of local price differences and the location of economic activities are simultaneously
determined by a general theory of “local conditionality”. As an example, the inability to erect
new intrastate and interstate transmission lines makes existing access more valuable to potential
buyers of generation facilities
4.2 MARKET POWER
Market power must be addressed in two broad categories (Shepherd, 1997). One is
horizontal market power, which refers to the ability of a dominant firm (or firms) to control
production and manipulate prices. The other is vertical market power, which is the ability of an
existing firm to erect barriers to entry or otherwise shift costs and revenues among affiliates in
ways that distort efficient market operation.
According to Shepherd (1997), in deregulated markets, market power could result in
increased prices, reduced levels of electric output and employment, retarded innovation in
electricity generation and transmission, cost shifting among buyers in different jurisdictions, and

41
suppression of technological advances. As a result, the potential for market power could pose a
serious threat to the successful restructuring of the electric industry.
A report by Edison Electric Institute (EEI, 1999) delves into the issue of market power
and forced divestiture in a competitive market. An issue raised in this report is that electricity
competitors are concerned that existing utilities can exercise market power in electricity markets.
Market power exists when one competitor has the ability to deny, or unfairly restrict, access to
consumers by other competitors and raise prices for a sustained period of time without losing
market share. One issue concerning valuation is whether or not market power should be
considered an intangible asset (goodwill) or an integral part of the value of a utility asset. This s
important in identifying those intangible assets related to a plants' value.
Some potential competitors complain that utilities have horizontal market power because
they own substantial amounts of generating capacity in an area. This belief ignores the large and
growing number of electricity suppliers in wholesale markets around the U.S., many of whom
own generation and will be competing head-to-head to provide electricity and other services to
consumers. These suppliers include more than 4,000 non-utility generation projects that
currently sell their power to utilities. The Federal Energy Regulatory Commission (FERC)
examined the issue of market power in generation with FERC Order 888 and determined that no
such power exists with respect to new generation. The order supported an earlier determination
that entry into markets for new generating facilities is easy and competitive
Traditionally, estimation and prediction of market power has relied mainly on
concentration measures. Concentration measures rely on historical data such as energy sales and
transmission congestion. These measures are questionable since the incentive of many firms will
change significantly after restructuring. Due to the weakness of analyzing market power based

42
on concentration measures; the Federal Energy Regulatory Commission (FERC) has proposed
using production-cost simulation modeling. According to Borenstein, Bushnell, and Knittel
(1999), this procedure is flawed because modeling approaches simulate markets as if they were
perfectly competitive and then apply measures of the potential for exercise of market power,
such as concentration indices. This flaw results from the fact that a firm or set of firms, through
the very act of exercising market power, will usually alter their production patterns in ways that
violate the assumption of market-wide least cost production. Researchers are now employing
more sophisticated market analyses in an attempt to capture the more strategic aspects of
competition in the electricity industry (Borenstein, Bushnell, and Knittel, 1999). Although far
from being perfect, these methods offer insight, both theoretically and empirically, into
restructured electricity markets and thus offer significant advantages over the more traditional
concentration measures. One central insight of restructured electricity markets is that a single
market can at times, exhibit very little market power, while at other times, suffer a great deal
from the effects of market power. The difference occurs when demand rises to the point that few
producers have the capacity available to compete for the marginal load. According to
Borenstein, Bushnell, and Knittel (1999), this difference is more apparent in the electricity
industry due to the relatively limited production capacities of small producers, the widespread
potential for transmission congestion, and the fact that electricity is expensive to store. These
factors combine to make the elasticity of demand for electricity a crucial factor in determining
the potential impacts of market power. The more traditional concentration measures do not
provide information about the elasticity of demand and supply.
According to Hayward & Schmidt (1999), market power “is coming to the forefront as a
possible ‘deal buster’ to open access and competition” (Hayward & Schmidt, 1999, Pg. 83).

43
This is especially true of electricity generation or generation that must operate during
transmission constraints. These suppliers are often referred to as “price makers” instead of
“price takers”. Price takers are usually in a highly competitive market and will take whatever
price the market is setting. Price makers have control over the market, such as a monopolist, to
set prices for their own gains. These prices are usually higher than the competitive price.
There are a number of factors (beyond the number and size of firms in the market) that
impact the degree of competition with an industry. These factors include (Borenstein, Bushnell,
and Knittel, 1999):
• The incentives of producers: In the near term, it is likely that electricity markets will feature a diverse set of firms, including publicly owned utilities, unregulated generation companies, and traditional vertically integrated utilities. Each type of firm is likely to respond differently to a given competitive environment.
• The price responsiveness (elasticity) of demand: In markets where customers can easily choose not to consume a product, or to consume a substitute instead, producers cannot raise prices far above costs without significantly reducing sales. Conversely, a producer that knows that its product is absolutely needed can profitably raise prices to very high levels.
• The potential for expansion of output by competitors and potential competitors: Just as a producer with very price responsive customers cannot exercise much market power, neither can a producer faced with many non-price-responsive customers. Transmission capacity into a region and available competition generation capacity are the main factors in determining the potential for short-run competitive entry or output expansion.
The fundamental measure of the exercise of market power is the price-cost margin which
measures the degree to which prices exceed marginal costs. The price-cost margin is defined as:
P – MC P

44
Prices above marginal cost lead to both inefficient allocations since consumption will be too low
in response to prices that are too high and to inequitable transfers from consumers to producers.
(Borenstein, Bushnell, and Knittel, 1999).
4.3 INTANGIBLE ASSETS
Few intangible assets are included in an electric utility’s rate base. Goodwill is an
intangible asset that has not been accepted for purposes of ratemaking primarily because
customers did not have alternative sources of supply. “Because the value of goodwill depends
on an electric utility’s earnings, to include it in rate base would result in circular reasoning”
(Hayward & Schmidt, 1999, pg.112). Normally, the burden of proof is on the electric utility to
show tangible benefits to ratepayers for including goodwill in an electric utility’s rate base.
Under retail competition, this policy will change. (Hayward and Schmidt, 1999).
Goodwill is also referred to as “going concern”. The going concern assumption is that a
company will continue in operation for the foreseeable future. Charles F. Phillips, Jr., in his text
The Regulation of Public Utilities: Theory and Practice, notes, “no cost measure of this value
has ever been devised, making it ‘purely hypothetical’ and the ‘most intangible of all the
intangibles’". In two U.S. Supreme Court cases since 1933, the Court could not find a basis for a
separate going concern value. On the other hand, one expert has found that “if enterprise has
‘demonstrated a capacity for profitable operations under reasonable rates’ it may be entitled to
consideration of reproduction-cost-new less depreciation, including an intangible ‘going concern
value’, under certain circumstances.” (Hayward and Schmidt, 1999).
A franchise is another intangible asset. For IOU's, franchises are contracts with industrial
users, PURPA co-generators, or any other contract for power purchases. Including a value for an

45
electric utility’s franchise in rate base would require customers to pay a permanent return on
monopoly privilege that they have granted to the electric utility. The rights and obligations of
holders of franchises historically have not been controversial issues. This issue was debated in
New Hampshire. The Public Service Company of New Hampshire (PSNH) believed it had an
exclusive franchise to provide service within the state. The New Hampshire Public Utilities
Commission decided that the company did not have an exclusive franchise. This left an
opportunity for Freedom Electric Company (now Freedom Energy Company) to compete for
PSNH industrial customers. (Hayward and Schmidt, 1999).
In his valuation study of the stock market’s R&D Investment during the 1980’s,
Hall (1993) utilizes Tobin’s q theory to value the intangibles regarding R&D investment. This
study is based on Tobin’s q theory, “in which the long-run equilibrium market value of the
bundle of assets which compose a firm is equal to the book value of those assets, properly
measured" (Hall, 1993, p259). Deviations from this relationship can either imply that the market
is in disequilibrium and that firms have an incentive to undertake additional investment or
disinvestments or that there is an unmeasured source of rents driving a wedge between the
market and book value of the assets. Other researchers have studied the q relationship to
determine the value of intangible corporate assets or sources of rents, either observable or
unobservable. (Hall, 1993).
Hall’s valuation equation for corporate assets is derived in the following way:
“…a firm is viewed as solving the dynamic programming problem of choosing an investment strategy to maximize the expected present value of cash flow given a portfolio of stocks of capital assets. Because the assets cannot be adjusted costlessly, the present position of the firm in asset space matters in determining the value of the optimal program conditional on the assets. This implies that the value of the firm as an ongoing enterprise in any given period can be expressed as a function of the various stocks of capital. The value function of the firm is written as a sum of the composite capital A and the intangible stocks

46
K1,K 2,… that are valued by the market but are not in the measured capital of the firm:” (Hall, 1993, pg. 262)
V(A,…,K1,K2,…) = Q(A +…+γ1K1 + γ2K2 +…)σ.
To derive the estimating equation, introduce a multiplicative disturbance term, and take
logarithms of both sides. This gives an equation of the following form:
logV = logQ + σ (log A +… + γ1(K1/A) + γ2 (K2 /A) +…) + e.
The σ coefficient describes the overall scale effect and should be equal to 1 under
constant returns to scale of the value function (and no measurement error in log A). The
parameter multiplying the left-out stocks Ki is the shadow value of those stocks relative to the
value of A (Hall, 1993).
For some industries, other intangible assets are the value of the brand name, product
differentiation, and good will arising from product reputation. These assets are typically the
product of advertising expenditures and investments in sales and service. Reporting by firms of
advertising expenditures (Adv/A), is taken as an indicator of the rents accruing to brand-name
reputation.
Hall (1993) uses a proxy for any market power or long-run profitability of the firms that
is not specifically related to advertising or R&D inputs. Included in this study is a two-year
moving average of cash flow (net of advertising and R&D expense, CF2/A). Also included is the
growth rate of sales in the current year (∆ log S) to capture the prospects for future growth of a
particular firm which may be a product of R&D and other investments but is not completely
captured by the current level of R&D capital or spending. (Hall, 1993).
The Appraisal of Real Estate, 10th ed. (Rabianski, 1996), provides the following
definition for going concern value:
“The value of a proven property operation. It includes the incremental

47
value associated with the business concern, which is distinct from the value of the real estate only. Going concern value includes an intangible enhancement of the value of an operating business enterprise which is produced by the assemblage of the land, building, labor, equipment, an marketing operation”. (Rabianski, 1996, pg. 190)
A more expansive definition of going concern value is given by Manning (1993):
The most probable market value, expressed in terms of money, available in the open market for a
proven business enterprise that has established patronage, exclusivity or uniqueness, which
results in demonstrated earnings or profitability. It incorporates the value of the real estate,
machinery and equipment, working capital and all other assets that are in place, operating within
and are a part of an established business. Included is the excess of value over cost that arises as a
result of earnings capability in a complete and well-coordinated operation.
Manning (1993), also states that going-concern value is:
"The present value of surplus earnings after the costs of capital, labor, management, and real estate have been attended to" (Manning, 1993, pg. 6)
This last definition is conceptually different from the first of Manning’s definitions. The latter
definition views going concern value as the difference between the total market value of the
business and the value of the business attributed to the factors of production or resources used by
the firm. This definition is supported by Henszley (1983):
“The difference between the total value of a viable, operating business and the value of its tangible assets. In this context, going concern value is the intangible value that exists over and above the value of the intangible assets.” (Henszley,1983, pg. 699)
In addition to real property, tangible assets are inventory and fixed assets such as
“leasehold improvements, furniture, fixtures, and equipment, etc.” Real estate includes: “land

48
and the improvements placed thereon, quality and utility of the building, (and) location including
an access and visibility, neighborhood and surrounding amenities.” The tangible assets include:
“machinery and equipment (or furniture and fixtures), the quality and use thereof, leasehold
interest or advantage, efficiency of plant, (and) working capital. (Rabianski, 1996).
There are many reasons to analyze intangible assets ranging from income taxation to
commercial litigation. Several of the valuation approaches presented in this thesis contain
intangible values. The ability to identify intangibles for ad valorem tax purposes is important.
Some states do not tax intangible property while others do. The intangible assets include the
“leasehold, trade name, patents, copyrights, customer lists, goodwill, advantageous financing
arrangements, etc.” The intangible or goodwill portion includes: management expertise and
ability, existing customer attitudes and patronage, stability of earnings generators and the
capability thereof, (and) probability of profit continuance. The term “business enterprise value”
also frequently arises in the discussion of surrounding going-concern value. Business enterprise
value refers to the value component over and above the value of the real property. In this
context, business enterprise value is an intangible component caused or created by
entrepreneurial effort and managerial ability associated with and intrinsically involved in the
conceptualization, planning, design, and assemblage of productive resources in the development
as well as the construction and the operation of the business. (Rabianski, 1996).
Reilly and Dandekar (1997) present three common approaches to valuing intangible
assets. The intangible assets considered in each approach are listed in table 3. It is important to
note that the most important parameter to valuing intangible assets is the premise of value. The
“highest and best use” of the intangible asset usually dictates the appropriate valuation premise.
49
Furthermore, the purpose and objective of the valuation normally dictates the definition of value
and the premise of value. (Reilly and Dandekar, 1997).
Table 4.1. Intangible assets
Common approaches to valuation of intangible assets
Intangible Asset Market Approach
Cost Approach
Income Approach
Customer lists X
Corporate practices and procedures X
Contracts X
Computer software X
Copyrights X
Franchises X
Goodwill X
Licenses and permits X
Patents – active X
Patents – inactive X
Proprietary technology X X
Trademarks and trade names X X
Trade secrets X
Trained and assembled workforce X Source: Reilly and Dandekar 1997

50
According to Rabianski (1996), market value of real property can be estimated using
three evaluation techniques. This includes the sales comparison, cost, and income approaches.
The question is whether these three techniques can capture the going-concern value that includes
real property, fixed assets, and the intangibles. The cost approach to valuation is not structured
to handle any and all aspects of the business. The cost approach to value real property cannot be
modified to estimate the intangible aspects of a business according to the concept of going-
concern value and, therefore, cannot be used to estimate going-concern value. The intangible
value would have to be separately estimated and added to the value of the real property and other
tangible assets to get an estimate of going-concern value.
In the sales comparison approach, financial ratios such as operating expense ratio, debt
service coverage ratio, and the equity dividend ratio can be used as elements of comparison to
select comparable properties. These financial ratios are oriented toward the operation of the
property rather than the operation of the business in the property. Financial ratios can be used to
value a business and estimate the going-concern value of an operating business but the nature
and substance of the ratios are different. The operating expense ratio focuses on operating the
property, not operating the business. An operating expense ratio for the going business concern
needs to consider business cost items such as the cost of goods sold and salaries/wages in
addition to the property’s operating expenses. Similarly, the appraiser’s equity dividend rate is
also a property concept. As a measure of return, it could be modified to include business
revenue and business cost items to generate the numerator of the ratio, and it could be modified
to consider all forms of initial equity required to start the business in addition to the funds needed
to acquire the equity position in the property. (Coggins, 1998)

51
A cash flow analysis (income approach) is the only applicable valuation technique for
going-concern value. Either the direct or the yield capitalization approach can be used3. The
form of cash flow statement must be modified, however, to include business revenue and cost
factors that are not part of the revenue and cost factors for the operation of the property.
(Rabianski, 1996).
According to Rabianski (1996), the intangible value of a business is the difference
between the going-concern value of the business including the real property (GCV) and the
market value of the real property (MV). The GCV is estimated using discounted cash flow
(DCF) analysis or direct capitalization, and MV can be estimated using any of the three valuation
techniques. To make the most conceptually appropriate comparison of GCV and MV, the
income approach to MV estimation should be the technique used. The intangible value or the
enterprise value of a business is positive if GCV > MV. The intangible value of a business could
also be negative, GCV < MV. In this case, the business is not fully utilizing the potential for the
subject property’s space in the market.
4.4 ECONOMIC RENTS
While the basic model for structural and regulatory reform in electricity is fairly
straightforward, the details of the institutional reforms that are necessary to improve on the
performance of the present U.S. system are complex. Pressure for reform in the U.S. reflects
rent-seeking behavior by various interest groups (school districts) pursuing private agendas that
may not always be consistent with efficiency goals. At the same time, there are good public
interest reasons to believe that structural reforms that foster competition can lead to real cost
3 In literature, on business valuation, the capitalized earnings approach and the discounted future earnings methods are structurally equivalent to direct and yield capitalization, respectively.

52
savings in the long run if appropriate supporting institutional arrangements are put in place.
Because of the critical role that economic and reliable supplies of electricity play in the
economy, there is a profound public interest in ensuring that these reforms improve rather than
degrade the performance of the electricity sector over the long run. (Joskow, 1997)
Producer’s surplus is normally used to measure the welfare effect of a policy on
producers. In a pure perfect competition case, producers’ surplus can only exist in the short run
since, in perfect competition, long run equilibrium profits are driven to zero and there are no
fixed costs. In reality, since producers are concerned with the short run and not the long run,
producers’ surplus is important. In the long run, there will be rents earned by certain limited
resources such as land and patented factors of production or technologies. (Tollison, 1982)
Historically, economic theory defines rents as earnings in excess of what it takes to keep
an input in its current employment. Some classical economists used to argue that rents were evil
and should be taxed away. Henry George is associated with developing the land tax and this
practice continues today with the use of real property taxes. More modern analyses have
indicated that rents are endemic and fundamental to natural resource industries. All of the
earnings of a natural resource such as coal or oil in excess of the costs (including capital costs
and minimum return on investment) of extraction and refining are rents. (Krueger, 1974)
All rents share one common factor in that they are earned by a factor or resource that is
limited in supply. This factor can be a limited factor such as managerial talent, location,
environmental quality, or natural resources. It can also be an artificially induced limitation such
as a patent, copyright, or monopolization of a market. Rent can be very important in determining
the price of a resource. The price paid for land is based entirely on the present value of the
stream of rents generated by that piece of land. Those rents are determined by land quality,

53
location, environmental characteristics, and the demand for the services provided by the land.
Resource valuation and environmental economics are both based on determining or estimating
the rents generated by the resource.
It is important to realize that only the initial owner of the rent generating resource earns
the rent (in the form of excess profits). This occurs because the rents are capitalized into the
price of the resource. Any future buyers pay a price that reflects the present value of the rent.
4.5 RISK
According to Hayward and Schmidt (1999), risk has two components – systematic and
unsystematic. Systematic risk concerns the changes in economic, social, and political conditions
that affect the risk structure and market prices of securities. These changes include expected
inflation and the real risk-free rate. The real risk-free rate is the price of postponing consumption
by one year and is derived by the supply and demand for money in the economy. The real risk-
free rate is the return required by investors if inflation and risk did not exist. The 91-day U.S.
Treasury Bill is often used as a proxy for a risk-free rate. A 91-day Treasury bill is considered
risk-free since usually little, if any, inflation can occur in 91 days, and the U.S. government has
never defaulted on its debt. The real rate represents the underlying long-term growth rate in the
U.S. economy.
Unsystematic risk involves business and financial attributes specific to a company and
industry that cause shareholder returns and stock prices to vary. Through diversification,
investors can substantially reduce the variations in returns caused by unsystematic risk.
Systematic risk cannot be diversified away, however, since the social, economic, and political
54
factors influencing this component have an impact on all securities to a certain extent. (Chen,
1967)
One way to incorporate risk is to adjust the discount rate. The net present value (NPV) is
the present value of yearly income less the present value of all yearly costs, including
investments. The NPV can be calculated by applying a discount rate which can be adjusted to
incorporate risk. The discount rate is the rate used to discount future cash flows (revenue and
costs) to determine present value and reflects the opportunity cost of capital to the firm (Torries,
1996).
4.6 CAPITALIZATION RATE
A capitalization rate is an expected rate of return that investors would require to invest in
a property. It is an expected rate of return that an investor could get from another equivalent risk
property. The capitalization rate, often referred to as the current cost of capital, is dependent on
risk – the higher the risk the higher the rate. If a given property is typically financed by both
debt and equity, then the capitalization rate will include both financial and business risk.
(Assessor’s Handbook, 2000).
The purpose of a capitalization method is to convert future income into value.
Capitalization methods are described by the shape and duration of future income. Future income
may last forever or it may terminate; it may incline, remain level, or decline; or it may have some
combination of these characteristics. Capitalization methods based on terminating income
projections are generally applied in conjunction with traditional land and building residual
techniques or property reversion techniques while direct capitalization methods are used with
perpetual income flows. (Assessor’s Handbook, 2000).

55
Chapter 5
Asset Valuation Methods
5.0 BASICS OF ASSET VALATION
The basics to any asset valuation analysis must consider the following fundamentals
(Hayward and Schmidt, 1999 and Torries, 1996):
• The analysis of historical data
• Estimating future earnings before adjustments for interest expenses, income taxes, depreciation, and amortization expenses – both the timing and the amount.
• Estimating the capitalization or discount rate that will be used to calculate the
present value or today’s value of the future income stream (sometimes the weighted average cost of capital (WACC) is used.
• Estimating the present value of the future income stream (i.e., the value of the
future income stream in today’s dollars). • An analysis of the risk involved in choosing among the different valuation
methods and identifying the user’s perception and tolerance to the risks involved. • Attempt to determine a single unit value for the purpose of taxation, sale/purchase
or investment.
• Analyzing and interpreting the results.
5.1 VARIABLES AFFECTING THE VALUE OF A UTILITY
Timing and the amount of income as well as the Discount/Capitalization rate primarily
affect the value of electric utility assets. According to Hayward and Schmidt (1999), there are
also a number of not so obvious factors that can affect asset values. These are:
• Reserve margin or the amount of generating capacity available above peak load. An abnormally high reserve margin might suggest under-utilized plant (over-capacity). Such over-capacity may not generate income for several years into the future.
56
• Pricing flexibility. If the utility is limited to charging only tariff-based rates and does not have the ability to adjust prices to meet competitive alternatives, sales from the utility’s assets may be lost. Prices in competitive markets can vary only slightly (if at all) between alternative producers. Indeed, prices between homogeneous products can differ only by insignificant amounts before purchasers buy from other suppliers or produce the product themselves. In the case of electricity, there are no inherent physical differences in the electricity produced by different suppliers or self-generation. Therefore, pricing flexibility is essential if the asset is to compete. If the asset cannot produce a competitively priced product, the value of that asset is adversely affected.
• Transmission access. An isolated generation plant, for example, with limited transmission access has limited markets. Limited markets may not enable sales to higher priced m arkets, thus trimming potential profits. Reduced profits translate into reduced value.
• Sales mix. A high concentration of price-sensitive industrial customers could present challenges. It is difficult to compete on price alone.
• Cost structure. The utility’s cost structure, particularly the utility’s embedded and marginal cost of power generated, must be compared to other sources of generation that have access to the utility’s market area.
• Regulatory prices. Regulatory prices can significantly affect the value of an electric utility’s assets. Basic policies such as allowed rate of return, the use of a future versus historical test year, fuel adjustment clauses, incentive mechanisms, and the regulator’s record of disallowance for imprudent investments are fundamental factors that can affect the value of an electric utility or its assets.
• Long term power supply contracts. Just having the contract itself and the relative certainty of the income associated with that contract can be of significant value to the purchaser. Such contracts also help in financing the acquisition of the asset.
• Physical condition of plant and equipment. Necessary repairs and/or deferred maintenance can influence significantly the value of the asset or utility. It is important to assess the need for these items before the purchase is determined. Such factors can be a critical negotiating tool.
• Location, location, location. The present and future value of the land on which the asset is located could be worth a great deal. Perhaps even more than the asset itself because of it’s access to a market even for new construction on that site.
• Management. The utility’s management can significantly affect the value of an electric utility and its assets. Judgment calls on maintenance issues, customer relations, political issues, union versus non-union labor, labor wage rates and policies, the ability to motivate employees, shareholder relations, and a host of other factors can influence the productivity and value. Perhaps this is why the asset can fetch a higher price in the first

57
place. In such cases, the new management (and their investors) are of the opinion they can do a better job than the old, especially if the old management is focused on an outmoded paradigm.
Environmental factors are another consideration when determining value. In a
competitive market, the cost of environmental compliance will no longer be included in rate base
or the regulated cost of service. This will increase the cost burden on a utility generator. Older
plants, which usually require more environmental modifications, will incur more significant
costs. Prospective investors in a power plant will recognize environmental changes that may
affect the profitability of their investment. (Schneider, 1998).
The Securities and Exchange Commission has addressed the accounting and disclosure of
environmental liability costs. The commission has acknowledged that even though estimates of
environmental liabilities differ from actual amounts, electric utilities may not delay recognition
of a contingent liability until they have a reasonable estimate. The electric utility should measure
its potential liability in light of facts, laws and regulations, and existing technology.
Furthermore, the entity should incorporate expected inflation, societal, and other factors in its
measurement. They also state that even though regulators decide if an environmental cost is
capitalized or expensed, the regulator cannot affect the timing of the recognition of the liability.
(Hayward and Schmidt, 1999).
Computing the capitalization/discount rates for a valuation project can also have an effect
on the outcome of the valuation. Capitalization and discount rates are often discussed as if they
are one in the same but there are fundamental differences in concept, application and
computation (Bizyak, undated). A utility’s cost of capital is its discount rate. Included in the
cost of capital are three specific elements of investor expectation. These include:
• A “real” rate of return for use of investor dollars by someone else on a risk-free
58
basis, • Expected inflation compensation for reduced future purchase power, and
• Risk as to the future cash flow or other economic benefit stream.
Cost of capital has several characteristics:
• It is market driven – an opportunity cost
• It is a function of the investment, not the investor,
• It is forward looking and based on expected returns,
• It is measured against market value, not book value, and
• It is usually stated in nominal terms, i.e., including inflation expectations.
The cost of capital is a link called the discount rate that equates expected future returns
for the life of an investment with the present value of the investment at a given date. A discount
rate can be observed from historical company or industry cost of capital experience and future
cost of capital expectations or it can be developed from several different models that are widely
utilized within the business community. Once developed, the discount rate is utilized to
determine present value factors to be applied to future projected economic benefit streams to
discount those streams to present value. (Bizyak, undated).
In assessing the value of a privately held operating business, no methodology more
closely mirrors the theoretical definition of fair market value (FMV) than the discounted future
benefits (DFB) method under the income approach. The DFB method entails the projection of
future cash flows and then “discounting” the future cash flows to today’s dollars using an
appropriate rate of return. The discount rate essentially assimilates the rate of return necessary to
attract investors to the particular company with all its attendant risks or other investments with
similar risks. Numerous methodologies exist for determining the discount rate. The two most
common methods are the capital asset pricing model (CAPM) and the buildup model. The
59
starting point in developing a discount rate is to identify a “risk-free” rate. The risks for a
competitive electricity industry involve market prices for electricity as well as fuel costs. No
investment is totally risk-free and most business professionals use the twenty-year U.S. Treasury
bond rate. (Grossman, 2000)
The risk-free rate is comprised of three elements. First it includes “rent” for foregoing
consumption and use of the investor’s money. Second it includes a risk premium for interest rate
risk. Lastly it includes a risk premium for investor expectations about inflation. This is where
the twenty-year bond is used. Once identified, the risk free rate is increased by a premium that
reflects the additional return required by investors to buy equities in the public market versus
investing in Treasury bonds. Various sources serve to identify this premium but the most
common is Roger Ibbotson’s Stocks, Bonds, Bills, and inflation yearbook. (Grossman, 2000).
In contrast, a capitalization rate can be directly observed in the public market if
comparable companies can be identified. Alternatively, a capitalization rate can be determined
by subtracting from the discount rate the company’s expected long-term sustainable growth rate
applicable to the economic benefit stream being utilized. While a discount rate is applied to all
expected incremental returns to discount the benefit stream to present value, a capitalization rate
serves as a mere divisor to one single element of return. Seldom will these two rates be the
same. The only instance in which the discount rate is equal to the capitalization rate is when
each future increment of expected returns are in perpetuity. In every other situation the rates will
be different. The fundamental principle in the valuation of utility assets is that the value of the
asset is equal to the present value of its future cash flow.

60
Table 5.1. Capitalization rate
Development of Capitalization Rate Discount rate 25.0% Long Term Sustainable Growth Rate (4.0%) Capitalization Rate 21.0%
Source: Grossman, 2000
Interest Rate/Weighted Average Cost of Capital (WACC): An electric utility’s WACC is
important because it serves as the capitalization/discount rate to convert the utility’s future
stream of cash flow into a present value that is important to investors debt and equity.
WACC consists of the cost of each element in the capital structure (i.e. short-term debt,
long-term debt, preferred stock, and common stock). The cost of each of these items and the
capital structure should be based on the future. The utility’s WACC reflects investors’
expectations as opposed to historical data that is not necessarily reflective of future performance.
The formula for a utility’s WACC is as follows:
WACC = Kb(1-T) * (B/V) + Kp * (P/V) + Ks * (S/V)
Where: Kb = the market pre-tax cost of nonconvertible and noncallable debt Ks = the market cost of common equity capital Kp = the market cost of preferred capital T = the marginal tax rate of the electric utility being analyzed V = the market value of debt, common equity capital, and preferred capital B = the market value of interest-bearing debt P = the market value of preferred stock S = the market value of common equity
The WACC should represent the marginal cost of all sources of capital. Marginal
cost is the cost of new capital. Marginal costs are used because investment decisions should be
based on the current cost of capital instead of an electric utility’s existing or embedded cost of

61
capital. The WACC must also be based on the after-tax cost of capital since the WACC is
applied to after-tax cash flows. Finally, the WACC must be consistent with the various weights
(or percentages of capital) in an electric utility’s capital structure. The capital structure
represents the percentages of each type of capital. The sum of the percentages must equal one.
It would be incorrect to have a very high percentage of debt in the capital structure and relatively
low costs of long-term debt and common equity. (Hayward and Schmidt, 1999)
The terms “capitalization rate” and “discount rate” are often used interchangeably but this
is incorrect. To distinguish between the two terms it is necessary to look at the terminal value or
lump sum in a series of cash flows. If a terminal value does not exist then the use of a
capitalization rate is appropriate. In that case, one WACC rate is used to discount the yearly
amounts of cash flows each year to infinity. When a terminal value does exist than a discount
rate should be used. In this case, a WACC rate is used to discount both the yearly amounts of
cash flows and the lump sum terminal amount.
5.2 VALUATION METHODS
5.2.1 COST APPROACH According to Youngman (1994), the cost approach "estimates market value on the basis
of a property's cost of construction, reduced to reflect obsolescence and physical depreciation"
(Youngman 1994, pg.34). According to Torries (1996), major cost categories consist of Direct
Operating Costs, Net Production Costs, Cash Break Even Cost and Total Cost. Total Cost is
actually the summation of the other cost categories.
In her book, Legal Issues in Property Valuation and Taxation: Cases and Materials,
Youngman, (1994) defines the cost approach as involving a determination of the current cost of

62
reproducing property less loss in value from deterioration and functional and economic
obsolescence-accrual depreciation. There are five steps involved in the cost approach:
o the estimate of the land value as if vacant,
o the estimate of the currents cost of reproducing or replacing the existing improvements
o the estimate of accrued depreciation from all causes,
o deduction of accrued depreciation estimate to arrive at indicated value of
improvements,
o the addition of the land value to the indicated value of the improvements to develop indicated property value.
In information filed to the West Virginia State Tax Department, the cost approach
for an electric generation facility includes:
! Electric generation facility in service ! Materials and supplies
Less: - Locally assessed property - Pollution control facilities - Plant under capital lease
Less:
- Depreciation
Plus:
- Depreciation on Locally assessed property - Depreciation on Pollution control
The cost approach is considered a meaningful tool for estimating market value
under certain conditions. Three cost concepts have potential application to utility properties --
replacement, reproduction, and historical. The relevance of these concepts vary depending upon
economic and regulatory influences on the market. (Assessor’s Handbook, 2000)

63
Reproduction cost may be different from replacement cost. It is the cost of an exact
duplication insofar as is possible of an existing facility. This cost concept also has relevance as a
value indicator whenever the market forces permit returns satisfactory to investors. Replacement
cost, in comparison, is the estimated cost to construct a property that is equivalent to the property
being appraised in terms of utility as of the valuation date. It is this concept of cost that is
validated by the principle of substitution since a rational person will pay no more for a property
than the cost of acquiring a satisfactory (not necessarily identical) substitute property. In the
case of electric utility generators, the most desired and efficient plant replacement would be gas-
turbine technology.
The most difficult aspect of the replacement cost approach is estimating depreciation.
Depreciation is the difference between the present value of the property being appraised and the
present value of a hypothetical newly built modern plant of equivalent utility. The three
generally accepted means of estimating depreciation include the market method, the percent
good method, the straight-line or age-life method, the observed condition method, and the
production output or services hours’ method.
According to the Assessor’s Handbook (2000), most assessors use the percent good
factor. To say a plant is 80% good is to say that depreciation is 20%. The calculation for
replacement cost new is:
Replacement Cost New (RCN) x % good factor = Replacement Cost New less Depreciation.
This produces an estimated market value for each type of property. The summation of all these
properties is the estimated market value of the unitary property from the cost approach.

64
Some adjustments to the initial value indicator should be considered. These include but
are not limited to:
• Nontaxable property and property assessed elsewhere
• Construction work in progress
• Leased property
• Taxable possessory interests
• The value of property that is exempt from taxation (including the value of intangible assets and rights) or the value of property that is taxed in a different manner should be excluded from the replacement cost indicator.
5.2.2 INCOME APPROACH Youngman's (1994) definition of the income or earnings approach "determines value by
reference to the property's income-producing capacity under typical management." (Youngman,
1994, pg.35). The four steps involved in the income approach involve:
• Obtain the rent schedules and the percentage of occupancy for the subject property and for comparable properties for the current year and for several past years. This information provides gross rental data and the trend in rentals and occupancy. This data is then compared and adjusted to an effective estimate of gross income, which the subject property may reasonable, be expected to produce.
• Obtain expense data, such as taxes, insurance and operating costs being
paid by the subject property and by comparable properties. The trend in these expenses is also significant.
• Estimate the remaining economic life of the building to establish the
probable duration of its income, or, alternatively, estimate the suitable period of ownership before resale.
• Select the appropriate capitalization method and the applicable technique
and appropriate rate for processing the net income.
The income approach to value is considered an excellent method to estimate

65
market value if reliable economic data are available. Application of the approach requires
estimating future annual income and converting that income into a value estimate by means of a
capitalization rate. The critical ingredients of the approach are future income, duration of the
income, capitalization rate, and method of capitalization. (Assessors' Handbook, 2000)
Income can be defined as the amount of money a project produces after expenses
(except depreciation), but before interest and income taxes are paid. Depreciation is the recovery
of a non-cash yearly expense based on the original investment and age of the asset. The
capitalization rate or discount rate is the cost of money, including debt and equity. It is used to
calculate the present or future value of income at a particular point in time. Capital structure is
that proportion of an electric utility’s debt and equity.
Valuing an electric utility involves estimating future economic performance. There are
several ways to define the financial performance of an electric utility. Estimating “free cash
flow” is the most important measure of “earnings” for valuation purposes. Earnings are also
called net income or profit. (Hayward and Schmidt, 1999).
The income to be capitalized is future net income that can reasonably be
anticipated by a prospective purchaser. This "principle of anticipation" was explained by the
Court in De Luz Homes, Inc. v, County of San Diego, (1955) 45 Cal. 2d 546, as follows from
Bonbright.(1937):
The net earnings to be capitalized,…are not those of the present owner, but those that would be anticipated by a prospective purchaser.
'Anticipated future earnings is the sole matter of consequence, since reported earnings are already water under the mill.'
Income forecasting is usually done at the net income level. A current annual
66
gross income estimate for the property is reduced by normal operating expenses to arrive at net
income. The appraiser then estimates what shape that net income will take in the future. It is
this future net income stream that is capitalized into value.
Income projections for utility property normally start with an analysis of current financial
statements since investor decisions are based on this same data source. For growth-oriented
properties analysis of the current year's operating statements is usually preferable; past earnings
may give little insight into the future when annual investments in new plants are in millions of
dollars. For nongrowth companies, it may be reasonable to analyze past earnings over a longer
period of time. Some appraisal authorities advocate analyzing at least a five-year history of
earnings in order to level out the peaks and valleys. Income projections, however, should be
based on the purchasing power of the dollar as of the appraisal date. Averaging five-year old
dollars with current dollars may result in major income distortions because of inflation. Inflation
can be treated consistently by adjusting historical earnings to current dollars prior to using that
data to forecast future income; consistent application requires capitalizing income at a rate based
on the current cost of capital. (Assessor's Handbook, 2000)
Analysis of operating statements may require reconstructing income and expenses for
various reasons. For example, recent rate changes, which are not fully reflected in current
operating statements, may have to be adjusted to a full year basis. Similarly, expenses that are
unusual and nonrecurring may have to be deleted. The objective of this analysis is to arrive at a
net income figure that, from a buyer's viewpoint, is probable and likely for the subject property.
For property tax purposes, the level of income that is capitalized is typically a "net" income prior
to any deductions for interest, corporate income taxes, ad valorem taxes, or depreciation. Interest
expense is an indication that a portion of the capital is borrowed, and this fact should not lower

67
the value of the unitary property. Debt interest expense is accounted for in the capitalization
rate, so interest cannot properly be deducted from income as an expense. Corporate income and
ad valorem taxes are legitimate operating expenses and must be considered as such. Tax
allowances should approximate the amount of taxes that would be anticipated by a prospective
purchaser. Since both income and ad valorem taxes are a function of either income or value, and
since both income and value are being estimated, it is preferable to provide components in the
capitalization rate for these taxes instead of deducting them from income. State income and ad
valorem tax components cannot be accurately estimated for interstate companies because out-of-
state tax rates necessary for the computation are usually unknown to the appraiser, so in those
cases such taxes should be directly deducted from income. (Assessor's Handbook, 2000)
Depreciation, as reflected in operating statements, is not such a cash outlay but rather a
bookkeeping allocation of a portion of a prior accounting period's investment to current expense.
Therefore, for purposes of income capitalization or discounting a cash flow, book depreciation is
not an expense. In the De Luz decision, the court dealing with the question of expensing
depreciation pointed out that to estimate depreciation the appraiser must preconceive a capital
value and that to include an expense based on the very answer you seek is an error. The investor,
however, is entitled to recapture his investment as well as earn a return in it. The court further
held that capital recovery is correctly handled by including a recapture component in the
capitalization rate. (Assessor's Handbook, 2000)
The behavior or shape of the future income stream must be estimated and projected over
the remaining life or expectancy of the unitary property. An exact prediction of the behavior of
income is not possible or necessary. It is sufficient to estimate future income behavior that a
prospective purchaser would anticipate. The purchaser's estimate would be based upon the

68
probable or likely "net income" or cash flow over time. Actual incomes fluctuate, but an
estimate by a buyer would likely be a smoothed or averaged income projection. (Assessor's
Handbook, 2000)
Growth in the consumption of the services or product on a per customer basis has been
characteristic of the utility industry. The growth rate varies among utilities and can be expected
to continue to vary depending, in part, on spatially diverse regulatory attitudes about
conservation. The growth in consumption per consumer causes income to rise. Another factor
that needs to be considered when projecting income is that as assets are used and become older,
there is a tendency for their efficiency to decline. This decline in efficiency causes costs to rise
and may cause net income to decline. All of the above factors complicate the estimation of the
behavior of the income stream. Some plausible arguments can be advanced for using either an
inclining income premise or a declining income premise. A constant or level income premise
may be the best fit if the factors influencing income changes are offsetting. In any event, the
appraiser's estimate should fit the expectations of investors who constitute the market for the
property being appraised. The income premise selected is only an estimation or projection of the
probable behavior of the income over time. It is not used as a means of providing for risk or the
likelihood that the income will or will not be received. Those factors are properly reflected in
the capitalization rate. (Assessor's Handbook, 2000).
Utilizing the income approach requires the estimation of the duration of a property’s
earning potential. Land has the capability to earn income forever while improvements and
personal property have limited economic lives. Utilities are made up of a large percentage of
assets that have terminal lives. These assets are continually replaced so that in reality the
companies have infinite economic lives.

69
In some states, the unitary value of a utility must reflect only the value of the property
that exists on the lien date. Future income growth and endurance resulting from future
investment should not be considered in the income amount and duration estimates unless the
costs of these future investments are expensed from the projected income stream. Otherwise,
this may result in valuing property that does not exist on the lien date.
Capitalization of income for a limited duration requires an estimate of remaining life.
Under the unit concept, the net income stream should not be fragmented but rather should be
capitalized in total for a single period. A composite life expectancy can best be estimated by
analyzing the life expectancies of the various assets that make up a company’s unitary property.
There should be a weighting of relative importance of each asset’s contribution to remaining life;
this weighting can be done on the basis of historical, reproduction, or replacement costs.
Replacement cost is considered the best premise because it gives consideration to current price
levels.
Capitalizing income on a perpetual basis requires making in-depth studies of replacement
costs and replacement patterns. The replacement costs of assets having the same quality and
capacity as the existing assets must be deducted from the income stream. It is this provision for
future replacements, above and beyond the normal maintenance and repairs associated with the
unit that perpetuates the income life.
A major problem with the approach is that most replacements are not exact
replacements; they are also improvements which increase plant quality and capacity. Utilities
not only upgrade but they also maintain their operations. If the cost of investment in new plant
or replacements that increase capacity is to be expensed against income, then the projected

70
income stream must also include the income potential of the future investment. (Assessor's
Handbook, 2000).
The income method approach assumes that property is worth the present value of the
income stream it can generate. Under traditional regulation, utilities project future income based
on rate of return on rate base discounted by the market cost of capital. If market cost of capital
approximates the allowed (and assumed achieved) rate of return, the income indicator will
approximate the rate base.
Under deregulation, an appraiser must estimate prospective income a utility’s
generating plant is expected to earn based on a reasonable projection of electricity market prices
and how they will affect the plants dispatch. Operating costs, such as fuel prices, also are
projected and discounted to present value. To make these projections, an appraiser can
commission studies from energy and economic forecasting firms specifically for the plant at
issue or use reports from the Energy Information Administration or the Gas Research Institute,
which provide a more global perspective. The utility can also use price projections that it has
used to conduct studies of stranded cost recovery. These studies typically provide the portion of
net book cost the utility would likely not recover, and by extension, what an investor likely
would not purchase. If the assessment is based on net book value, such studies will prove useful
to benchmark property values. Depending upon the quality of the study, it may be combined
with competent appraisal evidence and used to prove a value reduction in court. If a plant is
already producing primarily for a wholesale market, then competitive prices could be projected.
State law should be examined to determine if using an income stream based on rate base or
including stranded cost recovery allowances would improperly set the value of the property
based on the owner’s use rather than its FMV or by valuing intangible assets. Fair market value

71
is based on hypothetical buyers and sellers in the marketplace. If the only buyers would be
independent power producers, their purchase price would be based only on the value of the
tangible assets. Only the utility-not an independent power producer-would have the ability to
collect both the income from rate base or stranded costs. Under most state laws, prices from
above-market power purchase agreements should not be used to project income since doing so
will value the non-taxable intangible contract rights rather than the tangible property comprising
the power plant. (Schneider, 1998).
5.2.3 COMPARABLE SALES APPROACH The comparable sales approach or market data approach involves an analysis of sales of
property similar to the property under question (Youngman, 1994). This approach involves five
steps:
• Research similar properties for which similar sales, listings, offerings, and/or rental data are available.
• Determine the nature of the conditions of the sale, including the price, terms,
and motivating forces.
• Analyze each of the comparable properties' attributes with those properties being appraised under the general characteristics of time and location including physical and economic characteristics.
• Consider the dissimilarities in the above step in terms of their probable effect
on the sale price.
• Determine in light of the comparisons an opinion of the relative value of the subject property as a whole or by applicable units being compared to similar properties.
In a hearing before the West Virginia Public Service Commission
(Chernick, 1999), testimony was given as to the market value for generation assets of West
Virginia utilities. This market value was based on an analysis of the actual prices of comparable

72
capacity sold for use in the electric generation market. In this analysis it was concluded WV
generating assets exceed book value implying a negative stranded cost.
Auction, sale, spin-off, or some other market process implements market valuation
methods. In a study of electric transition costs (Hirst, Baxter, and Hadley, 1997), the contention
is that the sale price obtained through an auction, by comparison, defines the current market
price of an asset. The sale price should reflect the buyer's estimate of the net present value of the
revenues to be generated by the asset (electricity produced and the market price of power) minus
the ongoing costs of the asset (fuel plus O&M), plus any salvage value. Auctions eliminate the
need for regulators to estimate future production, book value, or market prices for electricity. All
of that is left to the bidders.
Based on testimony before the WV PSC, Howard W. Pifer III (1999) testified as to the
drawbacks of the comparable cost approach of valuation. The main argument is that
"comparables" are not always comparable. When comparing generation assets it should be noted
what the similarities and differences are among the assets. Location is important because of
access to fuel sources and to transmission facilities and consumers. Other considerations are that
the "potentially stranded assets have to be very similar in operating parameters and costs and in
the same market as the candidate comparable transaction, or the prices of the candidate
comparable transactions must be quantitatively adjusted to account for any differences".
The comparative sales approach is seldom applicable to utility properties since
they infrequently sell. Moreover, the few sales that do occur are difficult to analyze because
such transactions usually include subsidiary companies, have complicated financial
arrangements, and often include only a portion of the unitary property. The approach should not

73
be ignored when sales exist, but careful analysis is required before a sale can be used as an
indicator of value.
The market value concept assumes a typical prospective buyer exists for the
property being appraised. Since utility properties are unique and rarely sold, the type of buyer is
reasoned to be someone who would use the property in a similar manner as the present owner
unless the property clearly has a more probable use. The prospective buyer would have a similar
capability, knowledge, and credit rating as the present owner and would take ownership of the
property under the assumption that ad valorem and income taxes would continue. In California,
where electric generation deregulation has been ongoing, utilities have sold portions of unitary
properties, such as distribution systems and rights-of-way, to tax exempt agencies. Since tax-
exempt agencies usually do not pay ad valorem or income taxes, do not have rates that are
regulated, and can borrow money by issuing tax-exempt securities, they have many advantages
that do not exist for a typical buyer. (Ruff, 1999). These advantages, together with the right of
condemnation, have resulted in the sales prices of such properties taking place at amounts
equivalent to reproduction cost less depreciation. Such sales do not meet the definition of a
market value transaction and should not be used as an indicator of market value. Moreover, the
sale of a fractional part of a unit has doubtful validity as an indicator of the value of an entire
unit. (Assessor’s Handbook, 2000)
Usually corporate acquisitions are accomplished by mergers. In these cases, control of
the corporation's assets is acquired. While such acquisitions are not outright sales of the tangible
assets subject to ad valorem, they are the equivalent of sales of the assets since complete control
of the assets is acquired. Application of the comparable sales approach must include analysis of
these transactions.

74
The market-comparable approach considers numerous factors simultaneously and
provides a straightforward characterization of how investors perceive value. The market-
comparable approach's foundation is the identification of market transactions comprising either
the acquisition of power assets or the purchase of publicly traded securities of companies that
operate power assets. Thus, the market approach can be segregated into two subsets: the capital-
market approach and the comparable-transaction approach.
The comparable-market approach compares the subject facility with public companies
that possess similar growth prospects and business risks that trade on organized capital-market
exchanges. The comparable public companies should exhibit characteristics that are
representative of an independent power plant. Companies that develop and operate independent
power plants are considered comparable companies when they exhibit characteristics that are
consistent with the subject facility.
With the capital market approach, the capital markets in the form of a price-to-earnings
ratio incorporate an investor’s expectations concerning future cash flows and the perceived risk
of the earnings. The price-to-earnings ratio offers a measure of investors' expectations
concerning the perceived attractiveness of future cash flows. The product of the price-to-
operating earnings multiple and the facility's operating earnings provides an estimate of the value
of the facility. (Ellsworth, 1994)
5.2.4 STOCK AND DEBT APPROACH
The stock and debt approach is another method for valuing utilities. A study
of the yield and direct capitalization methods of the electric utility industry was conducted to
determine the accuracy of this method for appraisal purposes. (Simonds, 1999) In this study
current stock prices of the subject firms were observed. The empirical results suggest that direct
capitalization is a more accurate estimation procedure than yield capitalization.
75
According to the Assessors' Handbook (2000); the stock and debt approach is based upon
the accounting equation that the value of the assets equals the value of the liabilities plus net
worth. Market values of the long-term debt, current and deferred liabilities, and capital stock are
estimated, and the sum of these amounts is held to equal the value of the total corporate assets.
The value of the total corporate assets includes nonunitary and nontaxable assets; therefore,
value allocations and deductions must be made to arrive at a value estimate for the unitary
property. These value adjustments should be made on the basis of the value the securities market
places on the deductible assets. In some cases, a further allocation is required to separate West
Virginia property from property located in other states.
The stock and debt approach has many limitations. It cannot be applied to all companies
because sometimes there is little or no trading of the securities. Furthermore, a utility may be
part of a larger holding, and the parent company may be involved in other financial endeavors.
The necessity to use a series of allocations, including allocations between companies and
between states, greatly weakens the validity and reliability of the approach.
Another major limitation occurs when the stock and debt approach stems from the
nature of the rights involved in a stock transfer. The usual purchaser of stock acquires ownership
rights in the corporation, but this is an ownership without control. The stockholder has the right
to vote, but he has no effective control or liability such as occurs when someone buys property in
his own name. The purchase of enough stock to actually gain control of the corporation is
usually made at a price higher than the price at which the stock is typically traded. A study of
tender offers will illustrate this contention. This may indicate that typical stock prices do not
effectively measure the advantages of ownership and control, which are inseparable in
noncorporate property. Despite these limitations, the stock and debt approach has some validity.

76
Well-informed investors do acquire stock based on analysis of a company's present and future
earning capacity. The approach is meaningful when market participants have sufficient
information to accurately measure the present value of future benefits likely to accrue to the
corporation. (Assessors' Handbook, 2000)
The first step in applying the stock and debt approach is the valuation of the common and
preferred stock and the long-term debt. Valuation is based upon the prices paid in the securities
market. The data from more actively traded and widely held securities are presumably more
accurate. If the securities are not traded, the validity of the approach is questionable. However,
it is possible to use the method if some of the debt is not publicly held by estimating its value on
the basis of the prices of comparable securities. It is also possible to use the method if a
reasonable market price for the common stock can be developed.
The use of sales prices can be a problem since prices of securities usually fluctuate daily.
Some experts believe the lien date price should be used; others feel an average of prices is
preferred. In most case, the average of monthly high and low prices for the previous calendar
year is used in order to eliminate any unusual or temporary market reaction not related to the
value of the property.
The value of current and accrued liabilities, with some exceptions, must also be included
in the gross stock and debt value. Current liabilities represent short-term debt and are a source of
money or credit that can be used for the acquisition of assets. Current liabilities are usually
valued at book value. However, dividends declared unpaid are a liability, which is not included
in the gross value because this value is already reflected in the stock prices.
Each one of the accrued liability accounts must be considered and, if it is a source of
money or credit that can be used for the acquisition of assets which add to the value, it must be

77
included in the gross stock and debt value. Some deferred credits may be worth less than book
value. Each account must be considered on its own merits and a determination made as to
whether it should be included in the gross stock and debt value.
If leased property is included as part of the appraisal unit, the value of such property must
also be added to the gross stock and debt value. Leased assets are not part of the unitary property
in some cases.
Certain deductions are made from the gross stock and debt value. Deductions are
itemized and should be made at the value placed on the asset by the securities market because the
gross value is based on the securities market. Current assets are deducted since these represent
cash and special deposits and notes and accounts receivable, which are nontaxable items.
Prepayments are also deductible since no asset is on hand. Materials and supplies are deducted
initially and added back since they represent a part of the subject valuation. Other deferred
charges are also deductible. Book cost is presumed to be a good measure of the value of the
deductible assets.

78
Chapter 6
Power Plant Valuation
6.0 INTRODUCTION
To demonstrate how each valuation approach determines value, an example of each is
applied to Appalachian Power (AP) assets. Information on AP assets was obtained from the
West Virginia (WV) State Tax Department. This information includes, costs, income, and
financial data necessary to conduct the income, cost and, stock and debt approach. Information
for the replacement cost and comparable sales approach was obtained from the EIA and
documented testimony before the WV Public Service Commission.
6.1 VALUATION OF APPALACHIAN POWER PLANTS IN WEST VIRGINIA
The following tables outline four valuation assessments for AP assets. The first three
approaches (cost, income, stock & debt) are valuations based on information from the West
Virginia State Tax Department. Data used to conduct these valuations are held at the state tax
department. Some of the financial data are considered sensitive and are not reported. These
valuations are based on calendar year 1998 and were to be utilized for the 2000 tax year.
6.1.1 COST APPROACH
The WV cost approach is based on historical costs to include original construction
and any improvements in the form of materials and supplies. This original cost is depreciated to
obtain book value. Other considerations are the investment in pollution control facilities and any
capital leases, if any. Allocations refer to the percentage of value that is taxed by the state of
WV. Table 5 provides a summary of the data provided by the WV department of taxation that
are the basis of the cost approach valuation for AP assets in WV.

79
Table 6.1. Cost approach for AP assets
COST APPROACH SYSTEM ($) WV ($) WV ALLOCATION ($) Plant in Service 4,877,421,785 2,828,319,482
Materials & Supplies +87,360,815 +55,999,332
SUB TOTAL =4,964,782,600 =2,884,318,814
Less: Locally assessed property
0 -3,293,572
Pollution control facilities 0 -308,553,684
Plant under capital lease 0 -2,572,471,558 51.8144%
Less: Depreciation
-1,952,792,667 -1,243,471,558
Plus: Depreciation on locally assessed
0 0
Depreciation on pollution control +158,374,217
SUB TOTAL 3,011,989,933 1,487,349,872 49.3810%
Less: Obsolescence
0 50.5977%
COST VALUE 3,011,989,933
Source: Appalachian Power Valuation Calendar Year 1998, 1999
6.1.2 INCOME APPROACH
The current WV income approach to valuation of AP plants in WV is based on historical
earnings for five previous years as depicted in table 6. Earnings are analyzed to determine
percentage increases or decreases over this time period. Operating revenue minus expenses
yields net operating income; the most recent year’s net income is averaged with the previous four
years to compute average net income. This average income is capitalized based on the WACC
formula (as discussed in section 5.1). Working capital is deducted from the capitalized income
to arrive at the current income value of the plant. The only difference between the WV method

80
and a traditional income approach is that WV utilizes historical income. In a deregulated
environment, this income would be based on income projections derived from the projected
market price for electricity. Theoretically, the values should be similar.
Table 3.2. Income approach for AP assets
INCOME APPROACH SYSTEM ($) TREND NET PLANT 1998 NET PLANT 1997 NET PLANT 1996 NET PLANT 1995 NET PLANT 1994
2,924,629,118 2,889,336,746 2,792,739,289 2,738,920,449 2,657,640,481
TRENDED PRCT 1998 TRENDED PRCT 1997 TRENDED PRCT 1996 TRENDED PRCT 1995 TRENDED PRCT 1994
OPERATING REVENUE 1998 OPERATING EXPENSE 1998 NET OPERATING INCOME 1998
1,672,243,716 -1,438,796,365 =233,447,351
NET INCOME 1998 NET INCOME 1997 NET INCOME 1996 NET INCOME 1995 NET INCOME 1994
233,447,351 239,992,827 242,875,994 233,716,624 204,290,853
TRENDED NET INC. 1998 TRENDED NET INC. 1997 TRENDED NET INC. 1996 TRENDED NET INC. 1995 TRENDED NET INC. 1994
AVERAGE INCOME 230,864,730
INCOME TO CAPITALIZE 242,000,000
CAPITALIZATION RATE 8.6% See table 7 below
CAPITALIZED INCOME 2,791,234,141
Less: Working capital
-68,732,173 See table 7 below
NET CAPITALIZED INCOME 2,722,501,968
PERCENTAGE 1.000000 1.012215 1.047226 1.067804 1.100461
233,447,351 242,924,339 254,346,056 249,563,546 224,814,116
241,019,082
Source: Appalachian Power Valuation Calendar Year 1998, 1999

81
Table 6.3. Capitalization rate and working capital
BAND OF INVESTMENT CAP. RATES
Common 1,103,551,868 Preferred 41,668,700 Short Term Debt 76, 400,000 Long Term Debt 1,552,454,808 TOTAL 2,774,075,376
Equity Rate 11.00% Preferred Rate 6.75% Short Term Debt 6.00% Long Term Debt Rate 7.19%
CAPITALIZATION RATE 8.6%
WORKING CAPITAL
(30 DAYS OF OPERATING COSTS) OPERATION & MAINTENANCE EXPENSE 1,127,902,156 LESS: PURCHASED POWER - 303,116,085 NET EXPENSES = 824,786,071
1/12 NET EXPENSES = 68,732,173
Source: Appalachian Power Valuation Calendar Year 1998, 1999 6.1.3 STOCK AND DEBT APPROACH
The WV stock and debt approach is based upon the accounting equation that the
value of the assets equals the value of the liabilities plus net worth. Market values of the long-
term debt, current and deferred liabilities, and capital stock are estimated, and the sum of these
amounts is held to equal the value of the total AP assets located in WV. As depicted in table 7,
the value of the total corporate assets includes nontaxable assets; therefore, value allocations and
deductions must be made to arrive at a value estimate for the unitary property. These value
adjustments should be made on the basis of the value the securities market places on the
deductible assets

82
Table 6.4. Stock & debt approach for AP assets
STOCK & DEBT APPROACH
Stock Value + 1,450,000,000 Preferred Stock + 42,768,700 Long-Term Debt + 1,638,70,000 Current Liabilities + 412,224,941 Gross Stock & Debt = 3,543,693,491 Less: Non-operating property @ 14.3% (see below) - 506,748,191 Stock & Debt Value = 3,036,945,450 STOCK VALUATION # OF SHARES AVERAGE PRICE VALUE Parent Company Stock Value 190,800,00 42 + 8,013,600,000 Total Utility Stock % * 18.7% (see
below)
Utility Stock Value = 1,498,543,200 NET EARNINGS P/E RATIO Utility Stock Value 117,249,312 12 =1,406,991,744 SAY =1,450,000,000 Net Value LONG TERM DEBT VALUATION
Market Value of Debt-reported 7.19% =1,638,700,000 INTEREST EXPENSE DEBT RATE Market Value of Debt-calculated 56,296,499 7.50% 750,619,987 45,578,689 6.75% 675,239,837 15,875,500 5.50% 288,645,455 = 117,750,688 6.87% = 1,714,505,278 SAY 7.19% = 1,638,700,000 UTILITY STOCK EARNINGS %
PARENT UTILITY PECENTAGE
1998 536,200,000 95,956,012 17.9% 1997 620,400,000 113,508,000 18.3% 1996 587,400,000 117,751,000 20.0% SAY 18.7% NON-OPERATING NON-OPERATING TOTAL PERCENTAGE Income influence 5,959,079 242,000,000 2.5% Cost Influence 504,151,978 3,516,141,911 14.3% SAY 14.3% STOCK & DEBT VALUE = 3,036,945,450 Source: Appalachian Power Valuation Calendar Year 1998, 1999 6.2 CURRENT APPALACHIAN POWER VALUES
The three valuations of AP assets conducted by the West Virginia Tax Department result
in the following values:
• Cost Value (Regulated): $3,011,989,933
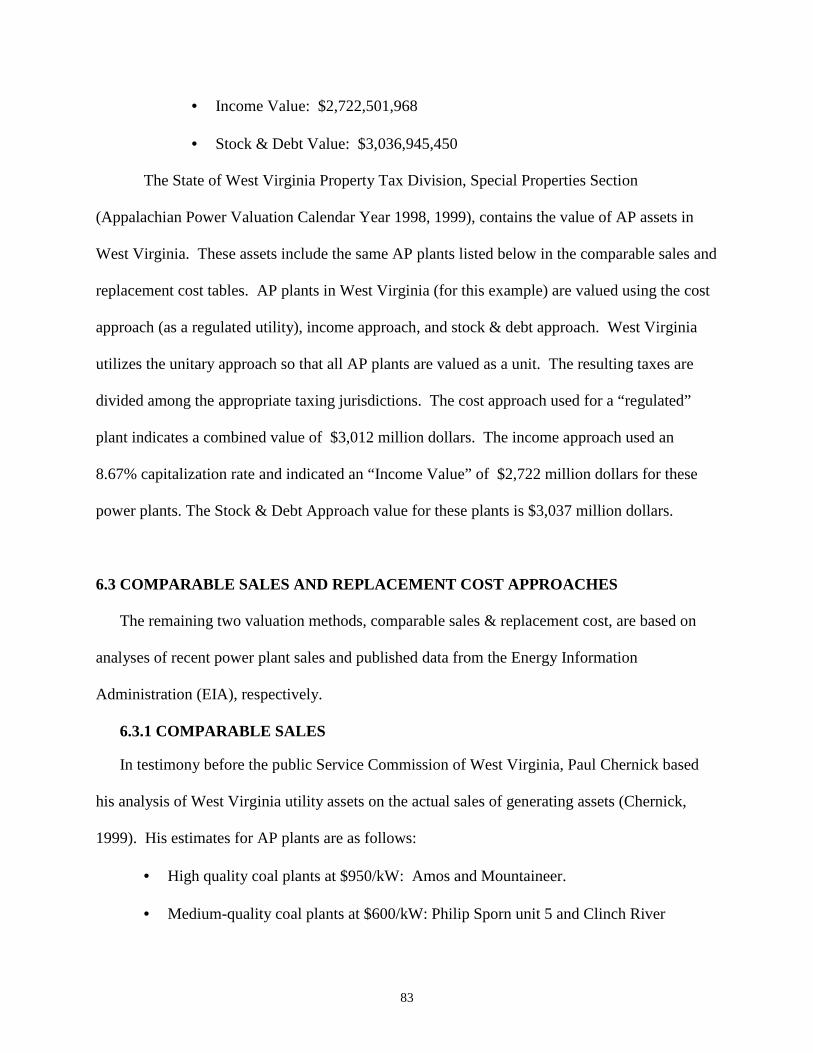
83
• Income Value: $2,722,501,968
• Stock & Debt Value: $3,036,945,450
The State of West Virginia Property Tax Division, Special Properties Section
(Appalachian Power Valuation Calendar Year 1998, 1999), contains the value of AP assets in
West Virginia. These assets include the same AP plants listed below in the comparable sales and
replacement cost tables. AP plants in West Virginia (for this example) are valued using the cost
approach (as a regulated utility), income approach, and stock & debt approach. West Virginia
utilizes the unitary approach so that all AP plants are valued as a unit. The resulting taxes are
divided among the appropriate taxing jurisdictions. The cost approach used for a “regulated”
plant indicates a combined value of $3,012 million dollars. The income approach used an
8.67% capitalization rate and indicated an “Income Value” of $2,722 million dollars for these
power plants. The Stock & Debt Approach value for these plants is $3,037 million dollars.
6.3 COMPARABLE SALES AND REPLACEMENT COST APPROACHES
The remaining two valuation methods, comparable sales & replacement cost, are based on
analyses of recent power plant sales and published data from the Energy Information
Administration (EIA), respectively.
6.3.1 COMPARABLE SALES
In testimony before the public Service Commission of West Virginia, Paul Chernick based
his analysis of West Virginia utility assets on the actual sales of generating assets (Chernick,
1999). His estimates for AP plants are as follows:
• High quality coal plants at $950/kW: Amos and Mountaineer. • Medium-quality coal plants at $600/kW: Philip Sporn unit 5 and Clinch River
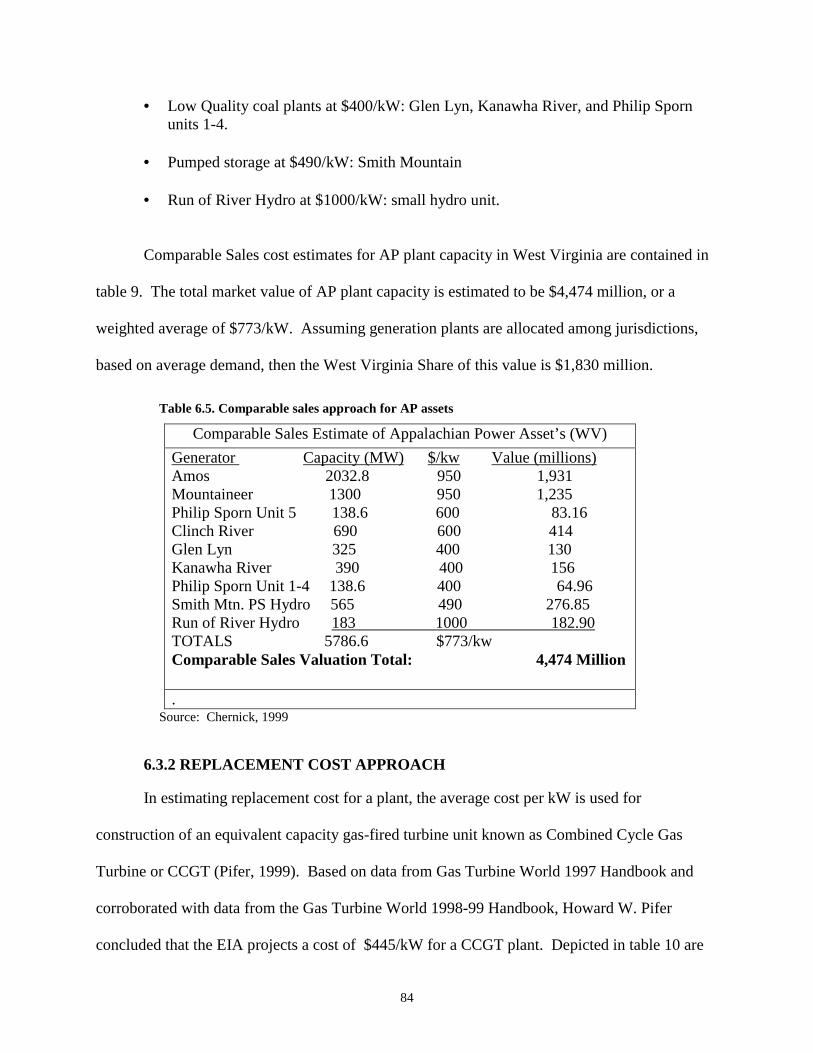
84
• Low Quality coal plants at $400/kW: Glen Lyn, Kanawha River, and Philip Sporn units 1-4.
• Pumped storage at $490/kW: Smith Mountain • Run of River Hydro at $1000/kW: small hydro unit.
Comparable Sales cost estimates for AP plant capacity in West Virginia are contained in
table 9. The total market value of AP plant capacity is estimated to be $4,474 million, or a
weighted average of $773/kW. Assuming generation plants are allocated among jurisdictions,
based on average demand, then the West Virginia Share of this value is $1,830 million.
Table 6.5. Comparable sales approach for AP assets
Comparable Sales Estimate of Appalachian Power Asset’s (WV) Generator Capacity (MW) $/kw Value (millions) Amos 2032.8 950 1,931 Mountaineer 1300 950 1,235 Philip Sporn Unit 5 138.6 600 83.16 Clinch River 690 600 414 Glen Lyn 325 400 130 Kanawha River 390 400 156 Philip Sporn Unit 1-4 138.6 400 64.96 Smith Mtn. PS Hydro 565 490 276.85 Run of River Hydro 183 1000 182.90 TOTALS 5786.6 $773/kw Comparable Sales Valuation Total: 4,474 Million
.
Source: Chernick, 1999
6.3.2 REPLACEMENT COST APPROACH
In estimating replacement cost for a plant, the average cost per kW is used for
construction of an equivalent capacity gas-fired turbine unit known as Combined Cycle Gas
Turbine or CCGT (Pifer, 1999). Based on data from Gas Turbine World 1997 Handbook and
corroborated with data from the Gas Turbine World 1998-99 Handbook, Howard W. Pifer
concluded that the EIA projects a cost of $445/kW for a CCGT plant. Depicted in table 10 are

85
the AP generators, capacity, estimated $/kw and the total value in dollars. The two components
for developing the capital costs of new CCGT capacity are: the turnkey costs, and “soft” costs
such as cost for land, infrastructure and interconnection with the electric grid.
Table 6.6. Replacement cost approach for AP assets
Replacement Cost Estimate of Appalachian Power Asset’s (WV) Generator Capacity (MW) $/kw Value (millions) Amos 2032.8 445 904.596 Mountaineer 1300 445 585 Philip Sporn Unit 5 138.6 445 62.37 Clinch River 690 445 310.50 Glen Lyn 325 445 146.25 Kanawha River 390 445 175.5 Philip Sporn Unit 1-4 138.6 445 73.08 Smith Mtn. PS Hydro 565 445 254.25 Run of River Hydro 183 445 82.305 TOTALS 5786.6 Replacement Cost Valuation Total: 1,784 Million
Source: Pifer, 1999.
The $1,784 million dollar replacement cost for all of West Virginia AP assets is
significantly lower than the $4,474 million dollar estimate based on comparable sales data. The
replacement cost data should not contain any intangibles whereas the comparable sales cost will
contain intangible value.
6.4 SUMMATION OF VALUES
Information contained in table 11 indicates the valuation difference among the five
approaches. The least cost value is the replacement cost as opposed to the higher cost of the
comparable sales value. This difference can be defined by the existence of intangible value in
the comparable sales method of valuation. Other added value in the comparable sales may also
reflect the current market conditions in which power plant sales are taking place. The regulated

86
cost value and the stock and debt value are very close. The income value interestingly reflects
the difference between the replacement value and the comparable sales value. This could make
the income approach the best indicator of value for the implied bundle of intangible assets.
Table 6.7. Comparative values for AP assets
Valuation of Appalachian Power Plant Generation Assets in West Virginia (in millions of dollars)
Combined Capacity (MW’s)
Cost (Regulated)
Income Replacement Cost
Comparable Sales
Stock & Debt
5,786.6
$3,012 $2,722 $1,784 $4,474 $3,037

87
Chapter 7
Summary & Conclusions
7.0 SUMMARY
The four valuation methods; income, stock and debt, replacement, and comparable sales,
were examined in theory and practice with the regulated cost approach to valuation used as a
check. All four methods are common appraisal methods used for ad valorem taxation purposes.
In the case of West Virginia, and many other states, property tax reform will be necessary
because of competitive costs and the concern for maintaining tax revenue neutrality.
Competitive costs will be an important factor especially under deregulation, which brings
competition from out-of-state electricity providers. Differential tax treatments with bordering
states will affect the price of electricity to customers. Also, competition will exist between other
providers within West Virginia such as the non-taxable municipal and federally owned utilities.
Currently, West Virginia has put their deregulation plans on hold while it studies a variety of
issues to include tax reform. One of the most important considerations in the choice of valuation
method is the use of intangible assets and their resulting effect on total value and indirectly on
tax revenue.
The ability to compete across state lines while containing costs is a regional issue. The
concept of an equitable revenue neutral tax structure is intended to retain a level of tax revenue
for taxing jurisdictions. Meanwhile the concept of a level playing field is intended to impose
equal treatment among all types of power generators as well as competing out-of-state electricity
providers. Because they are no longer allowed to recover costs through the regulated price of
electricity, electricity generators will no longer be guaranteed collectors of taxes.

88
The only aspect of the electricity industry to be deregulated is the generation sector;
transmission and distribution will still be regulated. Instituting a consumption tax on the
customer could make up for the loss in tax revenue that results from lower plant valuations. A
consumption tax will take place at the distribution level and not the generation level. Since, by
definition, distribution takes place within the state, such taxes would not be in violation of the
interstate commerce act. This is one way to make up for the loss in tax revenue. But it does not
solve the problem of power plants in adjoining states being valued differently. This can
seriously affect the ability to compete within the state.
In litigation cases, most school districts will probably seek to rely upon the comparable
sales approach to valuation to determine property tax values for utility assets. This approach
would create the largest amount of tax revenue compared to other valuation approaches. The
primary drawback with this method is that it inherently contains the value of the intangible assets
related to the plant. Most power plants are not purchased for their physical (tangible) assets only
but by their demonstrated market power, physical location (access to transmission line or fuel
sources), brand name/reputation, demonstrated management, or power purchase contracts.
Currently, the state of West Virginia is phasing out taxation of intangibles and will have to
reassess its valuation techniques.
With regard to intangibles, three of the valuation methods require further study and
analysis. When using the comparable sales approach, comparable properties are often sold in a
transaction that includes intangible assets and rights. The value of those intangible assets and
rights, as well as the value of assets other than the comparable property, must be removed from
the sale price before the sale is compared to the subject property. Anyone valuing property can
use any of the three additional approaches (cost, income, and market) to value those nontaxable

89
intangible assets and rights when necessary. If the subject property is part of the sale of a
business enterprise, the appraiser may wish to examine transaction documents that contain an
allocation of the purchase price to the various component assets. This allocation may or may not
be made based upon the fair market value of the various components.
If an income stream is generated in part by intangible assets and rights, then it may be
necessary to either attribute sufficient income to provide a return of and on the intangible rights
or remove the value of the intangible assets and rights from the income indicator after the income
stream has been capitalized or discounted to present value. A business may have valuable
intangible assets and rights even though the business may not generate sufficient income to
produce an adequate rate of return for the utility generator in question. In contrast, the
replacement cost approach serves as the best indicator of physical (tangible) value. The cost
efficiencies associated with gas turbine technology make it the best replacement choice in a
competitive market as well as the best choice for peaking power or additional capacity as
discussed in chapter 3. Most new power plants are based on gas turbine technology for their
base load.
The Stock & Debt Approach depends on the assumption that capital markets accurately
value financial claims, that is, that capital market prices reflect the intrinsic economic values of
the securities traded. Market efficiency refers to informational efficiency not operational
efficiency in how quickly and accurately a market processes trades. An obvious limitation to the
stock and debt approach is that it cannot be applied to value the property of a firm whose
common stock is not publicly traded.
Determining the value of deregulated utility assets is relatively new and the precedence
for using other methodologies is not yet set. The comparative sales approach is an inappropriate

90
method to value utility assets in a deregulated climate. This is due to the tendency of these sales
to be overvalued because of forced divestitures and investor attempts to expand markets through
purchases. It is difficult to omit this type of analysis in court cases involving judges, juries, and
less well informed attorneys because of the common use of this method in both residential and
commercial property valuations. Another aspect to the drawbacks of this method is that it is
based on nameplate capacity and not operating capacity. Many plants may be valued for their
potential and not their competitive operating levels.
Mandatory divestiture could result in significant losses of tax revenues for state and local
communities. Electric utilities pay billions of dollars in state and local taxes ($13.9 billion
nationwide in 1996) that are included in electricity rates. With the historically high tax rates
imposed on utilities, a prescribed sell-off of assets could have a devastating effect on tax
receipts, especially if they are sold to utility companies that have paid less in taxes.
The income approach assumes that buyers and sellers of property base their valuations on
the income that a property is expected to produce. The critical variables in the income approach
are the expected future income to be capitalized or discounted and the rate of
capitalization/discount. The income is based on a forecast of expected gross income and a
forecast of expected future operating expenses. The expected income stream of a power plant
used in the income approach is based on several assumptions. For a competitive electricity
market these assumptions will be based on the market equilibrium price and any fluctuations in
the customer base or competitive market can affect the value of the asset. In a competitive
environment the most efficient way to produce electricity is the method that maximizes the
difference between the value of outputs and the value of inputs. Theoretically, the income

91
approach should be the preferred valuation method especially with the transitional issues
associated with the competitive market.
7.1 CONCLUSION
If the value of deregulated utility assets is for the purpose of buying or selling utility
assets, then the income approach should be preferred and the comparable cost approach used as a
check. The “highest and best use” of the plant being valued should be considered in choosing
the proper valuation method. For the purposes of ad valorem taxation, the plant is assumed to be
utilizing all assets for the purpose of producing and selling electricity. In this case the income
approach could be used for states that tax tangible and intangible values.
The cost approach (replacement cost) typically includes only the tangible taxable
property so may not require removal of the intangible assets or rights. However, this does not
mean that the value as estimated using the cost approach sets a ceiling on values estimated using
the income approach or comparable sales approach, or that there is a restriction on using the
most appropriate method on arriving at fair market value. As with the comparable sales
approach, the replacement cost approach is also based on nameplate capacity. A plant valued
with this method could potentially be overvalued because it m ay not operate at its full potential
in a competitive market.
The court cases discussed indicate that an alternative approach may be to first use the
income approach to value utility assets, and then utilize the results from the comparable sales and
replacement cost approaches. The difference between the replacement cost value and the
comparable sales cost value or income approach value could be a good indicator of the value of
the intangible assets. This is based on the fact that power plant purchases inherently contain the

92
intangible assets that make the purchase desirable and the replacement cost is based on the
physical (tangible) assets.
In valuing utility property it is necessary to reconcile the values arrived at from the
different approaches. In theory, each approach to value should yield the same indication of
value. In reality, it is rare for any two approaches to yield the same value. Variations occur
because of the lack of adequate and reliable data as well as subjectivity when making
adjustments. And finally, the inclusion of intangible assets with the tangible property can
comprise the difference between values that have been arrived at. If the value derived from the
income approach is substantially higher than the value from the cost replacement approach then
the assumption is that the intangible assets make up the difference.
7.2 FURTHER RESEARCH REQUIRED
The issue of valuation for property tax purposes is important and requires further study.
The solution may be to institute a consumption tax but meanwhile valuation continues to take
place and some methods are being challenged in the courts. Valuation for deregulated utilities is
a hot topic in the power industry, accounting profession, taxation associations, with court cases,
and state legislators. Further research at the thesis or doctoral level could be conducted. As
power plant sales and divestitures increase, an econometric analysis for the comparable sales
approach might provide some insight into valuation. Research could also be conducted into a
method that could be used to separate out the intangible value of a power plant. This would be
helpful to states that do not tax intangible property. Another area for research could be the effect
of a consumption tax on the market.

93
References Cited
American Public Power Association (APPA). State Restructuring-State Tax Initiatives Related to Restructuring. http://www.appanet.org. July 2000
Appalachian Power Valuation Calendar Year 1998. West Virginia StateTax
Department. 2 Sep 1999
Assessor's Handbook 541. State of California, Office of Property Tax and Revenue. May 2000
Anderson, Susan E.. The State Tax Considerations of Electric Utility Deregulation.
Journal of State Taxation. Vol 18 No. 2, Fall 1999. pg. 17-29. Baxter, L. & E. Hirst. Estimating Potential Stranded Commitments for U.S
Investor-Owned Electric Utilities, ORNL/CON-406, Oak Ridge National Laboratory, Oak Ridge, Tn 1995
Bizyak, Melissa. Capitalization Rate Versus Discount Rate. Grossman, Yanak & Ford (GYF), Undated.
Blacconiere, W. G., Marilyn F Johnson, and Mark S. Johnson. Market Valuation
and Deregulation of Electric Utilities. Working Paper. June 17, 1999
Bonbright, James C. The Valuation of Property. New York. McGraw Hill Book Co
Bonbright, J., A. Danielson, and D. Kamerschen Principles of Public Utility Rates, 2nd ed., Public Utility Reports, Inc., Arlington, VA. 1988.
Borenstein, Severin, James Bushnell, and Christopher R. Knittel. 1999. Market Power in Electricity Markets: Beyond Concentration Measures. The Energy Journal, Vol. 20, No. 4, 1999
Chen, Houng-Yhi. Valuation Under Uncertainty. Journal of Financial and Quantitative Analysis, Volume 2, Issue 3, Sep. 1967, pg. 313-325
Chernick, Paul, Resource Insight, Inc. Direct testimony on Behalf of the Consumer Advocate Division of the Public Service Commission of West Virginia. Case No. 98-0452-E-GI. July 7, 1999.
Coggins, Jay S. An Arbitrage-Free Approach to Quasi-Option Value. Journal of Environmental Economics and Management 35, 103-125, 1998.
Coopers and Lybrand L.L.P. Electric & Gas Industries: Deregulation Raises State and
Local Tax Concerns. 1997.

94
Copeland, T., and J. Murin.. Valuation: Measuring and Managing the Value of Companies. John Wiley & Sons, New York. 1990
Deloitte and Touche. Federal, State and Local Tax Implications of Electric Utility Industry Restructuring. Dallas Texas, October 1996
Eckert, J., ed. Property Appraisal and Assessment Administration. Chicago, Ill.: The International Association of Assessing Officers. 1990.
Edison Electric Institute. Competition in Electricity Markets: The Case Against Forced
Divestiture. http:www.eei.org/issues/comp_reg/divest-3.htm. July, 1999
Ellsworth, Richard K. Valuation Analysis for Independent Power Project. Journal of Energy Engineering, Vol. 120, No.2 August 1994.
Energy Information Administration (EIA). The Changing Structure of the Electric Power Industry 2000: An update. DOE/EIA-0562(00). October 2000.
Grossman, Robert J. "What is a Discount Rate?" Grossman, Yanak & Ford (GYF). 2000. Hall, Bronwyn H., The Stock Market’s Valuation of R&D Investment during the 1980’s.
The American Economic Review, Volume 83, Issue 2. May 1993 259-264 Hayward, David L. and Michael R. Schmidt. Valuing an Electric Utility: Theory and
Application. Public Utilities Reports, Inc. Vienna, Virginia. 1999 Henszley, Benjamin N. Going Concern After Concord Control, Inc. Taxes, November 1983,
pg. 699.
Hirst, Eric., Lester Baxter, and Stan Hadley. Transition Cost Issues for US Electricity Utilities. Annual Review of Energy and the Environment, 1997. 22:119-54
Isard, Walter. The General Theory of Location and Space-Economy. Quarterly Journal of Economics, Volume 63, Issue 4. Nov. 1949, 476-506.
Joskow, Paul L. Restructuring, Competition and Regulatory Reform in the U.S.
Electricity Sector. The Journal of Economic Perspectives, Volume 11, Issue 3 (Summer, 1997), 119-138.
Krueger, A.O., 1974. The political economy of the rent-seeking society. American Economic
Review 64, 291–303.
Levin, Rich and Bill Driscoll. Electric Utility Deregulation and its Potential Tax Impact on Ohio School Districts with Electric Generating Plants. Report prepared for the Ohio School Boards Association. August 9, 1996.
Mahaffey, Doris. Re-Assessing Ohio’s Public Utility Property Tax in an era of Public

95
Utility Restructuring. Ohio Legislative Budget Office (LBO). Undated.
Manning, Lloyd R. Valuing the Small Business. Todd Publishing , Inc., Scottsdale, Arizona. 1993, Pgs 6-7.
Mobley III, T. Alvin. Defining and Allocating Going-Concern Value Components. Appraisal Journal. 65:323-33-, October 1997.
Moorhouse, John C. Competitive Markets for Electricity Generation. The CATO Journal Vol 14. No. 3. Winter 1995.
Murray, Jacqueline Phillips. Real Property Taxation of Utility Generation Facilities.
Letter, undated. Law Firm of Crane, Greene & Parente, Albany. N.Y.
Pifer, Howard W. III on Behalf of Monongahela Power Company and the Potomac Edison Company dba Allegheny Power. Direct testimony before the West Virginia Public Service. Case No. 98-0452-E-GI. July 6, 1999.
Public Service Commission, State of Georgia. Tax Implications of Restructuring
Georgia’s Electric Industry. July 14, 1997. www.psc.state.ga.is/electric/Reports.
Rabianski, Joseph S. Going-Concern Value, Market Value, and Intangible Value. Appraisal Journal, April 1996. pgs 183-194.
Reilly, Robert F. and Manoj P Dandekar. Valuation of Intangible Contract Rights. The CPA Journal, June 1997.
Ruff, Larry. Competitive Electricity Markets : Why They Are Working And How To
Improve Them. 12 May 1999. Harvard Electricity Group. http://ksgwww.harvard.edu/hepg/FPRuff599.htm. (Accessed: Nov 15, 2000)
Schneider, Steven P. Evaluating power plant property taxes under deregulation. Public
Utilities Fortnightly. Arlington, Va. March 1, 1998.
Schneider, Steven P. Deregulation. Journal of Multistate Taxation and Incentives. August 1999.
Shepherd, William G. Market Power in the Electric Utility Industry: An Overview. National Council on Competition in the Electric Industry. November 1997.
Shogren, Jason F. and Thomas D. Crocker. Risk and Its Consequences. Journal of
Environmental Economics and Management 37, 44-51, 1999.
Simonds, Richard R. Accuracy of the Yield and Direct Capitalization Methods: A Twenty-Year Empirical Study of the Electric Utility Industry. Assessment Journal. July/August 1999.

96
State Electricity Profiles 2000 – West Virginia. http://www.eia.doe.gov/cneaf/electricity/st_profiles/west_virginia/wv.html. (Accessed: Oct 9, 2000)
Tollison, R. Rent-seeking, A survey. Kyklos 35, pg. 575–602, 1982 Torries, Thomas F. Handbook of Mineral Project Evaluation. Society of Mining,
Metallurgy, and Exploration, Inc. November 1996. West Virginia Public Service Commission Report. Public Service Commission
of the State of West Virginia, pg. 14, 1997.
Youngman, Joan. Legal Issues In Property Valuation and Taxation: Cases and Materials. The International Association of Assessing Officers. 1994