valuing the multiple impacts of pesticide use in the uk: a contingent ranking approach
TRANSCRIPT

Journal of Agricultural Economics - Volume 51, Number I -January 2000 - Pages 1-21
Valuing the Multiple Impacts of Pesticide Use in the UK: A Contingent Ranking Approach
Vivien Foster and Susana Mourato
he contingent ranking method was used to estimate the value of the human health and biodiversity impacts associated with pesticide applications, using a “greenn consumer product as a payment vehicle. Specification testing showed that the standard conditional
logit model provides a representation of these data prejierabk to the rank-wdered logit variant. The resulting estimates - which p e r f m well in terns of standard validity tests - show that, on average, consumers are only willing to tohate between six and eight cases of human illness to save an entire species of farmland birds.
1. Introduction More often than not, the environmental damages associated with human activities art: not confined to a single dimension, but are rather multifarious in nature. Furthermore, the remedial measures that can be taken to attenuate environmental impacts frequently reduce damages along one dimension only at the expense of increasing them along another. The existence of these fundamental trade-offs entails the need to weigh-up not only the benefits of environmental protection against the associated monetary costs, but also the benefits of an improvement in environmental performance along one dimension against the costs of a deterioration along another.
While the first of these tasks is now routinely undertaken by means of contingent valuation, the second task lies beyond the capabilities of that methodology. However, stated preference techniques such as contingent ranking - which were originally designed by marketing practitioners to isolate the value of individual product characteristics typically supplied in combination with one another - provide a natural means of analysing environmental multi-dimensionality. Examples of successful applications include valuation of landscape changes (Hanley et al., 1998; Hanley, Wright and Adamowicz, 1998), water quality improvements .(Smith and Desvousges, 1986),
W Vivien Foster works for the Oxford Economic Research Associates Ltd, Oxford. Susana k1ourato is at the T. H. Huxley School of Environment, Earth Sciences and Engineering, Imperial Colle e of Science, Technolo and Medicine, London. Both authors contribute to the Centre for Sociafand Economic Researcpon the Global Environment, University College London and University of East Anglia. The research underlying this paper was funded by the United States Environmental Protection Agency. The authors gratefully acknowled e additional fundin provided by UK Economic and Social Research Council and the Portuguese funta Nacional de fnvestigaqao Cientifica e Tecnol6gica (JNICT) through the PRAXIS XXI Programme. David Pearce, Richard Blundell, Joseph Swierzbinski, Ece Ozdemiroglu and two anonymous referees made valuable contributions at different stages of the study.
2 Vivien Foster and Susuna Mouruto
environmental and health effects of energy programmes (Johnson and Desvousges, 1997), recreational site choice (Adamowicz et al., 1994) and wetland preservation and benefits transfer (Morrison et al., 1998).
The application of pesticides in agricultural production provides a particularly complex example of multi-dimensional environmental impacts, since loss of aquatic and terrestrial biodiversity, contamination of groundwater and agricultural produce, as well as poisoning of agricultural workers, are all potential consequences of pesticide use. Moreover, the choice between alternative pesticide products raises the issue of trade-offs between these different types of damages. For example, an agrochemical product which is more benign in terms of human health may be more damaging in terms of biodiversity.
This paper develops an application of the contingent ranking methodology to the valuation of multiple environmental impacts from pesticide applications to arable land using a "green consumer good" payment vehicle. Respondents are asked to view the various environmental consequences of pesticide use in bread production as product attributes to be taken into account in the purchase decision. The current trend towards eco-labelling of consumer products - such as the case of "dolphin friendly" tuna - suggests that consumers can be induced to differentiate between products purely on the basis of their production processes, even when these do not ultimately lead to any discernible physical differences between the products offered on the supermarket shelves.
The methodology used here follows this line of reasoning, and thus stands in contrast to earlier valuation studies of the social costs of pesticides which have tended to focus only on the ways in which their use impacts upon consumers directly in terms of pesticide residues and aesthetic pest damage of produce (van Ravenswaay and Hoehn, 1991a, b, c, d; Eom, 1994; Eom and Smith, 1994; Weaver, 1994).
The results show that on average consumers are prepared to accept a mark-up of 0.7 pence per loaf to avoid a case of human illness and 5.3 pence per loaf to protect one species of farmland birds. Another way of expressing these results is that respondents are on average only willing to tolerate between seven and eight cases of human illness to save an entire species of birds.
The paper is organised as follows. Section 2 briefly describes the design of the contingent ranking survey. Section 3 presents the theoretical and empirical framework which underpins the analysis, while Section 4 presents the results of specification testing between the standard conditional logit model and the rank-ordered variant. In Section 5 a range of validity checks are carried out which indicate that the valuation estimates perform well in terms of standard testing procedures. Conclusions are provided in Section 6.
2. Survey Design The basic idea behind the design of the contingent ranking survey was to ask consumers to rank a conventional loaf of bread against a number of alternative loaves, differentiated in terms of price and eco-labels, which identified the environmental impacts generated by the underlying production processes. This section briefly reviews the principal stages
Valuing the Multiple Impacts of Pesticide Use in the UK: A Contingent Ranking Approach 3
involved in the survey design - namely, the choice of attributes, the determination of attribute levels and the construction of ranking sets. A more detailed discussion is provided in Foster and Mourato (1997).
As noted above, the range of environmental impacts associated with pesticide use is potentially very large, but can be broadly grouped into the two categories, human health and biodiversity.’ The indicator variables chosen to quantify each of these two dimensions in the survey were selected to represent, as accurately as possible, the main areas of well-documented environmental damages for the United Kingdom. Thus, the impact on human health was measured in terms of “cases of illness as a result of field exposure to pesticides during cultivation”, while the impact on biodiversity was measured in terms of the “number of farmland bird species in a state of serious long-term decline as a result of pesticide use in cereal cultivation”.z
For the baseline “conventional loaf” - priced at 60 pence3 - the health and environmental impact attributes defined above were set at their estimated current position - that is 100 cases of ill-health per year and nine bird species in decline. The remaining two levels of each attribute represented an increase in price accompanied by a reduction in environmental impacts relative to the status quo. Non-linear spacing of attributes was adopted to maximise the range of implicit prices offered in the survey. While two pilot surveys were used to identify the appropriate upper and lower bounds on implicit prices, which ultimately ranged between 0.42.8 pence per loaf per case of ill- health and 3.6-18.3 pence per loaf per bird species. The problem of determining implicit prices for contingent ranking surveys is analogous to that of determining appropriate bid levels for dichotomous choice contingent valuation surveys.
The combination of three attributes at three different levels creates a total of 27 possible permutations of the hypothetical bread product, which would have to be ranked by respondents to obtain full information about each of their preference structures. Given the prohibitive complexity of such a task, the experimental design literature has developed procedures for selecting a subset of alternatives which still contains sufficient information to identify the primary effect of each attribute level on the ranking decision (McClean and Anderson, 1984; Louviere, 1988). In the case of the present survey, the number of alternatives to be offered could be reduced from the original 27 to just nine, without serious loss of information.4 ’ In this study, the external impacts of pesticide use were represented by means of two major indicator variables: number of bird species in decline and cases of human illness as a result of field exposure. Clearly these are only a subset of the full range of environmental impacts of pesticides, which can also include groundwater contamination, pesticide residues in water, river pollution and loss of insect and mammal species. More complex representations - considering a larger number of impacts - could potentially be accommodated within the contingent ranking method by adding further attributes. However, it should be noted that increasing the number of attributes also increases the complexity of the choice task for respondents. Given the complex nature of the attributes themselves, the authors preferred to keep to a relatively small number of attributes. * The species in question include the Bullfinch, Corn Bunting, Grey Partridge, Linnet, Reed Bunting, Skylark, Song Thrush, Spotted Flycatcher and Tree Sparrow. ’ As of February 1998, f 1 = USB1.65 and f 1 = 100 pence. ‘ By use of specialised software packages, such as SPEED, it is straightforward to generate this kind of “fractional factorial design”. From such a design it is possible to obtain what are known in the literature as “main effects”; that is the extent to which variations in behaviour can be explained purely by the level of each pf the individual attributes presented. Louviere (1988) states that more than 80 per cent of respondent behaviour can typically be explained in terms of main effects alone. However, full information is lost by such a design in that i t does not permit analysis of how interactions between attribute levels influence individual ranking decisions.

4 Viuia Foster and S w a m Mourato
Nonetheless, in their review of the contingent ranking literature, Smith and Desvousges conclude that ranking sets containing more than eight elements become cognitively infeasible for respondents, and that the best results are obtained when ranking sets are limited to between four and six alternatives (Smith and Desvousges, 1986). Consequently the nine alternatives were "packaged" into four-way ranking sets,' which were then randomly allocated across respondents. An example of one of the ranking sets used is provided in Table 1. All ranking sets included the conventional loaf which acted as a common reference point, and - more importantly - gave respondents the opportunity to express a zero willingness to pay as their most preferred alternative. Ranking the baseline option first is analogous to refusing to pay the bid presented in a dichotomous choice contingent valuation survey.
After the initial design and pretest stages, the final survey was conducted during the month of June 1996. It was based on face-to-face interviews, performed by a market research company, on a sample of 504 people selected to be representative of the UK population. The questionnaire comprised three sections. The first introduced the subject of the environmental impacts of pesticides via a series of attitudinal questions. The second contained the contingent ranking exercise, and was prefaced by a short briefing on the environmental impacts of wheat production, comprising a detailed description of each of the attributes to be varied in the ranking exercise and a justification for their inclusion in the study (the exact wording of the question is reproduced in the Appendix). The third requested information on a variety of socio- economic characteristics.
3. Theoretical Framework
The random utility model provides the theoretical basis for estimating the willingness to pay to protect human health and biodiversity from the data collected in the contingent ranking survey. According to this framework, the indirect utility function for each
Table 1 Samde Contingent Rankine Question From the Survey Process A I Process B2 Process C Process D
Price of bread 60p per loaf 85p per loaf 85p per loaf f1.15 per loaf
Health effects on 100 cases of ill 40 cases of ill 40 cases of ill 60 cases of ill general public health per year health per year health per year health per year
Biodiversity effects 9 bird species 2 bird species 5 bird species 2 bird species on farmland birds in decline in decline in decline in decline
Ranking
1 Current technology for wheat cultivation. * Alternative environmentally friendly options for wheat cultivation.
' A procedure for doing this was devised based on two basic insights. First, that the information contained in a ranking of nine alternatives was equivalent to that contained in a series of 36 pairwise comparisons. Second, that many of these pairwise comparisons were redundant either because they consisted of dominated pairs, or because they included infeasible alternatives. On this basis, it was possible to recast the nine alternatives as a number of four-way ranking questions.

Valuing the Multiple Impacts of Pesticide Use in the UK: A Contingent Ranking Approach 5
respondent i can be decomposed into two parts: a deterministic element - which is a linear index of the attributes (X) of the j different alternative hypothetical loaves in the choice set - and a stochastic element (e), which respresents unobservable influences on individual choice. This is shown in equation (1).
Thus, the probability that any particular respondent prefers option g in the choice set to any alternative option h, can be expressed as the probability that the utility associated with option g exceeds that associated with all other options, as stated in equation (2). In order to derive an explicit expression for this probability, it is necessary to know the distribution of the error terms (eg). A typical assumption is that they are independently and identically distributed with an extreme-value (Weibull) distribution given in equation (3).
P[(Uig > Uih)Vh # g] = P[(bXi, - bXih) > (eih - eig)]
P(eg I t) = F(t) = exp(-exp(-t)) (3)
The above distribution of the error term implies that the probability of any particular alternative g being chosen as the most preferred can be expressed in terms of the logistic distribution (McFadden, 1973) stated in equation (4). This specification, known as the conditional logit model, applies the random utility framework only to the selection of the first choice option and will consequently be referred to henceforth as the Most Preferred Alternative (MPA) model. An important implication of this specification is that selections from the choice set must obey the Independence from Irrelevant Alternatives ( IN) property, which states that the relative probabilities of two options being selected are unaffected by the introduction or removal of other alternatives. This property follows from the independence of the Weibull error terms across the different options contained in the choice set.
The drawback of this model is that it does not fully exploit all of the information contained in a contingent ranking survey, which not only identifies the most preferred alternative but also the exact ordinal ranking of all of the remaining elements. Beggs, Cardell and Hausman (1981) develop an extension to the basic conditional logit model
6 Viuien Fostez and Susana Mournto
which is capable of using this additional information (Lareau and Rae, 1985; Smith and Desvousges, 1986). Their specification is based on the repeated application of the probability expression given in equation (4) until a full ranking of all the alternatives has been obtained. Hence the probability of any particular ranking of alternatives being made by individual i can be expressed as in equation (5).
Clearly, this Ranked Data (RD) model is more restrictive than the MPA model in as much as the extreme value (Weibull) distribution governs not only the first choice but all successive choices as well. As before, the RD model relies critically on the IIA assumption, which in this case is what permits the multiplication of successive conditional logit probabilities to obtain the probability expression for the full ranking.
Both models can be estimated by conventional maximum likelihood procedures, with their respective log-likelihood functions stated in equations (6) and (7) below, where yij is an indicator variable which takes a value of one if respondent i chose option j and zero otherwise.
Once the parameter estimates have been obtained, consumer willingness to pay for the human health (H) and biodiversity (B) attributes of the ecological loaves is calculated as the marginal rate of substitution between each of these attributes and the money price of bread (P), as indicated in equations (8) and (9).
Uij = bpPij t bhHij t b,Bij

Valuing the Multiple Impacts of Pesticide Use in the UK: A Contingent Ranking Approach 7
4. Specification Testing This section undertakes the necessary specification tests for validating the use of the logit framework and selecting between the MPA and RD model described above.
Most Pr+rred Alternative Model
Use of the MPA model is only legitimate if the data satisfy the IIA assumption. This was ascertained by means of the standard Hausman test, which is based on a comparison bctwccn thc coefficient estimates obtained before and after one of the alternatives in the choice set has been removed. Under the null hypothesis of IIA, the differences in the coefficients will not be statistically significant. The test statistic ( S ) for this procedure is given by equation (10) - where b represents the coefficient vector, Z represents the covariance matrix and F and R respectively index the full and reduced choice sets - and is distributed as a chi-squared variable with degrees of freedom equal to the number of explanatory variables.
S = (bR- bF)'[CR-CF]-l(bF- bR) (10)
The values of the test statistics obtained from the alternate deletion of each of the branches of the choice set were found to lie in the range 4.55-11.55, as against a critical value from the chi-squared distribution with three degrees of freedom of 12.84 at the 99.5 per cent confidence level. These results indicate that the data narrowly pass the Hausman test for conformability with the ILA assumption and thus validate the use of the MPA model.1
Ranks Data Model
As noted above, although the RD model makes use of a richer set of information about respondent preferences, it is significantly more restrictive than the MPA model in the sense that it assumes the same choice process governs the top rank as governs each successive rank. Hausman and Ruud (1987) note the possibility that individuals might pay much more attention to identifylng their first best choice than to ranking the remaining alternatives, and show that such an outcome would render the use of the RD model illegitimate. Ben-Akiva et al. (1991) also find significant differences among choice models run for different ranks, the implication being that the decision criteria adopted for the top ranks may well be different from that of the low ranks, thus invalidating the use of the RD model.
The notion that choices should be consistent across ranks suggests a natural likelihood ratio-based specification test which involves comparing the outcome of the RD model ' Surprisingly, testing for conformity with the IIA assumption is not commonly done in the literature, although non-conformity would effectively invalidate the use of the standard conditional logit specification. This analysis therefore extends previous work of Ben-Akin et al. (1991) or Hanley ct aL (1998), for example, by explicitly testing for ILA before proceeding with the use of logit estimators. -

8 Viuien Foster and Susana Mousato
with the outcome of estimating a series of separate MPA models for the selection of each successive rank from the choice set which remains after the previously most highly ranked alternative has been deleted (Ben-Akiva et aL, 1991). The test is based on the recognition that the log-likelihood for the RD model can be broken down into the sum of the log- likelihoods for each of the series of MPA models just described. This is shown in equation (1 1). In the RD specification (IogL,), the coefficients governing each successive choice are constrained to be equal, whereas separate estimation of the underlying MPA models (logLMpAj) allows them to vary across ranks. Under the null hypothesis, the log- likelihoods associated with each of these two estimation procedures should be equal. The test statistic is stated in equation (12). The degrees of freedom for the test are given by the difference between the number of coefficients estimated in each case.
T- 1
The application of this procedure to the current data set yields a test statistic of 66.99 in comparison with a critical value for the chi-squared distribution with six degrees of freedom of 12.59. This constitutes a strong rejection of the RD specification over and against the MPA model.
Comparison of Both Specifications
Hausman and Ruud (1987) maintain that while use of a misspecified RD model may lead to significant differences in the coefficients estimated relative to the MPA model, this will not necessarily make any material difference to the ultimate willingness to pay estimates which are ratios of those coefficients. In order to ascertain whether this is the case in the present context, Table 2 presents the coefficient estimates and associated willingness to pay values for the MPA and RD models.1
For the purposes of estimation, the attribute levels were re-scaled in the following way: price is expressed in pounds per loaf; the "health" attribute was divided by 100; and the "birds" atvibute was divided by ten. This affects the interpretation of the coefficients. The rescaling is removed during the process of calculating willingness to pay.

Valuing the MultipL Impacts of Pesticide Use in the UX. A Contingent Ranking Approach 9
Table 2 Comparison of MPA and RD Spedfkations MPA Model RD Model
Price1
Human health’
Biodiversity’
Log-likelihood No. of observations
~~ ~
-3.515 (0.372) -9.443 -2.391 (0.246) -9.703 -1.837 (0.223) -8.249
-621.942 501
-2.015 (0.077) -26.295 -2.346 (0.103) -22.853 -1.496 (0.102) -14.699
-1458.2 501
WTP for human health2 0.681 (0.062)
1.168 (0.083)
WTP for biodiversity2 5.252 7.444 (0.574) (0.639)
1 The values listed in each case are coefficient, standard error and t-ratio. * The WTP is expressed in units of pence per loaf of bread.
The results show that the coefficients for both models have the expected negative signs and are highly statistically significant. Relative to the MPA mode1,the RD model has a very similar coefficient for human health and smaller coefficients for price and biodiversity. In order to examine whether these differences were statistically significant a Hausman test for overall equality of the coefficients was applied, comparable to that defined by equation (10). The resulting test statistic of 43.90 lies well above 7.82, which is the 95 per cent critical value for the chi-squared distribution with three degrees of freedom. This rejection is consistent with the results of the likelihood ratio test reported above.
In line with prior expectations, the standard errors on the coefficients of the RD model are substantially smaller than those obtained for the MPA model, leading to t-ratios which are two to three times greater. This higher degree of efficiency is attributable to the fact that the RD model is making use of all the available information about consumer rankings as opposed to just the first best choice.
As noted in equation (9), the implicit values of willingness to pay are non-linear functions of the coefficient estimates. Krinsky and Robb (1986) show that, under these circumstances, classical linear approximations are unlikely to provide accurate estimates of the variance of willingness to pay. A superior approach is to use simulation techniques to establish the empirical distribution of willingness to pay, based on N random drawings from the multivariate normal distribution defined by the coefficients and covariance matrix estimated from the logit model. All willingness to pay estimates and associated standard errors reported in this paper are estimated using this technique, with simulations based on 1,000 repetitions.
Willingness to pay is found to be substantially larger under the RD model than under the MPA model - 1.2 pence per loaf as against 0.7 pence per loaf to prevent each case of human ill-health and 7.4 pence per loaf as against 5.3 pence to reverse the decline of each species of farmland birds. Another way of expressing these results is that on average

10 Viuien Foster and Swana Muurato
respondents were only willing to tolerate between six and eight cases of human ill-health to save an entire species of farmland birds. This indicates the importance which the sample attached to the preservation of human health.
In order to ascertain whether these differences are statistically significant, it is necessary to examine the magnitude of the standard errors generated by the Krinsky and Robb (1986) procedure. These indicate that the observed differences in willingness to pay are statistically significant in the case of human health but not in the case of biodiversity. Thus this finding provides only partial support for Hausman and Ruud’s (1987) suggestion that misspecification need not be a problem if ultimate interest lies in willingness to pay rather than in individual coefficient estimates.
Overall, the results indicate that the greater efficiency and reduced sample sizes that are possible when ranks data are used come at the expense of a considerable degree of misspecification.’ On the strength of these conclusions the MPA model will be used as the basis of analysis throughout the remainder of this paper. However, for comparison, the results of the RD specification will also be reported where they show any interesting divergence from the conclusions of the MPA model. In this way, the consequences of misspecification can be fully explored.
5. Validity Testing For some time now it has been considered good practice to subject the results of contingent valuation studies to a process of validity testing (Mitchell and Carson, 1989). One important form of validity test concerns establishing whether or not willingness to pay varies systematically with the socio-economic characteristics of respondents in ways that might be predicted by economic theory. A second type of validity test, advocated by the panel of the National Oceanic and Atmospheric Administration in the US, is to examine whether willingness to pay estimates are sensitive to the scope of the resource change that is presented to respondents. Finally, it is also considered advisable to compare willingness to pay estimates with those obtained in other studies and, where possible, with equivalent real payments.
All of these concerns are as important in a stated preference context as they are for contingent valuation, although the associated validity tests require some adaptation to contingent ranking data.
Theoretical Validity
In contingent valuation studies, theoretical validity is usually assessed by estimating a bid function which seeks to explain the variation in willingness to pay across respondents in terms of their underlying socioeconomic characteristics. Owing to the statistical specification of the logit model it is not possible to incorporate socio-economic regressors ’ Ultimately, the adequacy of a particular model specification will depend on the decision criteria that people adopt when faced with a particular ranking task. The RD model assumes that the same decision criterion is used for all ranks. But, as this paper shows, this assumption may not hold even for relatively simple ranking exercises. In general, the likelihood of individuals paying more attention to identifying their first best choice than to ranking the remaining alternatives is expected to increase with the complexiy of the ranking task.

Valuing the MultipLe Impacts of Pesticide Use in the UIC A Contingat Ranking Approach 11
directly into the utility index.’ Instead, the impact of socioeconomic factors on willingness to pay can be gauged by one of two alternative methods. The first entails interacting socio-economic variables with the attributes of the alternative loaves,* and examining the signs and significance of the resulting interacted variables. The second involves estimating the model on sub-samples of the data differentiated by socio- economic factors, and comparing the resulting willingness to pay across sub-samples. Each of these two approaches will be considered in turn.
h important prediction of economic theory is that willingness to pay will be an increasing function of income. A natural way of testing this hypothesis in the present context is to incorporate an additional interaction variable which expresses price as a function of individual income, thereby modifying the utility index along the lines indicated in equation (13). The predicted willingness to pay then becomes a function of income level as shown in equation (14). Because of the form of the interaction, a positive relationship between income and willingness to pay will show up as a negative coefficient on the price-income interaction variable (by).
Uij = bpPg + by(Pg / Yi) + bhHg + bbBg
The results of applying this approach are illustrated in Table 3, where the MPA model with the income interaction variable is compared to the baseline specification with no interaction. Given that the income variable was missing for one third of the sample, the baseline MPA model was re-estimated on the sub-sample for which the income variable is available, in order to facilitate comparisons between the two specifications.3
The income interaction variable proves to be highly significant, with the expected negative sign. The price variable on its own also remains highly significant, though less so than in the baseline specification. This demonstrates that willingness to pay for the “health” and “birds” attributes increases with income level, as predicted by economic ’ The reason for this is that, as illustrated in equation (2) above, the random utility framework is based on differencing the values of attributes across different alternatives. Thus any attribute - such as a socioeconomic characteristic of the respondent - which does not vary across alternatives would simply drop out of the model as a result of this process.
The fact of interacting the socioeconomic characteristics with the attributes of the alternatives circumvents the earlier problem because the interacted variable both contains individual-specific sociwconomic information and varies across alternatives in the choice set. ’ In order to check for the presence of sample selectivity bias brought about as a result of income non-response, the log-likelihood function for the whole sample is compared with the sum of the log-likelihood functions estimated for the sub-samples which include and exclude income observations. This likelihood ratio procedure, described by Ben-Akiva and Lerman (1985), cannot reject the null hypothesis of equality between the coefficients estimated on these exhaustive and mutually exclusive subsamples. Moreover, the willingness to pay estimates resulting from the two subsamples are not significantly different.

12 Vivien Foster and Susana Mournto
Table 3 Comparison of MPA with and without the Income Interaction Bardim Observation w’th Mirring Income Model with Model Income Only Observations Only Inmmc Intrraction
Price’ -3.515 -3.768 -3.087 -2.564 (0.372) (0.471) (0.609) (0.559) -9.443 -7.994 -5.070 -4.586
(0.246) (0.311) (0.405) (0.3 14) Human health] -2.391 -2.399 -2.391 -2.474
-9.703 -7.721 -5.903 -7.886 Biodiversity’ -1.837 -1.850 -1 .829 -1.903
(0.223) (0.278) (0.374) (0.28 I ) -8.249 -6.656 4.894 -6.779
Price-income interaction’ -7.130 (1.923) -3.709
Log-likelihood -621.942 400.408 -220.667 -392.834 No. of observations 50 1 324 177 324 WTP for human health‘ 0.681 0.642 0.791 0.778
W P for biodiversity2 5.252 4.933 6.045 5.981 (0.062) (0.073) (0.138) (0.109)
(0.574) (0.655) (1.134) (0.933)
The values listed in each case are coefficient, standard error and t-ratio. The WTP is expressed in units of pence per loaf of bread.
theory. A likelihood ratio test strongly rejects the exclusion of the income interaction variable, with a test statistic of 15.15 well above the 95 per cent critical value of 3.84. However, the ultimate willingness to pay estimates for the interaction model based on the average income level lie within the 95 per cent confidence interval for the baseline MPA model estimated on the same sample. A very similar pattern of results is obtained from estimating the same models on the basis of the RD specification.
The second approach to testing for theoretical validity relies on estimating willingness to pay for a series of exhaustive and mutually exclusive groupings of the population. Clearly, there are a large number of ways in which the sample could be segmented. Here, the general approach is illustrated by examining cuts according to gender, degree of interest in environmental issues (as measured by an attitudinal variable included in the introductory portion of the survey), educational level, and birdwatching status.
The resulting models for each of the four pairs of cuts are summarised in Table 4, which indicates substantial variations in coefficients across population segments, particularly as regards the price coefficients. In order to test whether these differences are statistically significant overall, Ben-Akiva and Lerman (1985) propose a likelihood ratio test based on comparing the log-likelihood function for the model estimated on the pooled sample - where coefficients across all segments of the population are implicitly restricted to be equal (logLR) - and the sum of the log-likelihoods estimated across a series of exhaustive and mutually exclusive segments of the population where coefficients are allowed to vary (CulogLu). The test statistic - which is given in equation (15) - is distributed as a chi- squared variable with degrees of freedom equal to the difference in the number of coefficients estimated across the restricted and unrestricted models.

Valuing the Multiple Impacts of Pesticide Use in the UX. A Contingent Ranking Approach 13
Table 4 Cornoarison of MPA Models &timated on Different Pooulation Semen& concern for Educational
Gender Environment h e 1 Birdwatcher Males Femalcs Hich Low Secondasy Tertiary Yac No
Price' -3.771 -3.313 -3.396 4.495 -3.392 4.269 -3.825 -3.431 (0.561) (0.499) (0.421) (0.967) (0.403) (1.002) (0.858) (0.416) -6.726 -6.641 -8.067 4.648 -8.420 -4.262 4.456 -8.242
Human health1 -2.372 -2.446 -2.919 -0.808 -2.256 -3.114 -3.052 -2.240 (0.356) (0.345) (0.282) (0.588) (0.270) (0.623) (0.566) (0.276) -6.658 -7.100 -10,347 -1.374 -8.357 4.998 -5.390 -8.109
Biodiversity' -2.029 -1.668 -2.222 -0.894 -1.688 -2.614 -2.994 -1.518 (0.332) (0.302) (0.257) (0.520) (0.243) (0.579) (0.518) (0.249) -6.115 -5.529 -8.643 -1.719 -6.952 -4.519 -5.781 -6.099
-306.891 -314.520 -480.505 -112.827 -511.746 -108.424 -123.315 -492.518 Log-likelihood No. of observations 247 254 405 96 408 93 111 390 LR test statistic 1.062 57.220 3.544 12.218 WTP for human health* 0.633 0.752 0.867 0.174 0.672 0.738 0.826 0.656
(0.079) (0.100) (0.090) (0.124) (0.074) (0.143) (0.176) (0.070) WTP for biodiversity' 5.449 5.064 6.561 1.959 4.966 6.245 8.032 4.440
(0.685) (0.842) (0.719) (1.095) (0.610) (1.294) (1.596) (0.591)
I The values listed in each case are coefficient, standard error and t-ratio. 2 The WTP is expressed in units of pence per loaf of bread.
s = 2[ '5 log L") - log LRI
The test statistics for this likelihood ratio test are also reported in Table 4, and can be compared against a critical value of 7.82 at the 95 per cent confidence level. This suggests that only degree of interest in environmental issues and birdwatching status have a material impact on the coefficient estimates.
This finding is corroborated by a comparison of the willingness to pay estimates produced by the Krinksy and Robb procedure and their associated standard errors. These indicate that while women exhibit a higher willingness to pay than men, and those with tertiary education exhibit a higher willingness to pay than those with only secondary education, these differences are not statistically significant. However, those with a high degree of interest in environmental issues are willing to pay around three times as much to preserve human health and biodiversity as those who do not. Birdwatchers are willing to pay nearly twice as much to protect bird species as those who do not undertake this pastime. This pattern of results conforms with a piwi theoretical expectations and provides further evidence of the theoretical validity of the results. Once again, repeating this estimation procedure with the RD model instead of the MPA model does not materially affect the conclusions drawn.
Sensitivity to Scope
In contingent valuation studies, the sensitivity of willingness to pay to the scope of the environmental change being presented is typically ascertained by one of two methods:

14 Vivien Foster and Susana Mourato
either presenting each individual with a number of valuation scenarios which differ according to scope (for example Boyle et al., 1993) - a within groups test; or by presenting different sub-samples of the population with valuation scenarios which differ according to scope (for example Boyle et al., 1994) - a between groups test. While the within groups test is undoubtedly weaker than the between groups test - in as much as the answers given by any particular individual are not independent from each other and thus sensitivity to scope is to some extent forced - the present contingent ranking survey does not permit a test of the other kind.1
In order to test for sensitivity to scope, the linear utility index given by equation (8) above is replaced by a piecewise linear index, illustrated in equation (16). The human health and biodiversity attributes are each represented by a pair of dummy variables (AB and AH) one of which is used to indicate whether the attribute appears at its medium level (M) and the other whether it appears at its lowest level (L). Both dummy variables take a value of zero when the attribute appears at its baseline level. This makes it possible to examine how willingness to pay varies across different ranges of the two attributes.
The results of estimating this piecewise linear specification for both specifications of the logit model are reported in Table 5. The coefficients on the human health and biodiversity dummies now capture the marginal utility of moving from the baseline to the medium level of the attribute and from the baseline to the lowest level of the attribute respectively. The coefficients on the lowest level dummies are larger than those on the medium level dummies, reflecting the fact that a larger change is occurring.
When the coefficients are translated into overall willingness to pay for these changes, an interesting result emerges. For the MPA model, the willingness to pay estimates for the larger changes are significantly higher, indicating sensitivity to scope, while for the RD model, the willingness to pay estimates for each of the pairs of dummy variables are not significantly different, indicating that embedding effects are present. A possible explanation for this links back to the specification test for the RD model, and the underlying idea that respondents may not pay very much attention to their rankings after they have selected their most preferred alternative. If this is the case, then one would expect second and third ranks not to be very closely related to the variations in attribute levels offered under different alternatives. Since the estimates from the RD model are "contaminated" by second and third choice information, it is consequently not so surprising that they do not exhibit sensitivity to scope.
When these overall willingness to pay estimates are converted into marginal willingness to pay across the two attribute ranges, another interesting contrast emerges. In the case of the RD model there is sharply decreasing marginal willingness to pay with respect to environmental improvements. This is particularly striking in the case of biodiversity
Nonetheless. in a contingent ranking context the problem of forcing sensitivity to scope does not arise to the same degree in that willingness to pay is implicit in ranking decisions and thus is not directly perceived by the respondent.

Valuing the MultipIe Impacts of Pesticide Use in the UK: A Contingent Ranking Approach 15
Table 5 Comparison of MPA and RD Models with a Piecewise Linear Index MPA Model RLI Model
Price' -3.469 (0.376) -9.229
-2.063 (0.082) -25.109
Medium human health dummy1 0.854 1.109 (i.e. 100-60 cases per ycar) (0.149) (0.093)
5.740 11.919 Low human health dummy' 1.463 1.292 (i.e. l O M O cases per year) (0.153) (0.092)
9.574 14.034 Medium biodiversity dummy' 0.706 0.859 (i.e. 45 species in decline) (0.132) (0.087)
5.369 9.864 Low biodiversity dummy1 1.298 0.946
8.225 10.352 (i.e. 9-2 species in decline) (0.158) (0.091)
Log4 kel i hood 621.370 -1443.979 No. of observations 50 1 50 1 WTP for human health2 24.613 53.641
WTP for human health2 42.428 62.429
WTP for biodiversity2 20.374 41.722 (9-5 cases per year) (3.500) (3.688)
WTP for biodiversity2 37.603 45.842 (9-2 cases per year) (3.944) (3.720)
I The values listed in each case are coefficient, standard error and t-ratio. * The WTP is expressed in units of pence per loaf of bread.
(100-60 cases per year) (3.878) (3.553)
(10040 cases per year) (4.145) (3.459)
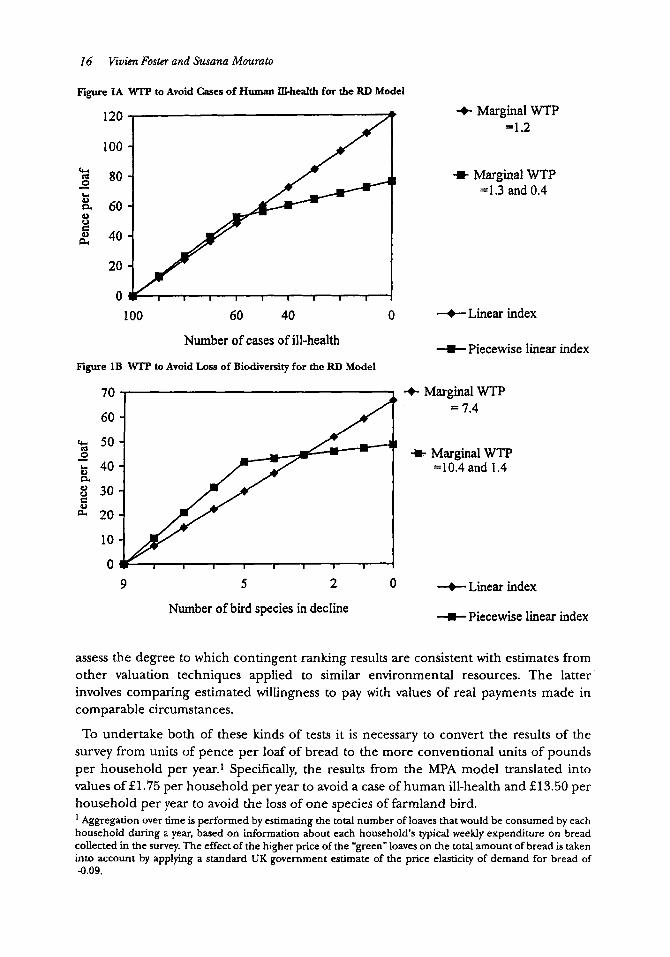
where the marginal willingness to pay per species falls from 10.4 pence per loaf to 1.4 pence per loaf, but is essentially just another manifestation of the embedding result noted above. One implication of this is that very different estimates of willingness to pay for a particular environmental change would be achieved by adopting the linear versus the piecewise linear specification. This is clear from the graphical illustrations provided in Figures 1A-B.
However, for the MPA model, marginal willingness to pay is actually increasing with respect to environmental improvements. For example, for biodiversity it rises from 5.1 pence per species per loaf to 5.7 pence per species per loaf. One way of understanding this result is that people care more about eliminating the entire problem of biodiversity loss than they do about marginal changes in the number of species. Nonetheless, as illustrated in Figures 2A-B, these marginal differences do not lead to very substantial differences in total willingness between the linear and piecewise linear specifications, which lie very close to each other across the entire attribute range.
Convergent and Criterion Validity
Two valuable tests of the reliability of willingness to pay estimates are those for convergent and criterion validity. The former requires comparisons with other valuation studies to
16 Vivien Foster and Susana Mourato
Figure IA WIT to Avoid Cases of Human ill-health for the RD Model
120
100
% 80
60
0 - 8 g 40 e
20
0
f Marginal WTP =1.2
* Marginal WTP =1.3 and 0.4
100 60 40 0 -f- Linear index
Number of cases of ill-health -w- Piecewise linear index Figure 1B WTP to Avoid Loss of Biodiversity for the RD Model
70
60
% 50 0 -
40 a 8 30 s
20
10
0
+- Marginal WTP = 7.4
-r Marginal WTP =10.4 and 1.4
9 5 2 0 --t Linear index
Number of bird species in decline -t- Piecewise linear index
assess the degree to which contingent ranking results are consistent with estimates from other valuation techniques applied to similar environmental resources. The latter involves comparing estimated willingness to pay with values of real payments made in comparable circumstances.
To undertake both of these kinds of tests it is necessary to convert the results of the survey from units of pence per loaf of bread to the more conventional units of pounds per household per year.* Specifically, the results from the MPA model translated into values of $1.75 per household per year to avoid a case of human ill-health and S13.50 per household per year to avoid the loss of one species of farmland bird.
Aggregation over time is performed by estimating the total number of loaves that would be consumed by each household during a year, based on information about each household’s typical weekly expenditure on bread collected in the survey. The effect of the higher price of the “green” loaves on the total amount of bread is taken into account by applying a standard UK government estimate of the price elasticiry of demand for bread of 4.09.

Valuing the Multiplc Impacts of Pesticide Use in the U E A Contingent Ranking Approach 17
figure 2A WTP to Avoid Cases of Human Ill-health for the MPA Model
80
70
i- Marginal WTP =0.6 and 0.9
60
2 50 rc. I
t Marginal WTP =0.7
20
10
0 100 60 40 0 -+- Linear index
Number of cases of ill-health -8- Piecewise linear index
Figure 2B WTP to Avoid Loss of Biodiversity for the MPA Model
50
40
(r td 2 30 8 R
10
0 9 5
I + Marginal WTP = 5.3
* Marginal WTP =5.1 and 5.7
2 0 +Linear index Number of bird species in decline + Piecewise linear index
The first part of Table 6 summarises the studies that are available for the purposes of the convergent validity test. Unfortunately, there are no other UK studies of the value of bird species, so the studies cited are taken from the US and Scandinavian literatures.' The value obtained for bird biodiversity in the present study lies well within the range of these results, towards the upper end. While this suggests that the study performs well in terms of convergent validity, it is perhaps surprising that the present value is larger than many of the others given that they are drawn from single species valuation studies whereas the current survey required respondents to think about multiple species. Unfortunately, there is no direct comparator for the value obtained for human ill-health in the present ' The estimates from Reaves ef al. (1994). Fredman (1995). Stevens et al. (1991) were reported per person rather than per household. Based on an assumption of two adults per household, these values have been doubled to permit comparisons with the present results. All values have been converted from their respective currencies to pounds sterling at the current exchange rates.

18 Vivim Foster and Surana Mourato
Table 6
Vatidity Comparator Value
Convergent Bird biodiversity
Comparison Values for Convergent and Criterion Validity Tests (Approximate WTP in Pounds Per Household Per Year)
WTP to preserve the redcockaded woodpecker in the US 15 (Reaves ef aL, 1994)
(Stevens et al., 1991)
(Fredman el aL, 1995)
(Veisten er al., 1993)
WTP to preserve the wild turkey in the US
WTP to preserve the white-backed woodpecker in Sweden
WTP to preserve the white-backed woodpecker in Norway
12
4
33
Human ill-health WTP to relieve one day of own eye irritation in the US 40 (Tolley el al., 1994)
Criterion Bird biodiversity UK Royal Society for the Protection of Birds annual subscription fee 50
<1 UK Royal Society for the Protection of Birds fund-raising appeal to preserve the bittern
Human illhealth Mean annual donation to health sector charities in the UK 24
study because this relates to third party, rather than own, health effect. Nonetheless, the fact that the current value is an order of magnitude smalier than that obtained by Tolley et aZ. (1994) to escape from suffering a similar type of symptom for oneself, provides some reassurance that the results of the contingent ranking study are reasonable.
The second part of Table 6 summarises a number of statistics on UK charitable donations which can be used to provide some indication of criterion validity. Viewed from this perspective the values obtained from this (and other valuation studies cited in Table 6) appear very large. For example, according to the contingent ranking study, birdwatchers are willing to pay 218.60 per year for preserving a single species of farmland bird. However, this is an order of magnitude larger than the actual average contribution received from a group of bird-lovers in response to a real fund-raising appeal made by the Royal Society for the Protection of Birds - the UKs largest environmental organisation - to save an endangered species called the Bittern.
Thus while the contingent ranking survey performs well in terms of convergent validity, the criterion validity test suggests that the results could be unrealistically high when compared with what people actually pay in practice. This result suggests that the monetary values obtained in this study would probably need to be adjusted before being applied to answer policy questions (Foster et d., 1997).
6. Conclusions This paper has presented the results of a contingent ranking survey designed to isolate willingness to pay for human health and biodiversity impacts associated with pesticide use

Valuing the Multiple impacts of Pesticide Use in the UX. A Contingent Ranking Approach 19
in the production of wheat, using a "green" consumer good as the payment vehicle. The methodology used has the valuable advantage of presenting respondents with trade-offs - not only between environmental quality and money - but also between different dimensions of environmental quality. These are a common feature of environmental decision-making in the real world.
From a statistical point of view, an important finding of the paper was that specification testing rejected the use of the RD model in preference for the MPA model, in spite of its superior efficiency. Thus, the basic assumption of the RD model that all ranks are governed by the same underlying choice process is overly restrictive and cannot be supported by the data. This misspecification not only affected the coefficient values, but also led to significant overestimates of willingness to pay.
In addition, the discussion illustrated how a series of standard validity tests developed for contingent valuation studies can be adapted to the context of contingent ranking data. The results from the pesticide survey were shown to perform well in terms of theoretical and convergent validity, as well as sensitivity to scope. However, the results of the necessarily somewhat imperfect tests for criterion validity suggested that some degree of hypothetical bias could be present.
The basic finding of the study was that consumers were on average willing to pay 0.7 pence extra per loaf of bread to avoid a case of human illness and 5.3 pence per loaf to protect one species of farmland bird. An alternative way of expressing this is that, on average, respondents were only willing to tolerate seven to eight additional cases of human illness to save an entire species of farmland bird.
The conditional logit model of choice between environmentallydifferentiated loaves of bread can be put to use in a range of different applications. Perhaps the most obvious of these is the design of a bread product which could be marketed under an eco-label. Here the model can be used to inform as to the balance of price, human health and biodiversity impacts which is most likely to maximise the market share of such a loaf. However, the relative weighting of health and biodiversity impacts obtained from the model also have wider uses; in particular, in informing the choice between alternative agrochemical products which differ in their range of environmental damages. Indeed, such weights could ultimately be used in the design of a differentiated pesticide tax.
References
Adamowicz, W., Louviere, J. and Williams, M. (1994). Combining Revealed and Stated Preference Methods for
Beggs, S., Cardell, S. and Hausman, J. (1981). Assessing the Potential Demand for Electric Cars, Journal of
Ben-Akiva, M. and Lerman, S. R. (1985). Discrete Choice Analysis: T h e q and Application to Travel Demand, Cambridge, Mass.: MIT Press.
Ben-Akiva, M., Morikawa, T. and Shiroishi, F. (1991). Analysis of the Reliability of Preference Ranking Data, Journal of Business Research, 23, 253-268.
Boyle, K J., Welsh, M. P., and Bishop, R C. (1993). The Role of Question Order and Respondent Experience in Contingent Valuation Studies, Journal ofEnvimnmmta1 Economics and Management, 25(1), 80-99.
Boyle, K J., Desvousges, W. H. ,Johnson, F. R. , Dunford, R. W. and Hudson, S. P. (1994). An Investigation of Part-Whole Bias in Contingent Valuation Studies, Journal of Enuimnmmlal Economics and Management, 27(1), 64-83.
Valuing Environmental Amenities, Journal ofEnvironmental Economics and Management, 26, 271-292.
E ~ ~ n ~ m e h ' c s , 16, 1-19.

20 Viuia Foster and Susana Mowato
Eom, Y. S. (1994). Pesticide Residue Risk and Food Safety Valuation: A Random Utility Approach, Amrican Journal of Agricultural Ecmomics, 76,760-771.
Eom, Y. S. and Smith, V. K. (1994). Calibrated Non-Market Valuation. Discussion Paper 9421, Resources for the Future, Washington DC, USA.
Foster, V., Bateman I. J. and Harley, D. (1997). A Non-Experimental Comparison of Real and Hypothetical Willingness to Pay, Journal of Agncultural E c m i c s , 48(2), 123-138.
Foster, V. and Mourato, S. (1997). Behavioural Consistency, Statistical Specification and Validity in the Contingent Ranking Method Evidence from a Survey of the Impacts of Pesticide Use in the UK. Working Paper GEC 9749, Centre for Social and Economic Research on the Global Environment, University College London, and University of East Anglia, UK.
Fredman, P. (1995). Endangered Species: Benefit Estimation and Policy Implications. Report No. 109, Department of Forestry Economics, Swedish University of Agricultural Sciences, Umea, Sweden.
Hanley, N., MacMillan, D., Wright, R., Bullock, C., Simpson, I., Parsisson, D. and Crabtree, B. (1998). Contingent Valuation Versus Choice Experiments: Estimating the Benefits of Environmentally Sensitive Areas in Scotland, Journal of Agn'cultural Economics, 49(1), 1-15.
Hanley, N., Wright, R and Adamowicz, V. (1998). Using Choice Experiments to Value the Environment, Environmmlal and Resource Economics, 11(3-4), 413-428.
Hawman, J. k and Ruud, P. A. (1987). Specifying and Testing Econometric Models for Rank-Ordered Data, Journal of Econometrics, 34,83104.
Johnson, F. R. and Desvousges, W. H. (1997). Estimating Stated Preferences with Rated-Pair Data: Environmental, Health, and Employment Effects of Energy Programmes,]ournal ofEnvimmenta1 Economics and Managemen4 34,79-99.
Krinsky, I. and Robb, A. L. (1986). On Approximating the Statistical Properties of Reported Elasticities, The
Lareau, T. J. and Rae, D. A. (1985). Valuing Willingness to Pay for Diesel Odor Reduction: An Application of
Louviere, J. J. (1988). AnalyzingDccision-Making Mebic Conjoint Analysis, No. 67 Quantitative Applications in the
McClean, R, and Anderson, V. (1984). Applied Factorial and Fractional Designs, New York: Marcel Dekker.
MacFadden, D. (1973). Conditional Logit Analysis of Qualitative Choice Behaviour, in Zarembka, P. (ed.)
ReviRu ojEconomics and S&atirtics, 68, 715-719.
the Contingent Ranking Technique, Southern Economic Journal 55(3), 728442.
Social Sciences Series, Sage University Papers, Sage Publications, Newbury Park, California.
Frontim in Econmbics , New York Academic Press.
Mitchell, R and Carson, R (1989). Using Survcys to ValuePublic Goodr: The Contingent Valuation Method, Resources for the Future, John Hopkins Press, Baltimore.
Morrison. M., Bennett, J., Blarney. R. and Louviere, J. (1998). Choice Modelling and Tests of Benefit Transfer, Research Report No& The University of New South Wales.
Reaves, D., Kramer, R. and Holmes, C. (1994). Valuing the Endangered Red-Cockaded Woodpecker and Its Habitat: A Comparison of Contingent Valuation Elicitation Techniques and a Test for Embedding. Paper Presented at the Association of Environmental and Resource Economists Session of the Annual American Economics Association Meetings, San Diego, California.
Smith, V. K. and Desvousges, W. (1986). Measuring Wafer Quality Benefits, Boston: Kluwer-Nijhoff.
Stevens, T. H., Echevarria, J.. Glass, R J., Hager, T. and More T. A. (1991). Measuring the Existence Value of
Tolley, C., Kenkel. D. and Fabian, R. (1994). Valuing Health for Policy: An Economic Approach, Chicago: University
van Ravenswaay, E. 0. and Hoehn, J. P. (1991a). The Impact of Health Risk Information on Food Demand: A Case Study of Alar and Apples, in Caswell. J. A. (ed.), Economics ofFood Safety. Elsevier Science Publishing Co. Inc., New York, USA.
van Ravenswaay, E. 0. and Hoehn, J. P. (1991b). Contingent Valuation and Food Safety: The Case of Pesticide Residues in Food, Staff Paper No. 91-13, Department OfAgricultural Economics, Michigan State University, East Lansing, Michigan, USA.
Wildlife: What Do CVM Estimates Really Show?, Land Economics, 67(4), 390-400.
of Chicago Press.
Valuing the Multiple Impacts of Pesticide Use in the UK: A Contingent Ranking Approach 21
van Ravenswaay, E. 0. and Hoehn, J. P. (1991~). Consumer Willingness to Pay for Reducing Pesticide Residues in Food: Results of a Nationwide Survey, Staff Paper No. 91-18, Department of Agricultural Economics, Michigan State University, East Lansing, Michigan, USA.
van Ravenswaay. E. 0. and Hoehn. J. P. (1991d). Consumer Perspectives on Food Safety Issues: The Case of Pesticide Residues in Fresh Produce, Staff Paper No. 91-20, Department of Agricultural Economics, Michigan State University, East Lansing, Michigan, USA.
Veisten, R, Hoen, H.. Navrud, S and Strand, S. (1993). Valuing Biodiversity in Norwegian Forests: A Contingent Valuation Study with Multiple Bias Testing. Memorandum No. 7, Department of Economics, University of Oslo.
Weaver, R. D. (1994). Pesticide Use and Consumer Demand for Product Quality: A Survey of Evidence, Pcsficidz Use and Roduu Quality, Proceedings of a Workshop Sponsored by the Agricultural and Food Marketing Consortium, The Farm Foundation, Oak Brook, Illinois, USA.
APPENDIX
Section 2: Contingent Ranking Give Showcard E fo respondent and read the follow’ng
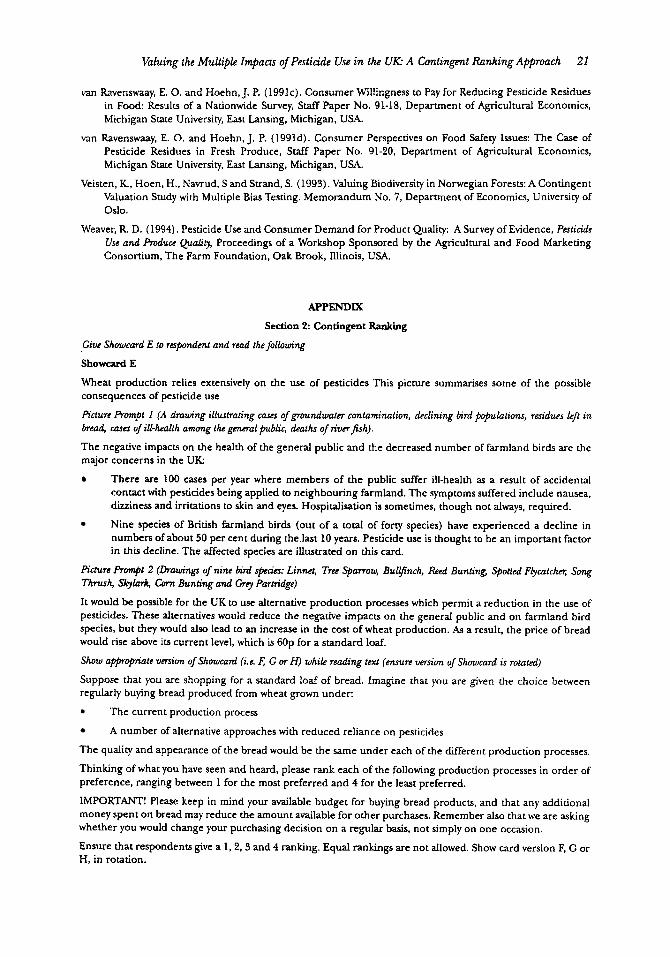
Showcard E Wheat production relies extensively on the use of pesticides This picture summarises some of the possible consequences of pesticide use
Picture Prompt 1 (A drawing illustrating cases ojgroundwatw contamination, declining bird populations, raidups kff in bread, cases of ill-htalfh among !he general public, deafhs of r ivwfih) .
The negative impacts on the health of the general public and the decreased number of farmland birds are the major concerns in the UK:
There are 100 cases per year where members of the public suffer ill-health as a result of accidental contact with pesticides being applied to neighbouring farmland. The symptoms suffered include nausea, dizziness and irritations to skin and eyes. Hospitalisation is sometimes, though not always, required.
Nine species of British farmland birds (out of a total of forty species) have experienced a decline in numbers of about 50 per cent during the last 10 years. Pesticide use is thought to be an important factor in this decline. The affected species are illustrated on this card.
Picfun Romp& 2 (Drawings of nine bird species: Linnet, Tree Sparrow, Bullfinch, Reed Bunting, SPotfrd Flycafchet; Song Thrush, Skylad, Cmn Bunting and Gr? Partridge)
It would be possible for the UK to use alternative production processes which permit a reduction in the use of pesticides. These alternatives would reduce the negative impacts on the general public and on farmland bird species, but they would also lead to an increase in the cost of wheat production. As a result, the price of bread would rise above iu current level, which is 60p for a standard loaf.
Shmu appropriate version of Showcard f i e . E G OT H) while reading text ( m r e version of Showcard is rotated)
Suppose that you are shopping for a standard loaf of bread. Imagine that you are given the choice between regularly buying bread produced from wheat grown under:
The current production process
The quality and appearance of the bread would be the same under each of the different production processes.
Thinking of what you have seen and heard, please rank each of the following production processes in order of preference, ranging between 1 for the most preferred and 4 for the least preferred.
IMPORTANT! Please keep in mind your available budget for buying bread products, and that any additional money spent on bread may reduce the amount available for other purchases. Remember also that we are asking whether you would change your purchasing decision on a regular basis, not simply on one occasion.
Ensure that respondents give a 1 , 2 , 3 and 4 ranking. Equal rankings are not allowed. Show card version F, G or H, in rotation.
A number of alternative approaches with reduced reliance on pesticides