van gool, bronwyn (2007) effects of blasting on the ... · 904072 904077 904078 average blast hole...
TRANSCRIPT

This file is part of the following reference:
van Gool, Bronwyn (2007) Effects of blasting on the stability of paste fill stopes at Cannington Mine. PhD thesis,
James Cook University.
Access to this file is available from:
http://eprints.jcu.edu.au/4833

Chapter 6 - Applying a Blast Load
6. Applying a Blast Load
6.1. Introduction
One of the most important aspects of building a numerical model to estimate the effects of blasting on
paste fill is to ensure that a representative blast load is applied to the model. A number of methods of
applying a blast load are available. The most suitable method of applying a blast load to a numerical
model is dependent on the purpose of the model. For this project, it is necessary that the blast loading
function is representative of loads applied to the blast hole walls during a blast, and is numerically
efficient. The different methods of applying blast loads available in ABAQUS/Explicit and the
method chosen for this project are discussed in this chapter.
6.2. What Happens When an Explosive Detonates?
When an explosive detonates in a blast hole in rock, the chemical reaction produces a gas at a very
high temperature and pressure. This gas exerts a very high pressure on the blast hole walls, pushing
the walls outwards and shattering the rock surrounding the blast hole. The high pressure sends a
stress wave through the rock, which expands radially from the blast hole. The tangential stress from
this wave causes radial cracks to occur around the blast hole. The gases then expand into the cracks
surrounding the blast hole, opening up the cracks and reducing the pressure of the gas. The response
of the material surrounding the blast hole to loading from the detonation of an explosion can be
categorized into the following three zones (Brady and Brown, 1993):
1. Shock zone or crushed zone: In the immediate vicinity of the blast hole, the rock behaves
mechanically as a viscous solid and the stress wave causes the material to be crushed or
extensively cracked. The radius of the shock zone is approximately twice the radius of
the blast hole.
2. Transition zone: The transition zone is immediately outside the shock zone. The rock
behaves as a non-linear elastic solid subject to large strain in this region. New cracks are
initiated in the radial direction in this zone by interaction of the stress wave with the
crack population. The radius of this zone is approximately 4 to 6 times the radius of the
blast hole.
92

Chapter 6 - Applying a Blast Load
3. Seismic Zone: Beyond the transition zone, the rock behaves linearly elastically and rock
behaviour can adequately be explained by elastic fracture mechanics theory. Crack
propagation in this region occurs by extension of the longest cracks in the transition zone.
These zones are shown in Figure 6.1. During blasting in the mine, the paste fill is always located
within the seismic zone and never within the shock or transition zone. Therefore the interest in the
numerical modelling is mainly with the seismic zone. This can be clearly seen from the field
monitoring discussed in Chapter 3. The production blasts monitored consisted of 89 mm diameter
boreholes, with a transition zone radius of 0.18 to 0.27 m. The nearest borehole was located 2 m from
the paste fill.
Seismic Zone
Figure 6.1 - Fragmentation Zones Around a Blast Hole in Rock
If the stress wave encounters a free boundary, the compressional wave is reflected back as a tensional
wave, and cracking known as spalling may occur at the boundary if the tensile stress of the wave is
larger than the tensile strength of the rock (Atchison 1968).
As these two energy sources, shock wave and gas penetration, occur both simultaneously and almost
instantly, it is difficult to determine which explosive effects occur from each source. A look at the
literature shows that authors are divided over which energy source has the greatest effect, and shows
that in order to accurately model the damage to the blast hole walls, both effects must be considered.
Sarracino and Brinkmann (1990) compared the damage caused by explosives enclosed in metal tubes
to prevent gas penetration and normal blast holes. The acceleration and strain measurements showed
that the character of shock transmitted from both were the same. Although there is some
disagreement between researchers over the effects of the shock wave and the gas penetration, many
authors agree that the shock wave stresses and causes acceleration to the surrounding material, while
93

Chapter 6 - Applying a Blast Load
the majority of fracturing is caused by gases penetrating into crack surrounding the blast hole
(Sarracino and Brinkmann, 1990; Daehnke et al., 1996; Liu and Katsabanis, 1997).
The gases produced during the explosion provide the load to the surrounding rock. During
detonation, the gases are produced quickly, and so the load would be expected to increase from zero
to the maximum load over a very short period of time. When the rock immediately surrounding the
blast hole is shattered, the gas expands into the new volume available, reducing the pressure and
therefore the blast load. The gas pressure continues to reduce as the gas expands into the cracks
produced by the shock waves. This reduction in pressure would be gradual due to the time required
for the gas to expand into the cracks. Therefore, the expected shape of the load curve relative to time
is a sudden, almost instantaneous increase from zero to maximum load, followed by a gradual
decrease.
6.3. Measuring Blast Damage
In order to model the effect of blasting on paste fill, a measure of blast damage is required. When an
explosive detonates, stress waves are generated and travel through the solid, causing ground
vibration. This ground vibration causes the particles in the rock mass to run through an elliptical
motion, and the highest velocity experienced by the particle is known as the peak particle velocity
(ppv). Persson et al. (1994) were able to make reliable predictions of rock damage based on the
vibration particle velocities in the rock. Field monitoring results presented in chapter 3 indicate that
damage is observed in paste fill when peak particle velocities of the order of 2.5 mls are experienced.
6.4. Prediction ofPeak Particle Velocity
As discussed in Section 2.3, when an explosive detonates, stress waves are generated and travel
through the solid, causing ground vibration. This ground vibration causes the particles in the rock
mass to run through an elliptical motion, and the highest velocity experienced by the particle is
known as the peak particle velocity (Holmberg and Persson, 1979). The peak particle velocity
decreases with distance from the charge, and can be predicted by equation 2.3 for a spherical
explosive.
However, explosives are commonly loaded into blast holes, as shown in Figure 2.3. In this figure, the
bottom of the blast hole is filled with explosive, and the blast hole is 'stemmed' with an inert
material. Holmberg and Persson (1979) modified equation 2.3 to predict the peak particle velocity for
94

Chapter 6 - Applying a Blast Load
blast waves resulting from columns of explosive, resulting in equation 2.5 which is valid when P is
equal to 2ex, which is often seen in rock.
As discussed in Section 2.3, Sartor (1999) used this equation to model the vibration induced damage
from blasting in rock at Cannington Mine. The constants in the equation were found to be: k = 2938,
ex = Yz P= 0.66. Field tests conducted in paste fill described in Chapter 4 were used to develop a site
specific equation for the paste fill at Cannington Mine. The constants were found to be k = 1000 and
P= 1.02.
Equation 2.5 can be used to determine the peak particle velocity a loading function should produce at
various distances from the charge. This can be used to validate the loading function. The average
linear charge density and blast hole length for a set of mass blasts monitored at Cannginton Mine is
given below in Table 6.1.
Table 6.1 Blast Parameters for Stope 4760
Blast Number
904061
904064
904065
904066
904068
904072
904077
904078
Average Blast Hole Length
(m)
15.7
2.0
15.5
14.7
20.6
20.0
20.1
20.7
Average Linear Charge
Density (kg/m)
6.217
6.223
6.213
6.212
5.563
5.367
8.611
6.300
95
Chapter 6 - Applying a Blast Load
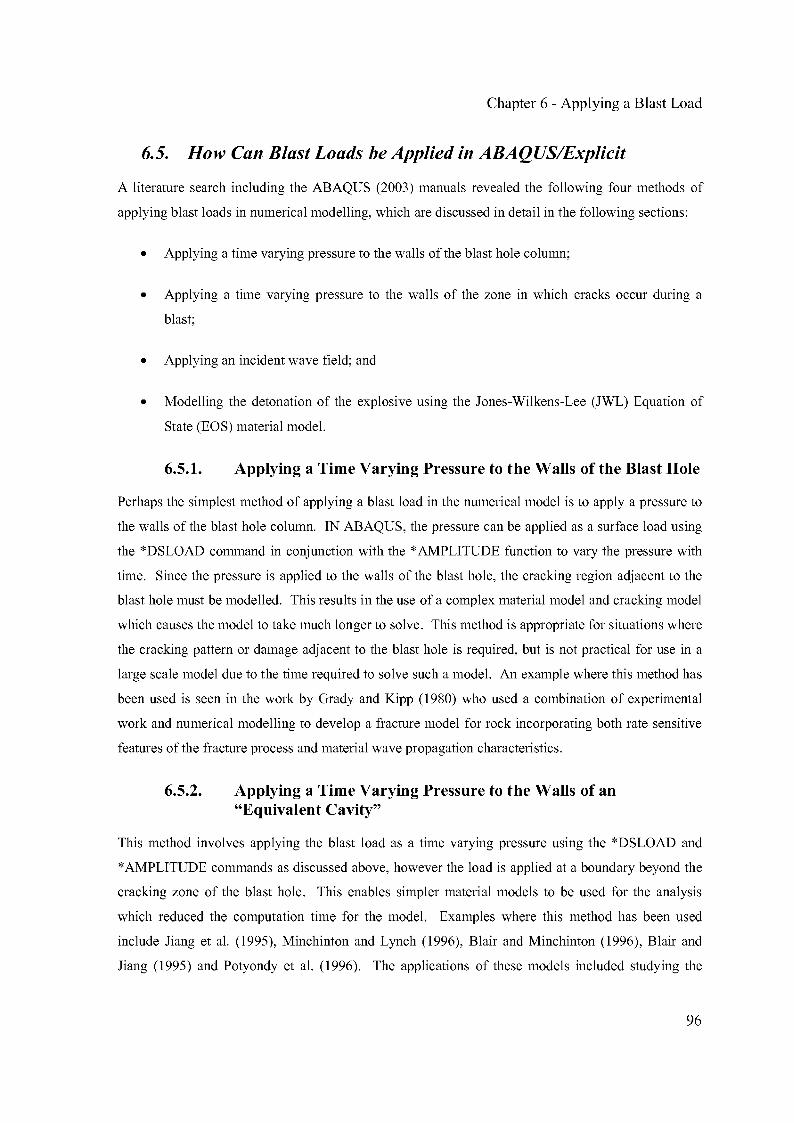
6.5. How Can Blast Loads be Applied in ABAQUSIExplicit
A literature search including the ABAQUS (2003) manuals revealed the following four methods of
applying blast loads in numerical modelling, which are discussed in detail in the following sections:
• Applying a time varying pressure to the walls of the blast hole column;
• Applying a time varying pressure to the walls of the zone in which cracks occur during a
blast;
• Applying an incident wave field; and
• Modelling the detonation of the explosive using the Jones-Wilkens-Lee (JWL) Equation of
State (EOS) material model.
6.5.1. Applying a Time Varying Pressure to the Walls of the Blast Hole
Perhaps the simplest method of applying a blast load in the numerical model is to apply a pressure to
the walls of the blast hole column. IN ABAQUS, the pressure can be applied as a surface load using
the *DSLOAD command in conjunction with the *AMPLITUDE function to vary the pressure with
time. Since the pressure is applied to the walls of the blast hole, the cracking region adjacent to the
blast hole must be modelled. This results in the use of a complex material model and cracking model
which causes the model to take much longer to solve. This method is appropriate for situations where
the cracking pattern or damage adjacent to the blast hole is required, but is not practical for use in a
large scale model due to the time required to solve such a model. An example where this method has
been used is seen in the work by Grady and Kipp (1980) who used a combination of experimental
work and numerical modelling to develop a fracture model for rock incorporating both rate sensitive
features of the fracture process and material wave propagation characteristics.
6.5.2. Applying a Time Varying Pressure to the Walls of an"Equivalent Cavity"
This method involves applying the blast load as a time varying pressure using the *DSLOAD and
*AMPLITUDE commands as discussed above, however the load is applied at a boundary beyond the
cracking zone of the blast hole. This enables simpler material models to be used for the analysis
which reduced the computation time for the model. Examples where this method has been used
include Jiang et al. (1995), Minchinton and Lynch (1996), Blair and Minchinton (1996), Blair and
Jiang (1995) and Potyondy et al. (1996). The applications of these models included studying the
96
Chapter 6 - Applying a Blast Load
damage zone around a blast hole (Blair and Minchinton 1996) and studying surface vibrations due to
a vertical column of explosive (Blair and Jiang 1995).
6.5.3. Incident Wave Field
The *INCIDENT WAVE option is used in ABAQUS to apply incident wave loads such as those
experienced due to an underwater explosion or a blast in air. This method is designed to model loads
due to external wave sources, which occur in a fluid external to the structure of interest. This fluid is
often air or water. Different methods are available depending on whether the user wishes to model
the wave in the fluid and the structure, or the wave only in the structure (ABAQUS 2003). Since
blasting in an underground mine involves explosives detonated in the rock mass, and not in a fluid,
the *INCIDENT WAVE option was not considered a feasible option for loading the numerical model.
Applications of this method include modelling the impact of air blasts or underwater explosions on
nearby structures.
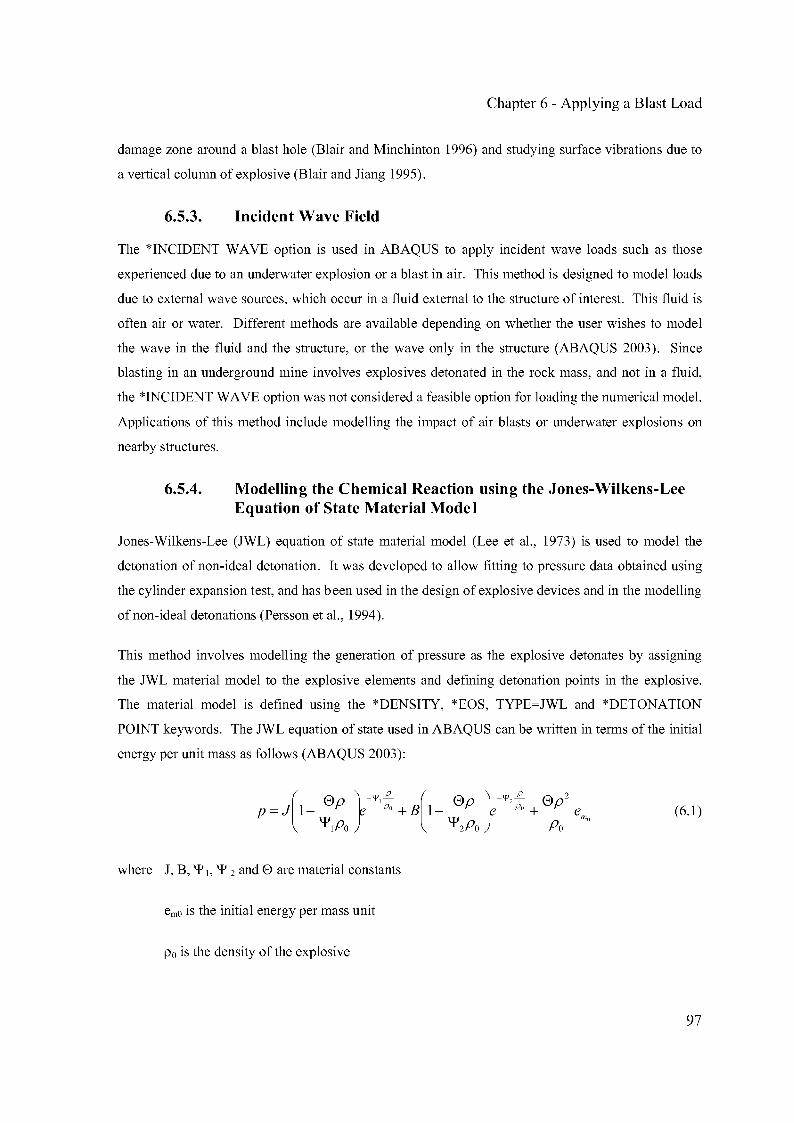
6.5.4. Modelling the Chemical Reaction using the Jones-Wilkens-LeeEquation of State Material Model
Jones-Wilkens-Lee (JWL) equation of state material model (Lee et al., 1973) is used to model the
detonation of non-ideal detonation. It was developed to allow fitting to pressure data obtained using
the cylinder expansion test, and has been used in the design of explosive devices and in the modelling
of non-ideal detonations (Persson et al., 1994).
This method involves modelling the generation of pressure as the explosive detonates by assigning
the JWL material model to the explosive elements and defining detonation points in the explosive.
The material model is defined using the *DENSITY, *EOS, TYPE=JWL and *DETONATION
POINT keywords. The JWL equation of state used in ABAQUS can be written in terms of the initial
energy per unit mass as follows (ABAQUS 2003):
(6.1)
where J, B, '¥), '¥ 2 and e are material constants
emO is the initial energy per mass unit
po is the density of the explosive
97

Chapter 6 - Applying a Blast Load
P is the density of the detonation products
The arrival time of the detonation wave at a material point is calculated as the distance from the
material point to the nearest detonation point divided by the detonation wave speed, and takes into
account the detonation delay of the given detonation point (ABAQUS 2003).
This method was used by Yang et al. (1996), Liu and Katsabanis (1996) and Thorne et al. (1990).
Applications included the development of constitutive models for blast damage (Yange et al. 1996,
Liu and Katsabanis 1996) and investigation of the fundamental mechanisms of cratering (Thorne et
al. 1990).
6.5.5. Discussion of Blast Loading Methods
The advantages and disadvantages of the methods discussed above are given in Table 6.2. The
method of blast loading to choose for any project depends on the purpose of the modelling and the
desired results. The purpose of this project is to assess the effects of blast loads on nearby paste fill
material. The blast holes are located in the rock, and the paste fill material is located near by but
outside the cracking zone of the blast hole. The lack of symmetry in the region of interest requires
the full paste fill stope to be included in the model, resulting in large scale models in 3-dimensions.
Due to the large scale of the model, a blast loading method that is numerically efficient is required to
ensure that the model can be solved within a reasonable time frame. The results of interest are the
velocities experienced in the nearby paste fill as a result of the blast. Therefore, the blast loading
method for this project must provide reliable results in the paste fill at a distance from the blast
source, but reliable results within the cracked zone are not necessary. The method of applying a
pressure to the walls of the zone in which cracks occur (see section 6.5.2) was found to satisfy these
requirements.
6.6. Concept ofan "Equivalent Cavity"
A cylindrical "equivalent cavity" was used in order to model only the seismic zone, in which elastic
wave propagation is expected to occur. This method avoids modelling the region where new cracks
in the material are initiated from the shock wave during an explosion. The concept of an "equivalent
cavity" was first proposed by Sharpe (1942). Sharpe's work, and work by other authors (Kutter and
Farihurst, 1971; Blair and Jiang, 1995) have shown that the use of an "equivalent cavity" gives
reasonable agreement with field measurements. When this concept is used, the blast pressure is
applied to the walls of the "equivalent cavity" instead of the walls of the blast hole. The radius of the
98

Table 6.2 Advantages and Disadvantages of Methods of Applying a Blast Load
Chapter 6 - Applying a Blast Load
Method
Applying a time varying
pressure to the walls of the
blast hole column (see
section 6.5.1)
Applying a time varying
pressure to the walls of the
zone in which cracks occur
during a blast (see section
6.5.2)
Applying an incident wave
field (see section 6.5.3)
Model the chemical reaction
in a blast hole using the JWL
Equation of State Material
Model (see section 6.5.4)
Advantages
Accurately models the effects of a
blast load to the rock mass
surrounding the blast hole,
including cracking
Accurately models the effects of a
blast load to the rock mass
surrounding the cracked region
Numerically efficient
Models the loading on structures
due to explosives blasts in a
"fluid" external to the structure
Accurately models the explosion
in a blast hole and the loading on
the rock mass surrounding the
blast hole, including cracking
Disadvantages
Numerically expensive due to
complex cracking models and small
mesh sizes required.
Does not provide accurate model
results in the cracked region
surrounding the blast hole
Not applicable for cases where the
blast occurs within the structure of
interest.
Numerically expensive due to
complex reactions in the blast hole
and complex cracking model sand
small mesh sizes required.
TypicalUse
Generally used for modelling the
cracking in the region immediately
surrounding the blast hole. Not
generally used for large scale
models.
Used to model the transmission of
the shock wave through the material
Generally used for loading due to
underwater explosions on structures
or airblast loading on structures
Generally used for modelling the
cracking in the region immediately
surrounding the blast hole. Not
generally used for large scale
models.
99

Chapter 6 - Applying a Blast Load
cavity is set a distance from the blast hole wall that ensures that the strength of the material is greater
than the stresses experienced from the shock wave, which is typically thought to occur between 3 and
9 times the blast hole radius (Kutter and Fairhurst, 1971). A value of 3 times the blast hole radius
was used in this dissertation. This will result in the load being applied in the transition zone shown in
Figure 6.1.
The method of using an equivalent cavity allows the behaviour of the material in the seismic zone to
be modelled without the need to model the cracking that occurs around the blast hole. For large scale
models such as those used in this work, this method dramatically reduces the solving time of the
models, as complex material models and cracking models are not required. As the paste fill is not in
the area immediately surrounding the blast hole where cracks are expected to occur, the development
of the cracks surrounding the blast hole does not need to be modelled. It is the shockwave travelling
through the ore and into the paste fill which causes the damage to the paste fill and threatens the
stability of the stope. In ABAQUS, if a sufficient load is applied to the model, the program will
model the transmission of the shock wave through the material. Hence, an initial load is required that
will transmit an equivalent shock wave through the model as that measured in the field. Since the
purpose of this work is to model the behaviour of paste fill rather than the behaviour of the rock in the
immediate vicinity of the blast hole, the use of an equivalent cavity is appropriate. However, the use
of an equivalent cavity would not be suitable if the behaviour of the rock in the vicinity of the blast
hole was required.
6.7. Explosives Being Modelled
The loading function applied to the numerical model will be dependent on the explosive used in the
given application. Emulsion type explosives were used in both the field tests and the production
blasts at Cannington Mine. In the test blasts in paste fill, cartridges of the explosive Powergel
Powerfrag were used, and in the production blasting that was monitored, the explosive Powerbulk
VE, at a density of approximately 1.0 g/crrr' was used. Both explosives were supplied by Orica.
Information about these explosives is given in the Tables 3.1 (Powerbulk VE) and 4.2 (Powergel
Powerfrag).
Powergel Powerfrag is a high strength, detonator sensitive packaged explosive. It is designed for
priming applications, such as the initiation of explosive columns, and for use as a medium density
column explosive in mining and general explosive work. Powergel Powerfrag is supplied in
cartriges. Powerbulk VE is a primer sensitive bulk emulsion explosive that has been designed for
100

Chapter 6 - Applying a Blast Load
used in underground blasting applications. Powerbulk VE is a fluid with a viscosity similar to that of
heavy grease. It is pumped into boreholes and can be used for boreholes of up to 35 m length. The
explosive can be detonated using either a primer or a Powergel packaged explosive cartridge in
conjunction with a detonator.
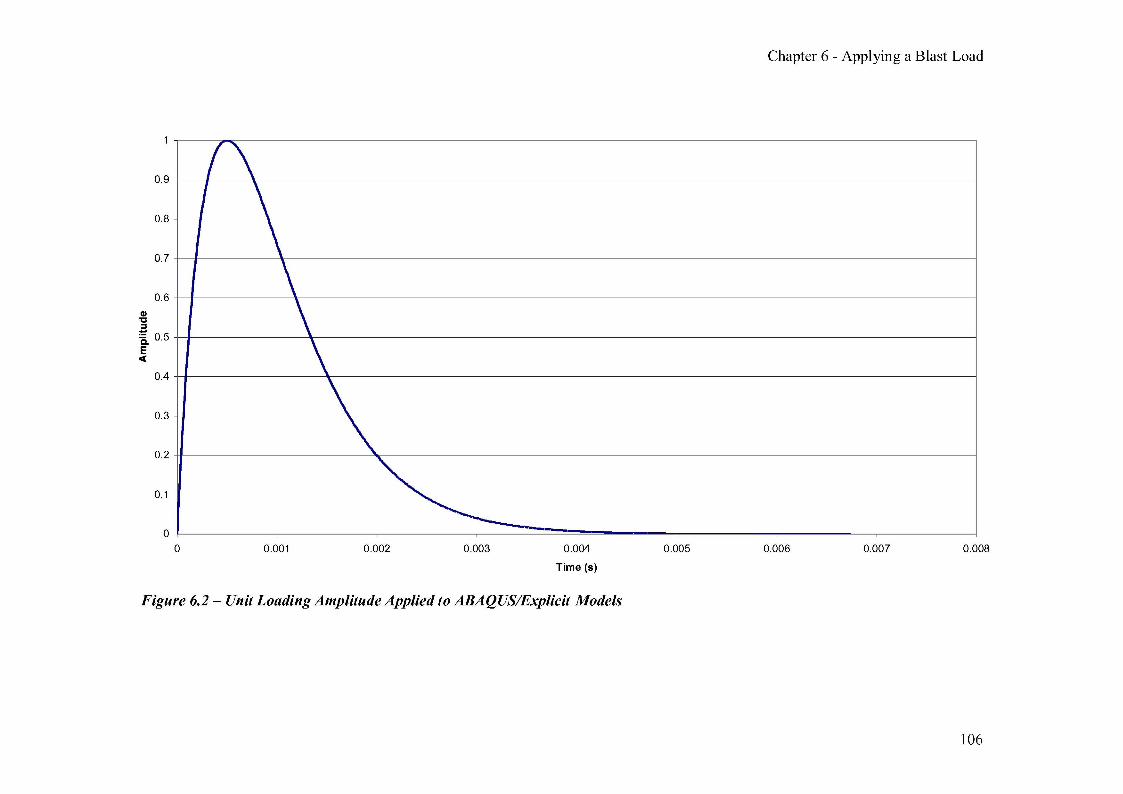
6.8. Form ofthe Loading Function
As discussed in section 6.2, the pressure from an explosive blast is expected to increase to maximum
pressure quickly, and slowly dissipate as the gasses penetrate the cracked region. In ABAQUS, a
time-varying pressure is applied using the *DSLOAD function in conjunction with the *AMPLITUDE
function. When the load is applied, the data lines on the *DSLOAD function include the name of the
amplitude function, and the maximum pressure. The maximum pressure is then multiplied by the
amplitude function. Therefore, a 'unit' amplitude function is required.
The literature was consulted at this point of the development of the blast loading function to
determine the expected shape for a blast loading function, or the functions used in numerical models
by other researchers. A summary of loading functions used to model explosive materials is given in
Table 6.3. These loading functions were used to model a variety of scenarios. Only the functions
used to model blasting in a mine were considered as a possible loading function for use in this
dissertation. Jiang et al. (1995) used the function given as equation 2.10 to model an emulsion
explosive in rock, by applying the pressure to the walls of an equivalent cavity. Emulsion type
explosives are also used at Cannington Mine. Therefore, the loading function represented by
equation 2.10 was used to apply blast loads to the numerical models. The unit function is shown in
Figure 6.2 for n = 1 and P= 2000 used by Jiang et al. (1995). These values for nand Pwere adopted
for this work. The calculation of the initial peak pressure is discussed in section 6.8.1.
101
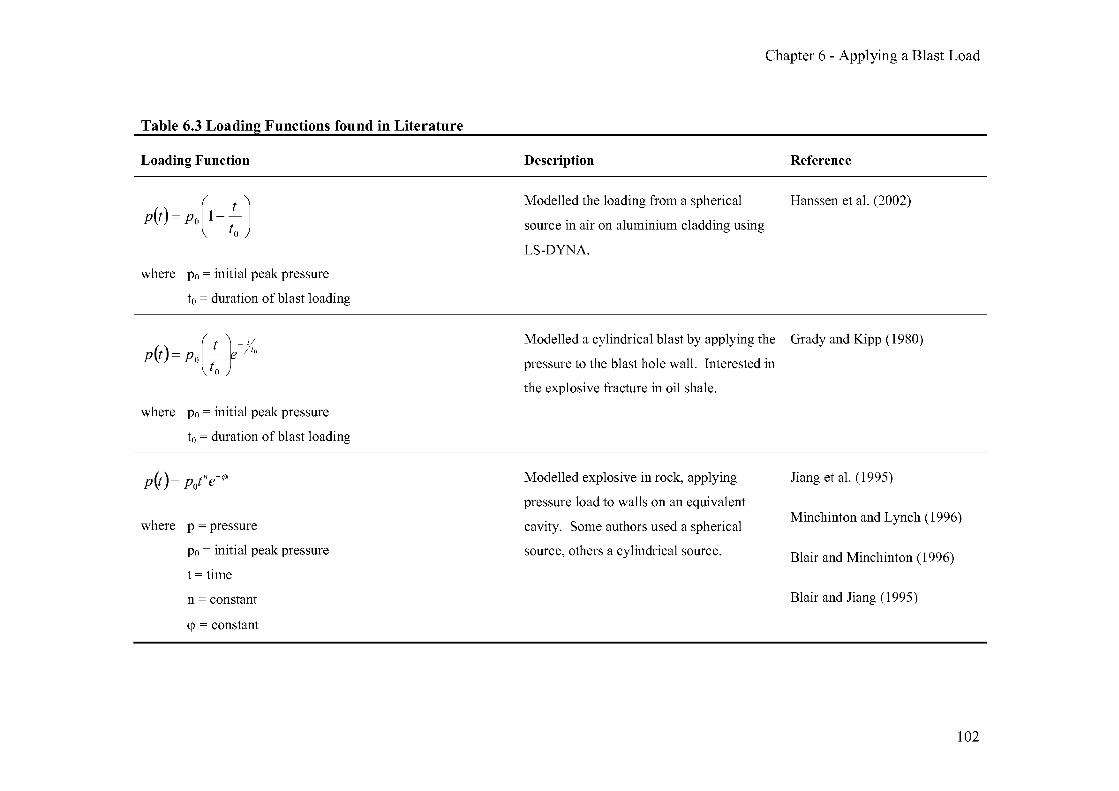
Table 6.3 Loading Functions found in Literature
Loading Function
p(t)~ P{I- :. Jwhere Po = initial peak pressure
to = duration of blast loading
Description
Modelled the loading from a spherical
source in air on aluminium cladding using
LS-DYNA.
Chapter 6 - Applying a Blast Load
Reference
Hanssen et al. (2002)
p(t) ~ po[:. } to
where Po = initial peak pressure
to = duration of blast loading
Modelled a cylindrical blast by applying the Grady and Kipp (1980)
pressure to the blast hole wall. Interested in
the explosive fracture in oil shale.
p~)= potne-qJt
where p = pressure
Po = initial peak pressure
t = time
n = constant
<p = constant
Modelled explosive in rock, applying
pressure load to walls on an equivalent
cavity. Some authors used a spherical
source, others a cylindrical source.
Jiang et al. (1995)
Minchinton and Lynch (1996)
Blair and Minchinton (1996)
Blair and Jiang (1995)
102

Loading Function
t-fa
p{t) = PrJl- (t - tJle ;Yr,
where Pm = resulting peak overpressure
ta = arrival time
b = waveform parameter
Ts= positive phase duration
Chapter 6 - Applying a Blast Load
Description Reference
Modelled the explosion of a bomb in a city Smith et al. (2000)
street using small-scale experiments and
numerical simulation. This was a spherical
source from an air blast.
Vmaxv, (t) = _r- (t - t ) t ~ t ~ l.lto It a a a
• a
[ ( Jl (I-I)t t II -04 _a
Vr~)= v;uax 1-0.4 ~a a ~e . la Llz, < t
Vr~)= 0 O~t~ta Modelled ground shock wave propagation
using FLAC to consider the effect of
explosive loads in the design of
underground civil defence structures. A
spherical explosive source was assumed.
Olofsson et al. (1999)
where Vr = radial velocity relative to the centre of charge
vrmax
= peak radial velocity
ta = arrival time of ground shock time, t a = ;;:p
r = distance from centre of charge
cp = longitudinal seismic velocity
t = time after explosion
103

Loading Function
P(t)=Pm:
P(t)=Pm
p(t)= pJO.76+2000t)-2
where Pm = tnaxtmum pressure
tr = rise time
t[ = fall-off time
p(t) = Po sin (mt)
t < t,
t; :<::; t < t f
t > t f
Description
Applied a time-varying pressure to the
outer surface of a cylinder three times the
diameter of the actual blast hole, avoiding
simulation of the crushed zone. A
cylindrical source was used.
Modelled a sill mat in a mine which was
subjected to seismic loads
Chapter 6 - Applying a Blast Load
Reference
Potyondy et al. (1996)
O'Hearn and Swan (1989)
Modelled structural response to sinusoidal Todo and Dowding (1984)
excitation and real blast vibration transients
104

Loading Function
Linear Pressure Pulse
maximum pressure at t = 0 s
Description
Modelled sacrificial claddings under blast
loading from an air blast explosion
(spherical source)
Chapter 6 - Applying a Blast Load
Reference
Guruprasad and Mukherjee
(2000)
zero pressure at t = 0.00108 s
JWL Equation of State
Noted the spherical pressure front can be
approximated as a plane pressure front if
the distance of explosion is high compared
to the dimensions of the plane surface that
is subjected to the blast loading.
Modelled cratering due to an explosive
charge, using a new damage model for
rock.
Yang et al. (1996)
Liu and Katsabanis (1996)
Thome et al. (1990)
105
Chapter 6 - Applying a Blast Load
0.0080.0070.0060.0050.004
Time (s)
0.0030.0020.001
~
r- ( \-
\\\
~
.............MIIl_____
oo
0.2
0.3
0.4
0.1
0.9
0.8
0.6
0.7
Q)"C
~Q. 0.5Ecr:
Figure 6.2 - Unit Loading Amplitude Applied to ABAQUSlExplicit Models
106

6.8.1.
Chapter 6 - Applying a Blast Load
Calculating the Initial Peak Pressure
The calculation of the initial peak pressure used in the loading function (equation 2.10) is
discussed in this section. The initial peak pressure was calculated for two cases, the explosion
of a Powergel Powerfrag cartridge in paste fill, and the explosion of Powerbulk VE in rock (see
Tables 4.2 and 3.1). The method used in this calculation is outlined below. The finite element
models created for this dissertation were created through a three stage modelling process. The
first stage of the modelling process involved validating the numerical model results of the
transmission of blast waves through paste fill against data from the field instrumentation tests.
The models created for stage 1 consisted of a single blast hole located in paste fill. Since the
stage 1 model was based on the field instrumentation tests in which one cartridge of explosive
was loaded into the blast hole, the pressure blast calculated for the explosion of a Powergel
Powerfrage cartridge was applied to the model.
The second stage of the process involved validating the numerical model results of the
transmission of blast waves through rock against the peak particle velocity predictions obtained
from equation 6.3 and the stage 2 model consisted of a single blast hole located in a body of
rock. The third and final stage of the modelling process involved modelling blast holes located
in rock at various distances from a paste fill stope. The blast pressure calculated for a column
of Powerbulk VE was applied to both the stage 2 and stage 3 models. The problem definition
and geometry of the models from all three stages are discussed in section 7.3.
1. The following numerical models of a single blast hole were used:
a. Paste Fill: The stage 1 model, described in section 7.3.2, was used to model the
detonation of a cartridge of explosive located in paste fill. This model was
based on the field instrumentation tests described in chapter 4. The
axisymmetric model consisted of a 3 m deep borehole, which was assumed to
contain a 0.2 m long cartridge of explosive material. An area 15 m wide and 6
m deep was modelled, with infinite elements along the side and base of the
model in order to provide a non-reflecting boundary. The mesh for the stage 1
model is shown in Figure 7.3.
b. Rock: Model 2, described in section 7.3.3, as used to model an explosive
column in rock. The axisymmetric model consisted of a 3 m deep borehole,
which was assumed to consist of 2 m of explosive material and 1 m of
stemming material. An area 15 m wide and 6 m deep was modelled, with
infinite elements along the side and base of the model in order to provide a
107
Chapter 6 - Applying a Blast Load
non-reflecting boundary. The mesh for the stage 2 model is shown in Figure
7.5.
2. The model was solved for a variety of blast loads using the time varying amplitude
specified by equation 6.5 and initial peak pressures ranging between 100 kPa and
1000 MPa. For each loading case, the peak particle velocity (ppv) was computed at a
number of points in the model that were located between 0.5 m and 14.0 m from the
centreline of the blast hole.
3. The results from all of the different loading cases were collated. For each point at
which the ppv was calculated, the ppv calculated by the model was plotted against the
initial peak pressure applied to the model. This created a separate plot for each point of
interest which showed the effect of the peak initial pressure on the ppv induced in the
surrounding material. Trend lines were fitted to the model results. The plots for the
points located 2.0 m and 5.0 m from the centreline of the blast hole in rock can be seen
in Figure 6.3. The plots created in this step were used in steps 4 and 5 to estimate the
peak initial pressure that should be applied to the model to produce the peak particle
velocities shown in the experimental data.
4. For each plot created in step 3, the ppv was predicted using the formulae presented in
section 6.4. The initial peak pressure to be applied to the model to calculate this ppv
was then read from the plot as shown in Figure 6.3.
5. The initial peak pressure value to apply to the models was the average of the values
obtained in step 4.
A pressure of 502 MPa was used for explosions in rock, and 45.1 MPa was used for explosions
in paste fill.
6.9. Validation ofthe Loading Function
In order to validate the loading function, the model of the explosive cartridge in paste fill and
the model ofthe explosive column in rock were run with the blast loads described in Section 6.8
applied. The results of these models were compared against the predicted ppv values for these
scenarios. The results of the explosive cartridge in paste fill are shown in Figure 6.4 and the
results ofthe explosive column in rock are shown in Figure 6.5.
108

Chapter 6 - Applying a Blast Load
ppv =4E-17p2 - 8E-09p + 0.2397
R2 =0.9986
35
• Model Results
- Poly. (Model Results)30
25
20
i 15~c.
10
5
0 •0.00 +00 2.00E+08 4.00E+08
-5
6.00E+08 8.00E+08 1.00E+09 1.20 +09
Initial Peak Pressure (Pal
(a)
+09
I
• Model Results
I- Poly. (Model Results)
/~V =4E- 18p2 + 2E-09p - 0.002
R2 =1.:/
~
.i->+00 2.00E+08 4.00E+08 6.00E+08 8.00E+08 1.00E+09 1.20 E
2
7
6
4
5
-1
o0.00
Initial Peak Pressure (Pal
(b)
Figure 6.3 - ppv Versus Pressure for 2 m Long Explosive Column in Rock(a) 2 m from Blast Column (bj 5 m from Blast Column
As seen in Figure 6.4, for distances greater than or equal to 2 m from the explosive in paste fill
the model matches the predicted ppv quite closely, although the ppv are overestimated at
distances less than 2 m from the source. Similar results are seen in rock.
109

Chapter 6 - Applying a Blast Load
- ppv Equation based on Field Data
• Numerical Model
•
\\
\ •
\~~ ----.----. • .--. ._ ---.
0.9
0.8
'iii" 0.7
1~ 0.6g"iii~ 0.5U1::~ 0.4...III
8? 0.3
0.2
0.1
oo 2 4 6 8 10 12 14
Distance from Blast (m)
Figure 6.4 - Validation ofthe Stage 1 Model- Cartridge ofExplosive in Paste Fill
I
• Numerical Model (Broadlands)
II
- ppv Equation, Sartor (1999)I
\
\IIIIIIII
\
'.~~.
-------~~._-.-.---+--. • • •
30
25
5
oo 2 4 6 8 10 12 14 16
Distance from Blast Hole (m)
Figure 6.5 - Validation ofStage 2 Model- Explosive Column in Rock
The model overestimates the ppv close to the explosive source as the crushing and cracking
mechanisms that occur in the vicinity surrounding the borehole are not considered in the
numerical model. As discussed in section 6.5.5, since the purpose of the modelling for this
110
Chapter 6 - Applying a Blast Load
dissertation is to predict the ppv in paste fill as a result of blasting in adjacent rock, the effect of
the stress wave is of interest rather than the crushing and fracturing which occurs around the
blast hole. Since the paste fill is not within 2 m of the blast hole in the stage 3 model of blast
holes in rock adjacent to paste fill, the results shown these models were found to produce
acceptable results.
6.10. Variables Which Affect Blast Loading
The models discussed previously in this chapter consisted of a single explosive in a rock or
paste fill mass. However, the production blast for the extraction of a stope in an underground
mine consists of multiple blast holes which are detonated with millisecond delays between the
detonation of each blast hole. There are many variables that can exist for a production blast,
including the type of explosive used, the size of the blast, the blast hole pattern and the
properties of the rock mass. These variables affect the stresses and peak particle velocities
induced in a rock mass due to the blasting that occurs during the extraction of a stope. Some of
these variables are discussed in the following sections.
6.10.1. Types of Explosives
The properties of explosives vary depending on the type of explosive. Commercial explosives
used for mining applications can be broken into two groups, low and high explosives. Low
explosives, such as black powder (or gun powder), are explosives that can be initiated by a
flame, while high explosives are explosives which require shock or impact for detonation. High
explosives consist ofthe following four main groups:
• Ammonium Nitrate-Fuel Oil (ANFO): As the name suggests, ANFO explosives
consists of a mixture of ammonium nitrate and fuel oil. The performance of ANFO
decreases when the explosive is exposed to water and mixtures containing more than 10
% water may fail to initiate. ANFO explosives have a velocity of detonation in the
range of 2200 - 4000 mls (Sen, 1995).
• Watergels: Watergels consist of a mixture of a gel base with ammonium nitrate and
sometimes aluminium powder. These explosives have a gelatinous consistency which
makes them suitable for use in wet conditions. Watergel explosives have a velocity of
detonation in the range of3500 - 5000 mls (Sen, 1995).
• Emulsions: Emulsion explosives consist of fine microscopic droplets of oxidiser salts,
finely dispersed into the continuous phase of fuel oil. These explosives have excellent
111

Chapter 6 - Applying a Blast Load
water resistance and can be detonated in deep wet blast holes. Emulsion explosives
have a velocity of detonation in the range of 4500 - 6100 mls (Sen, 1995).
• Gelignites: Gelignites are explosives which are based on nitroglycerine. They can be
manufactured in gelatinous or semigelatinous form depending on the power, density
and waterproofing requirements. Gelignite explosives have a velocity of detonation in
the range of3500 - 5500 mls (Sen, 1995).
Emulsion type explosives were used at Cannington Mine for the field tests, and the production
blasts which were instrumented and monitored for this project.
6.10.2. Rock Properties
The rock structure and material properties will generally have a greater effect on the
performance of blasting than the explosive properties. For the purpose of this modelling, it has
been assumed that the rock mass is an isotropic and homogenous body, however, this is
generally not the case. Rock masses contain joints and bedding planes which effect the
transmission of the blast wave through the rock. These joints and beddings complicate the
prediction of peak particle velocities and stresses in a rock mass due to the reflections of the
blast wave which occur.
Rock material properties such as dynamic compressive strength, elastic modulus, density,
porosity, internal friction, water content and in situ static stress effect the transmission of the
blast wave through the rock and the subsequent damage to the rock mass.
6.10.3. Mining Methods
The mining method which is used in a particular ore body depends on the type of rock and the
geometry of the ore body. The various underground mining methods include longwall, open
stope (also known as long hole stoping), cut and fill, room and pillar, shrinkage, sublevel caving
and vertical crater retreat. The blasting pattern used for a particular mine will be dependent on
the mining method.
At BHP Billiton's Cannington Mine, the open stope mining method is used with post placed
back fill, where the ore is mined in blocks referred to as stopes. In open stope mining, access to
the top and bottom of the ore block is set up with tunnels and a vertical hole is excavated from
the top to the bottom of the stope. Blast holes are then drilled in order to excavate vertical slabs
off the ore block (e-Gold Prospecting & Mining n.d.). The broken ore from the stope is then
loaded into trucks from draw points at the bottom of the stope and hauled to the surface (BHP
Billiton n.d.). Once the stope has been extracted, the void is filled with paste fill.
112
6.10.4. Blasting Pattern
Chapter 6 - Applying a Blast Load
The blast load applied to a rock mass is dependent on many factors including the geometry of
the ore body, the number of blast holes, the placement of the blast holes and the detonation
order and delay timing. The blast pattern chosen for an ore body depends on the application of
the blasting, the mining method being employed, the shape of the ore body, the depth and
geological characteristics ofthe ore body.
The following definitions are useful for the discussion of blast hole patterns.
• Burden: The distance from the blast hole to the nearest free face
• Spacing: The distance between adjacent blast holes, measured perpendicular to the
burden
• Charge length: The length of explosive in a blast hole
• Stemming: An inert substance, such as sand, filled between the explosive charge and
the collar ofthe blast hole to confine the explosion gases. Materials such as water, drill
cuttings, sand, mud and crushed rock are often used as stemming
• Decking: A technique of dividing the explosive column into two or more charges in the
same blast hole, separated by stemming material.
• Charge density: The charge mass distributed in the column of a blast hole, measured in
kg/m
A number of mining methods used in underground metal mines are shown in Figure 6.6,
categorised by mining application. The blasting methods shown in the figure are broadly
categorised into development and production blasts. Development blasts are the blasts required
to access the ore body and transport the material after excavation. This type of mining includes
tunnelling, shaft sinking, cross cutting and raising. Descriptions of the blasting patterns used in
development blasts are given in Sen (1995).
113

- Development -
Chapter 6 - Applying a Blast Load
- Wedgecutr-- Tunnelling------L__ Pyramidor diamond cut
- Dragcut
- Fancut
- Burncut
Blasting in anunderground metalmine '--- Shaft -c Conecut
Benchcut
- Production -[Short-Hole Blasting
. ---c RingBlastingLong-Hole Blasting L Bench
VerticalCrater
Figure 6.6 - Blasting Methods Used in Underground Metal Mines
Production blasts are the blasts used in mining of the ore body. The long-hole blasting methods
are of interest to this work. The three long-hole blasting systems are:
1. Ring Blasting
Ring blasting is the name given to the mining method that involves radial patterns of blast
holes. It is used in the mining of massive ore bodies. Ring blasting involves the three steps
listed below. These steps can be seen in Figure 6.7.
a. Excavation of the "ring drive", which is a tunnel running the full length of the stope
b. Excavation of the "slot", which is an empty space located at the end of the ring
drive
c. Drilling of sets of "rings" parallel to the slot
In ring blasting, the burden is defined as the distance between two consecutive rings, while
the spacing is defined as the distance between the ends of adjacent holes in the same ring,
measured as shown in Figure 6.7.
The collars of the blast holes are close together in ring blasting. As a result, a variable
stemming length is used to avoid overcharging the ore body in this region.
114
Chapter 6 - Applying a Blast Load
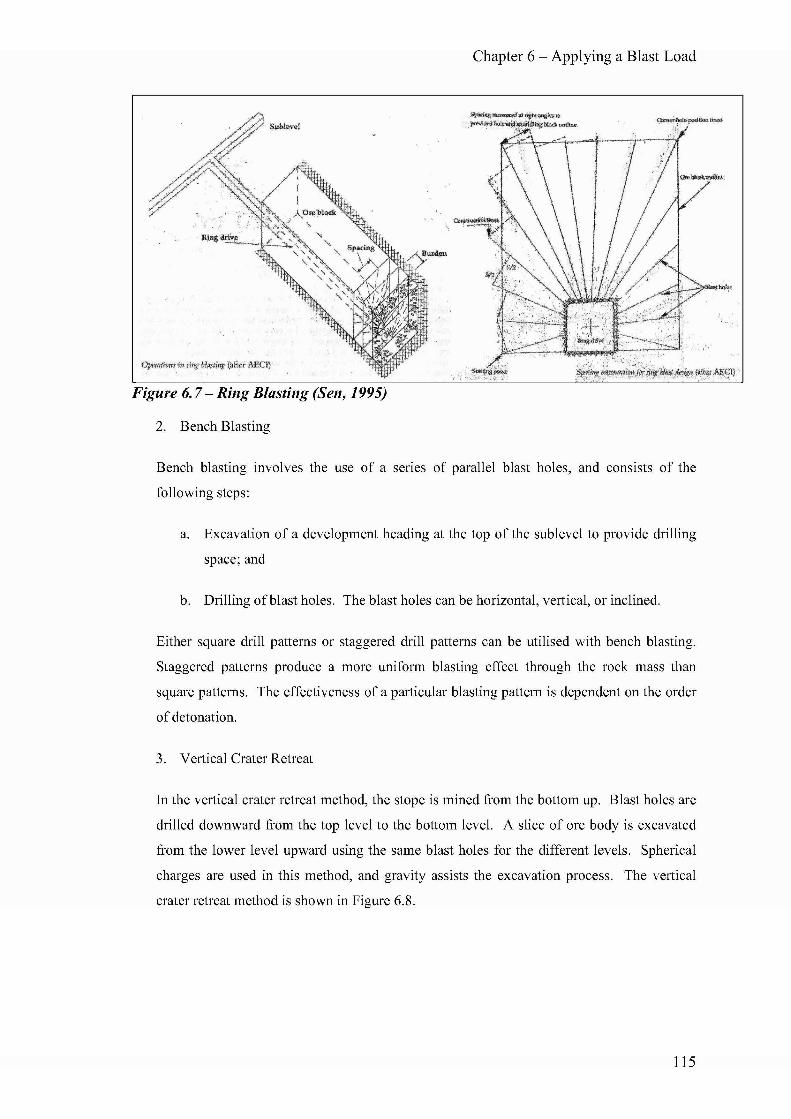
Figure 6.7- Ring Blasting (Sen, 1995)
2. Bench Blasting
Bench blasting involves the use of a senes of parallel blast holes, and consists of the
following steps:
a. Excavation of a development heading at the top of the sublevel to provide drilling
space; and
b. Drilling of blast holes. The blast holes can be horizontal, vertical, or inclined.
Either square drill patterns or staggered drill patterns can be utilised with bench blasting.
Staggered patterns produce a more uniform blasting effect through the rock mass than
square patterns. The effectiveness of a particular blasting pattern is dependent on the order
of detonation.
3. Vertical Crater Retreat
In the vertical crater retreat method, the stope is mined from the bottom up. Blast holes are
drilled downward from the top level to the bottom level. A slice of ore body is excavated
from the lower level upward using the same blast holes for the different levels. Spherical
charges are used in this method, and gravity assists the excavation process. The vertical
crater retreat method is shown in Figure 6.8.
115

Chapter 6 - Applying a Blast Load
Blast holes chargedready for firing4 - 5 m slice
Drilling level
Stope - back from previous slice
Sw ell removed
Production level
Vertical crater retreat method (after Agnew Ni ckel)
Figure 6.8 - Vertical Crater Retreat Blasting (Sen, 1995)
A combination of bench blasts and ring blasts were used in the production blasts monitored at
Cannington Mine.
6.10.5. Initiation Patterns
Initiation patterns can vary greatly, with the optimal initiation depending on the blasting
application, and geology. Initiation patterns are chosen to ensure that the blasting pattern is
always working towards a free face.
6.10.6. Delay Intervals
Delay intervals between the detonation of blast holes in a blast round are used to reduce the
ground vibrations and to increase fragmentation. The short delays are designed to allow the
rock of previous blasts to move away and the free face of the next blast hole to be uncovered so
that the blasting pattern is always working towards a free face. The delays are kept short
enough that the rock from previous rows is still hanging in the air at the time of detonation of
the next row, and is able to stop rock fragments from the second row from moving with greater
speeds than average. The optimal delay time for a blast is dependent on the burden.
116
6.10.7. Blast Size
Chapter 6 - Applying a Blast Load
The prediction of ppv from an explosive blast was discussed in section 6.4 and equations were
presented from which to predict ppv based on the mass of explosive and the distance from the
source. From equation 6.1 and 6.3 it can be seen that an increase in the linear charge density
(mass per unit length) of explosive will results in a corresponding increase in ppv. Therefore,
the ppv and consequently damage to the surrounding material can be decreased by reducing the
mass of explosive detonated at anyone time. This is achieved through the use of delay
intervals.
6.10.8. Velocity of Detonation
When an explosive detonates, the detonation is initiated at a point in the explosive material and
a detonation wave travels through the explosive material. The rate at which this wave travels
through the explosive is known at the velocity of detonation. The velocity of detonation is used
in determining explosive performance, and often depends on both the explosive type and the
blast hole diameter. Explosives with lower velocities of detonation tend to release gas energy
over a longer period of time than explosives with higher velocities of detonation. This results in
less fracturing around the blast hole and more heaving action. Therefore, the velocity of
detonation of a given type of exp losive can be used to determine which explosive is required for
a given application.
6.11. Summary
A blast loading function was identified in this chapter. In order to identify a method of
applying a blast load to the numerical model, the methods used by other authors and the
mechanics of a blast were investigated. The typical use and the advantages and disadvantages
of the different methods was considered along with the intent of the models created for this
dissertation to determine the most appropriate method of load application for this work. The
blast load was applied to the numerical model by applying a time-varying pressure pulse to the
walls of an "equivalent cavity". The form of the time-varying pressure pulse was based on the
function used by Jiang et al. (1995) to model the detonation of the same type of explosive. The
initial peak pressure for the time-varying pressure was set to the value required to produce peak
particle velocities similar to those observed in field tests. At the end of the chapter, variables
which affect the stresses and peak particle velocities induced in a rock mass due to the blasting
were discussed.
117