variable deletion strategies 1
TRANSCRIPT
Variable Deletion Strategies 1
Running head: VARIABLE DELETION STRATEGIES
Multivariate Variable Deletion Methods: Don’t Do Stepwise
TauGamba Kadhi
Texas A&M University
Paper presented at the annual meeting of the Southwest
Educational Research Association, San Antonio, TX, February
13-15, 2003.
Variable Deletion Strategies 2
Abstract
This paper explains the theory and methodology behind
the use of variable deletion in canonical correlational
analysis (CCA). Both the Capraro and Capraro (2002) and
the Cantrell (1997) data tables are evaluated and explained
in order to clarify strategies utilized. Understanding of
variable deletion strategies and their proper usages in a
CCA can assist a researcher in reporting a more replicable
study.
Variable Deletion Strategies 3
Variable Deletion Strategies in Canonical Correlation
Analysis
Any study using the General Linear Model (GLM) focuses
on explaining the explained in as few variables as possible
(parsimoniously). CCA is the most general form of the GLM
(Capraro & Capraro, 2002; French & Chess, 2002; Knapp,
1978; Thompson, 1984, 1991, 1998). Thompson (1991) also
clarified the generality of the CCAs, explaining that they
can perform all other parametric measures such as t-tests,
ANOVAs, Regressions, Discriminant Analysis, and MANOVAs.
Fewer variables in a CCA produce results that are more
generalizable, are more population driven than sample
driven, and more replicable (Cantrell, 1999; Capraro &
Capraro, 2002; Thompson, 1991; Thorndike, 1978).
Furthermore, as with all strategies of variable deletion in
GLM, stepwise is highly discouraged. Because stepwise
methods present a false number of degrees of freedom they
provide unscrupulous results that are usually nonreplicable
and should not be employed in statistical analysis
(Thompson, 1996).
In this paper, two studies were analyzed in order to
explain and clarify the proper procedures used in variable
deletion in CCA. Both the Capraro and Capraro (2002) and
Variable Deletion Strategies 4
the Cantrell (1997) data tables are evaluated and
explained. The Capraro and Capraro (2002) data consisted
of a real data set, testing 287 students with three
different tests (criteria variables) on six subscales
(predictor variables), while the Cantrell (1997) paper used
the Holzinger and Swinford (1939) heuristic data set,
testing three variables with eight subset variables.
This paper does not address the mathematical
applications used in creation of these tables but clarifies
the theory behind the strategies of variable deletion.
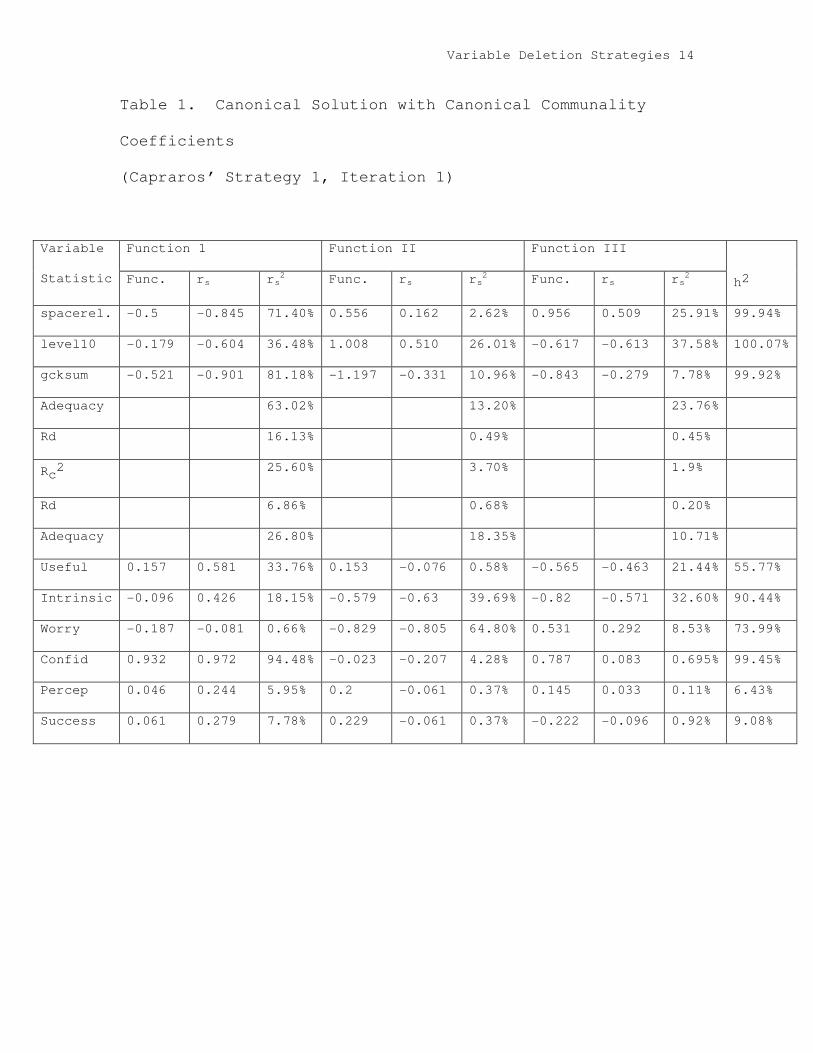
Strategy One: Delete the Canonical Communality
Coefficients (h2) while watching the Squared Canonical
Coefficient (Rc2)
1. Find the lowest h2 and delete it
2. Check change to Rc2 for each function
3. If there is little change to Rc2 find the next lowest h2
4. Delete it (repeat process until Rc2 change is too big)
INSERT TABLE 1 ABOUT HERE
INSERT TABLE 2 ABOUT HERE
INSERT TABLE 3 ABOUT HERE
Variable Deletion Strategies 5
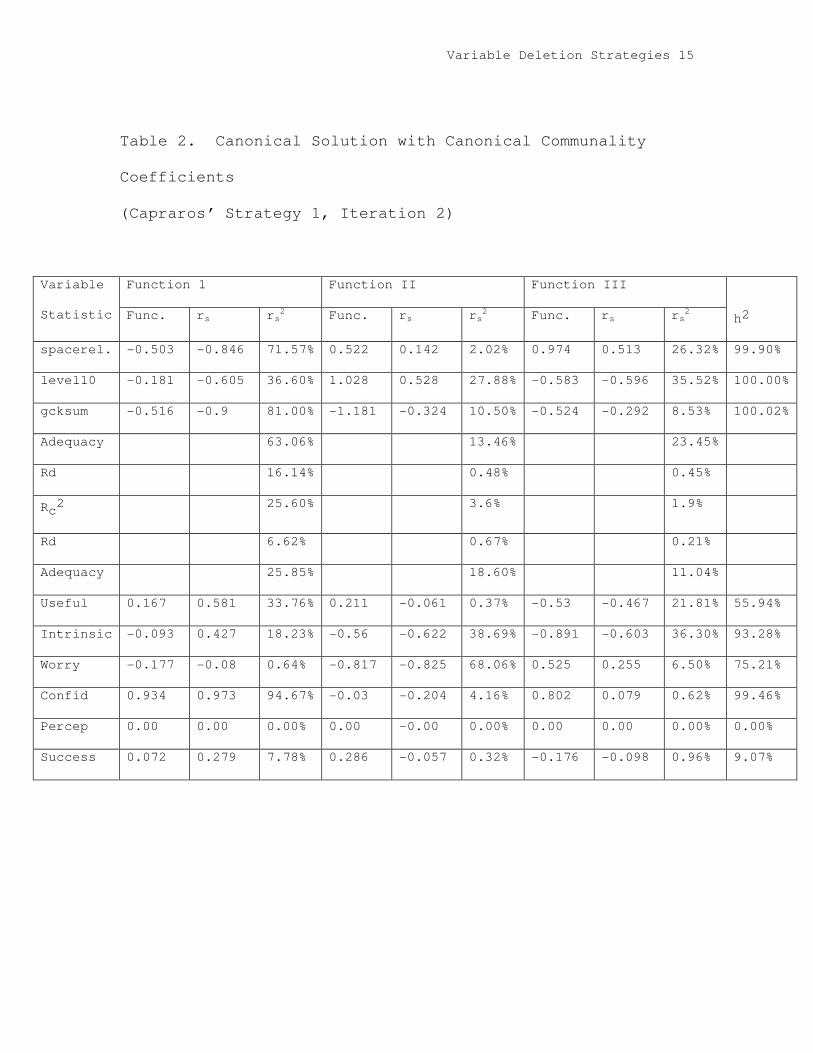
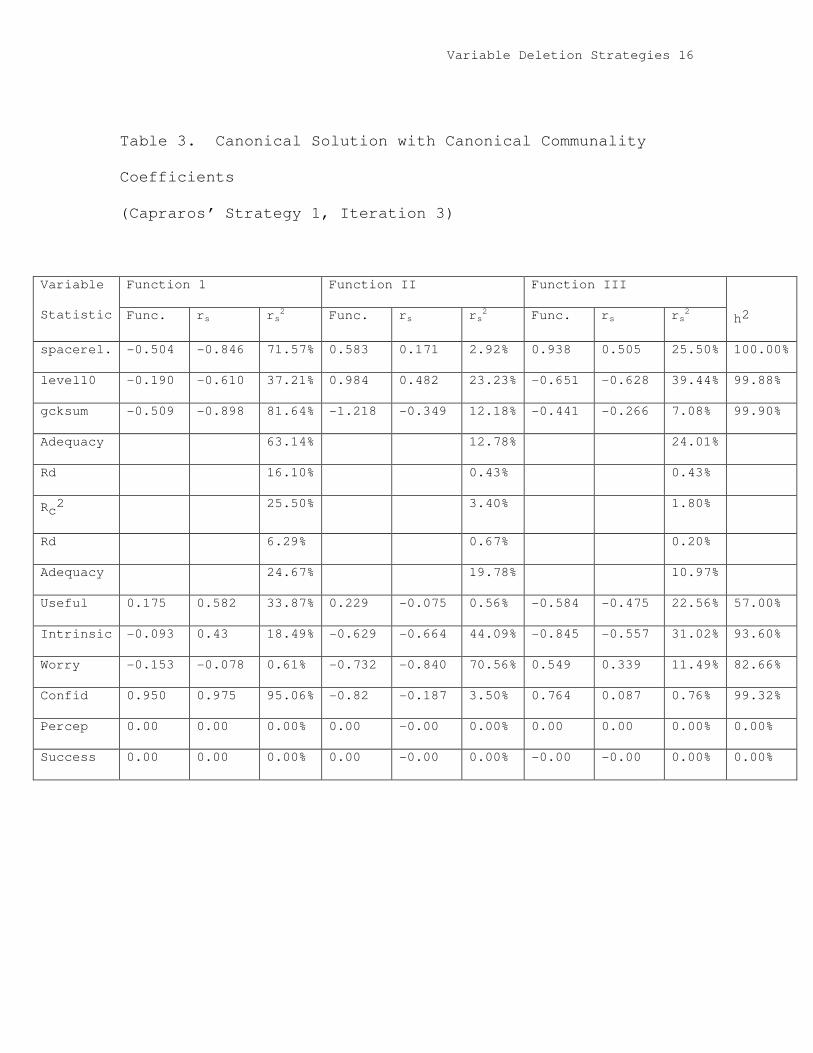
In the Capraro and Capraro (2002) Table 1, the smallest h2s
were perceptions (6.34%) and success (9.08%). Perceptions
was deleted first and the table was recalculated (see Table
2) and success next and the tables were again recalculated
(see Table 3). The largest change in Rc2 for each function
was less than 1%.
INSERT TABLE 4 ABOUT HERE
INSERT TABLE 5 ABOUT HERE
INSERT TABLE 6 ABOUT HERE
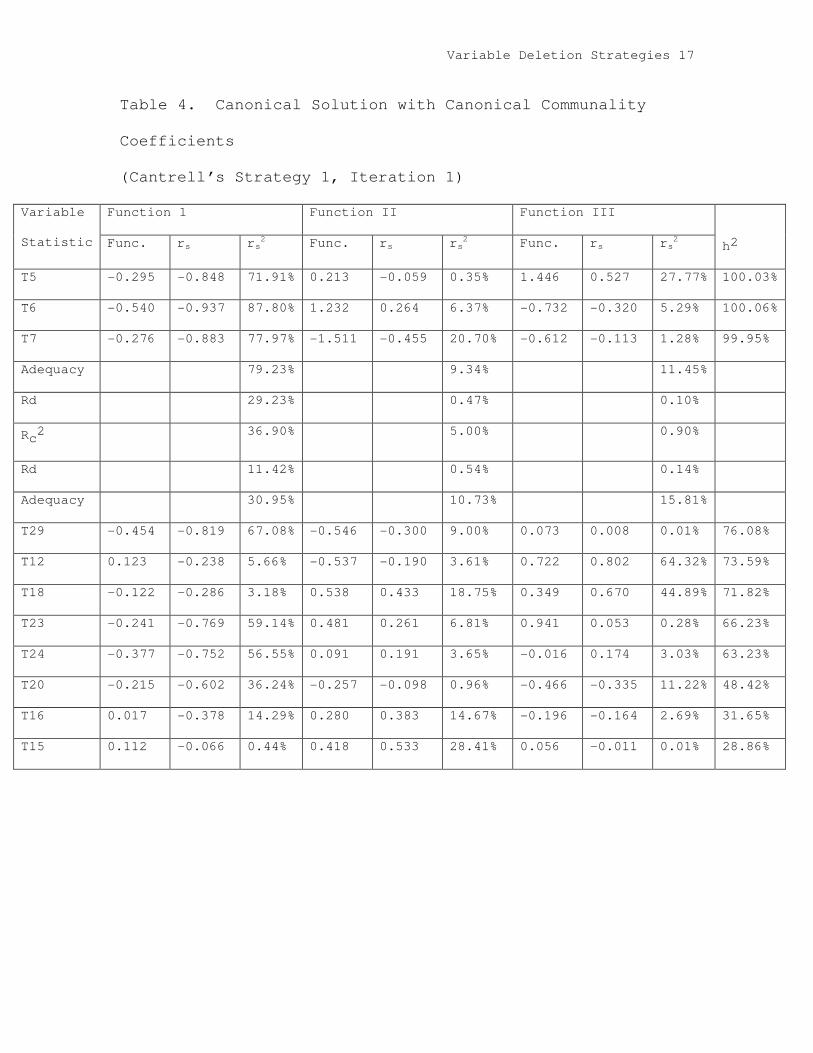
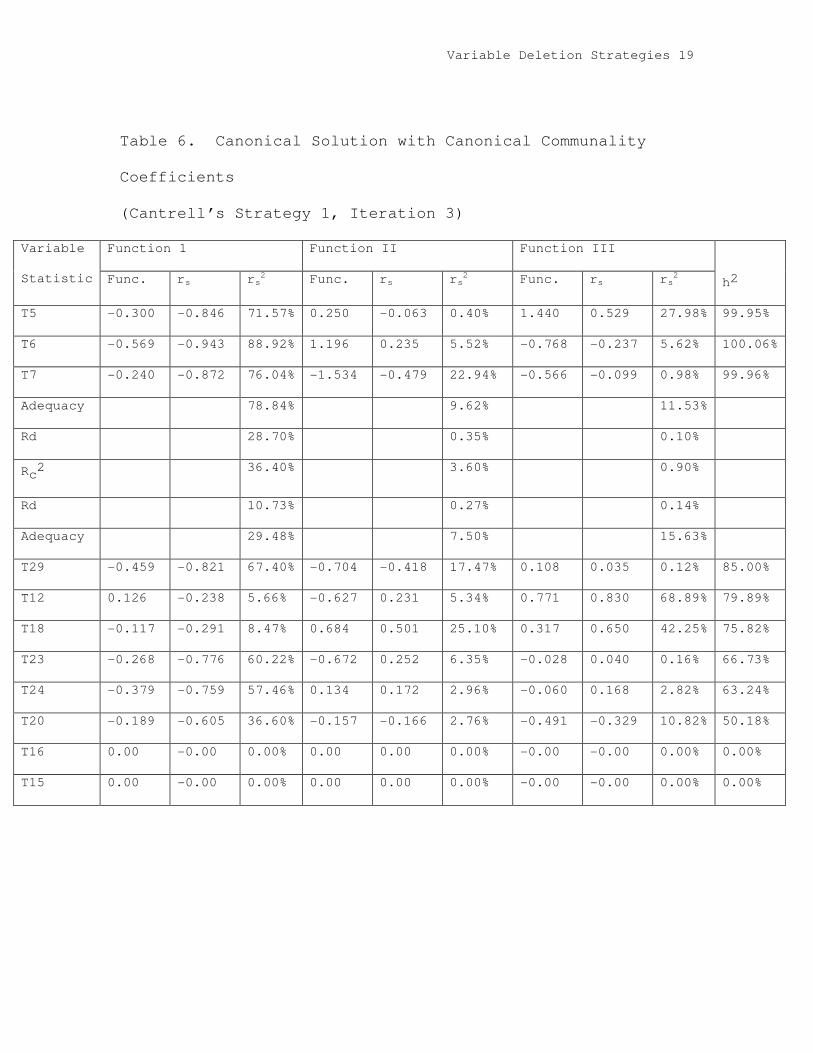
The Cantrell tables for strategy one produced similar
results (see Table 4). T15 was dropped first (see Table 5)
due to its low h2 and similarly T16 was deleted because of
its 32.83% h2 (see table 6). The dropping of these two h2s
resulted in a very small change in any of the three
functions.
Clearly, there is a negative aspect to this type of
deletion strategy. By focusing decision making mostly on
the h2 without taking into account the function effect size
(Rc2) until after variable deletion, a misguided researcher
could keep a large h2 that in a function with a small
Variable Deletion Strategies 6
effect size. Therefore, you could be left with a less
parsimonious solution (Capraro & Capraro, 2002).
Strategy two: Focus on functional contributions to total
solution
1. Look at Rc2
2. Omit function with small Rc2
3. Recompute subset of h2s
4. Find variable that has lowest h2; drop it from the
original solution
5. Stop when remaining variable are reasonably close in
their subset h2 values
INSERT TABLE 7 ABOUT HERE
INSERT TABLE 8 ABOUT HERE
INSERT TABLE 9 ABOUT HERE
INSERT TABLE 10 ABOUT HERE
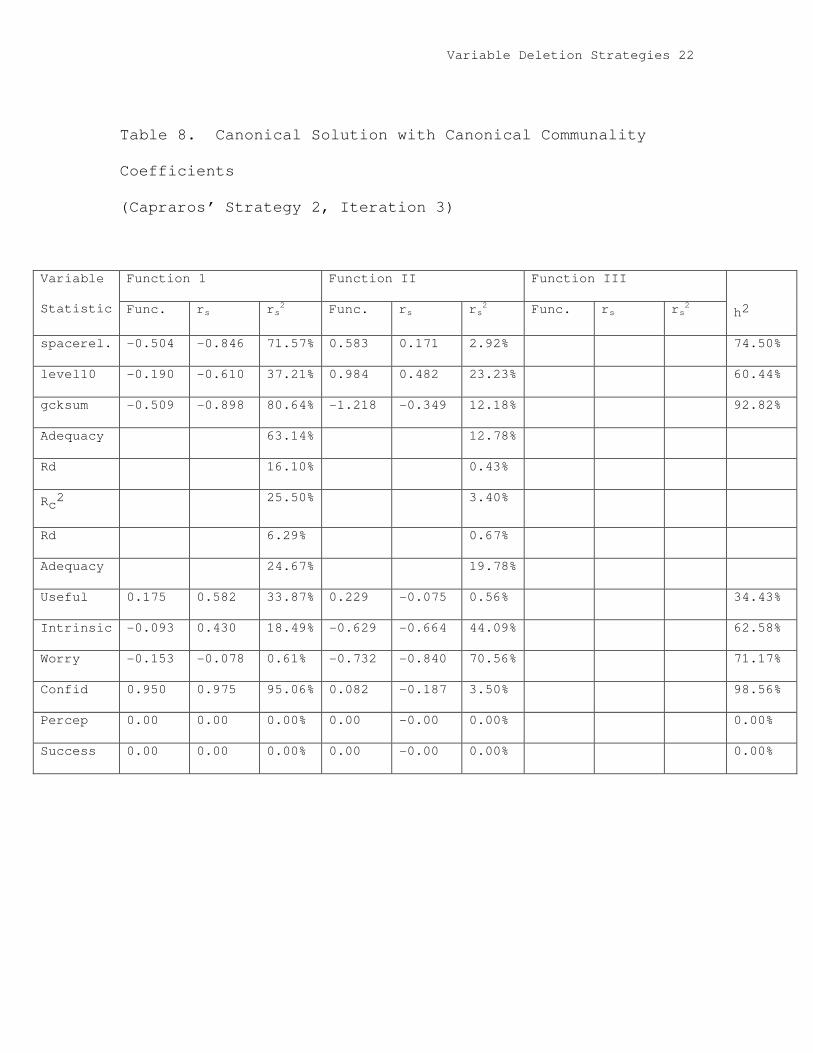
When looking at the Capraro and Capraro data Table 7,
notice the lowest squared canonical coefficient (Rc2) was
Function III (1.9%). Therefore, by employing strategy 2
this is the function that should be dropped. Then, after
recalculation of data (see Table 8), deletion of variables
Variable Deletion Strategies 7
commences. The first variable for deletion, due to low h2
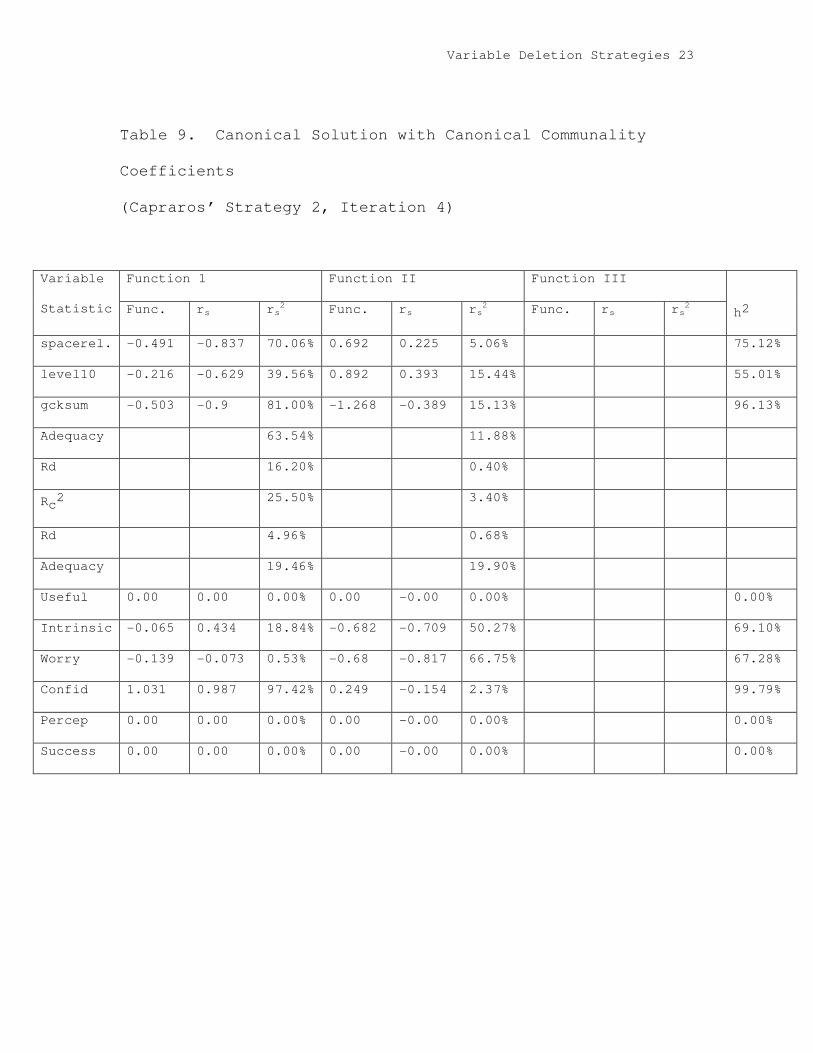
is perception (6.33%). Then table is recalculated (see
Table 9). Next, the variable success is dropped because of
low canonical communality coefficient (h2 = 8.11%). And
finally useful was dropped due to it not being close to the
other h2s.
INSERT TABLE 11 ABOUT HERE
INSERT TABLE 12 ABOUT HERE
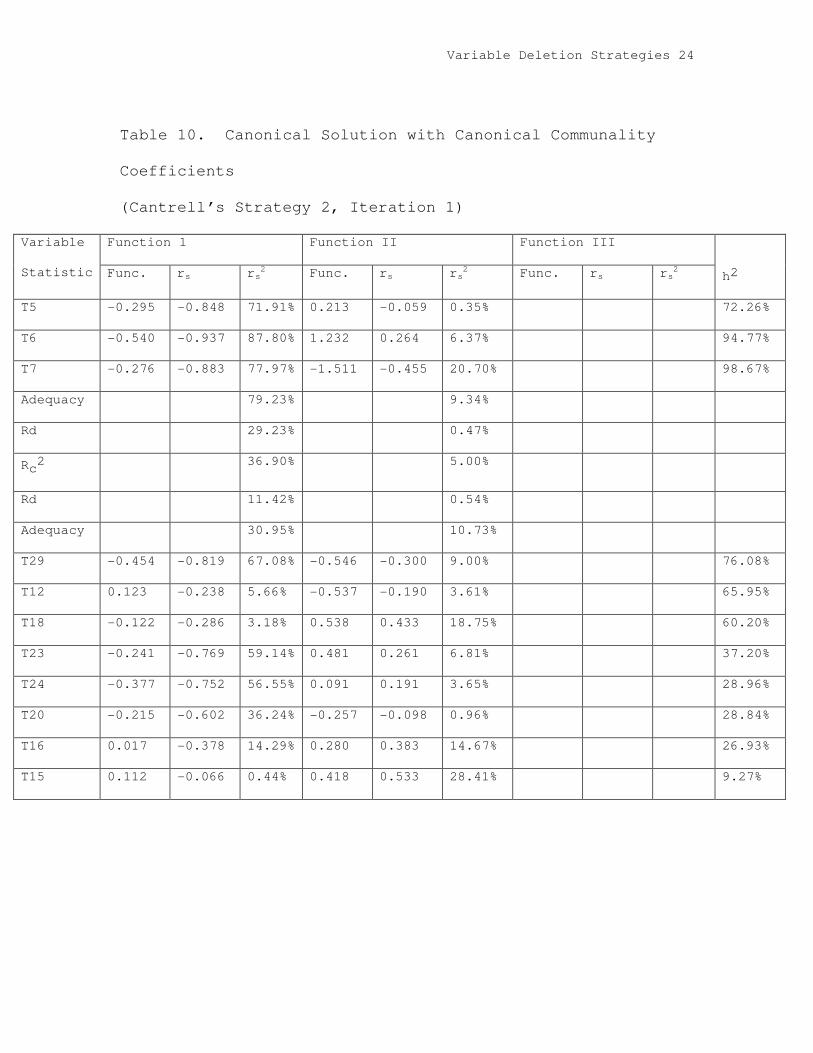
In the Cantrell data tables using strategy 2, Table
11 showed the recalculation of the variables after function
3 was dropped due to low Rc2 (.90%) (see Table 4). Next,
the correct procedure would require that the variable T17
be deleted due to lowest h2 and obvious distance from the
other canonical communality coefficient (26.93% being the
next lowest). Finally, due to the perception of the
researcher the iterations ended and the most parsimonious
solution was found (see Table 12).
Clearly, an argument about the soundness of a strategy
that ignores a function with a small squared canonical
coefficient can be made. Furthermore, this strategy seems
Variable Deletion Strategies 8
to ignore variation as to where h2 comes from (Capraro &
Capraro, 2002).
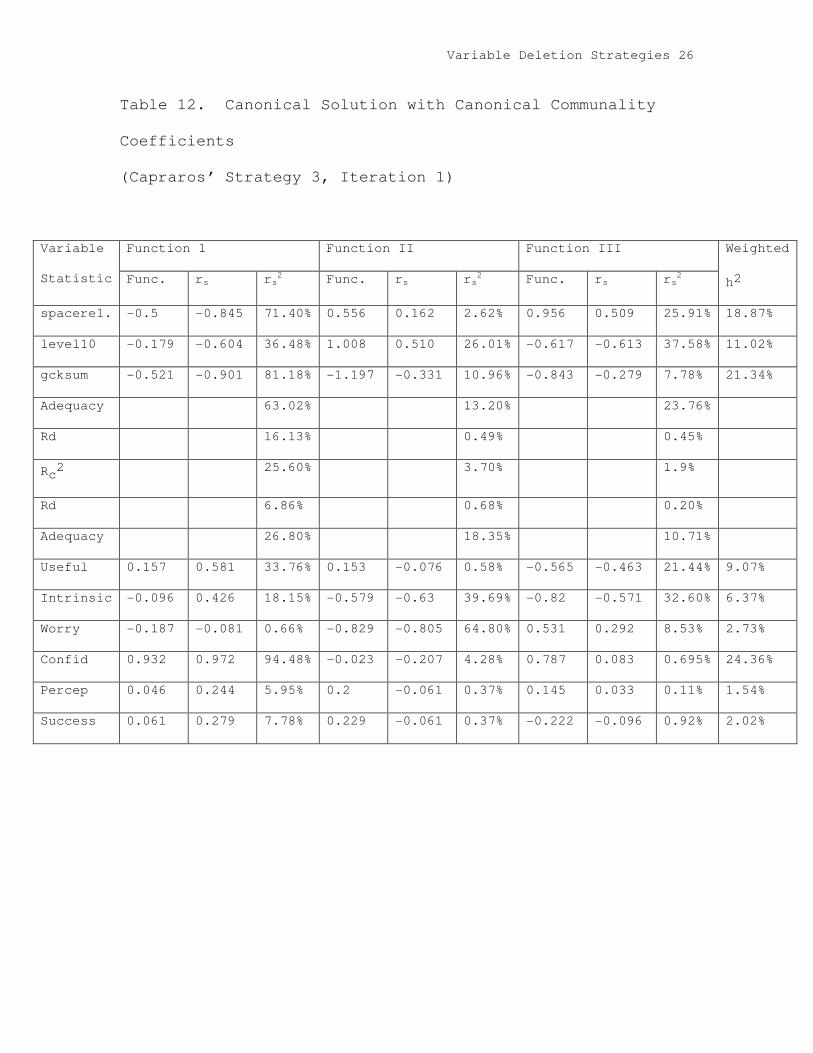
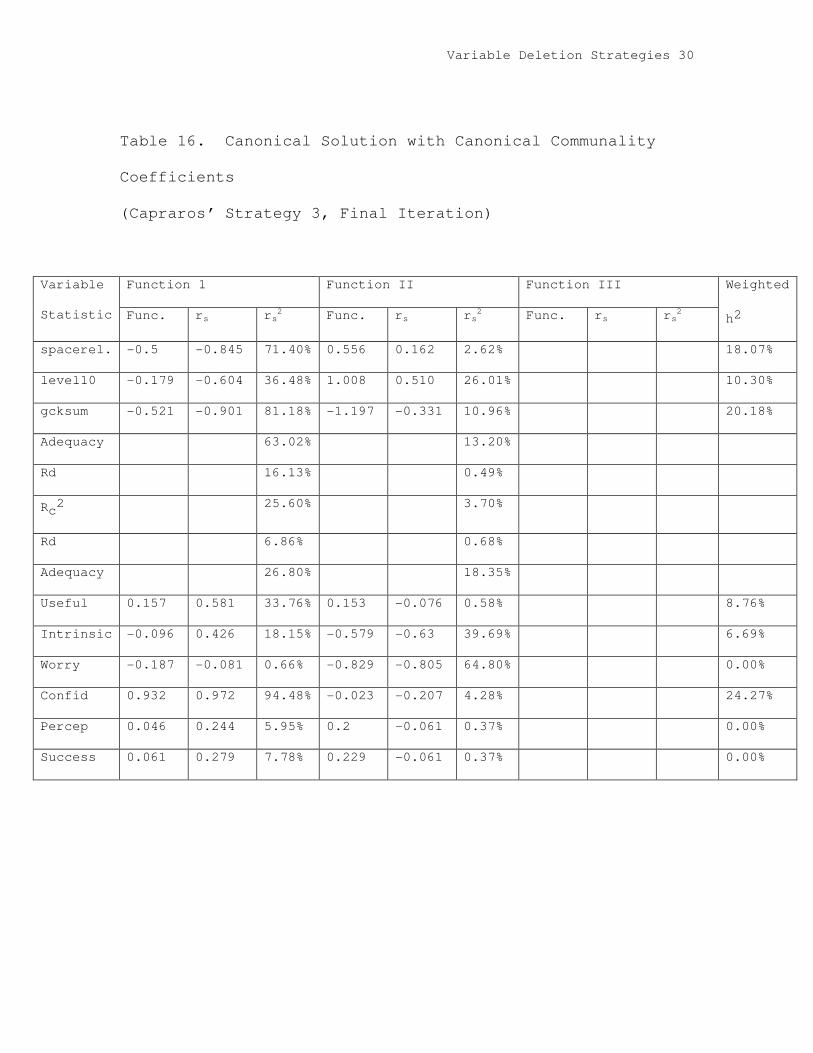
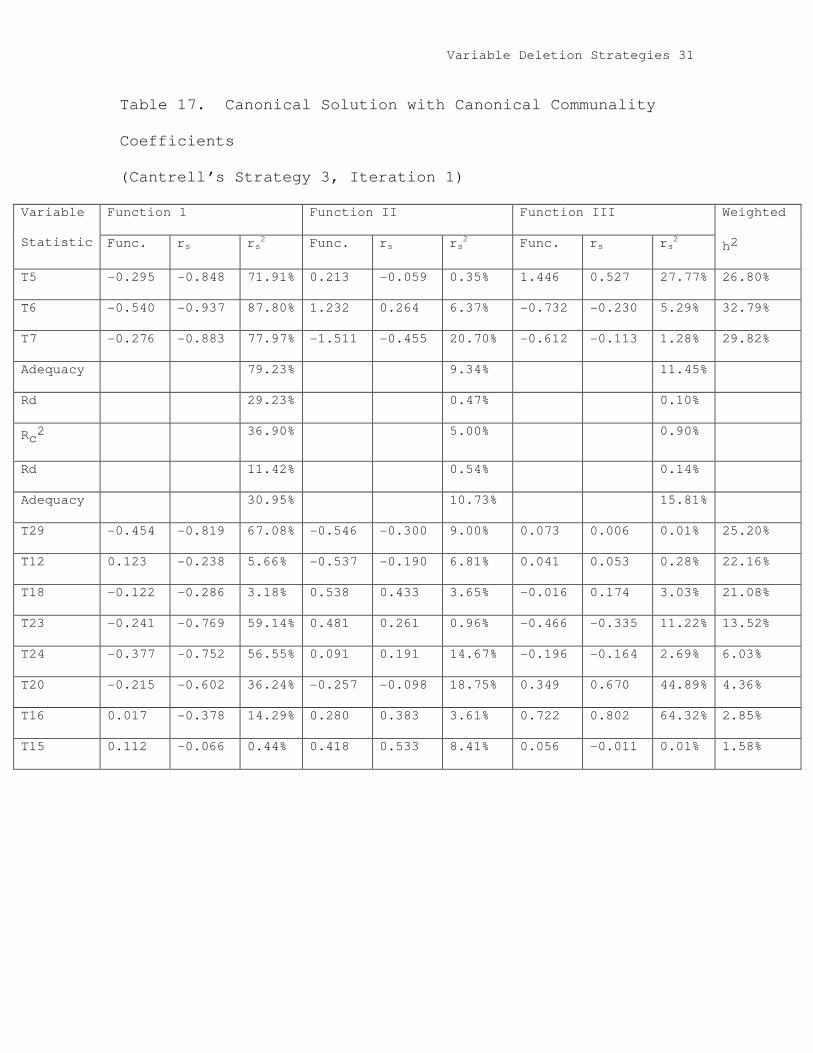
Strategy three: evaluate both h2 and variables contribution
to solution
1. Multiply Rc2 times rs
2
2. Add products together for each row
3. Drop lowest weighted h2
4. Look at the change in Rc2; if small, drop next lowest h2
5. Remove as many variables as possible with comprising the
Rc2
This strategy is regarded by both researchers
evaluated as the best strategy for variable deletion in CCA
(Cantrell, 1999; Capraro & Capraro, 2002). Due to the
design of this strategy, a weighted h2, dependent on both
the Rc2 and the squared structure coefficients of each
variable, a better idea of the variable’s true contribution
to the solution is found.
Obviously, the parallel here to other GLM analysis
cannot be ignored. Thompson (1998) consistently stresses
an importance of both weights and structure coefficients in
GLMs for clearer picture. Of course, the most general form
of the GLM (CCAs) should not be immune to this necessity.
Variable Deletion Strategies 9
INSERT TABLE 13 ABOUT HERE
INSERT TABLE 14 ABOUT HERE
INSERT TABLE 15 ABOUT HERE
INSERT TABLE 16 ABOUT HERE
INSERT TABLE 17 ABOUT HERE
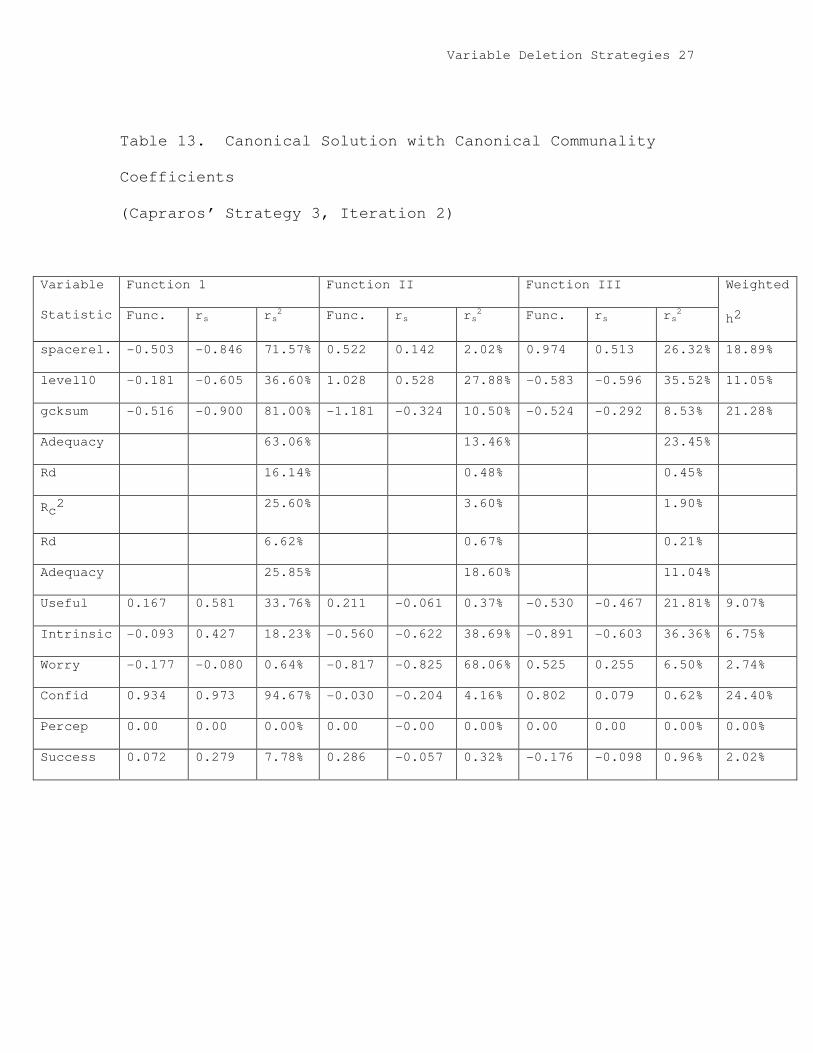
The Capraros’ (2002) Table 13 shows the data with
their newly calculated weighted h2. With the weighted h2
the lowest canonical communality coefficient is perception
(1.54%). Perception is deleted and Table 14 shows
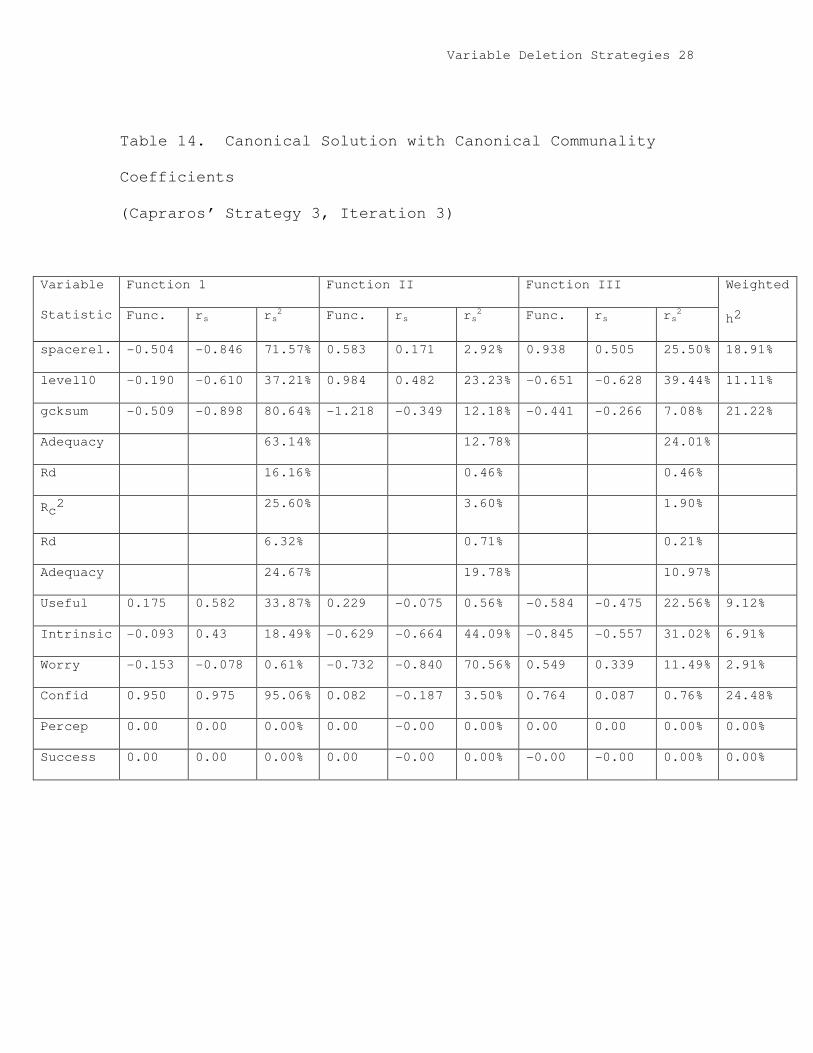
recalculations, with success being the next lowest h2
(2.02%). Success is deleted and worry is seen as being a
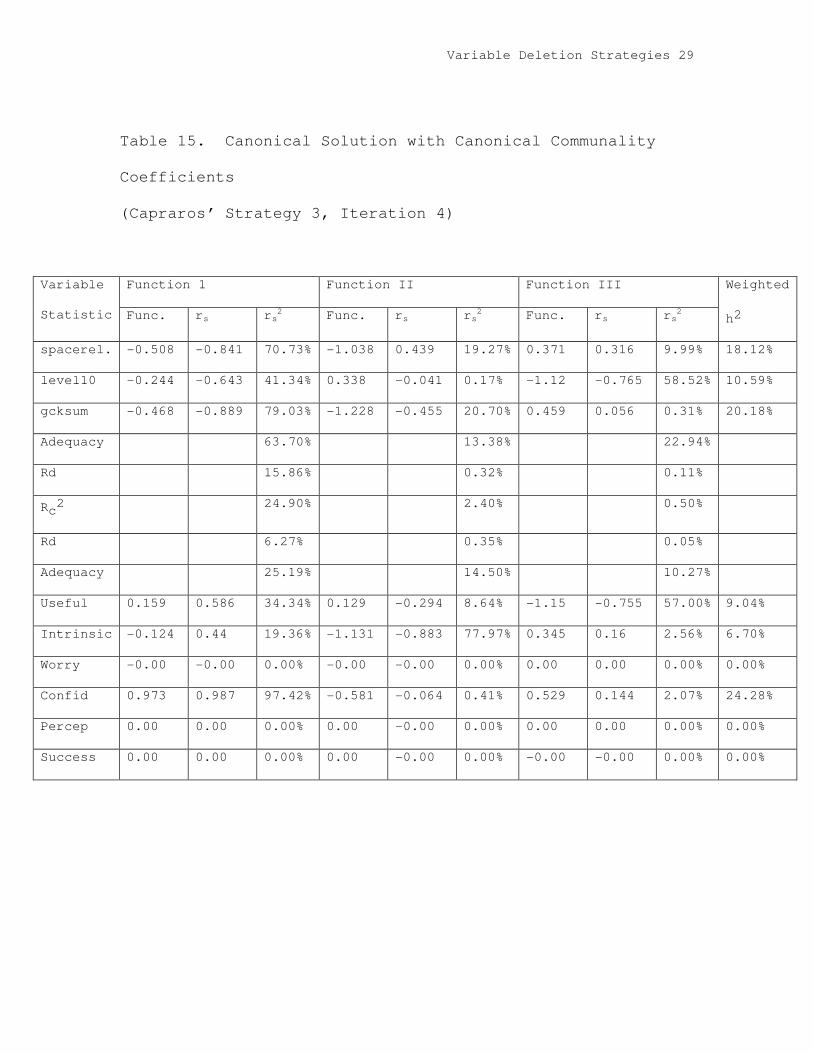
candidate for deletion (see Table 15). Worry is deleted
and the researcher decides to discontinue iterations (see
table 16). Finally, the function with the lowest Rc2 is
dropped and the final solution is presented with two
functions and three predictors (see Table 17).
Variable Deletion Strategies 10
INSERT TABLE 18 ABOUT HERE
INSERT TABLE 19 ABOUT HERE
INSERT TABLE 20 ABOUT HERE
INSERT TABLE 21 ABOUT HERE
INSERT TABLE 22 ABOUT HERE
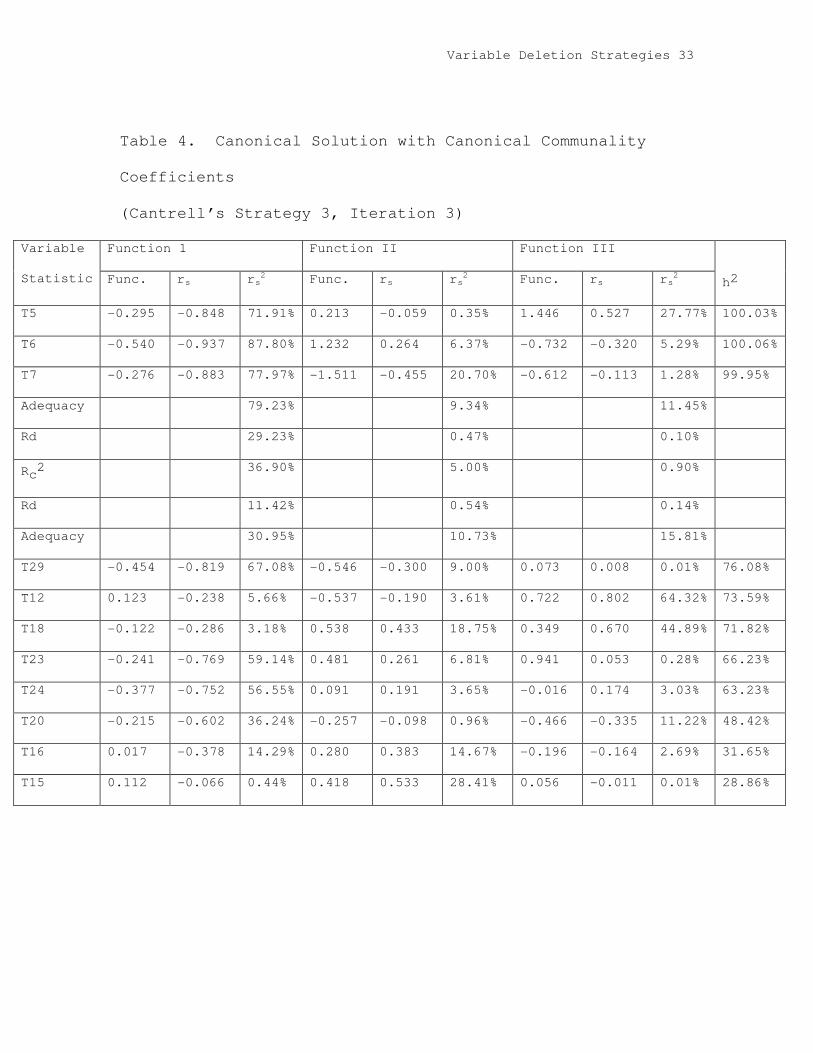
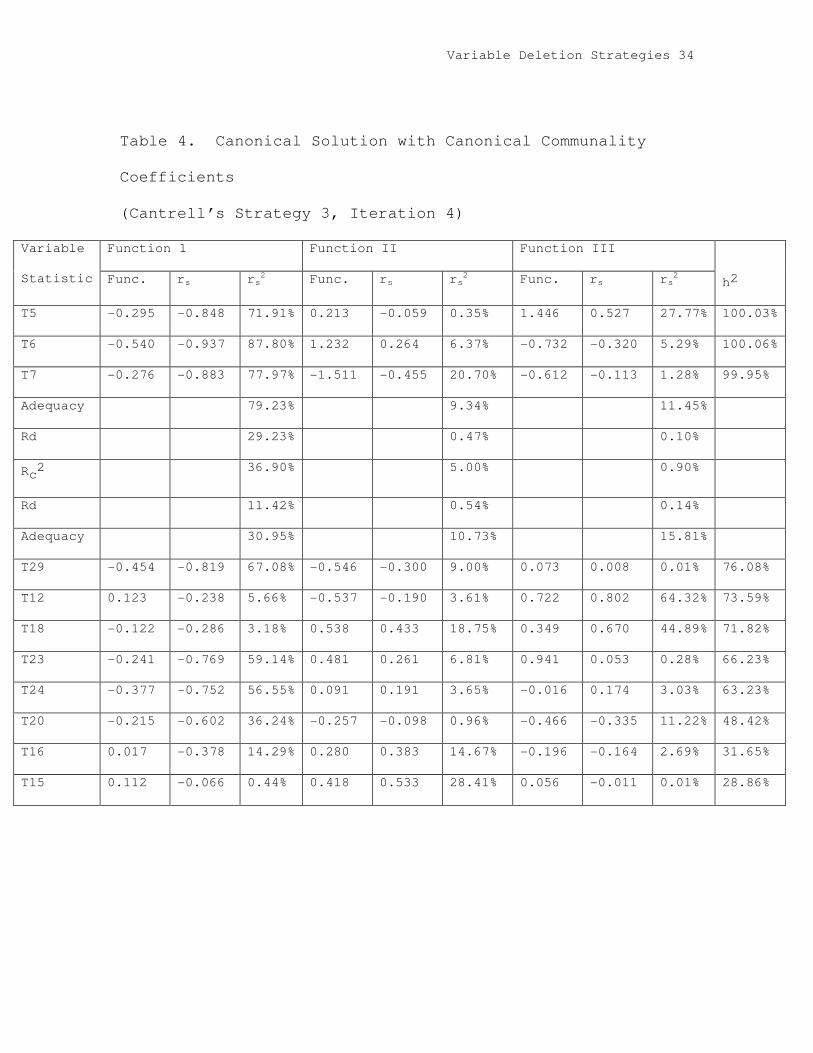
The Cantrell (1997) article uses 5 tables to get to
final solution. Table 18 shows the weighted three
functions with the weighted h2s. T15 is deleted and the
table 19 shows the recalculations. T12 is next and the
recalculations are shown in table 20. It is observed that
there are still small variations in the change of Rc2 for
each function. Because of low h2, T10 was deleted (see
table 21). And finally, T16 was dropped and the final table
shows the final solution (see Table 22).
It is also observed that Cantrell chose not to delete
a function. This is clearly due to the judgment of the
researcher. Regardless, a deletion of four variables
allows for a very parsimonious solution that barely changed
the squared canonical coefficients of the functions.
Variable Deletion Strategies 11
Summary
In summary, the goal of any study done with the GLM is
to explain the most variance with as few variables as
possible. This paper explained the theory and methodology
behind the use of variable deletion in canonical
correlational analysis by using both the Capraro and
Capraro (2002) and the Cantrell (1997) data tables.
Hopefully, evaluation of these employed variable deletion
strategies and their proper usages in a CCA will offer
confidence and clarity in future use of any of these
strategies.
Variable Deletion Strategies 12
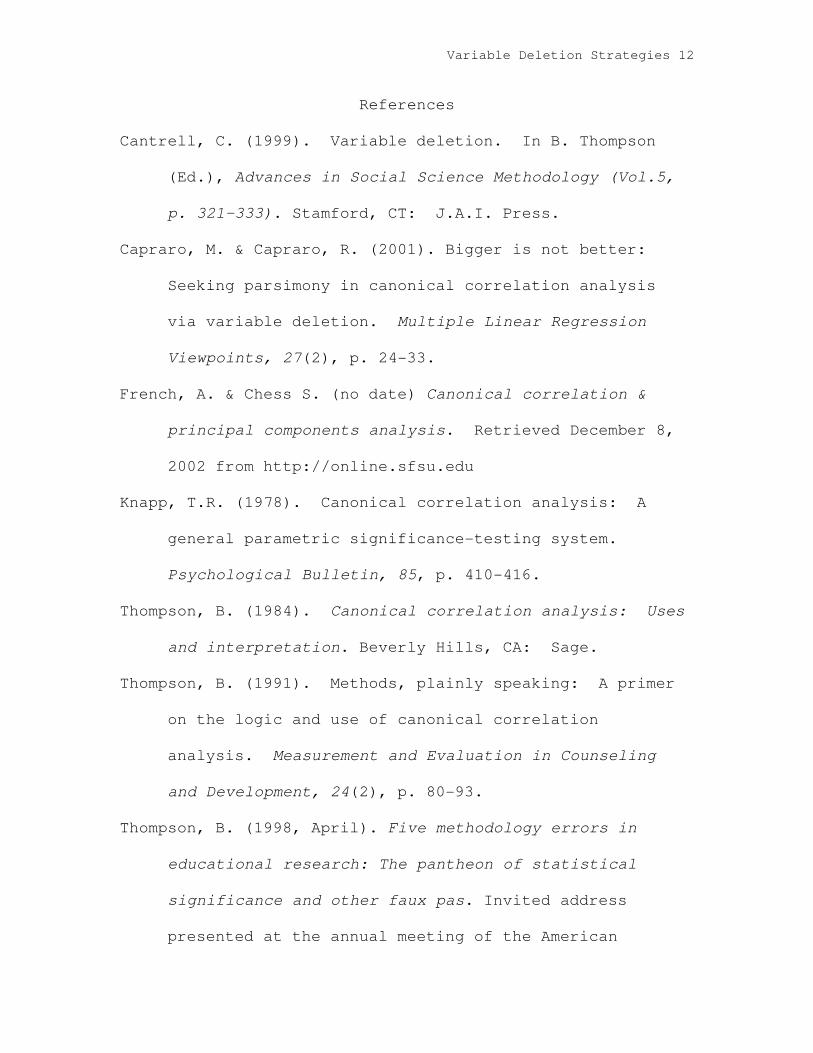
References
Cantrell, C. (1999). Variable deletion. In B. Thompson
(Ed.), Advances in Social Science Methodology (Vol.5,
p. 321-333). Stamford, CT: J.A.I. Press.
Capraro, M. & Capraro, R. (2001). Bigger is not better:
Seeking parsimony in canonical correlation analysis
via variable deletion. Multiple Linear Regression
Viewpoints, 27(2), p. 24-33.
French, A. & Chess S. (no date) Canonical correlation &
principal components analysis. Retrieved December 8,
2002 from http://online.sfsu.edu
Knapp, T.R. (1978). Canonical correlation analysis: A
general parametric significance-testing system.
Psychological Bulletin, 85, p. 410-416.
Thompson, B. (1984). Canonical correlation analysis: Uses
and interpretation. Beverly Hills, CA: Sage.
Thompson, B. (1991). Methods, plainly speaking: A primer
on the logic and use of canonical correlation
analysis. Measurement and Evaluation in Counseling
and Development, 24(2), p. 80-93.
Thompson, B. (1998, April). Five methodology errors in
educational research: The pantheon of statistical
significance and other faux pas. Invited address
presented at the annual meeting of the American

Variable Deletion Strategies 13
Educational Research Association, San Diego. (ERIC
Document Reproduction Service No. ED 419 023)
Thorndike, R. (1978). Correlation procedures for research.
New York: Gardner.
Variable Deletion Strategies 14
Table 1. Canonical Solution with Canonical Communality
Coefficients
(Capraros’ Strategy 1, Iteration 1)
Function 1 Function II Function III Variable
Statistic Func. rs rs2 Func. rs rs
2 Func. rs rs2
h2
spacerel. -0.5 -0.845 71.40% 0.556 0.162 2.62% 0.956 0.509 25.91% 99.94%
level10 -0.179 -0.604 36.48% 1.008 0.510 26.01% -0.617 -0.613 37.58% 100.07%
gcksum -0.521 -0.901 81.18% -1.197 -0.331 10.96% -0.843 -0.279 7.78% 99.92%
Adequacy 63.02% 13.20% 23.76%
Rd 16.13% 0.49% 0.45%
Rc2 25.60% 3.70% 1.9%
Rd 6.86% 0.68% 0.20%
Adequacy 26.80% 18.35% 10.71%
Useful 0.157 0.581 33.76% 0.153 -0.076 0.58% -0.565 -0.463 21.44% 55.77%
Intrinsic -0.096 0.426 18.15% -0.579 -0.63 39.69% -0.82 -0.571 32.60% 90.44%
Worry -0.187 -0.081 0.66% -0.829 -0.805 64.80% 0.531 0.292 8.53% 73.99%
Confid 0.932 0.972 94.48% -0.023 -0.207 4.28% 0.787 0.083 0.695% 99.45%
Percep 0.046 0.244 5.95% 0.2 -0.061 0.37% 0.145 0.033 0.11% 6.43%
Success 0.061 0.279 7.78% 0.229 -0.061 0.37% -0.222 -0.096 0.92% 9.08%
Variable Deletion Strategies 15
Table 2. Canonical Solution with Canonical Communality
Coefficients
(Capraros’ Strategy 1, Iteration 2)
Function 1 Function II Function III Variable
Statistic Func. rs rs2 Func. rs rs
2 Func. rs rs2
h2
spacerel. -0.503 -0.846 71.57% 0.522 0.142 2.02% 0.974 0.513 26.32% 99.90%
level10 -0.181 -0.605 36.60% 1.028 0.528 27.88% -0.583 -0.596 35.52% 100.00%
gcksum -0.516 -0.9 81.00% -1.181 -0.324 10.50% -0.524 -0.292 8.53% 100.02%
Adequacy 63.06% 13.46% 23.45%
Rd 16.14% 0.48% 0.45%
Rc2 25.60% 3.6% 1.9%
Rd 6.62% 0.67% 0.21%
Adequacy 25.85% 18.60% 11.04%
Useful 0.167 0.581 33.76% 0.211 -0.061 0.37% -0.53 -0.467 21.81% 55.94%
Intrinsic -0.093 0.427 18.23% -0.56 -0.622 38.69% -0.891 -0.603 36.30% 93.28%
Worry -0.177 -0.08 0.64% -0.817 -0.825 68.06% 0.525 0.255 6.50% 75.21%
Confid 0.934 0.973 94.67% -0.03 -0.204 4.16% 0.802 0.079 0.62% 99.46%
Percep 0.00 0.00 0.00% 0.00 -0.00 0.00% 0.00 0.00 0.00% 0.00%
Success 0.072 0.279 7.78% 0.286 -0.057 0.32% -0.176 -0.098 0.96% 9.07%
Variable Deletion Strategies 16
Table 3. Canonical Solution with Canonical Communality
Coefficients
(Capraros’ Strategy 1, Iteration 3)
Function 1 Function II Function III Variable
Statistic Func. rs rs2 Func. rs rs
2 Func. rs rs2
h2
spacerel. -0.504 -0.846 71.57% 0.583 0.171 2.92% 0.938 0.505 25.50% 100.00%
level10 -0.190 -0.610 37.21% 0.984 0.482 23.23% -0.651 -0.628 39.44% 99.88%
gcksum -0.509 -0.898 81.64% -1.218 -0.349 12.18% -0.441 -0.266 7.08% 99.90%
Adequacy 63.14% 12.78% 24.01%
Rd 16.10% 0.43% 0.43%
Rc2 25.50% 3.40% 1.80%
Rd 6.29% 0.67% 0.20%
Adequacy 24.67% 19.78% 10.97%
Useful 0.175 0.582 33.87% 0.229 -0.075 0.56% -0.584 -0.475 22.56% 57.00%
Intrinsic -0.093 0.43 18.49% -0.629 -0.664 44.09% -0.845 -0.557 31.02% 93.60%
Worry -0.153 -0.078 0.61% -0.732 -0.840 70.56% 0.549 0.339 11.49% 82.66%
Confid 0.950 0.975 95.06% -0.82 -0.187 3.50% 0.764 0.087 0.76% 99.32%
Percep 0.00 0.00 0.00% 0.00 -0.00 0.00% 0.00 0.00 0.00% 0.00%
Success 0.00 0.00 0.00% 0.00 -0.00 0.00% -0.00 -0.00 0.00% 0.00%
Variable Deletion Strategies 17
Table 4. Canonical Solution with Canonical Communality
Coefficients
(Cantrell’s Strategy 1, Iteration 1)
Function 1 Function II Function III Variable
Statistic Func. rs rs2 Func. rs rs
2 Func. rs rs2
h2
T5 -0.295 -0.848 71.91% 0.213 -0.059 0.35% 1.446 0.527 27.77% 100.03%
T6 -0.540 -0.937 87.80% 1.232 0.264 6.37% -0.732 -0.320 5.29% 100.06%
T7 -0.276 -0.883 77.97% -1.511 -0.455 20.70% -0.612 -0.113 1.28% 99.95%
Adequacy 79.23% 9.34% 11.45%
Rd 29.23% 0.47% 0.10%
Rc2 36.90% 5.00% 0.90%
Rd 11.42% 0.54% 0.14%
Adequacy 30.95% 10.73% 15.81%
T29 -0.454 -0.819 67.08% -0.546 -0.300 9.00% 0.073 0.008 0.01% 76.08%
T12 0.123 -0.238 5.66% -0.537 -0.190 3.61% 0.722 0.802 64.32% 73.59%
T18 -0.122 -0.286 3.18% 0.538 0.433 18.75% 0.349 0.670 44.89% 71.82%
T23 -0.241 -0.769 59.14% 0.481 0.261 6.81% 0.941 0.053 0.28% 66.23%
T24 -0.377 -0.752 56.55% 0.091 0.191 3.65% -0.016 0.174 3.03% 63.23%
T20 -0.215 -0.602 36.24% -0.257 -0.098 0.96% -0.466 -0.335 11.22% 48.42%
T16 0.017 -0.378 14.29% 0.280 0.383 14.67% -0.196 -0.164 2.69% 31.65%
T15 0.112 -0.066 0.44% 0.418 0.533 28.41% 0.056 -0.011 0.01% 28.86%

Variable Deletion Strategies 18
Table 5. Canonical Solution with Canonical Communality
Coefficients
(Cantrell’s Strategy 1, Iteration 2)
Function 1 Function II Function III Variable
Statistic Func. rs rs2 Func. rs rs
2 Func. rs rs2
h2
T5 -0.300 -0.847 71.74% 0.190 -0.080 0.64% 1.449 0.525 27.56% 99.94%
T6 -0.560 -0.941 88.55% 1.231 0.251 6.30% -0.717 -0.228 5.20% 100.05%
T7 -0.260 -0.875 76.56% -1.507 -0.468 21.90% -0.632 -0.120 1.44% 99.90%
Adequacy 78.95% 9.61% 11.40%
Rd 28.52% 0.41% 0.10%
Rc2 36.50% 4.30% 0.90%
Rd 11.41% 0.35% 0.14%
Adequacy 31.26% 8.15% 15.92%
T29 -0.462 -0.822 67.40% -0.652 -0.367 13.47% 0.048 0.007 0.00% 80.88%
T12 0.116 -0.240 8.41% 0.619 0.452 20.43% 0.371 0.682 46.51% 75.35%
T18 -0.125 -0.238 5.66% -0.591 0.222 4.93% 0.706 0.796 63.36% 73.95%
T23 -0.248 -0.775 60.06% 0.539 0.244 5.95% 0.058 0.056 0.31% 66.33%
T24 -0.180 -0.757 57.30% 0.051 0.168 2.82% -0.020 0.175 3.06% 63.19%
T20 -0.148 -0.605 36.60% -0.220 -0.134 1.80% -0.466 -0.342 11.70% 50.09%
T16 0.048 -0.383 14.67% 0.453 0.397 15.76% -0.167 -0.155 2.40% 32.83%
T15 0.00 -0.00 0.00% 0.00 0.00 0.00% -0.00 -0.00 0.00% 0.00%
Variable Deletion Strategies 19
Table 6. Canonical Solution with Canonical Communality
Coefficients
(Cantrell’s Strategy 1, Iteration 3)
Function 1 Function II Function III Variable
Statistic Func. rs rs2 Func. rs rs
2 Func. rs rs2
h2
T5 -0.300 -0.846 71.57% 0.250 -0.063 0.40% 1.440 0.529 27.98% 99.95%
T6 -0.569 -0.943 88.92% 1.196 0.235 5.52% -0.768 -0.237 5.62% 100.06%
T7 -0.240 -0.872 76.04% -1.534 -0.479 22.94% -0.566 -0.099 0.98% 99.96%
Adequacy 78.84% 9.62% 11.53%
Rd 28.70% 0.35% 0.10%
Rc2 36.40% 3.60% 0.90%
Rd 10.73% 0.27% 0.14%
Adequacy 29.48% 7.50% 15.63%
T29 -0.459 -0.821 67.40% -0.704 -0.418 17.47% 0.108 0.035 0.12% 85.00%
T12 0.126 -0.238 5.66% -0.627 0.231 5.34% 0.771 0.830 68.89% 79.89%
T18 -0.117 -0.291 8.47% 0.684 0.501 25.10% 0.317 0.650 42.25% 75.82%
T23 -0.268 -0.776 60.22% -0.672 0.252 6.35% -0.028 0.040 0.16% 66.73%
T24 -0.379 -0.759 57.46% 0.134 0.172 2.96% -0.060 0.168 2.82% 63.24%
T20 -0.189 -0.605 36.60% -0.157 -0.166 2.76% -0.491 -0.329 10.82% 50.18%
T16 0.00 -0.00 0.00% 0.00 0.00 0.00% -0.00 -0.00 0.00% 0.00%
T15 0.00 -0.00 0.00% 0.00 0.00 0.00% -0.00 -0.00 0.00% 0.00%

Variable Deletion Strategies 20
Table 7. Canonical Solution with Canonical Communality
Coefficients
(Capraros’ Strategy 2, Iteration 1)
Function 1 Function II Function III Variable
Statistic Func. rs rs2 Func. rs rs
2 Func. rs rs2
h2
spacerel. -0.5 -0.845 71.40% 0.556 0.162 2.62% 74.03%
level10 -0.179 -0.604 36.48% 1.008 0.510 26.01% 62.49%
gcksum -0.521 -0.901 81.18% -1.197 -0.331 10.96% 92.14%
Adequacy 63.02% 13.20%
Rd 16.13% 0.49%
Rc2 25.60% 3.70%
Rd 6.86% 0.68%
Adequacy 26.80% 18.35%
Useful 0.157 0.581 33.76% 0.153 -0.076 0.58% 34.33%
Intrinsic -0.096 0.426 18.15% -0.579 -0.63 39.69% 57.84%
Worry -0.187 -0.081 0.66% -0.829 -0.805 64.80% 65.46%
Confid 0.932 0.972 94.48% -0.023 -0.207 4.28% 98.76%
Percep 0.046 0.244 5.95% 0.2 -0.061 0.37% 6.33%
Success 0.061 0.279 7.78% 0.229 -0.061 0.37% 8.16%

Variable Deletion Strategies 21
Table 8. Canonical Solution with Canonical Communality
Coefficients
(Capraros’ Strategy 2, Iteration 2)
Function 1 Function II Function III Variable
Statistic Func. rs rs2 Func. rs rs
2 Func. rs rs2
h2
spacerel. -0.503 -0.846 71.57% 0.522 0.142 2.02% 73.59%
level10 -0.181 -0.605 36.60% 1.028 0.528 27.88% 64.48%
gcksum -0.516 -0.9 81.00% -1.181 -0.324 10.50% 91.50%
Adequacy 63.06% 13.46%
Rd 16.14% 0.48%
Rc2 25.60% 3.60%
Rd 6.62% 0.67%
Adequacy 25.85% 18.60%
Useful 0.167 0.581 33.76% 0.211 -0.061 0.37% 34.13%
Intrinsic -0.093 0.427 18.23% -0.56 -0.622 38.69% 56.92%
Worry -0.177 -0.08 0.64% -0.817 -0.825 68.06% 68.70%
Confid 0.934 0.973 94.67% -0.03 -0.204 4.16% 98.83%
Percep 0.00 0.00 0.00% 0.00 -0.00 0.00% 0.00%
Success 0.072 0.279 7.78% -0.286 -0.057 0.32% 8.11%
Variable Deletion Strategies 22
Table 8. Canonical Solution with Canonical Communality
Coefficients
(Capraros’ Strategy 2, Iteration 3)
Function 1 Function II Function III Variable
Statistic Func. rs rs2 Func. rs rs
2 Func. rs rs2
h2
spacerel. -0.504 -0.846 71.57% 0.583 0.171 2.92% 74.50%
level10 -0.190 -0.610 37.21% 0.984 0.482 23.23% 60.44%
gcksum -0.509 -0.898 80.64% -1.218 -0.349 12.18% 92.82%
Adequacy 63.14% 12.78%
Rd 16.10% 0.43%
Rc2 25.50% 3.40%
Rd 6.29% 0.67%
Adequacy 24.67% 19.78%
Useful 0.175 0.582 33.87% 0.229 -0.075 0.56% 34.43%
Intrinsic -0.093 0.430 18.49% -0.629 -0.664 44.09% 62.58%
Worry -0.153 -0.078 0.61% -0.732 -0.840 70.56% 71.17%
Confid 0.950 0.975 95.06% 0.082 -0.187 3.50% 98.56%
Percep 0.00 0.00 0.00% 0.00 -0.00 0.00% 0.00%
Success 0.00 0.00 0.00% 0.00 -0.00 0.00% 0.00%
Variable Deletion Strategies 23
Table 9. Canonical Solution with Canonical Communality
Coefficients
(Capraros’ Strategy 2, Iteration 4)
Function 1 Function II Function III Variable
Statistic Func. rs rs2 Func. rs rs
2 Func. rs rs2
h2
spacerel. -0.491 -0.837 70.06% 0.692 0.225 5.06% 75.12%
level10 -0.216 -0.629 39.56% 0.892 0.393 15.44% 55.01%
gcksum -0.503 -0.9 81.00% -1.268 -0.389 15.13% 96.13%
Adequacy 63.54% 11.88%
Rd 16.20% 0.40%
Rc2 25.50% 3.40%
Rd 4.96% 0.68%
Adequacy 19.46% 19.90%
Useful 0.00 0.00 0.00% 0.00 -0.00 0.00% 0.00%
Intrinsic -0.065 0.434 18.84% -0.682 -0.709 50.27% 69.10%
Worry -0.139 -0.073 0.53% -0.68 -0.817 66.75% 67.28%
Confid 1.031 0.987 97.42% 0.249 -0.154 2.37% 99.79%
Percep 0.00 0.00 0.00% 0.00 -0.00 0.00% 0.00%
Success 0.00 0.00 0.00% 0.00 -0.00 0.00% 0.00%
Variable Deletion Strategies 24
Table 10. Canonical Solution with Canonical Communality
Coefficients
(Cantrell’s Strategy 2, Iteration 1)
Function 1 Function II Function III Variable
Statistic Func. rs rs2 Func. rs rs
2 Func. rs rs2
h2
T5 -0.295 -0.848 71.91% 0.213 -0.059 0.35% 72.26%
T6 -0.540 -0.937 87.80% 1.232 0.264 6.37% 94.77%
T7 -0.276 -0.883 77.97% -1.511 -0.455 20.70% 98.67%
Adequacy 79.23% 9.34%
Rd 29.23% 0.47%
Rc2 36.90% 5.00%
Rd 11.42% 0.54%
Adequacy 30.95% 10.73%
T29 -0.454 -0.819 67.08% -0.546 -0.300 9.00% 76.08%
T12 0.123 -0.238 5.66% -0.537 -0.190 3.61% 65.95%
T18 -0.122 -0.286 3.18% 0.538 0.433 18.75% 60.20%
T23 -0.241 -0.769 59.14% 0.481 0.261 6.81% 37.20%
T24 -0.377 -0.752 56.55% 0.091 0.191 3.65% 28.96%
T20 -0.215 -0.602 36.24% -0.257 -0.098 0.96% 28.84%
T16 0.017 -0.378 14.29% 0.280 0.383 14.67% 26.93%
T15 0.112 -0.066 0.44% 0.418 0.533 28.41% 9.27%

Variable Deletion Strategies 25
Table 11. Canonical Solution with Canonical Communality
Coefficients
(Cantrell’s Strategy 2, Iteration 2)
Function 1 Function II Function III Variable
Statistic Func. rs rs2 Func. rs rs
2 Func. rs rs2
h2
T5 -0.305 -0.854 72.93% 0.456 0.045 0.20% 73.13%
T6 -0.508 -0.929 86.30% 1.103 0.239 5.71% 92.02%
T7 -0.300 -0.891 79.39% -1.586 -0.451 20.34% 99.73%
Adequacy 79.54% 8.75%
Rd 29.03% 0.36%
Rc2 36.50% 4.10%
Rd 11.13% 0.56%
Adequacy 30.49% 13.61%
T29 -0.456 -0.825 68.06% -0.591 -0.284 8.07% 76.13%
T12 -0.278 -0.771 59.44% 0.497 0.331 10.96% 70.40%
T18 -0.371 -0.755 57.00% 0.088 0.263 6.92% 63.92%
T23 -0.207 -0.606 36.72% 0.351 -0.100 1.00% 37.72%
T24 -0.067 -0.285 8.12% 0.384 0.541 29.27% 37.39%
T20 0.114 -0.062 0.38% 0.466 0.587 34.46% 34.84%
T16 0.021 -0.377 14.21% 0.298 0.427 18.23% 32.45%
T15 0.00 -0.00 0.00% 0.00 0.00 0.00% 0.00%
Variable Deletion Strategies 26
Table 12. Canonical Solution with Canonical Communality
Coefficients
(Capraros’ Strategy 3, Iteration 1)
Function 1 Function II Function III Variable
Statistic Func. rs rs2 Func. rs rs
2 Func. rs rs2
Weighted
h2
spacerel. -0.5 -0.845 71.40% 0.556 0.162 2.62% 0.956 0.509 25.91% 18.87%
level10 -0.179 -0.604 36.48% 1.008 0.510 26.01% -0.617 -0.613 37.58% 11.02%
gcksum -0.521 -0.901 81.18% -1.197 -0.331 10.96% -0.843 -0.279 7.78% 21.34%
Adequacy 63.02% 13.20% 23.76%
Rd 16.13% 0.49% 0.45%
Rc2 25.60% 3.70% 1.9%
Rd 6.86% 0.68% 0.20%
Adequacy 26.80% 18.35% 10.71%
Useful 0.157 0.581 33.76% 0.153 -0.076 0.58% -0.565 -0.463 21.44% 9.07%
Intrinsic -0.096 0.426 18.15% -0.579 -0.63 39.69% -0.82 -0.571 32.60% 6.37%
Worry -0.187 -0.081 0.66% -0.829 -0.805 64.80% 0.531 0.292 8.53% 2.73%
Confid 0.932 0.972 94.48% -0.023 -0.207 4.28% 0.787 0.083 0.695% 24.36%
Percep 0.046 0.244 5.95% 0.2 -0.061 0.37% 0.145 0.033 0.11% 1.54%
Success 0.061 0.279 7.78% 0.229 -0.061 0.37% -0.222 -0.096 0.92% 2.02%
Variable Deletion Strategies 27
Table 13. Canonical Solution with Canonical Communality
Coefficients
(Capraros’ Strategy 3, Iteration 2)
Function 1 Function II Function III Variable
Statistic Func. rs rs2 Func. rs rs
2 Func. rs rs2
Weighted
h2
spacerel. -0.503 -0.846 71.57% 0.522 0.142 2.02% 0.974 0.513 26.32% 18.89%
level10 -0.181 -0.605 36.60% 1.028 0.528 27.88% -0.583 -0.596 35.52% 11.05%
gcksum -0.516 -0.900 81.00% -1.181 -0.324 10.50% -0.524 -0.292 8.53% 21.28%
Adequacy 63.06% 13.46% 23.45%
Rd 16.14% 0.48% 0.45%
Rc2 25.60% 3.60% 1.90%
Rd 6.62% 0.67% 0.21%
Adequacy 25.85% 18.60% 11.04%
Useful 0.167 0.581 33.76% 0.211 -0.061 0.37% -0.530 -0.467 21.81% 9.07%
Intrinsic -0.093 0.427 18.23% -0.560 -0.622 38.69% -0.891 -0.603 36.36% 6.75%
Worry -0.177 -0.080 0.64% -0.817 -0.825 68.06% 0.525 0.255 6.50% 2.74%
Confid 0.934 0.973 94.67% -0.030 -0.204 4.16% 0.802 0.079 0.62% 24.40%
Percep 0.00 0.00 0.00% 0.00 -0.00 0.00% 0.00 0.00 0.00% 0.00%
Success 0.072 0.279 7.78% 0.286 -0.057 0.32% -0.176 -0.098 0.96% 2.02%
Variable Deletion Strategies 28
Table 14. Canonical Solution with Canonical Communality
Coefficients
(Capraros’ Strategy 3, Iteration 3)
Function 1 Function II Function III Variable
Statistic Func. rs rs2 Func. rs rs
2 Func. rs rs2
Weighted
h2
spacerel. -0.504 -0.846 71.57% 0.583 0.171 2.92% 0.938 0.505 25.50% 18.91%
level10 -0.190 -0.610 37.21% 0.984 0.482 23.23% -0.651 -0.628 39.44% 11.11%
gcksum -0.509 -0.898 80.64% -1.218 -0.349 12.18% -0.441 -0.266 7.08% 21.22%
Adequacy 63.14% 12.78% 24.01%
Rd 16.16% 0.46% 0.46%
Rc2 25.60% 3.60% 1.90%
Rd 6.32% 0.71% 0.21%
Adequacy 24.67% 19.78% 10.97%
Useful 0.175 0.582 33.87% 0.229 -0.075 0.56% -0.584 -0.475 22.56% 9.12%
Intrinsic -0.093 0.43 18.49% -0.629 -0.664 44.09% -0.845 -0.557 31.02% 6.91%
Worry -0.153 -0.078 0.61% -0.732 -0.840 70.56% 0.549 0.339 11.49% 2.91%
Confid 0.950 0.975 95.06% 0.082 -0.187 3.50% 0.764 0.087 0.76% 24.48%
Percep 0.00 0.00 0.00% 0.00 -0.00 0.00% 0.00 0.00 0.00% 0.00%
Success 0.00 0.00 0.00% 0.00 -0.00 0.00% -0.00 -0.00 0.00% 0.00%
Variable Deletion Strategies 29
Table 15. Canonical Solution with Canonical Communality
Coefficients
(Capraros’ Strategy 3, Iteration 4)
Function 1 Function II Function III Variable
Statistic Func. rs rs2 Func. rs rs
2 Func. rs rs2
Weighted
h2
spacerel. -0.508 -0.841 70.73% -1.038 0.439 19.27% 0.371 0.316 9.99% 18.12%
level10 -0.244 -0.643 41.34% 0.338 -0.041 0.17% -1.12 -0.765 58.52% 10.59%
gcksum -0.468 -0.889 79.03% -1.228 -0.455 20.70% 0.459 0.056 0.31% 20.18%
Adequacy 63.70% 13.38% 22.94%
Rd 15.86% 0.32% 0.11%
Rc2 24.90% 2.40% 0.50%
Rd 6.27% 0.35% 0.05%
Adequacy 25.19% 14.50% 10.27%
Useful 0.159 0.586 34.34% 0.129 -0.294 8.64% -1.15 -0.755 57.00% 9.04%
Intrinsic -0.124 0.44 19.36% -1.131 -0.883 77.97% 0.345 0.16 2.56% 6.70%
Worry -0.00 -0.00 0.00% -0.00 -0.00 0.00% 0.00 0.00 0.00% 0.00%
Confid 0.973 0.987 97.42% -0.581 -0.064 0.41% 0.529 0.144 2.07% 24.28%
Percep 0.00 0.00 0.00% 0.00 -0.00 0.00% 0.00 0.00 0.00% 0.00%
Success 0.00 0.00 0.00% 0.00 -0.00 0.00% -0.00 -0.00 0.00% 0.00%
Variable Deletion Strategies 30
Table 16. Canonical Solution with Canonical Communality
Coefficients
(Capraros’ Strategy 3, Final Iteration)
Function 1 Function II Function III Variable
Statistic Func. rs rs2 Func. rs rs
2 Func. rs rs2
Weighted
h2
spacerel. -0.5 -0.845 71.40% 0.556 0.162 2.62% 18.07%
level10 -0.179 -0.604 36.48% 1.008 0.510 26.01% 10.30%
gcksum -0.521 -0.901 81.18% -1.197 -0.331 10.96% 20.18%
Adequacy 63.02% 13.20%
Rd 16.13% 0.49%
Rc2 25.60% 3.70%
Rd 6.86% 0.68%
Adequacy 26.80% 18.35%
Useful 0.157 0.581 33.76% 0.153 -0.076 0.58% 8.76%
Intrinsic -0.096 0.426 18.15% -0.579 -0.63 39.69% 6.69%
Worry -0.187 -0.081 0.66% -0.829 -0.805 64.80% 0.00%
Confid 0.932 0.972 94.48% -0.023 -0.207 4.28% 24.27%
Percep 0.046 0.244 5.95% 0.2 -0.061 0.37% 0.00%
Success 0.061 0.279 7.78% 0.229 -0.061 0.37% 0.00%
Variable Deletion Strategies 31
Table 17. Canonical Solution with Canonical Communality
Coefficients
(Cantrell’s Strategy 3, Iteration 1)
Function 1 Function II Function III Variable
Statistic Func. rs rs2 Func. rs rs
2 Func. rs rs2
Weighted
h2
T5 -0.295 -0.848 71.91% 0.213 -0.059 0.35% 1.446 0.527 27.77% 26.80%
T6 -0.540 -0.937 87.80% 1.232 0.264 6.37% -0.732 -0.230 5.29% 32.79%
T7 -0.276 -0.883 77.97% -1.511 -0.455 20.70% -0.612 -0.113 1.28% 29.82%
Adequacy 79.23% 9.34% 11.45%
Rd 29.23% 0.47% 0.10%
Rc2 36.90% 5.00% 0.90%
Rd 11.42% 0.54% 0.14%
Adequacy 30.95% 10.73% 15.81%
T29 -0.454 -0.819 67.08% -0.546 -0.300 9.00% 0.073 0.006 0.01% 25.20%
T12 0.123 -0.238 5.66% -0.537 -0.190 6.81% 0.041 0.053 0.28% 22.16%
T18 -0.122 -0.286 3.18% 0.538 0.433 3.65% -0.016 0.174 3.03% 21.08%
T23 -0.241 -0.769 59.14% 0.481 0.261 0.96% -0.466 -0.335 11.22% 13.52%
T24 -0.377 -0.752 56.55% 0.091 0.191 14.67% -0.196 -0.164 2.69% 6.03%
T20 -0.215 -0.602 36.24% -0.257 -0.098 18.75% 0.349 0.670 44.89% 4.36%
T16 0.017 -0.378 14.29% 0.280 0.383 3.61% 0.722 0.802 64.32% 2.85%
T15 0.112 -0.066 0.44% 0.418 0.533 8.41% 0.056 -0.011 0.01% 1.58%

Variable Deletion Strategies 32
Table 4. Canonical Solution with Canonical Communality
Coefficients
(Cantrell’s Strategy 3, Iteration 2)
Function 1 Function II Function III Variable
Statistic Func. rs rs2 Func. rs rs
2 Func. rs rs2
h2
T5 -0.295 -0.848 71.91% 0.213 -0.059 0.35% 1.446 0.527 27.77% 100.03%
T6 -0.540 -0.937 87.80% 1.232 0.264 6.37% -0.732 -0.320 5.29% 100.06%
T7 -0.276 -0.883 77.97% -1.511 -0.455 20.70% -0.612 -0.113 1.28% 99.95%
Adequacy 79.23% 9.34% 11.45%
Rd 29.23% 0.47% 0.10%
Rc2 36.90% 5.00% 0.90%
Rd 11.42% 0.54% 0.14%
Adequacy 30.95% 10.73% 15.81%
T29 -0.454 -0.819 67.08% -0.546 -0.300 9.00% 0.073 0.008 0.01% 76.08%
T12 0.123 -0.238 5.66% -0.537 -0.190 3.61% 0.722 0.802 64.32% 73.59%
T18 -0.122 -0.286 3.18% 0.538 0.433 18.75% 0.349 0.670 44.89% 71.82%
T23 -0.241 -0.769 59.14% 0.481 0.261 6.81% 0.941 0.053 0.28% 66.23%
T24 -0.377 -0.752 56.55% 0.091 0.191 3.65% -0.016 0.174 3.03% 63.23%
T20 -0.215 -0.602 36.24% -0.257 -0.098 0.96% -0.466 -0.335 11.22% 48.42%
T16 0.017 -0.378 14.29% 0.280 0.383 14.67% -0.196 -0.164 2.69% 31.65%
T15 0.112 -0.066 0.44% 0.418 0.533 28.41% 0.056 -0.011 0.01% 28.86%
Variable Deletion Strategies 33
Table 4. Canonical Solution with Canonical Communality
Coefficients
(Cantrell’s Strategy 3, Iteration 3)
Function 1 Function II Function III Variable
Statistic Func. rs rs2 Func. rs rs
2 Func. rs rs2
h2
T5 -0.295 -0.848 71.91% 0.213 -0.059 0.35% 1.446 0.527 27.77% 100.03%
T6 -0.540 -0.937 87.80% 1.232 0.264 6.37% -0.732 -0.320 5.29% 100.06%
T7 -0.276 -0.883 77.97% -1.511 -0.455 20.70% -0.612 -0.113 1.28% 99.95%
Adequacy 79.23% 9.34% 11.45%
Rd 29.23% 0.47% 0.10%
Rc2 36.90% 5.00% 0.90%
Rd 11.42% 0.54% 0.14%
Adequacy 30.95% 10.73% 15.81%
T29 -0.454 -0.819 67.08% -0.546 -0.300 9.00% 0.073 0.008 0.01% 76.08%
T12 0.123 -0.238 5.66% -0.537 -0.190 3.61% 0.722 0.802 64.32% 73.59%
T18 -0.122 -0.286 3.18% 0.538 0.433 18.75% 0.349 0.670 44.89% 71.82%
T23 -0.241 -0.769 59.14% 0.481 0.261 6.81% 0.941 0.053 0.28% 66.23%
T24 -0.377 -0.752 56.55% 0.091 0.191 3.65% -0.016 0.174 3.03% 63.23%
T20 -0.215 -0.602 36.24% -0.257 -0.098 0.96% -0.466 -0.335 11.22% 48.42%
T16 0.017 -0.378 14.29% 0.280 0.383 14.67% -0.196 -0.164 2.69% 31.65%
T15 0.112 -0.066 0.44% 0.418 0.533 28.41% 0.056 -0.011 0.01% 28.86%
Variable Deletion Strategies 34
Table 4. Canonical Solution with Canonical Communality
Coefficients
(Cantrell’s Strategy 3, Iteration 4)
Function 1 Function II Function III Variable
Statistic Func. rs rs2 Func. rs rs
2 Func. rs rs2
h2
T5 -0.295 -0.848 71.91% 0.213 -0.059 0.35% 1.446 0.527 27.77% 100.03%
T6 -0.540 -0.937 87.80% 1.232 0.264 6.37% -0.732 -0.320 5.29% 100.06%
T7 -0.276 -0.883 77.97% -1.511 -0.455 20.70% -0.612 -0.113 1.28% 99.95%
Adequacy 79.23% 9.34% 11.45%
Rd 29.23% 0.47% 0.10%
Rc2 36.90% 5.00% 0.90%
Rd 11.42% 0.54% 0.14%
Adequacy 30.95% 10.73% 15.81%
T29 -0.454 -0.819 67.08% -0.546 -0.300 9.00% 0.073 0.008 0.01% 76.08%
T12 0.123 -0.238 5.66% -0.537 -0.190 3.61% 0.722 0.802 64.32% 73.59%
T18 -0.122 -0.286 3.18% 0.538 0.433 18.75% 0.349 0.670 44.89% 71.82%
T23 -0.241 -0.769 59.14% 0.481 0.261 6.81% 0.941 0.053 0.28% 66.23%
T24 -0.377 -0.752 56.55% 0.091 0.191 3.65% -0.016 0.174 3.03% 63.23%
T20 -0.215 -0.602 36.24% -0.257 -0.098 0.96% -0.466 -0.335 11.22% 48.42%
T16 0.017 -0.378 14.29% 0.280 0.383 14.67% -0.196 -0.164 2.69% 31.65%
T15 0.112 -0.066 0.44% 0.418 0.533 28.41% 0.056 -0.011 0.01% 28.86%

Variable Deletion Strategies 35
Table 4. Canonical Solution with Canonical Communality
Coefficients
(Cantrell’s Strategy 3, Iteration 5)
Function 1 Function II Function III Variable
Statistic Func. rs rs2 Func. rs rs
2 Func. rs rs2
h2
T5 -0.295 -0.848 71.91% 0.213 -0.059 0.35% 1.446 0.527 27.77% 100.03%
T6 -0.540 -0.937 87.80% 1.232 0.264 6.37% -0.732 -0.320 5.29% 100.06%
T7 -0.276 -0.883 77.97% -1.511 -0.455 20.70% -0.612 -0.113 1.28% 99.95%
Adequacy 79.23% 9.34% 11.45%
Rd 29.23% 0.47% 0.10%
Rc2 36.90% 5.00% 0.90%
Rd 11.42% 0.54% 0.14%
Adequacy 30.95% 10.73% 15.81%
T29 -0.454 -0.819 67.08% -0.546 -0.300 9.00% 0.073 0.008 0.01% 76.08%
T12 0.123 -0.238 5.66% -0.537 -0.190 3.61% 0.722 0.802 64.32% 73.59%
T18 -0.122 -0.286 3.18% 0.538 0.433 18.75% 0.349 0.670 44.89% 71.82%
T23 -0.241 -0.769 59.14% 0.481 0.261 6.81% 0.941 0.053 0.28% 66.23%
T24 -0.377 -0.752 56.55% 0.091 0.191 3.65% -0.016 0.174 3.03% 63.23%
T20 -0.215 -0.602 36.24% -0.257 -0.098 0.96% -0.466 -0.335 11.22% 48.42%
T16 0.017 -0.378 14.29% 0.280 0.383 14.67% -0.196 -0.164 2.69% 31.65%
T15 0.112 -0.066 0.44% 0.418 0.533 28.41% 0.056 -0.011 0.01% 28.86%

Variable Deletion Strategies 36