variable stability and control tests on the sc 1 aircraft in jet-borne flight, with particular
TRANSCRIPT

q
R. & M. No. 3584
• i ̧ " ~ ' ~ : 5 ~
M I N I S T R Y O F T E C H N O L O G Y
A E R O N A U T I C A L RESEARCH C O U N C I L
REPORTS A N D M E M O R A N D A
Variable Stability and Control Tests on the S.C.1 Aircraft in Jet-Borne Flight, with Particular Reference
to Desirable VTOL Flying Qualities
By J. K. B. Illingworth and H. W. Chinn Aerodynamics Dept., R.A.E., Bedford
LONDON : HER MAJESTY'S STATIONERY OFFICE
1969
PRICE 16s. 6d. NEX

Variable Stability and Control Tests on the S.C.1 Aircraft in Jet-Borne Fright, with Particular Reference
to Desirable VTOL Flying Qualities By J. K. B. Illingworth and H. W. Chinn
Aerodynamics Dept., R.A.E., Bedford
Reports and Memoranda No. 3584*
May, 1963
Summary. The note describes a series of tests made on the S.C.1 variable stability VTOL aircraft in hovering and
low speed flight, with various amounts of autostabilization. The measurements made cover control power, damping, trim, engine response and ground effect. Pilot opinions of the flying qualities of the aircraft in different conditions are correlated with its measured characteristics, including the time taken to perform manoeuvres. Conclusions are drawn about desirable flying qualities for VTOL aircraft, and are compared with those obtained from other similar flight tests.
.
2.
2.3.
CONTENTS
Introduction
Description of the Aircraft and Equipment
2.1. The aircraft
2.2. Control system and autostabilizer
2.2.1. Modes of operation of control system
2.2.2. Electrically signalled control system and autostabilizer
2.2.3. Autostabilizer modes
2.2.4. Range of adjustment of autostabilizer constants
Instrumentation
3. Scope of the Test Programme
*Replaces R.A.E. Technical Note Aero. 2895, May 1963.--A.R.C, 25 001.

4. Quantitative Measurements
4.1. Control power
4.1.1. Test technique
4.1.2. Results
4.1.3. Discussion of control power results
4.2. Damping
4.2.1. Test technique
4.2.2. Results
4.3. Vertical thrust response and damping
4.3.1. Test technique
4.3.2. Results
4.4. Ground effect
4.4.1. Test technique
4.4.2. Results
4.5. Longitudinal trim and stability
4.5.1. Test technique
4.5.2. Results
4.6. Lateral and directional trim and stability
4.6.1. Test technique
4.6.2. Results
5. Qualitative Results
5.1. General
5.2. Handling assessment
5.2.1. Pitch control
5.2.2. Roll control
5.2.3. Yaw control
5.2.4. Height control
5.2.5. Other qualitative results
5.3. Comparison with AGARD recommendations
5.3.1. Attitude control
5.3.2. Height control
5.4. Comparison with other jet-lift VTOL aircraft
6. Conclusions
References
Tables 1 to 3
Illustrations--Figs. 1 to 17
Detachable Abstract Cards
LIST OF TABLES
Table
1
2
3
Principal data relating to the S.C.1 aircraft
Data relating to the pilot's position and controls
Pilot opinion rating system from Ref. 8
LIST OF ILLUSTRATIONS
Figure 1 2
3 4
5
6
7
8
9
10 11 12 13 14 15 16 17
The Short S.C.1 General arrangement of the S.C.1 Sectional drawing of the S.C.1 Diagrammatic representation of control and autostabilizer system Theoretical responses to a ramp control input Typical responses to oscillatory control inputs Typical responses to steps in control Acceleration in pitch vs. nozzle opening. Acceleration in roll vs. nozzle opening Acceleration in yaw vs. nozzle angle Steady rate of pitch vs. stick position Steady state of roll vs. stick position Time histories of engine response Changes in net vertical force with vertical velocity Time history of landing showing changes in vertical force near the ground Pitch nozzle opening required to trim vs. airspeed S.C.1 results compared with control power and damping boundaries from Ref. 7 and with P.1127
1. Introduction.
Early experience ~ with the 'Flying Bedstead' jet-lift research vehicle demonstrated the practicability of satisfactorily controlling this type of aircraft with the aid of autostabilization, but left important research areas unexplored. These related mainly to conditions of forward speed and the transition to conventional wing-borne flight. One of the purposes for which the Short S.C.1 aircraft was designed and built was to extend this range of investigation.
One of the important aspects of the research programme on the S.C.1 is the study of desirable handling qualities at all stages of jet-borne flight. This study is of special significance in the VTOL regime of operation, because control power and manoeuvrability have to be produced by jet reaction nozzles which are expensive in terms of aircraft performance, and it is therefore necessary to find the right com- promise between what the pilot wants and what the designer can afford to make available.
To provide information on desirable handling characteristics, a study has been made of the stability and control of the S.C.1 in hovering and low speed flight, and of the effects of changes in various para- meters on flying qualities. The work covers roughly the first year of research testing, and, although only

part of the VTOL field of operation has been covered, the results to date are of sufficient interest to warrant publication.
Some results of general interest relating to the operation of a jet-lift VTOL aircraft are presented in Ref. 2.
2. Description of the Aircraft and Equipment.
2.1. The Aircraft. The Short S.C. 1 shown in Fig. 1 is a single-seat, low wing, tailless delta aircraft of about 8000 lb maximum
all-up weight. Four Rolls Royce RB108 light-weight lift engines are mounted vertically in side-by-side pairs in a central bay, so that their resultant thrust line passes close to the centre of gravity of the aircraft. These pairs of engines can be swivelled about transverse axes, so as to produce accelerating or decelerating components of thrust along the flight path. A fifth RB108 engine is mounted under the fin, and exhausts at the rear of the aircraft to provide propulsive thrust in normal flight.
A 3-view general arrangement drawing of the aircraft is given in Fig. 2, while the part-sectional view of the aircraft, in Fig. 3, illustrates the engine installation and gives some indication of the layout of the air-jet control system used in hovering and low speed flight.
In this system, about 10 per cent of the intake mass flow of the lift engines is ducted to a 'ring main' and thence to the variable area nozzles whose thrust can be varied to produce the required control moments in pitch, roll and yaw. The combined thrust of these nozzles remains constant, and amounts to just over 10 per cent of the total thrust of the engines.
A full description of the control system follows in the next Section, while a more complete account of the aircraft itself is given in Ref. 2.
The principal dimensions, weights and moments of inertia of the aircraft are listed in Table 1, and data relating to the pilot's position, the geometry of the pilot's controls and the control forces are given in Table 2.
2.2. Control System and Autostabilizer. The S.C.1 has two types of control; aerodynamic surfaces for use at normal flight speeds and air-jet
nozzles for use at low speed and in hovering when the aerodynamic surfaces are ineffective. The aero- dynamic surfaces are conventional, with ailerons and elevators on the wing trailing edge and a normal rudder. The air-jet controls comprise roll control nozzles inboard of the wing tips and combined pitch and yaw nozzles below the nose and tail. These latter nozzles open and close to give pitching moments, and rotate ± 30 deg about their fore and aft axes to give yawing moments. In yaw the air-jet and aero- dynamic controls are permanently linked mechanically to the rudder bar and there is no autostabilization. In pitch and roll, the two types of control are not necessarily linked; different modes of operation are available in which the aerodynamic surfaces or the nozzles are actuated by direct mechanical connexion with the stick or by the electro-hydraulic servo-motor forming part of an electrically signalled control system. These modes of operation are described in the next Section.
The electrically signalled control system, which was adopted to facilitate the provision of various degrees of synthetic stability, together with the equipment known as the 'Autostabilizer' which generates the stabilizing signals, is described in Section 2.2.2.
2.2.1. Modes of operation of control system. The mechanical outputs from the stick and from the electro-hydraulic servo-motor may be utilized in the following alternative ways which are illustrated in Fig. 4.
(a) The aerodynamic surfaces and the nozzles may both be operated by the servo-motor, with the pilot's demands and the stabilizing signals fed in electrically. This condition is known as 'Fully-stabilized'.*
(b) The nozzles may be operated by the servo-motor in response to electrical signals as in (a) while the aerodynamic surfaces are directly linked to the stick. This condition is known as 'Nozzle-stabilized'.*
*These terms, and other which follow, have come into common use with the S.C.1, but they are far from ideal, and their use here is not to be construed as a recommendation for their general adoption.
4

(c) The nozzles and the aerodynamic surfaces may both be directly linked to the stick in the so-called 'Manual',* (more accurately, 'Direct') condition.
Changeover between the first two conditions is made on the ground, but the pilot has always the facility of reversion to the third conditionl 'Manual', in the air by an emergency lever.
Since the elevator hinge moments in certain phases of flight might be beyond the capacity of the servo-motor, the elevator is normally operated through a conventional power control unit. This unit can revert to true 'manual' in the event of h hydraulic failure, but this is an emergency, not a test, con- dition.
2.2.2. Electrically signalled control system and autostabilizer. A simplified diagrammatic re- presentation of this system is given in Fig. 4. The control surfaces or nozzles are positioned by an electro- hydraulic servo-motor in response to the sum of stabilizing signals derived from a rate gyro in the autostabilizer and a signal proportional to the pilot's stick position. These signals, together with servo position and servo rate feedback signals are added in a magnetic amplifier whose output operates an electro-mechanical transducer ('Law's relay') which moves the valve spool of the hydraulic servo-motor. The position of this valve spool, which determines the rate at which the servo-motor moves, is measured by an a.c. pick-off to provide the servo-rate feedback signal, required for stabilization of the servo system itself. The main feedback signal, the servo position signal, is obtained from a potentiometer coupled to the the output shaft of the servo-motor.
To provide against the possibility of faults, the electrically signalled control system, including the autostabilizer, is triplex. That is, it comprises three independent lanes, each complete in itself and termina- ting in a servo-motor. The three servo-motors are mechanically coupled to a common shaft and are so designed that ifa fault should occur and one of them attempt to move the control to an incorrect position, the other two would be able to overpower it and move the control correctly. Thus one lane of the control system or the autostabilizer may fail without any great deterioration in the overall performance. The failure of a second lane could however leave the pilot without effective control through the electrically signalled control system and i t would be necessary to change to 'Manual ' (mode (c) in Section 2.2.1). For this reason a fault detection system has been provided to indicate to the pilot when a fault has occurred. This is achieved by comparing the three signals from a second set of a.c. pick-offs measuring the positions of the three valve spools. When one of these signals differs by more than a set amount from the other two, fault indicating lights are illuminated in the cockpit. The pilot will then normally land the aircraft as soon as possible. However, since a transient difference can exist between the three valve positions while a rapid manoeuvre is being performed, the pilot would generally cancel an indication appearing in such circumstances and take no further action unless the indication reappeared.
This emphasis on safety was dictated in the first place by the fundamental decision to use an auto- stabilizer in which the stabilizing signals are capable of making a demand greater (in fact 40 per cent greater) than the maximum demand from the stick, so that even when the pilot demands maximum response, the autostabilizer is not saturated and can still maintain the required response despite external disturbances. If a single lane system had been used with an autostabilizer having this degree of authority, then in the event of a failure which resulted in a stabilizing signal reaching its maximum possible value, the pilot would have been unable to control the aircraft. The triplex arrangement overcomes this difficulty and also ensures that no undue hazard is introduced by the use of the electrically signalled control system, enabling the pilot to be given, as nearly as possible, infallible indication of any foreseeable fault as soon as it occurs. In addition, all power supplies, hydraulic piping etc. are so arranged that no single fault can affect the functioning of the control system or autostabilizer and that any fault which is significant is immediately signalled to the pilot.
2.2.3. Autostabilizer modes. The autostabilizer also has three modes of operation according to the stabilizing signals selected by the pilot as shown in Fig. 4.
*These terms, and others which follow, have come into common use with the S.C.1, but they are far from ideal, and their use here is not to be construed as a recommendation for their general adoption.

(i) In the first mode, known as 'Non-Auto', there are no stabilizing signals. The control applications are sensibly proportional to the pilot's input, and produce mainly moments. In the hovering phase, no aerodynamic moments are produced by deviations in 0 or O, and hence the equation of motion is approxi- mately
I 0 = As, (1)
where 0 is the angular displacement of the aircraft, I is the moment of inertia, s is the pilot's input and A is a constant.
(ii) In the second mode, known as 'Rate-Auto' a signal proportional to aircraft rate of rotation is added, and, if we assume that the autostabilizer has no lags or other imperfections, we can write the equation of motion
I O+ B 0 = As, (2)
where B is a constant defining the amount of synthetic damping added. (iii) Finally, in the third mode, a further signal is added, obtained by approximately integrating* the
aircraft rate, electrically, in a circuit including a condenser and a by-pass resistor. This condition is known as 'Full-Auto'. The effect is to provide quasi-position control which resembles a pure position control from the point of view of dynamic stability and initial response. The type of response is compared diagrammatically with that corresponding to the first two modes, in Fig. 5. The control equation becomes:
C~ "~ 0 = As I 0 + B + l + z p
i.e.
Czp 0 = As I O+BO+ l +zp (3)
where ;4 and B have the same meaning as in equation (2), and C is a constant defining the quasi-stiffness, z is the time constant of the integrating condenser and its associated by-pass resistor, and p is differentiation with respect to time. This type of control had been found beneficial in previous tests of a jet-lift aircraft 1.
2.2.4. Range of adjustment of autostabilizer constants. The degrees of stabilization given in the 'Rate-Auto' and 'Full-Auto' modes, that is the values of B, C and z in equations (2) and (3), are set on the ground. The sensitivity of the pilot's control, represented by the constant A in equations (1), (2) and (3) is at present not adjustable.
In the 'Rate-Auto' condition the response of the aircraft to a step input by the pilot can be defined by two parameters; the final steady rate, and the time constant, or as is more usual in this context, the ratio of damping to inertia which is equal to the reciprocal of the timeconstant.
The final steady rate is the rate for which the signal from the rate gyro is equal and opposite to that from the pilot's input. In the absence of aerodynamic moments it is determined only by the ratio A/B without reference to the absolute values of the inertia or moments involved, and it is therefore a con- venient way of specifying the damping setting. The figures quoted below are the final steady rates for full stick deflection.
On the other hand, determination of the damping/inertia ratio, which is also given by the ratio of initial acceleration to final steady rate, depends on the value of the acceleration produced by a given
*In the early stages, the introduction of a separate position gyro was not contemplated, although it is a feature of the latest version of the autostabilizer. Perfect integration of the rate gyro signal was not practicable for reasons given later:

input to the autostabilizer and in order to give values to it, it is necessary to anticipate the results of tests described later. Because the sensitivity of the pilot's control is not adjustable, the damping/inertia ratio cannot be varied independently of the final steady rate.
The values of the two parameters are given below. The damping/inertia ratios are calculated on the basis that the initial acceleration given by full stick deflection would be 64 deg/sec 2 in pitch and 77 deg/sec 2 in roll (see Section 4.1.2). The final steady rates are nominal values.
Damping setting 1 2 3 4 5 6
Final steady rate for full stick deflection (both axes) 21 16 13 11 8.5 6.5 deg/sec
Damping/inertia ratio: Pitch 3.0 4'0 4.9 5.8 7.5 9.8 sec- 1 Roll 3.7 4.8 5"9 7.0 9.1 11"9 sec- 1
In the 'Full-Auto' condition, the response is more complex and three parameters are required to define
it: (1) The quasi-stiffness (C), that is the relationship between stick deflection and the change of attitude
which would result if the integration of the rate were perfect, (2) the damping (B), (3) the time constant (z) of the decay of the attitude signal. An infinite time constant (perfect integration) implies a pure position control system, in which the
final steady attitude is proportional to the stick position. This setting has not, in fact, been used, because inevitable differences in the characteristics of the 3 lanes of each channel would be integrated with time and would eventually appear as faults. With short time constants, this situation is less likely to occur. Zero time constant is, of course, a pure rate system.
The nominal values of the quasi-stiffness and the time constant for various settings in this condition are given below: the figures apply to both axes. The damping/inertia ratios available are the same as those for the 'Rate-Auto' condition.
Quasi-stiffness setting 1 2 3 4 5
Change of attitude for fu l l stick deflection
with perfect integration (z = oo) 5 10 15 20 30 degrees
Time constant setting 1 ~ • oc, ~ ~ ~ seconds 2 0.12 0.29 0.43 0.58 0.86 ,,
3 0.36 0.86 1.3 1.7 2.6 ,, 4 0.66 1'6 2.4 3.2 4.8 ,, 5 0.87 2.1 3.1 4.2 6.4 ,, 6 3.6 8-6 13.0 17 26 ,,
2.3. Instrumentation. The instrumentation system used Hussenot A22 recorders to record all the basic quantities such as
p i lo t ' s control inputs, control nozzle and surface positions, angular velocities and linear accelerations etc. but for safety reasons no signals were taken from the autostabilizer itself.
External measurements of the behaviour of the aircraft were made with kin6-theodolites, enabling ground position and velocity to be obtained.
The aircraft is fitted with a telemetry system which enables a selection of those quantities recorded

in the aircraft to be displayed and recorded on the ground. In addition, this system is used to monitor certain important aircraft systems, such as hydraulic, electrical and fuel systems, and the autostabilizer.
The telemetry installation is an experimental one, but it has proved useful both for pilot training and for the conduct of certain tests in which continuous, simultaneous recording of measured quantities and the pilot's spoken commentary were required.
3. Scope of the Test Programme.
The objective in this first stage of the research programme was to study the effect on flying qualities of variations in the control and stabilization of the aircraft during hovering and low-speed flight. The investigation could not be extended beyond about 90 knots, at this stage, because of a failure in the operating mechanism of the lift engine air intake system.
In nearly all the tests, the aircraft was flown in the 'Nozzle-Stabilized' condition with various amounts of synthetic damping, including none. The effect of the quasi-stiffness was also examined and a few flights were made in the 'Fully-Stabilized Rate-Auto' condition.
In order to interpret the results of handling tests, it was clearly necessary to measure the control power - i.e. the maximum angular acceleration capability of the control system- as well as the damping provided by the autostabilizer. The test procedure by which this was done is described below. Also, measurements were made of the vertical thrust control characteristics, (although no changes were made in this control) and of some of the basic longitudinal, lateral and directional stability characteristics.
The flying qualities assessment was based partly on the results of specific test manoeuvre, but more generally on pilot opinion.
The aircraft was flown by three RAE pilots, two of whom were very experienced on the aircraft, by two NASA test pilots of wide V/STOL experience, and by two French test pilots with no previous V/STOL experience except, to a limited extent, on helicopters.
The usual pilot opinion numerical rating system was not normally used, since few of the pilots engaged in the tests were familiar with it, and, in addition, the descriptive sub-divisions (which were devised for conventional aircraft) are not easily applicable to tests of this sort.
In the interests of accuracy, all the quantitative tests for measuring aircraft characteristics were made in fairly calm conditions (surface wind less than 12 knots) and, apart from the longitudinal and lateral trim tests, were made with the aircraft hovering, nose to wind, over a spot on the ground. The handling assessments however were generally made in less calm conditions with winds up to 30 knots.
4. Quantitative Measurements.
4.1. Control Power.
4.1.1. Test technique. Tw• techniques were used f•r these measurements• inv••ving b•th •sci••at•ry and step inputs by the pilot. It will be remembered that, when the autostabilizer is engaged, the control nozzle opening is not directly controlled by the pilot, so that simple step changes in nozzle opening, cannot be made. By using an oscillatory input, which the pilots found fairly easy to do over a limited range of frequencies, the control power could be obtained even in the presence of quite large amounts of synthetic damping. Fig.6 shows typical examples of the records of such tests. The pilot's input was very nearly sinusoidal ; consequently the response of the control nozzle and the angular rate of the aircraft were also nearly sinusoidal. Theoretically, both the inherent damping and the control moments are obtainable from records of such tests, but because the pilot's input was not purely sinusoidal and because of limita- tions in the present instrumentation, it was not possible to measure the phase relationship and hence the inherent damping accurately. However the magnitude of the damping moment was sufficiently small for the control power, defined as the maximum angular acceleration capability of the control, to be derived simply from the measured frequency and the peak angular rate of the response.
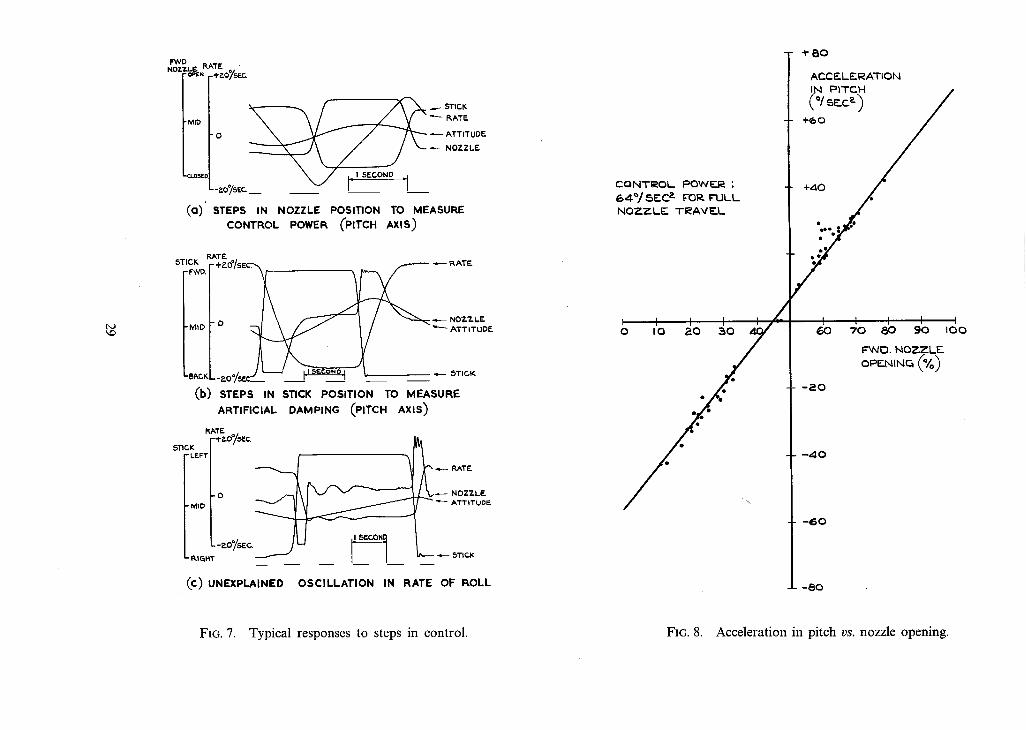
When the pilots weremore familiar with the aircraft, tests could be made in the so-called 'Non-Auto', unstabilized condition. Here, the pilot controlled the nozzle directly, and the desired step inputs could be obtained. Fig. 7a is a record of the response of the aircaft to such an input. A range of amplitudes was used, and the angular acceleration was derived from the record of angular velocity, the value being

taken at zero angular velocity to eliminate the effect of inherent damping. Had an angular accelerometer been available, more accurate results might have been obtained.
Both types of measurement were used for control power in pitch, roll and yaw.
4.1.2. Results. In the oscillatory input tests, the input amplitude could not be varied widely, since it was necessary for the pilot to choose an input which allowed him to move the control smoothly and regularly, without distortion of the desired pure sine wave. Therefore, only the angular accelerations for full control deflection are quoted, and are given in the table to follow.
For the step input tests, angular acceleration has been plotted as a function of nozzle opening for the pitch and roll axes, in Figs. 8 and 9, and against nozzle angle for the yaw axis, in Fig. 10.
In pitch (Fig. 8), the results are quite consistent and linear. A small displacement from neutral is evident at zero response, indicating a slight non-alignment of the lift-engine thrust line with the aircraft centre of gravity.
In roll (Fig. 9), the results show rather more scatter which is attributed mainly to the effect of fuel sloshing in the wing tanks, but there is no consistent out of trim condition.
The results in yaw (Fig. 10) again show good consistency and linearity, but a significant out of trim condition exists, representing almost 20 per cent control deflection. This is due mainly to the lateral thrust produced by a discharge of air from the propulsion engine compressor through openings on the port side of the rear fuselage. This discharge is necessary to compensate for the difference in engine operating conditions between VTOL and conventional flight.
The control powers given by the two methods of test are listed below:
Control power Axis Oscillatory method Step method Pitch 64°/sec 2 64°/sec 2
Roll 80°/sec 2 75°/sec 2
Yaw 20°/sec 2 18-5°/sec 2
Strictly, the results of all the above tests should be corrected for changes in control thrust due to variations in weight and, thus, in lift engine thrust, and for changes in inertia as fuel is used. However, as the magnitudes of these corrections are of the order of 5 per cent or less, individually, and tend to cancel out, no corrections have, in fact, been applied.
4.1.3. Discussion of control power results. The results from the two types of test agree reasonably well, and, in the form of angular accelerations are adequate for the present handling assessment. For design purposes, it would be valuable to convert them into control nozzle thrusts. This cannot be done yet with any certainty because the moments of inertia so far available are only estimated. Comparison of the pitch and yaw control powers, for example, shows that the inertias quoted in Table 1 are not consistent, and that the linear extrapolation of the pitch control power to full travel, in Fig. 8, may not be exactly justified. Similarly, the ratio of roll control nozzle thrust to pitch control nozzle thrust, inferred from tl~e inertias and measured control powers, does not agree with the known ratio of the exit areas of the ~wo sets of nozzles - both fed from the same main duct.
It is obvious that further tests will be required to establish these control thrusts absolutely. These tests will involve deliberate known shifts of the aircraft CG, longitudinally and laterally, with measure- ment of control-nozzle travel required to trim. In addition, the moments of inert.ia of the aircraft will have to be measured.
4.2. Damping. • 4.2.1. Test technique. The angular-velocity damping of the aircraft is in general made up of two
components - one inherent, the other, very much larger, synthetic. With the autostabilizer in operation, the response to a step input by the pilot rapidly settles down to a steady angular rate. A typical example is shewn in Fig. 7b. This final steady rate, in the absence of any inherent damping, would be that for which the autostabilizer rate gyro signal, and the pilot's input signal, just cancel one another. In fact,

some inherent damping would be expected, and, if it were positive, would cause the final steady rate to be less than the rate at which the above electrical balance is obtained.
Thus, with the autostabilizer working, the final steady angular rate could be measured for a range of step inputs, without the aircraft having to reach large angles of pitch or roll. In roll, however, the response was somewhat oscillatory, as illustrated in Fig. 7c, and a mean final steady rate had to be used, since the oscillation was poorly damped. The causes of this oscillation are not yet fully understood, but the effect is to increase the scatter of the results. It also attracted adverse comment from the pilots.
With no synthetic damping, the step-input technique could not be used since the final rate would be too high, and take too long to be achieved with practical inputs by the pilot. Therefore, the inherent damping had to be measured by alternative means. One method involved manoeuvres of the type re- corded in Fig. 7a. Following a step input, the angular acceleration decreased slightly as the angular rate increased*, indicating positive damping. The variation of acceleration with rate enabled the damping to be estimated.
As an alternative method applicable to the pitch and roll axes, the control nozzle position was measured when the final steady angular rate was achieved, with the autostabilizer in operation. This, again, gave a measure of the moment required to sustain a steady angular rate, and hence the required inherent damping.
Neither ofthe above methods was particularly satisfactory, since the inherent damping is very low. The oscillatory input method, mentioned earlier, could have enabled the damping to be obtained, had it been possible to determine the phase relations between nozzle opening and rate output with sufficient accuracy. Steps are being taken to improve the accuracy of such phase measurements. Recorders having a wide range of recording paper speeds will be used so that recorded traces can be analysed more accurate-
" ly, and a different type of rate gyro with more stable frequency response characteristics will be used permitting more reliable corrections to be made for the phase shift due to the instrument.
4.2.2. Results. Figs. 11 and 12 show the final steady rates of pitch and roll, respectively, plotted against pilot's stick position, for two settings of the autostabilizer. The measured rates for full input are compared below, with the nominal rates for which the autostabilizer and pilot signals should balance.
Nominal 1 l°/sec Nominal 21°/sec Pitch, measured 1 l°/sec 18°/sec
Roll, measured 1 l°/sec 19°/sec
At the lower damping (21°/sec nominal), the measured steady rates are significantly less than the nominal value. This difference is presumably due, in part at least, to the effect of the inherent damping, but the absence of a measurable difference in the higher damping case suggests there may be some dis- crepancy in the relative magnitudes of the coefficients built into the autostabilizer. If the difference in steady rates at low damping were due only to the effect of inherent damping, the measured steady rate at the higher damping would be 9.5 deg/sec instead of 11 deg/sec.
The values of the inherent damping measured by the two methods described in the previous Section agreed reasonably well. The values of the damping/inertia ratio and the corresponding final steady rates are given below and compared with the values measured for the lowest damping at present available from the autostabilizer.
Axis Inherent damping
('Non-Auto') Pitch 0.5 see-1 (130O/sec)
Roll 0.6 sec- i (130O/sec)
Yaw 0.1 sec- 1 (190O/sec)
Minimum synthetic damping
('Rate-Auto' setting 1) 3.5 sec-1 (18O/sec)
4.0 sec- 1 (19O/sec)
*Fig. 7a appears to indicate the opposite effect, but this is due to a slight non-linearity in the recording system.
10

These results underline the large gap in damping between the 'Non-Auto' condition and the lowest autostabilizer setting. This has made the establishment of optimum damping rather uncertain at present, but autostabilizer changes are planned which will help to bridge the gap.
4.3. Vertical Thrust Response and Damping. 4.3.1. Test technique. With the aircraft hovering at a suitable height, a vertical velocity was
initiated by a small step change in lift engine throttle setting. A second step change in throttle setting was then made to check the vertical velocity. The instantaneous net thrust was derived from the recorded vertical acceleration and the aircraft weight, while kin&theodolite records were used to find the instant at which the vertical velocity was zero. The magnitude of the vertical velocity was always such that the engine thrust had time to reach a steady value after the application of the check movement of the throttle and before the vertical velocity became zero. These tests enabled the net thrust to be determined as a function of throttle position.
The time responses of the lift engine thrust to step inputs on the throttle were also obtained from these tests. However, the thrust response is so fast that it is difficult for the pilot to move the throttle fast enough (relative to the rate of thrust responses) for his input to be considered a 'step'.
For measurement of the vertical-velocity damping, the aircraft was made to ascend or descend, at rates up to 10 ft/sec, while tracked by the kin6-theolodites. The difference between the engine thrust deduced from the throttle setting, and the net force given by the aircraft weight and vertical acceleration, gives the resultant damping force.
4.3.2. Resultsl The sensitivity of the lift throttle was found to be 1000 lb/inch (i.e. 0.14 g per inch) at around the take-off condition.
The thrust response records, of which some examples are given in Fig. 13, are not easily interpreted, for the reasons mentioned above. However, for small changes in throttle setting ( < 400 lb say), the engine thrust reached a steady value about 0"1 sec after the throttle. For large steps, the maximum recorded rate of thrust increase was about 3500 lb/sec (0.5 g per sec).
The results of the vertical-velocity damping tests are given in Fig. 14, where the increment of vertical force is plotted against vertical velocity. The points, although scattered, group themselves into the two opposite quadrants, indicating the presence of some positive damping.
Damping would be expected to arise from two causes : (a) momentum drag of the intake air (about 4 lb/ft/sec) and (b) fiat plate drag of the wings etc. At 10 ft/sec the force due to their combined effects is estimated to amount to about 70 lb, whereas Fig. 14 indicates forces well in excess of this. An additional effect could arise from the effects of recirculation of exhaust gases (even apart from the effect of ground), which, by convection, could affect the intake temperature, and hence the engine thrust. Some indication of the existence of some such effect is given by the sequence of points linked by the dotted line in Fig. 14. A possible explanation of this sequence is that the aircraft after experiencing damping forces due to (a) and (b) at the beginning of its descent, eventually entered the uprising cloud of heated air, which led to a loss in thrust and an apparent reduction in vertical-velocity damping. The height of the hysteresis loop in Fig. 14 corresponds to an intake temperature rise of about 8°C, which sounds quite reasonable. However, this explanation does not account for the overall damping being higher than expected.
Although the points in Fig. 14 are scattered, it can be seen from the line which has been drawn at a slope of 20 lb/ft/sec that the damping is of this order.
For a more detailed study of the sources of damping, careful account of intake temperature variations would have to be made, and possibly a flow visualization technique employed to study the recirculation flow patterns.
4.4. Ground Effect. 4.4.1. Test techniques. Only a preliminary study has so far been made of the change in net vertical
force due to ground effect. These changes arise from two main sources, whose effects are very difficult to separate. Firstly, the presence of the ground causes the lift jet efflux to spread horizontally and to mix rapidly with ambient air. This mixing process results in changes in pressure under the wing and fuselage, which, in turn, produces a resultant downward force (suction effect) and changes in trim and stability.
11
Secondly, the spready jet efflux tends to rise, by convection, and leads to a rise in intake temperature and a loss in lift-engine thrust. The effects are therefore additive, but the test method used so far gives only the total change in thrust, due to both effects.
With the aircraft hovering at about 50 ft, a small reduction in lift thrust was made, to start the descent. The throttle was then returned approximately to its previous position and held fixed as long as possible. The descent was tracked by kin6-theodolites, to give height and vertical velocity, while the accelerometer gave the net vertical force on the aircraft.
4.4.2. Results. Fig. 15 gives a typical set of time histories of throttle position, net force, height and velocity. There is, at first, the expected increase in total vertical force, due to vertical-velocity damping. Thereafter, there is a rapid loss of vertical force, particularly from a height of 15 ft downwards, despite the increase in throttle setting. During this descent, the force decreased by about 250 lb, whereas, in free air, an increase in vertical force of about 50-100 lb would be expected, from the measured vertical velocity damping.
4.5. Longitudinal Trim and Stability.
4.5.1. Test technique. The aircraft was flown at constant height, outside the range of ground effect, at forward speeds from - 3 0 knots (backwards) to +90 knots, which was the limiting speed at the time of the tests. Pitch nozzle position was measured at each of a number of steady speeds, the record being corrected for any small residual angular acceleration. Speeds up to 45 knots were measured by a cup-type anemometer mounted on the nose-boom. Higher speeds were measured by the pilot's A.S.I.
All tests were made with the lift engines fixed in the hover position. For speeds up to +45 knots, horizontal thrust was obtained by tilting the aircraft, keeping the propulsion engine at idling thrust. To produce these speeds it was necessary to make changes of attitude (and consequently of incidence) of up to 5 ° . For the'higher speeds, the attitude was held near zero, while the propulsion engine was used to give forward thrust.
Because of the difference in techniques, the two sets of results are not strictly comparable ; although the propulsion-engine thrust line passes very close to the centre of gravity, there still remains the change in incidence.
4.5.2. Results. The two sets of trim points are plotted in Fig. 16. The scatter is reasonably small, and there is no obvious discontinuity where the two sets of results join at around 45 knots, which might have been expected from the 5 deg incidence change.
The stick moves in the conventional sense with increase in speed, for speeds up to 90 knots, although the rate of forward stick movement required to trim, i.e. the slope of the curve in Fig. 16, is quite large. There is some indication of a reduction in the slope of this curve at the highest speeds, and it is known, from the many transitions to normal flight that have been made, that the stick reaches its maximum forward position soon after 100 knots is passed, and thereafter moves back again.
It should be noted that the elevator remained directly linked to the stick, and became increasingly effective as speed increased. These results cannot therefore be used directly to measure the pitching moment due to forward speed until the elevator power, itself, has been measured.
The source of this increase of nose-up pitching moment with increasing forward speed is largely associated with the presence of the lift engine air intake on top of the fuselage. The intake flow produces a momentum drag acting in a plane above the centre of gravity, and in addition, induces pressure changes over the forward upper fuselage. These pressure changes are augmented by further changes on the lower rear fuselage aft of the lift-engine exit flow, and contribute to the nose-up moment.
As might be expected, the aircraft is unstable in backward flight, so that it is difficult to hold steady attitude of speeds in this condition. Other piloting problems arise from irregular 'snatching' on rudder and ailerons.
The overall drag of the aircraft was obtained by measuring the inclination of the thrust line needed to sustain a constant forward speed, for speeds up to 45 knots. The change in drag with forward speed, at these very low speeds, was about 7 lb/ft/sec, of which it is estimated that intake momentum drag alone would account for 4 lb/ft/sec.
12

4.6. Lateral and Directional Trim and Stability. 4.6.1. Test technique. The aircraft was flown sideways at speeds up to 30 knots, by applying
progressively increased bank angles. The aileron and rudder inputs needed to trim were recorded. The lateral velocity was measured by the cup-type anemometer.
4.6.2. Results. The aircraft exhibited positive dihedral effect and positive weathercock stability in these manoeuvres, in that increasing application of aileron and rudder, in the stable sense, were required to trim. Quantitatively, the increase in rolling moment with increasing lateral velocity, expressed in terms of rolling acceleration, amounted to 0"39 deg/sec 2 per ft/sec. Similarly, the yawing moment due to alteral velocity was equivalent to 0.05 deg/sec 2 per ft/sec. These moments cannot be expressed in absolute terms until the corresponding moments of inertia have been determined.
However, the results illustrate the comparative insensitivity of the aircraft to lateral disturbances. A steady sideways velocity of 30 knots required 25 per cent of the available roll control, and 13 per cent of the rudder control, to trim*.
The increase in bank angle required to sustain increasing lateral velocities enabled the side force characteristics of the aircraft to be obtained. It amounted to 12 lb/ft/sec, of which, again, 4 lb/ft/sec would be accounted for by intake momentum drag.
5. Qualitative Results.
5.1. General.
Qualitative opinions about the handling of the S.C. 1 complementary to the quantitotive results already discussed have been collected from all the pi lots- RAE, NASA and French, ~.~ ~,~ ./k~,,. '&e :aircraft during the test period. These opinions are correlated and discussed in the succeeding paragraphs, and generally speaking they show a good degree of unanimity.
The amount and type of flying on which the pilots based their opinions varied widely. Two of the RAE pilots had 60 or more hovering flights in the S.C.1 and the third had 14 flights. These pilots were given specific manoeuvring tasks in order to help them to assess the control system, which were intended to represent the type of manoeuvre likely to be done in practice by a VTOL aircraft while hovering. In the pitch-yaw manoeuvre they started with the aircraft hovering above a line, rotated it through 90 ° and flew it to hover above a second line 100 yards away. The roll manoeuvre consisted of a sideways flight between two lines 30 yards apart starting and ending in a steady hover.
Of the visiting pilots, those from NASA flew the aircraft 6 or 7 times each. They were pilots of very v~ide experience, including flight in other VTOL aircraft and variable stability helicopters, which was of obvious assistance to them in assessing the S.C.1. The French pilots, who had about 8 flights each, had no previous experience of VTOL other than in helicopters. Their opinions were based on a limited amount of naturally cautious flying and were therefore tentative but useful.
It should be observed that only the pitch and roll damping, and not control power or sensitivity, were changed during the tests. It is therefore not possible at this stage to be completely sure that pilots' criticisms of control power would not be met by changes in sensitivity (or vice versa) and further tests are needed to clarify the position.
As mentioned earlier, the usual pilot opinion rating system has not been used, since too much weight should not be attached, at this stage, to the precise distinctions of opinion implied by a numerical system.
5.2. Handling Assessment. 5.2.1. Pitch control. All the pilots who have flown the S.C.1 have considered the control power in
pitch to be adequate although some have suggested that more power could be used particularly in re- covery from extreme attitudes. The sensitivity has also usually been considered satisfactory, but one of
*These results apply to sideways flight at low incidence. More recent flight and wind-tunnel tests have shown that at high incidence and at sideslip angles in the vicinity of 30 ° to 60 ° rolling moments are developed which are much greater than might be expected from these results (see AGARD Report 527).
13

the NASA pilots thought that an increase in sensitivity of up to 50 per cent, by a reduction in stick travel for the same control power, would be an improvement.
On the optimum damping, the range of opinion has been wider. The RAE pilots prefer the lower values of damping available from the autostabilizer, th,t~ is. setting 1 or 2, giving nominal steady rates of 21 deg/sec or 16 deg/sec for full control, or damping/inertia ratios of 3'0 or 4.0 sec-1. The higher damping settings, giving 11 deg/sec (damping/inertia = 5"8 sec-t) or less, are considered too sluggish for comfortable manoeuvring. Although it appears that settings 1 or 2 may represent the optimum for RAE pilots, this could not be confirmed because there were no intermediate steps between setting 1 and 'Non-Auto'.
The NASA pilots, who were accustomed to low damping on other VTOL aircraft, felt that the minimum available damping was still too high and would have preferred a further reduction. The relatively in- experienced French pilots did not feel competent to come to a final decision. In calm weather they pre- ferred setting 1 or 2 but felt that more damping would be desirable in gusty conditions.
Most of the pilots made some flights with no synthetic damping in pitch and were agreed that additional damping was required. With no synthetic damping the aircraft was controllable and it was considered that it would be satisfactory in emergency. It should be noted however that these flights were made with the pitch control nozzles operated by the autostabilizer servo ('Nozzle-Stabilized') and the elevator by the power control, so that their hinge moments were not fed back to the stick. Flight has not yet been attempted in either the 'Direct' or the 'Manual ' conditions (see Section 2.2.1) in which, because friction and hinge moments would be felt by the pilot, the quality of the control would be impaired somewhat*.
During the process of obtaining pilots' opinions on the desirable level of damping, the manoeuvres described in Section 5.1 were performed, and the times analysed, but in the case of only one pilot were the effects of changes in damping not obviously obscured by a learning process. In this case, the mean and standard deviation of the manoeuvre times for different pitch damping settings were as follows:
Nominal Mean time Setting Nominal Damping~inertia for Standard
max. steady rate ratio manoeuvre deviation 1 21°/sec 3'0 sec- 1 t6.0 sec 0.93 sec 2 16°/sec 4.0 sec- 1 16.0 sec 0.77 sec 3 13°/sec 4.9 sec-1 16.6 sec 0.66 sec 4 11°/sec 5"8 sec 17.7 sec 1.64 sec
Of these results, the times in setting 4 are significantly (at the 0"02 probability level) different from the others, but no distinction can be drawn between the other three sets. It must therefore be observed that although decreases in damping make the aircraft more pleasant to fly, there are no signs that manoeuvres can be done more speedily with lower damping settings. It is unfortunate that further decreases in damping could not be tested, but steps are being taken to increase the range of adjustment of the autostabilizer.
A small amount of flying has also been done in 'Full-Auto', with the quasi-position control. The NASA and RAE pilots who tried this condition with a time constant of about 3 seconds did not like the added stability because it restricted the manoeuvrability of the aircraft, while the change in stick position which was required to maintain a change of attitude, as the quasi-attitude signal decayed, made control more difficult. On the other hand, the French pilots, who being less experienced, were perhaps more concerned with stability, had a slight preference for this condition.
These opinions differ from those given by pilots on the 'Flying Bedstead '1 who considered that 'Full- Auto' made the machine easier to fly, particularly in gusty conditions. This difference of opinion can probably be accounted for by the superior quality of the control system in the S.C.1 with its freedom from the lag which made the 'Flying Bedstead' so difficult to control.
*It is now known that the autostabilizer servo has considerable hysteresis which degrades the quality of the control. Flight in the 'Direct' condition has in fact proved to be easier than in 'Non-Auto' despite the higher control forces.
14
5.2.2. Roll control While, broadly speaking, the pitch control of the S.C.1 appears to be satis- factory, roll control has received more criticism, and pilots have been less consistent in their views on it. The position is complicated by two 'factors which affect the pilots' views of the control quality without being directly concerned with it. Firstly, surplus air from the propulsion-engine compressor exhausts sideways near the wing trailing edge when the engine is idling, and the flow causes snatch on the ailerons, which are not power operated, and hence on the stick; and secondly there is an oscillation in roll at about 2 cycles a second at low speeds (Fig. 7c) which appear superimposed on the response in roll and is noticeable to pilots.
A few flights were made in the 'Fully-Stabilized' condition so that the ailerons were operated by the autostabilizer servo. By relieving the pilot of the snatch this gave a marked improvement at the hover; but it appeared that the oscillation was somewhat worse and, for this reason, the condition was not generally used. The oscillation is still under investigation and its cause is not known at present.
The general pilot opinion is that a higher control power in roll would be preferable. The time taken to stop a manoeuvre is considered to limit the angles of bank which can reasonably be used with the aircraft hovering. Most pilots also consider that the sensitivity of the roll control should also be increased, at least for large stick movements; sensitivity for small movements, such as are used in steady hovering, is considered to be satisfactory.
The pilots' preference on damping level in roll were also more varied than in pitch. The NASA pilots again considered that the minimum damping was excessive and that a further reduction would be de- sirable. The most experienced RAE pilot on the other hand preferred damping setting 2 (nominal steady rate of 16 deg/sec or damping/inertia = 4.8 sec-1) for manoeuvring and higher damping for steady hovering. He did not however feel that variation in the roll damping had as much effect as variation in pitch damping, while the second experienced RAE pilot, who preferred damping setting 1 (steady rate 21 deg/sec or damping/inertia = 3.7 sec- l) took the opposite view. The one set of timed manoeuvres in which the effects of changes in damping were not obscured by learning showed no significant difference over the range of settings from 1 to 4 (21 deg/sec to 11 deg/sec steady rate or damping/inertia = 3.7 sec- 1 to 7"0 sec- 1).
All the pilots who flew the aircraft without synthetic roll damping agreed that this condition was inferior to the unstabilized pitch condition, and was hardly suitable even for emergency use. It was felt that the limit of controllability could easily be reached and that the rates and angles of bank used had therefore to be limited. The three pilots who flew in this condition suggested that an increase in sensitivity would improve the control; while this might increase the risk of overcontrolling for small inputs, it would also reduce the possibility of the pilot getting out of phase after large disturbances and so losing control. Again an increase in sensitivity for large movements only would appear to offer an all-round advantage*.
5.2.3. Yaw control. It is generally considered by pilots that the yaw control is not satisfactory. The poor centring of this control, combined with a tendency for the rudder to snatch in gusty conditions and the out-of-trim yawing moment produced by the propulsion engine air discharge (see Section 4.1.2) are all contributory factors, but the main reason given is that the control power is too low. Since there is no damping, high rates of yaw (40 deg/sec) can be used, but the maximum acceleration is comparatively low (about 19 deg/sec2), so that considerable anticipation is needed in fast turns. It is therefore thought that while these control characteristics are adequate for the flying at present being done, they would not be satisfactory if precision tasks in yaw had to be carried out. Pilots would certainly benefit from more
*Flight in the 'Direct' condition has shown that these criticisms were due to hysteresis in the servo (see also footnote on p. 14). Increasing sensitivity has not proved advantageous and the original sensitivity is now thought to be near optimum.
15

control power but the other defects, particularly the out-of-trim and the control centring would also need to be improved.
5.2.4. Height control. The height control of the S.C. 1 has received much praise and little criticism. The response of the lift engines to the throttle, described in Section 4.3.2 is so fast as to cause no trouble to the pilots. The height control is usually described as excellent and the only difficulties have been caused by lack of thrust in ground effect after high weight take-offs if the aircraft has failed to gain sufficient height immediately after lift-off. To what extent the excellence of this control is due to the particular value of sensitivity which it has or to the speed of the engine response is a question to answer which further tests are required.
5.2.5. •ther qua•itative •esults. Besides the particu•ar pi••ts• •pini•ns •n the vari•us c•ntr••s •f the S.C. l, other useful opinions have been expressed about various features of the aircraft's handling. Possibly the most important of these is that the aircraft, stabilized, is easier and more pleasant to fly than a normal helicopter, for example the Westland-Sikorsky $51 Dragonfly or the Westland Wasp. In particular, pilots who have flown it in turbulent conditions comment that it is very insensitive to gusts and wind speed and that it is possible to take-off or hover without reference to the wind direction, although the aileron snatching referred to in Section 5.2.2 above is more marked and irritating with a tail wind. In- sensitivity to gusts and wind direction is, of course, a general feature of jet-lift aircraft, the aircraft response to gusts when hovering being to the first order inversely proportional to the velocity of the supporting jet.
The training programme has also indicated the practicability of allowing pilots to make their first flights in the S.C.1 free, without previous experience of tethered flight. The success of this procedure underlines the comparative ease (and simplicity) of control of the aircraft as does the early stage in their flight experience at which pilots are willing to use large angles of pitch and roll, up to 25 or 30 degrees, in hovering flight.
The low level of friction and break-out forces (about 1 ]b), the low force gradient (about 5 lb for full deflection) and absence of backlash, have all contributed to the favourable opinion of the mechanics of the S.C.1 control system. This feature is believed to have a marked effect on pilot opinion of flying qualities.
On the debit side all pilots comment unfavourably on the complication of the cockpit, which requires careful briefing and much study by the pilot before he flies the aircraft. This complication is however largely the result of the specification requirements of the aircraft which called for operation in numerous stability conditions, and would be greatly reduced on an operational aircraft.
5.3. Comparison with A GARD Recommendations.
The AGARD recommendations for V/STOL handling qualities 3 which suggest minimum levels of response and damping, are based largely on U.S. military helicopter requirements, supplemented by experience gained on several V/STOL research aircraft including the S.C.1. The recommendations are necessarily tentative, but it is of interest to examine them in the light of recent S.C.1 experience.
5.3.1. Attitude control. The response, defined by the angular change in attitude which can be achieved in the first second after the application of full control, and the damping of the S.C.1 are compared in the Table below with the levels recommended by Ref. 3 for an aircraft of the weight of the S.C.1. The figures for the S.C.1, in both pitch and roll, correspond to damping setting 1 which, from the consensus of pilots' opinions, appear to be the best of those available. The control travels and force gradients are
16

also given in the Table.
Axis
Pitch
Roll
Yaw
d
J Aircraft weight 6900 lb S.C.1 Ref. 3 i, I
Response (deg in 1 sec) damping (lb/ft/rad/sec) stick travel (in.) force gradient (lb/in.)
Response (deg in 1 sec) damping (lb ft/rad/sec) stick travel (in.) force gradient (lb/in.)
Response (deg in 1 sec) damping (lb ft/rad/sec) pedal travel (in.) force gradient (lb/in.)
13 19,200
+3½ 2
14 7,350
+3½ 1'1
8"5 small
-t-3 5
15 6400
4-4 1-2-5
15 4900
±3 1-2.5
9 13,500
±3 5-15
From the above it can be seen that, about all three axes, the response, control travels and force gradients recommended in Ref. 3 are close to those actually present on the S.C.1, but that considerable differences exist between the actual and recommended dampings.
In pitch, which is considered satisfactory in the S.C.1, the damping is considerably greater than the recommended minimum value. Apart from 'Non-Auto' (for which the response and damping are 26 deg and 2700 lb ft/rad/sec respectively) no lower damping was available so that it was not possible to test the recommendation more closely. There is, however, evidence from tests with a variable stability heli- copter 4 and from other sources that, for the control power of the S.C. 1, pilot opinion is relatively insensitive to damping at least over the range in question (from 6200 to 19200 lb ft/rad/sec) so that the discrepancy may not be very important. Further work planned for the S.C.1 with lower values of damping should enable a more conclusive comparison to be made.
In roll, although the S.C.1 figures are close to the recommended values, the S.C.1 is not considered completely satisfactory, "and it is suggested that an increase in control power, and perhaps of sensitivity as well, would be an improvement. This appears to contradict Ref. 3 since the recommended response and damping imply control power and sensitivity somewhat less than those of the S.C.1. It is unlikely that the rather low (by comparison with Ref. 3) force gradient of the S.C.1 is the cause of its unsatisfactory roll control characteristics because this might be expected to give the impression of excessive sensitivity rather than the reverse. The importance of sensitivity in addition to control power and damping in controlling a VTO aircraft is-well recognised but not yet fully understood, (despite a recent simulator study 5 which attempted to analyse the inter-relation between these three parameters and pilot rating), and it is probable, therefore, that the requirements for control travel are not so simple as has necessarily been assumed in Ref. 3. Further work, some of which is planned for the S.C.1, will be needed to elucidate this problem.
In yaw, the S.C.1 does not have the recommended damping, and is not satisfactory. Pilots suggest that a considerable improvement would result from an increase in control power. This is also implied in Ref. 3, since the control power would have to be almost doubled to maintain the response with the recommended damping. For the type of flying done so far in the S.C.1, in which no great precision of yaw control has been demanded, pilots have not felt strongly the need for damping. In instrument flight, however, which Ref. 3 is intended to cover, some measure of damping would undoubtedly be required.
Summarizing, the S.C.1 experience is not extensive enough to confirm the AGARD recommendations but apart from the roll control there is no obvious disagreement. Further work planned for the S.C.1
17

in which a wider range of parameters will be required, should enable a more conclusive comparison to
be made.
5.3.2. Height control. The AGARD recommendations propose that it should be possible, without exceptional skill, to control the vertical velocity to within 4-1 ft/sec while hovering in still air. The S.C.1 certainly complies with this. It is also recommended that 60 per cent of a demanded increase in thrust, amounting to 10 per cent of the weight of the aircraft, should be achieved within 0-3 seconds after a step input. Because of the difficulty of obtaining a sufficiently rapid movement of the throttle, the tests done so far have not demonstrated this specifically, but it does appear likely that the recommendation is being
met. Thrust margins have generally been somewhat greater than the 5 and 15 per cent recommended
respectively for take-off and landing and in this respect S.C.1 experience does not provide confirmation of Ref. 3.
5.4. Comparison with other Jet-Lift VTOL Aircraft. Two aircraft with which it is of interest to compare the handling characteristics of the S.C.1
are the Bell X-14A and the Hawker P.1127. Both are deflected jet aircraft; the X-14A, a two-engined aircraft, is smaller than the S.C.1, weighing 3500 lb, and the P.1127, which is single engined, is larger, with a maximum weight for vertical take-off of 11 500 lb at the present stage of development. The control system of the X-14A enables control power and damping about all three axes to be varied over a wide range. The P.1127 has a limited authority autostabilizer with no provision for variation of the control
characteristics. The control characteristics of these two aircraft and of the S.C.1 are compared in the following Table.
The figures for the X-14A have been taken from Refi 6: those for the P.1127 have been gathered from
the firm.
Aircraft
X-14A
Pl127
S.C.1
Axis
Pitch Roll Yaw
Pitch Roll Yaw
Control power
(rad/sec 2)
0.44-0.8 0.8-2.05 0-35-1"0
0.8 2.0 0.4
Pitch 1.1 Roll 1.35 Yaw 0.33
Control travel (in.)
± 6 +5 4-3
-t-3½ ±4 ±2½
±3½ +3½ ±3
Average control
sensitivity (rad/secZ/in.)
0.07-0.13 0.16-0.41 0.12-0.33
0.23 0.5 0.16
0.31 0.39 0.11
One RAE and two NASA pilots have flown all three aircraft. The two NASA pilots had taken part in the flight assessment of control power and damping requirements in the X-14A, the results of which are given in Ref. 6. Although not in complete agreement about their criticisms of these aircraft, the three pilots did concur in the Pilot Ratings which they attached to these characteristics, but emphasized that, because of the considerable differences between the aircraft, such ratings should be regarded as tentatiye. Nevertheless these ratings, based on the pilot opinion rating system given in Table 3 and discussed in Ref. 7, have been compared in Fig. 17 with results taken from Ref. 6 showing the boundaries between 'satisfactory' and 'unsatisfactory' (PR = 3½) and between 'unsatisfactory' and 'unacceptable' (PR = 6½)
18

combinations of control power and damping. These boundaries relate to manoeuvring tasks only, and, being based on tests performed in relatively calm conditions, do not include any allowances for the effects of gusts or other disturbances. If such allowances were made, a shift of the boundaries would be expected in the direction of greater control power and damping. This fact should be borne in mind in the following comparisons with the S.C.1 and P. 1127 which have been tested under generally less calm conditions, the S.C.1 in particular having been flown with winds up to 30 knots.
All three pilots flew the P.1127 without autostabilization, the configuration in which it is generally flown. No figures are available for the damping of the aircraft in this condition; it is said to be very small, and is probably of the same order as the inherent damping of the S.C.1 and X-14A. For the sake of plotting the Pilot Ratings, the damping of the P.1127 about all three axes has been indicated by a line between 0.5 and 1 sec-1.
The pilots' ratings of the roll control of the P.1127 and of the S.C.1 for both damping setting 1 and for 'Non-Auto' are consistent with the results of Ref. 6, which also appears to confirm the suggestion that an increase in control power would improve the handling of the S.C.1 in roll. That this is not, however, necessarily the correct conclusion is shown by recent experience with the P.1127 in which an increase in sensitivity alone brought about an improvement. This was achieved by introducing a measure of non-linearity into the control circuit, giving greater sensitivity (about 50 per cent more than the average) over the central part of the stick travel without any increase in control power.
In yaw, pilot's ratings for both the P.1127 and the S.C.1 are fairly consistent with Ref. 6, the rather low rating of the P.1127 being due apparently to its unstable directional characteristics in a crosswind given by the forward position of the engine intakes. The S.C.1 is known to be lacking in control power, pilots using full control for a high proportion of the time, but this is a manoeuvring requirement, the aircraft being fairly insensitive to crosswinds.
In pitch, the S.C.1 in damping setting 1 is so far removed from the range explored in the X-14A, that comparison would not be justified. In the 'Non-Auto' condition, pilots rated the S.C.1 at 4½ although the combination of control power and damping lies well on the satisfactory side of the PR = 3½ boundary. A similar situation exists in the case of the P.1127.
These differences of opinion do not appear to be due to the weight factor since, if corrections were applied on the basis of the AGARD recommendations, the points referring to the S.C.1 and P.1127 would be brought even further into the satisfactory region. It is possible that the greater control travel of the X-14A in pitch (±6" compared with ±3½" for S.C.1 and P.1127) may bea factor influencing pilot opinions and as pointed out by the pilots themselves, there are several differences between the aircraft which make a comparative assessment difficult. Among these are the low wing loading of the X-14A (18 lb/fC compared with 32.5 lb/ft 2 for the S.C.1 and 65 lb/ft 2 for the P.1127) and the fact that due to the limited deflection angle of the jets, the X-14A hovers with the wing at 11 ° incidence: this imposes a limit on the nose-up attitude changes which can be used to arrest forward motion since, even at fairly low speeds, significant pre-stall disturbances can readily be induced. If this limitation were removed and pilots were able to employ the large nose-up attitudes commonly used in the S.C.1 and P.1127, then it is to be expected that they would require more damping, and the PR = 3½ boundary for pitch control in Fig. 17 would be shifted to the right, reducing the present discrepancy.
At this stage, no further explanation cai~ be offered for the differences between the ratings given by the pilots to the three aircraft with similar combinations of damping and control power, but further work covering a wider range of parameters is planned for the S.C.1 and should help in understanding the problem.
6. Conclusions.
While the tests reported in this Report represent only the first stage in the flight test programme of the S.C.1, and have shown deficiencies in, for example, the ranges of some of the parameters which can be covered at present, nevertheless, it is possible to draw some tentative conclusions.
(1) The tests have shown that the aircraft is easier and more pleasant to fly at the hover than the average
19

helicopter. Conversion of new pilots to this mode of flight is straightforward, once the complexities of the cockpit, arising from the experimental nature of the aircraft, have been mastered.
(2) Pitch control is satisfactory, but possibly a lower value of the damping than that presently available would be an advantage.
(3) Roll control is not completely satisfactory, and opinions as to the best way to an improvement differ, at present. Possibly a change in control sensitivity may be sufficient.
(4) Yaw control without synthetic damping is satisfactory for visual flight, but more control power and probably some synthetic damping would be necessary for the more precise control tasks associated with instrument flight.
(5) Height control is excellent, but the characteristics of the system which are responsible for this attribute have not yet been positively identified.
(6) The range of variables covered in the assessment so far is not adequate for a full comparison with the AGARD recommendations, though no major disagreement has been shown up. However, there are indications that more weight should be given to control sensitivity than is the case in the present AGARD recommendations, particularly in the case of roll.
Some of the results reported here clearly indicate the need for further studies in the jet-borne phase, in particular, an investigation of lower levels of synthetic damping. The next major extension of the flight- test programme will be to higher speeds, including transition to wing-borne flight, where aerodynamic effects - largely insignificant in the present context - become important.
20

No. Author(s) 1 J .K .B . Illingworth ..
2 D. Lean and H. W. Chinn
4 Robert J. Tapscott ..
5 J. Patierno and J. A. Isca
6 Stewart Rolls and . .
Fred J. Drinkwater
7 George E. Cooper . .
LIST OF REFERENCES
Title, etc. .• Flight tests of a hovering jet-lift aircraft (Rolls Royce Flying
Bedstead). A.R.C.R. & M. 3336. May 1961.
. . Review of general operating experience with a jet-lift VTOL research aircraft.
Unpublished M.O.A. Report.
•. Recommendations for V/STOL handling qualities. AGARD Report No. 408. October 1962.
•. Criteria for control and response characteristics of helicopters and VTOL aircraft in hovering and low-speed flight.
Institute of the Aerospace Sciences paper No. 60-51. January 1960.
. . Instrument flight simulator study of the VTOL controllability - control power relationship.
Aerospace Enoineerin9 21(3)• March 1962.
•. A flight determination of the attitude control power and damping requirements for a visual hovering task in the variable stability and control X-14A research vehicle.
NASA Tech Note D-1328. May 1962.
•. Understanding and interpreting pilot opinion• Aeronautical Enoineerino Review• 16(3). March 1957.
21

TABLE 1
Principal Data Relating to the S.C.1 Aircraft.
Wing span Area Standard mean chord Leading edge sweepback Trailing edge sweepback
Overall length (excluding nose boom) Pitch and yaw nozzle arm Roll nozzle arm
Mean height of wing undersurface above ground, with aircraft static with oleos extended
Weight of aircraft less fuel Max weight for vertical take-off (wing loading 36.5 lb/ft 2) Max weight for conventional take-off (wing loading 38.0 lb/ft 2)
Total lift engine thrust including control thrust but without installation losses Propulsion engine thrust without installation losses
Estimated moments of inertia at: Pitch Roll Yaw
23.5 ft 211.5 ft z 9.0 ft 54 ° 3 °
25.5 ft 11.33 ft 8.76 ft
4-5 ft 5.6 ft
6260 lb 7700 lb 8050 lb
8600 Ib 22O0 lb
6900 lb 5480 sl.ft 2 1865 sl.ft 2 7000 sl.ft 2
TABLE 2
Data Relating to the Pilot's Position and Controls.
Position of pilot's head : 7.1 ft forward of the pitch and yaw axes 2.5 ft above the roll axis
Geometry of the controls : Pitch stick travel ± 12½ deg or -+-3½ in. Roll stick travel 0-9½ deg or ±3½ in.
Yaw pedal travel ± 22 deg or -/-3 in. Lift-engine throttle travel 24 deg or 3¼ in. total, from idling to maximum r.p.m.
Control forces (at the hover): Pitch friction 1 lb, force gradient 2 lb/in. Roll friction 1 lb, force gradient 1.1 lb/in. Yaw friction 5 lb, force gradient 5 lb/in. Lift engine throttle, friction adjustable, no force gradient.
22

TABLE 3
Pilot Opinion Rating System from Ref. 8.
to
Operating conditions
Normal operation
Emergency operation
No operation
Adjective rating
Satisfactory
Unsatisfactory
Unacceptable
Numerical rating
1 2 3
4 5 6
Description
Excellent, includes optimum Good, pleasant to fly Satisfactory, but with some mildly unpleasant
characteristics
Acceptable, but with unpleasant characteristics Unacceptable for normal operation Acceptable for emergency condition only*
l Primary mission
accomplished
Yes Yes Yes
7 8 9
Unacceptable even for emergency condition* Unacceptable - dangerous Unacceptable - uncontrollable
Yes Doubtful Doubtful
No No No
Can be landed
Yes Yes Yes
Yes Yes Yes
Doubtful No No
I Catastrophic 10 ] Motions possibly violent enough to prevent pilot escape No ! No
I !
*Failure of autostabilizer.

~L~ ̧
?
!,
. z . , . . ~ . ~
FIG. 1. The Short S.C.1.

,,, 2 9 - 8 ' (APPX.) ~.l
~- ~ I ': J~I~ ,gF MAIN ulc . IDATuH
STATIC GROUND LINE ~ ' - ,_ . . . . . . a E ~ L - - ~ - - ' - _ , I oF M A ~ u/C; I
~.~,'2,,~ ,~E~L~ ~o~ , ~ ~ ,
OF NOZZLE
P
r-
il "51 I
~3 "5'
0o
oF NOZZLE
FIG. 2. General arrangement of the S.C.1.

I • . ?.~ .y.'
t4 :'-~,. / "~
°
FIG. 3. Sectional drawing of the S.C.1.

I-J
t NON-AUTO RATE- AUTO FULL- AUTO
COUPLED TO ~ - - . ST I CV.. :~
ST I CV-.
f f J f / J / / f / / / / / / f / / / / / / / / f J J / / J ~
m
ALL PARTS WITHIN THiS AREA, FORMING THE ELECTRICALLY 51C~NALLED CONTROL
! /SYSTEM AND AUTOSTABILIZER. ~ ARE [~ T R I P L E X .
t x \ K DEMANDED CONTROL ~ /
~Y~R0 I - ~ ~ f TPL~~O - I SE~RV0 K L ~ I "P°SITION' ~D~J~ = 1~SE:~R ~ : ; ~ L--X--~--X----X-- --~ ~ l ~ R A T E FEEDBAC COMMON OUTPUT > SHAFT F'ROM
i I \ l + ' [ p / / ISERv0 POSITION FEEDBACK I ' TRIPLEX SERVO- M O T O R . ,{ CONTROL NOZZLE.
~o = AS ~ DIRECT . . . . ~- 6o = AS -- F,O NOZZLE STABILIZED --- So = AS - B~) -C ~ TP ) e FULLY STABILIZED --)<--> f%-~p
CHANGE- OVER POWER 5ERVO IN MECHANISM ELEVATOR CIRCUIT ONLY
\ ,, \ x/2 ' /
\ x CONTROL SURF'ACE \ / / \ / x \
FIG. 4. Diagramatic representation of control and autostabilizer system.

bO C~
,STICK I / DI ~PLACEHENT V
I t I I I ~ ~t 4
RATE OF CHANGE
Off ATTITUOE.
NON-AUTO / I I
I
I /
0 I 2 3 4-
RATE-- AUTO.
FULL- AUTO,
ATTITUDE
FIG. 5.
NON-AUTO. ,'RATE-AUT0 ~ ' l , ~UL_-- / . / - - ~ ~ j A :o .
/ /
i /J I /
J I I ~ I t 2 5 ,4-
Theoretical responses to a ramp control input.
('a) IN ROLL AT 2 C.P.S.
t_l SECOND j I I
(b) IN YAW AT IC.P.S.
~ NOZZLE
RATE
,.STICK
I SECOND J 1
(C) IN PITCH AT O-5 C.RS. SHOWING 'LUMPINESS" IN PILOT'S INPUT.
FIG. 6. Typical responses to oscillatory control inputs.
bO ~D
FWD. N O ~ 7 . L E RATE '
~ / ~ ~ STICK -MID ~ L " ~ RATE
"0 / ~ - - ATTITUDE : . / ~ ~ NOZZLE
~ i , 5ECOND -i
(a) STEPS IN NOZZLE POSITION TO MEASURE CONTROL POWER (PITCH AXIS)
ATE STICK. FWD. "'1!=,; "+ '?-O~/SEC" F ~ ~ RATE
-MID " 0 _ NOZZLE ~, - ATTITUDE
-~ACK ._ao*/s~jJ__ s'r,cK (b) STEPS IN STICK POSITION TO MEASURE
ARTIFICIAL DAMPING (PITCH AXIS) RATE --t- .?..O~/SEC.
.5,TICK - kl~ F't
- M i D " 0
- -?_O°/SEC.
(c) UNEXPLAINED
I I
' ~ RATE
NOZZLE L ~ ATTITUDE
OSCILLATION IN RATE OF ROLL
C O N T R O L P O W E R : 64~/,.,~EC P- FOI~ FULL NOZZLE Tt~AV EL
/
0 10 20 0
7 ./
÷ 8 0
ACCE.LERA'T'ION
+40 ¢ ~
- 2 0
i i i i i i , ,
(~o 7 0 8 o 90 I o o
FWO. NOZZLE OPENIN~ (%)
- 4 0
- 6 0
- 8 0
FIG. 7. Typical responses to steps in control. FIG. 8. Acceleration in pitch vs . nozzle opening.

I I 1 I
CONTROL PO~NFR : 75* /SEC P- FOR FIJLL NOZZLE TRAVEL.
I l I : 0 iO P_O 30 40
e
T + 80
ACCELErATiON
i mLL /
+ 6 0 o /
. 7 l i e •
'+ 40 li ® /
/ 1 I I I I 60 70 80 90 lOO
PORT NOZZLE OPENING (%)
- P - O
- 4 0
-FaO
- 8 0
CONTr~!OL PO~/ER : 18,5°15EC 2 FOR FULL NOZ'-'LE TRAVEL.
3 1 . 5 3 0 P.O I0 q
L
-+30
ACCELERATION IN YAW (L*/SEC ~)
.+~0
RIGHT NOZZLE AN~LE
-IO
. - 2 0
. - 3 0
FIG. 9. A c c e l e r a t i o n in ro l l vs . nozz l e open ing . FIG. 10. A c c e l e r a t i o n in y a w v s . n o z z l e angle .

+ 2 0
STEADY RATE / OF PITCH C°IsEc.)
• +I5 I f @ ~'S EC. FOR FULL STICK.
-+10
/ ~ r l °/SEC. FOR • 5 ® ~ FULL STICK.
I I , I I !°0 I 1~..5 ° I~.S ° I0 ° 5 • 5 °
FORWARD BACK STICK POSITi0H
- 5
I I ® NOMINAL MAX. STEADY RATE 21 °/SEC-
® ' - I 0 • NOMINAL MAX-STEAD"( RATE II °/$EC.
--15
¢ - 2 0
iO ° LE~"I"
B* 6 ° 4 "
® ®
+~0
STEAI~Y RATE OF ROLL (=/S ¢C)
"+15 19/sEe. ~o¢~ FULL S T I C K .
"PtO ®
i I ' /SEC. F'OI~ ~'ULL ¢~'I't Cl<.
- 5
8. = 4. ~ I~|GHT
STICK ~O~l=rlON
® NOMINAL MAX. s T E A D V RATE 2.1°/~EC. - IO
• NOMINAL MAX. S T E A D Y RATE,. II°/SEC.
~J5
- 2 0
FIG. 11. Steady rate of pitch vs . stick position. FIG. 12. Steady rate of roll vs . stick position.
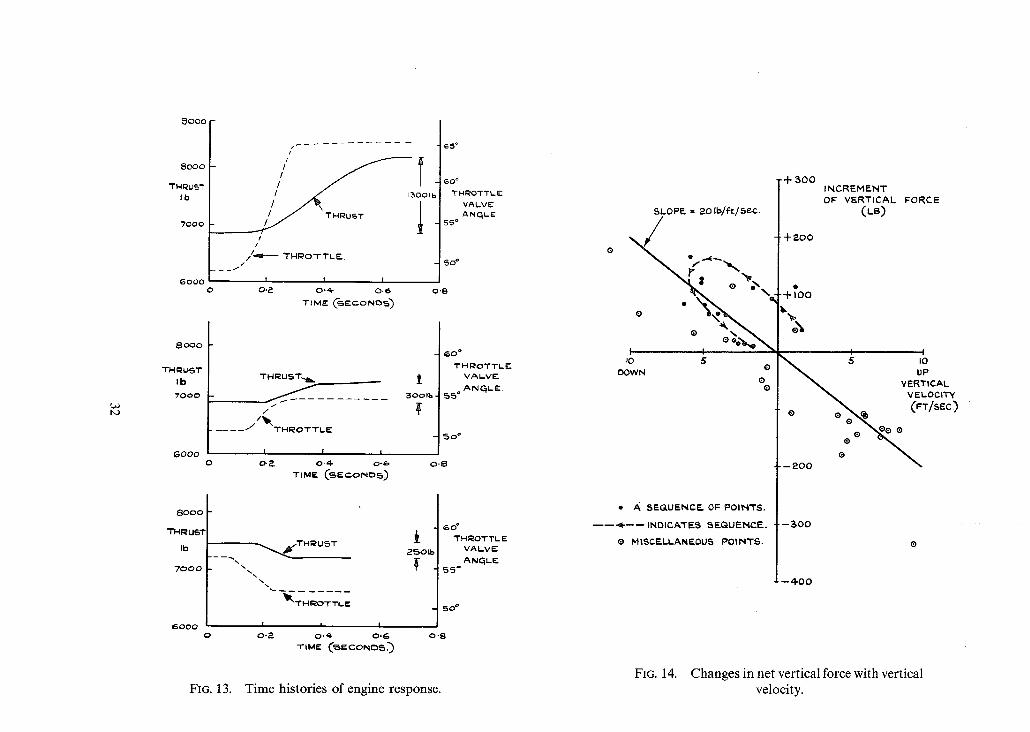
L~J h.J
5 O O O
8OOO
THRus'r I b
70OO
GOOO
II// ~ I /I ~ i~,oo,
_ . ~ ~ / / " TI-4RUST i
/ /
//-ql------ T~-I~OT TL E.. /
1 1 1 O O-2 O'~- 0 - 6
T I M = C~ECON~)
~ 5 °
8000
THRU.S? Jb 7 0 0 0
GOOo
THRUST..~, __ ~_
~ 3 o o i b
. . . . ~ / T H I ~ O T T L . E
O I I i
0-?_ 0-4- o-(=, TIME CSECOND5)
60 ° TNROTT~E
VALVE ANqLE
55 °
8 o o o
TH~us~r
Ib
70o0
~' I "HI~OTTLE
~ o o o I ! I o o - ~ o .4 - o . ~
T,ME (~E CON~.')
i 25ol t
5 o ~
0 - 8
FIG. 13. Time histories of engine response.
O-8
6 0 =
THROTTLE VAL-VE
$5o A N G L E
~o °
6o" THROTTLE
VALVE ANCiLE
55 °
o - S
SLOPE = 20 Ib./,Ft/5¢c...
~ 0 5 e DOWN
0 e
.+ 500
+200
@
-t- i o o
INCREMENT oF V~-RT,CAL F0~CE
I I 5 10
--200 ®
e ,~ 5EG, UENCF_ OF POINTS.
- - - - . .< - - - - - INDICATES ,%F__QU~PiCE..
® M|$CF..LLANEOU,% POll,ITS.
I I ~ 0 0
- - 4 - 0 0
FIG. 14. Changes in net vertical force with vertical velocity.

THIE:)TTL l / " - PO,~ITION. ~ " -•.13 @UNALENT
I00 Ib HANGE OF
THRUST
VEI~TI CAL ACCELERATION
(s)
I.Ot
1 . 0 0 -
0 ' 9 9 /
0 98 A /o 0 "9"7-
~_ _ 0___/ X \ ®
- 0
CHANGE. OF - I 00 VEP~TICAL
FORCE FE~OM HOVER
®
- - 3 0 0
50
40
N E.IGHT 30
2O
I 0 UNDEI~CAI~ RI A EC--j._.~I . NE~GNT 0
0
- VELOCITY -- " ----\X:
I I I I I I I I I I I I I I 5
0
- I
-8 V EI~TICAL VELOCITY
- 3 ['FTI.mF_C')
-4
-S IO 15
FIG. 15. Time history of a landing showing changes in vertical forces near the ground.
33

~ J
I'- b- <
u
FORWARD PITCH NOZZLE
0PENIN~ (O/o) O E
O E v U f- Is}
6O
FORWARD THRUST COMPONENT PROVIDED BY :- • A T T I T U D E C H A N t i E S ONLY. ®PROPULSION EN~INF-. ONLY,
50
40
30
2O
I0
0 - 4 0
NEUTRAL
@
• / , . J ( g ~ ° /
@@0 ~ @
• ~ e " ~ . e e
® ®
0
®
®
1
"~0 I I l I
0 +~o +40 +60 TRUE AIR SPEED ( K N O T S )
®
Q
I + 8 0
I
+ I00
FIG. 16. Pitch nozzle opening required to trim v s . air speed.

, . • • . . • _
I.?_.
0 ' 8
C)AMPIN~ 5EC -I
0'4
0
P I T C H . T
P,LOT RAT, N ~ ( P @ ; ~ I .. | t ! I " / I f
" 4 J
U N 5 A'I'I 5 F'A ET0 R~I'./,. 5ATISF'A(:TONY /
t
O
I J
I 1 1
O 4 O,8 CONTROL POWER R A O / S " : , z
I'?-
DAMPINq 5EC- i
4
DAMPING @EC -I
Q , 4 R O L L .
I " f
3 r 5 ." .SAT,5 5
/ " -ABLE. t/ -F'ACTORY.//
J J
(:3 0
5ATI 5 FACTOR Y.
<3,1
I " /
." I I 5 / i "
/ , / / / :3 I I
I g
CONTROL POWER I I IAD/SEc P',
f
T S I - Y A W . I " J
PR= 66 | / t 5AWl 5 F'ACTORY. %x, *5
/ 4 ~ -" / U N S A T I S / . . _ _ /
L I N A C C E . p T / / . . . . . . . I " 1 ' ~ : ~ 2 - - A B L E . , / ~ i - P , , ~ / u ~ 1,
I / I t " i
0 0,4 0,8
CONTROL POWER RAO/SEC 2.
E) -- 5.C.I 11'4 O A M P I N G SET'T ' IN~ I.
X = s.c.I. UNSTABIL IZED.
T : P ll~_7 I I UNSTA~IL. IZED.
3
1,2
FIG. 17. S.C.1 results c o m p a r e d with con t ro l power and d a m p i n g bounda r i e s f rom Ref. 7 and with P.1127.
Printed in Wales for Her Maiesty's Stationery Office by Aliens Printers tWales) Limited
Dd. 135646 K 5

R. & M. No. 3584
c Crown copyright 1969
Published by HER MAJESTY'S STATIONERY OFFICE
To be purchased from 49 High Holborn, London w.c.1
13A Castle Street, Edinburgh 2 109 St. Mary Street, Cardiffcvl 1JW
Brazennose Street, Manchester M60 8AS 50 Fairfax Street, Bristol BS 1 3DE 258 Broad Street, Birmingham I
7 Linenhall Street, Belfast BT2 8AY or through any bookseller
R. & M. No. 3584
S.O. Code No. 23-3584