vector fluid: a vector graphics depiction of...
TRANSCRIPT

Vector Fluid: A Vector Graphics Depiction of Surface Flow
Ryoichi Ando∗
Graduate School of Design
Kyushu University
Reiji Tsuruno†
Faculty of Design
Kyushu University.
Figure 1: Vector graphics depicted fluid: These figures were generated interactively using our prototype and they can be described in termsof spline curves. Zoom in with your PDF viewer to see how our vector fluid preserves very high levels of detail.
Abstract
We present a simple technique for creating fluid silhouettes de-scribed with vector graphics, which we call ”Vector Fluid.” In oursystem, a solid region in the fluid is represented as a closed contourand advected by fluid flow to form a curly and clear shape similarto marbling or sumi-nagashi (See Figure 1). The fundamental prin-ciple behind our method is that contours of solid regions shouldnot collide. This means that if the initial shape of the region is aconcave polygon, that shape should maintain its topology so thatit can be rendered as a regular concave polygon, no matter how ir-regularly the contour is distorted by advection. In contrast to othertechniques, our approach explicitly neglects topology changes totrack surfaces in a trade off of computational cost and complexity.We also introduce an adaptive contour sampling technique to reducethis extra cost. We explore specific examples in 2D for art orientedusage and show applications and robustness of our method to ex-hibit organic fluid components. We also demonstrate how to portour entire algorithm onto a GPU to boost interactive performancefor complex scenes.
CR Categories: I.3.5 [Computational Geometry and Object Mod-eling]: Curve, surface, solid, and object representations— [I.3.3]:Picture/Image Generation—Line and curve generation
Keywords: Non-photorealistic rendering,vector graphics,surfaceflow,marbling
∗
†
1 Introduction
For more than a decade in the graphics community, the depictionof fluids has been mainly focused on capturing realistic behavior.Thanks to the considerable contribution of seminal studies, we nowhave extensive knowledge about how to achieve the photorealisticrendering of fluids. On the other hand, although some approaches tothe artistic rendering of fluid have been proposed, it seems that Non-Photorealistic Rendering (NPR) of fluids has not been researchedintensively and techniques for rendering fluids using vector graph-ics still remain untouched. In this paper, we specifically explore artoriented depictions of 2D surface flow similar to marbling or sumi-nagashi, using vector graphics. In order to achieve vector graphicsrendering, we have to track solid regions in the fluid. However, tra-ditional methods which address complex topological changes areoften too dissipative, blobby or complex to capture clear and de-tailed silhouettes.
Instead, we adopt the principle that no parts of contours shouldcollide by advection so that the topology of a region should notchange, because the streaklines of fluid do not collide. Such solidregions may merge or split when they get very close, which doesinvolve topological changes; despite exhausive efforts, such topo-logical changes are still daunting to track precisely. In the contextof surface detail preservation, a state-of-the-art topological changesalgorithm also acts as a filter, which smoothes out surface detail. Inour approach, we explicitly neglect topological changes to simplifythe problem. We consider this to be a computational trade off. Ig-noring topological events enables us to obtain detailed features andsimplifies the algorithm, at the expense of considerable extra com-putational cost. Fortunately, we found that the cost in two dimen-sions was not so extreme as to monopolize the CPU. In fact, everyfigure shown in this paper was created interactively. In our model,a solid region is represented with explicit closed form contours sothat rendering or export of the region into vector graphical form isdone simply by plotting sequential contour vertices as a concavepolygon.
The main drawback of our approach is that the computational costrises quickly as the shape becomes complex due to the sharp propa-gation of vertices to track. Additionally, discretized contour rep-resentation causes collisions around adjacent contours. In order

to deal with these disadvantages, we introduce a simple techniqueto change the discretization space of contour vertices adaptively,which we call “Adaptive Refinement.” We further introduce amethod to implement the entire algorithm on a GPU to achieve suf-ficient performance to make real-time interaction with the simula-tion feasible.
The key components of our algorithm are listed as follows: (a) Ig-norance of topological changes; since streaklines of fluid never col-lide, contours of the fluid flow never collide either. This leads to theidea that the topology of the solid region should not change no mat-ter how irregularly shapes are distorted by advection. (b) AdaptiveRefinement: if we let vertices propagate without bounds, the com-putational cost rises sharply as complexity increases. We suppressthis propagation by controlling sampling spaces in the local envi-ronment. (c) Shapes are depicted with vector graphics; the closedform contours of solid regions are treated as regular concave poly-gons. By just plotting a sequence of vertices, the whole shape canbe directly translated into vector graphics format.
2 Previous work
Our work is related to studies in two categories: artistic expres-sion of fluids and surface tracking methods. The most relevantwork is that of [Acar and Boulanger 2006] which was intended toreproduce the visual effects of marbling flow using a physically de-rived flow model. They observed surface flow based on mesoscaledynamics and produced effects of fluctuations at different scales.In order to advect clear silhouettes under Eulerian grids, they em-ployed b-spline interpolation and extended the range of concentra-tion temporarily in the semi-Lagrangian advection phase. Euleriangrid approximation is limited in terms of the degree of resolution,if we wish to obtain a reasonable simulation. If we simulate withhigh resolution, it requires a great deal of per-pixel computation andmemory.
Eden [Eden et al. 2007] proposed a method for rendering liquidsin a cartoon-style manner. Exploiting a physically created fluidsurface, they rendered it by emphasizing properties of the liquid’sshape and motion, inspired by the abstraction and simplification ofcartoon animations. This method resembles our own in that bothhave clear silhouettes and very few colors. However, they usedan implicit contouring method as an underlying liquid animation;hence thin line detail is inherently smoothed out before it is styl-ized.
Selle et al. [Selle et al. 2004] introduced a technique for gener-ating cartoon-style animations of smoke. Based on a physically-based simulated output, they traced marker particles and renderedthem using depth buffer differences to generate clear smoke ani-mations. McGuire et al. [McGuire and Fein 2006] extended thistechnique and developed a system for rendering real-time anima-tions of smoke, in addition to introducing a novel self-shadowingalgorithm. However, these methods cannot track precise thin lineswith the level of detail seen in marbling-like fluid flow since eachparticle (primitive) is visibly large.
Witting [Witting 1999] presented a system that uses computationalfluid dynamics to produce two-dimensional animated films. Theyemployed a compressive fluid dynamics and restricted it to two di-mensions to develop user controllable fluid experiences. The workpresented in this paper shares his motivation in that both offer artistsfluid environments for design purposes; we focus particularly on avector graphics format.
Our work is also comparable with surface tracking techniques usedin physically derived liquid animations. This topic has a long his-torical background; here, we briefly review those works since they
mainly focus on a well-designed topological changes algorithm,which is orthogonal to our approach. Roughly, a free surface istracked using three approaches: Eulerian grids, Lagrangian parti-cles and explicit surfaces.
Among Eulerian approaches, Hirt [Hirt and Nichols 1981] pro-posed a volume-of-fluid method that constructs an approximationof the interface from cells which contain portions of the interface.Osher [Osher and Sethian 1988] proposed a level set method whichhas become dominant in industrial applications. In the level setmethod, a signed distance function φ from the interface is advectedand the surface is implicitly located where φ = 0. The advantageof these two Eulerian based approaches is that they do not require aspecial post-process to handle topological changes. However, theydo suffer from numerical diffusion or loss of mass conservation[Enright et al. 2005].
Among Lagrangian methods, Enright [Enright et al. 2002] ex-tended the level set method with Lagrangian particles and in-creased accuracy. Harlow [Harlow and Welch 1965] advected par-ticles in marker-and-cell grids to identify deforming surfaces.Muller, Harada [Muller et al. 2003; Harada et al. 2007] incorpo-rated Smoothed Particle Hydrodynamics (SPH) and applied it tovisual simulations. These methods introduced blobby or splittingartifacts for thin details.
Meanwhile, a number of explicit front tracking meth-ods have been proposed, both for computational dynamics[Glimm et al. 1998; Brochu and Bridson 2009; Wojtan et al. 2009;Muller 2009; Tryggvason et al. 2001] and for image processing[Kass et al. 1988; McInerney and Terzopoulos 2000]. In fronttracking methods, a surface interface is constructed with explicitsurface elements and advected by the underlying motion. The fronttracking method offers a precise representation of the interface freefrom grid resolution or numerical diffusion; however, it suffersfrom self-intersections or complexity. They detected topologicalchanges by uniform grid traps or by searching close edges. Itturns out to be challenging to do this without losing surface detail.Except for the fact that they tackle complex topological changes,their method is comparable to ours. Since we eliminate topologicalchanges, we instead suffer from a huge computational cost.
3 Method
Before we discuss the concrete algorithm, let us first briefly out-line the overall workflow in Figure 2. To depict vector graph-ics, we first place closed contours in a fluid flow and then ad-vect them along the fluid flow. Rendering of the solid region isperformed in just the same way as rendering a regular concavepolygon. Since particle-based advection preserves accurate massconservation, [Enright et al. 2002; Puckett et al. 1997] we paint re-gions with plain colors.
Figure 2: Workflow of our method: We first place closed contoursof a painted region in the fluid field, then advect or stretch themalong the fluid flow. The rendering of the region is done just as aconcave polygon is rendered.

3.1 Contour Advection
In order to advect contours, we must generate the underlying fluidmotion. For simplicity, we used the finite differential grid and semi-Lagrangian advection method to generate the fluid velocity field.Once we have fluid flow, we can place closed contours on the sur-face of water and advect them. In our system, we represent con-tours as a sequence of discrete points connected to each other andadvect them in the Lagrangian manner. For a numerical method,it is inevitable that advection causes collisions; to prevent signifi-cant collisions, we employed a fourth order accuracy Runge-Kuttascheme. We denote this scheme as
vt+∆t = φ(∆t, vt, ut). (1)
where vt , u
t and φ denote the position of the contour vertex, thevelocity of the fluid field and the Runge-Kutta scheme at time t,respectively. After all vertices have been advected (t ← t + ∆t),we measure the distances between connected vertices and if thisdistance exceeds a threshold d, we insert a new vertex vnew midwaybetween the relevant pair of vertices at the previous time step andadvect it such that
vnew = φ(
∆t,1
2(vt−∆t
0 + vt−∆t
1 ), ut−∆t
)
(2)
where v0 and v1 denote the positions of each vertex in the pair. Thistime rewinding method helps position subdivided vertices more ac-curately than would linear subdivision with rapid advection. Theeffect may be slight; however, it also helps to reduce faceted edgesor collisions, which allows us take larger time steps. On the con-trary, if the distance is less than d/2 we collapse the vertex. Thisprocess is repeated until all connected vertices lie between d andd/2 apart.
3.2 Rendering and Export
To export the region as a vector graphic, we write the shape as a reg-ular concave polygon. Starting from an arbitrary vertex, we move tothe next connected vertex and write its position in sequence. Ren-dering of the concave polygon is performed efficiently by the sten-cil method [Woo et al. 1997]; for every pair of connected contourpoints (p, q), we draw a triangle polygon (0, p, q) onto a frame-buffer while inverting the existing values between 0 and 1. Finally,the solid region is filled with value 1.
3.3 Adaptive Refinement
With the aforementioned steps we may be able to create a vectorfluid silhouette, however, implementation of this method can easilyresult in excessive computation due to rapidly increasing propaga-tion of vertices over time. In this section, we introduce an “AdaptiveRefinement” method to suppress this propagation.
From our observations, we found that we could omit vertices wherethe contour is not curved strongly, whereas where the contour istightly curved or the fluid is eddying we needed to insert morepoints. Hence, we tuned the distance threshold d; we controlledit by taking its product with the local curvature ccurvature
i and theturbulence cturbulence
i , thus:
di = dmaxccurvaturei cturbulence
i + ε (3)
where dmax denotes the maximum space between vertices. Thevalue ε is a limit constant to avoid 0. To determine the local curva-ture, we employed a normalized second derivative:
ccurvaturei = exp(−|κ|), (4)
Figure 3: Adaptive Refinement: Small diamond marks representvertices to track. Notice that the space of vertices is sensitive to thecurvature. In order to avoid collisions, more vertices are insertedwhere contours are highly curved.
where κ denotes the finite differential curvature value. For localturbulence, we considered local vorticity:
cturbulencei = exp(−|∇ × u(vi)|), (5)
where vi is the position of i th vertex on a contour, u(vi) denotesthe velocity of the fluid at position vi. Using such an adaptive d,we can unnoticeably remove a large fraction of the vertices whileincreasing the quality where contours have high curvature or turbu-lence. Notice that both ccurvature
i and cturbulencei range between 0
and 1. This strategy works well for most cases, although when dis sufficiently large it often fails to capture small perturbations ofthe fluid flow. To compensate for this drawback, we additionallydiffused di along the contour. After we calculated each di value atvi we iteratively assigned to di a value as follows:
di ←
w∑
n=−w
G(α, n)di+n, (6)
where w and G(α, x) denote the window radius and a gaussianfunction, respectively. Typically, w = kd−1
max. By diffusing di,rapid agitation around vertices triggers its neighbors to have a smalldi value; therefore, such rapid motion is well captured by the neigh-boring vertices. We illustrate the effect of Adaptive Refinement inFigure 3.
The Adaptive Refinement technique prevents large numbers of un-necessary vertices from being inserted; however it still produces in-tersections around thin or adjacent regions. Fortunately, we foundthat slight collisions of contours do not contribute to significantvisual artifacts, however, for the purpose of generating high DPIimages such as big posters, one may want to remove collisions as
much as possible. In such cases, we add a proximity term cproximityi
in equation (3) as
cproximityi
= 1− exp(−dproximityi
), (7)
where dproximityi
denotes the distance function from the nearest op-posite contour. This magnifies contour subdivision; instead, gener-ated collisions are minimized. For such a thin line, one may justsplit it during the simulation, however, thin lines are important vi-sual keys for detailed silhouettes so we let them grow as it proceeds.
3.4 GPU Acceleration
Although our algorithm runs at an interactive rate on a CPU, itis limited to only around 40,000 vertices (10FPS). In this sectionwe introduce a GPU accelerated algorithm to boost realtime per-formance. Similarly to particle markers, contours can be tracked

with a collection of particles except that in our model the numberof particles varies and explicit connection information is dynami-cally reconstructed. The straightforward approach may be to storeeach initial vertex into individual kernels and watch them propa-gate, although computational cost varies among kernels since con-tour growth is uneven, which results in a slowdown. To disperse thecomputation evenly we introduce a method for task diffusion.
Our GPU acceleration strategy consists of the following three steps:(i) contour advection (ii) contour subdivision (iii) task diffusion. Inour system, each vertex has information about its position and a ref-erence to the next connected vertex. We refer to this kind of vertexas a “task.” On a GPU, a contour is decomposed into a collectionof tasks, each one referring to the next task; tasks are then storedin separate kernels. Device memory storage is pre-allocated andmapped onto kernels.
In the advection phase, positions of tasks stored in each kernel areadvected as in section 3.1 in parallel. In the contour subdivisionphase, each kernel probes every stored task for its distance fromthe referenced task, and then subdivides or collapses it if necessary,as also described in section 3.1,3.3. Inserted vertices are storedinto the kernel of the originating task. In this phase, numbers oftasks stored in kernels become uneven. In the task diffusion phase,we choose random pairs of kernels and compare their numbers ofstored tasks. In the case that the opposite kernel holds a smallernumber of tasks, we move tasks into the opposite kernel. Forconsistency, we choose a pair (kerneli, kernel(i+r)mod n), wherekerneli denotes the i th kernel, r is a shared random integer andn is the number of kernels. We avoid conflict by letting i be evenand r be odd. This task diffusion phase averages out the numbersof tasks among kernels, which disperses advection and subdivisioncost evenly.
To evaluate equation (7) vertex indices are sorted into uniform gridsas described in [Grand 2007] and we constrain searches withinneighboring grids. Solid regions are rendered using the stencilmethod by randomly writing task polygons (0, p, preference) intoa vertex array where p denotes the position of a task and preference
the position of the referenced task. Empty slots are filled with nullpolygons. In our case the whole procedure including a descriptionof the underlying fluid was ported using CUDA.
4 Results
Comparison with competing methods is shown in Figure 4. Theparticle level-set result was generated with an existing library[Mokberi and Faloutsos ]. Eulerian advection was generated witha semi-Lagrangian advection scheme. Clear edges were enforcedusing the concentration transformation function introduced by Acar[Acar and Boulanger 2006]. Front tracking methods were omittedsince they behave similarly to ours if topological change is skipped.All of those results were computed for shared fluid motion. Ourcomputation took 7 seconds while others took more than ten min-utes for a 1600x1600 grid. The thin line property was well main-tained with our method whereas the particle level-set method brokethin lines and Eulerian advection filtered them out even at high res-olution. The performance with a single threaded CPU and GPUis illustrated in Figure 5(a). Our implementation on a GPU runsseveral times faster than that on a CPU for a complex scene. Notethat the performance of the GPU depends on the size of the pre-allocated GPU memory because the entire memory space is sentinto the rendering pipeline. The maximum size of this example wasaround 100,000 vertices.
On the other hand, Figure 5(a,b) also reveals two critical limitationsof our method. Firstly, a tractable number of time steps is limitedto around a few thousand (but this number depends heavily on the
environment), which can be easily reached. Secondly, contours areinteractively tracked up to around 100,000 vertices. Despite theselimitations, we found that our method is quite practical and effectivefor creating organic fluid components.
Figure 4: Competing methods for a shared fluid field; the particlelevel-set method breaks thin lines and Eulerian advection filters outdetails whereas our method retains detailed features.
Figure 5: Performance of our method with Adaptive Refinement(a): At 10,0000 vertices the CPU recorded 4 FPS while the GPUrecorded 17 FPS. (b) Vertex propagation in time; there is a limit onthe number of time steps that can be interactively simulated due tothe sharp increase in the number of vertices.
5 Applications
We built an interactive prototype both on an Intel Core i7 2.8GHzand a GeForce 285GTX running Linux. The underlying fluid wascomputed with a 64×64 grid resolution. With our prototype, usersare allowed to drop pigments on the surface of water and disturbit simply by mouse dragging. In this section we introduce someinteresting applications and explore the potential of our method.
5.1 Marbling and Sumi-nagashi
Figure 6 shows an example of a complex vector fluid generated byour method. When creating this silhouette, artists experienced re-sponsive interactions just as in real marbling. As can be seen fromthe figure, our method is powerful enough to design stylish curlyshapes similar to marbling or sumi-nagashi. The particular charac-teristic of our vector fluid method is that such closed contours aredirectly translatable into vector based programs. Figure 7 showsan example of a shape imported to Adobe illustrator and Adobe
FLASH. Since our vector fluid is wholly described in vector graph-ics, artists are allowed to print it with limitless high resolution.
Figure 6: Complex marbling-like silhouette: This vector fluid wascreated with our GPU prototype and during the simulation, render-ing and interaction were responsive.
Figure 7: Shape imported into Adobe illustrator and AdobeFLASH: Our vector fluid can be directly exported into a vectorbased program without losing detail.
5.2 Shape Designing Tool
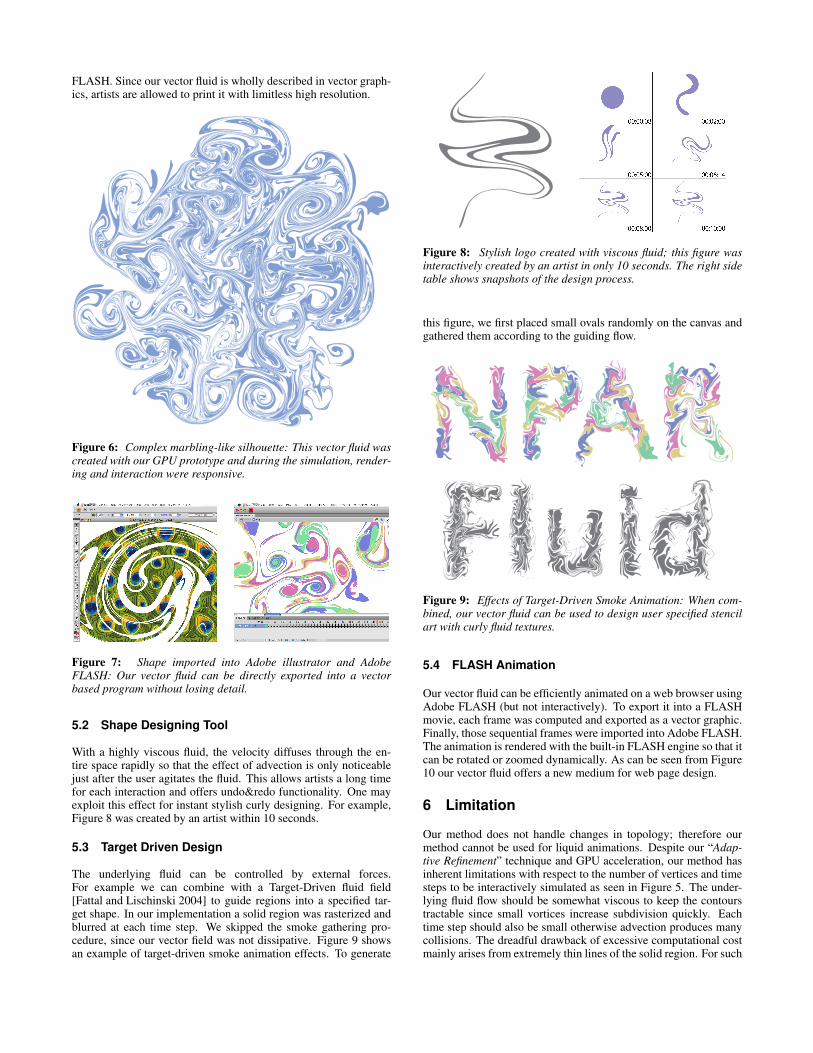
With a highly viscous fluid, the velocity diffuses through the en-tire space rapidly so that the effect of advection is only noticeablejust after the user agitates the fluid. This allows artists a long timefor each interaction and offers undo&redo functionality. One mayexploit this effect for instant stylish curly designing. For example,Figure 8 was created by an artist within 10 seconds.
5.3 Target Driven Design
The underlying fluid can be controlled by external forces.For example we can combine with a Target-Driven fluid field[Fattal and Lischinski 2004] to guide regions into a specified tar-get shape. In our implementation a solid region was rasterized andblurred at each time step. We skipped the smoke gathering pro-cedure, since our vector field was not dissipative. Figure 9 showsan example of target-driven smoke animation effects. To generate
Figure 8: Stylish logo created with viscous fluid; this figure wasinteractively created by an artist in only 10 seconds. The right sidetable shows snapshots of the design process.
this figure, we first placed small ovals randomly on the canvas andgathered them according to the guiding flow.
Figure 9: Effects of Target-Driven Smoke Animation: When com-bined, our vector fluid can be used to design user specified stencilart with curly fluid textures.
5.4 FLASH Animation
Our vector fluid can be efficiently animated on a web browser usingAdobe FLASH (but not interactively). To export it into a FLASHmovie, each frame was computed and exported as a vector graphic.Finally, those sequential frames were imported into Adobe FLASH.The animation is rendered with the built-in FLASH engine so that itcan be rotated or zoomed dynamically. As can be seen from Figure10 our vector fluid offers a new medium for web page design.
6 Limitation
Our method does not handle changes in topology; therefore ourmethod cannot be used for liquid animations. Despite our “Adap-tive Refinement” technique and GPU acceleration, our method hasinherent limitations with respect to the number of vertices and timesteps to be interactively simulated as seen in Figure 5. The under-lying fluid flow should be somewhat viscous to keep the contourstractable since small vortices increase subdivision quickly. Eachtime step should also be small otherwise advection produces manycollisions. The dreadful drawback of excessive computational costmainly arises from extremely thin lines of the solid region. For such

lines we are planning to employ an alternative simplified approxi-mation, such as explicit lines with width.
Figure 10: Vector fluid animated in a web browser using the built-in FLASH renderer. To animate in FLASH, a sequence of vectorgraphics frames was precomputed and stitched.
7 Discussion
We believe that the realtime interaction and the aesthetics of ren-dered silhouettes are the most impressive part of our method. Tradi-tional approaches to fluid dynamics in computer graphics based onEulerian grids or Lagrangian particles suffer from numerical diffu-sion or blobby artifacts when they are applied to generate clear sil-houettes of surface flow. It may be possible to achieve our goal byemploying state-of-the-art front tracking methods, but our methodis greatly simplified and specifically tuned to produce reasonableresults. The GPU acceleration and the fast rendering technique pre-sented in this paper are only feasible within two dimensions. Theoverall idea may be conceptually extendable to three dimensions;however, it is not practically feasible.
8 Conclusion
In this paper, we have presented the simple idea of vector fluid andgiven a detailed explanation of the proposed method. The under-lying principle of our method is that the topology of any concavepolygon should not change by advection because streaklines of fluidfield do not collide. Based on this consideration, we developeda simple front-tracking algorithm and introduced an adaptive re-finement method to reduce subdivision cost. We further ported theentire algorithm onto a GPU and succeeded in achieving realtimeperformance. We also showed that our method can be used formarbling design, shape design, flash animation and target-drivendesign. We believe that our method opens up a new opportunityfor vector artists. However, although our prototype is interactive,the running time of our method increases sharply as the contourstretches. In future work, we would like to modify our method toincrease its ability to deal with more complex scenes.
References
ACAR, R., AND BOULANGER, P. 2006. Digital marbling: A multi-scale fluid model. IEEE Transactions on Visualization and Com-puter Graphics 12, 4, 600–614.
BROCHU, T., AND BRIDSON, R. 2009. Robust topological oper-ations for dynamic explicit surfaces. SIAM Journal on ScientificComputing 31, 4, 2472–2493.
EDEN, A. M., BARGTEIL, A. W., GOKTEKIN, T. G., EISINGER,S. B., AND O’BRIEN, J. F. 2007. A method for cartoon-
style rendering of liquid animations. In GI ’07: Proceedingsof Graphics Interface 2007, ACM, New York, NY, USA, 51–55.
ENRIGHT, D., FEDKIW, R., FERZIGER, J., AND MITCHELL, I.2002. A hybrid particle level set method for improved interfacecapturing. J. Comput. Phys 183, 83–116.
ENRIGHT, D., LOSASSO, F., AND FEDKIW, R. 2005. A fastand accurate semi-lagrangian particle level set method. Comput.Struct. 83, 6-7, 479–490.
FATTAL, R., AND LISCHINSKI, D. 2004. Target-driven smokeanimation. In SIGGRAPH ’04: ACM SIGGRAPH 2004 Papers,ACM, New York, NY, USA, 441–448.
GLIMM, J., GROVE, J. W., LI, X. L., SHYUE, K.-M., ZENG, Y.,AND ZHANG, Q. 1998. Three-dimensional front tracking. SIAMJ. Sci. Comput. 19, 3, 703–727.
GRAND, S. L. 2007. GPU Gems 3, Broad-Phase Collision Detec-tion with CUDA. Addison Wesley.
HARADA, T., KOSHIZUKA, S., AND KAWAGUCHI, Y. 2007.Smoothed particle hydrodynamics on gpus. In Proc. of Com-puter Graphics International, 63–70.
HARLOW, F. H., AND WELCH, E. J. 1965. Numerical calculationof time-dependent viscous incompressible flow of fluid with freesurface. Physics of Fluids 8, 12, 2182–2189.
HIRT, C. W., AND NICHOLS, B. D. 1981. Volume of fluid /vof/method for the dynamics of free boundaries. Journal of Compu-tational Physics 39 (January), 201–225.
KASS, M., WITKIN, A., AND TERZOPOULOS, D. 1988. Snakes:Active contour models. International journal of computer vision1, 4, 321–331.
MCGUIRE, M., AND FEIN, A. 2006. Real-time rendering of car-toon smoke and clouds. In NPAR ’06: Proceedings of the 4thinternational symposium on Non-photorealistic animation andrendering, ACM, New York, NY, USA, 21–26.
MCINERNEY, T., AND TERZOPOULOS, D. 2000. T-snakes: Topol-ogy adaptive snakes. Medical Image Analysis 4, 2, 73–91.
MOKBERI, E., AND FALOUTSOS, P. A particle level set library.
MULLER, M., CHARYPAR, D., AND GROSS, M. 2003. Particle-based fluid simulation for interactive applications. In SCA ’03:Proceedings of the 2003 ACM SIGGRAPH/Eurographics sympo-sium on Computer animation, Eurographics Association, Aire-la-Ville, Switzerland, Switzerland, 154–159.
MULLER, M. 2009. Fast and robust tracking of fluid sur-faces. In SCA ’09: Proceedings of the 2009 ACM SIG-GRAPH/Eurographics Symposium on Computer Animation,ACM, New York, NY, USA, 237–245.
OSHER, S., AND SETHIAN, J. A. 1988. Fronts propagatingwith curvature-dependent speed: algorithms based on hamilton-jacobi formulations. J. Comput. Phys. 79, 1, 12–49.
PUCKETT, E. G., ALMGREN, A. S., BELL, J. B., MARCUS,D. L., AND RIDER, W. J. 1997. A high-order projection methodfor tracking fluid interfaces in variable density incompressibleflows. J. Comput. Phys. 130, 2, 269–282.
SELLE, A., MOHR, A., AND CHENNEY, S. 2004. Cartoon render-ing of smoke animations. In NPAR ’04: Proceedings of the 3rdinternational symposium on Non-photorealistic animation andrendering, ACM, New York, NY, USA, 57–60.

TRYGGVASON, G., BUNNER, B., ESMAEELI, A., JURIC, D., AL-RAWAHI, N., TAUBER, W., HAN, J., NAS, S., AND JAN, Y.2001. A front-tracking method for the computations of multi-phase flow. Journal of Computational Physics 169, 2, 708–759.
WITTING, P. 1999. Computational fluid dynamics in a traditionalanimation environment. In SIGGRAPH ’99: Proceedings of the26th annual conference on Computer graphics and interactivetechniques, ACM Press/Addison-Wesley Publishing Co., NewYork, NY, USA, 129–136.
WOJTAN, C., THUREY, N., GROSS, M., AND TURK, G. 2009.Deforming meshes that split and merge. In SIGGRAPH ’09:ACM SIGGRAPH 2009 papers, ACM, New York, NY, USA, 1–10.
WOO, M., NEIDER, J., AND DAVIS, T. 1997. OpenGL program-ming guide (2nd ed.): the official guide to learning OpenGLversion 1.1. Addison-Wesley Longman Publishing Co., Inc.,Boston, MA, USA.