vectran fiber time-dependent behavior and additional
TRANSCRIPT

National Aeronautics and Space Administration
Goddard Space Flight Center Greenbelt, Maryland 20771
December 2004
NASA/TM—2004-212773
Vectran Fiber Time-Dependent Behavior and Additional Static Loading Properties
R.B. FetteM.F. Sovinski

The NASA STI Program Offi ce … in Profi le
Since its founding, NASA has been ded i cat ed to the ad vance ment of aeronautics and space science. The NASA Sci en tifi c and Technical Information (STI) Pro gram Offi ce plays a key part in helping NASA maintain this im por tant role.
The NASA STI Program Offi ce is operated by Langley Re search Center, the lead center for NASA̓ s scientifi c and technical in for ma tion. The NASA STI Program Offi ce pro vides ac cess to the NASA STI Database, the largest col lec tion of aero nau ti cal and space science STI in the world. The Pro gram Offi ce is also NASA̓ s in sti tu tion al mech a nism for dis sem i nat ing the results of its research and de vel op ment ac tiv i ties. These results are published by NASA in the NASA STI Report Series, which includes the following report types:
• TECHNICAL PUBLICATION. Reports of com plet ed research or a major signifi cant phase of research that present the results of NASA pro-grams and include ex ten sive data or the o ret i cal analysis. Includes com pi la tions of sig nifi cant scientifi c and technical data and in for ma tion deemed to be of con tinu ing ref er ence value. NASA̓ s counterpart of peer-re viewed formal pro fes sion al papers but has less stringent lim i ta -tions on manuscript length and ex tent of graphic pre sen ta tions.
• TECHNICAL MEMORANDUM. Scientifi c and tech ni cal fi ndings that are pre lim i nary or of spe cial ized interest, e.g., quick re lease reports, working papers, and bib li og ra phies that contain minimal annotation. Does not contain extensive analysis.
• CONTRACTOR REPORT. Scientifi c and techni-cal fi ndings by NASA-sponsored con trac tors and grantees.
• CONFERENCE PUBLICATION. Collected pa pers from scientifi c and technical conferences, symposia, sem i nars, or other meet ings spon sored or co spon sored by NASA.
• SPECIAL PUBLICATION. Scientifi c, tech ni cal, or historical information from NASA pro grams, projects, and mission, often con cerned with sub-jects having sub stan tial public interest.
• TECHNICAL TRANSLATION. En glish-language trans la tions of foreign sci en tifi c and tech ni cal ma-terial pertinent to NASA̓ s mis sion.
Specialized services that complement the STI Pro-gram Offi ceʼs diverse offerings include cre at ing custom the sau ri, building customized da ta bas es, organizing and pub lish ing research results . . . even pro vid ing videos.
For more information about the NASA STI Pro gram Offi ce, see the following:
• Access the NASA STI Program Home Page at http://www.sti.nasa.gov/STI-homepage.html
• E-mail your question via the Internet to [email protected]
• Fax your question to the NASA Access Help Desk at (301) 621-0134
• Telephone the NASA Access Help Desk at (301) 621-0390
• Write to: NASA Access Help Desk NASA Center for AeroSpace In for ma tion 7121 Standard Drive Hanover, MD 21076–1320

December 2004
Vectran Fiber Time-Dependent Behavior and Additional Static Loading Properties
NASA/TM—2004–212773
Russell B. Fette, Marjorie F. SovinskiGoddard Space Flight Center, Greenbelt, MD

Available from:
NASA Center for AeroSpace Information National Technical Information Service7121 Standard Drive 5285 Port Royal RoadHanover, MD 21076–1320 Springfi eld, VA 22161Price Code: A17 Price Code: A10
Acknowledgments
The authors would like to acknowledge the assistance of those individuals who aided in the preparation of this document. Mr. Michael Viens reviewed the report repeatedly for content and style. The authors
would also like to thank Mr. David Puckett, Mr. Dewey Dove, Mr. Alex Montoya, and Mrs. Debbie Thomas who aided in testing at NASA GSFC.
“The views expressed in this article are those of the authors and do not refl ect the offi cial policy or position of the United States Air Force, Department of Defense, or the U.S. Government.”
i
Table of Contents
Page
Abstract…………………………………………………………………………………... 1
Introduction ………………………………………………………………………….….. 1
Background ……………………………………………………………………………… Creep and Stress Relaxation…………………………………………………………………..
Coefficient of Thermal Expansion (CTE) ….………………………………………………...
1
1
3
Experimental ……………………………………………………………………………..Specimens…………………………………………………………………………………….
Test Methods……………………………………………………………………………….…
Equipment…………………………………………………………………………………….
3
3
4
5
Results ………………………………………………………………………………….… Creep Testing …………….…………………………………………………………………..
Stress Relaxation Testing ….…………………………………………………………………
CTE Testing…………………………………………………………………………………..
Out-gassing……………………………………………………………………………………
5
5
5
7
7
Discussion ………………………………………………………………………………...Creep Testing…………………………………………………………………………………
Stress Relaxation Testing……………………………………………………………………..
Material Construction Effects………………………………………………………………...
CTE Testing…………………………………………………………………………………..
7
7
8
8
8
Conclusions and Recommendations……………………………………………………. 9
References………………………………………………………………………………... 10
Appendix A: Vectran Properties…………………..…………………………………… 11
ii
List of Tables Page
1. Comparison of High Strength Fibers…………………………………………………………... 13
2. Summary of Literature Properties for Vectran and Kevlar 49………………………………..... 14
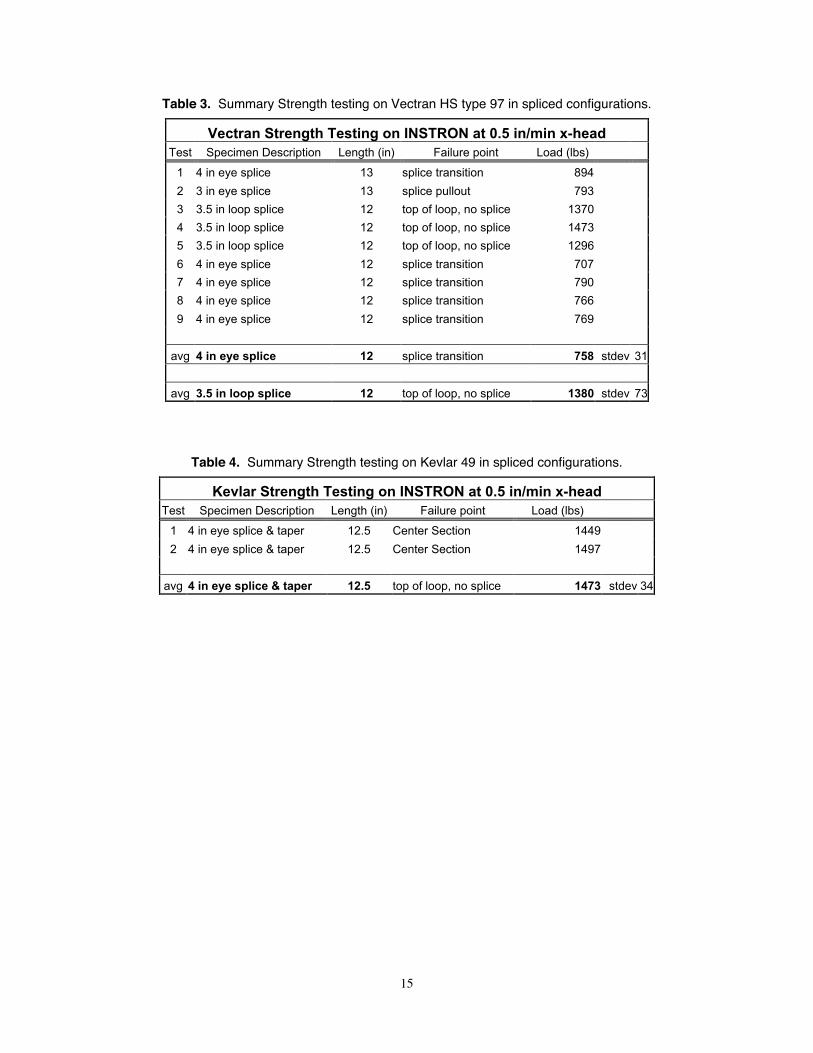
3. Summary Strength testing on Vectran HS type 97 in spliced configurations………………….. 15
4. Summary Strength testing on Kevlar 49 in spliced configurations……………………………. 15
5. Summary of Creep Constants………………………………………………………………….. 5
6. Summary of Relaxation Constants……………………………………………………………... 6
7. Kevlar vs. Vectran Relaxation…………………………………………………………………. 6
8. Out-gassing report…………………………………………………………………………….... 7
9. Creep vs. Stress Relaxation…………………………………………………………………….. 8
List of Figures Page
1. Strain vs. Time Behavior of Creep.……………………………………………………………. 2
2. Specimen Diagram…………………………………………………………………………….. 3
3. Creep Curves.………………………………………………………………………………….. 5
4. Manufacturer’s Creep Data.…………………………………………………………………… 6
5. Vectran Relaxation at NASA GSFC.………………………………………………………….. 6
6. Normalized Vectran Relaxation at NASA GSFC……………………………………………... 6
7. Depiction of Creep Curve with Inflection to Steady State Creep……………………………... 7
8. CTE Plot of Vectran HS.………………………………………………………………………. 9

1
Vectran Fiber Time-Dependent Behavior andAdditional Static Loading Properties
AbstractVectran HS appears from literature and testing to date to be an ideal upgrade from Kevlar braided cordsfor many long-term, static-loading applications such as tie-downs on solar arrays. Vectran is a liquidcrystalline polymer and exhibits excellent tensile properties. The material has been touted as a zero creepproduct. Testing discussed in this report does not support this statement, though the creep is on the orderof four times slower than with similar Kevlar 49 products. Previous work with Kevlar and new analysis ofVectran testing has led to a simple predictive model for Vectran at ambient conditions. The meancoefficient of thermal expansion (negative in this case) is similar to Kevlar 49, but is not linear. A positivetransition in the curve occurs near 100 ºC. Out-gassing tests show that the material performs well withinparameters for most space flight applications. Vectran also offers increased abrasion resistance, minimalmoisture regain, and similar UV degradation. The effects of material construction appear to have adramatic effect in stress relaxation for braided Vectran. To achieve the improved relaxation rate, upgradesmust also examine alternate construction or preconditioning methods. This report recommends VectranHS as a greatly improved replacement material for applications where time-dependent relaxation is amajor factor.
IntroductionThe EOS series launched in recent years usedbury spliced loops of Kevlar braided cord to tiedown the solar arrays during launch. A requisitetension remaining in the loops becameespecially critical during the cutting of the loopswith thermal knives in orbit to deploy the arrays.Previous testing at NASA Goddard Space FlightCenter (GSFC) showed that Kevlar has a highrate of stress relaxation with a wide margin oferror in prediction. Additionally, it hascomplicated environmental response. Similarapplications such as the GLAST Tracker Towerwhich use tensioning cables are also concernedwith break strength, relaxation, Ultra-Violet(UV) degradation, abrasion, and ease oftermination (splice etc…).1
A search was made for a material with betterperformance characteristics than Kevlar, and themost promising was Vectran. See Table 1 inAppendix A for a comparison of fibersresearched. Vectran is a liquid crystallinepolymer (LCP). The resin is anisotropic before itis spun through tiny holes producing a highlyoriented fiber structure with excellent tensileproperties.2
Vectran is being considered as a possiblereplacement material primarily due to improvedtime-dependent behavior. The manufacturerclaims the material exhibits no measurable creepwhen loaded up to 50% of its breaking load.2
This statement is contradicted by NASA testing,but the measured and quantified creep is on theorder of five times less than Kevlar.
BackgroundTable 2 in Appendix A reports materialproperties for Vectran with a direct comparisonto Kevlar 49 as reported by available literature.Key points include improved strength, abrasionresistance, and creep performance.
Creep and Stress RelaxationThe time dependent load behavior of materials ischaracterized by creep and stress relaxation.Creep describes a material that experiences anincreasing total strain with time under a constantload. Stress relaxation refers to a material that isinitially strained to a fixed dimension, and thenover time the stress within the materialdecreases. This phenomenon is observed tosome degree in almost every engineeringmaterial with the exception of a perfect singlecrystal.3,4

2
The activation temperature required to initiatethis time-dependent relaxation of the materialmay be seen as primary driver of the process.Other factors may have an effect on relaxationsuch as moisture, pressure, and the degree of theapplied strain or load. All of these vary greatlywith each material and there are also numerousunderlying molecular processes. 3,4
Metallic materials in general relax very slowlyand require high activation energies as comparedto polymers. Polymers display viscoelasticproperties where their behavior can be describedas a mix between a pure solid (governed byHooke’s Law) and a pure liquid (governed bythe laws of fluid mechanics). Maxwell modelsconsisting of a series of springs and dashpots areoften used to describe (at least conceptually) therelaxation of polymers over time. 3,4
A classical model of the creep behavior of amaterial has three stages of strain vs. timebehavior of creep (constant load). The first stageconsists of the initial elastic and plastic effectsof loading and an initially high, but rapidlydecaying creep rate. This is followed by steadystate creep in stage two where the rate is linearwith time, and concludes with tertiary creepwhere the creep rate rapidly accelerates and endsin failure.5 Figure 1 below represents these threephases.
Figure 1. Strain vs. Time Behavior of Creep.5
In classic polymer relaxation theory, the time-dependent behavior is governed by highlydeveloped equations often based on Maxwell or
Voigt models and governed by a spectrum ofrelaxation times for the material.4,6
To describe real systems, these models becomevery complicated. In literature and testing atNASA GSFC mathematical fits to creep andrelaxation curves proved a better engineeringsolution for Kevlar relaxation. This allowsanalysis on a macroscopic level and reliablepredictions under the condition that theconstants in the mathematical model can bevaried to include all pertinent variables.
These mathematical models can be furtherenhanced if they can be used to predictrelaxation after a history of varying conditions.Under the theory of Linear Viscoelasticity, theBoltzmann superposition principle applies. Itstates that the effects of mechanical history arelinearly additive.4 This may or may not be avalid assumption for Vectran.
Extensive literature review7-12 and testing withKevlar suggested that a simple logarithmic creepmodel might be applied to the results of Creepand Relaxation Testing with Vectran. Therefore,the following equation for steady state stressrelaxation is proposed, where Beta is assumed tobe negative.
€
σ(t) =σ1β log10(t) + β1 t > 0 (1)
€
σ(t) = Stress at time (t)
1σ = Stress at t = 1β = Constantt = time
The practicality of this predictive model will bediscussed following the results section. Makinga similar assumption that the material is stressindependent, a practical mathematical model forcreep can be obtained. β becomes the slope ofthe curve, divided by the total length of thespecimen in tension, measured as built. Modelsfrom Guimaraes9 and Blades12 use the initialstrain rather than the initial length to create theirconstants and models. This study proposes analternate method because of the difficulty ofdefining a specific point as being the point ofzero strain in a multi-fiber material. Using the
3
total length of the specimen allows a moreconsistent measure because the margin of errorfor defining this initial point is smaller.However, the equation is no longer directlycomparable to creep, and is insensitive to theload used for testing. Therefore, the constantsdeveloped will be specific to a degree of appliedload. The result is equation (2) below.
€
e(t) = l1β log10(t) t > 0 (2)
)(te = elongation at time tβ = Constantt = time
1l = length at t = 0, prior to any loading
These equations presuppose that the item inquestion has been pre-conditioned sufficiently toremove all construction settling.
Coefficient of Thermal Expansion (CTE)The CTE is the relationship between expansionin a linear direction and the temperature. TheCTE is especially important when working withdifferent materials. The CTE may be used todetermine the thermal compatibility of materialsthat will be bonded together, to make sure thatthey will expand at a comparable rate. Ifmaterials with different CTE values are bondedtogether, they will expand/contract at differentrates as they are heated/cooled and the bondcould ultimately fail or the materials couldmove. The CTE is also used in conjunction withmechanical measure-ments to determine thefeasibility of using a material for a project, i.e.,whether its properties fit the needs of the project.The CTE (α ) is calculated using the formula:
( )0TTl
llf
o
of −=−
α , (3)
l0 = Initial lengthT0 = Initial temperaturelf = Final lengthTf = Final temperature.13
ExperimentalThe configuration of tested fibers, the equip-ment, and the specific test methods are allcritical factors in this analysis.
SpecimensPrevious experience in testing Kevlar braidedcord accelerated the development of a suitabletest specimen for the braided Vectran. Thematerial tested was Vectran HS type 97 in a 12strand 1500 denier braid rated at 800 lbsaccording to the manufacturer of the cordage,Cortland Cable.
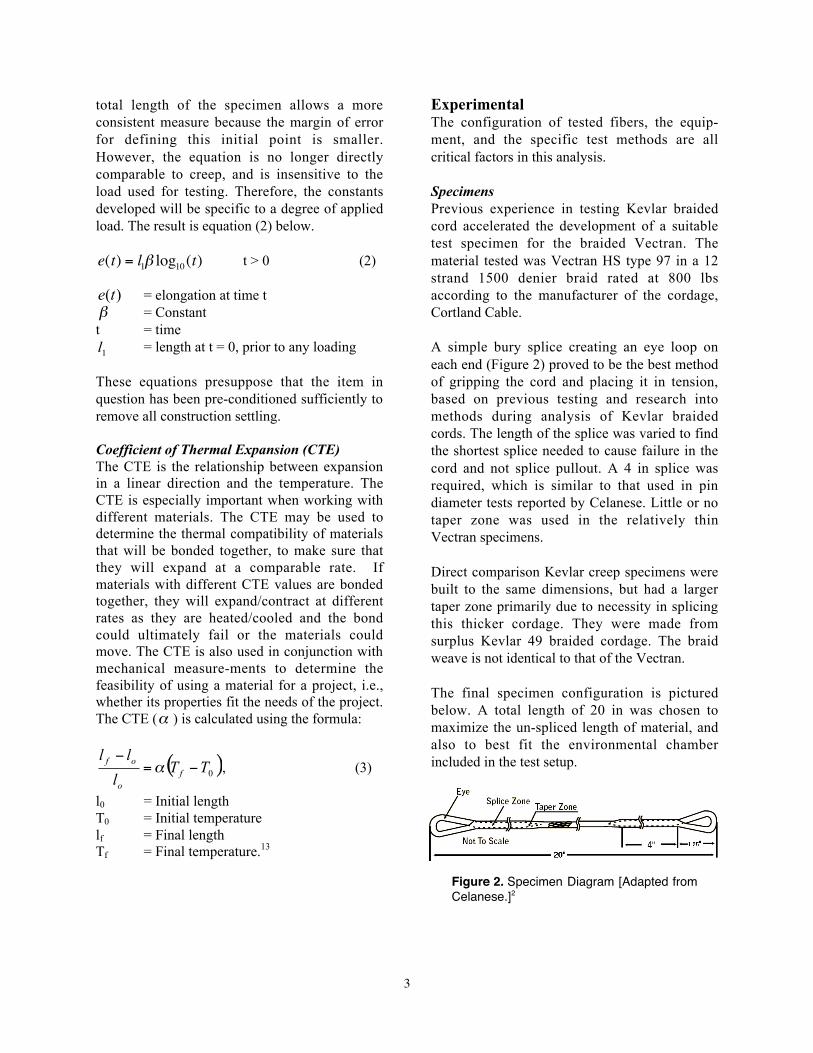
A simple bury splice creating an eye loop oneach end (Figure 2) proved to be the best methodof gripping the cord and placing it in tension,based on previous testing and research intomethods during analysis of Kevlar braidedcords. The length of the splice was varied to findthe shortest splice needed to cause failure in thecord and not splice pullout. A 4 in splice wasrequired, which is similar to that used in pindiameter tests reported by Celanese. Little or notaper zone was used in the relatively thinVectran specimens.
Direct comparison Kevlar creep specimens werebuilt to the same dimensions, but had a largertaper zone primarily due to necessity in splicingthis thicker cordage. They were made fromsurplus Kevlar 49 braided cordage. The braidweave is not identical to that of the Vectran.
The final specimen configuration is picturedbelow. A total length of 20 in was chosen tomaximize the un-spliced length of material, andalso to best fit the environmental chamberincluded in the test setup.
Figure 2. Specimen Diagram [Adapted from Celanese.]2

4
Tensile Testing was performed on the specimensto determine the average breaking strength inthis configuration. The specimens were loadedthrough 1/2 in steel pins in mechanical testingmachines and tensioned at a rate of 0.5 in/mincrosshead speed. The cable was reported to havea strength of 800 lbs. With this configuration theaverage breaking strength was 760 lbs. Totallength of the tensile specimens was 12 in, splicedimensions were identical to those above.Kevlar specimens were tested in a similarmanner.
A summary of all tensile testing resultsincluding specimens spliced and tested as acomplete loop similar to that used in the arraytie-downs is included in Appendix A as Table 3(Vectran) and Table 4 (Kevlar).
Test MethodsIn this properties discovery process, a widevariety of test methods were employed.
Creep Test: Creep Testing was performed on amechanical test machine with a hydraulicactuated ram to achieve precise and virtuallyinstantaneous control over load, along with aconvenient method to obtain creep informationby analyzing the crosshead displacement. Arapidly moving actuator is especially helpful tomatch the rapid initial displacements due toconstruction effects of the braid. An environ-mental chamber surrounded the specimen duringtesting and was used to control temperaturebetween 0 and 60 ºC.
Specimens were built by hand, inserted over1/2 in pins in the mechanical tester, and loadedto the final test load (which varied between 25and 50% of breaking strength) at a rate of 200lb/min. No preconditioning was performed forthese specimens. It was assumed that the effectsof the rope construction would be eliminatedover the initial part of the constant load test, inthe same way as pre-stressing them.
The data was analyzed by using the logarithmicslope fit function of KaleidaGraph WIN v 3.5x.The data period covered included all points after
5 hours. This point was chosen because it wasafter the inflection point noted previously andconsistently eliminated the area not showing alinear response. The slope constant was thenumber of interest from this equation.
The units from this result are mils/log(t). Thiswas converted to %e/log(t) (% elongation) bydividing by the total length of the test specimen(loop end to loop end). This number is the slopeconstant β , referred to in the Equation 2.
Stress Relaxation Test: The second testconducted was a simulation of the stressrelaxation test used by an independent testingcompany to report zero creep for Vectran. Fourcables constructed in the same manner as forcreep testing were loaded into steel load frames,in line with precision load cells. Two specimenswere tensioned to 60% of their breakingstrength, and two at 40%. They were allowed torelax for one day, and then re-tensioned to theoriginal load. Over the course of the 10-weektest, the cables were re-tensioned once more.
Data was analyzed by taking the logarithmicbest fit of the steady state portions of eachrelaxation curve. This constant was divided bythe load applied to obtain the constant β fromEquation 1. The slope constants reported weretaken from data 2.5 hours after loading where allcurves were visually log-linear.
An independent testing company performed astress relaxation test to infer properties for bothstress relaxation and creep. They performed thetest at 20% of material strength in a static testfixture, and monitored the load in two load cellsat the ends of the sample. Tensions wererecorded periodically for 6 months. The materialconfiguration was a single strand wire-lay. Thismethod helps to minimize the constructionstretch component as compared to a braidedrope. The specimen “was loaded very slowly to20% using a turnbuckle arrangement, and notsubsequently re-tensioned for the entire 6-month period. There was no previous loading onthe rope.”

5
“Po
siti
on
(m
il)”
CTE Test: The third test conducted was ananalysis of the CTE across a specifiedtemperature range for Vectran. The CTE for theVectran was measured using a TA InstrumentsTMA 2940 Thermomechanical Analyzer. Thesamples were prepared by clamping a smallpiece of the sample at both ends using thefilm/fiber clamps for the TMA 2940. The CTEof the samples was then measured using thefilm/fiber accessory, which measures the CTEby holding the sample in tension and measuringthe change in length as the sample is heated.Each of the samples was tested over atemperature range of –150 °C to 150° C using aramp rate of 5 °C/min. Nitrogen was used as thepurge gas for the TMA, and liquid nitrogen wasused to cool the samples to –150 °C.
EquipmentCreep testing was performed on an INSTRONModel 1350 Dynamic Testing Machine.Thermal control was achieved through anINSTRON Testing Oven Model 3119-409-21.Stress Relaxation Testing was performed instainless steel fixture formed by fixing squareplates at either end of threaded rods. A throughhole connected to a 1/2 in pin yoke provides theload path. Turning a fine thread nut tensions thesystem. Sensotec load cells from Honeywellwere calibrated before testing at GSFC. OneModel 31 Precision Miniature Load Cell with arange of 500 lbs was employed per fixture.
CTE measurements were performed on a TAinstruments Thermo-mechanical Analyzer: TMA2940. Liquid Nitrogen was used to cool thespecimens initially to begin testing.
Results
Creep TestingFigure 3 depicts four creep data runs taken at50% of the breaking strength for 20–90 hours,normalized for comparison. The specimens wererun at approximately 23 ºC in the labenvironment. Temperature and humidity werenot controlled. The summary of valid (seediscussion) creep constants is found in Table 5.
Time (days)
Figure 3. Creep Curves.
Table 5. Summary of Creep Constants.
Time Creep Rate (hrs) β(%/log(t))*
Vectran 50% of Breaking Load (23 °C)Vectran C2d 20 0.00031Vectran C2e 20 0.00029Vectran C2g 90 0.00029Vectran C2h 70 0.00026 Average 0.00029Vectran 25% of Breaking Load (23 °C)Vectran C1a 20 0.00048Vectran C1b 62 0.00032 Average 0.00040Kevlar 34% of Breaking Load (23 °C)Kevlar C2a 90 0.00122Kevlar C2b 90 0.00176 0.00149Vectran 50% of Breaking Load (60 °C)Vectran C6b 20 0.00026Vectran C6d 20 0.00029 Average 0.00028* note that % refers to a weighted %.
Stress Relaxation TestingAn independent testing company reported zerocreep for Vectran HS wire rope from the dataproduced in their stress relaxation test. Slightvariations were attributed to room temperaturefluctuations. This phenomenon is expectedbecause of CTE mismatches with the frame and
0
10
20
30
40
50
10-5 0.0001 0.001 0.01 0.1 1 10
Creep of Vectran HS 97 12 Strand Braided CordLoaded to 50% of breaking strength (380 lb) at 200 lb/min
Ambient Lab EnvironmentNo Preconditioning, 20.5 in sample
"Position mil""Position mil""Position mil""Position mil"
"Position (mil)"
"Time (Days)"

6
sample, and was seen in testing at NASA aswell. Their charted results were recreated byCelanese for their Engineering Data Sheet.2
Figure 4. Manufacturer’s Creep Data.2
A similarly formatted graph of the datagenerated in testing at GSFC is found as Figure5, and a normalized graph as Figure 6.
Days
Figure 5. Vectran Relaxation at NASA GSFC.
When the results from Figure 5 are normalized,both for time and load, the results can be betterexamined. This is depicted in Figure 6, whereeach re-tensioning has also been reset to t=1.The resulting creep constants are reported inTable 6 and compared with the summary of
results from previous Kevlar stress relaxationtesting. Table 7 shows an additional comparisontest of Kevlar and Vectran relaxation.
Normalized Time (days)
Figure 6. Normalized Vectran Relaxation at NASA GSFC.
Table 6. Summary of Relaxation Constants.
Vectran 10 Week Relaxation Test Strength Initial Secondary Tertiary %* %/log(t)* %/log(t)* %/log(t)*Fixture 1 0.59 -0.028 -0.025 -0.018Fixture 2 0.59 -0.031 -0.026 -0.018Fixture 3 0.39 -0.036 -0.034 -0.027Fixture 4 0.39 -0.034 -0.035 -0.026 Average -0.032 -0.030 -0.022Kevlar** 0.60 -0.015 -0.011 * note that % refers to a weighted %.**From previous NASA testing
Table 7. Kevlar vs. Vectran Relaxation.
2 Day Direct ComparisonSlope after 1 retensioning
% break %/log(t)Kevlar 0.2 -0.0388
Kevlar 0.2 -0.0398
Vectran 0.2 -0.0658
Vectran 0.2 -0.0612
% is weighted %
-100
-80
-60
-40
-20
0
20
10-5 0.0001 0.001 0.01 0.1 1 10 100
Vectran HS 97 12 Strand Braided CordRelaxation from first loading, and two reloadingsAverage nominal load of 50% breaking strength.
Ambient Lab environment.No Preconditioning
Loss of Load (lbs)
Normalized Time (days)
Initial
Secondary
Tertiary
200
250
300
350
400
450
500
0.001 0.01 0.1 1 10 100
Relaxation of Vectran HS 97 Braided Cord in Lab Environment
2 samples each at 60% and 40% of Breaking Strength
Tensile Load (lbs)
Days
Lo
ss o
f L
oad
(lb
s)
“Po
siti
on
(m
il)”

7
CTE TestingEach sample was heated from –150 °C to150 °C, and a mean CTE of -5.78µm/m- °C wasfound over a range of 125 °C to 0 °C. A CTE of-4.8 µm /m- °C from 20 to 145° C was reportedby Celanese, the manufacturer of the Vectranfiber. Additional CTE data provided by anindependent company lists a CTE of -4.89µm/m- °C from 150 to –160 °C.
Out-gas TestingStandard out-gassing tests were also performedat NASA and the pertinent results are includedin Table 8. The results show that the materialperforms well within the typical limits to qualifyit for space flight. IR Spectroscopy showed thecords tested were coated with optional siliconoil, which can be declined for space flight.
Table 8. Out-gassing report.
Micro VCM Out-gassing TestPer ASTM E-595-93, Three runs
Vectran HS Type 97 1500 denier 12 std Braid
tested as received
Average Total Mass Lost 0.06%Average WVR @ 50% RH 0.01%
Average CVCM 0.01%Test by Dewey Dove and Debbie Thomas,
NASA GSFC 1 June 2004.
DiscussionA variety of differently constructed ropeproducts are compared throughout this report. Aprimary assumption of this report is that theeffects of material construction (yarn twist,weave, braid, and wire rope packing) areeliminated during initial tensioning and thematerial will subsequently perform similarly to asingle fiber. For Creep testing, this break-inperiod (also known as pre-conditioning) isaccomplished during the initial period ofconstant loading in the test. For stress relaxation,the first loading curve and relaxation constantcan be assumed to be dominated by constructionartifacts as well.
The validity of this assumption is borne out bytesting of Kevlar braided cords during 2003 –
2004 at NASA GSFC where the relaxationconstants generated during testing of 12 strandbraided Kevlar included fiber results in theirmargin of error. It is also supported by a ropecreep study.9
Temperature fluctuations in tests at ambient labconditions caused disruptions in both creep andstress relaxation curves. These were minor, andare not assumed to have impacted the results.
Creep TestingThe most instructive information on theresponse of Vectran came from creep testing.Although for most applications at NASA, stressrelaxation is the more pertinent test, creeptesting allows quicker and more controlledresults that can cover a wider range of variables.Also, under certain simplifications, theBoltzmann superposition principle can be usedto directly relate creep to stress relaxation.
In creep testing, there was a distinct inflectionpoint observed on many of the test curves ofdisplacement vs. Log (t). The visually distinctinflections generally occurred between 0.5 and 4hours. Previous testing implies that this mayrepresent the end of a period when fiber lays arealigned and straightened. A graphic depiction ofone creep curve with a distinct inflection isrepresented below.
Figure 7. Depiction of Creep Curve with Inflection to Steady State Creep.

8
Beginning after the inflection is a period ofsteady state creep, which should demonstrate thematerial properties of the specimen.For the reported creep slopes, the only resultsconsidered valid were those in tests that covereda period of at least 20 hours. The first factor forthis decision was a visual inflection point in theresponse of Kevlar observed as late as 4 hoursinto the test. This inflection point appears torepresent a change from an initially rapid butdeclining response over log time beforeachieving a steady state response. Additionally,observation of initial results showed that theslope constant was lower with a longer test, untilreaching a plateau with the 20-hour testsconducted. Test runs demonstrating largeenvironmental interruptions or testing artifactswere also disregarded.
The two long-term tests performed at 60 ºC didnot reveal a significant departure from theresults at room temperature. Additional testingwill be required to determine if the Boltzmannsuperposition principle will further simplify theresults. It is unclear from either stress relaxationor creep testing if the material exhibits adistinctly different rate at different loads.
Stress Relaxation TestingThe results of the stress relaxation test show adecelerating initial reaction tapering to a steadystate response as expected. After each re-tensioning there is an additional break-in periodor settling before steady state at a logarithmicrate is achieved. This is similar to an inverse ofeach creep curve reported. Further testing shouldanalyze whether over-loading and the decreasingto a final start load eliminates this issue.
Material Construction EffectsTesting results indicate more rapid creep andrelaxation at lower loads. This information couldbe indicative of construction characteristics ofthe braided cord still having a significant effecton the material behavior during steady state dueto insufficient preconditioning, in contrast withthe initial assumption. Further testing shouldstudy the effects of relaxation from higher loads
and preconditioning by over-loading to elucidateand eliminate any construction effects.
The results of stress relaxation for Vectran whencompared to Kevlar show an opposite responsethan that of creep. The most likely explanation isa change in the way the construction artifacts areeliminated. Kevlar has been demonstrated toovercome the effects of yarn twist and braidafter an initial relaxation and re-tensioning asdiscussed in the assumptions. This may not beapplicable for Vectran. Creep testing could beless susceptible to construction effects as it is re-tensioned constantly. The difference in testresults for stress relaxation and creep comparedfor Kevlar and Vectran is shown in Table 9.
Table 9. Creep vs. Stress Relaxation.
Average Ratios of Rates of Kevlar andVectran Time-Dependent Behavior
CreepKevlar Vectran
4.3 to 1Stress Relaxation
Kevlar Vectran0.5 to 1
In light of this information, stress relaxationapplications should consider alternate materialconstructions. E-mail correspondence with Mr.Douglas Bentley (mechanical propertiesengineer at Cortland Cable) provided someguidance on ways to reduce the constructioncreep/relaxation. Reducing the twist in thecomponent strands of a braided cord or reducingthe helix angle of the braid can significantlyreduce the amount of elongation due toconstruction or geometry of the braid. Braidedcords have provided a convenient geometry forterminating the ends with a splice, but there areother options such as continuously woundgrommets, or cable terminations such asdiscussed for the GLAST project.1
CTE TestingDue to the fact that the Vectran cording isformed by braiding 12 strands of fiber, testing

9
was performed on both a single strand fromthe braid and on the braid as a whole. Testing ofa single strand was preferred, as the 12 strandsin the braid increases the amount of twist in thefiber and may alter the measured CTE. Theeffect that the braiding has on the CTE isreflected in the data. Two runs were performedon the TMA 2940 using a single strand ofVectran, and one run was done using the 12-strand braid.
The measured CTE for the Vectran fiber iscomparable to the CTE values reported by theindependent company; however, the expansioncurves from both the TMA 2940 and theindependent company show a small transition atapproximately 100 °C. For the TMA 2940measurements, the CTE was calculated from theexpansion curve over the range of –125 °C to0 °C, and was limited by the presence of thetransition in the curve. Conversely, the CTEcalculated by the independent company includedthe portion of the expansion curve with thetransition by taking the linear regression of thecurve. Given that the CTE is often provided as alinear value, the CTE for the Vectran would bemore useful if it were provided over atemperature range that excluded the transition inthe curve, rather than calculating the CTE usinglinear regression.
Several different test configurations were usedto determine the cause of the transition. Inaddition to testing the Vectran over the –150 °Cto 150 °C range, several samples were alsotested from room temperature to 150 °C, and asample was also run using a weight to providemore tension in the sample. Finally, a sample ofthe 12-strand Vectran braid was tested over thefull –150 °C to 150 °C temperature range. Asmentioned previously, because the braid consistsof 12 strands, the fibers within the braid aretwisted and are therefore not oriented in a lineardirection. It was therefore expected that testingthe Vectran in this configuration would providea higher CTE. Analysis of the braid of Vectranfound that the CTE for the braid was–12.5µm/m- °C, almost triple the reported CTE
value. Figure 8 provides a comparison of thedifference in CTE found by testing the entirebraided cord as opposed to a single strand.
Figure 8. CTE Plot of Vectran HS.
Conclusions and Recommendations1. Vectran HS type 97 appears from literature
and testing to date to be an ideal upgradefrom Kevlar Braided Cords for many long-term, static-loading applications such as tie-downs on solar arrays.
2. Key improvements in performance includecreep/relaxation, moisture regain, abrasionresistance, and strength properties.
3. Vectran is NOT a zero creep material. Thisassumption was uncontested and repeated inavailable literature, based on a stressrelaxation test. The material experiencedlogarithmic creep and stress relaxation.
4. Vectran creeps at a rate four times slowerthan Kevlar.
5. A mean CTE of -5.78µm/m- °C was foundover a range of -125 °C to 0 °C.
6. Vectran braided cord must be pre-loaded toremove the effects of fiber weave and laybefore a reliable creep or stress relaxationrate can be expected.
-60
-40
-20
0
20
(µm)
-150 -100 -50 0 50 100 150 Temperature (°C)
Vectran Braid
Vectran Strand

10
7. Continuing Creep and Stress Relaxationtesting should analyze effects ofconstruction artifacts in time-dependentbehavior more fully. Contact WhitehillManufacturing who has offered to help withdirect comparison tests between their wirerope product and our braided cord.
References
1. Ney, Steve. Ponslet, Eric. GLASTTracker Corner Cables and TowerAssembly. Hytec Inc. HTN-102050-0005-A. Los Alamos NM. 12 April2000.
2. Vectran Engineering Data. CelaneseAcetate LLC. From website Accessed1 2 N o v e m b e r 2 0 0 4 .http://www.vectran.net/login.html.
3. Askeland, Donald R. The Science andEngineering of Materials. 3rd Ed. PWSPublishing Company, Boston. 1994.
4. Ferry, John D. Viscoelastic Properties ofPolymers. 3rd ed. John Wiley & Sons.1980.
5. Dowling, Norman E. MechanicalBehavior of Materials. 2nd ed. PrenticeHall, New Jersey. 1999.
6. Schmitz, John V. ed. Testing ofPolymers. Vol.1. Interscience Publishersof John Wiley & Sons, Inc. 1995.
7. Duband, L., Hui, L. and Lange, A.Cryogenics 1993. Vol 33, No. 6, 643-647.
8. Erickson, R.H. Polymer. 26 733 (May1985).
9. Guimaraes, G.B. and Burgoyne, C.J.“Creep Behavior of a parallel-lay aramidrope.” Journal of Materials Science, Vol27 1992. 2473-2849.
10. Riewald, Paul. G. “Kevlar AramidFibers, Properties and IndustrialApplications.” Advanced TextileMaterials Conference, April 5-6, 1988.
11. Wang, John Z. Dillard, D.A. Ward, T.C.Journal of Polymer Science: Part B:Polymer Physics, Volume 30. 1391-1400, 1992.
12. Zachariades A.E. and Porter. R. S. ed.The Strength and Stiffness of Polymers.Marcel Kekker Inc. 1983.
13. William D. Callister, Jr., MaterialsScience and Engineering: AnIntroduction (New York: Wiley & Sons,Inc., 2000), 661.
14. Kevlar Aramid Fiber Technical Guide,.Dupont Corporation. Received on 21Aug. 2003 by e-mail.
15. Yang, H. H., Kevlar Aramid Fiber. JohnWiley & Sons, England. 1993.
16. Materials. Cortland Cable Website.Accessed 10 February 2004.http://www.cortlandcable.com/cortlandcable/materials_printable.asp.
17. Spectra Product Sheet. Honeywellwebsite accessed February 2004.http://www.spectrafiber.com/products/spectra_900.html.
18. Twaron The Power of Aramid. Twaronwebsite accessed February 2004.http://www.twaron.com/index-exp.html.
_______________________________________

11
Appendix A
Vectran Properties

13
Table 1. Comparison of High Strength Fibers.
Creep Strength Modulus CTE density Moisture Elong/Break Max T Other
Fibers %/log t GPa GPa um/m/C g/cm^3 % % °C
HMPE (6) Susceptible 16
Excellent16
Very Low16
Low16
dynamic toughness16
Spectra (1000) creeps 3 15
171 15
.97 15
2.7 15
3.317
100 15
Spectra (2000) 3.25 17
116 17
.97 17
2.917
(probably hard splice)
LCP (6) Zero16
Excellent16
High16
good flex fatigue16
Vectran 0.00**2
3.2 15
91 15
-4.8* 2
1.47 15
0.1 2
3.3 2
150 15
easy to splice 2
Aramid Negligible16
Excellent16
Excellent16
Kevlar (49) 0.016 2.9 15
13515
-4.9 14
1.45 15
3-4 15
2.8 15
250 15
Twaron (2200) 3.0 18
110 18
Technora 3.3 15
70 15
1.39 15
4.3 15
250 15
PBO Negligible16
Best16
Best16
Poor UV16
Zylon
Comparison
Steel 7.6 15
150 15
7.8 15
4.8 15
500 15
* from 20-145 °C** up to 50% of ult. Load

14
Table 2. Summary of Literature Properties for Vectran and Kevlar 49.
Property Comparison of Vectran and Kevlar 49
Vectran Kevlar 49 Source Source
LCP Aramid units Vectran Kevlar
Tenacity 2.9 3.0 GPa 2. 14.
Tenacity 23 24 gpd 2. 14.
Modulus 65 112 GPa 2. 14.
Modulus 525 885 gpd 2. 14.
Yarn Elongation 3.3 2.4 % 2. 14.
Density 1.47 1.44 g/cm315. 14.
Max Use Temperature 150 250 ºC 15. 15.
Moisture Regain <0.1 3.7 2. 2.
Melting Point 330 Chars ºC 2. 2.
TGA 50% weight loss 550 560 ºC 2. 2.
% Tenacity at 150 ºC 55 81 % 2. 2.
CTE (20-145ºC) -4.8 -4.9 m/m - ºC x 10^6 2. 14.
Abrasion Resistance* 10 1 Cycle Ratio 2. 2.
Creep 0.0003 0.0015 %/Log(t)*
Stress Relaxation 0.033 0.015 %/Log(t)*
UV Resistance** similar 2. 2.
Thermal Conductivity 0.37*** 0.04 W/(m x K) *** 14.
Cryogenic Strength** +4.3% +0.4% 23 to -50ºC 2. 14.
Cryogenic Modulus* +40.0% +12.5% 23 to -50ºC 2. 14.
Sintech Cut Resistance 3.4 1.1 Relative Load 2. 2.
* % refers to a weighted percent
* *These are not material properties, but an approximation of results of many varying tests
* * *Number was for a polymer chip coupon sample, not fiber, and from a phone interview
15
Table 3. Summary Strength testing on Vectran HS type 97 in spliced configurations.
Vectran Strength Testing on INSTRON at 0.5 in/min x-headTest Specimen Description Length (in) Failure point Load (lbs)
1 4 in eye splice 13 splice transition 894
2 3 in eye splice 13 splice pullout 793
3 3.5 in loop splice 12 top of loop, no splice 1370
4 3.5 in loop splice 12 top of loop, no splice 1473
5 3.5 in loop splice 12 top of loop, no splice 1296
6 4 in eye splice 12 splice transition 707
7 4 in eye splice 12 splice transition 790
8 4 in eye splice 12 splice transition 766
9 4 in eye splice 12 splice transition 769
avg 4 in eye splice 12 splice transition 758 stdev 31
avg 3.5 in loop splice 12 top of loop, no splice 1380 stdev 73
Table 4. Summary Strength testing on Kevlar 49 in spliced configurations.
Kevlar Strength Testing on INSTRON at 0.5 in/min x-headTest Specimen Description Length (in) Failure point Load (lbs)
1 4 in eye splice & taper 12.5 Center Section 1449
2 4 in eye splice & taper 12.5 Center Section 1497
avg 4 in eye splice & taper 12.5 top of loop, no splice 1473 stdev 34

REPORT DOCUMENTATION PAGE Form Approved OMB No. 0704-0188
The public reporting burden for this collection of information is estimated to average 1 hour per response, including the time for reviewing instructions, searching existingdata sources, gathering and maintaining the data needed, and completing and reviewing the collection of information. Send comments regarding this burden estimate or any other aspect of this collection of information, including suggestions for reducing this burden, to Department of Defense, Washington Headquarters Services, Directorate for Information Operations and Reports (0704-0188), 1215 Jefferson Davis Highway, Suite 1204, Arlington, VA 22202-4302. Respondents should be aware that notwithstanding any other provision of law, no person shall be subject to any penalty for failing to comply with a collection of information if it does not display a currently valid OMB control number. PLEASE DO NOT RETURN YOUR FORM TO THE ABOVE ADDRESS. 1. REPORT DATE (DD-MM-YYYY) 2. REPORT TYPE 3. DATES COVERED (From - To)
4. TITLE AND SUBTITLE 5a. CONTRACT NUMBER
5b. GRANT NUMBER
5c. PROGRAM ELEMENT NUMBER
6. AUTHOR(S) 5d. PROJECT NUMBER
5e. TASK NUMBER
5f. WORK UNIT NUMBER
7. PERFORMING ORGANIZATION NAME(S) AND ADDRESS(ES) 8. PERFORMING ORGANIZATION REPORT NUMBER
9. SPONSORING/MONITORING AGENCY NAME(S) AND ADDRESS(ES) 10. SPONSORING/MONITOR'S ACRONYM(S)
11. SPONSORING/MONITORINGREPORT NUMBER
12. DISTRIBUTION/AVAILABILITY STATEMENT
13. SUPPLEMENTARY NOTES
14. ABSTRACT Vectran HS appears from literature and testing to date to be an ideal upgrade from Kevlar braided cords for many long-term, static-loading applications such as tie-downs on solar arrays. Vectran is a liquid crystalline polymer and exhibits excellent tensile properties. The material has been touted as a zero creep product. Testing discussed in this report does not support this state-ment, though the creep is on the order of four times slower than with similar Kevlar 49 products. Previous work with Kevlar and new analysis of Vectran testing has led to a simple predictive model for Vectran at ambient conditions. The mean coefficient of thermal expansion (negative in this case) is similar to Kevlar 49, but is not linear. A positive transition in the curve occurs near 100 ºC. Out-gassing tests show that the material performs well within parameters for most space flight applications. Vectran also offers increased abrasion resistance, minimal moisture regain, and similar UV degradation. The effects of material construction appear to have a dramatic effect in stress relaxation for braided Vectran. To achieve the improved relaxation rate, upgrades must also examine alternate construction or preconditioning methods. This report recommends Vectran HS as a greatly improved replacement material for applications where time-dependent relaxation is a major factor.
15. SUBJECT TERMS
16. SECURITY CLASSIFICATION OF: 17. LIMITATION OF ABSTRACT
18. NUMBER OF PAGES
19b. NAME OF RESPONSIBLE PERSON
a. REPORT b. ABSTRACT c. THIS PAGE 19b. TELEPHONE NUMBER (Include area code)
Standard Form 298 (Rev. 8-98)Prescribed by ANSI Std. Z39-18
Vectran, Kevlar,time-dependent behavior, Goddard Space Flight Center (GSFC), Coefficient of Thermal Expansion (CTE), creep, Boltzman superposition principle, stress relaxation
15
Ma rjo rie F . S o vin s ki