vegetable production at 369 thousand metric tons
TRANSCRIPT

Newsletter of the Philippine Statistics Authority - Regional Statistical Services Office - Cordillera Administrative Region (PSA-RSSO-CAR)Volume 4, No. 4 October - December 2020
Vegetable production at 369 thousand metric tonsVegetable production at 369 thousand metric tonsVegetable production in the Cordillera region in 2019 was at 368,608.2 metric tons (MT) harvested from an estimated area of 23,976.9 hectares. Production slightly decreased by 0.02% from the 368,670.0 MT production recorded in 2018. Vegetable production in the provinces of Ifugao, Kalinga and Mountain Province registered negative performances while, Abra, Apayao and Benguet reported increases in production.
Out of the total regional production of 368,608.2 MT in 2019, priority vegetables contributed mainly at 64.9% or equivalent to 239,091.5 MT. On the other hand, 35.1% or 129,516.7 MT came from major vegetables. The priority vegetables or crops refer to the identified national banner crops and various regional priority crops of the Key Commercial Crops Development Program (KCCDP), High Value Commercial Crops (HVCC) Program and now the Key Commodity Road Maps of the Department of Agriculture which are being developed because of their industrial and commercial potentials. Meanwhile, the major vegetables are the top 20 crops in the Philippines, other than palay and corn collectively account for more than 60 percent of the total production.
Among the provinces, Benguet was the top producer with 308,218.6 MT with a share of 83.6% of the total regional vegetables production in the region. Mountain Province came second with 8.4% share, followed by Apayao with 3.8%, Ifugao with 2.2%, and Abra with 1.6% shares, respectively. The province that contributed the smallest share to total vegetable production in 2019 was Kalinga with an output of 959.6 MT comprising 0.3% of the total vegetables production in the region.
Benguet tops major vegetable production with 94 metric tons
The output of the Cordillera region on major vegetables in 2019 was 129,516.7 MT, comprising 64.9 % of the total vegetable production in the region. The commodities comprising the major vegetables are mongo, peanut, cabbage, eggplant, tomato, garlic, camote and cassava.
Benguet was the top major vegetable producing province with 94,261.6 MT comprising 72.8% of the total major vegetables production. Mountain Province followed with 11.6% share. Apayao and Ifugao came third and fourth with 9.8% and 4.1% shares. The provinces with the smallest shares were Abra and Kalinga with 1.5% and 0.3% shares, respectively.
Priority vegetables contribute mainly to vegetable production
Priority vegetables dominated the region’s production accounting for 64.9% of the total of 368,608.2 MT regional vegetable production in 2019. The priority vegetables include habitchuelas, banana blossom, broccoli, cauliflower, kangkong, lettuce, pechay, ampalaya fruit, stringbeans, gourd, okra, squash fruit, ginger, pepper, carrots, gabi, radish and white potato. Benguet province posted the highest production with 308,218.6 MT from an area harvested of 17,581.0 hectares. Mountain Province came second with 31,140.6 MT with area harvested of 3,055.8 hectares, while Kalinga had the least production in the region with 959.6 MT and an area harvested of 230.5 hectares. ... continued on page 10

“A gangsa (gong) is an indigenous musical instrument of the Igorots (“people of the mountain”) of the Cordillera region. It is usually played during cultural celebrations, rituals and festivities. It is a cultural symbol of fellowship and unity among the Igorots.”
The quarterly newsletter is prepared by the Statistical Operations and Coordination Division (SOCD) of PSA- RSSO CAR
Editor-in-Chief
Aldrin Federico R. Bahit Jr., CSS
Assistant Editor-in-Chief
Jezl R. Boado, IO
Staff/Contributors
Betina Joy V. Bermillo, SS II
Ma. Gina V. De Guzman, SS II
Warren B. Mamanteo, SS II
Brozybroz Y. Mateo, SS II
Cherry D. Kiaw, AS
Kay Angelika M. Castro, AS
Stephen Dale C. Estigoy, JO
Jhamil Kharl L. Bumagat, JO
Layout Artist
Winsky B. Salisa, ISA
Adviser
Villafe P. Alibuyog, Regional Director
CTLL Bldg. 141 Abanao Extension Rizal Monument,Baguio City 2600
(074) 443-7763
rssocar.psa.gov.ph
@PSACordi
DISCLAIMER: Some photos/ graphics used in this publication were downloaded from the internet. This publication does not take ownership of the said photos/ graphics.
In this Issue.....
Vegetable production at 369 thousandmetric tons
1
Fishery production in CAR at 4 thousand metric
tons
3 Inflation in PHaccelerates to 2.5 percent
4
PSA enjoins support forthe conduct of
monthly Labor Force Survey in 2021
5Regional Compendium of Environment Statistics Component 2:
Environmental Resources and Their Use -Mineral Resources
5
Agricultural production values at 27.5
million pesos in 2019
762.1 percent of the working age population in
the Cordillera are employed
6
Regional Statistics Committee Cordillera Major
Accomplishmentsfor 2020
8 Be PhilSys Informed 10
2GANGSA, October - December 2020

Fishery production in Fishery production in CAR at 4 thousand CAR at 4 thousand metric tonsmetric tons
The Cordillera Administrative Region (CAR) registered 4,157.6 metric tons (MT) of fish production in 2019. This decreased by 5.9% from the 4,418.8 metric tons (MT) produced in 2018. The production was contributed by both inland and aquaculture.
The provinces of Apayao, Kalinga and Mountain Province registered positive growths, while Abra, Benguet and Ifugao registered negative trends. Out of the 157.6 MT total regional production, about 73.7% or 4,3,064.7 MT came from aquaculture while 1,092.9 MT (26.3%) were harvested from inland fishery production.
The province of Ifugao was the top producer of fish with 2,377.0 MT accounting 57.2% of the total regional fishery production. Abra province came second with 14.5% share, followed by Kalinga with 11.7%, Benguet with 8.5%, and Apayao with 7.8% shares, respectively. Mountain Province produced the smallest share with an output of 15.4 MT comprising only 0.4% of the total fish production in region.
MUNICIPAL INLAND PRODUCTION
The region’s municipal inland fishing output in 2019 was 1,092.9 MT comprising 26.3% of the total fishery production in the region. Inland municipal fishing refers to fishing in inland waters like lakes, rivers, and dams using simple gears and fishing boats some of which are non-motorized with a capacity of less than three (3) gross tons, or fishing not requiring the use of fishing boats.
Kalinga was the top inland fishing province with 30.3% share to the total inland fishery production of the region. The province of Abra followed with 23.0% share. Apayao and Ifugao came third and fourth with 21.5% and 18.3 % shares, respectively. The provinces with the smallest shares were Benguet (6.5%) and Mountain Province (0.4%).
AQUACULTURE PRODUCTION
Aquaculture is a fishery operation involving all forms of raising and culturing of fish and other fishery species in fresh, brackish and marine water areas. CAR registered an aquaculture production of 3,064.7 MT in 2019 with an estimated area harvested of 551.0 hectares. Aquaculture dominated the region’s fisheries accounting for 73.7% of the total fish production.
Ifugao province recorded the highest production in aquaculture fishery with 2,177.5 MT harvetsed from an area of 259.0 hectares. Abra came second with 351.5 MT with an area harvested of 148.7 hectares, while Mountain Province has the least production in the region with only 11.0
MT and an area harvested of 4.0 hectares.
In terms of percentage distribution in aquaculture production in the region, Ifugao had the biggest share with 71.1%. Abra came second with 11.5% share. Other provinces and their shares to total aquaculture production were: Benguet with 9.2%; Kalinga, with 5.0%; and Apayao with 2.9%. Mountain Province had the smallest share with 0.4%.
The Philippine Statistics Authority (PSA) generates statistics for freshwater municipal aquaculture and municipal inland fishing through the Production of Quarterly Inland Municipal and Quarterly Aquaculture Surveys conducted in sample aquaculture farms and sample inland fishing households. The respondents of the surveys are aquafarm operators, fishermen or other knowledgeable members of the household. Generated quarterly fisheries production is included in the quarterly data review process of the PSA at the provincial, regional and national levels. After the data validation, preliminary estimates are made available to data users.
Photos credits to BFAR CAR
GANGSA, October - December 20203
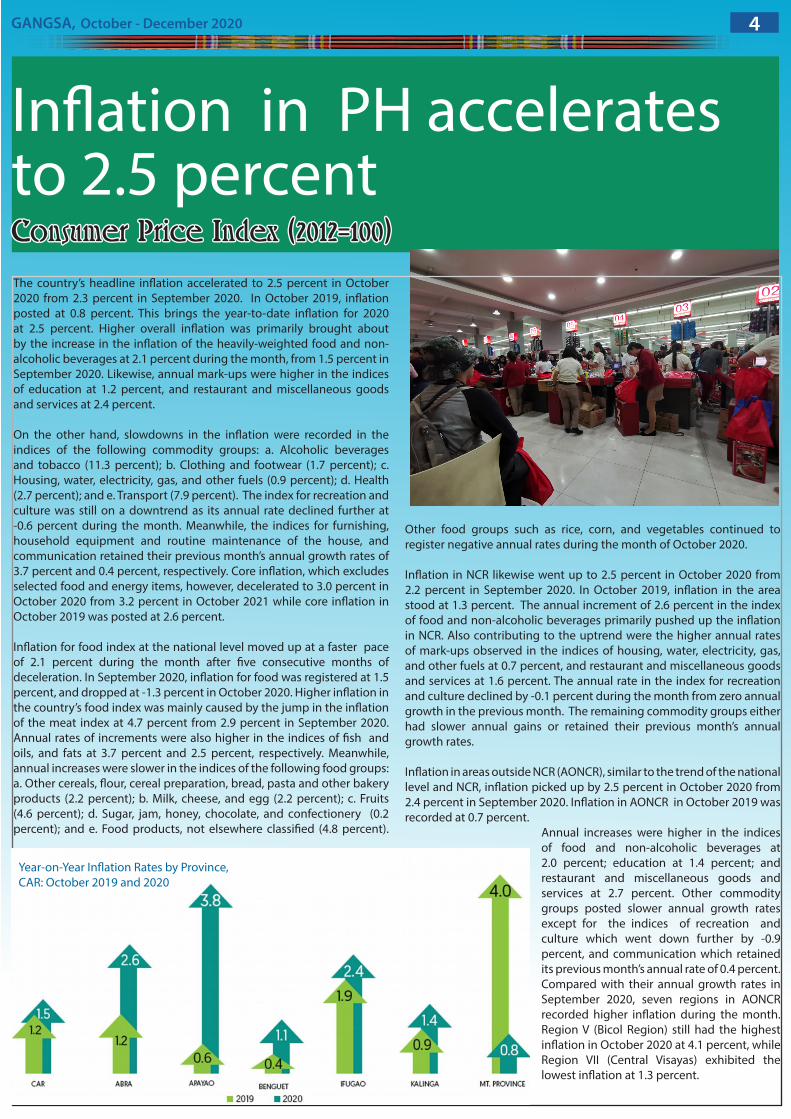
The country’s headline inflation accelerated to 2.5 percent in October 2020 from 2.3 percent in September 2020. In October 2019, inflation posted at 0.8 percent. This brings the year-to-date inflation for 2020 at 2.5 percent. Higher overall inflation was primarily brought about by the increase in the inflation of the heavily-weighted food and non-alcoholic beverages at 2.1 percent during the month, from 1.5 percent in September 2020. Likewise, annual mark-ups were higher in the indices of education at 1.2 percent, and restaurant and miscellaneous goods and services at 2.4 percent.
On the other hand, slowdowns in the inflation were recorded in the indices of the following commodity groups: a. Alcoholic beverages and tobacco (11.3 percent); b. Clothing and footwear (1.7 percent); c. Housing, water, electricity, gas, and other fuels (0.9 percent); d. Health (2.7 percent); and e. Transport (7.9 percent). The index for recreation and culture was still on a downtrend as its annual rate declined further at -0.6 percent during the month. Meanwhile, the indices for furnishing, household equipment and routine maintenance of the house, and communication retained their previous month’s annual growth rates of 3.7 percent and 0.4 percent, respectively. Core inflation, which excludes selected food and energy items, however, decelerated to 3.0 percent in October 2020 from 3.2 percent in October 2021 while core inflation in October 2019 was posted at 2.6 percent.
Inflation for food index at the national level moved up at a faster pace of 2.1 percent during the month after five consecutive months of deceleration. In September 2020, inflation for food was registered at 1.5 percent, and dropped at -1.3 percent in October 2020. Higher inflation in the country’s food index was mainly caused by the jump in the inflation of the meat index at 4.7 percent from 2.9 percent in September 2020. Annual rates of increments were also higher in the indices of fish and oils, and fats at 3.7 percent and 2.5 percent, respectively. Meanwhile, annual increases were slower in the indices of the following food groups: a. Other cereals, flour, cereal preparation, bread, pasta and other bakery products (2.2 percent); b. Milk, cheese, and egg (2.2 percent); c. Fruits (4.6 percent); d. Sugar, jam, honey, chocolate, and confectionery (0.2 percent); and e. Food products, not elsewhere classified (4.8 percent).
Other food groups such as rice, corn, and vegetables continued to register negative annual rates during the month of October 2020.
Inflation in NCR likewise went up to 2.5 percent in October 2020 from 2.2 percent in September 2020. In October 2019, inflation in the area stood at 1.3 percent. The annual increment of 2.6 percent in the index of food and non-alcoholic beverages primarily pushed up the inflation in NCR. Also contributing to the uptrend were the higher annual rates of mark-ups observed in the indices of housing, water, electricity, gas, and other fuels at 0.7 percent, and restaurant and miscellaneous goods and services at 1.6 percent. The annual rate in the index for recreation and culture declined by -0.1 percent during the month from zero annual growth in the previous month. The remaining commodity groups either had slower annual gains or retained their previous month’s annual growth rates.
Inflation in areas outside NCR (AONCR), similar to the trend of the national level and NCR, inflation picked up by 2.5 percent in October 2020 from 2.4 percent in September 2020. Inflation in AONCR in October 2019 was recorded at 0.7 percent.
Annual increases were higher in the indices of food and non-alcoholic beverages at 2.0 percent; education at 1.4 percent; and restaurant and miscellaneous goods and services at 2.7 percent. Other commodity groups posted slower annual growth rates except for the indices of recreation and culture which went down further by -0.9 percent, and communication which retained its previous month’s annual rate of 0.4 percent. Compared with their annual growth rates in September 2020, seven regions in AONCR recorded higher inflation during the month. Region V (Bicol Region) still had the highest inflation in October 2020 at 4.1 percent, while Region VII (Central Visayas) exhibited the lowest inflation at 1.3 percent.
Inflation in PH accelerates to 2.5 percentConsumer Price Index (2012=100)Consumer Price Index (2012=100)
Year-on-Year Inflation Rates by Province, CAR: October 2019 and 2020
4GANGSA, October - December 2020
The Philippine Statistics Authority (PSA) announces the conduct of the monthly Labor Force Survey (LFS) for year 2021 in between the regular quarterly LFS starting February 2021. The LFS is a nationwide quarterly survey of households that aims to gather data on the demographic and socio-economic characteristics of the population. It is aimed to provide a quantitative framework for the preparation of plans and formulation of policies affecting the labor market.
The monthly LFS will be conducted during the months when the LFS quarterly survey is not conducted, and will have lesser samples of around 11,000 households nationwide. The samples are deemed sufficient to provide national level labor market statistics such as labor force participation, employment, unemployment, and underemployment.
The LFS will conduct data enumeration through Computer Aided Personal Interviewing (CAPI) with the use of Tablets. The first monthly LFS round will be conducted from February 8 to 24, 2021. The schedules of data collection will be the same for the months of March, May, June, August, September, November and December 2021.
The monthly LFS is conducted in response to the urgent need for high frequency statistical information on the Philippine labor market to better monitor and understand the current job situation in the Philippines amidst the Coronavirus disease 2019 (COVID-19) pandemic. Results of the monthly LFS shall serve as basis for planning, formulation of policies, and implementing programs to create gainful employment, and bolster livelihood opportunities for the Filipinos.
In line with this, the PSA encourages everyone, especially those selected sample households to support and actively participate in the conduct of the monthly LFS by responding truthfully to the questions to be asked.
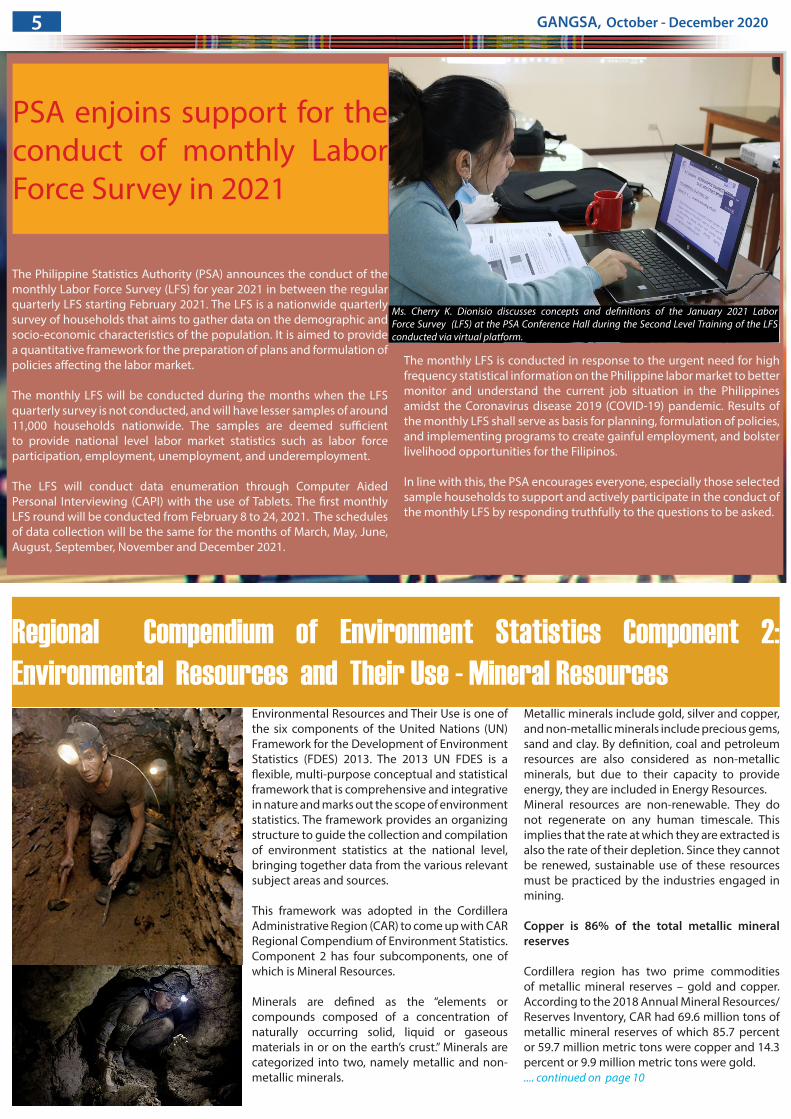
PSA enjoins support for the conduct of monthly Labor Force Survey in 2021
Ms. Cherry K. Dionisio discusses concepts and definitions of the January 2021 Labor Force Survey (LFS) at the PSA Conference Hall during the Second Level Training of the LFS conducted via virtual platform.
Regional Compendium of Environment Statistics Component 2: Environmental Resources and Their Use - Mineral Resources
Environmental Resources and Their Use is one of the six components of the United Nations (UN) Framework for the Development of Environment Statistics (FDES) 2013. The 2013 UN FDES is a flexible, multi-purpose conceptual and statistical framework that is comprehensive and integrative in nature and marks out the scope of environment statistics. The framework provides an organizing structure to guide the collection and compilation of environment statistics at the national level, bringing together data from the various relevant subject areas and sources.
This framework was adopted in the Cordillera Administrative Region (CAR) to come up with CAR Regional Compendium of Environment Statistics. Component 2 has four subcomponents, one of which is Mineral Resources.
Minerals are defined as the “elements or compounds composed of a concentration of naturally occurring solid, liquid or gaseous materials in or on the earth’s crust.” Minerals are categorized into two, namely metallic and non-metallic minerals.
Metallic minerals include gold, silver and copper, and non-metallic minerals include precious gems, sand and clay. By definition, coal and petroleum resources are also considered as non-metallic minerals, but due to their capacity to provide energy, they are included in Energy Resources.Mineral resources are non-renewable. They do not regenerate on any human timescale. This implies that the rate at which they are extracted is also the rate of their depletion. Since they cannot be renewed, sustainable use of these resources must be practiced by the industries engaged in mining.
Copper is 86% of the total metallic mineral reserves
Cordillera region has two prime commodities of metallic mineral reserves – gold and copper. According to the 2018 Annual Mineral Resources/Reserves Inventory, CAR had 69.6 million tons of metallic mineral reserves of which 85.7 percent or 59.7 million metric tons were copper and 14.3 percent or 9.9 million metric tons were gold..... continued on page 10
GANGSA, October - December 20205
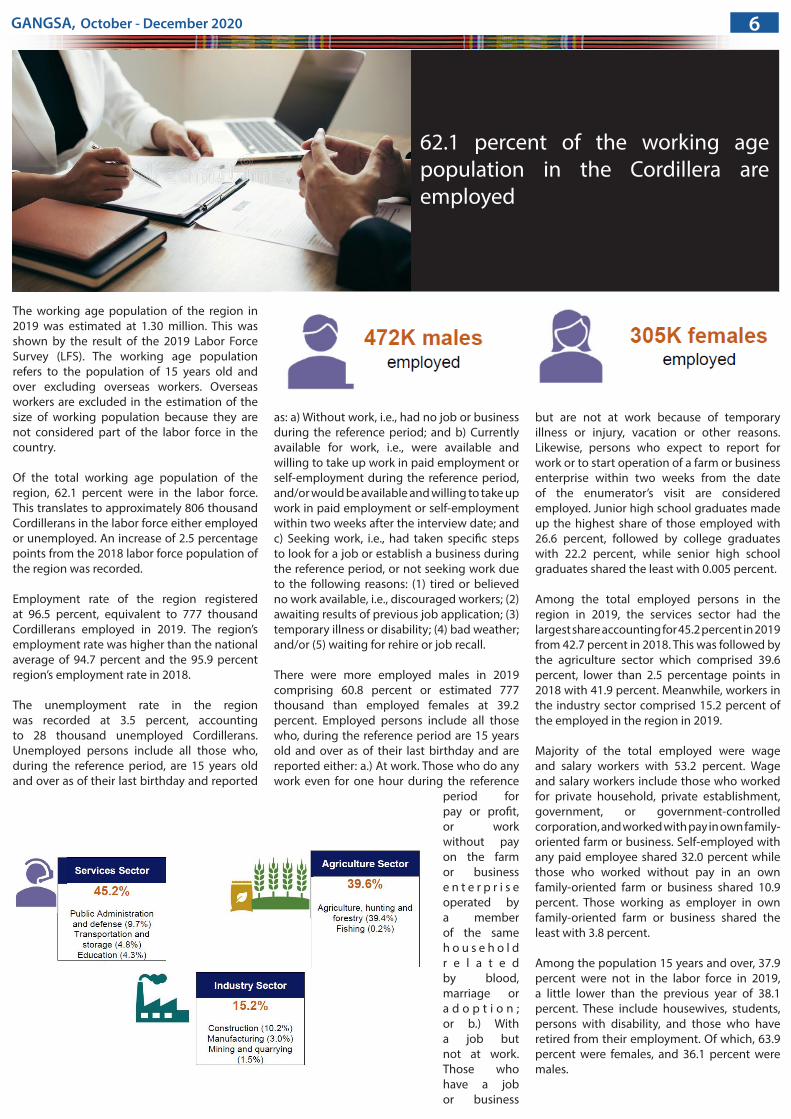
62.1 percent of the working age population in the Cordillera are employed
The working age population of the region in 2019 was estimated at 1.30 million. This was shown by the result of the 2019 Labor Force Survey (LFS). The working age population refers to the population of 15 years old and over excluding overseas workers. Overseas workers are excluded in the estimation of the size of working population because they are not considered part of the labor force in the country.
Of the total working age population of the region, 62.1 percent were in the labor force. This translates to approximately 806 thousand Cordillerans in the labor force either employed or unemployed. An increase of 2.5 percentage points from the 2018 labor force population of the region was recorded.
Employment rate of the region registered at 96.5 percent, equivalent to 777 thousand Cordillerans employed in 2019. The region’s employment rate was higher than the national average of 94.7 percent and the 95.9 percent region’s employment rate in 2018.
The unemployment rate in the region was recorded at 3.5 percent, accounting to 28 thousand unemployed Cordillerans. Unemployed persons include all those who, during the reference period, are 15 years old and over as of their last birthday and reported
as: a) Without work, i.e., had no job or business during the reference period; and b) Currently available for work, i.e., were available and willing to take up work in paid employment or self-employment during the reference period, and/or would be available and willing to take up work in paid employment or self-employment within two weeks after the interview date; and c) Seeking work, i.e., had taken specific steps to look for a job or establish a business during the reference period, or not seeking work due to the following reasons: (1) tired or believed no work available, i.e., discouraged workers; (2) awaiting results of previous job application; (3) temporary illness or disability; (4) bad weather; and/or (5) waiting for rehire or job recall.
There were more employed males in 2019 comprising 60.8 percent or estimated 777 thousand than employed females at 39.2 percent. Employed persons include all those who, during the reference period are 15 years old and over as of their last birthday and are reported either: a.) At work. Those who do any work even for one hour during the reference
period for pay or profit, or work without pay on the farm or business e n t e r p r i s e operated by a member of the same h o u s e h o l d r e l a t e d by blood, marriage or a d o p t i o n ; or b.) With a job but not at work. Those who have a job or business
but are not at work because of temporary illness or injury, vacation or other reasons. Likewise, persons who expect to report for work or to start operation of a farm or business enterprise within two weeks from the date of the enumerator’s visit are considered employed. Junior high school graduates made up the highest share of those employed with 26.6 percent, followed by college graduates with 22.2 percent, while senior high school graduates shared the least with 0.005 percent.
Among the total employed persons in the region in 2019, the services sector had the largest share accounting for 45.2 percent in 2019 from 42.7 percent in 2018. This was followed by the agriculture sector which comprised 39.6 percent, lower than 2.5 percentage points in 2018 with 41.9 percent. Meanwhile, workers in the industry sector comprised 15.2 percent of the employed in the region in 2019.
Majority of the total employed were wage and salary workers with 53.2 percent. Wage and salary workers include those who worked for private household, private establishment, government, or government-controlled corporation, and worked with pay in own family-oriented farm or business. Self-employed with any paid employee shared 32.0 percent while those who worked without pay in an own family-oriented farm or business shared 10.9 percent. Those working as employer in own family-oriented farm or business shared the least with 3.8 percent.
Among the population 15 years and over, 37.9 percent were not in the labor force in 2019, a little lower than the previous year of 38.1 percent. These include housewives, students, persons with disability, and those who have retired from their employment. Of which, 63.9 percent were females, and 36.1 percent were males.
6GANGSA, October - December 2020
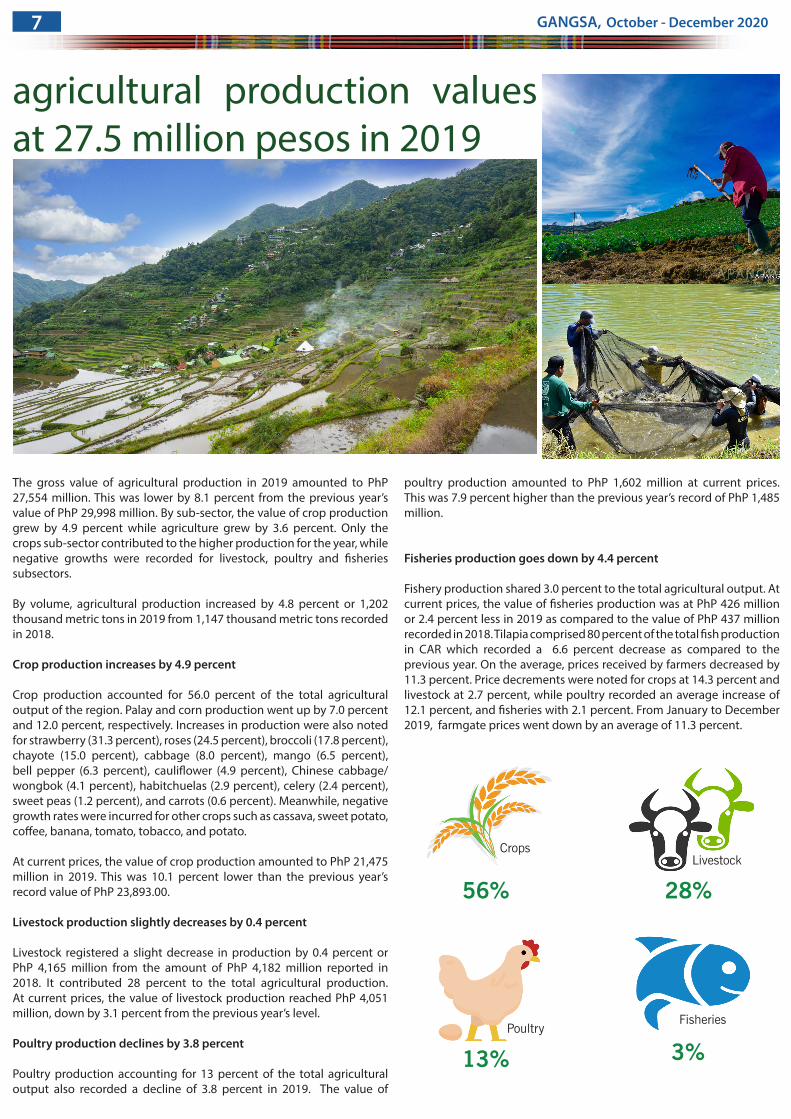
agricultural production values at 27.5 million pesos in 2019
The gross value of agricultural production in 2019 amounted to PhP 27,554 million. This was lower by 8.1 percent from the previous year’s value of PhP 29,998 million. By sub-sector, the value of crop production grew by 4.9 percent while agriculture grew by 3.6 percent. Only the crops sub-sector contributed to the higher production for the year, while negative growths were recorded for livestock, poultry and fisheries subsectors.
By volume, agricultural production increased by 4.8 percent or 1,202 thousand metric tons in 2019 from 1,147 thousand metric tons recorded in 2018.
Crop production increases by 4.9 percent
Crop production accounted for 56.0 percent of the total agricultural output of the region. Palay and corn production went up by 7.0 percent and 12.0 percent, respectively. Increases in production were also noted for strawberry (31.3 percent), roses (24.5 percent), broccoli (17.8 percent), chayote (15.0 percent), cabbage (8.0 percent), mango (6.5 percent), bell pepper (6.3 percent), cauliflower (4.9 percent), Chinese cabbage/wongbok (4.1 percent), habitchuelas (2.9 percent), celery (2.4 percent), sweet peas (1.2 percent), and carrots (0.6 percent). Meanwhile, negative growth rates were incurred for other crops such as cassava, sweet potato, coffee, banana, tomato, tobacco, and potato.
At current prices, the value of crop production amounted to PhP 21,475 million in 2019. This was 10.1 percent lower than the previous year’s record value of PhP 23,893.00.
Livestock production slightly decreases by 0.4 percent
Livestock registered a slight decrease in production by 0.4 percent or PhP 4,165 million from the amount of PhP 4,182 million reported in 2018. It contributed 28 percent to the total agricultural production. At current prices, the value of livestock production reached PhP 4,051 million, down by 3.1 percent from the previous year’s level.
Poultry production declines by 3.8 percent
Poultry production accounting for 13 percent of the total agricultural output also recorded a decline of 3.8 percent in 2019. The value of
poultry production amounted to PhP 1,602 million at current prices. This was 7.9 percent higher than the previous year’s record of PhP 1,485 million.
Fisheries production goes down by 4.4 percent
Fishery production shared 3.0 percent to the total agricultural output. At current prices, the value of fisheries production was at PhP 426 million or 2.4 percent less in 2019 as compared to the value of PhP 437 million recorded in 2018. Tilapia comprised 80 percent of the total fish production in CAR which recorded a 6.6 percent decrease as compared to the previous year. On the average, prices received by farmers decreased by 11.3 percent. Price decrements were noted for crops at 14.3 percent and livestock at 2.7 percent, while poultry recorded an average increase of 12.1 percent, and fisheries with 2.1 percent. From January to December 2019, farmgate prices went down by an average of 11.3 percent.
56% 28%
13% 3%
CropsLivestock
PoultryFisheries
GANGSA, October - December 20207

Regional Statistics Committee Cordillera Major Accomplishments for 2020The Regional Statistics Committee is a Special Committee (RSC) under the Regional Development Council (RDC) which serves as policy-making body on statistical matters and provides direction and guidance to regional/local statistical development activities. The RSC is a venue for discussion and resolution of statistical matters at the regional level. The committee has 33 members composed of regional line agencies, the City and Provincial Planning and Development Offices in CAR, selected academic institutions, and one private sector representative. It is led by the Regional Director of NEDA-CAR as the Chair and the Regional Director of the PSA-CAR as Vice Chair. The committee meets on a quarterly period with special meetings convened as necessary.
For the year, major accomplishments of the RSC-CAR laid-out in the 2020 RSC-CAR Annual Development Agenda are as follows:
Dissemination of Relevant and Timely Statistics
Committee members were regularly apprised on the results of statistical surveys, censuses, and administrative –based statistics timely released by the PSA and data source agencies (POPCOM, DOH, BSP), and statistical programs and frameworks during the quarterly meetings. These were in the forms of multi-media presentations, policy notes, publications and special releases, statistical frameworks, and forums. Statistics and programs disseminated during the year are as follows: ENRA Project: 2008-2018 Water Asset and Flow Accounts of CAR, Compendium of Regional Environment Statistics (RCES), Gross Domestic Regional Product and Gross Regional Expenditure (GRDE), 2018 Full Year Poverty Statistics, Sustainable Development Goals (SDG) Watch and Core Regional Indicator System Updates (CoRe IS), CAR Tourism Satellite Accounts, Inflation for CAR and provinces, POPCOM Demographic Vulnerability Tool, Consumer Price Index (CPI), Online Survey on Responsible Parenthood and Family Planning, Banking Statistics: Banking offices and nonbank financial institutions and the Enhanced New Generation Currency Banknotes, Overall Revision and Rebasing of the Gross Regional Domestic Product (GRDP) and Gross Regional Domestic Expenditure (GRDE), and the 2019 Report on the Performance of Agriculture of CAR.
Report on the Annual/Quarterly Regional Economic Situationer 2020 (ARES/QRES)
Quarterly and annual reports on the economic situationer of the Cordillera region were taken as part of the agenda of the quarterly meetings of the RSC. The reports present the status and progress of leading economic indicators such as inflation, employment and investment generation, exports, agricultural and mineral production, tourist arrivals, private building construction, motor vehicles registration, energy consumption,
and revenue collection on a regional scope.
Inventory of Statistics Available in Government (iSTAT)
RSC-CAR Resolution No. 03, s. 2020 passed and approved by the committee during its 3rd Quarter 2020 meeting on July 3, 2020 officially established the iSTAT (Inventory of Statistics Available in Government) for CAR. The iSTAT can be accessed through the Philippine Statistics Authority – CAR website http://rssocar.psa.gov.ph/iSTAT and will serve as the central facility and integrated portal of the inventory of statistics available in regional government agencies and instrumentalities, and LGUs in CAR. The iSTAT Web Page was officially launched via Facebook Page of the Philippine Statistics Authority – CAR on October 15, 2020 as part of the 31st National Statistics Month (NSM) celebration in relation to the theme: “Bridging Digital Gaps: Making Information Available to All” as a means of sharing information through a free access platform to data producers as well as users of statistics. Currently, the iSTAT contains data inventories of 31 government agencies.The development of the iSTAT was in response to the need for timely, reliable and quality statistics for evidence-based policy decisions. The effort was in line with the goals of RA 10625 otherwise known as “The Philippine Statistical Act of 2013” which provides for the preparation of
the Philippine Statistical Development Program (PSDP) to set strategic directions, thrusts and priorities of the Philippine Statistical System (PSS) and as information support to the Philippine Development Plan (PDP) 2017-2022, AmBisyon Natin 2040, 0-10 point Socioeconomic Agenda of the administration, and Sustainable Development Goals (SDGs), among others. Also one of the program priorities identified in Chapter III of the CAR Regional Statistical Development Program (RSDP) 2018-2023 is the enhancement and strengthening of mechanisms and systems for generation of timely, reliable and quality statistics that address information needs of local stakeholders.
Celebration of the 31st National Statistics Month (NSM)
The NSM celebration for 2020 carried the theme, “Bridging Digital Gaps: Making Information Available to All.” The theme focused on the on the importance of technology and digital innovation and overcoming barriers/gaps in continuously providing quality information and statistics that will help policymakers design responsive and evidence-based plans and programs towards economic recovery of the region and the whole nation amidst the challenges.
The RSC-led and region-wide NSM celebration include IEC drives on statistics and statistical programs, infographics exhibits, online/virtual contests, online training on preparing infographics and data storytelling, virtual launching of the iSTAT, and Forest Bathing and Fun Walk at the Camp John Hay reservation area. The line agencies and their provincial
RSC-CAR Chair and NEDA-CAR Regional Director Milagros A. Rimando with PSA-CAR Chief of Statistical Operations and Coordination Division Aldrin Federico R. Bahit, Jr. during the 1st Quarter 2020 meeting at the RDC Hall last February 20, 2020. Two Resolutions were approved during the meeting- first, a resolution creating the Technical Working Group on Citizen Generated Data (CGD), and second, a resolution enjoining agencies to provide data support for the compilation of the 2017-2019 Gross Regional Domestic Product (GRDP) of CAR.
8GANGSA, October - December 2020
counterparts, private organizations and the Provincial Statistics Committees (PSCs) also implemented NSM activities at their levels.
Statistical Policy Recommendations
Seven (7) Resolutions in support of statistical development of the region were issued/passed. These include the 2021 RSC-CAR Development Agenda approved during the last quarter meeting for the year held last November 19, 2020.
The Resolutions are as follows:
1. RSC-CAR Resolution No.01, s. 2020 (February 20, 2020): Creating The Task Force (TF) On Citizen-Generated Data (CGD)
• The creation of the TF on CGD aims to look at alternative sources of data specifically those generated by civil society organizations and institutions. The use of available and appropriate CGD addresses data gaps of admin-based, census and survey-based data of the government. The TF on CGD will study the use of CGD available in the region for monitoring of SDGs and other development indicators. ii
2. RSC-CAR Resolution No.02, s. 2020 (February 20, 2020): Requesting the Regional Line Agencies, Local Government Units and the Private Sector to Provide the Philippine Statistics Authority – Cordillera Administrative Region with the Data Needed in the Estimation of the 2017-2019 Gross Regional Domestic Product of CAR.
• RLAs, LGUs and the private sector were sought to provide data on the total outputs of goods and services that will serve as basis in estimating the economic performance of the region from 2017-2019. nnbnbnbnbbnbnmmm
3. RSC-CAR Resolution No.03, s. 2020 (July 3, 2020): Strengthening commitment of government agencies and instrumentalities and local government units in the Cordillera in providing information for the Inventory of Statistics Available in Government (iSTAT).
• The Resolution calls for different government agencies and LGUs to provide list of statistical outputs including data links of statistics being produced by the respective agencies/offices to the PSA-CAR in response to the needs of data users for timely, relevant and reliable statistics that will be used for evidence-based decisions and policy-making. The inventory of data/statistics will be uploaded to the iSTAT Web Page maintained by the PSA-CAR for free access of data users. vbvnvnvn
4. RSC-CAR Resolution No.01, s. 2020 (September 11, 2020): Approving the 2020 Regional Calendar of Activities in Celebration of the 31st National Statistics Month and Enjoining the Public and Private Agencies to Conduct Activities in Support of the NSM.
• The public and private agencies/offices were invited to celebrate the 31st National Statistics Month by conducting activities during the whole month of October
2020. The 2020 theme: “Bridging Digital Gaps: Making lnformation Available to All” focuses in making information accessible to all by addressing the digital divide and gaps in information and communication technology (lCT). bbmbmbm
5. RSC-CAR Resolution No.04, s. 2020 (November 25, 2020): Adopting the 2021 RSC-CAR Development Agenda
• The annual development agenda serves as a guide of the RSC-CAR in fulfilling its functions in terms of strengthening the statistical capability of the region, instituting statistical development activities and measures, and in addressing other statistical concerns for the whole year. The annual development agenda for the ensuing year is prepared and approved during the last quarter (4th Quarter meeting) of every year in time for implementation the following year. nm
6. RSC-CAR Resolution No.05, s. 2020 (November 25, 2020): Reconstituting the Regional Task Force (TF) on Tourism Statistics to Technical Working Group (TWG) on Tourism Statistics.
• The Reconstitution of the Task Force (TF) on Tourism Statistics to a Technical Working Group (TWG) will ensure the continuity of generating and updating of tourism statistics in the region. The TWG on Tourism Statistics is chaired by PSA-CAR with DOT-CAR as Vice Chair. The TWG will assist not only in the estimation of the CAR Tourism Satellite Accounts (TSA) and its succeeding activities, but also in improving tourism statistics of the region as a whole.m nmnmnm
7. RSC-CAR Resolution No.06, s. 2020 (November 25, 2020): Adopting the 2021 Work and Financial Plan (WFP) of the Task Force (TF) on Citizen-Generated Data (CGD)
• The TF on CGD was created through RSC-CAR Resolution No. 01 s. 2020 (February 20, 2020). The planned outputs and activities of the TF for 2021 were adopted by the RSC-CAR on its 4th Quarter 2020 meeting. Among the target activities of the task force include: identification of other civil society organizations (CSOs) that are producing/generating statistical data, identification of data gaps and issues that CGD could possibly address, inventory of statistics on CGD and its sources, launching of the Cordillera Citizen Generated Data (CGD), maintenance and monitoring of CGD, and developmental frameworks for data generation.
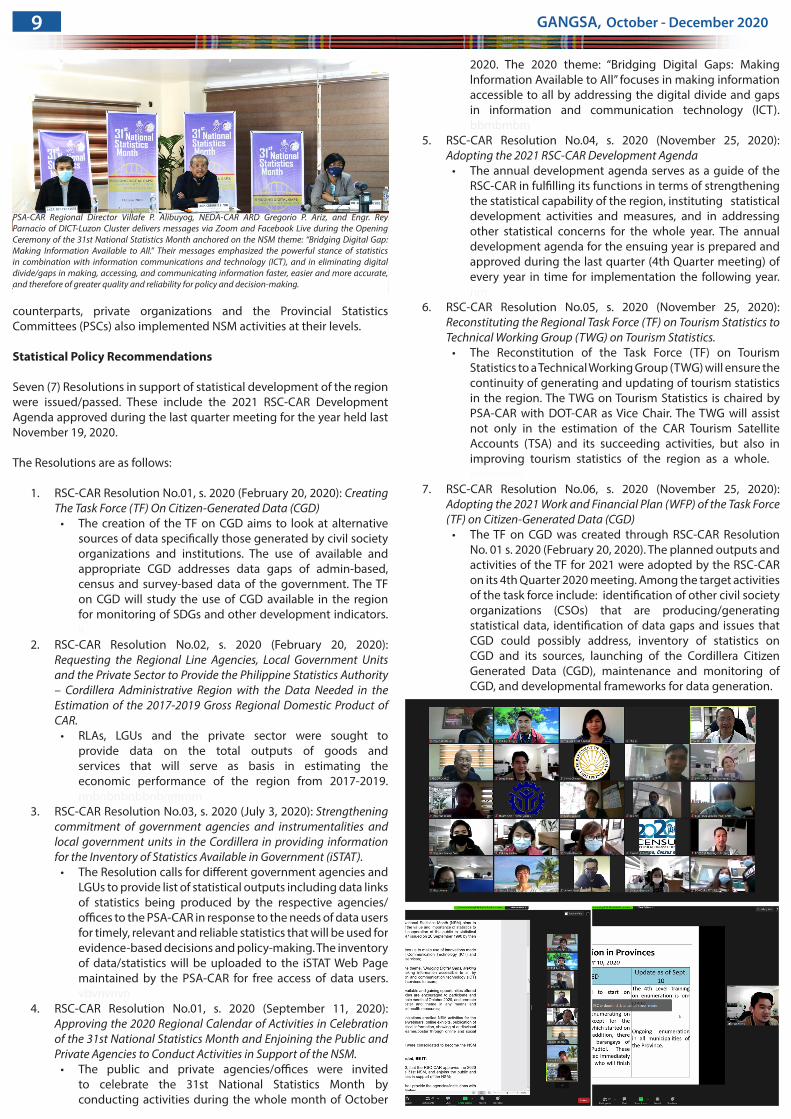
PSA-CAR Regional Director Villafe P. Alibuyog, NEDA-CAR ARD Gregorio P. Ariz, and Engr. Rey Parnacio of DICT-Luzon Cluster delivers messages via Zoom and Facebook Live during the Opening Ceremony of the 31st National Statistics Month anchored on the NSM theme: “Bridging Digital Gap: Making Information Available to All.” Their messages emphasized the powerful stance of statistics in combination with information communications and technology (ICT), and in eliminating digital divide/gaps in making, accessing, and communicating information faster, easier and more accurate, and therefore of greater quality and reliability for policy and decision-making.
GANGSA, October - December 20209
Regional... from page 5
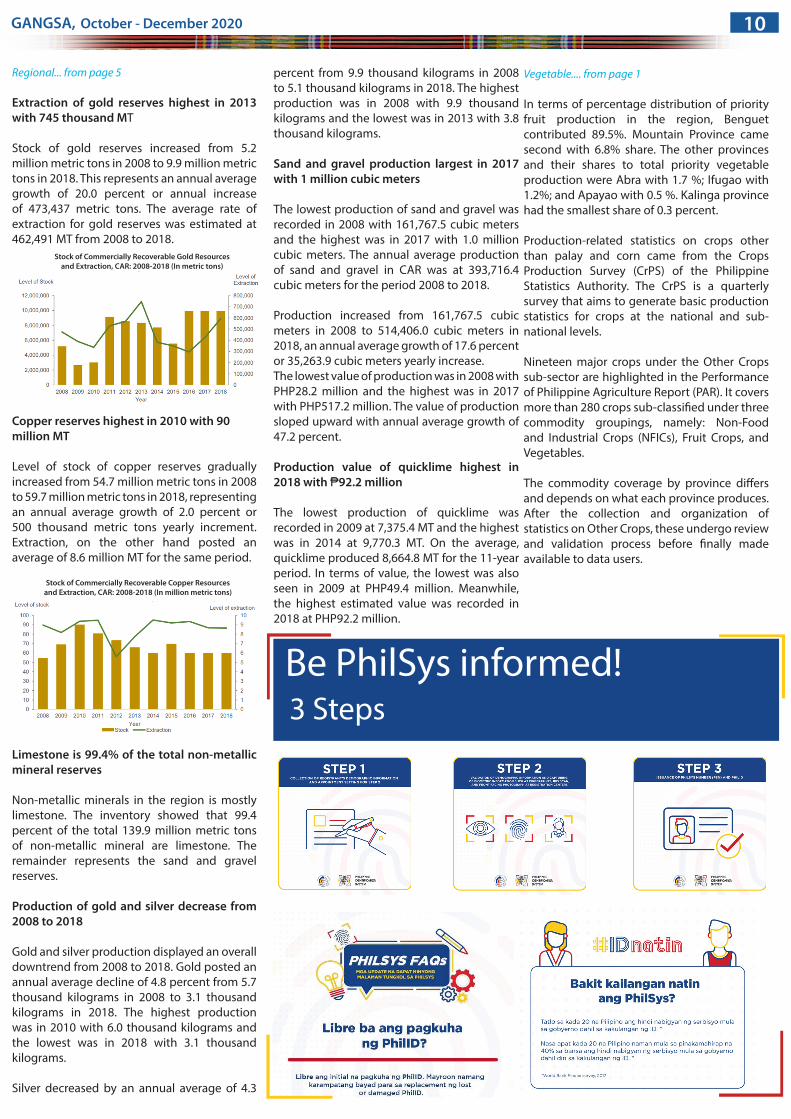
Extraction of gold reserves highest in 2013 with 745 thousand MT
Stock of gold reserves increased from 5.2 million metric tons in 2008 to 9.9 million metric tons in 2018. This represents an annual average growth of 20.0 percent or annual increase of 473,437 metric tons. The average rate of extraction for gold reserves was estimated at 462,491 MT from 2008 to 2018.
Copper reserves highest in 2010 with 90 million MT
Level of stock of copper reserves gradually increased from 54.7 million metric tons in 2008 to 59.7 million metric tons in 2018, representing an annual average growth of 2.0 percent or 500 thousand metric tons yearly increment. Extraction, on the other hand posted an average of 8.6 million MT for the same period.
Limestone is 99.4% of the total non-metallic mineral reserves
Non-metallic minerals in the region is mostly limestone. The inventory showed that 99.4 percent of the total 139.9 million metric tons of non-metallic mineral are limestone. The remainder represents the sand and gravel reserves.
Production of gold and silver decrease from 2008 to 2018
Gold and silver production displayed an overall downtrend from 2008 to 2018. Gold posted an annual average decline of 4.8 percent from 5.7 thousand kilograms in 2008 to 3.1 thousand kilograms in 2018. The highest production was in 2010 with 6.0 thousand kilograms and the lowest was in 2018 with 3.1 thousand kilograms.
Silver decreased by an annual average of 4.3
percent from 9.9 thousand kilograms in 2008 to 5.1 thousand kilograms in 2018. The highest production was in 2008 with 9.9 thousand kilograms and the lowest was in 2013 with 3.8 thousand kilograms.
Sand and gravel production largest in 2017 with 1 million cubic meters
The lowest production of sand and gravel was recorded in 2008 with 161,767.5 cubic meters and the highest was in 2017 with 1.0 million cubic meters. The annual average production of sand and gravel in CAR was at 393,716.4 cubic meters for the period 2008 to 2018.
Production increased from 161,767.5 cubic meters in 2008 to 514,406.0 cubic meters in 2018, an annual average growth of 17.6 percent or 35,263.9 cubic meters yearly increase. The lowest value of production was in 2008 with PHP28.2 million and the highest was in 2017 with PHP517.2 million. The value of production sloped upward with annual average growth of 47.2 percent.
Production value of quicklime highest in 2018 with ₱92.2 million
The lowest production of quicklime was recorded in 2009 at 7,375.4 MT and the highest was in 2014 at 9,770.3 MT. On the average, quicklime produced 8,664.8 MT for the 11-year period. In terms of value, the lowest was also seen in 2009 at PHP49.4 million. Meanwhile, the highest estimated value was recorded in 2018 at PHP92.2 million.
Stock of Commercially Recoverable Gold Resources and Extraction, CAR: 2008-2018 (In metric tons)
Stock of Commercially Recoverable Copper Resources and Extraction, CAR: 2008-2018 (In million metric tons)
Be PhilSys informed!3 Steps
Vegetable.... from page 1
In terms of percentage distribution of priority fruit production in the region, Benguet contributed 89.5%. Mountain Province came second with 6.8% share. The other provinces and their shares to total priority vegetable production were Abra with 1.7 %; Ifugao with 1.2%; and Apayao with 0.5 %. Kalinga province had the smallest share of 0.3 percent.
Production-related statistics on crops other than palay and corn came from the Crops Production Survey (CrPS) of the Philippine Statistics Authority. The CrPS is a quarterly survey that aims to generate basic production statistics for crops at the national and sub-national levels.
Nineteen major crops under the Other Crops sub-sector are highlighted in the Performance of Philippine Agriculture Report (PAR). It covers more than 280 crops sub-classified under three commodity groupings, namely: Non-Food and Industrial Crops (NFICs), Fruit Crops, and Vegetables.
The commodity coverage by province differs and depends on what each province produces. After the collection and organization of statistics on Other Crops, these undergo review and validation process before finally made available to data users.
10GANGSA, October - December 2020