vegetation condition and water quality in great lakes ... · vegetation condition and water quality...
TRANSCRIPT

Vegetation Condition and Water Quality in Great
Lakes Coastal Wetlands
Carol A. Johnston, ProfessorSouth Dakota State University
Understanding the Vegetation and Hydrology of Upper Midwest WetlandsSeptember 22-24, 2010
Carlton, MN

Acknowledgments
Michael Bourdaghs
Tom Hollenhorst
This research has been supported by a grant from the US Environmental Protection Agency's Science to Achieve Results (STAR) Estuarine and Great Lakes (EaGLe) Coastal Initiative through funding to the Great Lakes Environmental Indicators (GLEI) Project, US EPA Agreement EPA/R-8286750
Bad River Band of the Lake Superior Tribe of Chippewa Indians for permission to sample
Many collaborators, including:

Great Lakes, Great Wetlands
Caro
l A
. Jo
hnst
on
“develop a suite of new, integrative indicators of ecological condition, integrity, and/or sustainability that can be incorporated into long-term monitoring programs”
ENVIRONMENTAL INDICATORS IN THE ESTUARINE ENVIRONMENT2000 Science To Achieve Results (STAR) Program
GLEI: Great Lakes Environmental Indicators

Research Questions What are the plant community types of
northern Great Lakes coastal wetlands? How are they related to water chemistry?

Great Lakes, Great Wetlands
Caro
l A
. Jo
hnst
onMade 20,560 observations of cover class within 2051 sample plots in 90 wetlands
Photo: Lynn Vaccaro

Northern Great Lakes wetland vegetation sample sites
+3 sites on northern L. Huron →
Water chemistry measured on 26 northern sites (Trebitz et al. 2007, Morrice et al. 2008)

Great Lakes, Great Wetlands
Caro
l A
. Jo
hnst
onA Unifying Approach
1. sample wetlands representing the entire range of anthropogenic stress
2. sample a range of water depths within wetlands
3. use non-metric multidimensional scaling to determine a condition gradient
4. use hierarchical clustering to interpret MDS results
5. use GIS to map results
1. sample wetlands representing the entire range of anthropogenic stress
2. sample a range of water depths within wetlands
3. use non-metric multidimensional scaling to determine a condition gradient
4. use hierarchical clustering to interpret MDS results
5. use GIS to map results

Step 1: Sample wetlands representing the entire range of anthropogenic stress
Wolter et al. 2006. Land use land cover change in the U.S. Great Lakes basin 1992 to 2001. J. Great Lakes Res. 32: 607-628.

Step 2: sample a range of water depths within wetlands

Great Lakes, Great Wetlands
Caro
l A
. Jo
hnst
onStep 3: Use non-metric multidimensional scaling to determine a condition gradient
• MDS, NMS, NMDS• computed Bray-Curtis similarities among 90
wetlands• ordination based on ranked distances among
vegetation species assemblages• software packages PC-ORD, Primer
• MDS, NMS, NMDS• computed Bray-Curtis similarities among 90
wetlands• ordination based on ranked distances among
vegetation species assemblages• software packages PC-ORD, Primer

100806040200
easterncattail
westerncattail
burreed/ lake sedge
three-square
bluejoint/tussock
poor fens
Phragmites
Mere23% similarity
Step 4: Use hierarchical clustering to interpret MDS results
Great Lakes, Great Wetlands
Caro
l A
. Jo
hnst
onStep 5: Use GIS to map results
• ArcMap 9.2• identify geographic clusters of similar
vegetation• identify geographic outliers
• ArcMap 9.2• identify geographic clusters of similar
vegetation• identify geographic outliers

Plant Communities of Northern Great Lake Wetlands
Pokegama RiverPokegama River

Burreed marsh
Photo: C. Johnston
burreed (Sparganium eurycarpum)arrowhead (Sagittaria latifolia)Northwest Territory sedge (Carex utriculata)bladderwort (Utricularia macrorhiza)bulrush (Schoenoplectus tabernaemontani)
Photo: M. Bourdaghs

Wild rice (Zizania aquatica)8 out of 90 sites, 7 on Lake SuperiorSilt soil indicator

Bayview BeachBayview Beach
Plant Communities of Northern Great Lake Wetlands

Northern poor fen
Photo: C. Johnston
Sphagnum mossWooly-fruit sedge (Carex lasiocarpa)Myrica galeleatherleaf (Chamaedaphne calyculata)bog rosemary (Andromeda polifolia)pitcher plant (Sarracenia purpurea)bogbean (Menyanthes trifoliata)
Photo: M. Bourdaghs

Plant Communities of Northern Great Lake Wetlands
Tahquamenon RiverTahquamenon River

Photos: M. Bourdaghs
Bluejoint / tussock sedge
Bluejoint (Calamagrostis canadensis)Tussock sedge (Carex stricta)Softstem bulrush (Schoenoplectus tabernaemontani)Jointed rush (Juncus nodosus)

Plant Communities of Northern Great Lake Wetlands
Point au SablePoint au Sable

Cattail marshes
cattail (Typha angustifolia, Typha x glauca)bluejoint (Calamagrostis canadensis) jewelweed (Impatiens capensis)rice cutgrass (Leersia oryzoides)
Photos: C. Johnston

…what are plants telling us about wetland condition?So much diversity…

Non-metric multidimensional scaling – northern Great Lakes wetland vegetation

Non-metric multidimensional scaling – northern Great Lakes wetland vegetation
worst ← Condition → best

Chemical gradients among plant communities
a
bbc
c
poor fen cattailbluejointburreed
log [Chloride]
log conductivity
pH

Nutrient gradients among plant communities
a
b
b
poor fen cattailbluejointburreed
log [TP]
log [TN]
log [Chlorophyll a]b

Turbidity gradients among plant communities
a
bb
poor fen cattailbluejointburreed
log Ttube log [TSS]
b
poor fen cattailbluejointburreed
b b
b
a

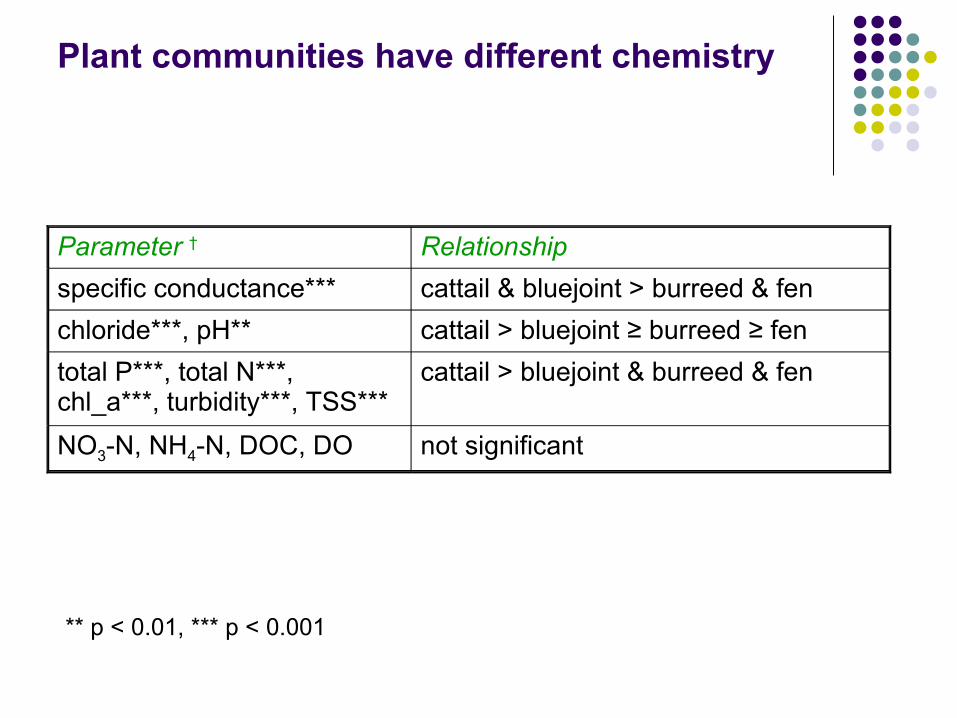
Plant communities have different chemistry
Parameter † Relationshipspecific conductance*** cattail & bluejoint > burreed & fenchloride***, pH** cattail > bluejoint ≥ burreed ≥ fentotal P***, total N***, chl_a***, turbidity***, TSS***
cattail > bluejoint & burreed & fen
NO3-N, NH4-N, DOC, DO not significant
** p < 0.01, *** p < 0.001

Non-metric multidimensional scaling – northern Great Lakes wetland vegetation
↑ Superior
↓ Michigan, Huron

175
176
177
178
179
180
181
182
183
184
1850 1870 1890 1910 1930 1950 1970 1990 2010Year
Elev
atio
n, m
eter
s
Superior lake levelMichigan/Huron lake level
Lake Superior fluctuates less than Lakes Michigan/Huron

Lakes have different chemistry
Parameter † Relationshipspecific conductance***, pH*** Huron & Michigan > Superiorchloride** Michigan ≥ Huron ≥ Superiortotal P**, total N*** Michigan > Superior & Huronchlorophyll_a* Michigan ≥ Superior ≥ HuronNO3-N* no Tukey differences
NH4-N, TSS, DOC, DO, turbidity not significant
* p < 0.05, ** p < 0.01, *** p < 0.001

Open-coast wetlands (Cw)
Riverine wetlands (Rw)
Protected wetlands (Pw)
3 Geomorphic Types

Geomorphology
conductivity: Pw < Cw*

Conclusions Plant species distinguish four major plant
communities in northern Great Lakes Water quality varies by plant community and
lake but not by geomorphology Based on chloride: cattail > bluejoint ≥ burreed ≥ fen Cattail wetlands (Lake Michigan) have poorest
water quality (more total P, total N, chl_a, turbidity, TSS)

Future threats: invasive wetland plants

! !!
!!! !
!!!!
! ! !! !
!
!! !
!! ! !
!!!!!!
0 0.1 0.2Kilometers
´1999
Photos: M. Tulbure
2004: common reed (Phragmites australis)

Monthly Water Level (MWL) at Green Bay, Lake Michigan, WI from 1999-2004Source: NOAA
175.4
175.6
175.8
176
176.2
176.4
176.6
176.8
Mar-99
Jun-99
Sep-99
Dec-99
Mar-00
Jun-00
Sep-00
Dec-00
Mar-01
Jun-01
Sep-01
Dec-01
Mar-02
Jun-02
Sep-02
Dec-02
Mar-03
Jun-03
Sep-03
Dec-03
Mar-04
Jun-04
Sep-04
Wat
er le
vel (
Met
ers
abov
e IG
LD 1
985)
MWLMeanMinimum
6/19/017/9/044/10/99

Take home messages A one-time “snapshot” sampling of multiple
wetlands can advance understanding Take a GPS with you when you do the
sampling! Keep looking at the data – it has many stories
to tell

References
Johnston, C.A., et al. 2007. Plant species indicators of physical environment in Great Lakes coastal wetlands. J. Great Lakes Res. 33 (sp3):106-124.
Trebitz A.S., et al. 2007. Water quality in Great Lakes coastal wetlands: Basin-wide patterns and responses to an anthropogenic disturbance gradient. J. Great Lakes Res. 33 (sp3):67-85.
Morrice J.A., et al. 2008. Human influences on water quality in Great Lakes coastal wetlands. Environ. Manage. 41:347-357.
Johnston, C.A., et al. 2009. A unifying approach for evaluating the condition of wetland plant communities and identifying related stressors. Ecol. Appl. 19:1739-1757.