vermont agency of education child nutrition...
TRANSCRIPT
VERMONT AGENCY OF EDUCATION
Child Nutrition Programs
Annual Statistical Report
Percent of Students Eligible for Free and Reduced Price School Meals
School Year 2016-2017
Nondiscrimination Statement:
In accordance with Federal civil rights law and U.S. Department of Agriculture (USDA) civil rights regulations and policies, the USDA, its Agencies, offices, and
employees, and institutions participating in or administering USDA programs are prohibited from discriminating based on race,
color, national origin, sex, disability, age, or reprisal or retaliation for prior civil rights activity in any program or activity conducted or funded by USDA.
Persons with disabilities who require alternative means of communication for program information (e.g. Braille, large print, audiotape, American Sign Language, etc.),
should contact the Agency (State or local) where they applied for benefits. Individuals who are deaf, hard of hearing or have speech disabilities may contact USDA
through the Federal Relay Service at (800) 877-8339. Additionally, program information may be made available in languages other than English.
To file a program complaint of discrimination, complete the USDA Program Discrimination Complaint Form, (AD-3027) found online at:
http://www.ascr.usda.gov/complaint_filing_cust.html, and at any USDA office, or write a letter addressed to USDA and provide in the letter all of the information
requested in the form. To request a copy of the complaint form, call (866) 632-9992. Submit your completed form or letter to USDA by:
(1) mail: U.S. Department of Agriculture
Office of the Assistant Secretary for Civil Rights 1400
Independence Avenue, SW
Washington, D.C. 20250-9410;
(2) fax: (202) 690-7442; or
(3) email: [email protected].
This institution is an equal opportunity provider.

2017 Free & Reduced Eligibility Report Page 1 of 27
Introduction
Free and reduced price meal eligibility data is reported by each school food authority or Supervisory Union annually. A school food
authority is a school or school district that is responsible for operating a School Lunch Program and/or a School Breakfast Program.
Some schools are included in a school food authority even though they are separate school districts. The eligibility numbers and
enrollment figures are from October of the current school year, as reported by the SFA for the 31st of October. For the purposes of the
National School Lunch Program, “eligible” means that a student has submitted an application and been certified as qualifying for free or
reduced price benefits based on the Family Size and Income Guidelines published by the United States Department of Agriculture. To
be eligible for free meals a family’s income must be at or below 130% of the Federal poverty level, the family/household receives
3SquaresVT or Reach-Up, or children are Directly Certified as free eligible. Families whose income falls between 130% and 185% of the
federal poverty level qualify for reduced price meals. Eligibility determinations are made at the local level by the food service director,
principal, or other person designated by the school administration.
The report for 2016-2017 uses the Child Nutrition Programs on-line reporting system Site Enrollment Report. The system has calculated
the information for all schools in the system participating in the school lunch program. For schools participating in the Community
Eligibility Provision their numbers of eligible students are determined by their CEP claiming percentages (percent of meals claimed at
the free rate) as instructed by USDA. There are a few public schools in Vermont that do not participate in any Child Nutrition Program
and therefore are not mentioned in this report at all. Data points indicated as "++" have had data suppressed per AOE reporting
guidelines.
How the Report is organized:
The report is organized alphabetically by Supervisory Union/SFA. The schools participating within the Supervisory Union are
listed by School name.
Column Headings
1. Supervisory Union
2. School
3. Number of students approved for free and reduced price meals
4. Enrollment in the school lunch program as of October. Note: This may be different from school enrollment because students
may be included in the lunch program even though they are not enrolled in the school.
5. Percent of students enrolled in the lunch program who are eligible for free and reduced price school meals
Statewide Average: The statewide total enrollment of students in school lunch programs is 86,311. The total number of students eligible
for free and reduced price meals is 38,034. Therefore, the statewide average eligibility is 44.07%.

2017 Free & Reduced Eligibility Report Page 2 of 27
Community Eligibility Provision Schools
The Community Eligibility Provision (CEP) allows schools to serve meals at no charge to students; schools receive the free and paid
reimbursement for meals served. Schools eligible to participate in CEP must have at least 40% of their enrolled students directly
certified. To account for the additional students who would be eligible for free or reduced price meals, the Identified Student Percentage
(percent of enrolled students directly certified) is calculated using the USDA multiplier of 1.6. The result is the percentage of meals to be
claimed at the free rate. In CEP USDA has instructed that to determine the number of students eligible, the “free” percentage is applied
to the current enrollment. The percentages listed for the CEP schools may have been determined by a single school or a group of
schools. The following is a list of schools that are participating in the Community Eligibility Provision. For more information, please
contact Laurie Colgan, Director of Child Nutrition Programs at (802) 479-1187.
Supervisory Union School Supervisory Union School
Barre Burlington
Barre City Elementary Schools
CP Smith Elementary
Orange East Orleans Central
Waits River Valley School
Albany Village School
Essential Early Education Barton Graded School
Hunt Middle School Brownington School
Integrated Arts Academy at HO Wheeler COFEC Head Start
JJ Flynn Elementary Irasburg Village School
ONTOP Orleans Central School Sustainability Academy at Barnes Orleans Southwest Lakeview Union School
Caledonia Central Caledonia North Essex Caledonia
Franklin Central Franklin Northeast
Grand Isle
Walden School
Sutton Village School
Concord School
Lunenburg & Gilman Schools
St. Albans City Elementary School
Berkshire Elementary
Enosburg Elementary
Richford Elementary
Richford High School
Alburgh Community Education Center
Isle La Motte School
Rutland City
Southwest Vermont
Wolcott Elementary School
Northeast Primary School
Northwest Primary School
Rutland Intermediate/Middle School
Bennington Elementary School
Molly Stark School
Monument Elementary
Mt. Anthony Middle School
Mt. Antony Union HS
Plus Program at Congress Street
Lamoille North Eden Central School Pownal Elementary
Laraway School North Country
Johnson Elementary
Laraway School
Brighton Elementary
Charleston Elementary
Coventry Village School Holland Elementary School
VT Achievement Center Washington Cty Mental Health Windham Southeast
Sacred Heart School
Shaftsbury Elementary School
Woodford Hollow
VT Achievement Center
Choice Academy
Academy School
Lowell School Green Street School
Newport City Elementary School Oak Grove School
Troy Elementary School Windham Southwest Readsboro Central School
Winooski Winooski School

2017 Free & Reduced Eligibility Report Page 3 of 27
Vermont Agency of Education
Child Nutrition Programs
Free and Reduced Eligibility for Fiscal Year 2017
Free and Reduced
Supervisory Union School Students Enrollment % Low Income
Addison Central SU
Bingham Memorial School 15 80 18.75%
Bridport Central School 46 73 63.01%
Mary Hogan School 207 482 42.95%
Middlebury UHS #3 135 617 26.90%
Middlebury Union Middle School 68 253 26.88%
Ripton Elementary School 22 47 46.81%
Salisbury Community School 44 103 42.72%
Shoreham Elementary School 38 80 47.50%
Weybridge Elementary School ++ 50 ++
Addison Northeast Supervisory Union
Beeman Elementary School 40 99 40.40%
Bristol Elementary School 113 252 44.84%
Lincoln Community School 32 120 26.67%
Monkton Central School 35 156 22.44%

2017 Free & Reduced Eligibility Report Page 4 of 27
Free and Reduced
Supervisory Union School Students Enrollment % Low Income
Mt. Abraham Union Middle/High School 210 646 32.51%
Robinson Elementary School 67 155 43.23%
Addison Northwest SU
Addison Central School 33 77 42.86%
Ferrisburgh Central School 57 175 32.57%
Vergennes UHSD #5 160 446 35.87%
Vergennes Union Elementary School #44 130 274 47.45%
Addison Rutland SU
Benson Village School 50 88 56.82%
Castleton Elementary School 108 248 43.55%
Castleton Village School 47 118 39.83%
Fair Haven Graded School 222 365 60.82%
Fair Haven UHS #16 178 416 42.79%
Orwell 54 140 38.57%
Barre SU
Barre City Elementary & Middle School 863 908 95.04%
Barre Town Elementary and Middle School 248 879 28.21%
2017 Free & Reduced Eligibility Report Page 5 of 27
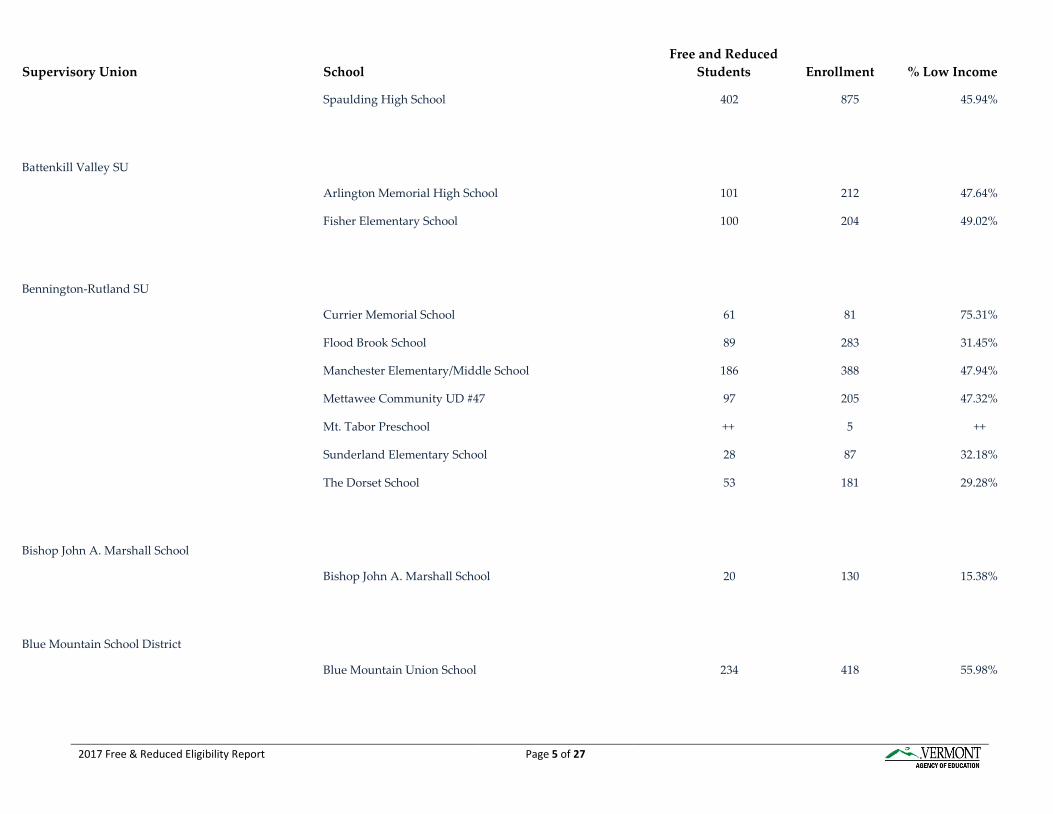
Free and Reduced
Supervisory Union School Students Enrollment % Low Income
Spaulding High School 402 875 45.94%
Battenkill Valley SU
Arlington Memorial High School 101 212 47.64%
Fisher Elementary School 100 204 49.02%
Bennington-Rutland SU
Currier Memorial School 61 81 75.31%
Flood Brook School 89 283 31.45%
Manchester Elementary/Middle School 186 388 47.94%
Mettawee Community UD #47 97 205 47.32%
Mt. Tabor Preschool ++ 5 ++
Sunderland Elementary School 28 87 32.18%
The Dorset School 53 181 29.28%
Bishop John A. Marshall School
Bishop John A. Marshall School 20 130 15.38%
Blue Mountain School District
Blue Mountain Union School 234 418 55.98%
2017 Free & Reduced Eligibility Report Page 6 of 27
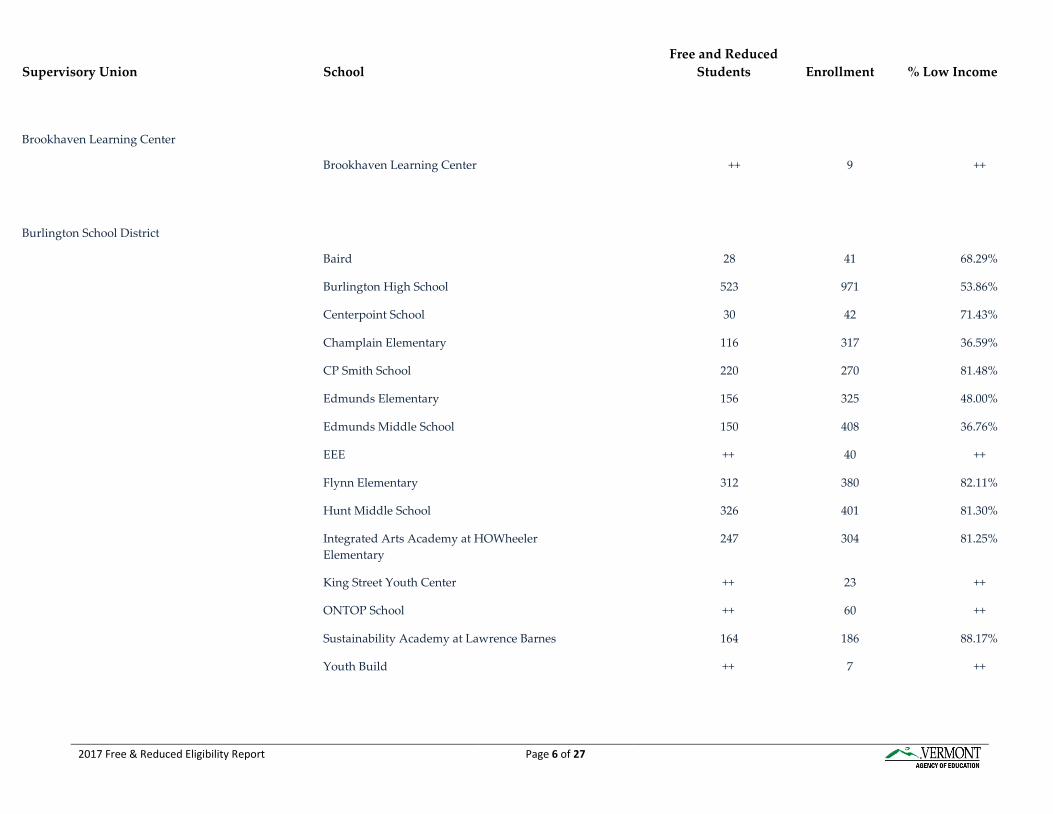
Free and Reduced
Supervisory Union School Students Enrollment % Low Income
Brookhaven Learning Center
Brookhaven Learning Center ++ 9 ++
Burlington School District
Baird 28 41 68.29%
Burlington High School 523 971 53.86%
Centerpoint School 30 42 71.43%
Champlain Elementary 116 317 36.59%
CP Smith School 220 270 81.48%
Edmunds Elementary 156 325 48.00%
Edmunds Middle School 150 408 36.76%
EEE ++ 40 ++
Flynn Elementary 312 380 82.11%
Hunt Middle School 326 401 81.30%
Integrated Arts Academy at HOWheeler 247 304 81.25%
Elementary
King Street Youth Center ++ 23 ++
ONTOP School ++ 60 ++
Sustainability Academy at Lawrence Barnes 164 186 88.17%
Youth Build ++ 7 ++

2017 Free & Reduced Eligibility Report Page 7 of 27
Free and Reduced
Supervisory Union School Students Enrollment % Low Income
Caledonia Central SU
Barnet Elementary School 90 206 43.69%
Danville School 138 366 37.70%
Peacham Elementary School 14 54 25.93%
Walden School ++ 94 ++
Caledonia North SU
Burke School 84 204 41.18%
Lyndon Town School 251 444 56.53%
Newark Street School 32 62 51.61%
Sutton Village School 76 101 75.25%
UD #37 Millers Run School 76 100 76.00%
Chittenden Central SU
Albert D. Lawton School 86 364 23.63%
Essex High School 356 1416 25.14%
Hiawatha School 52 213 24.41%
Little Ones University 44 68 64.71%
Summit School 59 201 29.35%
2017 Free & Reduced Eligibility Report Page 8 of 27
Free and Reduced
Supervisory Union School Students Enrollment % Low Income
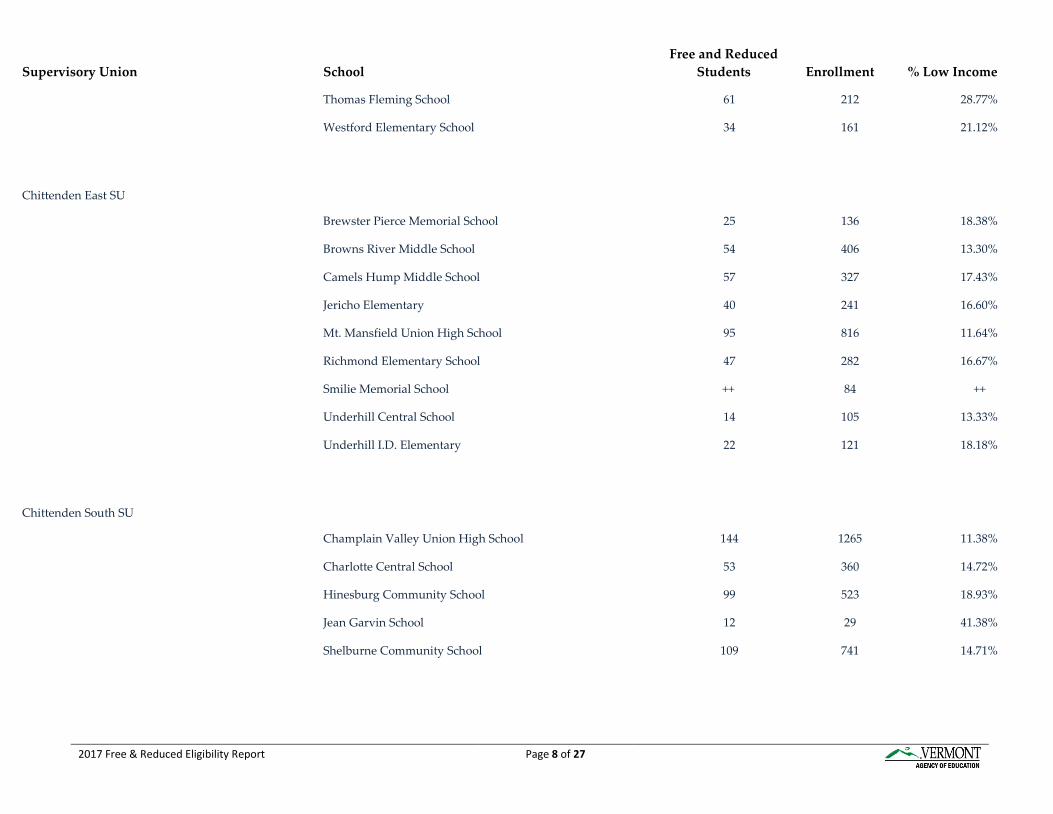
Thomas Fleming School 61 212 28.77%
Westford Elementary School 34 161 21.12%
Chittenden East SU
Brewster Pierce Memorial School 25 136 18.38%
Browns River Middle School 54 406 13.30%
Camels Hump Middle School 57 327 17.43%
Jericho Elementary 40 241 16.60%
Mt. Mansfield Union High School 95 816 11.64%
Richmond Elementary School 47 282 16.67%
Smilie Memorial School ++ 84 ++
Underhill Central School 14 105 13.33%
Underhill I.D. Elementary 22 121 18.18%
Chittenden South SU
Champlain Valley Union High School 144 1265 11.38%
Charlotte Central School 53 360 14.72%
Hinesburg Community School 99 523 18.93%
Jean Garvin School 12 29 41.38%
Shelburne Community School 109 741 14.71%

2017 Free & Reduced Eligibility Report Page 9 of 27
Free and Reduced
Supervisory Union School Students Enrollment % Low Income
Williston Schools 144 1043 13.81%
Christ the King School
Christ the King School 23 224 10.27%
Colchester Town School District
Colchester High School 138 677 20.38%
Colchester Middle School 127 454 27.97%
Malletts Bay School 202 589 34.30%
Porters Point School 78 231 33.77%
Union Memorial School 83 249 33.33%
Essex Caledonia SU
Concord School 105 130 80.77%
Gilman Middle School ++ 51 ++
Lunenburg Elementary ++ 68 ++
Waterford Town School 55 148 37.16%
Essex North SU
Canaan Schools 93 189 49.21%

2017 Free & Reduced Eligibility Report Page 10 of 27
Free and Reduced
Supervisory Union School Students Enrollment % Low Income
Essex Town School District
Essex Elementary School 104 377 27.59%
Essex Middle School 90 434 20.74%
Founders Memorial School 90 411 21.90%
Franklin Central SU
BFA St Albans 229 902 25.39%
Fairfield Center School 73 196 37.24%
Project High ++ 27 ++
Project Soar ++ 40 ++
St Albans City Elementary School 566 715 79.16%
St Albans Town Educational Center 217 686 31.63%
Franklin Northeast SU
Bakersfield Elementary School 48 135 35.56%
Berkshire Elementary School 210 226 92.92%
Enosburg Elementary School 231 248 93.15%
Enosburg Middle/High School 235 434 54.15%
Montgomery Elementary 68 147 46.26%

2017 Free & Reduced Eligibility Report Page 11 of 27
Free and Reduced
Supervisory Union School Students Enrollment % Low Income
Richford Elementary School 182 195 93.33%
Richford High School 209 225 92.89%
Franklin Northwest SU
Franklin Elementary School 43 118 36.44%
Highgate Elementary School 184 347 53.03%
Missisquoi Valley UHS 355 834 42.57%
Sheldon Elementary School 121 294 41.16%
Swanton Elementary School 268 573 46.77%
Franklin West SU
Bellows Free Academy - Fairfax 213 883 24.12%
Fletcher Elementary School 39 137 28.47%
Georgia Elementary and Middle School 123 608 20.23%
Grand Isle SU
Alburgh Community Education Center ++ 204 ++
Folsom Education & Community Center 37 135 27.41%
Grand Isle School 76 184 41.30%
Isle La Motte Elementary School ++ 28 ++
2017 Free & Reduced Eligibility Report Page 12 of 27
Free and Reduced
Supervisory Union School Students Enrollment % Low Income
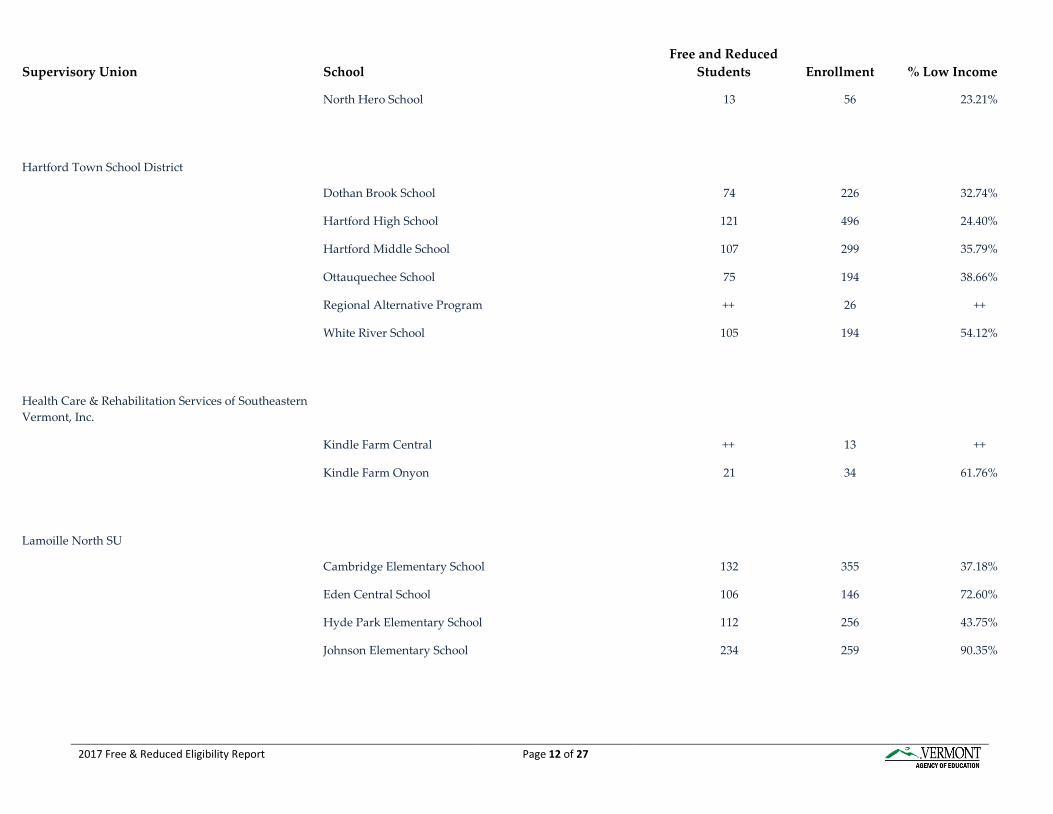
North Hero School 13 56 23.21%
Hartford Town School District
Dothan Brook School 74 226 32.74%
Hartford High School 121 496 24.40%
Hartford Middle School 107 299 35.79%
Ottauquechee School 75 194 38.66%
Regional Alternative Program ++ 26 ++
White River School 105 194 54.12%
Health Care & Rehabilitation Services of Southeastern
Vermont, Inc.
Kindle Farm Central ++ 13 ++
Kindle Farm Onyon 21 34 61.76%
Lamoille North SU
Cambridge Elementary School 132 355 37.18%
Eden Central School 106 146 72.60%
Hyde Park Elementary School 112 256 43.75%
Johnson Elementary School 234 259 90.35%

2017 Free & Reduced Eligibility Report Page 13 of 27
Free and Reduced
Supervisory Union School Students Enrollment % Low Income
Lamoille UHS #18 425 876 48.52%
Waterville Elementary School 38 95 40.00%
Lamoille South SU
Morristown Elementary School 175 319 54.86%
Peoples Academy 271 527 51.42%
Stowe Elementary School 54 348 15.52%
Stowe Middle/High School 50 447 11.19%
Laraway School, Inc.
Laraway School ++ 31 ++
Mater Christi School, Inc.
Mater Christi School 19 261 7.28%
Mill River Unified Union School District
Clarendon Elementary School 82 167 49.10%
Mill River Union High School 163 455 35.82%
Shrewsbury Elementary School 22 79 27.85%
Tinmouth Elementary School 23 52 44.23%

2017 Free & Reduced Eligibility Report Page 14 of 27
Free and Reduced
Supervisory Union School Students Enrollment % Low Income
Wallingford Elementary School 69 155 44.52%
Milton Town School District
Milton Elementary School 412 1207 34.13%
Milton High School 140 507 27.61%
Montpelier School District
Main Street Middle School 95 306 31.05%
Montpelier High School 87 311 27.97%
Union Elementary School 115 436 26.38%
New England Kurn Hattin Homes
New England Kurn Hattin Homes ++ 102 ++
North Country SU
Brighton Elementary School ++ 99 ++
Charleston Elementary School 83 110 75.45%
Coventry Village School 89 117 76.07%
Derby Elementary School 217 408 53.19%
Holland Elementary School ++ 34 ++

2017 Free & Reduced Eligibility Report Page 15 of 27
Free and Reduced
Supervisory Union School Students Enrollment % Low Income
Jay School District 38 63 60.32%
Lowell Graded School 88 107 82.24%
Newport City Elementary School 277 362 76.52%
Newport Town School 72 113 63.72%
North Country Union High School 286 720 39.72%
North Country Union Junior High School 129 261 49.43%
Troy Elementary School 165 206 80.10%
Westfield School District 16 32 50.00%
Orange East SU
Bradford Elementary School 129 244 52.87%
Newbury Elementary School 95 164 57.93%
Oxbow UHSD #30 178 379 46.97%
Thetford Elementary School 54 192 28.13%
Waits River Union #36 168 228 73.68%
Orange North SU
Orange Center School 59 97 60.82%
Washington Village School 49 103 47.57%
Williamstown Elementary School 144 254 56.69%

2017 Free & Reduced Eligibility Report Page 16 of 27
Free and Reduced
Supervisory Union School Students Enrollment % Low Income
Williamstown Middle/High School 150 301 49.83%
Orange Southwest Supervisory Union
Braintree Elementary School 51 82 62.20%
Brookfield Elementary School 25 70 35.71%
Randolph Elementary School 169 329 51.37%
Randolph Union High School 222 523 42.45%
Orleans Central SU
Albany Community School ++ 91 ++
Barton Graded School ++ 147 ++
Brownington Central School ++ 116 ++
COFEC Headstart ++ 79 ++
Glover Community School 54 116 46.55%
Irasburg Village School ++ 113 ++
Lake Region UHS 198 392 50.51%
Orleans Elementary ++ 96 ++
Orleans Southwest SU
Craftsbury Academy 61 134 45.52%

2017 Free & Reduced Eligibility Report Page 17 of 27
Free and Reduced
Supervisory Union School Students Enrollment % Low Income
Craftsbury Elementary 28 52 53.85%
Hardwick Elementary School 155 242 64.05%
Hazen Union High School 207 341 60.70%
Lakeview Union USD #43 49 75 65.33%
Wolcott Elementary School 115 143 80.42%
Woodbury Elementary School 25 50 50.00%
Rice Memorial High School
Rice Memorial High School 30 435 6.90%
Rivendell Interstate School District
Rivendell Academy 79 204 38.73%
Samuel Morey Elementary School 66 184 35.87%
Westshire Elementary 63 107 58.88%
Rutland Central SU
Proctor Elementary School 79 163 48.47%
Proctor Jr./Sr. High School 42 124 33.87%
Rutland Town School 91 343 26.53%
West Rutland School 145 341 42.52%

2017 Free & Reduced Eligibility Report Page 18 of 27
Free and Reduced
Supervisory Union School Students Enrollment % Low Income
Rutland City School District
Christ the King School 37 156 23.72%
Northeast Elementary School 211 245 86.12%
Northwest Elementary School 273 317 86.12%
Rutland Intermediate/Middle School 737 857 86.00%
Rutland Senior High School 379 1027 36.90%
Rutland Northeast SU
Barstow Unified Union School District - Barstow 58 173 33.53%
Memorial School
Otter Valley UUSD - Leicester Central School 27 53 50.94%
Otter Valley UUSD - Lothrop School 81 195 41.54%
Otter Valley UUSD - Neshobe Elementary School 205 418 49.04%
Otter Valley UUSD - Otter Valley Union High 213 532 40.04%
School
Otter Valley UUSD - Sudbury Country School ++ 36 ++
Otter Valley UUSD - Whiting School ++ 27 ++
Rutland Southwest SU
Middletown Springs Elementary School 30 61 49.18%
2017 Free & Reduced Eligibility Report Page 19 of 27
Free and Reduced
Supervisory Union Students Enrollment % Low Income
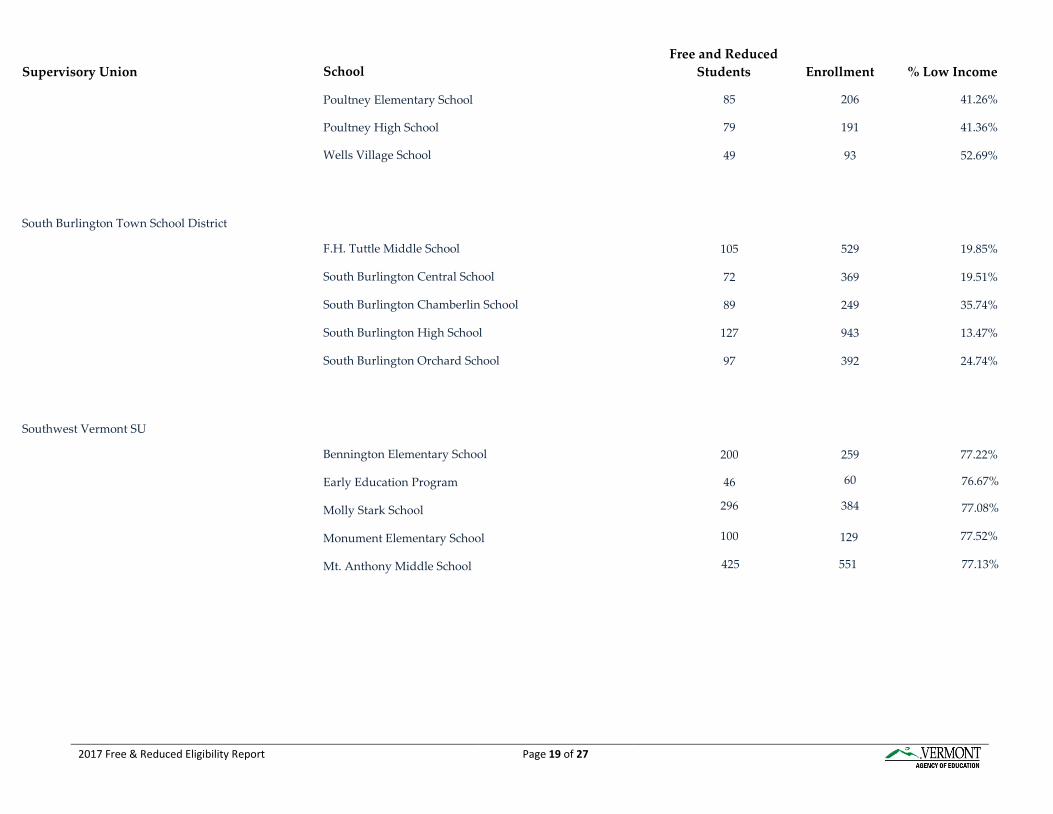
85 206 41.26%
79 191 41.36%
49 93 52.69%
South Burlington Town School District
105 529 19.85%
72 369 19.51%
89 249 35.74%
127 943 13.47%
97 392 24.74%
Southwest Vermont SU
200 259 77.22%
46 60 76.67%
296 384 77.08%
100 129 77.52%
School
Poultney Elementary School
Poultney High School
Wells Village School
F.H. Tuttle Middle School
South Burlington Central School
South Burlington Chamberlin School
South Burlington High School
South Burlington Orchard School
Bennington Elementary School
Early Education Program
Molly Stark School
Monument Elementary School
Mt. Anthony Middle School 425 551 77.13%

2017 Free & Reduced Eligibility Report Page 20 of 27
Free and Reduced
Supervisory Union Students Enrollment % Low Income
934
9
247
155
243
721
++
191
120
188
++ 22
77.19%
++
77.33%
77.42%
77.37%
++
Springfield Town School District
School
Mt. Anthony UHS #14
OnPoint Elementary at Congress St.
Pownal Elementary School
Sacred Heart School
Shaftsbury Elementary School
Woodford Hollow School
Elm Hill School 152 273 55.68%
Riverside Middle School 113 249 45.38%
Springfield High School 192 434 44.24%
Union Street School 141 287 49.13%
St Francis Xavier
St. Francis Xavier School 27 173 15.61%
St. Johnsbury Academy
St. Johnsbury Academy 268 751 35.69%

2017 Free & Reduced Eligibility Report Page 21 of 27
Free and Reduced
Supervisory Union School Students Enrollment % Low Income
St. Johnsbury Town School District
The St. Johnsbury School 395 671 58.87%
St. Paul's School
St. Paul's School 25 77 32.47%
The Compass School
The Compass School 40 73 54.79%
The Howard Center
Fay Honey Knopp Memorial School ++ 8 ++
The Village School of North Bennington
The Village School of North Bennington 50 132 37.88%
Two Rivers SU
Black River UHSD #39 66 152 43.42%
Cavendish Elementary School 61 101 60.40%
Chester-Andover USD#29 104 193 53.89%
Green Mountain UHSD #35 128 368 34.78%

2017 Free & Reduced Eligibility Report Page 22 of 27
Free and Reduced
Supervisory Union School Students Enrollment % Low Income
Ludlow Elementary 70 121 57.85%
Mt. Holly Elementary 52 107 48.60%
United Christian Academy
United Christian Academy 16 76 21.05%
Vermont Achievement Center
Vermont Achievement Center 135 148 91.22%
Vermont Permanency Initiative, Inc.
Bennington School ++ 52 ++
Washington Central SU
Berlin Elementary School 112 199 56.28%
Calais Elementary School 38 113 33.63%
Doty Memorial School 42 68 61.76%
East Montpelier Elementary 48 175 27.43%
Rumney Memorial School 40 159 25.16%
Union 32 High School 225 779 28.88%

2017 Free & Reduced Eligibility Report Page 23 of 27
Free and Reduced
Supervisory Union School Students Enrollment % Low Income
Washington County Mental Health Services Inc.
Choice Academy ++ 45 ++
Washington Northeast SU
Cabot School 92 188 48.94%
Twinfield USD #33 189 374 50.53%
Washington South SU
Northfield Elementary School 124 299 41.47%
Northfield Middle/High School 120 316 37.97%
Roxbury Village School 27 60 45.00%
Washington West SU
Crossett Brook Middle School 67 275 24.36%
Fayston Elementary School 18 111 16.22%
Harwood Union High School 167 669 24.96%
Moretown Elementary School 18 135 13.33%
Thatcher Brook Primary School 109 482 22.61%
Waitsfield Elementary School 29 140 20.71%
2017 Free & Reduced Eligibility Report Page 24 of 27
Free and Reduced
Supervisory Union School Students Enrollment % Low Income
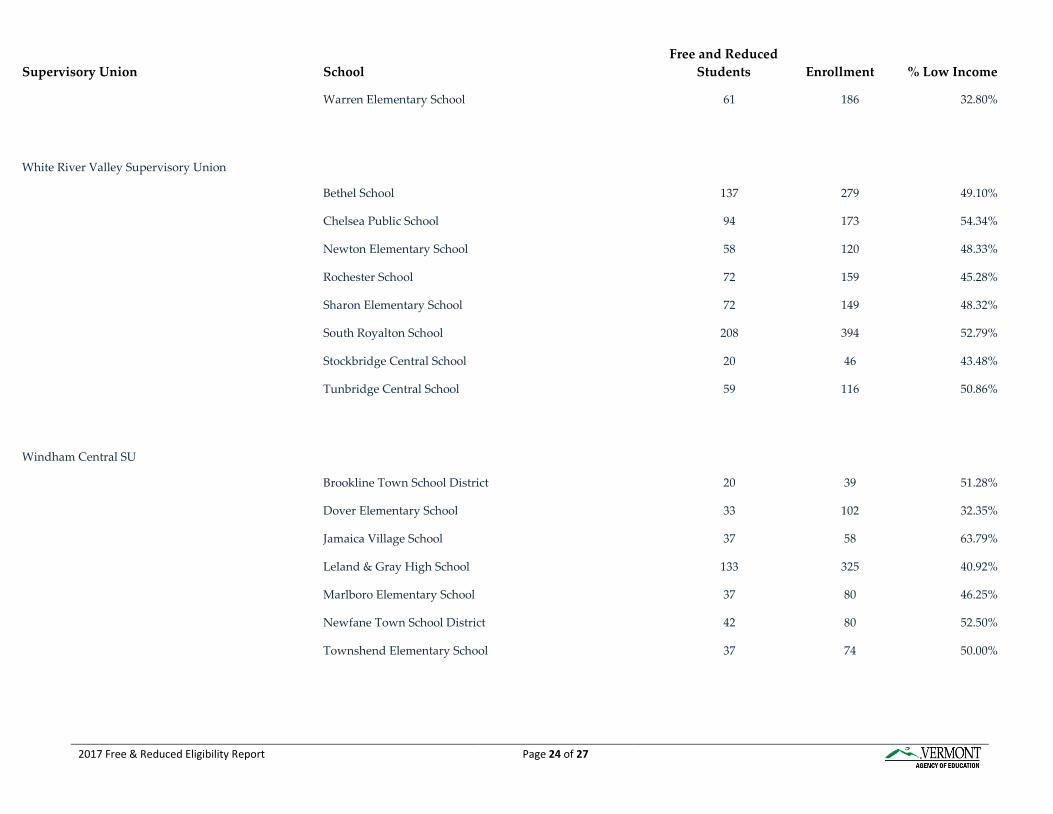
Warren Elementary School 61 186 32.80%
White River Valley Supervisory Union
Bethel School 137 279 49.10%
Chelsea Public School 94 173 54.34%
Newton Elementary School 58 120 48.33%
Rochester School 72 159 45.28%
Sharon Elementary School 72 149 48.32%
South Royalton School 208 394 52.79%
Stockbridge Central School 20 46 43.48%
Tunbridge Central School 59 116 50.86%
Windham Central SU
Brookline Town School District 20 39 51.28%
Dover Elementary School 33 102 32.35%
Jamaica Village School 37 58 63.79%
Leland & Gray High School 133 325 40.92%
Marlboro Elementary School 37 80 46.25%
Newfane Town School District 42 80 52.50%
Townshend Elementary School 37 74 50.00%

2017 Free & Reduced Eligibility Report Page 25 of 27
Free and Reduced
Supervisory Union School Students Enrollment % Low Income
Wardsboro Central School 20 51 39.22%
Windham Northeast SU
Athens Grafton School 52 91 57.14%
Bellows Falls Middle School 131 261 50.19%
Bellows Falls UHS#27 146 330 44.24%
Central Elementary School 106 159 66.67%
Saxtons River Elementary 45 99 45.45%
Westminster Center School 86 168 51.19%
Westminster West School ++ 20 ++
Windham Southeast SU
Academy School 277 342 80.99%
Brattleboro UHS #6 435 1117 38.94%
Dummerston School 49 149 32.89%
Green Street School 182 224 81.25%
Guilford Central School 43 97 44.33%
Oak Grove School 98 121 80.99%
Putney Central School 94 163 57.67%
Saint Michaels School 48 124 38.71%

2017 Free & Reduced Eligibility Report Page 26 of 27
Free and Reduced
Supervisory Union School Students Enrollment % Low Income
Vernon Elementary School 64 168 38.10%
Windham Southwest SU
Halifax School 29 52 55.77%
Readsboro Central School ++ 49 ++
Stamford Elementary School 13 72 18.06%
Twin Valley Elementary School - Whitingham 56 89 62.92%
Twin Valley Elementary School - Wilmington 70 109 64.22%
Twin Valley Middle High School - Whitingham 48 99 48.48%
Twin Valley Middle High School - Wilmington 63 131 48.09%
Windsor Central SU
Barnard Central School ++ 70 ++
Killington Elementary School 30 83 36.14%
Prosper Valley - Bridgewater 17 34 50.00%
Prosper Valley – Pomfret ++ 50 ++
Reading Elementary School 21 56 37.50%
Woodstock Elementary School 50 161 31.06%
Woodstock Union Middle/High School 90 505 17.82%
2017 Free & Reduced Eligibility Report Page 27 of 27
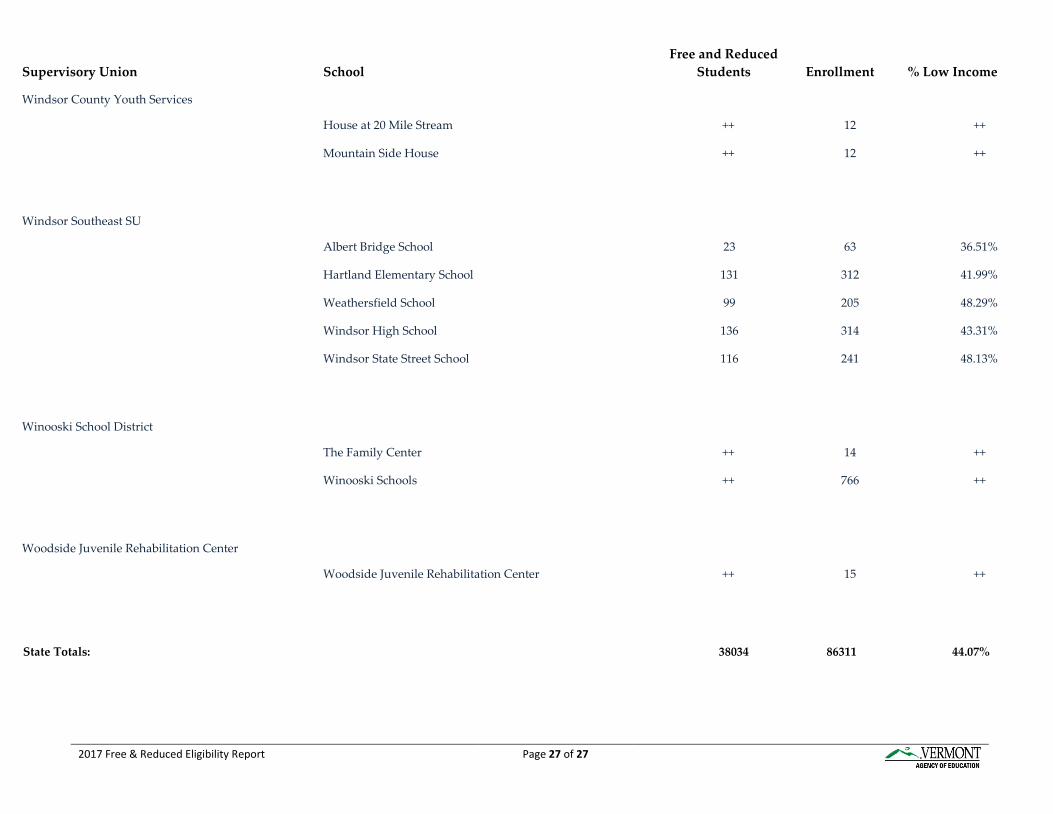
Free and Reduced
Supervisory Union School Students Enrollment % Low Income
Windsor County Youth Services
House at 20 Mile Stream ++ 12 ++
Mountain Side House ++ 12 ++
Windsor Southeast SU
Albert Bridge School 23 63 36.51%
Hartland Elementary School 131 312 41.99%
Weathersfield School 99 205 48.29%
Windsor High School 136 314 43.31%
Windsor State Street School 116 241 48.13%
Winooski School District
The Family Center ++ 14 ++
Winooski Schools ++ 766 ++
Woodside Juvenile Rehabilitation Center
Woodside Juvenile Rehabilitation Center ++ 15 ++
State Totals: 38034 86311 44.07%