vermont agency of transportation research and …
TRANSCRIPT
VERMONT AGENCY OF TRANSPORTATION
Research and Development Section
Research Report
EVALUATION OF BLINKERSIGN®
CROSSWALK LIGHTING SYSTEM
Report 2014 – 13
December 2014

Evaluation of BlinkerSign®
Crosswalk Lighting System
Final Report
Report 2014 – 13
December, 2014
Reporting on Work Plan 2005-R-3
STATE OF VERMONT
AGENCY OF TRANSPORTATION
RESEARCH & DEVELOPMENT SECTION
BRIAN R. SEARLES, SECRETARY OF TRANSPORTATION
CHRIS COLE, DIRECTOR OF POLICY, PLANNING AND INTERMODAL DEVELOPMENT
JOE SEGALE, P.E./PTP, PLANNING, POLICY & RESEARCH
WILLIAM E. AHEARN, P.E., RESEARCH & DEVELOPMENT
Prepared By: Wendy Ellis, Research Technician V
Jason P. Tremblay, M.S., P.E., Research Engineer
Reviewed By:
William E. Ahearn, P.E.,
Research Managing Engineer
Date: December 9, 2014

II
The information contained in this report was compiled for the use of the Vermont Agency
of Transportation (VTrans). Conclusions and recommendations contained herein are based upon
the research data obtained and the expertise of the researchers, and are not necessarily to be
construed as Agency policy. This report does not constitute a standard, specification, or
regulation. VTrans assumes no liability for its contents or the use thereof.

III
Technical Report Documentation Page
1. Report No. 2. Government Accession No. 3. Recipient's Catalog No.
2014-13 - - - - - - 4. Title and Subtitle 5. Report Date
Evaluation of BlinkerSign® Crosswalk Lighting System, Final Report
December, 2014 6. Performing Organization Code
7. Author(s) 8. Performing Organization Report No.
Wendy Ellis Jason P. Tremblay, M.S., P.E. 2014-13
9. Performing Organization Name and Address 10. Work Unit No.
Vermont Agency of Transportation Materials and Research Section 1 National Life Drive National Life Building Montpelier, VT 05633-5001
11. Contract or Grant No.
2005-R-03
12. Sponsoring Agency Name and Address 13. Type of Report and Period Covered
Federal Highway Administration Division Office Federal Building Montpelier, VT 05602
14. Sponsoring Agency Code
15. Supplementary Notes
16. Abstract
Concerning pedestrian safety, the Vermont Agency of Transportation (VTrans) is constantly searching for
ways to improve areas where large volumes of people and heavy vehicular traffic may come in direct conflict
with one another. In an effort to address this matter, VTrans installed BlinkerSigns®, produced by Tapco, in
November 2008 to enhance the visual delineation limits of a preexisting crosswalk adjacent to the Quechee
Gorge Visitor Center in Hartford, Vermont. The signs incorporate Day-Viz™ LEDs and 3M™ VIP Diamond
Grade™ sheeting giving drivers notice much further in advance than conventional signs.
After analyzing the results from the speed studies, the BlinkerSigns® have proven more effective, and
therefore safer, than having no system in place. Four years following installation of the BlinkerSigns®,
yielding compliance has increased by 8% on average, and a 20% increase was found in the number of vehicles slowing down as they approach within 300 feet of the crosswalk. From these findings, it has been determined that the BlinkerSigns
® have provided long-term benefits. The product should be considered at
future crosswalks and emergency crossings on Vermont Agency of Transportation projects where increased visibility is warranted. Other recommended applications are crossings that are not well lit, locations of high pedestrian crossings and at critical crossings in urban areas where significant automotive and pedestrian traffic conflicts occur.
17. Key Words 18. Distribution Statement
Pedestrian Hybrid Beacon High-Intensity Activated Crosswalk Beacon
No Restrictions.
19. Security Classif. (of this report) 20. Security Classif. (of this page) 21. No. Pages 22. Price
- - - - - - - - -
Form DOT F1700.7 (8-72) Reproduction of completed pages authorized

IV
TABLE OF CONTENTS
Abstract ........................................................................................................................................... 1
Introduction ..................................................................................................................................... 2
Project Location and Summary ....................................................................................................... 3
Product Description and Installation ............................................................................................... 4
Performance and Observations ....................................................................................................... 5
Summary and Recommendations ................................................................................................. 15
References ..................................................................................................................................... 16
Experimental Feature Workplan ................................................................................................... 17

- 1 -
ABSTRACT
Concerning pedestrian safety, the Vermont Agency of Transportation (VTrans) is
constantly searching for ways to improve areas where large volumes of people and heavy
vehicular traffic may come in direct conflict with one another. In an effort to address this matter,
VTrans installed BlinkerSigns®, produced by Tapco, in November 2008 to enhance the visual
delineation limits of a preexisting crosswalk adjacent to the Quechee Gorge Visitor Center in
Hartford, Vermont. The signs incorporate Day-Viz™ LEDs and 3M™ VIP Diamond Grade™
sheeting giving drivers notice much further in advance than conventional signs.
After analyzing the results from the speed studies, the BlinkerSigns® have proven more
effective, and therefore safer, than having no system in place. Four years following installation
of the BlinkerSigns®, yielding compliance has increased by 8% on average, and a 20% increase
was found in the number of vehicles slowing down as they approach within 300 feet of the
crosswalk. From these findings, it has been determined that the BlinkerSigns®
have provided
long-term benefits. The product should be considered at future crosswalks and emergency
crossings on Vermont Agency of Transportation projects where increased visibility is warranted.
Other recommended applications are crossings that are not well lit, locations of high pedestrian
crossings and at critical crossings in urban areas where significant automotive and pedestrian
traffic conflicts occur.
- 2 -
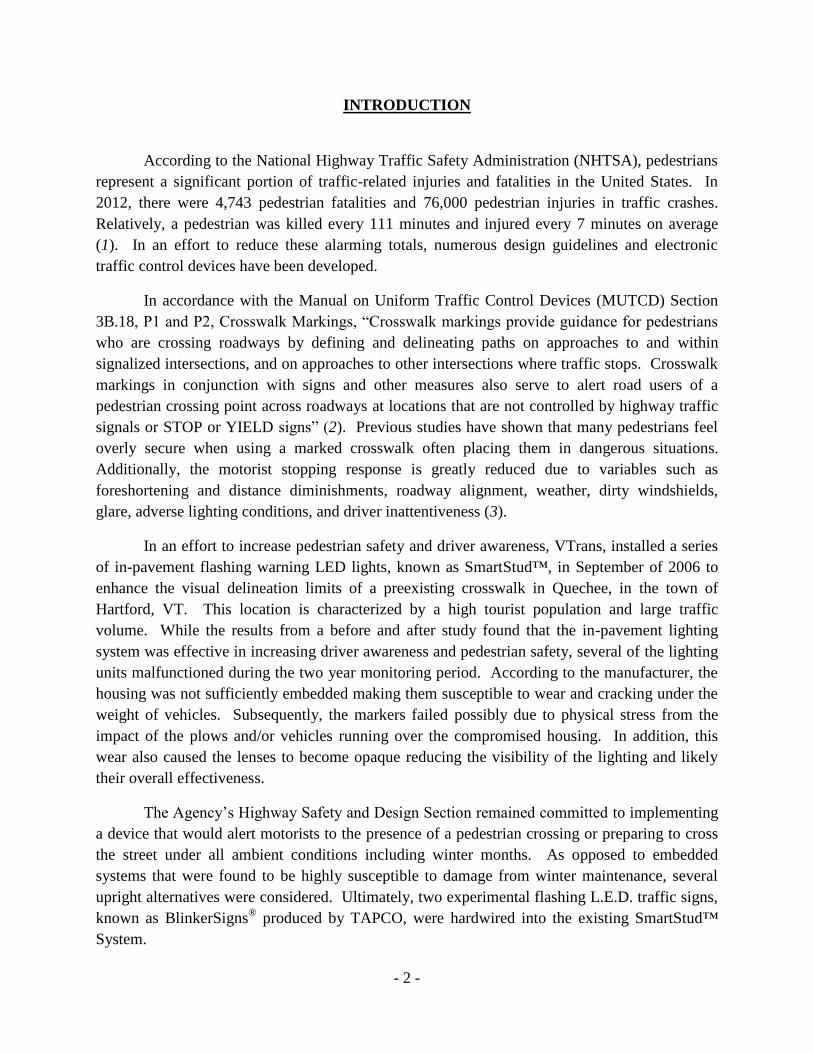
INTRODUCTION
According to the National Highway Traffic Safety Administration (NHTSA), pedestrians
represent a significant portion of traffic-related injuries and fatalities in the United States. In
2012, there were 4,743 pedestrian fatalities and 76,000 pedestrian injuries in traffic crashes.
Relatively, a pedestrian was killed every 111 minutes and injured every 7 minutes on average
(1). In an effort to reduce these alarming totals, numerous design guidelines and electronic
traffic control devices have been developed.
In accordance with the Manual on Uniform Traffic Control Devices (MUTCD) Section
3B.18, P1 and P2, Crosswalk Markings, “Crosswalk markings provide guidance for pedestrians
who are crossing roadways by defining and delineating paths on approaches to and within
signalized intersections, and on approaches to other intersections where traffic stops. Crosswalk
markings in conjunction with signs and other measures also serve to alert road users of a
pedestrian crossing point across roadways at locations that are not controlled by highway traffic
signals or STOP or YIELD signs” (2). Previous studies have shown that many pedestrians feel
overly secure when using a marked crosswalk often placing them in dangerous situations.
Additionally, the motorist stopping response is greatly reduced due to variables such as
foreshortening and distance diminishments, roadway alignment, weather, dirty windshields,
glare, adverse lighting conditions, and driver inattentiveness (3).
In an effort to increase pedestrian safety and driver awareness, VTrans, installed a series
of in-pavement flashing warning LED lights, known as SmartStud™, in September of 2006 to
enhance the visual delineation limits of a preexisting crosswalk in Quechee, in the town of
Hartford, VT. This location is characterized by a high tourist population and large traffic
volume. While the results from a before and after study found that the in-pavement lighting
system was effective in increasing driver awareness and pedestrian safety, several of the lighting
units malfunctioned during the two year monitoring period. According to the manufacturer, the
housing was not sufficiently embedded making them susceptible to wear and cracking under the
weight of vehicles. Subsequently, the markers failed possibly due to physical stress from the
impact of the plows and/or vehicles running over the compromised housing. In addition, this
wear also caused the lenses to become opaque reducing the visibility of the lighting and likely
their overall effectiveness.
The Agency’s Highway Safety and Design Section remained committed to implementing
a device that would alert motorists to the presence of a pedestrian crossing or preparing to cross
the street under all ambient conditions including winter months. As opposed to embedded
systems that were found to be highly susceptible to damage from winter maintenance, several
upright alternatives were considered. Ultimately, two experimental flashing L.E.D. traffic signs,
known as BlinkerSigns®
produced by TAPCO, were hardwired into the existing SmartStud™
System.

- 3 -
The purpose of this final report is to examine and evaluate the overall effectiveness of the
replacement BlinkerSign® system.
PROJECT LOCATION AND SUMMARY
In accordance with the Experimental Feature workplan, WP 2005-R-3, the enhanced
safety features were installed along US Route 4 at approximately MM 3.4 in the town of
Hartford, near the Quechee Gorge Visitors Center. This area is characterized by a heavily
travelled roadway consisting of local residents and tourists. The average annual daily traffic
(AADT), on this two-lane roadway, is 12,500, a moderately high AADT for the State of
Vermont. Although the posted speed limit is 35 miles per hour (mph), visual observations
indicate that many motorists travel above this speed.
Figure 1 Speed Limit Diagram.
The roadway is relatively flat with limited horizontal curve alignments. It is suspected
that the observed increase in speed may be caused by unfamiliarity with the area as much of the
demographic is composed of tourists (3).
The original enhanced warning system, Smart Stud In-Pavement Crosswalk Lighting
System was installed in conjunction with the Quechee Gorge Visitor Center Project, Hartford
PLH QGSP (2). This enhancement project included the construction of a new Visitor’s Center

- 4 -
and parking lot. Together, the improvements were supposed to enhance safe passage from the
Visitor’s Center to key vantage points of the gorge. Due to poor performance, the Smart Stud
system was replaced with the BlinkerSigns® (see Report 2011-03).
PRODUCT DESCRIPTION AND INSTALLATION
BlinkerSigns®, manufactured by TAPCO of Elm Grove, Wisconsin, are enhanced traffic
signs with Light Emitting Diodes (LED) around portions of the sign border meeting the
requirements of the MUTCD Section 2A.07, “Retroreflectivity and Illumination.” According to
TAPCO, a feature entitled “Day-Viz™” features an array of incredibly bright LEDs that flash in
unison, once per second. BlinkerSigns® may be programmed to operate continuously or on solar
time clocks, push-buttons, and/or motion detectors. The signs may be integrated into an
intelligent transportation system (ITS) and programmed to flash simultaneously. In addition, the
BlinkerSigns® can operate on either solar power or hard wired into an electrical system. TAPCO
utilizes 3M™ Diamond Grade™ sheeting, a highly reflective sheeting and asserts that the signs
can be seen up to two miles away (4).
Prior to installation, Rich Lolli from TAPCO, Russ Velander, the VTrans’ Traffic Shop
Supervisor, and Research personnel conducted an equipment evaluation site visit to ensure that
the existing 110-volt hard wired power supply and buried cable system that was in place for the
existing SmartStud™ system could be utilized to operate the BlinkerSigns®. TAPCO was able
to customize the control board on each BlinkerSign® to work with the existing SmartStud™
controller box and existing onsite equipment including the SmartPed™, SmartCabinet™ and
SmartButton™.
Due to the configuration of the power supply loop, the signs were installed on the same
side of the crosswalk by VTrans’ Traffic Shop personnel. The first attempt to install the signs
was on Wednesday, October 29, 2008. However due to an incorrect control board configuration,
new signs needed to be shipped out. The new signs were installed on Monday, November 3,
2008. Traffic Shop personnel commented that the system was relatively easy to install with
minimal setbacks due to the existing hard-wired system. On Tuesday, November 4, 2008,
District 4 and Research personnel removed the SmartStud™ LEDs from the ground and the
holes were filled with cold patch.

- 5 -
PERFORMANCE AND OBSERVATIONS
Two site visits were conducted soon after installation, on Tuesday January 6, 2009 and
Monday, August 2, 2010 to evaluate the condition of the BlinkerSign®
system and visually
assess the brightness of the LEDs. During the first site visit, the BlinkerSigns® were examined
during daylight, dusk, and nighttime hours whereas the second visit was conducted solely during
daylight hours. The signs appeared to be extremely visible under all light conditions especially
during evening hours as shown in Figures 2 and 3, and were in excellent condition during both
visits with no visible wear to the sign face or LED border. According to the District 4
maintenance crew and Traffic Shop personnel, no maintenance was performed in the first 18-
month period after installation. Subsequently, the traffic shop has been onsite twice to fix
electrical issues that presented themselves, rendering one of the signs non-functioning. One
issue was a broken wire that was found and fixed and the second was a water (from rain) leak in
one of the units that was repaired. Upkeep on winter maintenance around the signs has also been
an issue during a few winter seasons since their installation. During winter storms, the stepping
pads that can activate the system (in addition to the push button) can become covered with snow
and ice. This causes the system to become disabled as the pads are constantly pushed by the
applied weight. This has since been remedied with continued and targeted clearing during winter
months.
Figure 2 BlinkerSign® during daylight hours.

- 6 -
Figure 3 BlinkerSign® during nighttime hours.
Pedestrian Study Overview
This pedestrian crossing study was modeled after an evaluation completed by the City of
San Rafael, CA. The study assessed changes in driver behavior attributed to a crosswalk
enhancement system. “Before” and “after” studies evaluated differences in vehicle behavior pre-
and post-installation of the BlinkerSign® System. Each study incorporated a Vermont Agency of
Transportation member dressed in typical pedestrian clothing with two crossing scenarios. In
scenario 1, the decoy pedestrian provided the impression that they were about to step in the
crosswalk by looking in both directions. In scenario 2, the decoy pedestrian looked in both
directions and placed one foot into the crosswalk, as shown in Figure 4. Oncoming traffic was
visually monitored during these events in order to assess driver behavior. Each scenario was
completed 200 times (100 times per lane direction).
The “before” study took place two months prior to the SmartStud™ System installation
on Monday, July 18, 2005. The first BlinkerSign® System “after” evaluation was carried out
about 7 ½ months after installation on Wednesday, June 24, 2009 by Jon Kaplan, the Agency’s
Bicycle and Pedestrian Program Manager, and Research personnel, and the final study on August
6, 2012, 45 months after installation. Although efforts were made to minimize as many variables

- 7 -
as possible, the decoy pedestrian used in the “before” and “after” SmartStud™ evaluations was
not available so a different Agency member was chosen. Weather conditions during all studies
were comparable.
Figure 4 Looking and stepping crossing scenario, pre HAWK installation.
Methodology was parallel in both studies. The first task was to delineate observation
stations. This was done with painted stakes, marked out within a 500-foot stretch from the
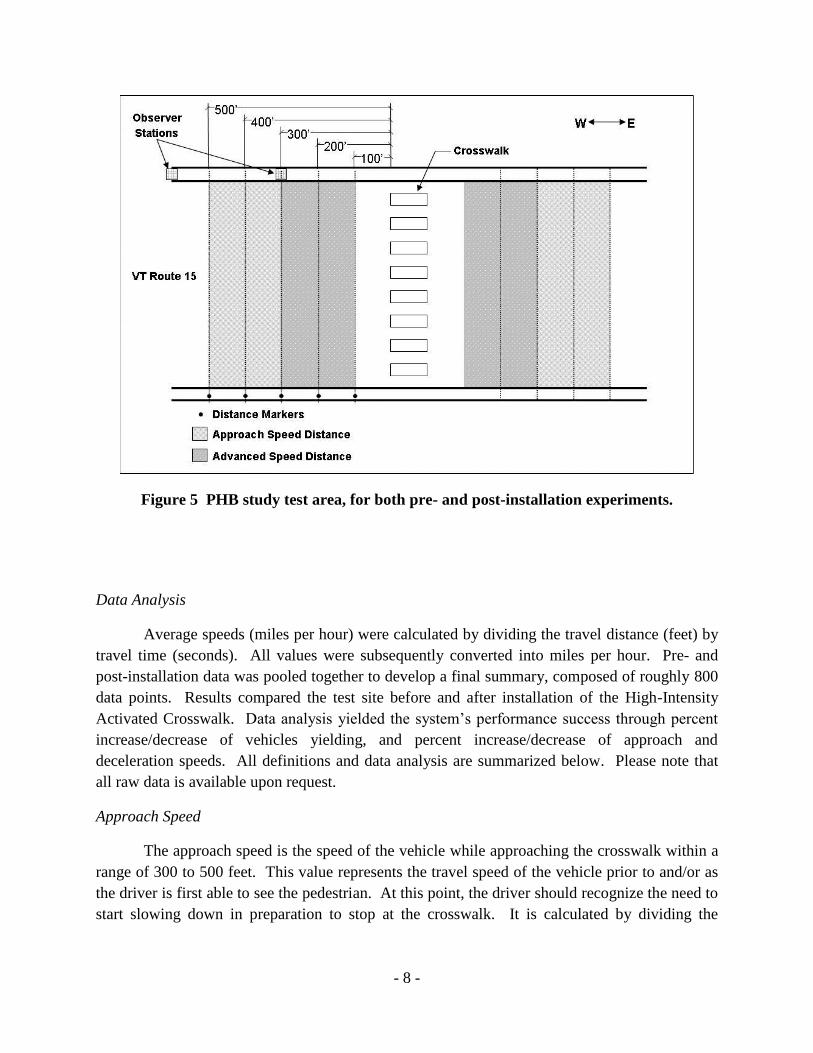
crosswalk in both the east and westbound directions. Observation stations are shown in Figure 5,
which details the test area. After stations were set, the decoy pedestrian carried out the two
crossing scenarios for both traffic directions. During this time, agency workers were taking
observations 500 and 300 feet back from the crosswalk. All non-crossing Agency personnel
were inconspicuously stationed along the side of the roadway to avoid drawing attention from
the passersby.
Numerical data was collected using a stopwatch. The time in seconds for the leading car
to travel from the 500’- 300’ from the crosswalk was recorded. This data was used to calculate
the leading car’s approach speed, in mph. The deceleration speed was calculated similarly, using
the time to travel from the stakes marked off at 300 and 100 feet. Additional observations
included the vehicle’s first braking distance, its compliance to the crosswalk system, and state of
licensure.
- 8 -
Figure 5 PHB study test area, for both pre- and post-installation experiments.
Data Analysis
Average speeds (miles per hour) were calculated by dividing the travel distance (feet) by
travel time (seconds). All values were subsequently converted into miles per hour. Pre- and
post-installation data was pooled together to develop a final summary, composed of roughly 800
data points. Results compared the test site before and after installation of the High-Intensity
Activated Crosswalk. Data analysis yielded the system’s performance success through percent
increase/decrease of vehicles yielding, and percent increase/decrease of approach and
deceleration speeds. All definitions and data analysis are summarized below. Please note that
all raw data is available upon request.
Approach Speed
The approach speed is the speed of the vehicle while approaching the crosswalk within a
range of 300 to 500 feet. This value represents the travel speed of the vehicle prior to and/or as
the driver is first able to see the pedestrian. At this point, the driver should recognize the need to
start slowing down in preparation to stop at the crosswalk. It is calculated by dividing the

- 9 -
distance travelled, (300 to 500 feet = 200 feet) by the time in seconds, it took the vehicle to travel
the distance.
A graphical representation for the system exhibiting the average approach speeds for both
east and westbound travel directions are showing below in
Figure 6. It should be noted that this figure includes speeds of all vehicles whether they
yielded to the decoy pedestrian or not. A breakdown of each scenario for the two directions is
provided later in the report. The data shows that, on average, vehicles approach the crosswalk at
a faster speed from the west than they do from the east, regardless of what system is in place.
Approach speeds decreased by one mile per hour with the addition of the BlinkerSigns®,
however after an additional three years approach speeds actually increased by 2 mph over no
system at all, indicating that drivers may now be driving faster in general through this tourist
area.
0
5
10
15
20
25
30
35
40
WB Look WB L&S EB Look EB L&S
Ave
rage
Sp
ee
d (
mp
h)
Crossing Scenario
No System Blinkersign, 1 year Blinkersign, 4 years

- 10 -
Figure 6 Average approach speeds.
Table 1 Average approach speeds (mph) and associated standard deviations.
System WB Look only WB Look and Step EB Look Only EB Look and Step
Average Std Dev Average Std Dev Average Std Dev Average Std Dev
None 36 7.9 35 6.0 33 5.6 32 6.5
BS, Year 1 35 6.1 34 5.0 32 5.5 31 4.1
BS, Year 4 38 5.8 37 7.2 34 6.1 35 5.6
The standard deviation for all systems in both directions and crossing scenarios are
comparable and reasonable as to suggest a small amount of variability within the data sets or in
this case driver response. During the latest study, the average speeds are below (eastbound) or
slightly above (westbound) the posted speed limit, the standard deviations imply that some
0
5
10
15
20
25
30
35
40
WB Look WB L&S EB Look EB L&S
Ave
rage
Sp
ee
d (
mp
h)
Crossing Scenario
No System Blinkersign, 1 year Blinkersign, 4 years

- 11 -
portion of the study population is traveling well above the speed limit of 35 mph assuming
normal distribution. This evidence supports the need for an advanced warning system.
Deceleration Speed
The deceleration speed is the speed of the vehicle within the distance of 100 to 300 feet
in advance of the crosswalk. This value represents the average speed that vehicles travel over
the 200-foot distance. It is calculated by dividing the distance traveled, (100 to 300 feet = 200
feet) by the time, in seconds, it took the vehicle to travel that distance. This speed should reflect,
when compared to the vehicle’s approach speed, whether or not it has begun to slow down once
recognizing the pedestrian or signal being activated.
A graphical representation exhibiting the average deceleration speeds for both east and
westbound travel directions are shown in Figure 7. It should be noted that the figure includes
speeds of all vehicles whether they yielded to the decoy pedestrian or not. Averages and
associated standard deviation results are shown in Table 2.
The standard deviation for all systems in both directions and crossing scenarios are
comparable based on the average speed results. Once again, standard deviations are relatively
small indicating consistent driver behavior.

- 12 -
Figure 7 Average deceleration speeds.
Table 2 Average deceleration speeds (mph) and associated standard deviations.
System WB Look only WB Look and Step EB Look Only EB Look and Step
Average Std Dev Average Std Dev Average Std Dev Average Std Dev
None 31 6.7 29 6.9 29 5.8 31 5.9
BS, Year 1 28 8.7 25 5.7 35 7.1 33 6.7
BS, Year 4 27 4.8 27 5.9 28 6.2 27 4.6
Approach and Deceleration Speed Comparison
Approach and deceleration speeds hold an interesting comparison. In theory, it could be
expected that average approach speeds would be greater than average deceleration speeds, as at
least some portion of the population would slow down for a pedestrian in a crossing scenario.
This held true for each scenario of the no-system and the BlinkerSign® year 4 studies and the
0
5
10
15
20
25
30
35
40
WB Look WB L&S EB Look EB L&S
Ave
rage
Sp
ee
d (
mp
h)
Crossing Scenario
No SystemBlinkersign, 1 yearBlinkersign, 4 years

- 13 -
westbound year 1 study. Counter to all other scenarios, the data shows that the average vehicle
sped up by more than 2 mph as they approached the activated signs and crosswalk in the two
eastbound scenarios for the year 1 study. The data did not coincide well with field observations
that suggested automobiles appeared to be slowing as they were in the other approach. One
possible reason for the higher speed calculations was a benchmark used to time the automobile
traverse was incorrect.
Changes in approach versus deceleration speeds are presented in Table 3. With no
system in place the average vehicle decelerated by 4 mph once they had the opportunity to
observe that a pedestrian was preparing to cross at the crosswalk. Once the BlinkerSigns® had
been in place for about one year, the speed decrease actually went down to slightly less than 3
mph, but this includes the data discrepancy previously noted; if only the westbound lanes were
represented, the average speed decrease was 8 mph, a large increase from no-system.
Table 3. Average speeds through both directions and crossing scenarios.
With No System BlinkerSigns® Year 1 BlinkerSigns
® Year 4
Approach Speed 34.2 32.8 36.0
Deceleration Speed 30.2 30.1 27.1
Traditionally it may be expected that once a safety measure has been installed for a
number of years drivers could become complacent with it and begin ignoring or disregarding it
more out of habit. This would lead to statistics returning closer to their pre-system state. This
was not the case at the four year pedestrian study as the speed decrease approached 9 mph once
the BlinkerSigns® were activated, a very substantial decrease in speed. This indicates the
BlinkerSigns® are still performing as desired.
A graphical comparison of the difference between approach and deceleration speeds is
shown in Figure 8 and 9. Figure 8 plots approach speed (x-axis) and deceleration speeds (y-axis)
couplets on a scatter plot for the no-system pedestrian study, while Figure 9 shows them for the
BlinkerSign® year 4 study. The diagonal lines in each figure represent approach speeds equaling
deceleration speeds. The more data points that are present below the line, the more vehicles
slowed down during the studies. It is evident from the plots that the data shifts below the line in
general with the BlinkerSigns® installed, indicating many more drivers slowed down when the
system was activated than previously had with the pedestrian only as the visual key. The data
shows that 71% slowed down with no system (a very respectable number when compared to data
found from other locations and studies) while that number increased to 91% with the system and
year 4.

- 14 -
Figure 8. Deceleration vs. approach speed with no system.
Figure 9. Deceleration vs. approach speed ~4 years after BlinkerSigns installed.
15
20
25
30
35
40
45
50
55
60
15 20 25 30 35 40 45 50 55 60
De
cele
rati
on
Sp
ee
d (
mp
h)
Approach Speed (mph)
15
20
25
30
35
40
45
50
55
60
15 20 25 30 35 40 45 50 55 60
De
cele
rati
on
Sp
ee
d (
mp
h)
Approach Speed (mph)

- 15 -
Yielding Compliance
Yielding compliance is the percentage of vehicles approaching the crosswalk during the
staged experiment that yielded or stopped for the pedestrian. Table 4 shows the percentage of
vehicles that yielded for the staged pedestrian during each crossing scenario for both lane
directions.
Table 4. Vehicle yielding compliance.
Direction
No System BlinkerSign
®
Year 1
BlinkerSign®
Year 4
% Vehicles
Yielding
% Vehicles
Yielding
% Vehicles
Yielding
Looking Only
EB 78 65 62
WB 31 78 52
Looking and Stepping
EB 63 88 74
WB 54 88 66
Overall Average
Overall 56 80 64
For example, there was a 31% yielding compliance rate before any system was installed,
in the looking only scenario for the westbound direction. One year after the installation of the
BlinkerSigns, the amount of cars stopping rose to 78% of the westbound vehicles, and then
dropped again to 52% at year 4. Overall, the percentage of traffic that yielded to pedestrians
increased following the installation of the pedestrian hybrid beacon crosswalk system. When no
system was in place 56% of the overall traffic yielded, compared to 80% compliance with the
activated system at year one, then fell somewhat to 64% at year 4. The overall percentages are
comprised of both directions and crossing scenarios. Of the two scenarios, it is interesting to
note the considerable increase in driver compliance when the decoy pedestrian acts as if they are
crossing the road by beginning to step out into the crosswalk. This indicates that a subset of the
population only complies with crosswalks and crosswalk systems when they feel compelled to
avoid hitting a pedestrian.

- 16 -
SUMMARY AND RECOMMENDATIONS
After analyzing the results from the speed studies, the BlinkerSign® system has proven
more effective, and therefore safer, than having no system in place. Following installation of the
signs, yielding compliance increased by 14% on average, and remained 8% higher after 4 years.
In addition, lower speeds have been shown from vehicles as they near the crosswalk. There have
been no documented complaints from vehicular or pedestrian traffic. The system will continue
to be examined for any visible damage, complaints and vehicular or pedestrian accidents in the
future to ensure its advantages. Further deployment should be considered at high pedestrian
count unsignalized intersections or crosswalks.

- 17 -
REFERENCES
1. National Highway Traffic Safety Administration. “Traffic Safety Fact Sheet, 2012 Data,
Pedestrians.” DOT‐HS 811888.
2. Federal Highway Administration. “Crosswalk Markings.” Manual on Uniform Traffic
Control Devices. Section 3B.17, Page 3B-27. 2003.
3. Arizona Department of Transportation. “Pedestrian Crosswalks – How Safe are
They?” 11-27-2006. http://www.mesaaz.gov/transportation/Pedestrian_Crosswalks.aspx.
4. Traffic & Parking Control Co., Inc. “BlinkerSign®
Flashing L.E.D. Signs.” TAPCO
– Traffic & Parking Control Co., Inc. Traffic Control Products. pp 2-9.

- 18 -
EXPERIMENTAL FEATURE WORKPLAN
- 19 -
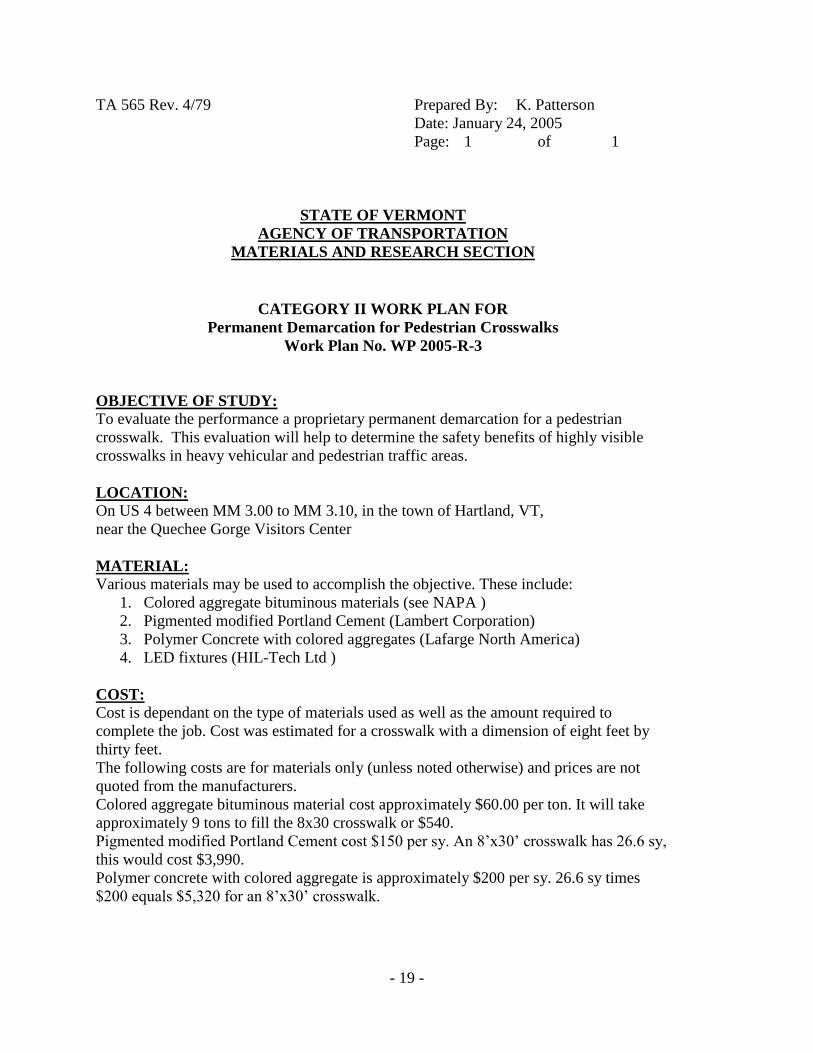
TA 565 Rev. 4/79 Prepared By: K. Patterson
Date: January 24, 2005
Page: 1 of 1
STATE OF VERMONT
AGENCY OF TRANSPORTATION
MATERIALS AND RESEARCH SECTION
CATEGORY II WORK PLAN FOR
Permanent Demarcation for Pedestrian Crosswalks
Work Plan No. WP 2005-R-3
OBJECTIVE OF STUDY: To evaluate the performance a proprietary permanent demarcation for a pedestrian
crosswalk. This evaluation will help to determine the safety benefits of highly visible
crosswalks in heavy vehicular and pedestrian traffic areas.
LOCATION: On US 4 between MM 3.00 to MM 3.10, in the town of Hartland, VT,
near the Quechee Gorge Visitors Center
MATERIAL: Various materials may be used to accomplish the objective. These include:
1. Colored aggregate bituminous materials (see NAPA )
2. Pigmented modified Portland Cement (Lambert Corporation)
3. Polymer Concrete with colored aggregates (Lafarge North America)
4. LED fixtures (HIL-Tech Ltd )
COST: Cost is dependant on the type of materials used as well as the amount required to
complete the job. Cost was estimated for a crosswalk with a dimension of eight feet by
thirty feet.
The following costs are for materials only (unless noted otherwise) and prices are not
quoted from the manufacturers.
Colored aggregate bituminous material cost approximately $60.00 per ton. It will take
approximately 9 tons to fill the 8x30 crosswalk or $540.
Pigmented modified Portland Cement cost $150 per sy. An 8’x30’ crosswalk has 26.6 sy,
this would cost $3,990.
Polymer concrete with colored aggregate is approximately $200 per sy. 26.6 sy times
$200 equals $5,320 for an 8’x30’ crosswalk.

- 20 -
LED fixtures cost $35.00 per Linear ft. If the length of the crosswalk is 30 feet than for
both sides of the crosswalk it would cost $2100 installed.
SURVEILLANCE AND TESTING: Research personnel will monitor the installation of the materials and visually inspect
them each spring and fall for the duration of the study. Research personnel will also be
present for any maintenance activities involving the materials to evaluate the ease and
cost of those activities. The surveillance shall include the following:
1) Durability of the material (ASTM D913-03, (Evaluating Degree of Resistance
to wear of traffic Paint), ASTM D4383-03, (Plowable, Raised retroreflective
Pavement Markers)).
2) Delineation performance under various light and weather conditions
3) The effects of the materials on snow removal operations, as well as the effect
of plowing operations on the materials.
4) Photographic documentation on the products performance
5) Visibility at installation and periodically afterwards
DURATION OF THE STUDY: The duration of the study will be three years.
REPORTS: An initial report will be prepared to include the installation of the materials, with
subsequent reports on an annual basis. A final report will be published after the three year
duration, and any interim reports will be published as warranted.
Agency of Transportation Reviewed
By:
Materials and Research Section
Date:
Donald H. Lathrop, P.E.
Materials & Research Engineer
Date: