vertical and horizontal fdi technology...
TRANSCRIPT

Vertical and Horizontal FDI Technology Spillovers:
Evidence from Thai Manufacturing
Archanun Kohpaiboon* Faculty of Economics, Thammasat University,
Bangkok Thailand [email protected]
ABSTRACT: This paper examines Foreign Direct Investment (FDI) spillover, using an unbalanced panel data set of the manufacturing survey of Thailand during the period 2001-03. In this paper, not only are both horizontal and vertical FDI technology spillovers examined, but the former is also assumed to vary across industries. The key hypothesis is that horizontal FDI spillovers depend on the trade policy regime as well as the absorptive capability of locally owned plants. Our panel data econometric analysis highlights the important role of the trade policy regime as a conditional gain of horizontal FDI spillovers. In particular, positive horizontal FDI spillovers are found only in an industry operating in a relatively liberal environment. Interestingly, imposing an assumption of identical horizontal FDI spillovers across industry could result in biased estimates of vertical FDI spillovers. The key policy inference highlights the relative importance of the trade policy regime in harnessing the gain from foreign presence. Liberalizing the foreign investment regime thus has to go hand in hand with liberalizing the trade policy to gain FDI technology spillovers. Our finding here gives a warning not to overemphasize the role of linkages. It is the quality rather than magnitude of linkages that should be used a proxy of the magnitude of vertical FDI spillovers. JEL Classification: F14, O24, D24
*I would like to thank Professor F. Kimura, Mr. S. Umezaki and all participants at the
Workshop ‘Deepening East Asia Economic Integration: Part II Firm-level Analysis, organized by Economic Research Institute for ASEAN and East Asia (ERIA), December 23, 2008 and February 9, 2009. The opinions expressed in this paper are the sole responsibility of the author and do not reflect the views of the ERIA.
1
1. Issues Enticing multinational enterprises (MNEs) to set up affiliations is placed high on the
policy agenda in many countries, especially developing ones, as their entry would bring
in much-needed capital, new production technologies, marketing techniques and
management knowhow. While all of these potential benefits of Foreign Direct
Investment (FDI) are viewed as important, particular emphasis is placed on
technological gains in the productivity and competitiveness of the domestic industry,
known as FDI technology spillovers (henceforth referred to as FDI spillovers). As a
result, the expectation of gaining from technology spillover persuades many developing
countries to offer various incentives in order to attract FDI. Nonetheless, only in some
investment-receiving (host) countries are FDI spillovers empirically found.
While tangible efforts have recently been made to gain a better understanding of
the factors that determine the presence of FDI spillovers, they have not thus far borne
fruit (Crespo& Fontoura, 2007). The existing literature divides into two broad themes.
First, horizontal FDI spillovers are assumed not to be automatic but are hypothesized as
being a function of the economic environment and domestic policies in host countries.
In this literature, two determinants have been generally recognized as conditioning gains
from FDI. These are the trade policy regime and the absorptive capability of locally
owned enterprises.1 While both of these factors are acknowledged, most researchers
have examined only the role of absorptive capability. This may be because of the
difficulty of finding a reliable proxy for protection across industries. So far only a few
studies (e.g. Kokko et al., 2001; Kohpaiboon, 2006) have examined empirically the role
of thetrade policy regime. Additionally, there is a dearth of studies that bring absorptive
capacity and the trade policy regime together in examining FDI spillovers. A major
caveat of literature in this field is that it concentrates only on spillovers taking place
within a given industry, (i.e. horizontal FDI spillovers).
1 See the comprehensive survey in Görg & Greenaway (2004) Crespo & Fontoura
(2007) Hayakawa et al. (2008).
2
In fact, a number of recent studies2 argue that it is more likely that FDI
spillovers would take place through backward and forward linkages (i.e. vertical FDI
spillovers) as opposed to horizontal ones. That is, where foreign investors involve
themselves with indigenous enterprises in upstream and/or downstream industries, it is
very likely that the latter will gain technological benefit from the former. MNEs would
have an incentive to prevent information leakage to their competitors, including local
enterprises, thereby reducing the possibility of horizontal spillover taking place. By
contrast, there would be incentive for them to transfer knowledge to their local suppliers
because such knowledge transfer would benefit the MNEs in terms of getting better
input quality and/or cheaper costs, and receiving inputs on time. It is also plausible that
spillovers from MNEs in upstream industries exist to provide inputs that either were
previously unavailable in the country or to make them technologically more advanced
or less expensive, or to ensure that they are accompanied by the provision of
complementary services (Javorcik, 2004).
Empirical studies examining the presence of vertical FDI technology spillovers
are sparse (Blomström et al. 2000; Lin & Saggi, 2005). The notable exception is
Javorcik (2004) and Blalock & Gertler (2008) which examined cases in Lithuanian and
Indonesian manufacturing sectors, respectively. Their key finding supports the relative
importance of vertical against horizontal FDI spillovers. In particular, it was found that
vertical FDI spillovers were statistically significant. Nevertheless, a major caveat in
these two studies is that their empirical model contains the implicit assumption that
horizontal FDI spillovers are identical for all industries. As argued above such an
assumption is rather restrictive. In addition, the correlation between protection and the
extent of industries generating backward linkages tends to be positive, and omitting the
trade policy regime in examining FDI spillovers could create bias in the results.
Against this backdrop, this paper examines the presence of FDI technology
spillover in Thai manufacturing. Panel data econometric analysis is conducted, using
2 They are Rodŕigueze-Clare (1996), Markusen & Venables (1999), Javorcik (2004), Lin & Saggi, (2005), Blalock & Gertler (2008)
3
the Industrial Survey conducted by the Office of Industrial Economics, Ministry of
Industry, during the period 2001-2003. This is the most up to date and reliable plant
survey available so far. In the empirical model, we follow the general practice in this
research area, in which the productivity equation of locally owned plants in the
manufacturing sector is estimated and the statistical relationship between plants’
productivity and the extent of foreign presence is examined. This paper contributes to
the existing literature in two ways. First, in our econometric analysis both horizontal
and vertical FDI spillovers are examined. So far there have been few studies (e.g.
Javorcik (2004) and Blalock & Gertler (2008) examining both spillovers
simultaneously. Additionally, our measure of backward and forward linkages takes into
consideration both direct and indirect (inter-sectoral) repercussions. This is different
from Javorcik (2004) and Blalock & Gertler (2008) in which only the direct linkage is
included. Secondly, we allow horizontal FDI spillovers to vary across industries. Trade
policy regime and absorptive capability are included in the empirical model as the key
factors determining the extent of horizontal FDI spillovers.
Thai manufacturing is a good laboratory for the issue in hand for two reasons.
First, Thailand has been a large FDI recipient throughout the past three decades.
However, few studies have examined technology spillover in Thai manufacturing. So
far there have been two studies, Kohpaiboon (2006) and Kohpaiboon and Jongwanich
(forthcoming), both of which are based on the Industrial Census of 1996. Hence, this
paper not only provides up-to-date evidence but also re-examine the relative importance
of spillover channels, and horizontal versus vertical spillovers. Secondly, Thai
manufacturing is broad-based as opposed to neighbouring countries, covering a wide
range of industries from traditional labour- intensive industries like garment and
footwear to several key industries in the machinery and transport equipment sector such
as automotive, electronics, and electrical appliances. Hence, evidence drawn from Thai
manufacturing would provide an insightful lesson for other countries.
The paper is organized as follows: Section 2 provides an analytical framework
illustrating possible channels where FDI spillover could take place as well as the role of
key determinants conditioning FDI spillovers. In Section 3, patterns of labour
4
productivity across industries are discussed and related to the extent of the foreign
presence and the effective rate of protection. The following section explains the
empirical model used in this paper (Section 4). Section 5 presents data and variable
construction and regression results are in Section 6. Conclusion and policy inferences
are in the final section.
2. Analytical Framework While MNEs have the potential to generate considerable impact on host countries’
economies, it is often argued that spillovers are the most desirable benefit of all. In
general, there are at least three channels through which FDI spillovers can occur. The
first channel is the demonstration effect. The presence of foreign firms can have a
demonstration effect that allows local firms to become familiar with superior
technologies, marketing and managerial practices used in foreign affiliates. Thus,
spillover can take place in the form of imitating the foreign subsidiaries’ technology.
Over and above this, the presence of foreign affiliates can exert pressure on local firms
exhibiting technical or allocation inefficiencies to adopt more efficient methods. This
allows local firms to survive successfully or even compete with foreign firms. Since
both demonstration and competition effects are likely to occur simultaneously, these
two effects are regarded in the literature as a single channel of spillover.
Linkage is the second channel of FDI spillovers. Where foreign investors are
linked to upstream and downstream industries in host countries, the linked indigenous
firm has the possibility of gaining technological benefits. The former is referred to as
backward linkage and the latter as forward linkage. By backward linkage, foreign
investors establish an inter-firm relationship with local suppliers and create demand for
inputs from local suppliers in upstream industries. When these local firms are engaged
to supply certain raw materials, the high quality, reliability and speed of delivery that
MNE affiliates demand force them to enhance productivity. Moreover, in some cases,
local suppliers in upstream industries receive technical and managerial training in the
production of the required inputs. This is likely to generate additional economic
5
activity and income, and to transfer technological and management skills to the host
country.
Similarly, forward linkage effects are created when one industry uses another
industry’s output as its inputs. Every activity that does not by its nature cater
exclusively to final demand induces attempts to utilize its outputs as inputs in other
industries. Benefits for domestic suppliers resulting from the presence of MNEs may be
extended to other domestic firms that produce end-user consumer goods. The most
evident link is observed in the MNEs’ supply of higher quality inputs and/or at a lower
price to domestic producers of end-user consumer goods. The sum of the backward and
forward linkages gives a total linkage effect, which can be seen as the growth in other
new industries induced by establishing an MNE affiliates.
The last channel is labour mobility. Foreign affiliates generally play a more
active role than local firms in educating and training local labour. Through this training
and subsequent work experience, workers become familiar with the foreign affiliates’
technologies and production methods. FDI spillovers through this channel occur when
employees of foreign affiliates move on to local employers or set up their own business,
using knowledge gained during their previous employment.
Empirically, most econometric studies have only examined the presence of FDI
spillovers through the demonstration and linkage channels simply because of data
availability. Analysis of labour mobility is very limited as researchers must have access
to information about top managers’ backgrounds. Unfortunately, such information is not
usually available.3 Secondly, in theory, FDI spillovers through the demonstration effect
can take place either within the same industry or across industries. In practice, it is very
difficult to measure the demonstration effect across industries so that spillovers through
demonstration effects are usually referred to as horizontal FDI spillovers. On the other
hand, FDI spillovers through linkage occur when MNEs are located in a given industry,
3To the best of our knowledge so far, the only econometric analysis of spillovers
through labour mobility is undertaken by Görg and Strobl (2002), using firm level data in Ghana.
6
and benefit upstream and downstream industries. These are regarded as FDI vertical
spillovers.
The recent studies such as Rodŕigueze-Clare (1996); Markusen & Venables
(1999); Lin & Saggi (2005); Javorcik (2004); and Blalock & Gertler (2008) highlight
the relative importance of vertical FDI spillovers as opposed to horizontal ones. In
particular, they argue that vertical FDI spillovers are likely. For example Blalock &
Gertler (2008) argue that it is hard to believe that horizontal FDI spillovers are likely.
Firstly, the technology gap between foreign and domestic firms may often be wide.
Local firms may lack the absorptive capacity needed to recognize and adopt new
technology. Similarly, the degree to which foreign and domestic firms actually compete
in the same market will also vary. It is possible, for example, that domestic firms may
produce for the local market while MNEs produce for export. Because of differences in
quality and other attributes, exported and domestically consumed goods may entail
different production methods thereby reducing the potential for technology transfer. In
contrast, technological benefits to local firms through vertical linkages are much more
likely simply because MNEs have incentives to improve the productivity of their
suppliers with the expectation of input cost reduction and quality improvement in
return. Moreover, MNEs are likely to procure inputs requiring less sophisticated
production techniques for which the gap is narrower.
The key finding of Javorcik (2004) and Blalock & Gertler (2008) supports the
core hypothesis, i.e. only vertical FDI spillovers through backward linkages are found.
Noticeably, the empirical model in both studies implicitly assumes that horizontal FDI
spillovers, if they exist, must be identical in all industries. In particular, locally owned
enterprises operating in two different industries (e.g. capital versus labour intensive
industries, restrictive versus liberal trade regime) would benefit identically from foreign
presence in their industries. This assumption seems to contradict a number of studies
pointing out the heterogeneity of spillovers (Görg & Greenaway, 2004; Crespo &
Fontoura, 2007; Hayakawa et al. 2008).

7
In fact, the recent effort is to clarify what kinds of heterogeneity in MNEs and/or
indigenous firms are crucial. So far there have been two factors identified, namely the
absorptive capability of indigenous firms and the trade policy regime. Whether a local
firm benefits from MNC presence depends on its capacity for assimilating knowledge-
its absorptive capability (Kokko et al. 1996; Girma et al., 2001; Girma & Görg, 2003;
Kinoshita, 2001; Girma, 2005). The hypothesis in the literature points out that the
higher the absorptive capability, the greater the spillover the local firm in the host
country can expect. Note that the absorptive capability is referred to as the
technological gap between MNE affiliates and indigenous firms (Kokko, 1994;
Blomstrom & Sjohölm, 1999; Sjohölm, 1999).
The trade policy regime is another factor to be considered, although there are
few empirical studies examining its role in conditioning FDI technology spillovers. As
pioneered by Bhagwaiti (1973) as an extension to his theory of immiserizing growth
and further developed by Bhagwati (1985, 1994); Brecher & Diaz-Alejandro (1977);
and Brecher & Findlay (1983), technology spillover tends to be smaller, or possibly
even negative, under a restrictive, import substitution (IS) regime compared with a
liberalizing, export promotion (EP) regime (referred to as the ‘Bhagwati’s hypothesis’).
FDI inflows enticed by an import substitution (IS) trade regime tend to be market-
seeking and are invested mostly in the industries where proprietary assets are important.
This creates barriers to entry for local firms and thus constrains technology and
efficiency spillovers. In contrast, the export promotion (EP) regime is more conducive
to generating favorable spillover effects because, under such a regime, FDI is mostly
attracted to industries in which the country has comparative advantage, i.e. efficiency-
seeking FDI. In such industries local firms have a greater potential to catch up with
foreign firms and achieve productivity improvement. Additionally, domestic firms
already exposed to foreign competition will probably have a great capacity not only to
absorb foreign technology but also to counter the competition provided by MNEs in the
local market, thereby precluding a negative impact through the competition channel
(Crespo & Fontoura, 2007).
8
While recognizing the important role of absorptive capability, trade policy is
highlighted in this paper because it is highly policy relevant and there is room for
improvement in the context of developing countries. While progress on tariff reduction
has occurred as a consequence of the Uruguay Round, it is clear that much remains to
be done. There has been a considerable decline in average tariff rates in developing
countries, especially in Asia and Africa, but this has occurred in an uneven manner
thereby increasing tariff dispersion. This implies that countries with low average tariff
rates are likely to have very high tariff peaks and exhibit escalation at higher levels of
disaggregation (Jongwnaich & Kohpaiboon, 2007).
More importantly, ignoring these two key determinants from econometric
analysis of FDI spillovers studies could result in biased estimates as a consequence of
omitting relevant variables. This is especially true for the trade policy regime simply
because there is likely to be a positive correlation between protection and the extent of
industries generating backward linkage. This is in line with the infant industry
argument. Pioneered by Hirschman (1958), investible resources should be geared
toward industries that have maximum linkages with the rest of economy. Such
industries are usually capital intensive and economies of scale still matter, so that
protection against foreign competition is always granted to give them time to gain more
production efficiency. The widely cited example is the development strategy for
automotive industry in developing countries which are likely to be a combination
between restrictive local content requirement measures and a high cross-border
protection. Although industrial linkages were a part of import substitution
industrialization strategy that has became less important since the 1980s, promoting
linkages and policy-induced ones in particular have continued to linger in the minds of
policymakers and development analysts (Athukorala, 1998; Pursell, 2001).
9
3. Patterns of Labour Productivity and Foreign Presence in Thai
Manufacturing.
This section aims to illustrate productivity difference between foreign and indigenous
plants across industries disaggregated into 4 digit ISIC classification in the Thai
manufacturing sector. As well, the productivity difference is examined together with
key variables in the paper’s core analysis, namely capital-labour ratio, the extent of
foreign presence (FOR), effective rate of protection (ERP), and backward linkages
index (BLI).4 Productivity here is measured by labour productivity, value added per
workers. Difference in labour productivity between foreign and locally owned plants as
a per cent of the latter’s productivity is calculated.5 The calculated productivity
difference is plotted together with difference in capital labour ratio between these two
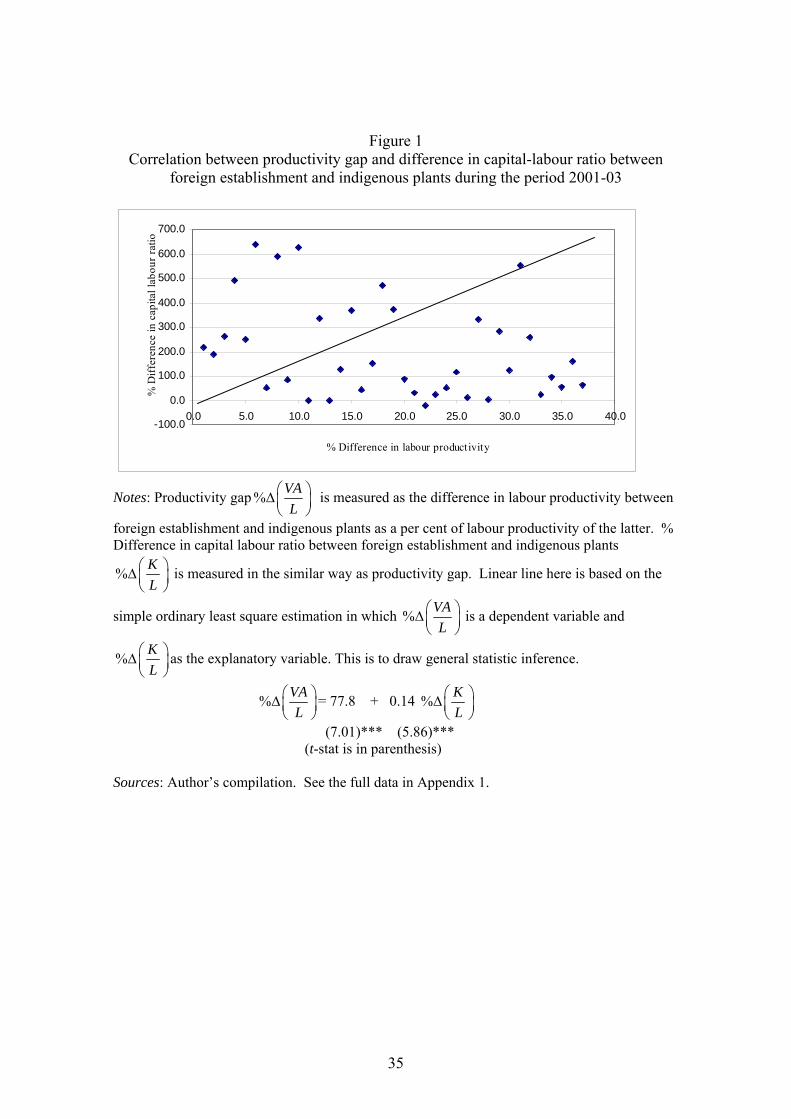
types of firms as shown in Figure 1 to reveal whether the former is more productive
than the latter after accounting for difference in the capital-labour ratio. These indicators
are the average figure during the period 2001-03.
The scattered plot in Figure 1 suggests that foreign plants generally have higher
labour productivity than locally owned ones. Most of industries stay above the
horizontal axis implying the positive productivity difference. The difference is
averaged out at 107 per cent with the maximum of nearly 400 per cent in dairy product
(ISIC 1520) and the minimum of -61.8 per cent in alcoholic beverages (ISIC 1551).
Nevertheless, the positive productivity difference is largely due to the fact that foreign
plants tend to be more capital intensive than their local counterparts as indicated by the
observed positive relationship between productivity and capital-labour ratio differences.
A (Spearman) rank correlation between difference in labour productivity and capital-
4 See full detail in Appendix 1 5 We do not report absolute number of labour productivity simply because they vary
largely across industries. For example, value added per worker of indigenous plants in 2001 was widely ranged from 95,891 baht/workers (ISIC 2029: other special purpose machinery) to 67,800,000 baht/workers (ISIC 1554: Soft Drink Industry). Since our interest here is to address the issue whether foreign plants always exhibit higher labour productivity than indigenous ones instead of explaining difference of labour productivity across industries, we decide to report only the percentage difference. Absolute value added per workers is available upon the author’s request.
10
labour ratio is about 0.44 and statistically significant at the conventional level (5 per
cent). Hence, the observed figure of positive labour productivity difference is
inadequate to conclude that foreign plants are superior to local ones unless the capital-
labour ratio is taken into consideration.
(Insert Figure 1 about here)
There are six industries experiencing a negative and significant (greater than 30
per cent) difference in labour productivity: i.e. locally owned plants have higher labour
productivity than foreign ones. They are alcoholic beverages (ISIC 1551), Tobacco
(ISIC 2925), veneer sheets (ISIC 2021), Paper pulp and paperboard (ISIC 2101), Toys
(ISIC 3694) and animal feeds (ISIC 1533). A common pattern observed among them is
there are Thai conglomerates playing important roles. One obvious example is alcoholic
beverages (ISIC 1551) dominated by two Thai conglomerates such as Thai Beverages
Public Company, and the Singha Corporation. Similarly, in animal feeds and paper
pulp industries, there are two Thai MNEs, the Chareon Pokphand Group (CP Group)
and Siam Cement Group, respectively.
We also examine foreign presence (FOR) measured in terms of output share6,
effective rate of protection (ERP) and backward linkage index (BLI) in order to view
their correlation with the average of plant productivity. BLI here is constructed based
on the Leontief inter-industry accounting framework which provides for the capture of
both direct and indirect (inter-sectoral) repercussions in the measurement process. It
shows the total units of output required, directly and indirectly, from all sectors
(including the unit of output delivered to final demand by the given sector) when the
demand for the industry’s product rises by one unit.
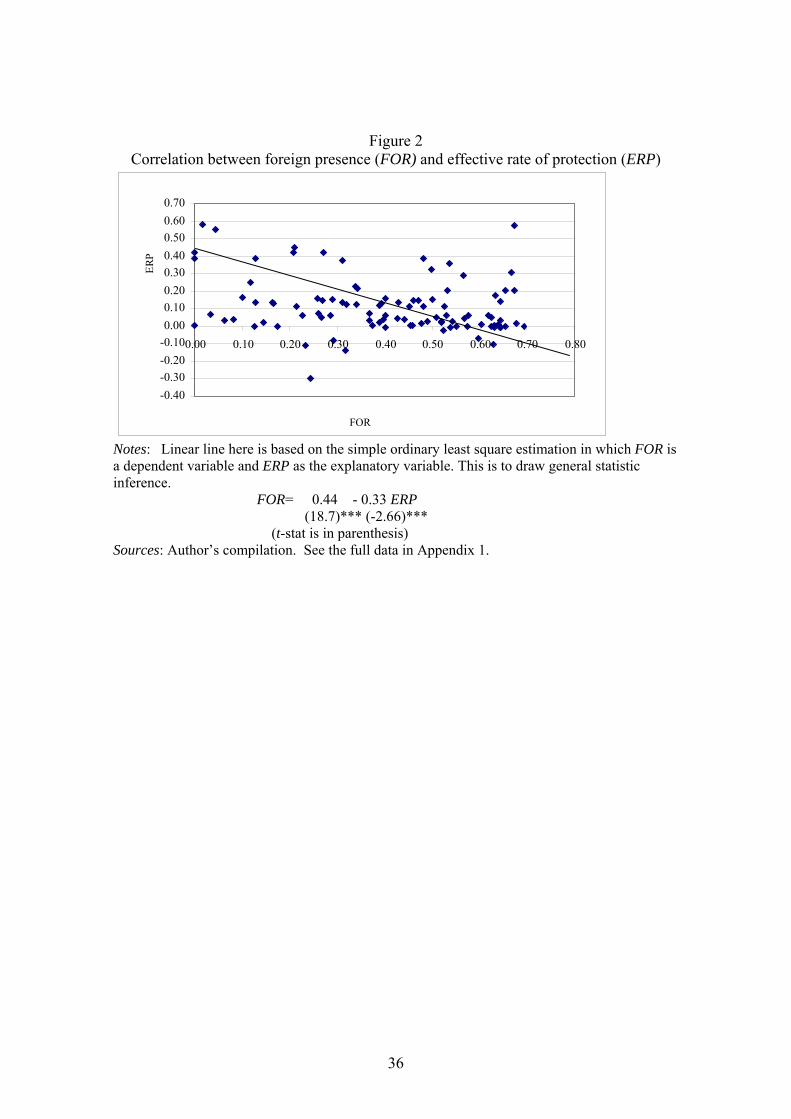
Generally, foreign plants tend to locate in industries having a low effective rate
of protection, as we found a negative correlation between FOR and ERP of -0.25
6 See further discussion on why output share is our preferable choice in this study in
Section 4.
11
(Figure 2). The negative correlation is consistent with the trend of FDI inflows at the
more aggregated level. Up to the late 1970s, FDI was predominantly in import-
substitution industries such as textiles, automobiles, and chemicals. From then on, an
increasing share of FDI was directed to more export-oriented activities. To begin with,
export-oriented FDI went into light manufacturing industries such as clothing, textiles,
footwear and toys. More recently, labour-intensive assembly activities in the
electronics and electrical goods industries have been the main attraction to foreign
investors. Interestingly, there is no clear relationship between FOR and BLI as their
simple correlation approaches zero (Figure 3). This reconfirms the proposition that FDI
inflows in Southeast Asia including Thailand predominantly belong to the efficiency-
seeking/export-oriented categories (Hill & Athukorala, 1998).
(Insert Figures 2 and 3 about here)
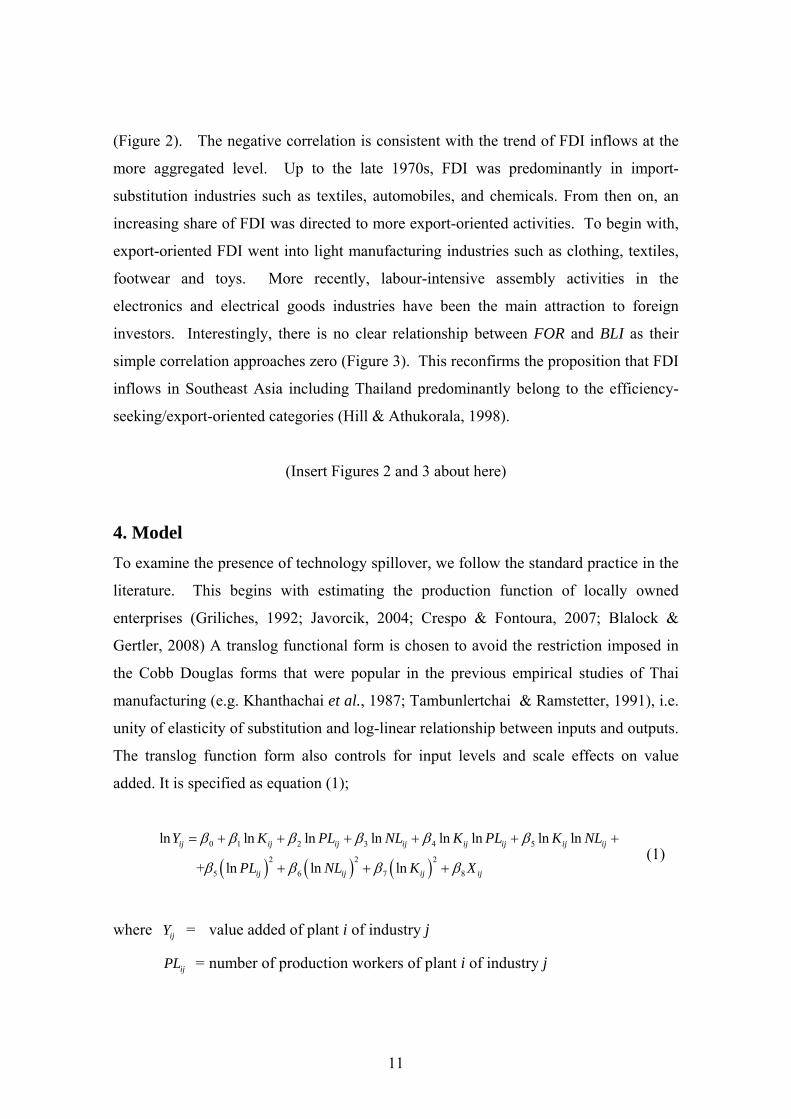
4. Model To examine the presence of technology spillover, we follow the standard practice in the
literature. This begins with estimating the production function of locally owned
enterprises (Griliches, 1992; Javorcik, 2004; Crespo & Fontoura, 2007; Blalock &
Gertler, 2008) A translog functional form is chosen to avoid the restriction imposed in
the Cobb Douglas forms that were popular in the previous empirical studies of Thai
manufacturing (e.g. Khanthachai et al., 1987; Tambunlertchai & Ramstetter, 1991), i.e.
unity of elasticity of substitution and log-linear relationship between inputs and outputs.
The translog function form also controls for input levels and scale effects on value
added. It is specified as equation (1);
( ) ( ) ( )
0 1 2 3 4 5
2 2 2
5 6 7 8
ln ln ln ln ln ln ln ln
+ ln ln ln
ij ij ij ij ij ij ij ij
ij ij ij ij
Y K PL NL K PL K NL
PL NL K X
β β β β β β
β β β β
= + + + + + +
+ + + (1)
where ijY = value added of plant i of industry j
ijPL = number of production workers of plant i of industry j

12
ijNL = number of non-production workers of plant i of industry j
ijK = fixed assets of plant i of industry j
ijX = controlling variables in affecting plant productivity of plant i of industry
j.
In equation 1, there are three primary inputs, physical capital and two types of
labour (i.e. production and non-production workers). The latter is done to allow
marginal products from them to be different. Controlling variables include both firm-
and industry-specific factors.
The first controlling variable is the plants’ market orientation nature ( ijMKT ).
One clear-cut finding in the literature of the export-productivity nexus is that exporters
are found to have higher productivity than non-exporters as firms would expect more
intense competition in the global market than in the domestic market. In addition, there
are sunk costs induced by exports.7 Hence, the nature of market orientation is included
in the model with the theoretical expected positive sign. ijMKT is measured a binary
dummy variable which equals to 1 if firms’ export-sale ratio exceeds 25 per cent and
zero otherwise. The rationale of not using an actual export-output ratio is because the
relationship between market orientation and productivity could be non-linear. Firms
planning to export must enhance their productivity to a certain level before export so
that a positive relationship between market orientation and productivity is expected
within a certain range of the export-output ratio only. In this study, 25 per cent is
arbitrarily used so that sensitivity analysis is conducted by using 20 and 30 per cent as
alternative cutting points. Nevertheless, the regression results are not sensitive to the
cutting points.8
7 Even though there is ongoing debate about whether firms become more productive
before export (self-selection) or experience productivity gains after export (learning from export). See the recent survey in Wagner (2007) and works cited therein.
8 Results are available upon author’s request.
13
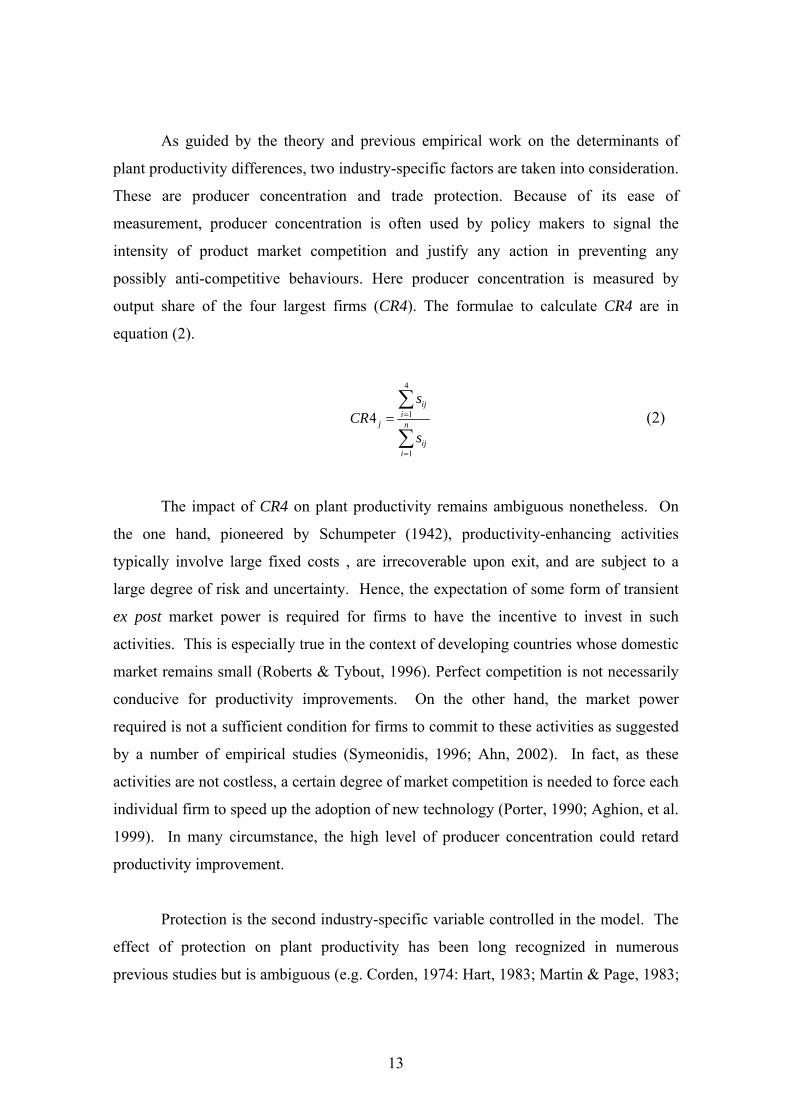
As guided by the theory and previous empirical work on the determinants of
plant productivity differences, two industry-specific factors are taken into consideration.
These are producer concentration and trade protection. Because of its ease of
measurement, producer concentration is often used by policy makers to signal the
intensity of product market competition and justify any action in preventing any
possibly anti-competitive behaviours. Here producer concentration is measured by
output share of the four largest firms (CR4). The formulae to calculate CR4 are in
equation (2).
4
1
1
4ij
ij n
iji
sCR
s
=
=
=∑
∑ (2)
The impact of CR4 on plant productivity remains ambiguous nonetheless. On
the one hand, pioneered by Schumpeter (1942), productivity-enhancing activities
typically involve large fixed costs , are irrecoverable upon exit, and are subject to a
large degree of risk and uncertainty. Hence, the expectation of some form of transient
ex post market power is required for firms to have the incentive to invest in such
activities. This is especially true in the context of developing countries whose domestic
market remains small (Roberts & Tybout, 1996). Perfect competition is not necessarily
conducive for productivity improvements. On the other hand, the market power
required is not a sufficient condition for firms to commit to these activities as suggested
by a number of empirical studies (Symeonidis, 1996; Ahn, 2002). In fact, as these
activities are not costless, a certain degree of market competition is needed to force each
individual firm to speed up the adoption of new technology (Porter, 1990; Aghion, et al.
1999). In many circumstance, the high level of producer concentration could retard
productivity improvement.
Protection is the second industry-specific variable controlled in the model. The
effect of protection on plant productivity has been long recognized in numerous
previous studies but is ambiguous (e.g. Corden, 1974: Hart, 1983; Martin & Page, 1983;

14
Scharfstein, 1988; Rodrik, 1991). While protection can create economic rents that can
be used for productivity improving activities, in practice an opposite effect can be seen.
By insulating firms from foreign competition, high protection tends to induce producers
to become ‘unresponsive’ to improved technological capability as well as to requests for
improvement in the quality and price of what they offer (de Melo and Urata, 1986;
Moran, 2001). This in turn results in a general deterioration of technological and
management skills Hence, the sign of trade protection is theoretically ambiguous.
Protection is proxied by the effective rate of protection (ERP). Even though there is no
consensus between ERP and the nominal rate of protection (NRP) amongst economists
as to choice of one over the other (Corden, 1966; Cheh, 1974), political bargains in Thai
manufacturing are struck over ERP rather than NRP based on the econometric evidence
of Jongwanich & Kohpaiboon (2007).
An interaction term between jCON and jERP is introduced to rectify the major
weakness of producer concentration in measuring the degree of product market
competition. At best, producer concentration cannot capture dynamic aspects of
competition especially from imports. As mentioned above, competition is important for
the positive impact of concentration on productivity. In the competitive environment,
the less productive firms tend to be “weeded out”, so a highly concentrated industry
structure would be more conducive for firms to continue their innovative activities. By
contrast, in the absence of significant market competition, economic rents generated as a
result of high producer concentration are likely to be captured by its managers (and
workers) in the form of managerial slack or lack of effort. All in all, this suggests that
the impact of producer concentration tends to be conditioned by the degree of market
competition so that the interaction term is introduced. The coefficient corresponding to
the interaction is expected to be negative.
The extent of foreign presence in an industry j ( )jFOR is introduced to examine
horizontal technology spillovers, In some previous empirical studies, foreign presence
can be captured by either output, employment or capital shares. Expressing the foreign
presence as an employment share tends to underestimate the actual role of foreign

15
affiliates because MNE affiliates tend to be more capital intensive than locally non-
affiliated firms.7 On the other hand, the capital share can easily be distorted by the
presence of foreign ownership restrictions. Such a restriction was in effect in Thailand
during the study period (Kohpaiboon, 2006). Hence, the output share is the preferred
proxy.
As suggested in the previous studies, horizontal spillovers can be either positive
or negative, depending on the absorptive capability of local plants and the nature of the
trade policy regime. The absorptive capability of the local plant is measured by the
ratio of supervisory and management workers to total employment (QL) as supervisory
and management workers are regarded as skilled labour. The higher the ratio, the
higher the labour quality. The expected sign of the corresponding coefficient is
positive. Trade policy regime is proxied by ERP. The higher the ERP, the less the
horizontal spillovers, so that the negative sign of the interaction term is expected.
As argued above, FDI can also generate vertical spillovers through the linkage
channel. To do so, inter-industry linkage is established according to the Leontief inter-
industry accounting framework. Consider an input-output framework of the
‘complementary import’ type (i.e. the input-output table, in which the import content of
each transaction is separately identified and allocated to an import matrix)9;
d dX A X Y E= + + (3)
where X = column vector of total gross output,
, d d dij ij ij jn
A a a X X⎡ ⎤= =⎣ ⎦ = domestic input-output coefficient matrix
Y d = column vector of domestic demand on domestically produced
goods.
E = column vector of export demand on domestically produced goods.
9 Another type of Input-output (I-O) table is a ‘competitive import’ type in which all
imports (intermediate plus final) are treated as competing with domestic production and thus imports are not separated from domestic transactions (Bulmer-Thomas, 1982).
16
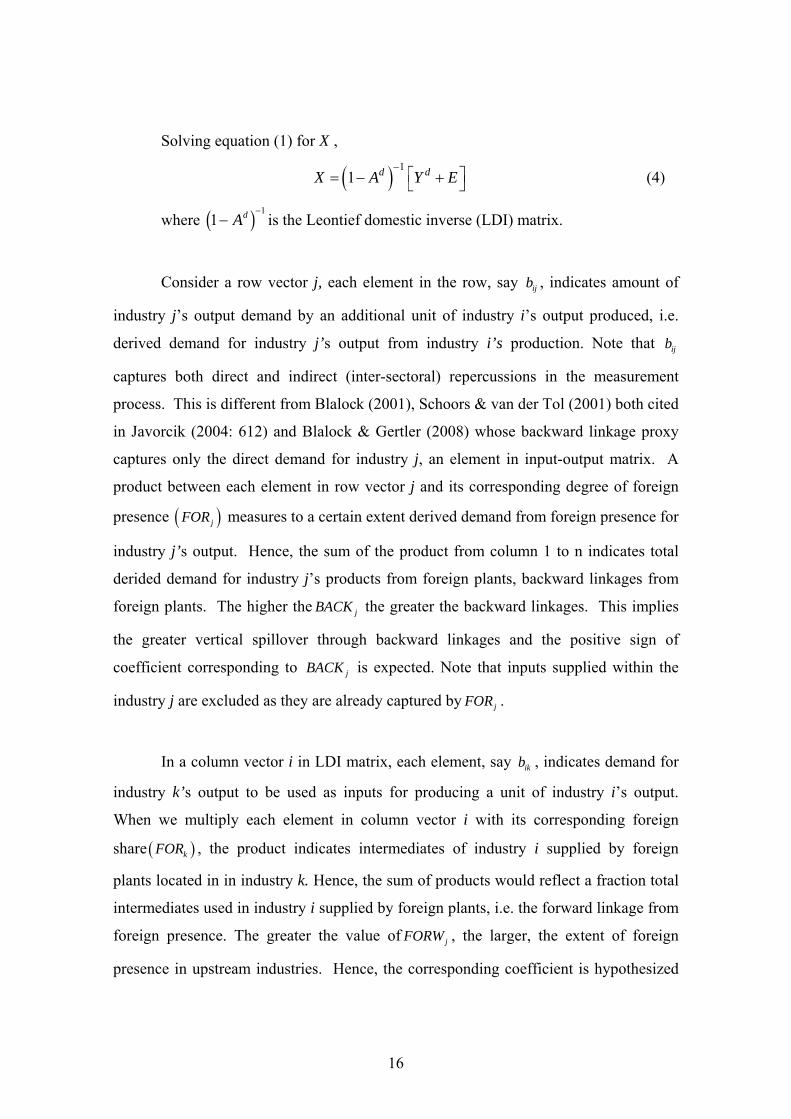
Solving equation (1) for X ,
( ) 11 d dX A Y E
−⎡ ⎤= − +⎣ ⎦ (4)
where 11
−−
Adc h is the Leontief domestic inverse (LDI) matrix.
Consider a row vector j, each element in the row, say ijb , indicates amount of
industry j’s output demand by an additional unit of industry i’s output produced, i.e.
derived demand for industry j’s output from industry i’s production. Note that ijb
captures both direct and indirect (inter-sectoral) repercussions in the measurement
process. This is different from Blalock (2001), Schoors & van der Tol (2001) both cited
in Javorcik (2004: 612) and Blalock & Gertler (2008) whose backward linkage proxy
captures only the direct demand for industry j, an element in input-output matrix. A
product between each element in row vector j and its corresponding degree of foreign
presence ( )jFOR measures to a certain extent derived demand from foreign presence for
industry j’s output. Hence, the sum of the product from column 1 to n indicates total
derided demand for industry j’s products from foreign plants, backward linkages from
foreign plants. The higher the jBACK the greater the backward linkages. This implies
the greater vertical spillover through backward linkages and the positive sign of
coefficient corresponding to jBACK is expected. Note that inputs supplied within the
industry j are excluded as they are already captured by jFOR .
In a column vector i in LDI matrix, each element, say ikb , indicates demand for
industry k’s output to be used as inputs for producing a unit of industry i’s output.
When we multiply each element in column vector i with its corresponding foreign
share ( )kFOR , the product indicates intermediates of industry i supplied by foreign
plants located in in industry k. Hence, the sum of products would reflect a fraction total
intermediates used in industry i supplied by foreign plants, i.e. the forward linkage from
foreign presence. The greater the value of jFORW , the larger, the extent of foreign
presence in upstream industries. Hence, the corresponding coefficient is hypothesized
17
to be positive. For the same reason as before, inputs purchased within the industry j are
not included.
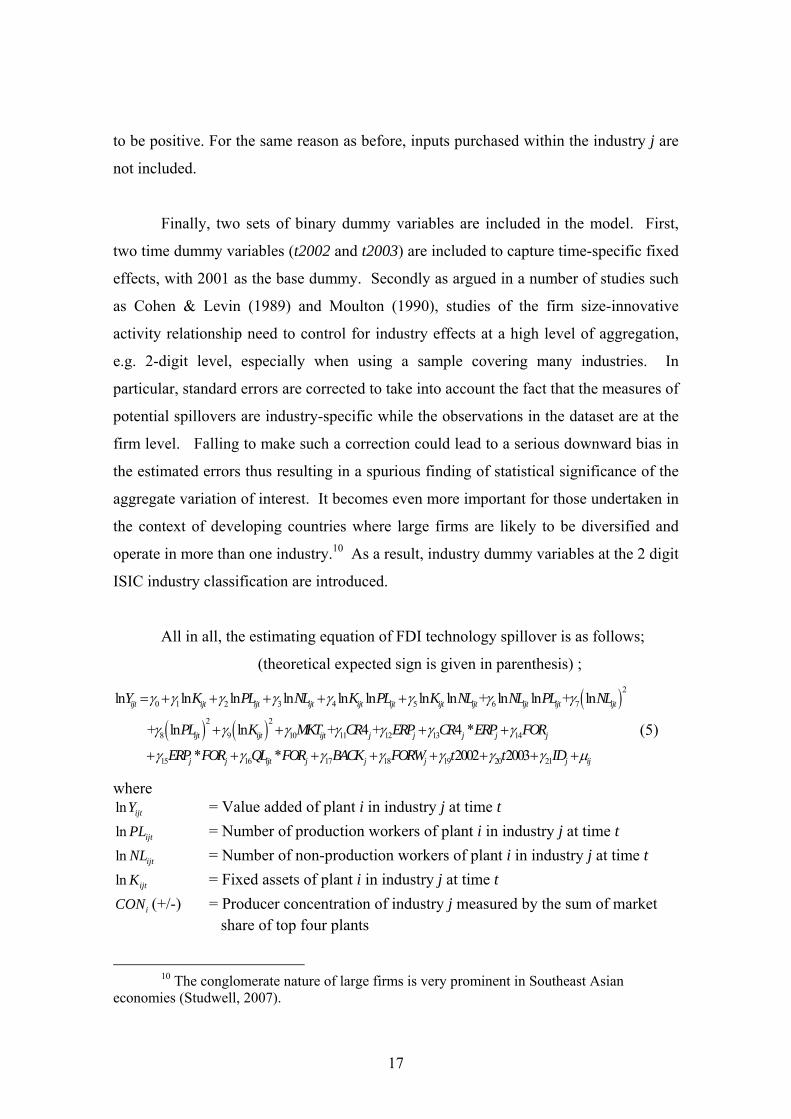
Finally, two sets of binary dummy variables are included in the model. First,
two time dummy variables (t2002 and t2003) are included to capture time-specific fixed
effects, with 2001 as the base dummy. Secondly as argued in a number of studies such
as Cohen & Levin (1989) and Moulton (1990), studies of the firm size-innovative
activity relationship need to control for industry effects at a high level of aggregation,
e.g. 2-digit level, especially when using a sample covering many industries. In
particular, standard errors are corrected to take into account the fact that the measures of
potential spillovers are industry-specific while the observations in the dataset are at the
firm level. Falling to make such a correction could lead to a serious downward bias in
the estimated errors thus resulting in a spurious finding of statistical significance of the
aggregate variation of interest. It becomes even more important for those undertaken in
the context of developing countries where large firms are likely to be diversified and
operate in more than one industry.10 As a result, industry dummy variables at the 2 digit
ISIC industry classification are introduced.
All in all, the estimating equation of FDI technology spillover is as follows;
(theoretical expected sign is given in parenthesis) ;
( )( ) ( )
2
0 1 2 3 4 5 6 7
2 2
8 9 10 11 12 13 14
15
ln ln ln ln ln ln ln ln + ln ln + ln
+ ln ln + 4 + 4 *
*
ijt ijt ijt ijt ijt ijt ijt ijt ijt ijt ijt
ijt ijt ijt j j j j j
j j
Y K PL NL K PL K NL NL PL NL
PL K MKT CR ERP CR ERP FOR
ERP FOR
γ γ γ γ γ γ γ γ
γ γ γ γ γ γ γ
γ
= + + + + +
+ + + +
+ 16 17 18 19 20 21* 2002 2003 ijt j j j j ijQL FOR BACK FORW t t IDγ γ γ γ γ γ μ+ + + + + + +
(5)
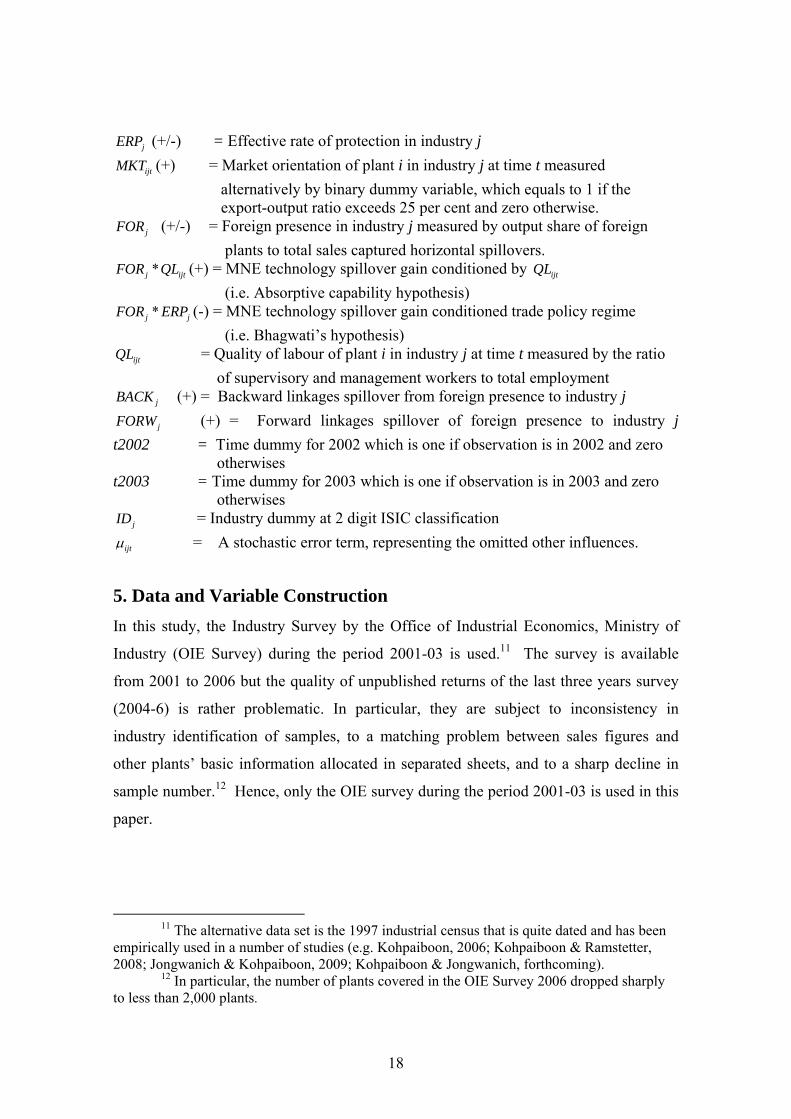
where ln ijtY = Value added of plant i in industry j at time t ln ijtPL = Number of production workers of plant i in industry j at time t ln ijtNL = Number of non-production workers of plant i in industry j at time t ln ijtK = Fixed assets of plant i in industry j at time t
iCON (+/-) = Producer concentration of industry j measured by the sum of market share of top four plants
10 The conglomerate nature of large firms is very prominent in Southeast Asian
economies (Studwell, 2007).
18
jERP (+/-) = Effective rate of protection in industry j
ijtMKT (+) = Market orientation of plant i in industry j at time t measured alternatively by binary dummy variable, which equals to 1 if the export-output ratio exceeds 25 per cent and zero otherwise.
jFOR (+/-) = Foreign presence in industry j measured by output share of foreign plants to total sales captured horizontal spillovers.
*j ijtFOR QL (+) = MNE technology spillover gain conditioned by ijtQL (i.e. Absorptive capability hypothesis)
*j jFOR ERP (-) = MNE technology spillover gain conditioned trade policy regime (i.e. Bhagwati’s hypothesis)
ijtQL = Quality of labour of plant i in industry j at time t measured by the ratio of supervisory and management workers to total employment
jBACK (+) = Backward linkages spillover from foreign presence to industry j
jFORW (+) = Forward linkages spillover of foreign presence to industry j t2002 = Time dummy for 2002 which is one if observation is in 2002 and zero
otherwises t2003 = Time dummy for 2003 which is one if observation is in 2003 and zero
otherwises jID = Industry dummy at 2 digit ISIC classification
ijtμ = A stochastic error term, representing the omitted other influences.
5. Data and Variable Construction
In this study, the Industry Survey by the Office of Industrial Economics, Ministry of
Industry (OIE Survey) during the period 2001-03 is used.11 The survey is available
from 2001 to 2006 but the quality of unpublished returns of the last three years survey
(2004-6) is rather problematic. In particular, they are subject to inconsistency in
industry identification of samples, to a matching problem between sales figures and
other plants’ basic information allocated in separated sheets, and to a sharp decline in
sample number.12 Hence, only the OIE survey during the period 2001-03 is used in this
paper.
11 The alternative data set is the 1997 industrial census that is quite dated and has been
empirically used in a number of studies (e.g. Kohpaiboon, 2006; Kohpaiboon & Ramstetter, 2008; Jongwanich & Kohpaiboon, 2009; Kohpaiboon & Jongwanich, forthcoming).
12 In particular, the number of plants covered in the OIE Survey 2006 dropped sharply to less than 2,000 plants.
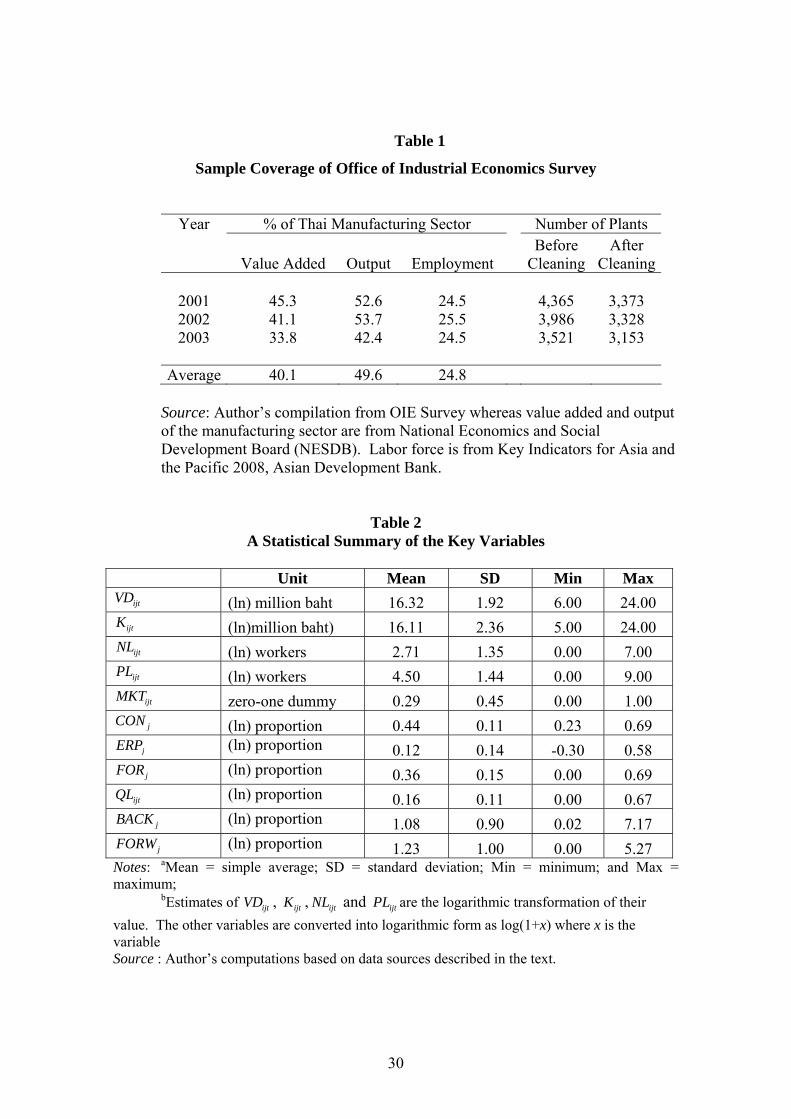
19
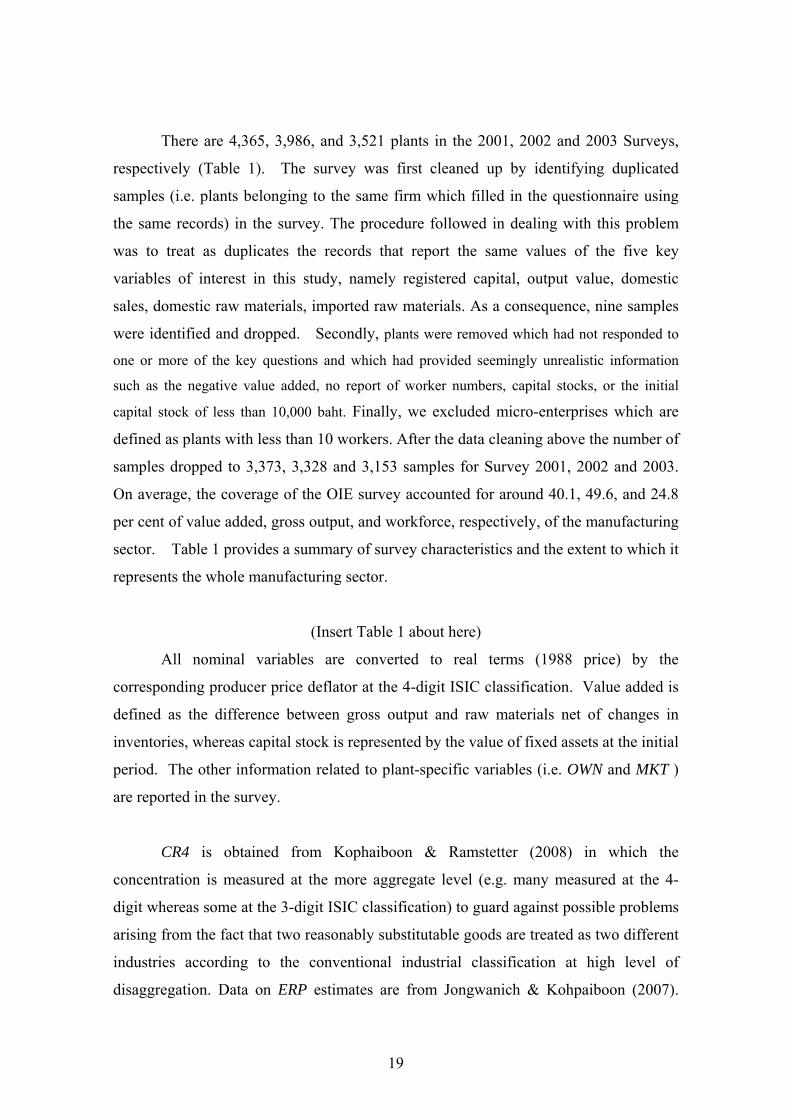
There are 4,365, 3,986, and 3,521 plants in the 2001, 2002 and 2003 Surveys,
respectively (Table 1). The survey was first cleaned up by identifying duplicated
samples (i.e. plants belonging to the same firm which filled in the questionnaire using
the same records) in the survey. The procedure followed in dealing with this problem
was to treat as duplicates the records that report the same values of the five key
variables of interest in this study, namely registered capital, output value, domestic
sales, domestic raw materials, imported raw materials. As a consequence, nine samples
were identified and dropped. Secondly, plants were removed which had not responded to
one or more of the key questions and which had provided seemingly unrealistic information
such as the negative value added, no report of worker numbers, capital stocks, or the initial
capital stock of less than 10,000 baht. Finally, we excluded micro-enterprises which are
defined as plants with less than 10 workers. After the data cleaning above the number of
samples dropped to 3,373, 3,328 and 3,153 samples for Survey 2001, 2002 and 2003.
On average, the coverage of the OIE survey accounted for around 40.1, 49.6, and 24.8
per cent of value added, gross output, and workforce, respectively, of the manufacturing
sector. Table 1 provides a summary of survey characteristics and the extent to which it
represents the whole manufacturing sector.
(Insert Table 1 about here)
All nominal variables are converted to real terms (1988 price) by the
corresponding producer price deflator at the 4-digit ISIC classification. Value added is
defined as the difference between gross output and raw materials net of changes in
inventories, whereas capital stock is represented by the value of fixed assets at the initial
period. The other information related to plant-specific variables (i.e. OWN and MKT )
are reported in the survey.
CR4 is obtained from Kophaiboon & Ramstetter (2008) in which the
concentration is measured at the more aggregate level (e.g. many measured at the 4-
digit whereas some at the 3-digit ISIC classification) to guard against possible problems
arising from the fact that two reasonably substitutable goods are treated as two different
industries according to the conventional industrial classification at high level of
disaggregation. Data on ERP estimates are from Jongwanich & Kohpaiboon (2007).
20
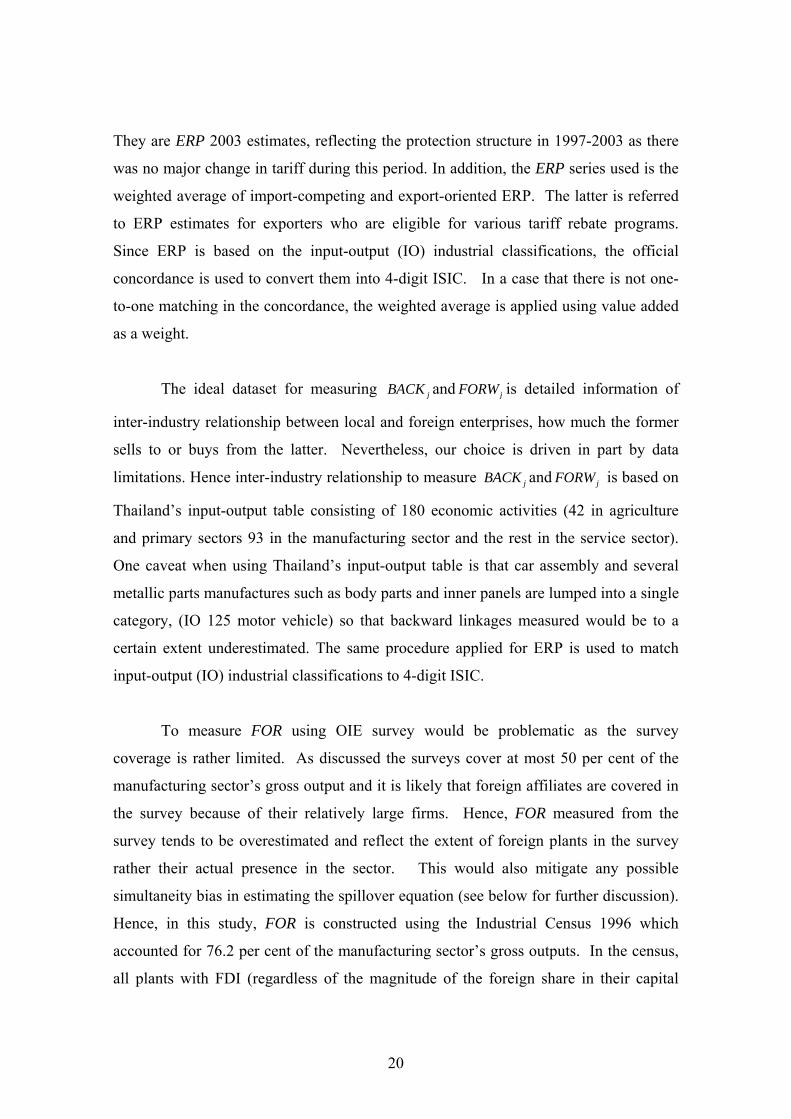
They are ERP 2003 estimates, reflecting the protection structure in 1997-2003 as there
was no major change in tariff during this period. In addition, the ERP series used is the
weighted average of import-competing and export-oriented ERP. The latter is referred
to ERP estimates for exporters who are eligible for various tariff rebate programs.
Since ERP is based on the input-output (IO) industrial classifications, the official
concordance is used to convert them into 4-digit ISIC. In a case that there is not one-
to-one matching in the concordance, the weighted average is applied using value added
as a weight.
The ideal dataset for measuring jBACK and jFORW is detailed information of
inter-industry relationship between local and foreign enterprises, how much the former
sells to or buys from the latter. Nevertheless, our choice is driven in part by data
limitations. Hence inter-industry relationship to measure jBACK and jFORW is based on
Thailand’s input-output table consisting of 180 economic activities (42 in agriculture
and primary sectors 93 in the manufacturing sector and the rest in the service sector).
One caveat when using Thailand’s input-output table is that car assembly and several
metallic parts manufactures such as body parts and inner panels are lumped into a single
category, (IO 125 motor vehicle) so that backward linkages measured would be to a
certain extent underestimated. The same procedure applied for ERP is used to match
input-output (IO) industrial classifications to 4-digit ISIC.
To measure FOR using OIE survey would be problematic as the survey
coverage is rather limited. As discussed the surveys cover at most 50 per cent of the
manufacturing sector’s gross output and it is likely that foreign affiliates are covered in
the survey because of their relatively large firms. Hence, FOR measured from the
survey tends to be overestimated and reflect the extent of foreign plants in the survey
rather their actual presence in the sector. This would also mitigate any possible
simultaneity bias in estimating the spillover equation (see below for further discussion).
Hence, in this study, FOR is constructed using the Industrial Census 1996 which
accounted for 76.2 per cent of the manufacturing sector’s gross outputs. In the census,
all plants with FDI (regardless of the magnitude of the foreign share in their capital

21
stock) are considered to be foreign rather than local plants. The cutting point (i.e. zero
per cent) seems to be slightly higher than what is widely used by the International
Monetary Fund (IMF) and other institutes such as the Organization for Economic Co-
operation and Development (OECD), the US Department of Commence as well as
several scholars studying multinational firms (IMF, 1993; Lipsey, 2001), i.e. 10 per
cent. However, the choice is dictated by data availability. Information on foreign
ownership in the census is reported with a wide range, i.e. zero, less than 50, greater 50
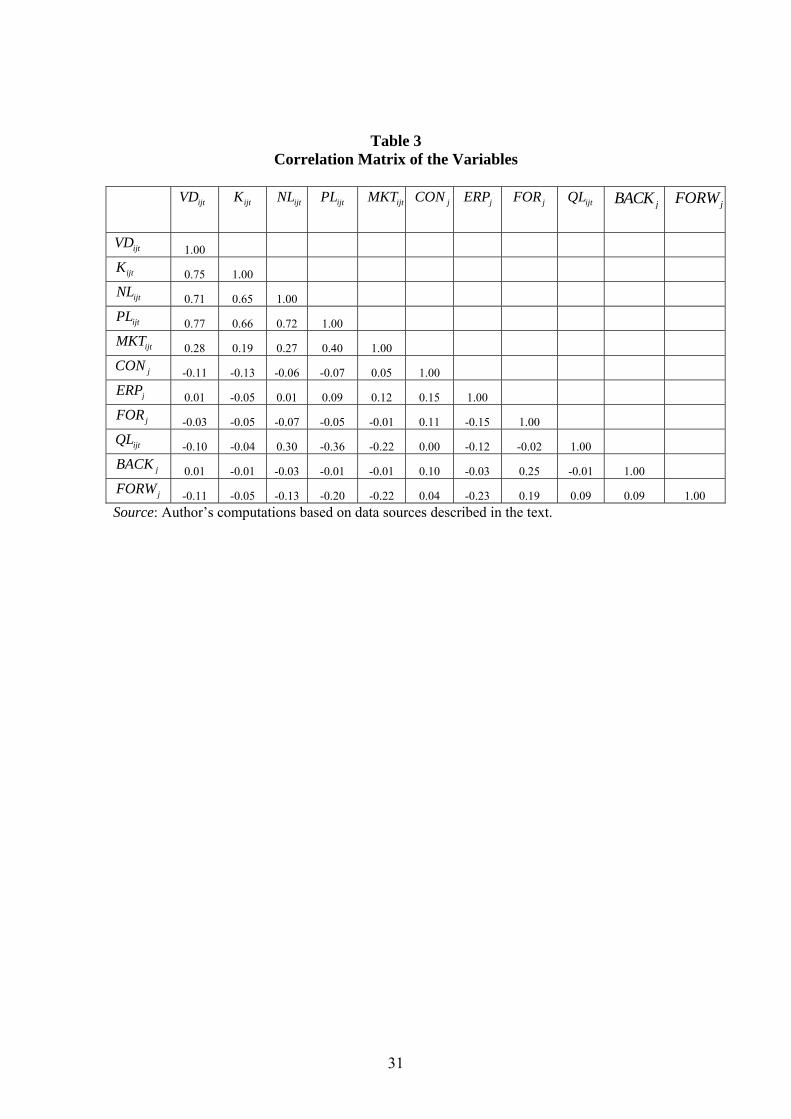
and 100 per cent foreign shares. Tables 2 and 3 provide a statistical summary of all
variables discussed above and their correlation matrix.
(Insert Tables 2 and 3 about here)
6. Regression Results
To examine the presence of spillover from FDI, an unbalanced panel econometric
procedure is applied. We used the random effect estimator as our preferred estimation
technique. The alternative fixed effect estimator is not appropriate because our model
contains a number of time-invariant variables ( jCON , jERP , jFOR , jBACK , and
jFORW ) all of which are central to our analysis. A major limitation of the random
effect estimator compared to its fixed effect counterpart is that it can yield inconsistent
and biased estimates if the unobserved fixed effects are correlated with the remaining
component of the error term. However, this is unlikely to be a serious problem in our
case because the number of explanatory variables is larger than the number of ‘within’
observations (Wooldridge 2002, Chapter 10). The random effect estimator also has the
added advantage of taking caring of the serial correlation problem. The results are
reported in Table 5. Nevertheless, the corresponding pooled cross-section estimations
are reported for the purpose of comparison. The random-effects and pooled cross-
section estimates are remarkably similar, suggesting that unobserved effects would be
relatively unimportant in our model.
Studies of FDI spillovers are subject to a criticism about a possibility of a
simultaneity problem. The positive relationship between foreign presence and plant

22
productivity might be interpreted as reflecting the fact that foreign investment gravitates
towards more productive industries rather than representing any technology spillover
from FDI (Haddad & Harrison, 1993; Aitken & Harrison, 1999). The general response
in the literature is to undertake fixed-effect panel estimation. Nevertheless, our
estimation results are less likely to be subject to a simultaneity problem as FOR in this
study is a pre-determined variable obtained from the 1996 industrial census. In theory, it
is arguable that a pre-determined variable might contain expectations of future
outcomes hence the simultaneity problem remains unsolved. For example, current
investment of MNEs would be a result of their expectation of productivity gains in the
future. This argument is less likely to apply for this study since foreign presence here is
measured by output share of current economic activities, and is unlikely to contain any
future expectation. Even though FOR reflects the distribution of foreign presence in
1996, as argued in Ramstetter (2003), the relative importance of foreign firms remains
unchanged during the past decade starting in 1996.
6.1 Is the foreign plant more productive than the locally-owned one?
Before we examine whether there are FDI spillovers and its relative importance between
horizontal and vertical spillovers, we ask a simple question; is the foreign plant is more
productive than the locally owned one? Even though it is theoretically expected that
MNC affiliates should be more productive than locally non-affiliated firms (Caves,
2007), it is not always true as suggested in several empirical studies such as Ramstetter
(2006) in the case of Thai manufacturing. Menon (1998) and Oguchi et al. (2002) in the
case of Malaysian manufacturing.
To do so, Equation 5 discussed above is modified. First, the sample will cover
both foreign- and locally owned plants. Second, FOR and its related variables (its
interaction terms with jERP and ijtQL as well as jBACK , and jFORW ) are replaced by
ownership variable (OWN) measured by a binary dummy variable which equals to 1 if
foreign ownership is greater than 10 per cent and zero otherwise. By definition, FDI
reflects the objective of an entity resident in one country to obtain a long-term
relationship between the direct investor and the host country enterprise, in which the

23
former has a significant degree of influence on the management of the latter. However,
the significant degree does not necessarily mean majority ownership. Hence this study
follows the dominant current definition by the International Monetary Fund (IMF) and
other institutes such as the Organization for Economic Co-operation and Development
(OECD), the US Department of Commence as well as several scholars studying
multinational firms, which use 10 per cent.13 Nevertheless, we also use the actual
foreign ownership share (OWN1) as an alternative measure to examine the sensitivity of
results. . A statistical significance of OWN indicates the productivity difference.
The result of the productivity determinant equation is reported in Table 4. The
first and second columns are the results of pooled cross-sectional and random-effected
estimations, respectively. Our following discussion will be based on the latter because
of the reasons discussed above. The estimated equation passes the Wald- test for overall
statistical significance at the 1 per cent level. The statistical significance of coefficients
corresponding to the primary inputs (capital, production workers and non-production
workers), their interactions, and some of their squared terms suggests that the
assumption imposed in the Cobb-Douglas production function is not supported by plant-
level panel data of Thai manufacturing. Even though translog functional form
specification is likely to be affected by the multicollinearity problem and standard error
is inflated, coefficients associated with the squared values of capital and production
workers are statistically significant at the one per cent level or better. It suggests that
such a multicollinearity problem would not create any severe effect on the regression
outcome. In particular, in the presence of the multicollinearity problem the effect still
shows up, simply because the true value itself is so large that even an estimate on the
downside still shows up as significant (Johnson, 1984: 249).
A coefficient corresponding to OWN is statistically significant. It suggests that
all other things (e.g. inputs level and scale effects) being equal, the foreign plant tends
to exhibit higher value added than the locally owned one. The coefficient of 0.21
indicates that the productivity difference between foreign and locally owned plants is
13 For example, the early Harvard studies under the direction of Raymond Vernon: Vaupel & Curhan, (1969: p.3) and Wilkins (1970), both cited in Lipsey (2001)
24
about 21 per cent on average after controlling input levels and scale effects. We also
find that exporting firms tend to exhibit a higher level of productivity than non-
exporting ones as the coefficient corresponding to MKT turns out to be positive and
significant. Such evidence supports the consensus in the literature of the export-
productivity nexus that export-oriented plants tend to be more productive than
domestic-oriented plants.
.
Impacts of producer concentration and trade protection on plant productivity are
to certain extent consistent with the findings of previous studies, i.e. Kohpaiboon &
Jongwanich (forthcoming) using the , Industrial Census 1996 data set. That is, the net
impact of producer concentration on plant productivity is not automatic, but does depen
on the degree of tariff protection. Tariff reduction must reach a certain level before the
potential positive impact of producer concentration on productivity is observed.
Similarly, insulating firms from foreign competition is not sufficient to promote plant
productivity improvement. In a highly concentrated industry, high protection tends to
induce producers to become ‘unresponsive’ to improved technological capability and to
retard productivity growth.14
(Insert Table 5 about here)
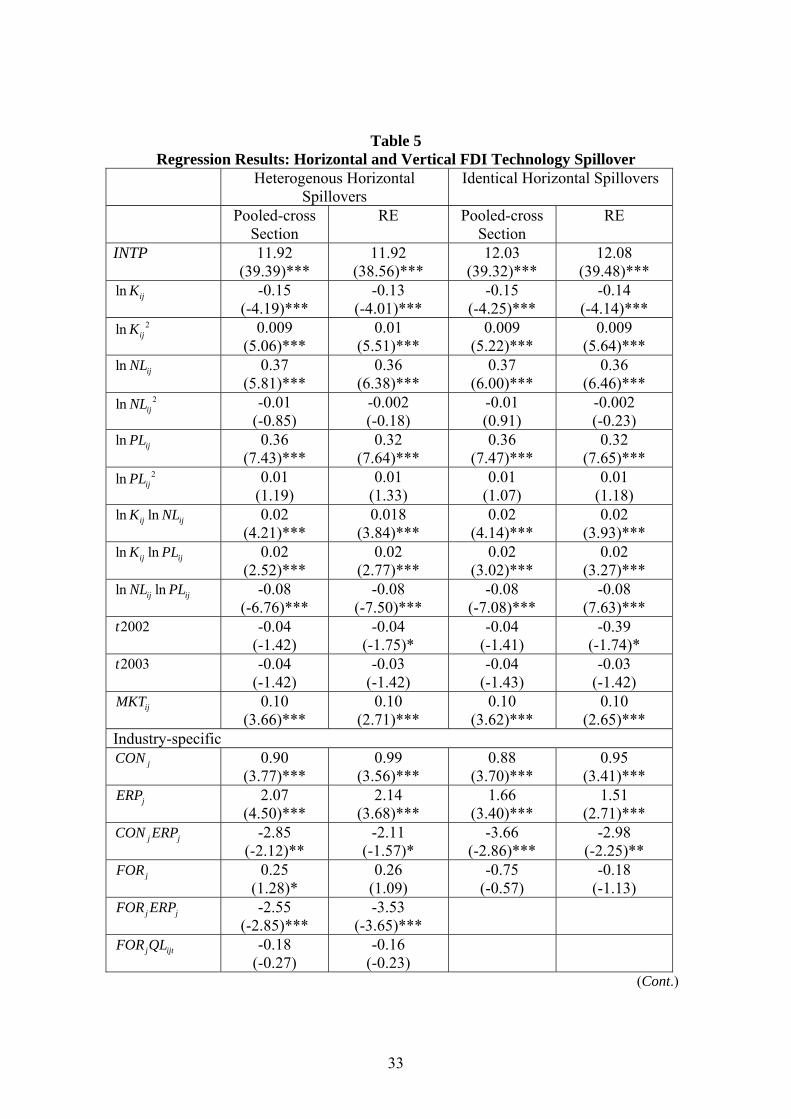
6.2 Horizontal and Vertical FDI Spillovers In this subsection the core hypothesis of this paper, namely the presence of horizontal
and vertical FDI spillovers, is addressed. Their regression results are reported in Table
14 Statistical significance of the interaction coefficient is very marginal at 15 per cent
(one-tailed test). As seen in Section 6.2 when the sample covers only locally owned firms, the interaction term turns out to be statistically significant at five per cent. This would be consistent to the aggregate trend discussed in Section 3 that foreign plants in Thailand tend to be located in efficient-seeking industries especially electronics, electrical appliances and automobiles. In fact FDI in automobile industry started with the traditional tariff-hopping style which aimed for a highly protected domestic market. As argued in Kohpaiboon (2006b and 2007), FDI inflows increased significantly in the 1990s with a shift in investment motivation to efficiency-seeking. Such foreign plants are keen to improve their production efficiency and strengthen their international competitiveness. This occurs even in a highly concentrated environment. Therefore, when foreign plants are included, this could weaken the proposed non-linear relationship among productivity, producer concentration and protection to some extent.
25
5. While both pooled cross-sectional and random-effect estimations are reported in the
first two columns of Table 5 for the sake of comparison, our discussion will emphasise
random-effect estimations. The overall significance test (Wald test) is passed at the one
per cent level. In general, most of the firm- and industry-specific variables (i.e. K, NL,
PL, MKT, CR4, ERP and 4*CR ERP ) turn out to be statistically significant and are in
line with what are found in the productivity determinant equation in the previous
section.
(Insert Table 5 about here)
Regression results support the hypothesis that horizontal FDI spillovers can vary
across industry. The found negative coefficient of FOR*ERP fails to reject the
‘Bhagwati hypothesis’. Given the extent of foreign presence, locally owned plants
operating in industries with more liberal trade regimes exhibit higher value added than
those operating in the less liberal regimes. The evidence that the coefficient of FOR is
not statistically different from zero points out that foreign presence could either
negatively or positively affect the local plant’s productivity, depending on the nature of
the trade policy regime, i.e. ERP greater or less than zero. As shown in Figure 2, there
are many export-oriented industries experiencing negative ERP such as processed foods
(ISIC 1511 and 1512), leather products (ISIC 1911). The negative figure is largely due
to the presence of cost in tariff drawback schemes (e.g. bank guarantees). The
econometric findings in these studies are also in line with those in previous studies, i.e.
Balasubramanyam et al. (1996), Athukorala & Chand (2000), Kohpaiboon (2003:
2006a) and Kokko et al. (2001).
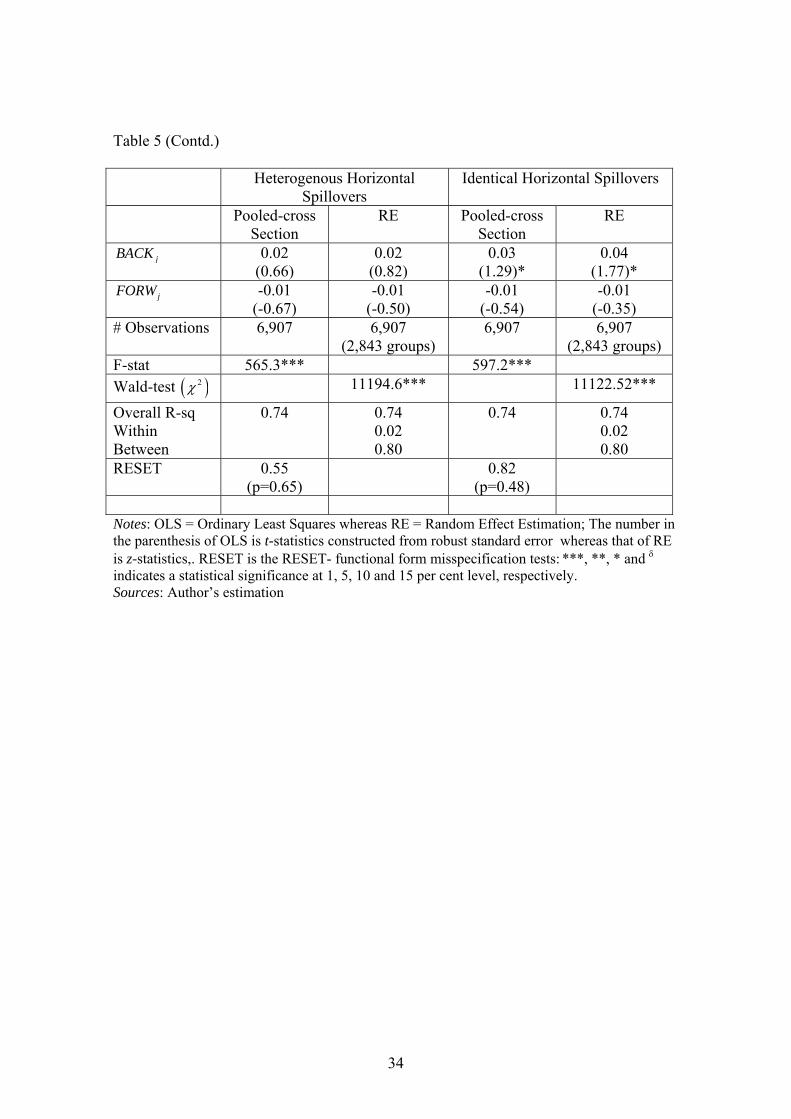
The interaction between foreign presence and absorptive capability is not
statistically different from zero. The statistic insignificance does not reject the role of
absorptive capability in conditioning gains from horizontal FDI spillovers. The failure
to uncover its statistic significance could be due to a measuring problem. In particular,
the definition of non-production workers in the survey is wide, covering not only
supervisors and management workers but also clerical and administrative staff.
Interestingly when identical horizontal spillovers are relaxed, statistical significance of
vertical spillovers from both backward and forward linkages is not found. The
26
coefficient corresponding to jBACK is positive but not statistically different from zero.
The coefficient corresponding to jFORW turns out to be negative but insignificant.
In general, the key finding in this study (that there are only horizontal spillovers,
not vertical ones) run counter to that of Javorcik, (2004) and Blalock & Gertler (2008)
relating to Lithunian and Indonesian manufacturing sectors, respectively. They have
uncovered a statistically significant positive spillover through backward linkages but
not horizontal spillovers. We suspect that the failure to appropriately control for
relevant explanatory variables may have biased the results of these studies.
Interestingly, our data set permits us to replicate their results through similar (arbitrary)
variable choice. That is, equation 5 is re-estimated by dropping two interaction terms
with horizontal FDI spillovers, i.e. imposing an assumption of identical horizontal
spillovers. The results are in line with Javorcik (2004) and Blalock & Gertler (2008).
Only the coefficient corresponding to jBACK is statistically significant at 10 per cent.
We rather argue that our model is more preferable as the results seem to be in
line with the industrialization path in developing countries including Thailand. As
argued in Hugh (2001) several developing Southeast Asian economies pursue the so
called ‘dualistic approach’ in opening up international trade, i.e. they are still reluctant
to cut tariffs but opt for tariff drawback schemes as a key instrument to promote an
export-led industrialization strategy. For instance, Thailand has been conservative in
opening the door for foreign made goods for the past three decades, as indicated in the
fact that its applied tariff rates remain at the highest of the six original ASEAN
countries (Jongwanich & Kohpaiboon, 2007).
Under such a policy setup, two options are available for entrepreneurs, including
MNEs. In Option 1, entrepreneurs aim to be a part of the global economy in which
resource allocation is directed according to factor proportion consideration for neo-
classical efficiency. Firms in this option tend to be more export-oriented. By contrast,
Option 2 encourages entrepreneurs to set up plants and supply highly protected local
markets in order to benefit from protection-induced economic rents. Even though
27
MNEs can occur in both options, MNEs existing in the first option (efficiency-seeking
MNEs) tends to be more beneficial than those in the second option (market-seeking
MNEs) argued in Athukorala and Chand (2000) based on US MNEs experience.
In this circumstance, backward linkages would hardly occur and nor would
vertical spillovers. Export-oriented firms including MNEs are unlikely to source local
intermediates because of the presence of intermediate tariffs so that they seem to
operate in ‘enclaves’ in isolation from local suppliers. In the meantime, highly
protected domestic markets encourage indigenous suppliers to find their own niche
markets that are not directly related to what exporting firms want. As long as the policy-
induced incentive structure still creates the economic rents, it would be difficult to find
qualified suppliers.
That would explain why MNEs which have played an important role in
Thailand’s industrialization generate limited backward linkages to indigenous firms.
Limited backward linkages are observed in several leading export-oriented industries in
Thailand such as the automotive, garment and hard disk drive industries (Kohpaiboon,
2006b; 2007 and 2008 and 2009). For example, while locally assembled vehicles in
Thailand are reliant largely on locally manufactured parts, as illustrated by the
proportion of imported parts to vehicle production, the number of purely Thai firms
must be around 10 suppliers, comparing to 287 MNE suppliers. Another example, the
ratio of imported fabric to garment production in Thailand has been increasing since
1996 (Kohpaiboon, 2008: Figure 4). The same evidence is also found in the case of the
Hard Disk Drive industry (Kohpaiboon, 2009).
7. Conclusion and Policy Inferences This paper examines FDI spillovers in Thai manufacturing, using industrial surveys
during the period 2001-03. A panel data econometric analysis of plant productivity
determinants of locally owned plants is undertaken. The paper goes beyond the existing
literature in two ways. First, both horizontal and vertical FDI spillovers are tested. In
addition, both direct and indirect (inter-sectoral) repercussions are captured in the

28
measurement process of industrial linkages. Secondly, horizontal FDI spillovers are
allowed to be different from one industry to the other instead of assuming identical
values across industries.
The key finding is that advanced technology associated with MNE affiliates
does not always spill over to the local plants operating in the same industry. The extent
of spillovers depends on the nature of the trade policy regime. Only industries operating
under a liberal trade policy regime experience positive horizontal FDI spillovers.
Neither backward nor forward spillovers are found in our study. This seems to be in
contradiction with the existing literature highlighting the relative importance of
backward linkages as a likely FDI spillover channel. Statistical significance of vertical
spillovers through backward linkages is found only if an assumption of identical
horizontal FDI spillover is in place. Such an assumption seems to be restrictive. The
finding that export-oriented plants have higher productivity than domestic-market-
oriented ones further highlight the role of trade policy regime on plant productivity
improvement process. Trade liberalization and its induced contestability environment
are an effective catalyst for firms to continue to improve their productivity. Besides,
only in low tariff environment, the positive impact of producer concentration on plant
productivity is observed.
Two policy inferences can be drawn from this study. First these results further
highlight the relative importance of the trade policy regime for productivity
enhancement and thus development policy. Liberalizing the foreign investment regime
thus has to go hand in hand with liberalizing trade policy to maximize gains from MNE
presence. Trade liberalization itself also creates contestability environment that is
conducive for firms to continue improving their productivity. Secondly, while the
relative importance of the linkage channel and its corresponding spillovers seems to be
a convincing argument, our work here provides a warning for policymakers not
overemphasize it. The conducive role of the backward linkage channel is a result of
natural links that are driven by economic concerns and can be distorted by policy
measures. The ability of the policy domain to forge linkages seems to be limited.
Policy-induced linkages are not perfectly substitutes for natural linkages. This issue is

29
increasingly important under a rising threat of the return of nationalism and
protectionism in the incoming global economic recession. The magnitude of linkages is
not a good proxy of the magnitude of vertical FDI spillovers. The quality of backward
linkages is a far better indication. Where quality is concerned, backward linkages
driven by economic concerns as well as motivated by capability of indigenous suppliers
are by far superior to that induced by policy measures.
30
Table 1
Sample Coverage of Office of Industrial Economics Survey
Year % of Thai Manufacturing Sector Number of Plants
Value Added Output Employment Before
Cleaning After
Cleaning
2001 45.3 52.6 24.5 4,365 3,373 2002 41.1 53.7 25.5 3,986 3,328 2003 33.8 42.4 24.5 3,521 3,153
Average 40.1 49.6 24.8
Source: Author’s compilation from OIE Survey whereas value added and output of the manufacturing sector are from National Economics and Social Development Board (NESDB). Labor force is from Key Indicators for Asia and the Pacific 2008, Asian Development Bank.
Table 2 A Statistical Summary of the Key Variables
Unit Mean SD Min Max
ijtVD (ln) million baht 16.32 1.92 6.00 24.00 ijtK (ln)million baht) 16.11 2.36 5.00 24.00
ijtNL (ln) workers 2.71 1.35 0.00 7.00 ijtPL (ln) workers 4.50 1.44 0.00 9.00
ijtMKT zero-one dummy 0.29 0.45 0.00 1.00 jCON (ln) proportion 0.44 0.11 0.23 0.69
jERP (ln) proportion 0.12 0.14 -0.30 0.58 jFOR (ln) proportion 0.36 0.15 0.00 0.69
ijtQL (ln) proportion 0.16 0.11 0.00 0.67 jBACK (ln) proportion 1.08 0.90 0.02 7.17 jFORW (ln) proportion 1.23 1.00 0.00 5.27
Notes: aMean = simple average; SD = standard deviation; Min = minimum; and Max = maximum; bEstimates of ijtVD , ijtK , ijtNL and ijtPL are the logarithmic transformation of their value. The other variables are converted into logarithmic form as log(1+x) where x is the variable Source : Author’s computations based on data sources described in the text.
31
Table 3 Correlation Matrix of the Variables
ijtVD ijtK ijtNL
ijtPL ijtMKT
jCON
jERP
jFOR ijtQL jBACK
jFORW
ijtVD 1.00
ijtK 0.75 1.00
ijtNL 0.71 0.65 1.00
ijtPL 0.77 0.66 0.72 1.00
ijtMKT 0.28 0.19 0.27 0.40 1.00
jCON -0.11 -0.13 -0.06 -0.07 0.05 1.00
jERP 0.01 -0.05 0.01 0.09 0.12 0.15 1.00
jFOR -0.03 -0.05 -0.07 -0.05 -0.01 0.11 -0.15 1.00
ijtQL -0.10 -0.04 0.30 -0.36 -0.22 0.00 -0.12 -0.02 1.00
jBACK 0.01 -0.01 -0.03 -0.01 -0.01 0.10 -0.03 0.25 -0.01 1.00
jFORW -0.11 -0.05 -0.13 -0.20 -0.22 0.04 -0.23 0.19 0.09 0.09 1.00 Source: Author’s computations based on data sources described in the text.

32
Table 4 Regression Results of Productivity Determinants
OLS RE INTP 11.99
(48.70)*** 11.88
(48.32)*** ln ijK -0.17
(-6.01)*** -0.14
(-5.21)*** 2ln ijK 0.01
(8.71)*** 0.01
(8.76)*** ln ijNL 0.41
(8.50)*** 0.41
(9.25)*** 2ln ijNL -0.002
(0.20) 0.005 (0.62)
ln ijPL 0.40 (10.35)***
0.36 (10.35)***
2ln ijPL 0.024 (2.74)***
0.02 (2.43)**
ln lnij ijK NL 0.02 (4.08)***
0.01 (3.73)***
ln lnij ijK PL 0.01 (1.8)**
0.01 (2.67)***
ln lnij ijNL PL -0.09 (-10.20)***
-0.09 (-10.94)***
2002t -0.04 (-1.76)*
-0.04 (-2.06)**
2003t -0.037 (-1.50)
-0.03 (-1.42)
ijMKT 0.07 (3.11)***
0.08 (2.62)***
ijOWN 0.21 (8.82)***
0.21 (6.51)***
Industry-specific jCON 0.63
(3.53)*** 0.72
(3.36)*** jERP 0.79
(2.11)** 0.88
(1.94)** j jCON ERP -1.01
(-1.05)δ -1.09
(1.02) δ # Observations 9,815 9,815 (3,963 groups) F-stat 1132.9 *** 19788.5 *** R-sq 0.78 0.78 RESET 1.50 (p=0.21) Notes: OLS = Ordinary Least Squares whereas RE = Random Effect Estimation; The number in the parenthesis of OLS is t-statistics constructed from robust standard error whereas that of RE is z-statistics,. RESET is the RESET- functional form misspecification tests; ***,**, * and δ indicates a statistical significance at 1, 5, 10 and 15 per cent level, respectively. Sources: Author’s estimation
33
Table 5 Regression Results: Horizontal and Vertical FDI Technology Spillover
Heterogenous Horizontal Spillovers
Identical Horizontal Spillovers
Pooled-cross Section
RE Pooled-cross Section
RE
INTP 11.92 (39.39)***
11.92 (38.56)***
12.03 (39.32)***
12.08 (39.48)***
ln ijK -0.15 (-4.19)***
-0.13 (-4.01)***
-0.15 (-4.25)***
-0.14 (-4.14)***
2ln ijK 0.009 (5.06)***
0.01 (5.51)***
0.009 (5.22)***
0.009 (5.64)***
ln ijNL 0.37 (5.81)***
0.36 (6.38)***
0.37 (6.00)***
0.36 (6.46)***
2ln ijNL -0.01 (-0.85)
-0.002 (-0.18)
-0.01 (0.91)
-0.002 (-0.23)
ln ijPL 0.36 (7.43)***
0.32 (7.64)***
0.36 (7.47)***
0.32 (7.65)***
2ln ijPL 0.01 (1.19)
0.01 (1.33)
0.01 (1.07)
0.01 (1.18)
ln lnij ijK NL 0.02 (4.21)***
0.018 (3.84)***
0.02 (4.14)***
0.02 (3.93)***
ln lnij ijK PL 0.02 (2.52)***
0.02 (2.77)***
0.02 (3.02)***
0.02 (3.27)***
ln lnij ijNL PL -0.08 (-6.76)***
-0.08 (-7.50)***
-0.08 (-7.08)***
-0.08 (7.63)***
2002t -0.04 (-1.42)
-0.04 (-1.75)*
-0.04 (-1.41)
-0.39 (-1.74)*
2003t -0.04 (-1.42)
-0.03 (-1.42)
-0.04 (-1.43)
-0.03 (-1.42)
ijMKT 0.10 (3.66)***
0.10 (2.71)***
0.10 (3.62)***
0.10 (2.65)***
Industry-specific jCON 0.90
(3.77)*** 0.99
(3.56)*** 0.88
(3.70)*** 0.95
(3.41)*** jERP 2.07
(4.50)*** 2.14
(3.68)*** 1.66
(3.40)*** 1.51
(2.71)*** j jCON ERP -2.85
(-2.12)** -2.11
(-1.57)* -3.66
(-2.86)*** -2.98
(-2.25)** jFOR 0.25
(1.28)* 0.26
(1.09) -0.75
(-0.57) -0.18
(-1.13) j jFOR ERP -2.55
(-2.85)*** -3.53
(-3.65)***
j ijtFOR QL -0.18 (-0.27)
-0.16 (-0.23)
(Cont.)
34
Table 5 (Contd.) Heterogenous Horizontal
Spillovers Identical Horizontal Spillovers
Pooled-cross Section
RE Pooled-cross Section
RE
jBACK 0.02 (0.66)
0.02 (0.82)
0.03 (1.29)*
0.04 (1.77)*
jFORW -0.01 (-0.67)
-0.01 (-0.50)
-0.01 (-0.54)
-0.01 (-0.35)
# Observations 6,907 6,907 (2,843 groups)
6,907 6,907 (2,843 groups)
F-stat 565.3*** 597.2*** Wald-test ( )2χ 11194.6*** 11122.52***
Overall R-sq Within Between
0.74 0.74 0.02 0.80
0.74 0.74 0.02 0.80
RESET 0.55 (p=0.65)
0.82 (p=0.48)
Notes: OLS = Ordinary Least Squares whereas RE = Random Effect Estimation; The number in the parenthesis of OLS is t-statistics constructed from robust standard error whereas that of RE is z-statistics,. RESET is the RESET- functional form misspecification tests: ***, **, * and δ indicates a statistical significance at 1, 5, 10 and 15 per cent level, respectively. Sources: Author’s estimation
35
Figure 1 Correlation between productivity gap and difference in capital-labour ratio between
foreign establishment and indigenous plants during the period 2001-03
-100.0
0.0
100.0
200.0
300.0
400.0
500.0
600.0
700.0
0.0 5.0 10.0 15.0 20.0 25.0 30.0 35.0 40.0
% D
iffer
ence
in c
apita
l lab
our r
atio
% Difference in labour productivity
Notes: Productivity gap % VA
L⎛ ⎞Δ⎜ ⎟⎝ ⎠
is measured as the difference in labour productivity between
foreign establishment and indigenous plants as a per cent of labour productivity of the latter. % Difference in capital labour ratio between foreign establishment and indigenous plants
% KL
⎛ ⎞Δ⎜ ⎟⎝ ⎠
is measured in the similar way as productivity gap. Linear line here is based on the
simple ordinary least square estimation in which % VAL
⎛ ⎞Δ⎜ ⎟⎝ ⎠
is a dependent variable and
% KL
⎛ ⎞Δ⎜ ⎟⎝ ⎠
as the explanatory variable. This is to draw general statistic inference.
% VAL
⎛ ⎞Δ⎜ ⎟⎝ ⎠
= 77.8 + 0.14 % KL
⎛ ⎞Δ⎜ ⎟⎝ ⎠
(7.01)*** (5.86)*** (t-stat is in parenthesis)
Sources: Author’s compilation. See the full data in Appendix 1.
36
Figure 2 Correlation between foreign presence (FOR) and effective rate of protection (ERP)
-0.40-0.30-0.20-0.100.000.100.200.300.400.500.600.70
0.00 0.10 0.20 0.30 0.40 0.50 0.60 0.70 0.80
ERP
FOR
Notes: Linear line here is based on the simple ordinary least square estimation in which FOR is a dependent variable and ERP as the explanatory variable. This is to draw general statistic inference. FOR= 0.44 - 0.33 ERP (18.7)*** (-2.66)***
(t-stat is in parenthesis) Sources: Author’s compilation. See the full data in Appendix 1.

37
Figure 3
Correlation between foreign presence (FOR) and backward linkage index (BLI)
0.00
0.20
0.40
0.60
0.80
1.00
1.20
0.00 0.10 0.20 0.30 0.40 0.50 0.60 0.70 0.80
FOR
BLI
Notes: The statistical relationship between FOR and BLI is not significantly different from zero based on the simple ordinary least square estimation in which FOR is a dependent variable and BLI as the explanatory variable. FOR= 0.41 - 0.004 BLI (12.9)*** (-0.08) (t-stat is in parenthesis) Sources: Author’s compilation. See the full data in Appendix 1.
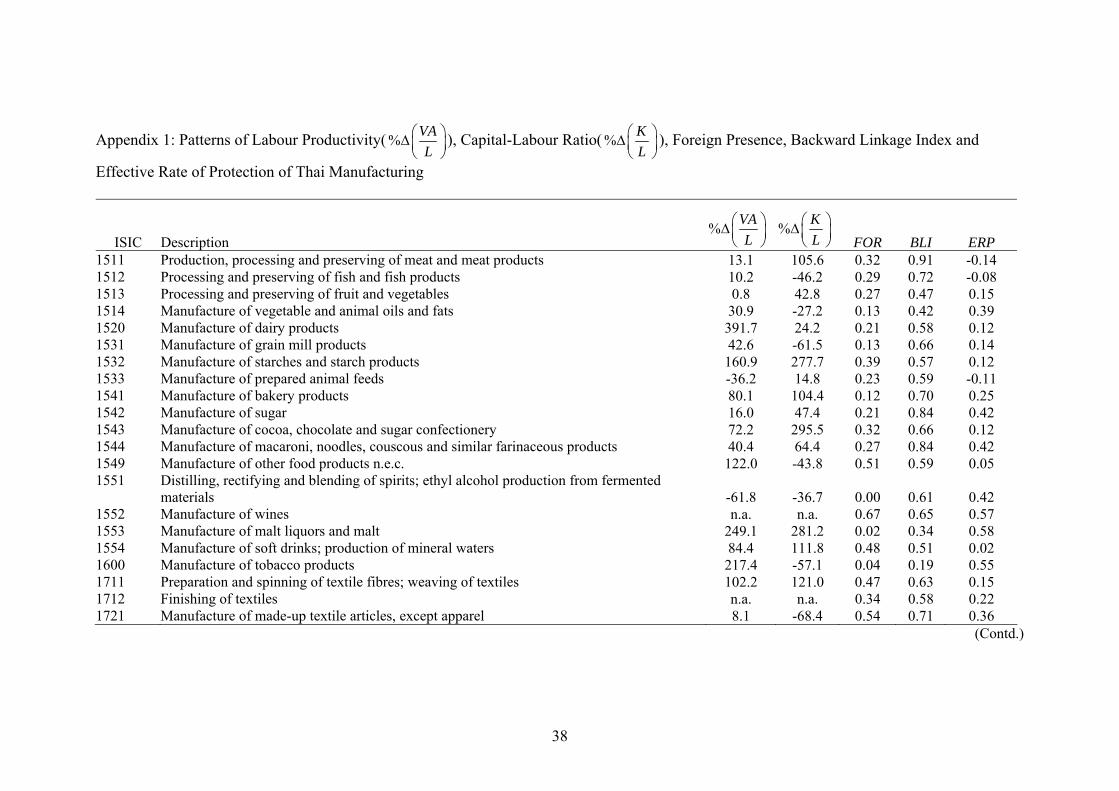
38
Appendix 1: Patterns of Labour Productivity( % VAL
⎛ ⎞Δ⎜ ⎟⎝ ⎠
), Capital-Labour Ratio( % KL
⎛ ⎞Δ⎜ ⎟⎝ ⎠
), Foreign Presence, Backward Linkage Index and
Effective Rate of Protection of Thai Manufacturing
ISIC Description % VA
L⎛ ⎞Δ⎜ ⎟⎝ ⎠
% KL
⎛ ⎞Δ⎜ ⎟⎝ ⎠ FOR BLI ERP
1511 Production, processing and preserving of meat and meat products 13.1 105.6 0.32 0.91 -0.14 1512 Processing and preserving of fish and fish products 10.2 -46.2 0.29 0.72 -0.08 1513 Processing and preserving of fruit and vegetables 0.8 42.8 0.27 0.47 0.15 1514 Manufacture of vegetable and animal oils and fats 30.9 -27.2 0.13 0.42 0.39 1520 Manufacture of dairy products 391.7 24.2 0.21 0.58 0.12 1531 Manufacture of grain mill products 42.6 -61.5 0.13 0.66 0.14 1532 Manufacture of starches and starch products 160.9 277.7 0.39 0.57 0.12 1533 Manufacture of prepared animal feeds -36.2 14.8 0.23 0.59 -0.11 1541 Manufacture of bakery products 80.1 104.4 0.12 0.70 0.25 1542 Manufacture of sugar 16.0 47.4 0.21 0.84 0.42 1543 Manufacture of cocoa, chocolate and sugar confectionery 72.2 295.5 0.32 0.66 0.12 1544 Manufacture of macaroni, noodles, couscous and similar farinaceous products 40.4 64.4 0.27 0.84 0.42 1549 Manufacture of other food products n.e.c. 122.0 -43.8 0.51 0.59 0.05 1551 Distilling, rectifying and blending of spirits; ethyl alcohol production from fermented
materials -61.8 -36.7 0.00 0.61 0.42 1552 Manufacture of wines n.a. n.a. 0.67 0.65 0.57 1553 Manufacture of malt liquors and malt 249.1 281.2 0.02 0.34 0.58 1554 Manufacture of soft drinks; production of mineral waters 84.4 111.8 0.48 0.51 0.02 1600 Manufacture of tobacco products 217.4 -57.1 0.04 0.19 0.55 1711 Preparation and spinning of textile fibres; weaving of textiles 102.2 121.0 0.47 0.63 0.15 1712 Finishing of textiles n.a. n.a. 0.34 0.58 0.22 1721 Manufacture of made-up textile articles, except apparel 8.1 -68.4 0.54 0.71 0.36
(Contd.)

39
Appendix 1 (contd.)
ISIC Description % VA
L⎛ ⎞Δ⎜ ⎟⎝ ⎠
% KL
⎛ ⎞Δ⎜ ⎟⎝ ⎠ FOR BLI ERP
1722 Manufacture of carpets and rugs n.a. n.a. 0.58 0.74 0.06 1723 Manufacture of cordage, rope, twine and netting n.a. n.a. 0.34 0.64 0.12 1729 Manufacture of other textiles n.e.c. 118.9 244.6 0.63 0.64 0.18 1730 Manufacture of knitted and crocheted fabrics and articles -0.6 37.9 0.39 0.65 0.13 1810 Manufacture of wearing apparel, except fur apparel 18.0 -11.4 0.31 0.68 0.37 1911 Tanning and dressing of leather 65.2 161.9 0.24 0.89 -0.30 1912 Manufacture of luggage, handbags and the like, saddlery and harness 25.9 196.6 0.34 0.49 0.23 1920 Manufacture of footwear -8.7 -16.0 0.29 0.64 0.06 2010 Sawmilling and planing of wood 27.8 186.0 0.15 0.29 0.02 2021 Manufacture of veneer sheets; manufacture of plywood, laminboard, particle board and other
panels and boards -49.0 -10.3 0.37 0.35 0.03 2022 Manufacture of builders' carpentry and joinery 61.3 49.4 0.06 0.35 0.03 2029 Manufacture of other products of wood; manufacture of articles of cork, straw and plaiting
materials n.a. n.a. 0.21 0.54 0.45 2101 Manufacture of pulp, paper and paperboard -44.6 106.5 0.52 0.33 0.03 2102 Manufacture of corrugated paper and paperboard and of containers of paper and paperboard 53.2 78.5 0.16 0.35 0.13 2109 Manufacture of other articles of paper and paperboard 112.3 100.3 0.50 0.41 0.15 2221 Printing 23.3 -20.6 0.10 0.46 0.17 2320 Manufacture of refined petroleum products 370.3 817.6 0.44 0.14 0.04 2411 Manufacture of basic chemicals, except fertilizers and nitrogen compounds 87.0 160.7 0.37 0.35 0.07 2413 Manufacture of plastics in primary forms and of synthetic rubber 81.0 88.7 0.46 0.51 0.15 2421 Manufacture of pesticides and other agro-chemical products n.a. n.a. 0.64 0.44 0.03 2422 Manufacture of paints, varnishes and similar coatings, printing ink and mastics 97.8 164.2 0.60 0.52 0.01 2423 Manufacture of pharmaceuticals, medicinal chemicals and botanical products 276.1 56.0 0.17 0.41 0.00 2424 Manufacture of soap and detergents, cleaning and polishing preparations, perfumes and
toilet preparations 284.8 424.7 0.52 0.49 0.02 2429 Manufacture of other chemical products n.e.c. n.a. n.a. 0.53 0.54 0.06
(Contd.)
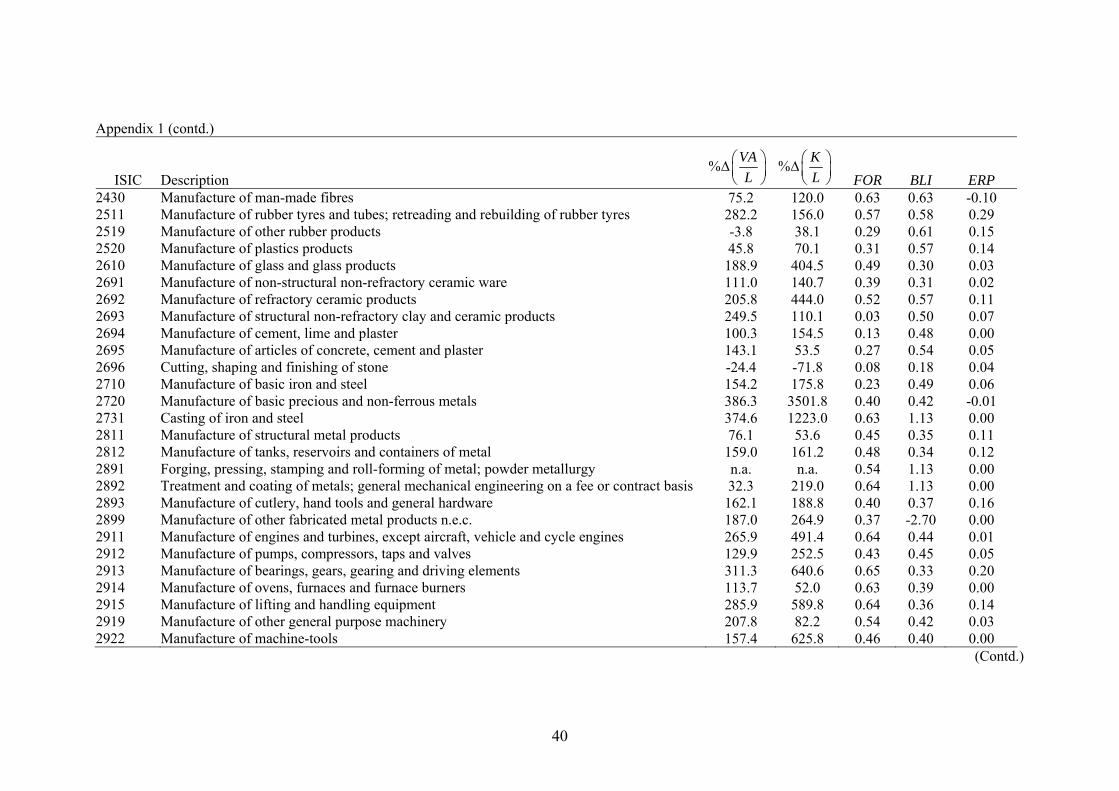
40
Appendix 1 (contd.)
ISIC Description % VA
L⎛ ⎞Δ⎜ ⎟⎝ ⎠
% KL
⎛ ⎞Δ⎜ ⎟⎝ ⎠ FOR BLI ERP
2430 Manufacture of man-made fibres 75.2 120.0 0.63 0.63 -0.10 2511 Manufacture of rubber tyres and tubes; retreading and rebuilding of rubber tyres 282.2 156.0 0.57 0.58 0.29 2519 Manufacture of other rubber products -3.8 38.1 0.29 0.61 0.15 2520 Manufacture of plastics products 45.8 70.1 0.31 0.57 0.14 2610 Manufacture of glass and glass products 188.9 404.5 0.49 0.30 0.03 2691 Manufacture of non-structural non-refractory ceramic ware 111.0 140.7 0.39 0.31 0.02 2692 Manufacture of refractory ceramic products 205.8 444.0 0.52 0.57 0.11 2693 Manufacture of structural non-refractory clay and ceramic products 249.5 110.1 0.03 0.50 0.07 2694 Manufacture of cement, lime and plaster 100.3 154.5 0.13 0.48 0.00 2695 Manufacture of articles of concrete, cement and plaster 143.1 53.5 0.27 0.54 0.05 2696 Cutting, shaping and finishing of stone -24.4 -71.8 0.08 0.18 0.04 2710 Manufacture of basic iron and steel 154.2 175.8 0.23 0.49 0.06 2720 Manufacture of basic precious and non-ferrous metals 386.3 3501.8 0.40 0.42 -0.01 2731 Casting of iron and steel 374.6 1223.0 0.63 1.13 0.00 2811 Manufacture of structural metal products 76.1 53.6 0.45 0.35 0.11 2812 Manufacture of tanks, reservoirs and containers of metal 159.0 161.2 0.48 0.34 0.12 2891 Forging, pressing, stamping and roll-forming of metal; powder metallurgy n.a. n.a. 0.54 1.13 0.00 2892 Treatment and coating of metals; general mechanical engineering on a fee or contract basis 32.3 219.0 0.64 1.13 0.00 2893 Manufacture of cutlery, hand tools and general hardware 162.1 188.8 0.40 0.37 0.16 2899 Manufacture of other fabricated metal products n.e.c. 187.0 264.9 0.37 -2.70 0.00 2911 Manufacture of engines and turbines, except aircraft, vehicle and cycle engines 265.9 491.4 0.64 0.44 0.01 2912 Manufacture of pumps, compressors, taps and valves 129.9 252.5 0.43 0.45 0.05 2913 Manufacture of bearings, gears, gearing and driving elements 311.3 640.6 0.65 0.33 0.20 2914 Manufacture of ovens, furnaces and furnace burners 113.7 52.0 0.63 0.39 0.00 2915 Manufacture of lifting and handling equipment 285.9 589.8 0.64 0.36 0.14 2919 Manufacture of other general purpose machinery 207.8 82.2 0.54 0.42 0.03 2922 Manufacture of machine-tools 157.4 625.8 0.46 0.40 0.00
(Contd.)
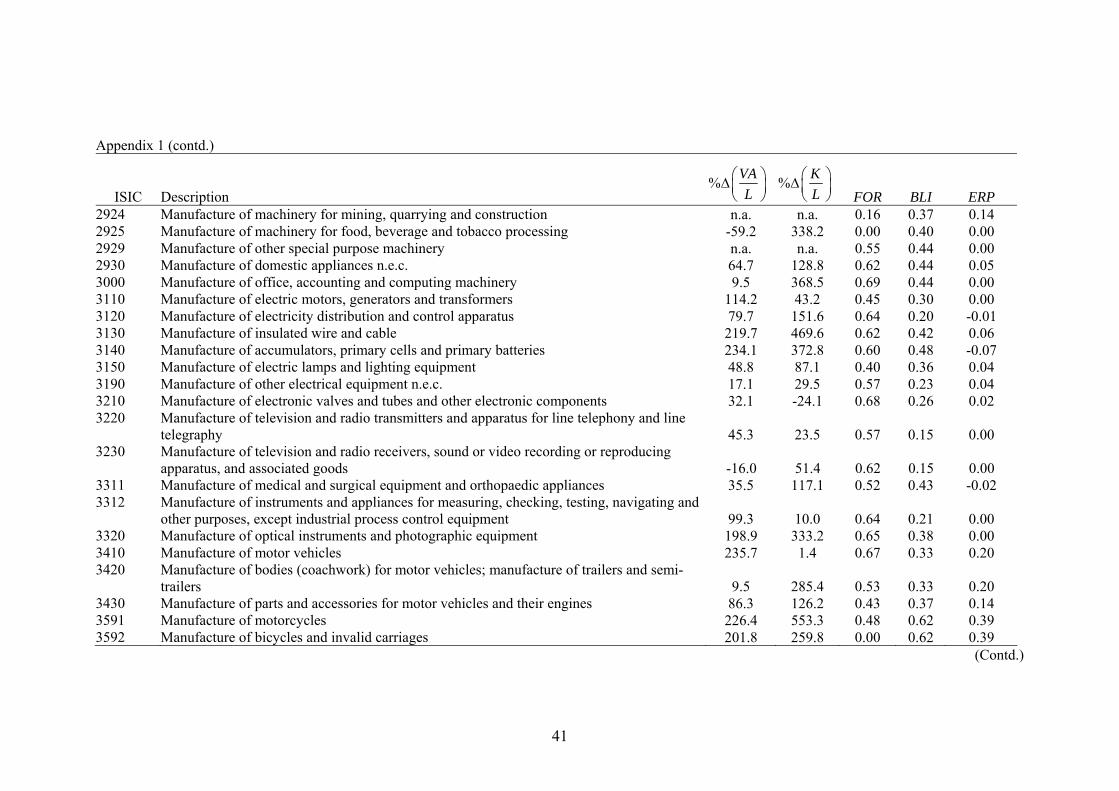
41
Appendix 1 (contd.)
ISIC Description % VA
L⎛ ⎞Δ⎜ ⎟⎝ ⎠
% KL
⎛ ⎞Δ⎜ ⎟⎝ ⎠ FOR BLI ERP
2924 Manufacture of machinery for mining, quarrying and construction n.a. n.a. 0.16 0.37 0.14 2925 Manufacture of machinery for food, beverage and tobacco processing -59.2 338.2 0.00 0.40 0.00 2929 Manufacture of other special purpose machinery n.a. n.a. 0.55 0.44 0.00 2930 Manufacture of domestic appliances n.e.c. 64.7 128.8 0.62 0.44 0.05 3000 Manufacture of office, accounting and computing machinery 9.5 368.5 0.69 0.44 0.00 3110 Manufacture of electric motors, generators and transformers 114.2 43.2 0.45 0.30 0.00 3120 Manufacture of electricity distribution and control apparatus 79.7 151.6 0.64 0.20 -0.01 3130 Manufacture of insulated wire and cable 219.7 469.6 0.62 0.42 0.06 3140 Manufacture of accumulators, primary cells and primary batteries 234.1 372.8 0.60 0.48 -0.07 3150 Manufacture of electric lamps and lighting equipment 48.8 87.1 0.40 0.36 0.04 3190 Manufacture of other electrical equipment n.e.c. 17.1 29.5 0.57 0.23 0.04 3210 Manufacture of electronic valves and tubes and other electronic components 32.1 -24.1 0.68 0.26 0.02 3220 Manufacture of television and radio transmitters and apparatus for line telephony and line
telegraphy 45.3 23.5 0.57 0.15 0.00 3230 Manufacture of television and radio receivers, sound or video recording or reproducing
apparatus, and associated goods -16.0 51.4 0.62 0.15 0.00 3311 Manufacture of medical and surgical equipment and orthopaedic appliances 35.5 117.1 0.52 0.43 -0.02 3312 Manufacture of instruments and appliances for measuring, checking, testing, navigating and
other purposes, except industrial process control equipment 99.3 10.0 0.64 0.21 0.00 3320 Manufacture of optical instruments and photographic equipment 198.9 333.2 0.65 0.38 0.00 3410 Manufacture of motor vehicles 235.7 1.4 0.67 0.33 0.20 3420 Manufacture of bodies (coachwork) for motor vehicles; manufacture of trailers and semi-
trailers 9.5 285.4 0.53 0.33 0.20 3430 Manufacture of parts and accessories for motor vehicles and their engines 86.3 126.2 0.43 0.37 0.14 3591 Manufacture of motorcycles 226.4 553.3 0.48 0.62 0.39 3592 Manufacture of bicycles and invalid carriages 201.8 259.8 0.00 0.62 0.39
(Contd.)
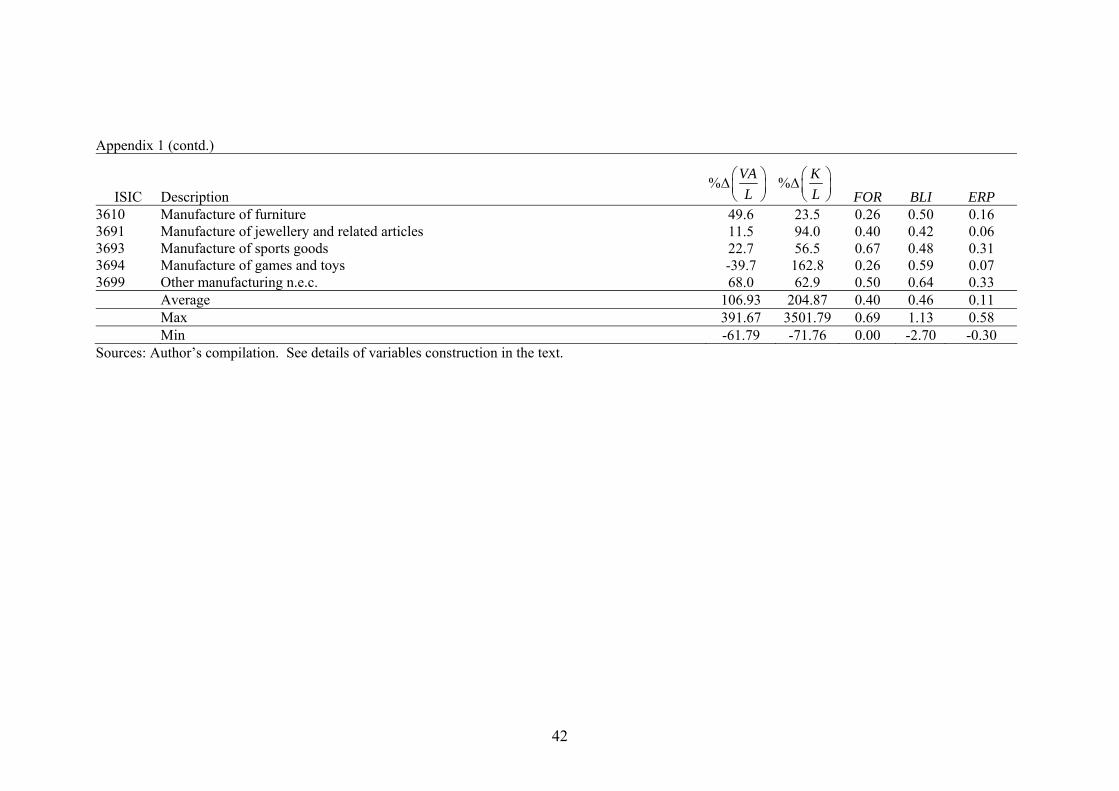
42
Appendix 1 (contd.)
ISIC Description % VA
L⎛ ⎞Δ⎜ ⎟⎝ ⎠
% KL
⎛ ⎞Δ⎜ ⎟⎝ ⎠ FOR BLI ERP
3610 Manufacture of furniture 49.6 23.5 0.26 0.50 0.16 3691 Manufacture of jewellery and related articles 11.5 94.0 0.40 0.42 0.06 3693 Manufacture of sports goods 22.7 56.5 0.67 0.48 0.31 3694 Manufacture of games and toys -39.7 162.8 0.26 0.59 0.07 3699 Other manufacturing n.e.c. 68.0 62.9 0.50 0.64 0.33 Average 106.93 204.87 0.40 0.46 0.11 Max 391.67 3501.79 0.69 1.13 0.58 Min -61.79 -71.76 0.00 -2.70 -0.30 Sources: Author’s compilation. See details of variables construction in the text.
43
References Aghion, P., M. Dewatripont, and P. Rey (1999), ‘Competition, Financial Discipline
and Growth’, Review of Economic Studies, 66, p.825-52. Ahn, S. (2002). ‘Competition, Innovation and Productivity Growth: A Review of
Theory and Evidence’, OECD Economic Department Working Paper, 317, OECD.
Aitken, B.J. and A.E. Harrison (1999), ‘Do Domestic Firms Benefit from Direct Foreign Investment? Evidence from Venezuela’, American Economic Review, Vol.89, No.3, pp.605–618.
Athukorala, P. (1998). Trade Policy Issues in Asian Development, Routledge, London Athukorala, P., & Chand, S. (2000). Trade orientation and productivity gains from
international production: a study of overseas operatins of United States TNCs. Transnational Corporations, 9, (2), 1-30.
Balasubramanyam, V.N., Salisu, M.A., & Sapsford, D. (1996). ‘Foreign direct investment and growth in EP and IS countries’ Economic Journal, 106, (434), 92-105.
Bell, M., B. Ross-Larson, L.E. Westphal (1984). ‘Assessing the Performance of Infant Industries’, Journal of Development Economics, 16 (1), 101–128.
Bhagwati, J. (1973). The theory of immiserizing growth: further applications. In M.B. Connolly, & A. K. Swoboda (Eds.), International trade and money. Toronto: University of Toronto Press.
Bhagwati, J. (1978). Anatomy and consequences of exchange control regimes. New York: Balinger Publishing.
Bhagwati, J. (1994). Free trade: old and new challenges. Economic Journal, 104, (423), 231-46.
Blalock, G. & P.J. Gertler (2008). ‘Welfare Gains from Foreign Direct Investment through Technology Transfer to Local Suppliers’, Journal of International Economics,74: 402-421.
Blomstrom, M. and F. Sjohölm (1999). ‘Technology Transfer and Spillovers: Does Local Partipation with Multinationals Matter?, European Economic Review, 43: 915-923.
Blomström, M., A. Kokko, and Z. Mario (2000). Foreign Direct Investment: Firm and Host Country Strategies, Macmillan Press, London
Brecher, R.A. and C. F. Diaz-Alejandro (1977), ‘Tariffs, Foreign Capital and Immiserizing Growth’, Journal of International Economics, Vol.7, No.4, pp.317–322.
Brecher, R.A. and R. Findlay (1983), ‘Tariff, Foreign Capital and National Welfare with Sector-Specific Factors’, Journal of International Economics, Vol.14, No.3, pp.277–88.
Bulmer-Thomas, V. (1982) Input-output Analysis in Developing Countries: Sources, Methods and Applications, J.Wiley & Sons, Chichester.
Cheh, J.H. (1974). ‘United States concessions in the Kennedy round and short-run adjustment costs’, Journal of International Economics, 4,(4), 267-274.
Cohen, W.M. and R. Levin (1989). ‘Empirical Studies of Innovation and Market Structure’, in R. Schumalensee and R.D. Willig (eds.), Handbook of Industrial Organization, Vol II. North Holand, Amsterdan.
Corden, W. M. (1966). The structure of a tariff system and the effective protective rate. Journal of Political Economy, 74, (3), 221-37.
Corden, W.M. (1974) Trade Policy and Economic Welfare (Oxford: Clarendon Press).
44
Crespo, N. and M.P. Fontoura (2007). ‘Determinant Factors of FDI Spillovers-What Do We Really Know?’, World Development, 35 (3), p. 410-425.
De Melo, J. and S. Urata (1986). ‘The Influence of Increased Foreign Competition on Industrial Trade and Profitability’, International Journal of Industrial Organization, 43 (3), p. 287-314.
Girma, S. (2005). ‘Absorptive Capacity and Productivity Spillovers from FDI: A Threshold Regression Analysis’, Oxford Bulletin of Economics and Statistics, 67(3): 281-306.
Girma, S. and H. Görg (2003). ‘Foreign Direct Investment, Spillovers and Absorptive Capacity: Evidence from Quantile Regressions, GEP Working Paper, No. 2002/14.
Girma, S., D. Greenaway, and K. Wakelin (2001). ‘Who Benefits from Foreign Direct Investment in the UK?, Scottish Journal of Politica Economy,48(2): 119-133.
Görg, H. and D. Greenaway (2004). ‘Much Ado about Nothing? Do Domestic Firms Really Benefit from FDI?, World Bank Research Observer, 19, 171-197.
Görg, H. and E. Strobl (2002), ‘Spillovers from Foreign Firms through Worker Mobility: An Empirical Investigation’, IZA Discussion Papers No. 591, Institute for the Study of Labor, Bonn.
Greenaway D. and R. Kneller (2007). ‘Firm Heterogeneity, Exporting and Foreign Direct Investment’, Economic Journal, vol. 117: 134-161.
Griliches, Z. (1992). ‘The Search for R&D Spillovers’, Scandinavian Journal of Economics, 94 p29-47.
Haddad, M. and A. Harrison (1993), ‘Are there Positive Spillovers from Direct Foreign Investment? Evidence from Panel Data for Morocco’, Journal of Development Economics, Vol. 42, No.1, pp. 51–74.
Hart, O. (1983). ‘The Market Mechanism as an Incentive Structure’, Bell Journal of Economics, 14 (autumn), 366-82.
Hayakawa, K., F. Kimura, and T. Machikita (2008). ‘Firm-level Analysis of Globalization: A Survey’, ERIA Discussion Paper 2008-01, Economic Research Institute for ASEAN and East Asia, Jakatra.
Hill, H. and P. Athukorala (1998), ‘Foreign Investment in East Asia: A Survey’, Asian-Pacific Economic Literature, Vol.12, No.2, pp.23–50.
Hirschman, A.O. (1958), The Strategy of Economic Development, Yale University Press, New Haven.
Hugh, H. (2001). ‘The Evolution of Dual Economies in East Asia’, in D. Lal and R.H. Snape (eds.), Trade, Development and Political Economy: Essays in Honour of Anne O. Krueger, Palgrave McMillan.
Javorcik, B.S. (2004). ‘Does Foreign Direct Investment Increase the Productivity of Domestic Firms? in Search of Spillovers through Backward Linkages’, American Economic Review 94(3), p.605-27.
Johnson, J. (1984) Econometric Methods, (3rd edition), McGraw-Hill, New York. Jongwanich, J. and A. Kohpaiboon (2009) Export Performance, Foreign Ownership
and Trade Policy Regime: Evidence from Thai Manufacturing, ERD Working Paper No. 140, Economics and Research Department, Asian Development Bank
Jongwanich, J. and A. Kohpaiboon (2007). ‘Determinants of Protection in Thai Manufacturing’, Economic Papers 26(3), p. 276-294
Khanthachai, N., K. Tanmavad, T. Boonsiri, C. Nisaisook and A. Arttanuchit (1987). Technology and Skills in Thailand, Institute of Southeast Asian Studies, Singapore.
45
Kinoshita, Y. (2001). ‘R&D and Technology Spillovers though FDI: Innovation and Absorptive Capacity’, CEPR Discussion Papers, No. 2775
Kohpaiboon (2003), ‘Foreign Trade Regimes and the FDI-Growth Nexus: A Case Study of Thailand’, Journal of Development Studies, 40 (2), 55–69.
Kohpaiboon, A. (2006a). Foreign Direct Investment and Technology Spillover: A Cross-industry Analysis of Thai Manufacturing’, World Development, 34(3), 541-56.
Kohpaiboon, A. (2006b). Multinational Enterprises and Industrial Transformation: Evidence from Thailand, Edward Elgar, Cheltenham.
Kohpaiboon, A. (2007) ‘Thai Automotive Industry: Multinational Enterprises and Global Integration’ ERTC Discussion Paper 2007/4 Faculty of Economics, Thammasat University.
Kohpaiboon, A. (2008). MNEs and Global Integration of Thai Clothing Industries: Policy Implication for SME Development, Report submitted to Institute of Developing Economies, Japan.
Kohpaiboon, A. (2009), Trade Policy and International Production Networks in Asia: A Case Study of Hard Disk Drive (HDD) Industry in Thailand, (work in progress)
Kohpaiboon, A. and E.D. Ramstetter (2008). ‘Producer Concentration, Conglomerates, Foreign Ownership, and Import Protection: Thai Manufacturing Firms a Decade after the Crisis’, ICSEAD Working Paper, March 2008, International Centre for the Study of East Asian Development, Kokura.
Kohpaiboon, A. and J. Jongwanich (forthcoming). ‘Market Structure, Foreign Ownership and Productivity in Thailand’ in E.D. Ramstetter, F. Sjöholm, and C. Lee (eds.) in Producer Concentration, Foreign Ownership, and Firms’ Performance in East Asia.
Kokko, A. (1994). ‘Technology, Market Characteristics, and Spillovers’, Journal of Development Economics, 43: 279-293.
Kokko, A., R. Tansini, M. Zejan (1996). ‘Local Technological Capability and Productivity Spillovers from FDI in the Uruguayan Manufacturing Sector, Journal of Development Studies, 32: 602-611.
Kokko, A., Zejan, M., & Tansini, R. (2001). Trade regimes and spillover effects of FDI: evidence from Uruguay. Weltwirtschaftliches Archiv, 137, (1), 124-149.
Lin, P. and K. Saggi (2005). ‘Multinational Firms and Backward Linkages: A Critical Survey and a Simple Model’, in T. Moran, E.M. Graham, M. Blomström (eds.), Does Foreign Direct Investment Promote Development?, Institute for International Economics, Washington DC.
Lipsey, R. (2001). ‘Foreign Direct Investment and the Operations of Multinational Firms: Concepts, History and Data’, in H. James (ed.), Handbook of International Trade, Cambridge: Basil Blackwell.
Markusen, J.R. (1995). ‘The Boundaries of Multinational Enterprises and the Theory of International Trade’, Journal of Economic Perspectives, 9(2), 169-89.
Markusen, J.R. and A.J. Venables (1999). ‘Foreign Direct Investment as a Catalyst for Industrial Development’, European Economic Review, 43 (2), 335–356.
Martin, J. and J. M. Page (1983). ‘The Impact of Subsidies on X-Efficiency in LDC Industry: Theory and an Empirical Test: Review of Economics and Statistics, 65, 608-17.
Menon, J. (1998), ‘Total Factor Productivity Growth in Foreign and Domestic Firms in Malaysian Manufacturing’, Journal of Asian Economics, 9, 251-80.
46
Moran, T.H. (2001). Parental Supervision: The New Paradigm for Foreign Direct Investment and Development, Washington, DC: Institute for International Economics.
Moultan, B.R. (1990). ‘An Illustration of a Pitfall in Estimating the Effects of Aggregate Variables on Micro Units’, Review of Economics and Statistics, May 72(2):p. 334-8.
Oguchi, N., N.A.M. Amdzah, Z. Bakar, R.Z. Abidin and M. Shafii (2002), ‘Productivity of Foreign and Domestic Firms in Malaysian Manufacturing Industry’, Asian Economic Journal, 16, 215-28.
Porter, M.E.(1990); The Competitive Advantage of Nations, Macmillan Press, London.
Pursell, G. (2001). ‘Australia’s Experience with Local Content Program in the Auto Industry’, Policy Research Working Paper WPS2625, World Bank, Washington.
Ramstetter, E. (2003). ‘Foreign Multinationals in Thailand after the Crisis: the Challenge of Measuring and Interpreting Recent Trends’, in M. Toida and J. Uemura (eds.), Projects for Asian Industrializing Region 2003, Tokyo, Institute of Developing Economies, p.83-170.
Ramstetter, E.D. (2006). ‘Are Productivity Differentials Important in Thai Manufacturing’, in E.D. Ramstetter and F. Sjöholm (eds.) Multinational Corporations in Indonesia and Thailand, Palgrave McMillan, New York.
Roberts, M. K. and J.R. Tybout (1996). Industrial Evolution in Developing Countries: Micro Patterns of Turnover, Productivity and Market Structure, Oxford University Press, New York..
Rodriguez-Clare, A. (1996). ‘Multinationals, Linkages and Economic Development’, American Economic Review, 86 (4), 852–873.
Rodrik, D. (1991). ‘Closing the Technology Gap: Does Trade Liberalization Really Help?’, in G. Helleiner (ed.), Trade Policy, Industrialization and Development: New Perspectives. Clarendon Press, Oxford.
Scharfstein, D. (1988). ‘Product-Market Competition and Managerial Slack’, Rand Journal of Economics, 19 (sping), 147-55.
Schumpeter, J.A. (1942). Capitalism, Socialism, and Democracy, Harper and Row, New York.
Sjohölm, F. (1999). ‘Technology Gap, Competition and Spillovers from Direct Foreign Investment: Evidence from Establishment Data’, Journal of Development Studies, 36(1):53-73.
Studwell, J. (2007). Asian Godfather Money and Power in Hong Kong and South East Asia, Profile Books
Symeonidis, G. (1996). ‘Innovation, Firm Size, and Market Structure: Schumpeterian Hypotheses and Some New Themes’, OECD Economic Studies, 27, 35-70.
Tamburlertchai, S., and E.D. Ramstetter (1991). Foreign firms in promoted industries and structural change in Thailand. In E. D. Ramstetter (Ed.), Direct Foreign Investment in Asia's Developing Economies and Structural Change in the Asia-Pacific region. USA: Westview Press.
Wagner, J. (2007). 'Exports and Productivity: A Survey of the Evidence from Firm Level Data', World Economy, 30, p. 60-82.
Wooldridge, J. (2002). Econometric Analysis of Cross Section and Panel Data,MIT Press, Cambridge MA.