veteran health network cdr bard, lcdr campbell, maj ford 5 june 2012 cdr bard, lcdr campbell, maj...
TRANSCRIPT

Veteran Health Network
Veteran Health Network
CDR Bard, LCDR Campbell, MAJ Ford5 June 2012
CDR Bard, LCDR Campbell, MAJ Ford5 June 2012

Outline Outline
• Backstory / Problem
• Abstract Network
• Network Operation
• Measure of Effectiveness
• Network Analysis
• Summary and Conclusion
2
U.S. Dept. of Veteran Affairs (VA)U.S. Dept. of Veteran Affairs (VA)
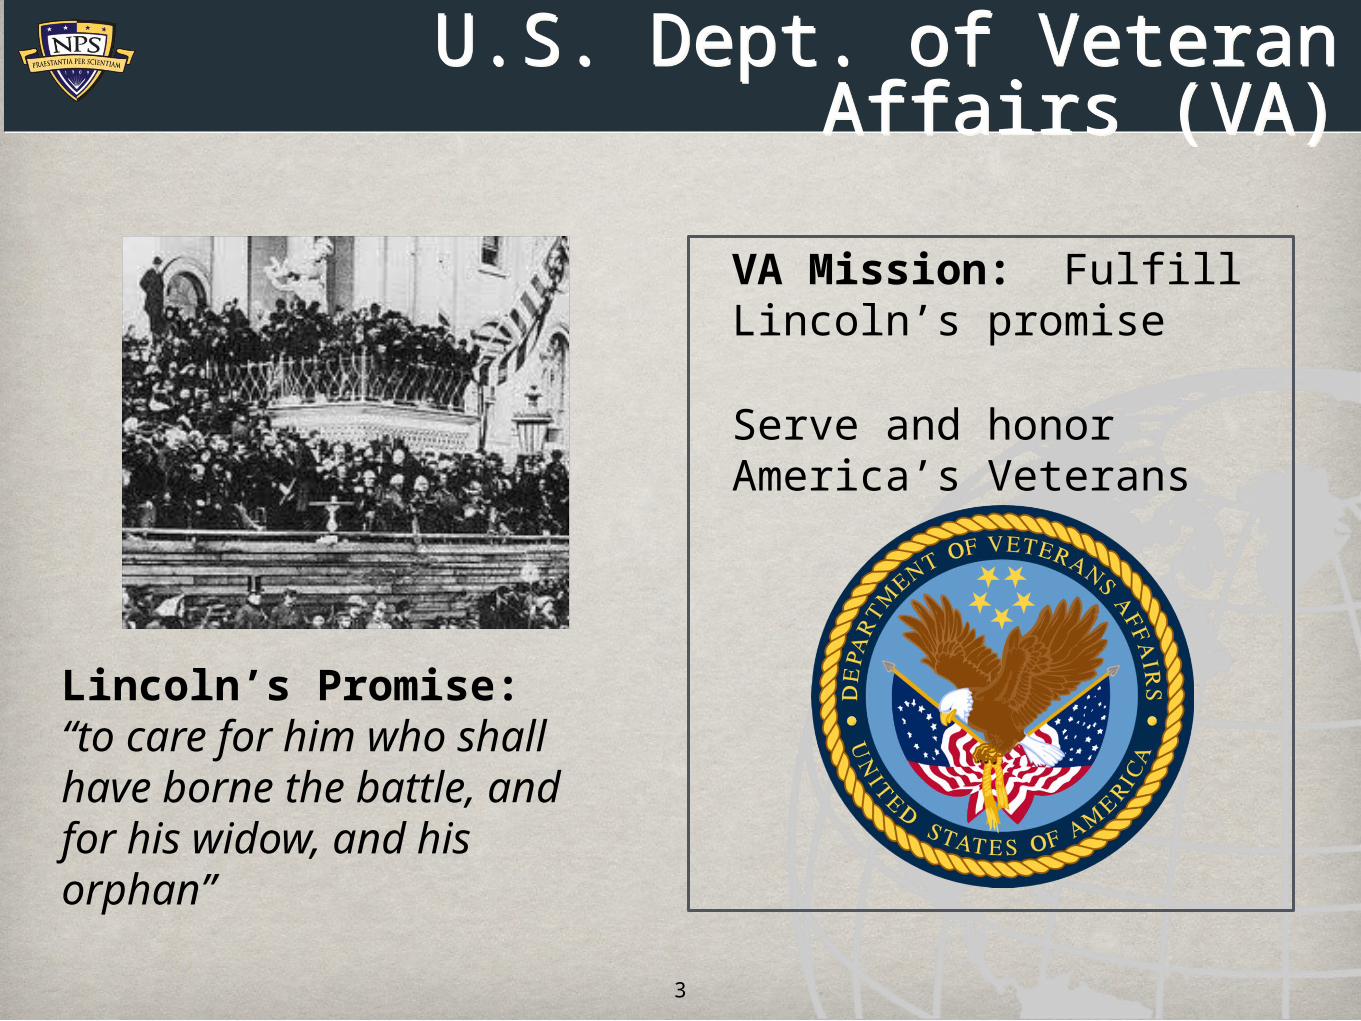
VA Mission: Fulfill Lincoln’s promise
Serve and honor America’s Veterans
3
Lincoln’s Promise: “to care for him who shall have borne the battle, and for his widow, and his orphan”

VA 2011-2015 Strategic PlanVA 2011-2015 Strategic Plan
Strategic Goals
Access to Care
Optimal Value
4
Mindful of President Lincoln’s promise

Veteran Health Administration (VHA)
Veteran Health Administration (VHA)
Largest integrated health care system in United States
152 medical centers
1400 community-based outpatient clinics
5
21 Veteran Integrated Service Networks (VISNs)
Meets needs of 8.3 million Veterans each year

VA Sierra Pacific NetworkVA Sierra Pacific Network
• VISN-21 serves 1.2 million Veterans in northern and central California, northern Nevada, Hawaii, the Philippines, and Guam
• Consists of 40 sites across six Systems
• Each Health Care System is sub-network of larger VISN-21 network
6

Abstract of VISN-21Abstract of VISN-21
Examine three independent Health Care Systems
VA Palo Alto
VA Sierra Nevada
VA Northern California
Representative of urban, rural and hybrid areas
7

Community TermsCommunity Terms
• Urban (Palo Alto): Consists of major population centers
• Rural (Sierra Nevada): Sparsely populated with a few small urban areas
• Hybrid (Northern CA): Consists of major population centers surrounded by rural areas
8
Nodes and EdgesNodes and Edges
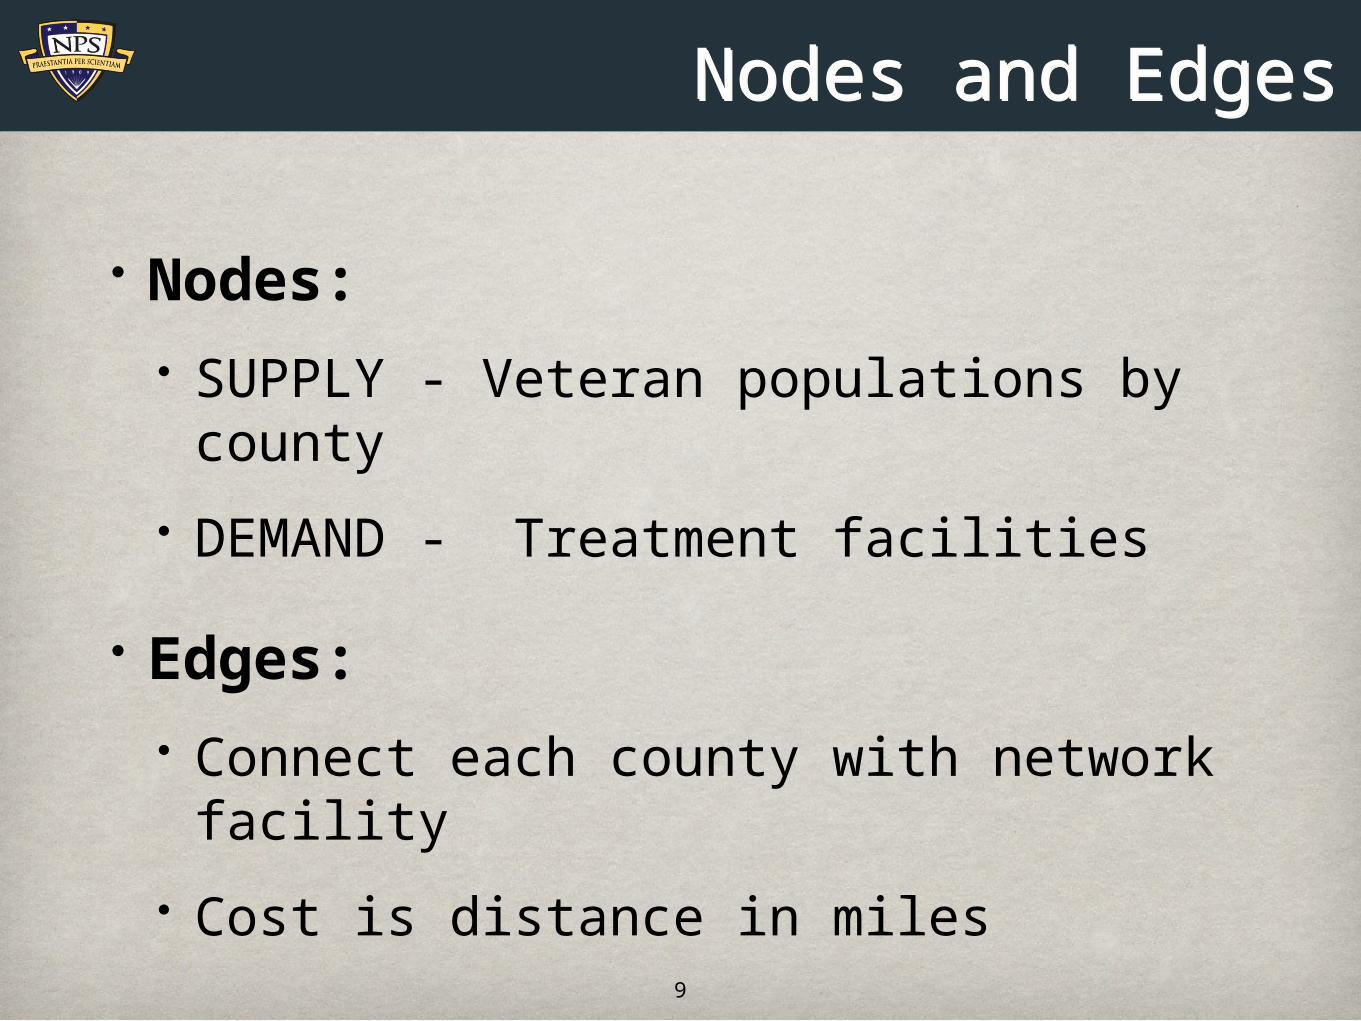
• Nodes:• SUPPLY - Veteran populations by county
• DEMAND - Treatment facilities
• Edges:• Connect each county with network
facility
• Cost is distance in miles
9

Simplified Graph Simplified Graph
10
Veterans Treatment
CLINICSCOUNTIES
Treatment Demand

Abstract of VISN-21Abstract of VISN-21
11
1 2
3
4
56
7
8
9Siskiyo
u County
VA Northern California(Hybrid)
Yreka

VA Northern California (Hybrid)
VA Northern California (Hybrid)
SUPPLY
COUNTIES
DEMAND
CLINICS
Network AnalysisNetwork Analysis
• Purpose: Provide outpatient care to Veterans
• Data Tracked:
• Cumulative Distance Traveled
• Per Capita Distance Traveled (outputs)
• Patients Assigned to Clinics
13

Measures of EffectivenessMeasures of Effectiveness
• Model allocates Veterans to treatment facilities
• Minimum-Cost Flow Modeling
• Minimize Veteran travel distance to treatment
• Objective Function:
min S cij yij
cij: cost (distance) per unit flow
yij: number of veterans (flow) on arc14

AssumptionsAssumptions
• All eligible Vets receive care from VA System
• One City per County for distance calculations
• No population distribution for veterans in county
• Community near geographic or population center
• Health Care Systems (HCS) operate independently
• Ability for interchange among HCSs for specialty care
• Not modeled for simplicity and tractability
15

ModelingModeling
• Begin with an unconstrained model
• Add network design constraints and evaluate responses
• Patient limits
• Patient limits with buffers
• Facility closure or patient capacity reductions
• Open a new clinic
• Year 2030 veteran populations
16

Unconstrained ResultsUnconstrained Results
17
Urban Hybrid Rural0
5
10
15
20
25
30
35
Distance to Care
Network
Dis
tance (
miles)
• All patients go to nearest clinic
• Per Capita Distance:
• Urban: 13.69 miles
• Hybrid: 17.37
• Rural: 30.02

Patient Limits Patient Limits
18
• Capacities chosen to ensure no unmet demand
• Modeled as upper bound on Clinic – Treatment Arcs
• Urban / Suburban Outpatient Clinics
• Capacity: 30,000 (urban / hybrid)
• Capacity: 25,000 (rural)
• Rural Outpatient Clinics
• Capacity: 10,000
• Hospitals
• Capacity: 75,000 (hybrid)
• Capacity: 50,000 (urban / rural)

Patient Limits ResultsPatient Limits Results
19
• Per Capita Distance:
• Urban: 16.26 miles
• Hybrid: 22.36
• Rural: 40.93
• 20 - 35% increase
Unconstrained Patient Limits0
5
10
15
20
25
30
35
40
45
Distance to Care
UrbanHybridRural
Model
Dis
tance
Patient Limits with Buffers Patient Limits with Buffers
20
• 1% buffer below capacity for all facilities
• Allow for patient transfers
• New sign-ups
• Recently moved
• Flexibility

Patient Limits with Buffers Results
Patient Limits with Buffers Results
21
• Per Capita Distance:
• Urban: 16.32 miles
• Hybrid: 23.0
• Rural: 41.25
• Baseline
• Closest to RealityUnconstrained Patient Limits With Buffers
0
5
10
15
20
25
30
35
40
45
Distance to Care
UrbanHybridRural
Model
Dis
tance

Budget Cuts Budget Cuts
22
• All HCSs must close a clinic or reduce staffing to save costs
• Force a clinic closure in each region
• Reduce patient limits across the board to simulate staffing cuts
• Model chooses optimal clinic to close and redistributes patients
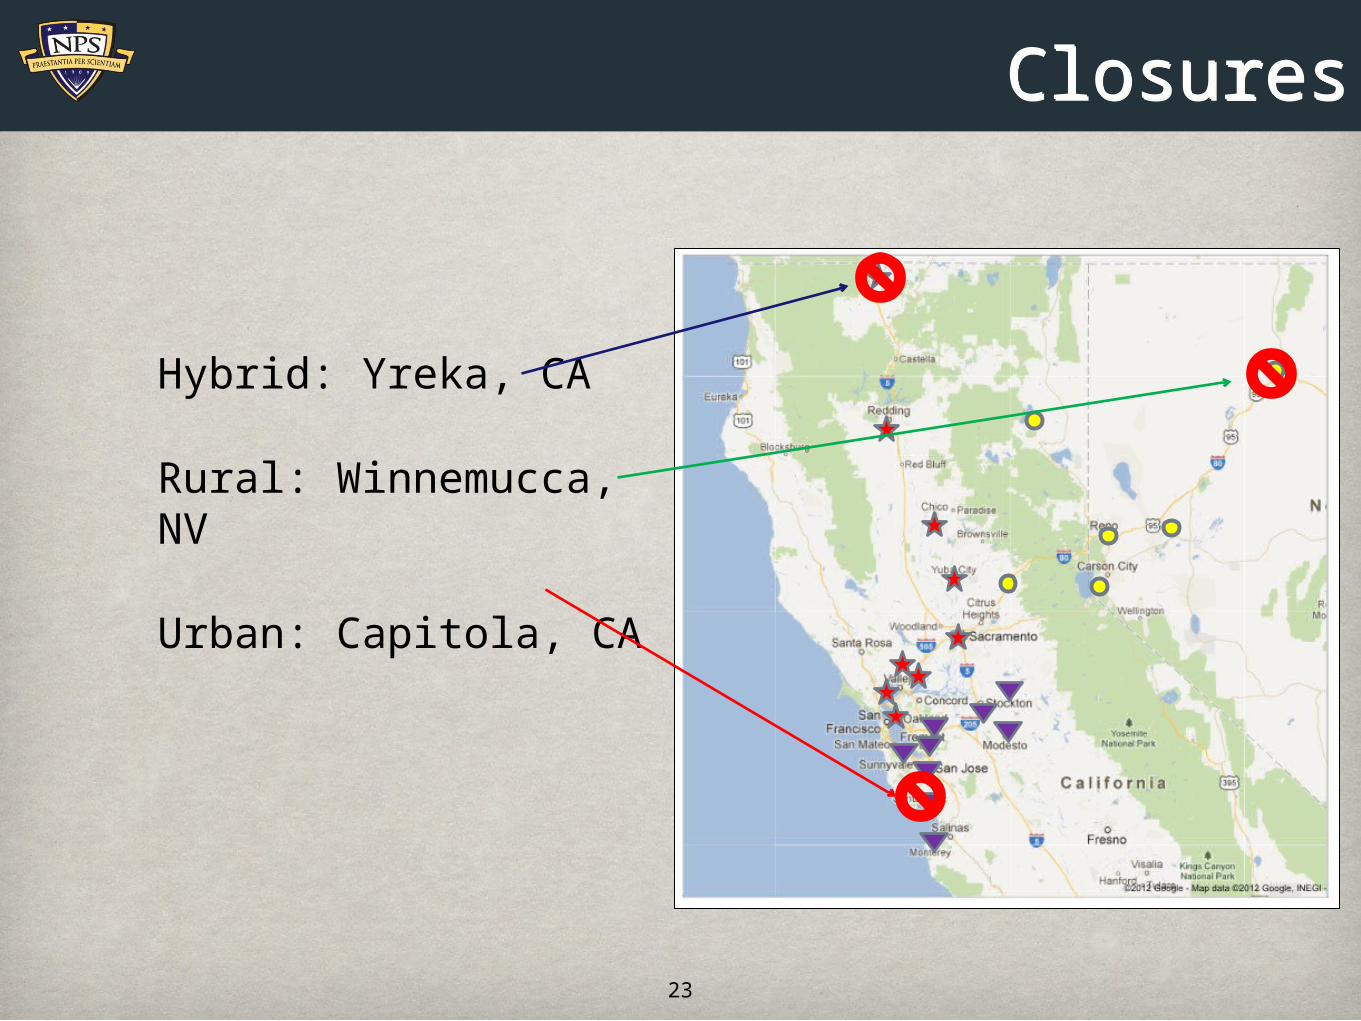
ClosuresClosures
Hybrid: Yreka, CA
Rural: Winnemucca, NV
Urban: Capitola, CA
23

Budget Cuts ResultsBudget Cuts Results
24
• Per Capita Distance (optimal):
• Urban: 16.99 miles
• Hybrid: 23.60
• Rural: 41.25
• Optimal Decision
• Urban: Staff Cuts (+0.67)
• Hybrid: Closure (+0.60)
• Rural: Closure (+1.50)
Unconstrained Patient Limits With Buffers Closure Staff Reductions0
5
10
15
20
25
30
35
40
45
50
Distance to Care
UrbanHybridRural
Model
Dis
tance

Budget Cut Takeaways Budget Cut Takeaways
25
• Can safely close one clinic in each network without disruption
• Two or more closures trigger unmet demand (untreated patients)
• Network is efficient but vulnerable
• Redundancy is expensive and not an efficient use of limited resources
• Maximum reductions in patient capacities (staff cuts) without disruption
• Urban: 10 percent – unmet demand
• Rural: 5 percent – unacceptable patient assignments
• Hybrid: 2.5 percent – unmet demand

Open New ClinicOpen New Clinic
26
• Political Pressures
• Can’t close a clinic and displace vets
• Must open a new clinic in each network
• Modeled after VA’s Rural Outreach Program
• Opening new small clinics in rural, underserved areas
• Yreka (CA) and Winnemucca (NV) are examples
• Optimal choice from among three communities in each region

UrbanUrban
Three possible locations
Rancho Calaveras, CA
Tracy, CA
Hollister, CA
27
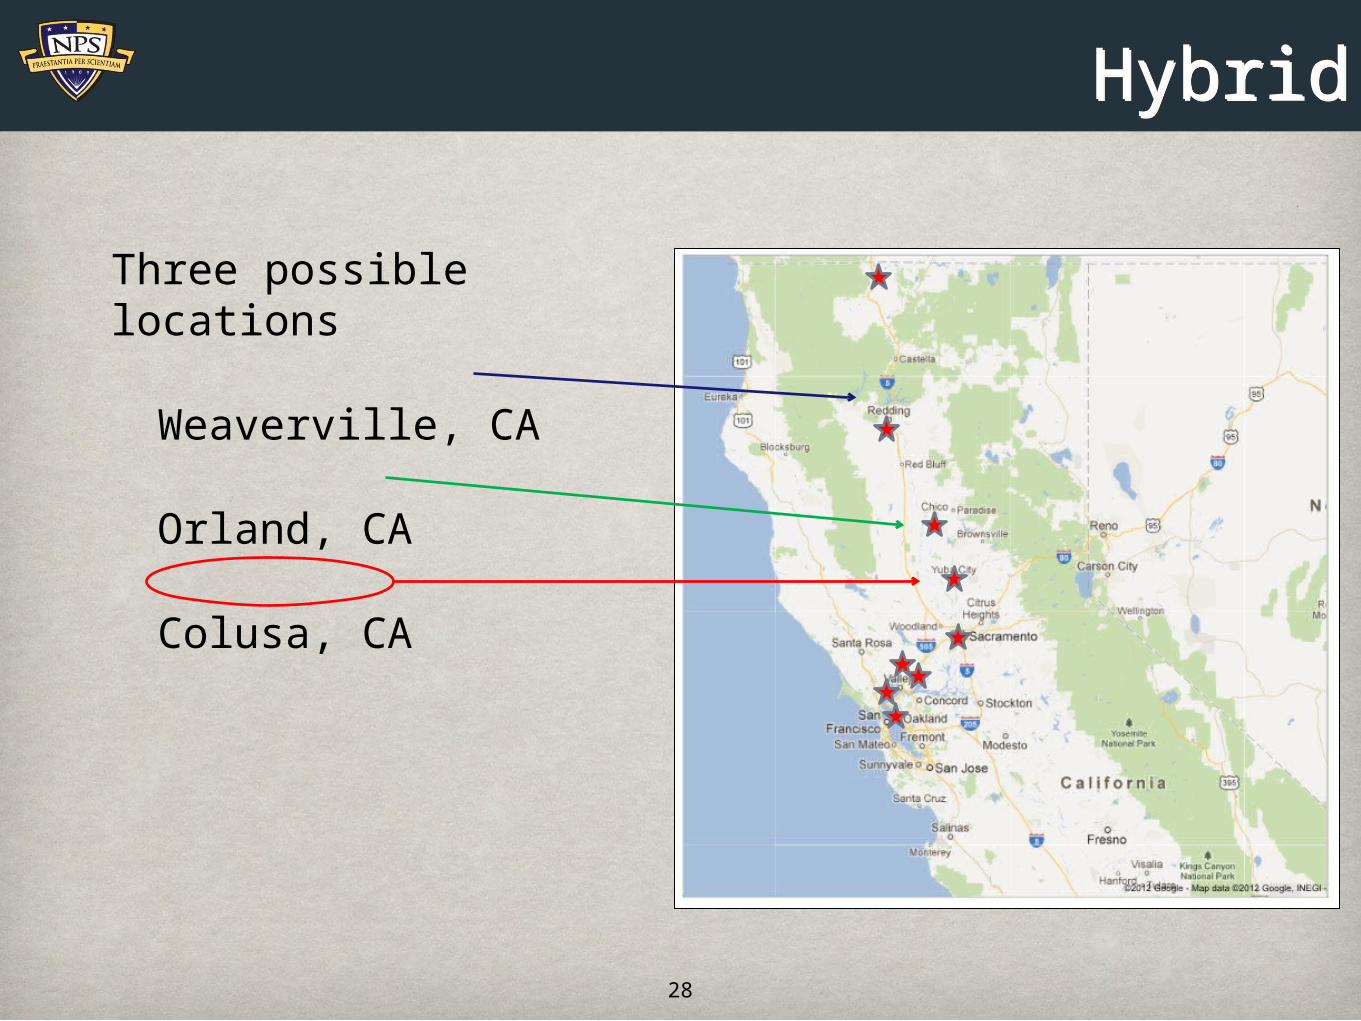
HybridHybrid
Three possible locations
Weaverville, CA
Orland, CA
Colusa, CA
28

RuralRural
Three possible locations
Austin, NV
Fernley, NV
Mammoth Lakes, CA
29

Open Clinic ResultsOpen Clinic Results
30
• Per Capita Distance:
• Urban: 16.06 miles
• Hybrid: 21.92
• Rural: 49.72
• Reduction from Baseline
• Urban: 0.26 (1.5%)
• Hybrid: 1.08 (4.7%)
• Rural: 1.53 (3.7%)
Uncon
stra
ined
Patie
nt Li
mits
With
Buff
ers
Closu
re
Staff
Red
uctio
ns
Open
Clinic
0
5
10
15
20
25
30
35
40
45
50
Distance to Care
UrbanHybridRural
Model
Dis
tance

Open Clinic TakeawaysOpen Clinic Takeaways
31
• Not worthwhile in urban network
• Slight decrease in objective function
• No patient load decreases on full capacity clinics
• Effective in hybrid and rural networks
• Larger decreases in objective function
• Decreased patient loads at full clinics

20302030
32
• What does the future hold?
• Veteran population projections by county from the VA for 2030
• 40% reduction from current level
• Fewer WWII, Korea, and Vietnam era vets
• Drafts vs. Volunteer Force
• Assumed all current clinics remain
• Not likely to be true
• Will VA system be folded into National Health Care System?

2030 Results2030 Results
33
• Per Capita Distance:
• Urban: 14.88 miles
• Hybrid: 17.69
• Rural: 32.2
• Similar to Unconstrained model results
• Clinic capacities become inconsequential
• Future closures?Unc
onst
rain
ed
Patie
nt Li
mits
With
Buff
ers
Closu
re
Staff
Red
uctio
ns
Open
Clinic
2030
0
5
10
15
20
25
30
35
40
45
50
Distance to Care
UrbanHybridRural
Model
Dis
tance

ConclusionConclusion
• Network satisfies strategic objective
• Network resilient to limited disruption
• Offers insight to VA network of networks
• Project results in alignment with VA practices
• Flexibility for future Veteran population 34

Future WorkFuture Work
• Add competing objective function(s)
• Minimize Veteran traveling distance
• Minimize cost per patient
• Minimize overhead costs
• Increase granularity
• Determine Optimum Staffing Levels
• Model to help VA meet strategic goals considering 35-40% decrease in Veteran population by 2030
35

QUESTIONS?QUESTIONS?
36

BACKUPBACKUP
37

Patient Limits and Buffers Results
Patient Limits and Buffers Results
38
Urban Hybrid Rural0
5
10
15
20
25
30
35
40
45
Distance to Care
UnconstrainedPatient LimitsWith Buffers
Network
Dis
tance (
miles)
Capito
la
Frem
ont
Liver
mor
e
Menlo
Par
k
Modes
to
Monte
rey
San
Jose
Sono
ra
Stoc
kton
0
10000
20000
30000
40000
50000
60000
70000
80000
Urban Patient Loads
UnconstrainedPatient LimitsWith Buffers
Facilites
Pati
ents
Assig
ned
Fairfi
eld
Sacr
amen
to
Valle
jo
Martin
ez
McCle
llan
Oakla
nd
Reddi
ng
Yrek
a
Chico
Yuba
City
0
20000
40000
60000
80000
100000
120000
Hybrid Patient Loads
UnconstrainedPatient LimitsWith Buffers
Facilities
Pati
ents
Assig
ned
Aubur
n
Fallo
n
Carso
n Val
ley
Susa
nvill
eRen
o
Win
nem
ucca
0
10000
20000
30000
40000
50000
60000
Rural Patient Loads
UnconstrainedPatient LimitsWith Buffers
Facilities
Pati
ents
Assig
ned

Budget Cuts ResultsBudget Cuts Results
39
Urban Hybrid Rural0
5
10
15
20
25
30
35
40
45
50
Distance to Care
UnconstrainedPatient LimitsWith BuffersClosureStaff Reductions
Network
Dis
tance (
miles)
Capito
la
Frem
ont
Liver
mor
e
Menlo
Par
k
Modes
to
Monte
rey
San
Jose
Sono
ra
Stoc
kton
0
10000
20000
30000
40000
50000
60000
70000
80000
Urban Patient Loads
UnconstrainedPatient LimitsWith BuffersClosureStaff Reductions
Facilites
Pati
ents
Assig
ned
Fairfi
eld
Sacr
amen
to
Valle
jo
Martin
ez
McCle
llan
Oakla
nd
Reddi
ng
Yrek
a
Chico
Yuba
City
0
20000
40000
60000
80000
100000
120000
Hybrid Patient Loads
UnconstrainedPatient LimitsWith BuffersClosureStaff Reductions
Facilities
Pati
ents
Assig
ned
Aubur
n
Fallo
n
Carso
n Val
ley
Susa
nvill
eRen
o
Win
nem
ucca
0
10000
20000
30000
40000
50000
60000
Rural Patient Loads
UnconstrainedPatient LimitsWith BuffersClosureStaff Reductions
Facilities
Pati
ents
Assig
ned

Open Clinic ResultsOpen Clinic Results
40
Urban Hybrid Rural0
5
10
15
20
25
30
35
40
45
Distance to Care
UnconstrainedPatient LimitsWith BuffersOpen Clinic
Network
Dis
tance (
miles)
Capito
la
Frem
ont
Liver
mor
e
Menlo
Par
k
Modes
to
Monte
rey
San
Jose
Sono
ra
Stoc
kton
0
10000
20000
30000
40000
50000
60000
70000
80000
Urban Patient Loads
UnconstrainedPatient LimitsWith BuffersOpen Clinic
Facilites
Pati
ents
Assig
ned
Fairfi
eld
Sacr
amen
to
Valle
jo
Martin
ez
McCle
llan
Oakla
nd
Reddi
ng
Yrek
a
Chico
Yuba
City
0
20000
40000
60000
80000
100000
120000
Hybrid Patient Loads
UnconstrainedPatient LimitsWith BuffersOpen Clinic
Facilities
Pati
ents
Assig
ned
Aubur
n
Fallo
n
Carso
n Val
ley
Susa
nvill
eRen
o
Win
nem
ucca
0
10000
20000
30000
40000
50000
60000
Rural Patient Loads
UnconstrainedPatient LimitsWith BuffersOpen Clinic
Facilities
Pati
ents
Assig
ned

2030 Results2030 Results
41
Urban Hybrid Rural0
5
10
15
20
25
30
35
40
45
Distance to Care
UnconstrainedPatient LimitsWith Buffers2030
Network
Dis
tance (
miles)
Capito
la
Frem
ont
Liver
mor
e
Menlo
Par
k
Modes
to
Monte
rey
San
Jose
Sono
ra
Stoc
kton
0
10000
20000
30000
40000
50000
60000
70000
80000
Urban Patient Loads
UnconstrainedPatient LimitsWith Buffers2030
Facilites
Pati
ents
Assig
ned
Fairfi
eld
Sacr
amen
to
Valle
jo
Martin
ez
McCle
llan
Oakla
nd
Reddi
ng
Yrek
a
Chico
Yuba
City
0
20000
40000
60000
80000
100000
120000
Hybrid Patient Loads
UnconstrainedPatient LimitsWith Buffers2030
Facilities
Pati
ents
Assig
ned
Aubur
n
Fallo
n
Carso
n Val
ley
Susa
nvill
eRen
o
Win
nem
ucca
0
10000
20000
30000
40000
50000
60000
Rural Patient Loads
UnconstrainedPatient LimitsWith Buffers2030
Facilities
Pati
ents
Assig
ned