veterinary science & technology - omics international · haemopoietic organs of fish which can...
TRANSCRIPT

Effect of Feeding with Different Dietary Protein Levels and Starvation onthe Health, Nonspecific Immune Parameters, Behavior andHistoarchitectures of Fantail Goldfish (Carassius auratus L.)ALshimaa AHM Khalil1, Walaa EL-Husseiny1, Azhar F Abdel Fattah2 and Wael AM Ghonimi3*
1Department of Fish Diseases and Management, Faculty of Veterinary Medicine, Zagazig University, 44519 Zagazig, Egypt2Department of Veterinary public health, Faculty of Veterinary Medicine, Zagazig University, 44519 Zagazig, Egypt3Department of Histology and Cytology, Faculty of Veterinary Medicine, Zagazig University, 44519 Zagazig, Egypt*Corresponding author: Wael AM Ghonimi, Department of Histology and Cytology, Faculty of Veterinary Medicine, Zagazig University, 44519 Zagazig, Egypt, Tel:00201222498246; Fax: +2-055-2283683; E-mail: [email protected]
Rec date: Sep 02, 2015; Acc date: Dec 02, 2015; Pub date: Dec 04, 2015
Copyright: © 2015 Khalil AA, et al. This is an open-access article distributed under the terms of the Creative Commons Attribution License, which permits unrestricteduse, distribution, and reproduction in any medium, provided the original author and source are credited.
Abstract
The present investigation was conducted to assess the effect of different dietary protein percentages andstarvation on the health, behavior, blood chemistry, immune response and histoarchitectures of fan tail gold fishCarassius auratus L. Experiment was carried out using 80 Carassius auratus with an average body weight 18 ± 2 gwhich were divided into four groups in duplicate in which, group 1 feed with diet A; 28% Crude Protein (CP). Fish ingroup 2 was fed on diet B (17% CP) and fish in group 3 was feed on diet C (45% CP) and group 4 kept as fastedgroup. The experimental period was 8 weeks. The current study clarified that significant high growth rate, improvedwelfare; decrease aggressive behavior, improved biochemical serum parameters and immune response wereobserved in group feed with diet containing 45% crude protein. Starvation is directly affected health, immunity andwelfare as well as histoarchitectures of all selected organs. Histologically, there is no any significant changes on thehistoarchitectures of the all selected organs; liver, spleen, intestine, head kidney as well as muscle of groups 1, 2and 3 feed with diet A (28% CP), diet B (17% CP) and diet C (45% CP) respectively. Meanwhile, the fasting of group4 had the most effective changes on the histoarchitectures of all selected organs.
Keywords: Dietary protein; Starvation; Health behavior;Histoarchitectures; Fantail goldfish; Carassius auratus L
IntroductionOrnamental fish have growing importance at the present time.
Cichlids, which are considered the most popular ornamental fish,constitute approximately 95% of all 4000 species and varieties [1].
There are different factors that affect ornamental fish welfare,including for example the physical and chemical environment, feeding,social interaction and the occurrence of fish pathogens [2]. Nutrientshave an important role in keeping the health condition, normalbehavior and in improvement the external appearance and color ofornamental fish [3]. Protein is considered the biggest part of the cost ofthe unit of feed, while fat and carbohydrates are important to supplythe energy required by fish [3].
The changes in the metabolic and immunological profiles are one ofthe tools that evaluate the fish performance and its ability to withstandthe different dietary conditions [4-6].
Histological analysis of the digestive system is considered a goodindicator of the nutritional status of fish [7-9]. The intestine and liverare the most important organs in digestion and absorption of nutrientsfrom food, and therefore monitoring of these organs is considerednecessary [10].
Starvation is one of the important causative of fish mortality innature and in aquaculture [11]. Long-term starvation can cause severedeformity in vital organs [12] and even mortality of fish. Starvation
also exhibits a widespread histological degeneration in thehaemopoietic organs of fish which can bring about alterations in theircellular architecture. Haemopoietic organs (liver, head kidney andspleen) have been reported to be the most sensitive tissues to beaffected by starvation [13]. Structural alterations/degeneration ofhaemopoietic organs impairs its functional capacity (haemopoiesis)which may prove even fatal for the survival of fish. Thushistopathological alterations in haemopoietic organs can be utilized astools in order to get a clear idea about the extent an organism isaffected at tissue or cellular level [14].
The aim of our work is to investigate the effect of different dietaryprotein levels and starvation on fish growth performance, health,behavior as well as histoarchitectures of liver, spleen, intestines, headkidney and muscle of fantail goldfish (Carassius auratus).
Material and Methods
Fish and aquariaA total number of 80 fantail goldfish (Carassius auratus L.) with an
average body weight 18 ± 2 g were collected alive from Zagazig fishmarket at Sharkia province and transported alive immediately to thelaboratory in large plastic bag. Fish were kept in experimental aquariawith 60 liter capacity and kept for 10 days acclimatization periodbefore the beginning of the experiment. Water in the aquaria wasaerated permanently and the temperature was regulated by usingthermostatically controlled heaters. Water was completely changedfour times weekly.
Veterinary Science & Technology Khalil, et al., J Veterinar Sci Technol 2016, 7:1http://dx.doi.org/10.4172/2157-7579.1000278
Research Article Open Access
J Veterinar Sci TechnolISSN:2157-7579 JVST, an open access journal
Volume 7 • Issue 1 • 1000278

Fish diets and feedingDiets with different protein levels were prepared in fish research
unit, Faculty of Veterinary Medicine, Zagazige University, Egypt. Thechemical analysis of feed stuffs used in the experimental diets is shownin Table 1. The diets included different crude protein levels asfollowing: Diet (A) in which, contains 28% crude protein; diet B,containing 17% crude protein, diet C, containing 45% crude proteinand group D acts as a fasting group. The fish in groups A, B, C were feddiets 2 times daily (09:00 AM and 03:00 PM) at rate of 3% of bodyweight for 8 weeks. Periodical evaluation of growth was done each 15days. The chemical composition of the experimental diets are shown inTable 2. The growth Performance Parameters carried out by evaluationof average body weight which calculated by dividing the total weight offish by the number of fish in each group. Body gain, body gain percent,specific growth rate % and daily gain rate were determined accordingto Pouomonge and Ombredane [15].
Ingredient Nutrient (% as fed basis)
DM CP EE CF Ash NFE(calculated)
Yellow corn 88.80 8.75 3.60 2.10 1.20 73.15
Wheat flour 89.00 12.80 2.50 1.60 1.60 70.50
Soybean meal 90.00 43.70 1.80 6.10 6.50 31.90
Fish meal 94.60 63.40 8.70 0.7 20.50 1.30
Poultry by-product
meal92.60 60.30 12.70 2.10 14.70 2.80
Table 1: Chemical analysis of feed stuffs used in the experimental diets.(DM= Dry matter, CP=Crude protein, EE=Ether extract, CF=Crudefiber and NFE (calculated)=Nitrogen free extract). DM, CP, EE andAsh were chemically analysed according to procedures of AOAC(2000).*Calculated according to tables of NRC (1993).
Ingredients Experimental diets
CP % in diets
A B C
Yellow corn 39.00 50.00 14.00
Wheat flour 12.00 23.00 6.00
Soybean meal 16.00 7.00 22.00
Fish meal 13.00 6.00 27.00
Poultry by-product meal 13.00 5.00 27.00
Vegetable oil 5.50 7.50 2.50
Vitamins and Minerals mixture* 1.50 1.50 1.50
DM, % 84.14 81.57 88.19
CP, % 28.02 17.20 45.01
EE, % 10.04 10.89 9.16
CF, % 2.38 2.02 2.50
Ash, % 6.30 3.40 11.25
NFE, % 42.63 55.24 22.60
DE, Kcal/ kg diet** 2919.40 2915.49 2944.55
Table 2: Chemical composition of the experimental diets. *Vitamin andMineral mixture (alfakema):- Each 1 kg contains:-Vit. A 580000 I.U,vit.D3 8600 I.U, vit.E. 720 mg, vit. K3 142 mg, vit C 0.1 mg, vit B1 58mg, vit B2 34 mg, vit. B6 34 mg , vit.B12 58 mg , Folic acid 86 mg,Pantothenic acid 8 mg , Manganese sulfate 65 mg , Zinc methionine3000 mg , Iron sulfate 2000 mg , Copper sulfate 3400 mg , Cobaltsulfate 572 mg , Sodium selenite 25 mg, Calcium iodide 25 mg,Calcium carbonate (Carrier substance) till 1000 gm. **Digestibleenergy calculation based on values of protein 3.5 kcal/gm, fat 8.1kcal/gm, NFE 2.5 kcal/gm (Santiago et al. 1982). (DM=Dry matter,CP=Crude protein, EE=Ether extract, CF=Crude fiber andNFE=Nitrogen free extract).
Experimental designFish are divided into four groups in duplicate in which, group 1 feed
with diet A. Fish in group 2 was fed on diet B and fish in group 3 wasfed on diet C. while fish in group 4 kept as fasting group. Theexperimental period was 8 weeks.
Behavioral observationCarassius auratus identified by short plastic strips applied in dorsal
fin of fish, behavior recorded in the period between 09:00 Am till 03:00Pm for 8 weeks by using focal sample technique for 15 sec. intervalsduring one hour daily. Visually by using a note book for recordingbehavior, a stop watch, multipurpose counter and video cameraaccording to Altuman [16]. The following behaviors were recordedaccording to Stephan [17]:
Feeding: Frequency and duration (Sec.) spent in feeding.
Swimming: Frequency and duration (Sec.) spent in swimming.
Aggression: Frequency and duration (Sec.) spent in attacking eachother.
Rest: Frequency and duration (Sec.) in which fish completelyimmobile and rest on the bottom of their aquaria.
Arousal: Frequency and duration (Sec.) in which fish has alocomotors activity.
Fish coming to surface of aquaria: Frequency and duration (Sec.) inwhich fish hanging around the top of aquaria.
Blood sampleAt the end of the experimental periods, blood samples were
collected from caudal vessels and centrifuged at 3000 rpm for 10minutes for obtaining serum samples and stored in freezer at -0°C thenanalyzed 24 hrs post collection. Blood samples should be collected 17 hafter the final feeding for the plasma glucose assay according to Chenget al. [18].
Biochemical analysisBiochemical analysis for glucose which was determined
colorimetrically according to Trinder [19], cholesterol [20], totalprotein [21] and creatinine [22] were determined.
Citation: Khalil AAHM, Husseiny WE, Fattah AFA, Ghonimi WAM (2016) Effect of Feeding with Different Dietary Protein Levels and Starvation onthe Health, Nonspecific Immune Parameters, Behavior and Histoarchitectures of Fantail Goldfish (Carassius auratus L.). J Veterinar SciTechnol 7: 278. doi:10.4172/2157-7579.1000278
Page 2 of 12
J Veterinar Sci TechnolISSN:2157-7579 JVST, an open access journal
Volume 7 • Issue 1 • 1000278

Immunological assessmentImmunological response of fish was evaluated through
determination of serum lysozyme levels [23] and IgM [24].
Statistical analysisData were collected, organized and analyzed using one-way analysis
of variance (ANOVA) through the general linear models (GLM)procedure of the Statistical Package for Social Sciences version 21.0(SPSS for Windows 21.0, Inc., Chicago, IL, USA). The comparison ofmeans was carried out with Duncan’s multiple range tests (DMRT).Results were recorded as mean ± standard deviation (SD). The value ofP<0.05 was used to indicate statistical significance.
Histological analysisAt the end of experiment, small slices of liver, spleen, intestine, head
kidney and skeletal muscle were taken and fixed immediately inneutral buffered formalin 10%. The fixed specimens were processedusing the usual histological techniques; dehydrated in ascendinggrades of ethanol series, cleared in benzene and embedded in paraffin.5-7 μm thick sections were prepared and mounted on glass slides.These are dewaxed in xylene, hydrated in descending grades of ethanolseries and stained with Harris's hematoxylin and Eosin (H&E) forroutine histopathological studies according to Bancroft and Gamble[25]. The microphotographies were taken using a digital Dsc-W 130super steady cyper shot camera (Sony, Japan) connected to anOlympus BX 21 light microscope.
ResultsThe effect of different levels of dietary protein on the growth
performance of Carassius auratus is summarized in Table 3 in whichthere is a high significant increase in all nutritional parameters ofgroup C "fish feed on high dietary protein" followed by control thenlow protein groups.
Parameters
Group
A B C
Initial body weight (g) 18.60 ± 0.28a 18.83 ± 0.20a 18.88 ±0.19a
Final body weight (g) 34.72 ± 0.20b 29.67 ± 0.17c 35.79 ± 0.16a
Weight gain (g) 15.89 ± 0.20b 11.07 ± 0.23c 16.91 ± 0.22a
weight gain % 84.54 ± 1.69a 59.77 ± 1.99b 89.69 ± 1.84a
Specific growth rate SGR 1.02 ± 0.02a 0.78 ± 0.02b 1.07 ± 0.02a
Daily gain rate (DGR) 0.26 ± 0.00b 0.18 ± 0.00c 0.28 ± 0.00a
Table 3: Effect of dietary protein levels on mean nutritional Parametersof Carassius auratus. Means within the same row carrying differentsuperscripts are sig. different at P<0.05 based on Duncan’s MultipleRange Test (DMRT).
Concerning the behavioral alteration of Carassius auratus exposedto different dietary protein levels and starvation stress is shown inTable 4. The feeding frequency and duration in which there was asignificant increase in group C (high protein in diet) when comparedwith groups B (low protein in diet) and D (fasting group). Regardingthe swimming frequency and duration, there was a significant increasein group B when compared with group D. Table 4 also showed theeffect of dietary protein levels and starvation on aggressive frequencyand duration. In which there was a significant increase in group Bwhen compared with other groups. The rest and arousal behavior andduration have a significant increase in fasting group (D), while fishcoming to the surface of aquaria behavior showed a significant increasein group B.
Behavioral patterns Group
A B C D
Frequency of feeding 3.05 ± 0.14b 2.19 ± 0.16c 4.73 ± 0.23a 0.04 ± 0.02d
Feeding time (Sec.) 76.01 ± 3.07b 25.62 ± 2.84c 82.30 ± 2.84a 5.00 ± 2.84d
Frequency of swimming 2.38 ± 0.15b 5.45 ± 0.61a 1.86 ± 0.4b 0.75 ± 0.15c
Swimming time (sec.) 27.28 ± 1.86b 43.95 ± 3.89a 28.34 ± 3.33b 29.02 ± 4.89b
Frequency of aggression 0.84 ± 0.10b 12.8 ± 2.77a 3.04 ± 0.26b 0.45 ± 0.12b
Aggression time (sec.) 4.23 ± 0.94b 21.59 ± 2.52a 5.08 ± 1.99b 7.15 ± 1.65b
Frequency of rest 0.19 ± 0.46b 3.72 ± 0.94ab 0.25 ± 0.05b 4.09 ± 2.32a
Rest time (sec.) 11.87 ± 3.19b 11.11 ± 3.96b 14.37 ± 3.53b 89.93 ± 5.62a
Frequency of arousal 1.00 ± 0.00a 0.94 ± 0.02a 0.97 ± 0.00a 0.36 ± 0.05b
Arousal time (sec.) 108.88 ± 3.19a 108.12 ± 3.56a 105.62 ± 3.53a 33.40 ± 5.85b
Frequency of fish coming surface 1.70 ± 0.13b 2.34 ± 0.17a 0.83 ± 0.10c 0.47 ± 0.10c
Citation: Khalil AAHM, Husseiny WE, Fattah AFA, Ghonimi WAM (2016) Effect of Feeding with Different Dietary Protein Levels and Starvation onthe Health, Nonspecific Immune Parameters, Behavior and Histoarchitectures of Fantail Goldfish (Carassius auratus L.). J Veterinar SciTechnol 7: 278. doi:10.4172/2157-7579.1000278
Page 3 of 12
J Veterinar Sci TechnolISSN:2157-7579 JVST, an open access journal
Volume 7 • Issue 1 • 1000278

Frequency of feeding 3.05 ± 0.14b 2.19 ± 0.16c 4.73 ± 0.23a 0.04 ± 0.02d
Table 4: Effect of nutritional factors on the behavioral patterns of Carassius auratus. Means within the same row carrying different superscriptsare sig. different at P<0.05 based on Duncan’s Multiple Range Test (DMRT).
Table 5 showing the effect of different dietary protein levels andstarvation on some blood serum biochemical Parameters of Carassiusauratus. As shown in this table, there was a significant increase inserum cholesterol level in group feeding on 28% and 45% CP., whencompared with low and fasting groups. The serum total proteinconsiders a nutritional indicator that gives information about fish
metabolism in which there was a significant increase in serum proteinin groups feeding on 28% and 45% CP. Concerning the glucose level asignificant decrease in glucose level in group feeding high protein inaddition there was a significant increase of creatinine in group feeding45% cp in diet when compared with other groups.
Parameters Group
A B C D
Cholesterol(CHO) (mg/dl) 259 ± 4.05a 244 ± 6.39b 260 ± 9.11a 220 ± 2.17c
Total Protein 4.90 ± 0.33a 3.80 ± 0.21b 5.10 ± 0.53a 3.42 ± 0.29c
Glucose 22 ± 2.03b 23 ± 0.91b 18 ± 1.20c 29 ± 2.02a
Creatinine 0.3 ± 0.02c 0.39 ± 0.02b 0.41 ± 0.03a 0.28 ± 0.01b
Table 5: Effect of different nutritional factors on some blood serum biochemical Parameters of Carassius auratus. Means within the same columncarrying different superscripts are sig. different at P<0.05.
Regarding the effect of dietary protein levels and starvation onmean IgM and Lysozyme levels as an important immunologicalparameters of fish blood, in which we observed that the highest IgMlysozyme level was in group C (high protein fed group) (Table 6).
Groups Parameter
IgM Lysozyme
Cholesterol(CHO) (mg/dl) 259 ± 4.05a 244 ± 6.39b
Total Protein 4.90 ± 0.33a 3.80 ± 0.21b
Glucose 22 ± 2.03b 23 ± 0.91b
Creatinine 0.3 ± 0.02c 0.39 ± 0.02b
Table 6: Effect of different nutritional factors on mean IgM andLysozyme levels. Means within the same column carrying differentsuperscripts are sig. different at P<0.05.
Regarding the histological examination, our result revealed thatthere are no any significant changes on the histoarchitectures of the allselected organs; liver, spleen, intestine, head kidney and muscle ofgroups 1, 2 and 3 feed with diet A (28% CP), diet B (17% CP) and dietC (45% CP) respectively. Meanwhile, the fasting of group 4 had themost effective changes on the histoarchitectures of all selected organs.
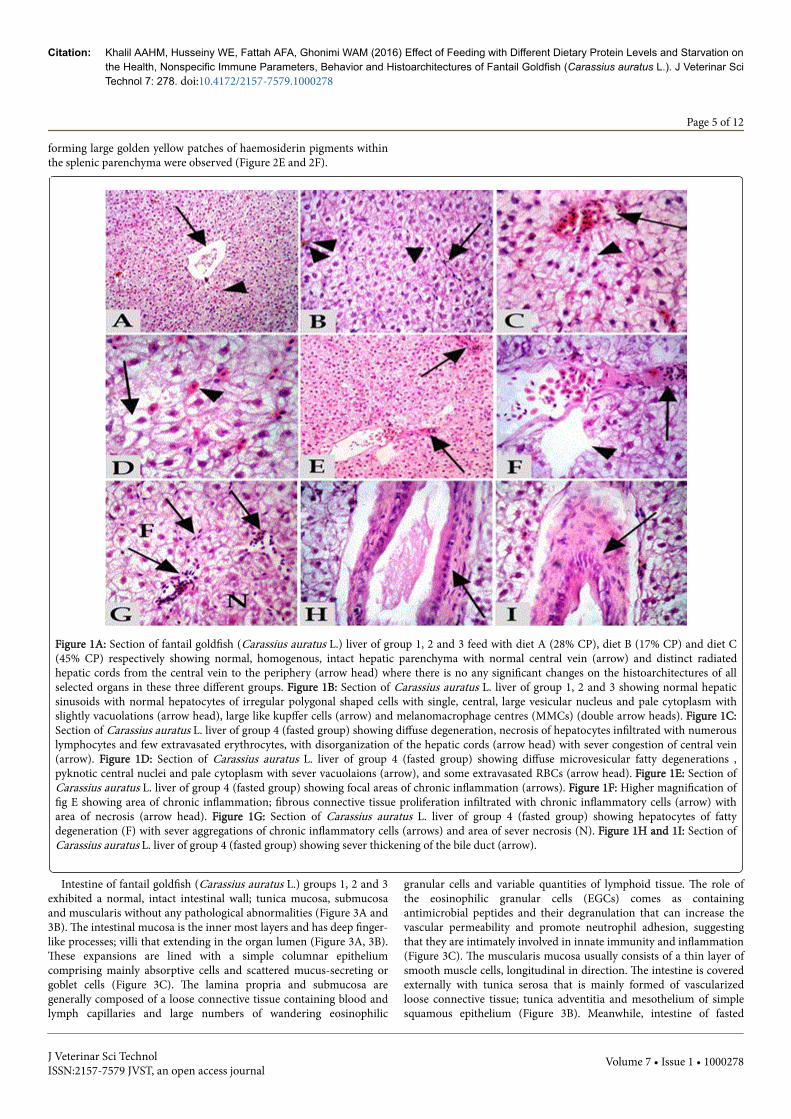
Liver of fantail goldfish (Carassius auratus L.) groups 1, 2 and 3exhibited a normal, homogenous, intact hepatic parenchyma withnormal central vein and there were no any pathological abnormalities.Hepatocytes were arranged as plates or cords that were dorsallyradiated from the central vein toward the periphery of the hepaticlobules. Hepatic lobulations in fan-tailed goldfish was indistinct asthey were separated by a very delicate loose connective tissue (Figure1A). With the higher magnification, liver demonstrated the sponge-like
appearance of the parenchyma which is primarily composed of largeirregular polygonal hepatocytes with typically large single central orsubcentral spherical nucleus with prominent nucleoli and sometimesbinucleated. Nucleus is associated with a pale or vacuolar area.Hepatocytes cytoplasm is pale and homogenous as a lot of glycogen.Furthermore, the hepatic cords were laterally separated by normalsinusoidal architectures that were filled with erythrocytes. Moreover,some kupffer cells and melanomacrophage centres (MMCs) wereobserved (Figure 1B). Meanwhile, liver of fasted fantail goldfish(Carassius auratus L.) group 4 showed focal to diffuse areas of vacuolardegeneration with mild necrotic areas characterized by focal necroticcells with pyknosis and karryorhexis of their nuclei. Disorganization ofthe hepatic cords with sever congestion of the central vein wereobserved (Figure 1C). Massive distension, vacuolations and microvesicular fatty degeneration of hepatocytes were also demonstrated insome examined sections as well as overall degeneration of cellulararchitecture of liver tissue (Figure 1D). Some extravasated RBCs wereobserved in between the hepatocytes within the hepatic parenchyma(Figure 1C, 1D). Focal areas of chronic inflammation with fibrousconnective tissue proliferation (Figure 1E, 1F) infiltrated with chronicinflammatory cells were clarified (Figure 1F, 1G). Sever thickening ofthe bile duct with fibrous tissue proliferation were also observed(Figure 1H, 1I).
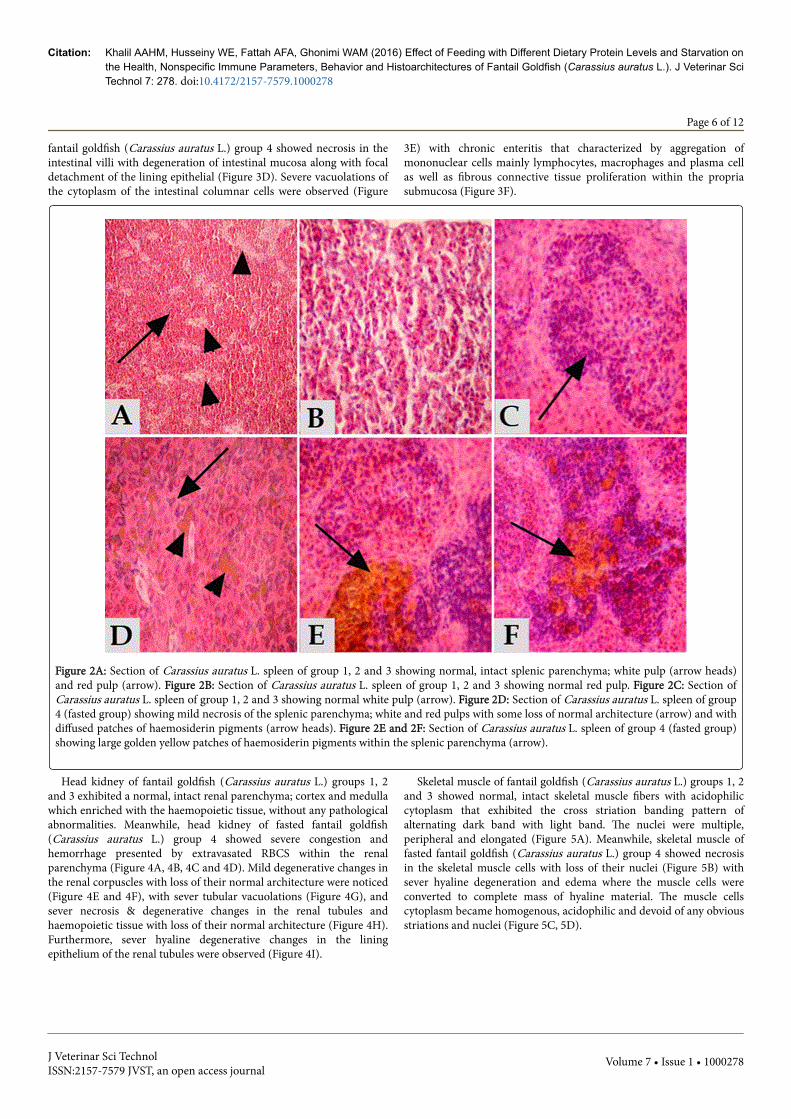
Spleen of fantail goldfish (Carassius auratus L.) groups 1, 2 and 3exhibited a normal, intact splenic parenchyma; white pulp and redpulp as well as the dark staining melanomacrophage centres in thesplenic tissues (MMCs) without any pathological abnormalities (Figure2A, 2B and 2C). Meanwhile, spleen of fasted fantail goldfish (Carassiusauratus L.) group 4 showed mild necrosis of the splenic parenchyma inboth white and red pulps with even initiation of vacuolations and someloss of normal architecture with diffused patches of haemosiderinpigments (Figure 2D). Sever haemosidriosis; haemolysis of RBCs andescape of large amount of haemosidrin pigment that accumulated
Citation: Khalil AAHM, Husseiny WE, Fattah AFA, Ghonimi WAM (2016) Effect of Feeding with Different Dietary Protein Levels and Starvation onthe Health, Nonspecific Immune Parameters, Behavior and Histoarchitectures of Fantail Goldfish (Carassius auratus L.). J Veterinar SciTechnol 7: 278. doi:10.4172/2157-7579.1000278
Page 4 of 12
J Veterinar Sci TechnolISSN:2157-7579 JVST, an open access journal
Volume 7 • Issue 1 • 1000278
forming large golden yellow patches of haemosiderin pigments withinthe splenic parenchyma were observed (Figure 2E and 2F).
Figure 1A: Section of fantail goldfish (Carassius auratus L.) liver of group 1, 2 and 3 feed with diet A (28% CP), diet B (17% CP) and diet C(45% CP) respectively showing normal, homogenous, intact hepatic parenchyma with normal central vein (arrow) and distinct radiatedhepatic cords from the central vein to the periphery (arrow head) where there is no any significant changes on the histoarchitectures of allselected organs in these three different groups. Figure 1B: Section of Carassius auratus L. liver of group 1, 2 and 3 showing normal hepaticsinusoids with normal hepatocytes of irregular polygonal shaped cells with single, central, large vesicular nucleus and pale cytoplasm withslightly vacuolations (arrow head), large like kupffer cells (arrow) and melanomacrophage centres (MMCs) (double arrow heads). Figure 1C:Section of Carassius auratus L. liver of group 4 (fasted group) showing diffuse degeneration, necrosis of hepatocytes infiltrated with numerouslymphocytes and few extravasated erythrocytes, with disorganization of the hepatic cords (arrow head) with sever congestion of central vein(arrow). Figure 1D: Section of Carassius auratus L. liver of group 4 (fasted group) showing diffuse microvesicular fatty degenerations ,pyknotic central nuclei and pale cytoplasm with sever vacuolaions (arrow), and some extravasated RBCs (arrow head). Figure 1E: Section ofCarassius auratus L. liver of group 4 (fasted group) showing focal areas of chronic inflammation (arrows). Figure 1F: Higher magnification offig E showing area of chronic inflammation; fibrous connective tissue proliferation infiltrated with chronic inflammatory cells (arrow) witharea of necrosis (arrow head). Figure 1G: Section of Carassius auratus L. liver of group 4 (fasted group) showing hepatocytes of fattydegeneration (F) with sever aggregations of chronic inflammatory cells (arrows) and area of sever necrosis (N). Figure 1H and 1I: Section ofCarassius auratus L. liver of group 4 (fasted group) showing sever thickening of the bile duct (arrow).
Intestine of fantail goldfish (Carassius auratus L.) groups 1, 2 and 3exhibited a normal, intact intestinal wall; tunica mucosa, submucosaand muscularis without any pathological abnormalities (Figure 3A and3B). The intestinal mucosa is the inner most layers and has deep finger-like processes; villi that extending in the organ lumen (Figure 3A, 3B).These expansions are lined with a simple columnar epitheliumcomprising mainly absorptive cells and scattered mucus-secreting orgoblet cells (Figure 3C). The lamina propria and submucosa aregenerally composed of a loose connective tissue containing blood andlymph capillaries and large numbers of wandering eosinophilic
granular cells and variable quantities of lymphoid tissue. The role ofthe eosinophilic granular cells (EGCs) comes as containingantimicrobial peptides and their degranulation that can increase thevascular permeability and promote neutrophil adhesion, suggestingthat they are intimately involved in innate immunity and inflammation(Figure 3C). The muscularis mucosa usually consists of a thin layer ofsmooth muscle cells, longitudinal in direction. The intestine is coveredexternally with tunica serosa that is mainly formed of vascularizedloose connective tissue; tunica adventitia and mesothelium of simplesquamous epithelium (Figure 3B). Meanwhile, intestine of fasted
Citation: Khalil AAHM, Husseiny WE, Fattah AFA, Ghonimi WAM (2016) Effect of Feeding with Different Dietary Protein Levels and Starvation onthe Health, Nonspecific Immune Parameters, Behavior and Histoarchitectures of Fantail Goldfish (Carassius auratus L.). J Veterinar SciTechnol 7: 278. doi:10.4172/2157-7579.1000278
Page 5 of 12
J Veterinar Sci TechnolISSN:2157-7579 JVST, an open access journal
Volume 7 • Issue 1 • 1000278
fantail goldfish (Carassius auratus L.) group 4 showed necrosis in theintestinal villi with degeneration of intestinal mucosa along with focaldetachment of the lining epithelial (Figure 3D). Severe vacuolations ofthe cytoplasm of the intestinal columnar cells were observed (Figure
3E) with chronic enteritis that characterized by aggregation ofmononuclear cells mainly lymphocytes, macrophages and plasma cellas well as fibrous connective tissue proliferation within the propriasubmucosa (Figure 3F).
Figure 2A: Section of Carassius auratus L. spleen of group 1, 2 and 3 showing normal, intact splenic parenchyma; white pulp (arrow heads)and red pulp (arrow). Figure 2B: Section of Carassius auratus L. spleen of group 1, 2 and 3 showing normal red pulp. Figure 2C: Section ofCarassius auratus L. spleen of group 1, 2 and 3 showing normal white pulp (arrow). Figure 2D: Section of Carassius auratus L. spleen of group4 (fasted group) showing mild necrosis of the splenic parenchyma; white and red pulps with some loss of normal architecture (arrow) and withdiffused patches of haemosiderin pigments (arrow heads). Figure 2E and 2F: Section of Carassius auratus L. spleen of group 4 (fasted group)showing large golden yellow patches of haemosiderin pigments within the splenic parenchyma (arrow).
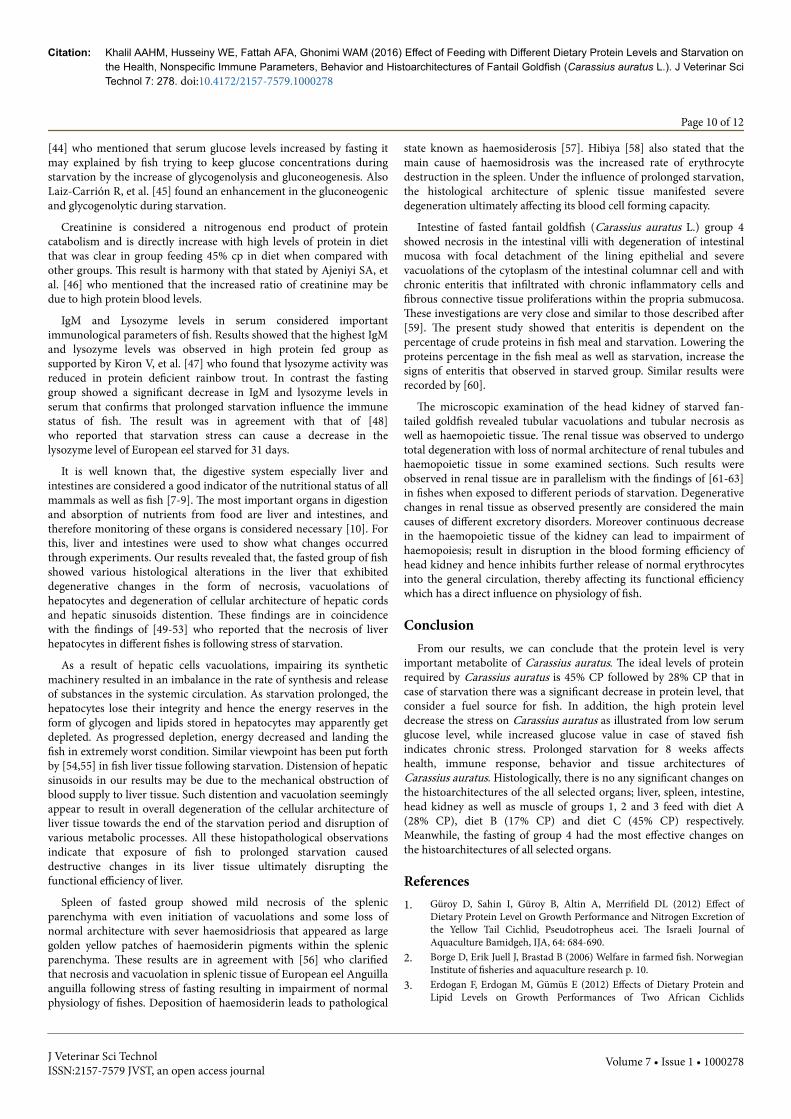
Head kidney of fantail goldfish (Carassius auratus L.) groups 1, 2and 3 exhibited a normal, intact renal parenchyma; cortex and medullawhich enriched with the haemopoietic tissue, without any pathologicalabnormalities. Meanwhile, head kidney of fasted fantail goldfish(Carassius auratus L.) group 4 showed severe congestion andhemorrhage presented by extravasated RBCS within the renalparenchyma (Figure 4A, 4B, 4C and 4D). Mild degenerative changes inthe renal corpuscles with loss of their normal architecture were noticed(Figure 4E and 4F), with sever tubular vacuolations (Figure 4G), andsever necrosis & degenerative changes in the renal tubules andhaemopoietic tissue with loss of their normal architecture (Figure 4H).Furthermore, sever hyaline degenerative changes in the liningepithelium of the renal tubules were observed (Figure 4I).
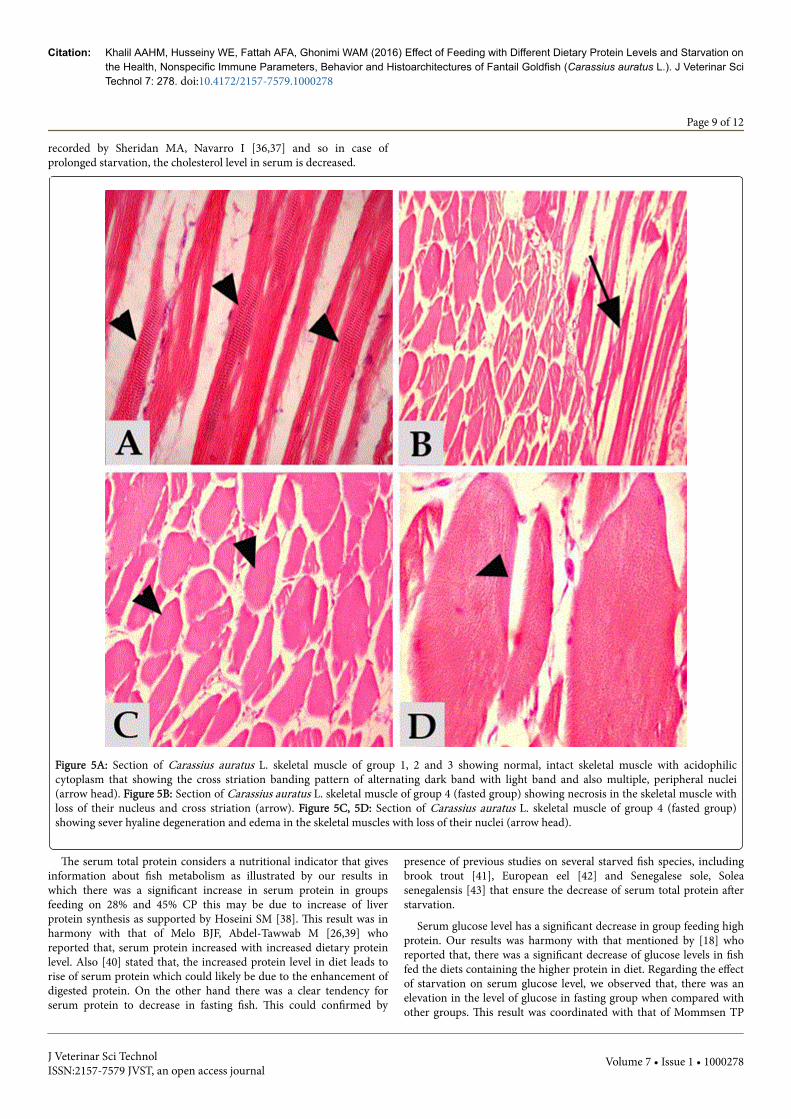
Skeletal muscle of fantail goldfish (Carassius auratus L.) groups 1, 2and 3 showed normal, intact skeletal muscle fibers with acidophiliccytoplasm that exhibited the cross striation banding pattern ofalternating dark band with light band. The nuclei were multiple,peripheral and elongated (Figure 5A). Meanwhile, skeletal muscle offasted fantail goldfish (Carassius auratus L.) group 4 showed necrosisin the skeletal muscle cells with loss of their nuclei (Figure 5B) withsever hyaline degeneration and edema where the muscle cells wereconverted to complete mass of hyaline material. The muscle cellscytoplasm became homogenous, acidophilic and devoid of any obviousstriations and nuclei (Figure 5C, 5D).
Citation: Khalil AAHM, Husseiny WE, Fattah AFA, Ghonimi WAM (2016) Effect of Feeding with Different Dietary Protein Levels and Starvation onthe Health, Nonspecific Immune Parameters, Behavior and Histoarchitectures of Fantail Goldfish (Carassius auratus L.). J Veterinar SciTechnol 7: 278. doi:10.4172/2157-7579.1000278
Page 6 of 12
J Veterinar Sci TechnolISSN:2157-7579 JVST, an open access journal
Volume 7 • Issue 1 • 1000278

Figure 3A: Section of Carassius auratus L. intestine of group 1, 2 and 3 showing normal, intact intestinal wall and intestinal villi. Figure 3B:Section of Carassius auratus L. intestine of group 1, 2 and 3 showing normal, intact intestinal mucosa, submucosa and muscularis. Figure 3C:Section of Carassius auratus L. intestine of group 1, 2 and 3 showing normal lining epithelium of simple columnar cells (short arrow) withscattered goblet cells (arrow head) and normal submucosa (long arrow).Inset box, showing higher magnification of the goblet cells. Figure 3D:Section of Carassius auratus L. intestine of group 4 (fasted group) showing necrosis in the intestinal villi with focal detachment of the liningepithelial (arrow head). Figure 3E: Section of Carassius auratus L. intestine of group 4 (fasted group) showing severe vacuolations of thecytoplasm of the intestinal columnar cells (arrow head). Figure 3F: Section of Carassius auratus L. intestine of group 4 (fasted group) showingchronic enteritis characterized by aggregation of mononuclear cells mainly lymphocytes, macrophages and plasma cell as well as fibrousconnective tissue proliferation within the submucosa.
DiscussionThis research was conducted to know the importance of the
different protein levels in diet and its impact on health and immunity,behavior and histoarchitectures of fantail goldfish Carassius auratus(L.) as well as the study shows how importance exposing those fish tostarvation. Regarding the results of growth performance of Carassiusauratus in which there was a high significant increase in all nutritionalparameters of fish feed on high dietary protein followed by controlthen low protein groups. This can be attributed to the increase amountof protein in the diet and consequently it convert to body mass alsosome of that protein may acts as fuel as suggested by Bancroft JD et al.[26]. Also Lovell [27] mentioned that, the relative deficiency of proteinin fish diet leads to lowering food intake and impairing developmentand growth. Our results also coordinated with that reported by ChengAC, et al. [18] who mentioned that, the moderate dietary proteincontent resulted in weight gain and feed efficiency better than the low-protein diets. The results were in disagreement with that mentioned by
Elangovan A, et al. [28] who reported that, protein level in diet around50% showed a significant decrease in the body weight it may be due tothe animal limitations to use the protein and their reduced feedefficiency. The fish survival was 100% in all treatments.
The behavioral patterns of Carassius auratus were also influenced bydifferent dietary protein levels and starvation. As in case of feedingfrequency and duration in which there was a significant increase ingroup in which fish fed high protein in diet. It may be attributed to thatincrease the dietary protein level in diet of fish increase the feed intakeand growth rate which correlated with increase oxidative metabolismand protein synthesis. This result could be supported by Borge D, et al.[2] who reported that high numbers of factors including feeding affectfish welfare for maintaining homeostasis and normal development andprotected against physical damages. While the effect of dietary proteinlevels and starvation on swimming frequency and duration, there wasa significant increase in group B (low protein in diet) when comparedwith group and D (fasting group).
Citation: Khalil AAHM, Husseiny WE, Fattah AFA, Ghonimi WAM (2016) Effect of Feeding with Different Dietary Protein Levels and Starvation onthe Health, Nonspecific Immune Parameters, Behavior and Histoarchitectures of Fantail Goldfish (Carassius auratus L.). J Veterinar SciTechnol 7: 278. doi:10.4172/2157-7579.1000278
Page 7 of 12
J Veterinar Sci TechnolISSN:2157-7579 JVST, an open access journal
Volume 7 • Issue 1 • 1000278

Figure 4A: Section of Carassius auratus L. head kidney of group 4 (fasted group) showing severe congestion (arrow) and hemorrhage (arrowhead) within the renal parenchyma. Figure 4B: Higher magnification of fig A showing severe congestion (arrow) and sever extravasated RBCs(arrow heads) within the renal parenchyma. Figure 4C and 4D: Section of Carassius auratus L. head kidney of group 4 (fasted group) showingsever hemorrhage with numerous lymphocytes within the renal parenchyma (arrow). Figure 4E, 4F: Section of Carassius auratus L. headkidney of group 4 (fasted group) showing mild degenerative changes in the renal corpuscles with loss of their normal architecture. Figure 4G,4H: Section of Carassius auratus L. head kidney of group 4 (fasted group) showing sever tubular vacuolations in fig G and sever necrosis °enerative changes in the renal tubules with loss of their normal architecture in fig H. Figure 4 I: Section of Carassius auratus L. head kidneyof group 4 (fasted group) showing sever hyaline degenerative changes in the renal tubules (arrow).
This result was in harmony with that mentioned by Martínez M,Alanara A, Brannas E, et al. [29-31] who illustrated that, fooddeprivation and deficiency in the diet leads to changes in metabolicactivity and changes in territorial behavior strategies and activitypattern especially swimming.
Concerning the effect of dietary protein levels and starvation onaggressive frequency and duration, there was a significant increase ingroup B when compared with other groups. It may be due to decreasedietary protein levels which enhance the aggressive behavior. Thisresult was in agreement with that of Höglund E, et al. [32] whoillustrated that increase dietary levels has been shown to suppressaggressive activity. On the other hand, the effect of dietary proteinlevels and starvation on rest and arousal behavior and duration inwhich there was a significant increase in fasting group. There was asignificant decrease in arousal behavior. These results agreed withZielinski WJ [33] who suggested that the availability of food increasethe activity, arousal and decrease the rest duration of fish. The results ofthe effect of dietary protein levels and starvation on fish coming to the
surface of aquaria, showed that there was a significant increase ingroup B. this may be due to that the protein deficiency in diet acts as astress factor in which fish become aggressive and try to come surface toget more food in order to be more growth rate and development assuggested by Houlihan DF, et al. [34].
Results of the effect of different dietary protein levels and starvationon some blood serum biochemical parameters of Carassius auratus,the serum cholesterol level, there was a significant increase in group Aand C when compared with B and D groups. This result go hand withhand of that mentioned by Abdel-Tawwab M [35] who stated that,serum lipids significantly increased when the protein level increasedthis may be as a result of that the muscle is a pivotal compartmentdirectly associated with amino acid turnover. It includes proteinsynthesis or breakdown of those molecules as energetic substrates.While, serum lipid levels decreased in case of fish starvation. As in caseof fasting the stored lipids were used as an energy source. Also ourresults ensure that, energy homeostasis of fish during starvationconfirm occurrence of energy reserves mobilization as lipids as
Citation: Khalil AAHM, Husseiny WE, Fattah AFA, Ghonimi WAM (2016) Effect of Feeding with Different Dietary Protein Levels and Starvation onthe Health, Nonspecific Immune Parameters, Behavior and Histoarchitectures of Fantail Goldfish (Carassius auratus L.). J Veterinar SciTechnol 7: 278. doi:10.4172/2157-7579.1000278
Page 8 of 12
J Veterinar Sci TechnolISSN:2157-7579 JVST, an open access journal
Volume 7 • Issue 1 • 1000278
recorded by Sheridan MA, Navarro I [36,37] and so in case ofprolonged starvation, the cholesterol level in serum is decreased.
Figure 5A: Section of Carassius auratus L. skeletal muscle of group 1, 2 and 3 showing normal, intact skeletal muscle with acidophiliccytoplasm that showing the cross striation banding pattern of alternating dark band with light band and also multiple, peripheral nuclei(arrow head). Figure 5B: Section of Carassius auratus L. skeletal muscle of group 4 (fasted group) showing necrosis in the skeletal muscle withloss of their nucleus and cross striation (arrow). Figure 5C, 5D: Section of Carassius auratus L. skeletal muscle of group 4 (fasted group)showing sever hyaline degeneration and edema in the skeletal muscles with loss of their nuclei (arrow head).
The serum total protein considers a nutritional indicator that givesinformation about fish metabolism as illustrated by our results inwhich there was a significant increase in serum protein in groupsfeeding on 28% and 45% CP this may be due to increase of liverprotein synthesis as supported by Hoseini SM [38]. This result was inharmony with that of Melo BJF, Abdel-Tawwab M [26,39] whoreported that, serum protein increased with increased dietary proteinlevel. Also [40] stated that, the increased protein level in diet leads torise of serum protein which could likely be due to the enhancement ofdigested protein. On the other hand there was a clear tendency forserum protein to decrease in fasting fish. This could confirmed by
presence of previous studies on several starved fish species, includingbrook trout [41], European eel [42] and Senegalese sole, Soleasenegalensis [43] that ensure the decrease of serum total protein afterstarvation.
Serum glucose level has a significant decrease in group feeding highprotein. Our results was harmony with that mentioned by [18] whoreported that, there was a significant decrease of glucose levels in fishfed the diets containing the higher protein in diet. Regarding the effectof starvation on serum glucose level, we observed that, there was anelevation in the level of glucose in fasting group when compared withother groups. This result was coordinated with that of Mommsen TP
Citation: Khalil AAHM, Husseiny WE, Fattah AFA, Ghonimi WAM (2016) Effect of Feeding with Different Dietary Protein Levels and Starvation onthe Health, Nonspecific Immune Parameters, Behavior and Histoarchitectures of Fantail Goldfish (Carassius auratus L.). J Veterinar SciTechnol 7: 278. doi:10.4172/2157-7579.1000278
Page 9 of 12
J Veterinar Sci TechnolISSN:2157-7579 JVST, an open access journal
Volume 7 • Issue 1 • 1000278
[44] who mentioned that serum glucose levels increased by fasting itmay explained by fish trying to keep glucose concentrations duringstarvation by the increase of glycogenolysis and gluconeogenesis. AlsoLaiz-Carrión R, et al. [45] found an enhancement in the gluconeogenicand glycogenolytic during starvation.
Creatinine is considered a nitrogenous end product of proteincatabolism and is directly increase with high levels of protein in dietthat was clear in group feeding 45% cp in diet when compared withother groups. This result is harmony with that stated by Ajeniyi SA, etal. [46] who mentioned that the increased ratio of creatinine may bedue to high protein blood levels.
IgM and Lysozyme levels in serum considered importantimmunological parameters of fish. Results showed that the highest IgMand lysozyme levels was observed in high protein fed group assupported by Kiron V, et al. [47] who found that lysozyme activity wasreduced in protein deficient rainbow trout. In contrast the fastinggroup showed a significant decrease in IgM and lysozyme levels inserum that confirms that prolonged starvation influence the immunestatus of fish. The result was in agreement with that of [48]who reported that starvation stress can cause a decrease in thelysozyme level of European eel starved for 31 days.
It is well known that, the digestive system especially liver andintestines are considered a good indicator of the nutritional status of allmammals as well as fish [7-9]. The most important organs in digestionand absorption of nutrients from food are liver and intestines, andtherefore monitoring of these organs is considered necessary [10]. Forthis, liver and intestines were used to show what changes occurredthrough experiments. Our results revealed that, the fasted group of fishshowed various histological alterations in the liver that exhibiteddegenerative changes in the form of necrosis, vacuolations ofhepatocytes and degeneration of cellular architecture of hepatic cordsand hepatic sinusoids distention. These findings are in coincidencewith the findings of [49-53] who reported that the necrosis of liverhepatocytes in different fishes is following stress of starvation.
As a result of hepatic cells vacuolations, impairing its syntheticmachinery resulted in an imbalance in the rate of synthesis and releaseof substances in the systemic circulation. As starvation prolonged, thehepatocytes lose their integrity and hence the energy reserves in theform of glycogen and lipids stored in hepatocytes may apparently getdepleted. As progressed depletion, energy decreased and landing thefish in extremely worst condition. Similar viewpoint has been put forthby [54,55] in fish liver tissue following starvation. Distension of hepaticsinusoids in our results may be due to the mechanical obstruction ofblood supply to liver tissue. Such distention and vacuolation seeminglyappear to result in overall degeneration of the cellular architecture ofliver tissue towards the end of the starvation period and disruption ofvarious metabolic processes. All these histopathological observationsindicate that exposure of fish to prolonged starvation causeddestructive changes in its liver tissue ultimately disrupting thefunctional efficiency of liver.
Spleen of fasted group showed mild necrosis of the splenicparenchyma with even initiation of vacuolations and some loss ofnormal architecture with sever haemosidriosis that appeared as largegolden yellow patches of haemosiderin pigments within the splenicparenchyma. These results are in agreement with [56] who clarifiedthat necrosis and vacuolation in splenic tissue of European eel Anguillaanguilla following stress of fasting resulting in impairment of normalphysiology of fishes. Deposition of haemosiderin leads to pathological
state known as haemosiderosis [57]. Hibiya [58] also stated that themain cause of haemosidrosis was the increased rate of erythrocytedestruction in the spleen. Under the influence of prolonged starvation,the histological architecture of splenic tissue manifested severedegeneration ultimately affecting its blood cell forming capacity.
Intestine of fasted fantail goldfish (Carassius auratus L.) group 4showed necrosis in the intestinal villi with degeneration of intestinalmucosa with focal detachment of the lining epithelial and severevacuolations of the cytoplasm of the intestinal columnar cell and withchronic enteritis that infiltrated with chronic inflammatory cells andfibrous connective tissue proliferations within the propria submucosa.These investigations are very close and similar to those described after[59]. The present study showed that enteritis is dependent on thepercentage of crude proteins in fish meal and starvation. Lowering theproteins percentage in the fish meal as well as starvation, increase thesigns of enteritis that observed in starved group. Similar results wererecorded by [60].
The microscopic examination of the head kidney of starved fan-tailed goldfish revealed tubular vacuolations and tubular necrosis aswell as haemopoietic tissue. The renal tissue was observed to undergototal degeneration with loss of normal architecture of renal tubules andhaemopoietic tissue in some examined sections. Such results wereobserved in renal tissue are in parallelism with the findings of [61-63]in fishes when exposed to different periods of starvation. Degenerativechanges in renal tissue as observed presently are considered the maincauses of different excretory disorders. Moreover continuous decreasein the haemopoietic tissue of the kidney can lead to impairment ofhaemopoiesis; result in disruption in the blood forming efficiency ofhead kidney and hence inhibits further release of normal erythrocytesinto the general circulation, thereby affecting its functional efficiencywhich has a direct influence on physiology of fish.
ConclusionFrom our results, we can conclude that the protein level is very
important metabolite of Carassius auratus. The ideal levels of proteinrequired by Carassius auratus is 45% CP followed by 28% CP that incase of starvation there was a significant decrease in protein level, thatconsider a fuel source for fish. In addition, the high protein leveldecrease the stress on Carassius auratus as illustrated from low serumglucose level, while increased glucose value in case of staved fishindicates chronic stress. Prolonged starvation for 8 weeks affectshealth, immune response, behavior and tissue architectures ofCarassius auratus. Histologically, there is no any significant changes onthe histoarchitectures of the all selected organs; liver, spleen, intestine,head kidney as well as muscle of groups 1, 2 and 3 feed with diet A(28% CP), diet B (17% CP) and diet C (45% CP) respectively.Meanwhile, the fasting of group 4 had the most effective changes onthe histoarchitectures of all selected organs.
References1. Güroy D, Sahin I, Güroy B, Altin A, Merrifield DL (2012) Effect of
Dietary Protein Level on Growth Performance and Nitrogen Excretion ofthe Yellow Tail Cichlid, Pseudotropheus acei. The Israeli Journal ofAquaculture Bamidgeh, IJA, 64: 684-690.
2. Borge D, Erik Juell J, Brastad B (2006) Welfare in farmed fish. NorwegianInstitute of fisheries and aquaculture research p. 10.
3. Erdogan F, Erdogan M, Gümüs E (2012) Effects of Dietary Protein andLipid Levels on Growth Performances of Two African Cichlids
Citation: Khalil AAHM, Husseiny WE, Fattah AFA, Ghonimi WAM (2016) Effect of Feeding with Different Dietary Protein Levels and Starvation onthe Health, Nonspecific Immune Parameters, Behavior and Histoarchitectures of Fantail Goldfish (Carassius auratus L.). J Veterinar SciTechnol 7: 278. doi:10.4172/2157-7579.1000278
Page 10 of 12
J Veterinar Sci TechnolISSN:2157-7579 JVST, an open access journal
Volume 7 • Issue 1 • 1000278

(Pseudotropheus socolofi and Haplochromis ahli). Turk J Fish Aquat Sci12: 635-640.
4. Moraes G, Bidinotto PM (2004) Digestive proteases of pacu, Piaractusmesopotamicus fed on distinct protein-starch diets. J Appl Aquac 15:197–207.
5. Lundstedt LM, Melo JF, Moraes G (2004) Digestive enzymes andmetabolic profile of Pseudoplatystoma corruscans (Teleostei:Siluriformes) in response to diet composition. Comp Biochem Physiol BBiochem Mol Biol 137: 331-339.
6. Cuesta A, Meseguer J, Esteban MA (2004) Total serum immunoglobulinM levels are affected by immunomodulators in seabream (Sparus aurataL.). Vet Immunol Immunopathol 101: 203-210.
7. Hall KC, Bellwood DR (1995) Histological effects of cyanide, stress andstarvation on the intestinal mucosa of Pomacentrus coelestis, a marineaquarium fish species. Journal of Fish Biology 47: 438-454.
8. Green BS, McCornick MI (1999) Influence of larval feeding history onthe body condition of Amphiprion melanopus. Journal of Fish Biology55: 1273-1289.
9. Caballero MJ, Izquierdo MS, Kjorsvik E, Montero D, Socorro J, et al.( 2003) Morphological aspects of intestinal cells from gilthead seabream(Sparus aurata) fed diets containing different lipid sources. Aquaculture225: 325-340.
10. Roberts RJ (1989) Fish pathology. Baillière Tindall, London.11. Margulies D (1993) Assessment of the nutritional condition of larval and
early juvenile tuna and Spanish mackerel (Pisces Scombridae) in thePanama Bight. Mar Biol 115: 317-330.
12. Kjorsvik E, Vandermeeren T, Kryvi H, Arnfinnson J, Kvenseth PG (1991)Early development of the digestive tract of cod larvae, Gadius morhua L,during start feeding and starvation. J Fish Biol 38: 1-15.
13. Bisbal GA, Bengtson DA (1995) Description of the starving condition insummer flounder Paralichthys dentatus early life history stages. Fish Bull93: 217-230.
14. Sachar A (2012) Studies on effect of organic and inorganic pollutants onhaematology, blood biochemistry and immune organs in some fishes ofJammu region. Ph.D Thesis, Department of Zoology, University ofJammu, Jammu.
15. Pouomonge V, Ombredane D (2001) Effect of feeding frequency on thegrowth of Tilapia (Oreochromis niloticus) in earthen ponds. Tropicultura19: 147-150.
16. Altmann J (1974) Observational study of behavior: sampling methods.Behaviour 49: 227-267.
17. Stephan GR (2008) Sleep in fishes. Universite de Moncton, Canda pp.1-13.
18. Cheng AC, Chen CY, Liou CH, Chang CF (2006) Effects of DietaryProtein and Lipids on Blood Parameters and Superoxide AnionProduction in the Grouper, Epinephelus coioides (Serranidae:Epinephelinae). Zoological Studies 45: 492-502.
19. Trinder P (1969) Determination of glucose concentration in the blood.Clinical Biochemistry 6: 24.
20. Hestrin S (1949) The reaction of acetylcholine and other carboxylic acidderivatives with hydroxylamine, and its analytical application. J BiolChem 180: 249-261.
21. Henry RJ (1964) Clinical Chemistry Principles and Techniques. (2ndEdn) Harper and Row Publ, New York, USA pp. 160-172.
22. Henry RJ (1974) Clinical Chemistry Principles and Techniques. 2nd ed.,Harper and Row Publ, New York, USA pp. 1354-1369.
23. Ellis AE (1990) Lysozyme assays. In Stolan JS, Fletcher TC, Erson DP,Roberson BS, Muiswinkel WB (Eds) Techniques in Fish Immunology,USA: SOS publications 1: 1-103.
24. Siwicki AK, Anderson DP (1993) Non-specific defense mechanisms assayin fish. II Potential killing activity of neutrophils and macrophages,lysozyme activity in serum and organs and total immunoglobulin level inserum. FAO-Project GCP/INT/526/JPN, IFI Olzsztyn pp. 105-112.
25. Bancroft JD, Gamble M (2001) Theory and practice of histologicaltechniques (5th Edn) Churchill livingstone, New york pp. 281-285.
26. Melo BJF, Lundstedt LM, Metón I, Baanante IV, Moraes G (2006) Effectsof dietary levels of protein on nitrogenous metabolism of Rhamdia quelen(Teleostei: Pimelodidae). Comparative Biochemistry and Physiology, PartA 145: 181-187.
27. Lovell RT (1979) Factors affecting voluntary food consumption bychannel catfish. Proc World Symp. Finfish Nutr Fishfeed Technol 1:555-564.
28. Elangovan A, Shim KF (1997) Growth response of juvenile Barbodes altusfed isocaloric diets with variable protein levels. Aquaculture 158: 321-329.
29. Martínez M, Guderley H, Dutil JD, Winger PD, He P, et al. (2003)Condition, prolonged swimming performance and muscle metaboliccapacities of cod Gadus morhua. J Exp Biol 206: 503-511.
30. Alanara A, Burns MD, Metcalfe NB (2001) Intraspecific resourcepartitioning in brown trout: the temporal distribution of foraging isdetermined by social rank. J Anim Ecol 70: 980-986.
31. Brannas E, Jonsson S, Lundquist H (2003) Influence of food abundanceon individual behavior strategy and growth rate in juvenile brown trout(Salmo trutta). Can J Zool 81: 684-691.
32. Höglund E, Weltzien FA, Schjolden J, Winberg S, Ursin H, et al. (2005)Avoidance behavior and brain monoamines in fish. Brain Res 1032:104-110.
33. Zielinski WJ (1988) The influence of daily variation in foraging cost onthe activity of small carnivorous. Animal behavior 36: 239-249.
34. Houlihan DF, Mathers E, Foster AR (1993) Biochemical correlates ofgrowth rate in fish. In: Rankin JC, Jensen FB (Eds) Fish Ecophysiology,Chapman & Hall, London, pp: 45–72.
35. Abdel-Tawwab M (2012) Effects of dietary protein levels and rearingdensity on growth performance and stress response of Nile tilapia,oreochromis niloticus (L). International Aquatic Research 4: 3.
36. Sheridan MA, Mommsen TP (1991) Effects of nutritional state on in vivolipid and carbohydrate metabolism of coho salmon, Oncorhynchuskisutch. Gen Comp Endocrinol 81: 473-483.
37. Navarro I, Gutierrez J (1995) Fasting and starvation. In: Hochachka PW,Mommsen TP (Eds) Biochemistry and Molecular Biology of Fishes.Elsevier, New York, pp: 393–434.
38. Hoseini SM, Ghelichpour M (2013) Effects of pre-sampling fasting onserum characteristics of common carp (Cyprinus carpio L). InternationalJournal of Aquatic Biology 1: 6-13.
39. Abdel-Tawwab M, Ahmad MH, Khattab YAE, Shalaby AME (2010) Effectof dietary protein level, initial body weight, and their interaction on thegrowth, feed utilization, and physiological alterations of Nile tilapia,Oreochromis niloticus(L). Aquaculture 298: 267-274.
40. Lundstedt LM, Melo JFB, Santos-Neto C, Moraes G (2002) Dietinfluences proteolytic enzyme profile of the South American catfish.In:Rhamdia quelen (Ed) Proceedings of the International Congress on theBiology of Fish biochemistry and physiology advances in finfishaquaculture, Vancouver pp. 22–25.
41. Heming TA, Paleczny EJ (1987) Compositional changes in skin mucusand blood serum during starvation of trout. Aquaculture 66: 265–273.
42. Dave G, Johansson-Sjobeck ML, Larsson A, Lewander K, Lidman U(1975) Metabolic and hematological effects of starvation in the Europeaneel, Anguilla anguilla LI Carbohydrate, lipid, protein and inorganic ionmetabolism. Comp Biochem Physiol A Physiol 52A: 423–430.
43. Costas B, Aragao C, Ruiz-Jarabo I, Vargas-Chacoff L, Arjona FJ, et al.(2011) Feed deprivation in Senegalese sole (Solea senegalensis Kaup,1858) juveniles: effects on blood plasma metabolites and free amino acidlevels. Fish Physiol Biochem 37: 495–504.
44. Mommsen TP, Plisetskaya EM (1991) Insulin in Fishes and agnathans:history, structure, and metabolic regulation. Reviews in Aquatic Sciences4: 225-259.
45. Laiz-Carrión R, Viana I R, Cejas J R, Ruiz-Jarabo I, Jerez S, et al. (2012)Influence of food deprivation and high stocking density on energeticmetabolism and stress response in red porgy, Pagrus pagrus L.Aquaculture International 20: 585-599.
Citation: Khalil AAHM, Husseiny WE, Fattah AFA, Ghonimi WAM (2016) Effect of Feeding with Different Dietary Protein Levels and Starvation onthe Health, Nonspecific Immune Parameters, Behavior and Histoarchitectures of Fantail Goldfish (Carassius auratus L.). J Veterinar SciTechnol 7: 278. doi:10.4172/2157-7579.1000278
Page 11 of 12
J Veterinar Sci TechnolISSN:2157-7579 JVST, an open access journal
Volume 7 • Issue 1 • 1000278

46. Ajeniyi SA, Solomon RJ (2014) Urea and Creatinine of Clarias Gariepinusin Three Different Commercial Ponds. Nature and Science 12: 124.
47. Kiron V, Fukuda H, Okamoto N, Takeuchi T (1995) Protein nutrition anddefense mechanisms in rainbow trout, Oncorhynchus mykiss. CompBiochem Physiol 111A: 351-359.
48. Caruso G, Denaro MG, Caruso R, Genovese L, Mancari F, et al. (2012)Short fasting and refeeding in red porgy (Pagrus pagrus, Linnaeus 1758):Response of some haematological, biochemical and non specifc immuneparameters. Marine Environmental Research 81: 18-25.
49. Pal M (2006) Bioassay studies under the ecotoxicological stress ofchromium tri-oxide in a freshwater food fish, Channa punctatus (Bloch).PhD Thesis, Department of Zoology, University of Lucknow, Lucknow.
50. Sarkar B, Chatterjee A, Adhikari S, Ayyappan S (2005) Carbofuran andcypermethrin induced histopathological alterations in the liver of Labeorohita (Hamilton) and its recovery. J Appl Ichthyol 21: 131-135.
51. Camargo M, Martinez C (2007) Histopathology of gills, kidney and liverof a Neotropical fish caged in an urban stream. Neotropical Ichthyology 5:327-336.
52. Pathan T, Shinde S, Thete P, Sonawane D (2010) Histopathology of liverand kidney of Rasbora daniconius exposed to paper mill effluent.Research Journal of Biological Sciences 5: 389-39.
53. Radhakrishnan M, Hemalatha S (2010) Sublethal effects of cadmiumchloride to liver of freshwater fish Channa striatus (Bloch). AmericanEurasian Journal of Toxicological Sciences 2: 54-56.
54. Gisbert E, Conklin D, Piedrahita R (2004 ) Effects of delayed first feedingon the nutritional condition and mortality of California halibut larvae. JFish Biol 64: 116-132.
55. Rios F, Donatti L, Fernandes M, Kalinin A, Rantin F (2007) Liverhistopathology and accumulation of melanomacrophage centres in
Hoplias malabaricus after long-term food deprivation and refeeding.Journal of Fish Biology 71: 1393-1406.
56. Spazier E , Storch V, Braunbeck T (1992) Cytopathology of spleen in eelAnguilla anguilla exposed to a chemical spill in the Rhine River. Diseasesof Aquatic Organisms 14: 1-22.
57. Zapata AG, Cooper EL (1990) The immune system: comparativehistopathology. John Wiley and Sons, Chichester, England, Zool SocBengalis 1: 67-70.
58. Hibiya T (1982) An atlas of fish histology. Normal and pathologicalfeatures. Kodansha Ltd, Tokyo pp: 147.
59. Urán PA, Gonçalves AA, Taverne-Thiele JJ, Schrama JW, Verreth JA, et al.(2008) Soybean meal induces intestinal inflammation in common carp(Cyprinus carpio L.). Fish Shellfish Immunol 25: 751-760.
60. Krogdahl Å, Bakke-McKellep AM, Baeverfjord G (2003) Effects of gradedlevels of standard soya bean meal on intestinal structure, mucosal enzymeactivities, and pancreatic response in Atlantic salmon (Salmo salar L).Aquaculture Nutrition 9: 361-371.
61. Velmurugan B, Selvanayagam M, Cengiz EI, Unlu E (2007) The effects offenvalerate on different tissues of freshwater fish Cirrhinus mrigala. JEnviron Sci Health B 42: 157-163.
62. Mohamed F (2009) Histopathological studies on Tilapia zilli and Soleovulgaris from lake Qarun, Egypt. World Journal of Fish and MarineSciences 1: 29-39.
63. Prashanth M (2011) Histopathological changes observed in the kidney offreshwater fish, Cirrhinus mrigala (Hamilton) exposed to cypermethrin.Recent Research in Science and Technology 3: 59-65.
Citation: Khalil AAHM, Husseiny WE, Fattah AFA, Ghonimi WAM (2016) Effect of Feeding with Different Dietary Protein Levels and Starvation onthe Health, Nonspecific Immune Parameters, Behavior and Histoarchitectures of Fantail Goldfish (Carassius auratus L.). J Veterinar SciTechnol 7: 278. doi:10.4172/2157-7579.1000278
Page 12 of 12
J Veterinar Sci TechnolISSN:2157-7579 JVST, an open access journal
Volume 7 • Issue 1 • 1000278