via first class mail and email …...incorporated 1896 1333 park avenue. emeryville, ca 94608-3517 t...
TRANSCRIPT

I N C O R P O R A T E D 1 8 9 6
1333 Park Avenue. Emeryville, CA 94608-3517 t (510) 596-4300 | f (510) 596-4389
April 19, 2019 VIA FIRST CLASS MAIL AND EMAIL ([email protected]) Tony Tavares Director California Department of Transportation 111 Grand Avenue Oakland, CA 94612 Rebecca De Pont Associate Environmental Planner California Department of Transportation, District 4 (Caltrans) P.O. Box 23660, MS 8B Oakland, CA 94623 Re: MacArthur Maze Vertical Clearance Project (“Project”) Dear Ms. De Pont: On behalf of the City of Emeryville (“City”), I write to submit comments on the Initial Study with Proposed Negative Declaration/Environmental Assessment (“ND”) regarding the above-referenced Project. As an initial matter, Public Resources Code section 21092.4(a) requires the lead agency to consult with transportation planning agencies and public agencies that have transportation facilities (as defined in Public Resources Code section 21092.4(b)) within their jurisdictions that could be affected by the project in the same manner as the lead agency would consult with a responsible agency. The ND was signed on January 15, 2019. However, the City received its first notification of the Project with a notice for a Project Development Team (PDT)/Stakeholders meeting on February 6, 2019. This notice is in stark contrast to the consultation efforts the agencies have undertaken with respect to the I-80/Ashby Avenue (SR-13) Interchange Improvements. The notifications Caltrans sent to the general public, which included the City, does not constitute the consultation envisioned by the Public Resources Code. The City’s preference would be to partner with Caltrans to address the Project’s impacts on Emeryville residents and businesses. However, because Caltrans did not consult with the City prior to the release of the ND as required by Public Resources Code section 21092.4, the City is compelled to submit these written comments1 on the ND.
1 Based on their skill and expertise, City Public Works staff, Andrew Clough, PG, Public Works Director, and Ryan O’Connell, P.E., Senior Civil Engineer, and City Planning staff, Charles S. Bryant, AICP,

City of Emeryville Comments on MacArthur Maze Vertical Clearance Project IS Page 2 of 14 The traffic impacts from this Project, especially during construction, will be acutely felt by the Emeryville community. While the City of Emeryville has a relatively small residential population compared to its neighbors, the City is a regional hub for commercial and retail activity. The City’s daytime population increases to approximately 32,000, and the Project’s impact on these commuters will be significant. The City is also unique in that funding for City services is largely reliant on more economically sensitive revenues such as sales tax, transient occupancy tax and business license tax, unlike other cities who are able to rely on more stable property tax. Should the Project affect the City’s economic drivers, it could negatively impact the City’s ability to sustain services to the entire community. For all of the reasons described in detail below, the City requests that Caltrans withdraw the proposed ND and complete a more thorough, adequate analysis of the project, as required under the California Environmental Quality Act (Public Resources Code, § 21000, et seq.) and its own policies and procedures. Due to the inadequate analysis of the ND, it remains unclear whether the City should also be named as a responsible agency. The Traffic Management Plan, a Project feature, will presumably require the City to participate in any such plan. The closure of certain segments of I-80, I-580, and I-880 as contemplated by the Project may impact major local arterials (such as Frontage Road, Powell Street, Christie Avenue, Shellmound Street, 40th Street, Ashby Avenue, 7th Street, W. Grand Avenue), nearby on and off-ramps, and public transportation, such as the Emery Go-Round, provided by the Emeryville Transportation Management Association, and will require Caltrans to reimburse the City for the expenses the City will incur as a result of such detours2. If the City is required to carry out a portion of the Project, then the City should be named as a responsible agency. In the meantime, the City’s comments related to the inadequacy of the ND follow below.
I. The ND does not adequately describe either baseline freight conditions or Project-caused freight conditions.
The ND lacks a basis for its conclusion that the Project will have no change in capacity or configuration of the current freeways. (See, e.g., ND, pp. 23, 55.) A change in the vertical clearance is a change in the capacity and configuration of the freeways. As the ND states: “This project would allow freight vehicles more direct access to and from the Port of Oakland.” (ND, p. 22; see also p. 55.) Furthermore, Appendix G to the Alameda County Transportation Goods Movement Plan (2016)3 (“Goods Movement Plan”) states that the Port of Oakland forecasts a 233% increase in freight tonnage from 2012 to 2040 (from 17,381 to 40,445 thousand tons per year). This Project will allow additional clearance for trucks to take new routes that they are not able to do under the current conditions. Accordingly, the Project will have an impact, and the question becomes how significant is the impact? To analyze that issue, information about baseline traffic characteristics for the Project area, such as truck routes, traffic volumes, and delays from Community Development Director and Diana Keena, AICP, Associate Planner have contributed to these comments. 2 Streets and Highway Code § 93. 3 Available at https://www.alamedactc.org/planning/goodsmovement/. Last visited on 3/19/19.

City of Emeryville Comments on MacArthur Maze Vertical Clearance Project IS Page 3 of 14 existing conditions is needed. The analysis should also include a comparison to the new traffic characteristics of opening these bridge spans to taller trucks. Unfortunately, the ND does not contain any information about such characteristics. In addition, the ND’s oversimplification of the purpose and need statements is problematic. The Caltrans’ Draft Project Report for Route 80/580/880 Separation (EA 4K8100), dated 2/6/2019 (“Draft Project Report”) for this Project states: “The purpose of this project is to increase the vertical clearances to current standard at three locations in the Maze to eliminate lengthy, time-consuming, and costly detours of large freight vehicles transporting goods through the I-80 connectors.” The bolded language was simplified when the purpose statement was restated in the ND. The language changed to, “that impede the safe and efficient movement of freight vehicles through the interchange.” The ND then only mentions the roadway vertical deficiencies as the need for the Project. However, the Draft Project Report not only includes vertical deficiencies as a purpose and need for the Project, but also elaborates on the goods movement needs as a basis for this Project. The Draft Project Report states that the current height restrictions “hinder the continuous movement of large or heavy freight loads. Because these connectors are not useable by larger or heavier loads, the trucks carrying these loads need to make lengthy detours around the bridges. Besides requiring extra time, these detours also generate extra greenhouse gas (GHG) emissions and other pollutants.”4 Although both the ND and Draft Project Report mention the large or heavy freight loads as a quasi-“need” for the Project, there are no metrics or information given for the baseline conditions, volumes, and routing. In addition, neither analyzes the future forecasted volumes and routing of freight traffic after this Project is completed (along with completion of other vertical clearance projects on I-80). This last sentence alone constitutes sufficient reason to withdraw the ND and to re-do the environmental analysis for this Project. The City requests that Caltrans includes information about the current traffic characteristics of all modes (explicitly highlighting truck routes, loads, special permit frequency, and special permit routing), and the projected traffic characteristics as a result of the Project and its alternatives. The flaw in the analysis of traffic conditions permeates into the other analyses in the ND that rely on the faulty conclusion that the Project does not change the capacity or configuration of the freeways. For example, for air quality, the ND states: “The proposed project is exempt per 40 CFR 93.126 as it would not increase the capacity of the MacArthur Maze or move the alignment closer to sensitive receptors” (ND, p. 24). Caltrans should update all analyses that rely on the erroneous conclusion about no change in capacity or configuration of the freeways. Finally, the ND concludes that the Project would not have impact on population and housing and would have no growth inducing impacts. (See, e.g., ND, p. 23 and p. 68) However, the Goods Movement Plan provides that: “Goods movement is critical to the County’s economy, with about one-third employment coming from goods movement-dependent industries….” (Goods Movement Plan, p. 14.) Caltrans should analyze 4 Caltrans’ Draft Project Report for Route 80/580/880 Separation (EA 4K8100), dated 2/6/2019.

City of Emeryville Comments on MacArthur Maze Vertical Clearance Project IS Page 4 of 14 whether the increased capacity for freight traffic will result in additional job creation, which in turn, could result in additional traffic, and demands on housing, as the population may increase as people move nearby to fill jobs created by the Project.
II. The ND does not adequately analyze the Project’s impact on alternative forms of transportation.
A. Alternative C will permanently displace a critical transit facility serving Emeryville.
Ironically, the ND concludes that “The proposed project complies with the following plans: Sustainable Transportation Plan - The City of Emeryville.” (ND, p. 22). However, the ND did not analyze the impacts of the Project and its alternatives on the Emery Go-Round. If it had, it would reach a different conclusion. Emery Go-Round is a free shuttle that is open to the public and connects the MacArthur BART station to businesses, residences, schools and other origins and destinations in Emeryville. It moves more than 5,500 passengers per day.5 It is owned and operated by the Emeryville Transportation Management Association (“ETMA”). However, pursuant to the City’s General Plan6 Policy T-P-34, the City supports and subsidizes Emery Go-Round because it offers free transit for both local travel within the City and travel to the regional hubs located at the Amtrak station, the MacArthur BART station, and San Pablo Avenue at 40th Street. ETMA is currently operating the fleet for Emery Go-Round at a temporary location within the City. It may only operate at its current location until April 15, 2020. ETMA has obtained a conditional use permit from the City of Oakland7 for a new site for operations located on Caltrans property. Accordingly, ETMA and Caltrans are in the process of executing a long-term lease for site ALA 580-34 with the Caltrans Airspace Lease Department.8 The site is adjacent to Mandela Parkway underneath the bridge spans for WB/EB 80 to EB 580.9 Although the site is located in Oakland, it is the only available site that is in close enough proximity to Emeryville and of a size that will allow the ETMA to continue to operate Emery Go-Round at its current service levels. The ETMA is conducting environmental technical studies and preparing a design submittal. The ND concludes “The project would have no permanent impacts to traffic or transportation or pedestrian and bicycle facilities.” (ND, p. 23.) Similarly, the ND also concludes: “The alternatives for this project would not impact the current or future land use in this area. There will be no changes in access or permanent impacts to any parks 5 ETMA Annual Ridership Survey, available at https://www.emerygoround.com/assets/etma-agenda-packet_jan2019.pdf. Last accessed 4/2/19. 6 The General Plan is available at https://www.ci.emeryville.ca.us/385/General-Plan-and-Supporting-Documents. Last accessed on 3/19/19. 7 Oakland CUP Approval Letter/Resolution, available at https://www.emerygoround.com/assets/etma-agenda-packet_april182019.pdf. Last accessed on 4/17/19. 8 In December 2018, the California Transportation Commission authorized District 4 to negotiate the terms of the lease with the ETMA; see also ETMA Board Agenda for April 18, 2019, at https://www.emerygoround.com/assets/etma-agenda-packet_april182019.pdf 9 Emery Go-Round Yard Location Map (Attachment A).

City of Emeryville Comments on MacArthur Maze Vertical Clearance Project IS Page 5 of 14 or trails, residences, or undeveloped land from this project.” (ND, p. 22; see also p. 23). However, Alternative C would permanently block access to site ALA 580-34. Without this site, ETMA will have no future facility to base its operations. If Emery Go-Round ceases to operate, the 5,500 passengers that are moved daily by Emery Go-Round will need to find alternative means of transportation, which may include single rider vehicle trips, leading to worsening traffic conditions, and air quality conditions. Accordingly, the City requests that Caltrans analyze the impacts that the Project and its alternatives may have on the operations of Emery Go-Round. Finally, Alternative C, which requires completely rebuilding the structures, should be abandoned. Such a rebuild would only be required if there were structural deficiencies. However, at the community meeting held in Emeryville on April 10, 2019, Caltrans’ staff stated that all of the bridges have been seismically retrofitted recently and that there are no structural deficiencies. Accordingly, Alternative C is not necessary.
B. The Project will impact regional transit provider AC Transit. Detour traffic could impact AC Transit routes, reducing reliability and increasing travel times. Impacted routes on Shellmound and 40th streets include the 57 and 36 local routes and the F, J and C Transbay routes. Together, these routes move over 10,000 riders on a daily basis. The 29 local route on Hollis Street could also be affected, which would impact an additional 1,348 daily riders. Also, the Caltrans TMP Guidelines call for “special arrangements with local transit services to encourage transit trips and contributing funds to accommodate a significant increase in ridership.” The City stresses the importance of Caltrans working closely with all local transit agencies to develop strategies to encourage alternate modes of transportation. Fewer vehicles on the roadway improves the safety of the Project’s construction workers and commuters alike.
C. The Project will impact bicycle/pedestrian facilities. In addition to failing to identify the impacts on Emery Go-Round and AC Transit, the ND does not adequately analyze the impacts of the Project on the Regional Bay Trail. First, all Project alternatives include using the existing Bay Bridge Trail segment for staging and site access, and such use “may require rerouting, realignment, and/or overhead protection during construction.” (ND, p. 11.) The ND should analyze whether this impact on the Bay Bridge Trail will result in additional traffic if there is closure of the trail and users use other modes of transportation. In addition, the ND does not analyze the impacts of the Project on a planned segment of the Regional Bay Trail. Figure 3-5 of Emeryville’s General Plan is a map of the planned Regional Bay Trail, which shows the Bay Trail making a connection from Emeryville to West Oakland by way of Halleck/Beach/Wood to Mandela Parkway. The ND concludes that the Project does not impact any current or future land uses (ND, p. 22), but such conclusion is not supported without an analysis of how the Project impacts the planned

City of Emeryville Comments on MacArthur Maze Vertical Clearance Project IS Page 6 of 14 Regional Bay Trail. Accordingly, the ND should analyze the Project’s impacts on this planned segment of the Regional Bay Trail.
III. The ND fails to analyze the significance of the traffic impacts during construction of the Project.
A. The Project description is inadequate without any information about the Traffic Management Plan.
A feature of the project includes the development of a Traffic Management Plan (TMP). (ND, p. 49.) This TMP will be developed during the design/construction phase of the Project. There is no analysis of why the development of the TMP is deferred until after Project approval, when it is a Project feature. The deferral of the development of the TMP violates existing Caltrans policy. Major TMPs may include the full spectrum of strategies, including lane requirement charts, special provisions for unique project characteristics, a large-scale public awareness campaign (with brochures, public meetings, project website, telephone hotline), COZEEP services, FSP, detours to alternate highways or surface streets, and special arrangements with local transit services to accommodate a significant increase in ridership. Accordingly, Caltrans Transportation Management Plan Guidelines10 (2015) (TMPG) policy states that TMPs are to be considered early during the project initiation or planning stage, and that they need to be refined and further developed as the project progresses through the various stages of development.11 The TMPG further states that TMP development is part of the normal project development process and must be considered in the project initiation document (PID) or the planning stage.12 This means that the project team needs to assess the potential work zone implications of a project early enough in planning so that they have an understanding of the TMP needs and costs for that project. The extent of a TMP is determined by the District Traffic Manager (DTM) during the preliminary studies of a capital project, namely the Project Study Report (PSR) or Project Study Scoping Report (PSSR).13 This decision-making on the extent of the TMP is driven by the DTM's understanding of the expected work zone impacts of a project. The TMPG further states that since projects are generally programmed, budgeted, and given an expenditure authorization upon PSR or PSSR approval, it is important to allow for the proper cost, scope, and scheduling of the TMP activities at this early stage of development.14 For all TMPs, an itemized estimate of the proposed strategies and their respective costs are included in the PSR for proper funding consideration. The small amount of information that Caltrans has provided about this Project since publication of the ND, regarding detours, night-time closures, weekend closures, and “extended” closures, has been inconsistent. At the Caltrans/City stakeholder meeting in 10 Available at: http://www.dot.ca.gov/trafficops/tm/docs/TMP_Guidelines.pdf. Last accessed on 3/19/19. 11 Available at: http://www.dot.ca.gov/trafficops/tm/docs/TMP_Guidelines.pdf. Last accessed on 3/19/19. 12 Available at: http://www.dot.ca.gov/trafficops/tm/docs/TMP_Guidelines.pdf. Last accessed on 3/19/19. 13 Available at: http://www.dot.ca.gov/trafficops/tm/docs/TMP_Guidelines.pdf. Last accessed on 3/19/19. 14 Available at: http://www.dot.ca.gov/trafficops/tm/docs/TMP_Guidelines.pdf. Last accessed on 3/19/19.

City of Emeryville Comments on MacArthur Maze Vertical Clearance Project IS Page 7 of 14 Emeryville on April 3, 2019, CalTrans Corridor Manager Laurie Lau described night-time closures as westbound 10 pm to 4 am and eastbound 12am to 6am, but at the April 10, 2019, community workshop meeting in Emeryville, she described the closures as being from 10 pm to 4 am. Also, at the April 10th community workshop, closures for Alternatives C and D were described as “night and extended”. Inconsistencies between PDT Meetings, Caltrans/City stakeholder meetings, and community workshops need to be resolved. Furthermore, without a TMP during the planning phase for this Project, Caltrans cannot adequately analyze the Project’s air quality impacts. The City agrees with Bay Area Air Quality Management District’s comment that CalTrans is required to “conduct a robust analysis of potential air quality impacts, including: emissions from construction equipment; emissions from re-routed traffic during construction, particularly traffic impacting local streets, and; emissions from long tern operations of the re-built interchange.”15 There is no analysis regarding the air quality impact during construction from traffic diverted to local streets, nor could there be, until Caltrans develops the TMP. Given that the TMP is a feature of the Project, and critical to adequately analyzing the air quality impacts of the Project, Without such information, the Project description is inadequate because the impacts to the environment as a result of the detoured traffic cannot be analyzed. The City requests that the TMP for this Project be included in the planning phase, so that the City can opine on proposed strategies before the project enters into Preliminary Engineering. In accordance with Sections 1.3 and 1.4 of the TMPG, the preliminary information and memorandums regarding the TMP should be disclosed to the public as part of any environmental review.
B. The Project will impact residential streets and schools. The TMP for this Project must consider when and where traffic will be re-routed during major construction closure events. The City of Emeryville has many low-volume, low-speed residential roadways that cannot accommodate the influx of diverted trips going around the construction zone. Improvements on streets and intersections for the roadway or alternate routes may be necessary to provide increased capacity to handle the traffic through the work zone or within the adjacent corridor. Pedestrian, bicycle, emergency vehicles and transit needs should be carefully considered to maximize the positive impact of alternative modes. The major corridors of Emeryville that traffic will likely get routed towards (directly or indirectly) are classified as Transit Priority Streets per Emeryville’s General Plan16. Signal timing and coordination improvements should be part of the TMP plan and described in the ND. This strategy involves retiming traffic signals to increase vehicle throughput of
15 Letter dated April 5, 2019, from Greg Nudd, Deputy Air Pollution Control Officer, BAAQMD to Tony Tavares, Director, Caltrans District 4. Emphasis added. 16 Available at: https://www.ci.emeryville.ca.us/385/General-Plan-and-Supporting-Documents. Last accessed on 3/28/19.

City of Emeryville Comments on MacArthur Maze Vertical Clearance Project IS Page 8 of 14 the roadway(s), improve traffic flow, and optimize intersection capacity in and around the work zone. Signal timing and coordination could include transit vehicle priority equipment and plans. If construction detours route traffic towards San Pablo Avenue, there are schools on or adjacent to San Pablo Avenue between Powell Street and 40th Street, including Emeryville Center of Community Life at 4727 San Pablo Avenue, and Escuela Bilingüe Internacional at 4550 San Pablo Avenue. Detours described in the TMP must take into consideration the start and end times of each of these schools so as to not send additional vehicular traffic towards school at their traffic peak periods. Additionally, diverted traffic on corridors near schools should be monitored, measured, and mitigated if found to be causing impacts to safety and levels of traffic stress (LTS)17 for school children traveling to/from school.
C. Temporary rerouting of traffic for Project construction could result in permanent impacts to the safety of bicycle and pedestrian users.
Caltrans’ Deputy Directive 64-R218 requires full consideration of non-motorized travelers including pedestrians, bicyclists, and persons with disabilities in all programming, planning, maintenance, construction, operations, and project development activities and products. The failure to discuss the impact on non-motorized travelers in the ND is discouraging and does not give local agencies nor the public the confidence that Caltrans will follow their own policies for this Project. Caltrans’ TMPG states that there should be an analysis of the existing traffic volume and user mix, such as pedestrians, bicyclists, trucks, and buses in the corridor both on the freeway and surface streets19. This will provide the basis for establishing the goal of the TMP and in determining the capability of the surrounding surface streets to handle the additional vehicular demand and the impact on bicycle and pedestrian traffic. Construction detours and long-term construction duration windows must consider bicycle and pedestrian users. Improvements on streets and intersections for the roadway or alternate routes may be necessary to provide increased safety and provide better levels of stress due to the traffic being diverted around the work zone or within the adjacent corridors. For example, it is anticipated that the intersection at Powell and Christie will be impacted by traffic detoured due to the construction of the Project. In 2016, there was a pedestrian fatality at this intersection, and another bicyclist injury at the I-80 off ramp near this intersection. Within the City, the combination of very high traffic volumes and increasing pedestrian and bicycle traffic raise concerns about safety for pedestrians and bicyclists. Taking a
17 Available at: https://www.cityofberkeley.info/uploadedFiles/Public_Works/Level_3_-_Transportation/Berkeley-Bicycle-Plan-2017_AppendixC_Level%20of%20Traffic%20Stress.pdf. Last accessed on 4/17/19 18 Available at: http://www.dot.ca.gov/hq/tpp/offices/ocp/docs/dd_64_r2.pdf. Last accessed on 3/28/19. 19 Available at: http://www.dot.ca.gov/trafficops/tm/docs/TMP_Guidelines.pdf. Last accessed on 3/19/19.

City of Emeryville Comments on MacArthur Maze Vertical Clearance Project IS Page 9 of 14 proactive stance, the City decided to intensify analysis and planning for pedestrian and bicycle safety. As part of this effort, the City partnered with the UC Berkeley Safe Transportation and Education Center (SafeTREC) to conduct an in-depth review of pedestrian and bicycle safety issues at six key intersections in the heart of Emeryville. The 2018/2019 study includes field observations, community input, SafeTREC corridor recommendations and professional traffic engineering review. The study area includes the pedestrian/bicycle experiences at and between six intersections within or near the Powell Street Corridor in Emeryville:
• Powell Street and Frontage Road
• Powell Street and I-80
• Powell Street and Christie Avenue
• Christie Avenue and Shellmound Way
• Christie Avenue and Shellmound Street
• Powell Street and Hollis Street The TMP stakeholder/workgroup team meetings need to include discussions on the 2018/2019 SafeTREC study, and how elements recommended in that study could be incorporated as part of this project. The vehicles on the Powell Street corridor being detoured through official means or GPS navigation routing should be measured and mitigated if found to be exceeding thresholds, or if causing impacts to safety and levels of stress for bicycle and pedestrian users. Additionally, Emeryville has a robust bicycle network that includes the use of bicycle boulevards. The bicycle boulevards in Emeryville have volume and speed thresholds that are maintained by the use of traffic calming elements installed on the street.20 The diverted traffic on corridors on bicycle boulevards should be measured and mitigated if found to be exceeding thresholds, or if causing impacts to safety and levels of stress.
D. The construction of the Project has the potential to significantly reduce access to the Emeryville Police Department and Fire Station No. 34.
The Project will likely involve full facility closures and/or lane closures on major emergency routes. Consideration must be given to the impact on emergency services and the project must provide adequate alternatives for emergency vehicles. Additionally, any full or partial closures must consider emergency services access and parking in or through the construction zone.
20 Available at: https://www.ci.emeryville.ca.us/923/Pedestrian-Bicycle-Plan. Last accessed on 3/28/19.

City of Emeryville Comments on MacArthur Maze Vertical Clearance Project IS Page 10 of 14 The ND cannot simply refer to the TMP to handle the impacts to emergency services. Per Caltrans’ TMPG21, local fire, law enforcement, and emergency services agencies shall be identified and made part of the TMP workgroup team. Identification of local emergency service facilities should be identified in the ND, and the baseline emergency response times should be discussed. This is especially significant for Emeryville. The Emeryville Police Station and Fire Station No. 34, both located on Powell on the peninsula, are west of I-80/580 on Powell Street. Any detours need to consider the impacts of construction traffic on Powell Street and the effect on emergency response times for police and fire to incidents east of I-80/580 within Emeryville, as well incidents on Caltrans’ own highways.
E. The ND failed to analyze the cumulative impacts from Caltrans’ other projects along the I-80 Corridor.
The ND is inadequate due to the implicit assumption that this Project is Caltrans’ only project in the area. Due to the Project’s location and the high potential for major regional traffic impacts, the City recommends extra focus on the “Concurrent corridor (including conflicting) construction projects in the area” section from Table 1.0 of the TMPG document. This would include the analysis and discussion of each of the 11 planned projects presented by Caltrans at a Project Stakeholder meeting on February 6th, 2019.22 Many of the projects’ construction windows overlap, and traffic delays of concurrent/overlapping project areas could have significant adverse impacts to businesses and residents. While this Project alone will create a “temporary condition”, the local community may be slated for a constant state of “temporary condition.” The impacted communities and local agencies must know the baseline TMP strategies for the various Project alternatives. The baseline strategies may include, but are not limited to, planned detour routing, night/weekend work schedules, pedestrian/bicycle access improvements, incentive/disincentive clauses, coordination efforts with the adjacent construction projects, signal timing/coordination improvements for alternate routes, and street/intersection improvements for alternate routes. The combined comments from the community, local agencies, and other key stakeholders will help refine the TMP as the project goes into the Preliminary Engineering phase. Per Caltrans’s own policies and procedures, as noted above, the TMP should not start in the Preliminary Engineering phase as it is indicated in the ND. The City requests Caltrans to explain why the TMP was not initiated during the Project Initiation Document (PID) phase. “It is extremely important to identify the proper scope and cost of the TMP activities in the PID, as significant post-PID approval changes will be difficult to obtain.”23 A TMP during the PID phase allows for further TMP refinement during the PA&ED process, and stakeholders can begin to be brought in to help handle the planning, implementation, monitoring, and evaluation details of specific elements. Finally, the City requests that this TMP be officially classified as a “Major TMP”. This Project is multijurisdictional in scope,
21 Available at: http://www.dot.ca.gov/trafficops/tm/docs/TMP_Guidelines.pdf. Last accessed on 3/19/19. 22 I-80 Corridor Projects Overview Map (Attachment B). 23 Available at: http://www.dot.ca.gov/trafficops/tm/docs/TMP_Guidelines.pdf. Last accessed on 3/19/19.

City of Emeryville Comments on MacArthur Maze Vertical Clearance Project IS Page 11 of 14 multifaceted in corridor impacts and project delivery methods, and could potentially be in place over an extended time. The I-80 Corridor has long been identified as one of the most congested corridors in the Bay Area and has been the recipient of large state/federal/regional funds to improve traffic flow. “The I-80 SMART Corridor Project took a “smart” approach to the management of one of the busiest interstates in the Bay Area and used technology and active management strategies to improve traffic flow along the I-80 corridor from the Carquinez Bridge to the Bay Bridge within Alameda and Contra Costa Counties, without requiring the construction of new roads or the widening of existing ones. Through the coordination of several project components, the corridor is managed as one integrated system. Safer, more efficient and reliable traffic flow along I-80 is essential to the current and future vitality of the Bay Area. I-80 carries as many as 270,000 vehicles a day and has approximately 25 accidents per week. On westbound I-80 between Richmond and Emeryville, the accident rate is twice as high as the statewide average for similar highways (such as I-405 in Southern California). Motorists experience as much as 25-35 minutes of delay during typical commute hours. Currently, when a traffic incident occurs, motorists traveling at high speeds may not stop in time for the sudden slowdown or may be forced to change lanes abruptly, resulting in secondary accidents that worsen congestion. Emergency vehicle access is impacted, resulting in slower incident response and recovery times.”24 The ND does not adequately explain the Project’s relation to the I-80 SMART Corridor Project and its direct impact to the usage of the elements implemented with it. The I-80 SMART Corridor Project was not intended to bring relief or even help minimize the impacts of major construction detours that are likely from the Project’s TMP. As indicated in the project documents of the I-80 SMART Corridor Project, “some motorists may choose to exit onto San Pablo Avenue to avoid the traffic jam, but the traffic signals on San Pablo Avenue and other arterials are not currently equipped to handle the resulting increase in traffic. Gridlock occurs, impacting bus operations and traffic flow on these streets. Without knowledge of the accident location, diverted motorists stay on city streets, and traffic jams persist. Even if motorists don’t detour, they don’t know how long it will take them to reach their destination due to inconsistent and unreliable travel times.”25 The I-80 SMART Corridor Project documents and traffic studies showed that many local arterial intersections in the direct vicinity of the Project are already in an “oversaturated” condition.26 These intersections were re-timed and coordinated to be used by the I-80 SMART Corridor Project for incident management and traffic routing, but they still remain in an oversaturated condition. The ND needs to address the impacts of TMP detours at these crucial intersections.
24 Available at: http://www.dot.ca.gov/80smartcorridor/faqs.html. Last accessed on 3/21/19. 25 Available at: http://www.dot.ca.gov/80smartcorridor/faqs.html. Last accessed on 3/21/19. 26 I-80 ICM Signal Re-timing – Final Existing Conditions Memorandum (Attachment C).

City of Emeryville Comments on MacArthur Maze Vertical Clearance Project IS Page 12 of 14
F. The ND failed to analyze the cumulative impacts from other development in the vicinity of the Project area.
The ND also fails to analyze the cumulative impacts of the Project as it relates to nearby development. There are several approved developments in the City, which are expected to be completed before the Project’s construction begins. The nearest development, at 1500 feet (0.3mile) north of the Maze, is the Sherwin-Williams mixed used project at 1450 Sherwin Avenue at Horton Street, which will include 500 dwelling units and 6,000 square feet of commercial uses. The Intersection mixed use project is 4,000 feet (.75 mile) from the Maze at 3800 San Pablo Avenue at 39th Street and will include 105 dwelling units and 18,000 square feet of commercial space. The Marketplace redevelopment, within a mile of the Maze at 5900-6285 Shellmound Street at 65th Street, will include 456 dwelling units and 44,000 square feet of commercial space. The Nady site residential project, 1.36 mile from the Maze at 6701 Shellmound Street at 67th Street, will include 186 apartments. Approved development projects are listed in the City of Emeryville 2018 General Plan Annual Progress Report.27
IV. The Project does not include any features or mitigation measures to address potential impacts on Cultural Resources.
As stated in the Emeryville General Plan EIR, “according to the NWIC at Somona State University, there is a high possibility of uncovering and identifying additional archaeological deposits almost anywhere in the entire city. … In general, projects in the vicinity of …alluvial flats … have the greatest possibility of encountering a prehistoric archaeological resource.”28 Given the fact that it is on an alluvial flat, there is potential that a prehistoric archaeological resource exists under the Project’s site area. However, the Environmental Consequences section of the Cultural Resources discussion on (ND, p. 33) fails to analyze whether the seismic soil treatments could affect any subsurface cultural materials that exist below the site. Furthermore, the ND states: “If previously unidentified cultural materials are unearthed during construction, work shall be halted in that area until a Caltrans qualified archaeologist can assess the significance of the find.” (ND, p. 33.) This provision of the Monitoring and Post-Review Discovery Plan stops short of mitigation, and there are no Project features that would ensure that archaeological resources and sites will be protected from damage.
V. The ND does not adequately address noise impacts on sensitive receptors. “Figure 2-6 shows the residential study areas where the noise analysis was conducted” (ND, p. 42). The residential study areas neglected to study the residential units in Southwest Emeryville. Specifically, no measurements were taken in the neighborhoods
27 Available at: http://www.emeryville.org/DocumentCenter/View/11314/Item-71---General-Plan-Annual-Progress-Report. Last accessed on 3/21/19. 28 Emeryville General Plan, adopted October 2009, https://www.ci.emeryville.ca.us/385/General-Plan-and-Supporting-Documents.

City of Emeryville Comments on MacArthur Maze Vertical Clearance Project IS Page 13 of 14 north of 40th Street and west of Horton Street (an area which also includes a soon to be built Lennar Development site described above). Additionally, the Extended Stay America Hotel located near the intersections of Mandela Parkway and Horton Street was not included in the analysis. Caltrans should analyze the Project’s noise impacts on these sensitive receptors.
VI. Notice Requested As a reminder, the City requests mailed notice of any and all hearings and/or actions related to the Project. These requests are made pursuant to Public Resources Code section 21092.2, 21080.4, 21083.9, 21092, 21108, 21161, and Government Code section 65092, which requires lead agencies and state agencies to mail such notices to any person who has filed a written request for them with the director of the agency. Please send the above-requested notices by U.S. mail and email to: Christine Daniel City Manager City of Emeryville 1333 Park Avenue Emeryville, CA 94608 [email protected]
VII. Conclusion The proposed ND erroneously concludes that there is no impact from the MacArthur Maze Vertical Clearance Project. Unfortunately, the ND lacks an adequate description of the baseline environmental setting, and any analysis of the impacts from detours and re-routing. Without that minimal information, there simply cannot be adequate analysis of the Project’s impacts. The City of Emeryville respectfully requests that Caltrans withdraw the proposed ND, adequately analyze the issues and impacts raised in this letter, including disclosing any written documents that it relies upon in such analysis, and partner with the affected local agencies in the delivery of this major project as anticipated by Caltrans longtime policies and procedures. We look forward to receiving Caltrans’ response to this comment letter and to continuing to work with the agency on this and many other projects in and around Emeryville. Very Truly Yours,
Christine S. Daniel City Manager

City of Emeryville Comments on MacArthur Maze Vertical Clearance Project IS Page 14 of 14 ATTACHMENTS: A. Emery Go-Round Yard Location Map B. I-80 Corridor Projects Overview Map C. I-80 ICM Timing Review Final Existing Conditions Memorandum cc: via email only Emeryville Mayor Ally Medina, Vice Mayor Christian Patz and City Council Members John
Bauters, Scott Donahue and Dianne Martinez Emeryville City Attorney Michael Guina Emeryville Transportation Management Association Director Roni Hatrup Emeryville Unified School District Superintendent Dr. Quiauna Scott Bay Area Rapid Transit District General Manager Grace Crunican Alameda-Contra Costa County Transit General Manager Michael Hursh City of Oakland Mayor Libby Schaff, City Administrator Sabrina Landreth and Director of
Department of Transportation Ryan Russo City of Berkeley Mayor Jesse Arreguin, City Manager Dee Williams-Ridley and Public
Works Director Phil Harrington Alameda County Transportation Commission Executive Director Arthur Dao Metropolitan Transportation Commission Executive Director Therese McMillian Bay Area Air Quality Management District Executive Gregory Nudd West Oakland Environmental Indicators Project Co-Director Margaret Gordon Bike East Bay Advocacy Director Dave Campbell California Air Resource Board Executive Officer Richard Corey Alameda County Fire Department Chief David Rocha

Emeryville Transportation Management Association – Mandela Shuttle Vehicle Yard Project
Location of Emery Go-Round Yard Approved for Occupancy in April of 2020
ATTACHMENT A

ATTACHMENT B

I-80 ICM Signal Re-timing 1
Final Existing Conditions Memorandum
MEMORANDUM
To: Aleida Andrino-Chavez, City of Albany
Hamid Mostowfi, City of Berkeley
Melissa Tigbao, City of El Cerrito
Maurice Kaufman, City of Emeryville
Mike Roberts, City of Hercules
Si Lau, City of Oakland
Tamara Miller, City of Pinole
Steven Tam, City of Richmond
Barbara Hawkins, City of San Pablo
David Man, Caltrans
Mark de la O, Contra Costa County
From: Robert Paderna and Brian Sowers, Kimley-Horn
Cc: Kanda Raj, Alameda CTC
Hisham Noeimi, CCTA
Date: April 4, 2017
RE: I-80 ICM Signal Re-timing – Final Existing Conditions Memorandum
Introduction and Project Area
The I-80 Integrated Corridor Mobility (ICM) program consists of multiple traffic operations
systems and strategies, working collectively, to manage traffic congestion along the I-80 corridor.
A key component of the I-80 ICM strategies is the management of traffic to and from I-80 during
incidents on the freeway, which consists of deployment of special signal timing plans along
crossing arterials to handle additional diverting traffic from the freeway. Incident management
signal timing plans are developed based upon the existing signal coordination plans that operate
under typical daily traffic conditions. This project also includes a signal timing study for 166 traffic
signals along San Pablo Avenue and crossing arterial roadways to update peak period signal
coordination plans.
The project limits and intersections for each corridor are as follows:
• San Pablo Avenue (92 signals): from Pomona Street/I-80 WB Ramps to MLK Jr./Castro
Street
• Parker Avenue (4 signals): from 2nd Street to 7th Street
• Willow Avenue (3 signals) from Hawthorne Drive to I-80 EB Ramps
• Pinole Valley Road (6 signals): from Ellerhorst Street to Estates Avenue
• Appian Way (4 signals): from Mann Drive to I-80 EB Ramps
• Richmond Parkway (5 signals): from Lakeside Drive to I-80 EB Ramps
• Hilltop Drive (7 signals): from Research Drive to I-80 EB Ramps
• El Portal Drive (6 signals): from Road 20 to I-80 EB Ramps
ATTACHMENT C

I-80 ICM Signal Re-timing 2
Final Existing Conditions Memorandum
• San Pablo Dam Road (3 signals): from Contra Costa Avenue to I-80 EB Ramps
• McBryde Avenue (2 signals): from I-80 WB Ramps to Amador Street
• Barrett Avenue (1 signal): at I-80 WB Ramps
• Cutting Boulevard (2 signals): from I-80 HOV Ramp to I-80 WB Ramps
• Potrero Avenue (1 signal): at I-80 Ramps/Eastshore Street
• Carlson Boulevard (2 signals): from I-80 EB Ramps to I-80 WB Ramps
• Central Avenue (4 signals): from Carlson Boulevard to I-80 WB Ramps
• Buchanan Street (4 signals): from Jackson Street to I-80 WB Ramps
• Gilman Street (3 signals): from 9th Street to 6th Street
• University Avenue (2 signals): from 9th Street to 6th Street
• Ashby Avenue (2 signals): from 9th Street to 7th Street
• Powell Street (6 signals): from Beaudry Street to Frontage Road/I-80 WB Ramps
• West Grand Avenue (7 signals): from Brush Street to Maritime Street
Figure 1 illustrate the project area, with each intersection labelled by agency.
The San Pablo Avenue corridor spans ten jurisdictions and extends from Castro Street/MLK Jr.
Way in the City of Oakland to Willow Avenue, just north of Highway 4, in Contra Costa County.
Traveling north, the corridor crosses the Cities of Oakland, Emeryville, Berkeley, Albany, El Cerrito,
Richmond, San Pablo, Contra Costa County, and the Cities of Pinole and Hercules. San Pablo
Avenue, State Route 123 from Cutting Avenue in El Cerrito to Highway 580 in Oakland, is a major
north/south arterial, consisting of four to six (4-6) lanes. San Pablo Avenue serves as a regional
route as well as a significant local arterial. The corridor provides access to major arterials and
regional freeways including Highways 80, 580, 980, 24, and 4 with AC Transit and WestCAT services
operating along this major multi-modal corridor. The surrounding land uses are varied along the
corridor and include residential, commercial, and schools.
The northern section of San Pablo Avenue, between Merchant Street/I-80 Westbound Ramps in
Contra Costa County and Richmond Parkway in the City of Richmond, is a four (4) lane arterial
roadway with an average daily traffic (ADT) ranging from 12,400 to 19,950 vehicles per day. The
roadway runs east-west between Richmond Parkway and Sycamore Avenue and the remainder of
this section of the corridor runs north-south with low pedestrian and bike activity present
throughout the day. This section of San Pablo Avenue provides connectivity to Route 4 and the
surrounding land uses include commercial and retail throughout the entire length and residential
housing at the northern end. The speed limit for the northern section ranges from 25 to 45 mph.
The speed limit is 45 mph north of Parker Street and south of the City of Pinole. Along Parker
Street the speed limit is 30 mph and in the downtown Pinole area the speed limit is 25 mph. The
remaining stretches of the northern section have 40-mph speed limits. The main direction of
travel on the northern section of San Pablo Avenue is southbound in the AM peak period,
ATTACHMENT C

80
880
580
980
80
80
80
24
13
Sa
n Pablo Ave
Merchan
t St
Refinery Rd
2nd St
Parker Ave
San P
ablo
Ave
4th St
Post Office Ped
John Muir PkwySycamore Ave Transit Center
John StPinole Valley Rd
Fernandez Ave
Tennent Ave
Del Monte Dr
Tara Hills Dr Belmont W
ayShamrock Dr
Crestwood Dr
Kay Rd
Pinole Shores Dr
Oak Ridge RdAppi
an W
ay
Sunn
yvie
w D
r
Hercules Ave
7th St
Hawtho
rne D
r
Cummings Skyway
Willow Ave
R obert M
iller D
r
Rivers St
Rumrill Blvd
23rd
St
Van
Ness
St
Chur
ch Ln
Everg
reen T
errac
eVa
le Rd
Broadway St
El Portal DrLaurie LnRd 20
San Pa
blo Dam
Rd
Food Max
McBryde AveEsmond Ave
Garvin Ave
Solano Ave
Clinton Ave
Sierra Ave Ped
Conlon Ave
Knott Ave
Hill St
Potrero Ave
Manila Ave
Schmidt Ln
Moeser Ln
Stockton Ave
Central Ave
Fairmount Ave
Carlson Blvd
Brighton Ave
Washington Ave
Marin Ave
Monroe St
Delaware St
University Ave
Addison StAllston Way
Dwight Way
Alcatraz Ave63rd St
53rd St47th St45th St
36th St35th St
30th St27th St25th St
W Grand Ave
65th St
Solano Ave
EastShore Blvd
Rheem Ave
Roosevelt AveBarrett AveMacDonald Ave
Cutting Blvd
Bayview Ave
Clay St
Buchanon St
Gilman St
Cedar St
Grayson St
Heinz AveAshby Ave (SR13)
63rd St
Park Ave
40th St
Adel
ine
St
Maritim
e St
W Grand Ave
Cast
ro S
tM
arke
t St
Mar
tin L
uthe
r Kin
g Jr
Stanford Ave
Powell St
Rich
mon
d Pkwy
Hilltop Dr
LEGEND:Incident Response Route
AGENCIES:Contra Costa CountyHerculesPinoleRichmondSan PabloEl CerritoAlbanyBerkeleyOaklandEmeryvilleCaltrans
Figure 1: Project Area Map I-80 ICM ARTERIAL RETIMING
ATTACHMENT C

I-80 ICM Signal Re-timing 4
Final Existing Conditions Memorandum
balanced in the midday peak period and northbound in the PM peak period.
The central section of San Pablo Avenue, between Richmond Parkway in the City of Richmond and
Carlson Boulevard in the City of El Cerrito, runs north-south and is a four (4) lane arterial roadway.
South of Cutting Boulevard, San Pablo Avenue is classified as State Route 123. The primary
surrounding land uses along this section of the corridor include commercial, retail and restaurants.
Access to Interstate 80, via multiple side corridors, two BART stations, which are located near the
intersections of Cutting Boulevard and Fairmount Avenue in the City of El Cerrito, and many
residential neighborhoods are located along the central section of San Pablo Avenue. The speed
limit along this portion of San Pablo Avenue is 45 mph from Richmond Parkway to Hilltop Drive,
40 mph near Robert Miller Drive, 35 mph from Rivers Street to Rheem Avenue, and 30 mph for
the rest of the section. There is moderate pedestrian and bicycle activity throughout the day and
the ADT volumes range from 15,290 to 23,630 vehicles per day. The main direction of travel on
this section of San Pablo Avenue is southbound in the AM peak period, balanced in the midday
peak period and northbound in the PM peak period.
The southern section of San Pablo Avenue, between Carlson Boulevard in the City of El Cerrito
and Castro Street/MLK Jr. Way in the City of Oakland, is a four (4) lane arterial with an ADT ranging
between 16,110 and 28,370 vehicles per day. North of Adeline Street, San Pablo Avenue is
classified as State Route 123. The speed limit along the southern section of the corridor is 30
mph. The main land uses surrounding the corridor include residential, commercial, restaurants
and office buildings. Moderate to high pedestrian and bicycle activity is present throughout the
day, with very high pedestrian and bicycle activity near the intersection of University Avenue in
Berkeley. The peak direction of travel on this section of San Pablo Avenue is southbound in the
AM and balanced during the midday and PM peak periods.
The initial phase of the project included collecting and analyzing existing conditions information
and updating existing conditions traffic models. This memorandum summarizes the existing
conditions along the corridors and includes the following:
• Traffic data collection and reduction;
• Travel time survey information;
• Field observations; and
• Traffic model updates
Traffic Data Collection and Reduction
Data collection for this project included coordinating with the various Cities, Contra Costa County,
and Caltrans to obtain timing sheets and other references, collecting traffic volumes, conducting
field review, and performing travel time surveys along the project corridors.
ATTACHMENT C

I-80 ICM Signal Re-timing 5
Final Existing Conditions Memorandum
Weekday turning movement counts, including vehicular, pedestrian, and bicycle counts, were
collected in November 2016 at one hundred fifty-six (156) of the Project intersections. The turning
movement counts were collected during the following peak periods, with small variations by
corridor based on historic daily traffic data.
• AM Peak 7:00 am to 9:00 am
• Midday Peak 11:30 am to 1:30 pm
• PM Peak 3:30 pm to 6:00 pm
Copies of the turning movement counts will be provided to each agency separately.
To understand daily and weekday traffic volumes along the corridors, 24-hour tube counts were
collected at thirty (30) segments. The 24-hour tube counts were collected for seven (7)
consecutive days from Saturday, November 12, 2016 through Sunday, November 20, 2016.
It was observed that the volume along the project corridors fluctuates on a day-to-day basis
depending on I-80 operations. The Average Daily Traffic (ADT) volumes were calculated for each
location and are presented in Table 1. The ADT count sheets and summaries are provided in the
Appendix.
Table 1: 24-hour Average Daily Traffic Volumes Summary
Locations Period EB/NB
Average
WB/SB
Average Total
San Pablo Avenue (between John Muir Parkway
and Linus Pauling Drive)
Weekday (M-F) 5,805 6,598 12,403
Weekend (S-S) 3,730 4,325 8,055
San Pablo Avenue (between Sycamore Avenue
and Hercules Avenue)
Weekday (M-F) 10,260 9,030 19,290
Weekend (S-S) 6,320 5,225 11,545
San Pablo Avenue (between Appian Way and
Sunnyview Drive)
Weekday (M-F) 10,410 9,545 19,955
Weekend (S-S) 6,365 5,420 11,785
San Pablo Avenue (between Richmond Parkway
and Hilltop Drive)
Weekday (M-F) 7,900 8,105 16,005
Weekend (S-S) 5,670 5,965 11,635
San Pablo Avenue (between El Portal Drive and
Rumrill Boulevard)
Weekday (M-F) 7,340 7,950 15,290
Weekend (S-S) 6,775 6,960 13,735
San Pablo Avenue (between Church Lane and
Van Ness Street)
Weekday (M-F) 9,145 Missing Data*
Weekend (S-S) 7,955
San Pablo Avenue (between Garvin Avenue and
Esmond Avenue)
Weekday (M-F) 9,895 10,825 20,720
Weekend (S-S) 7,610 9,230 16,840
San Pablo Avenue (between Conlon Avenue and
Knott Avenue)
Weekday (M-F) 11,185 11,050 22,235
Weekend (S-S) 9,440 9,935 19,375
* Due to count tube displacement, some data was not available
ATTACHMENT C

I-80 ICM Signal Re-timing 6
Final Existing Conditions Memorandum
Table 1 (Continued): 24-hour Average Daily Traffic Volumes Summary
Locations Period EB/NB
Average
WB/SB
Average Total
Willow Avenue (between San Pablo Avenue
and Hawthorne Road)
Weekday (M-F) 6,490 7,530 14,020
Weekend (S-S) 4,755 5,705 10,460
Pinole Valley Road (between Ellerhorst Drive and
Henry Avenue)
Weekday (M-F) 6,825 6,770 13,595
Weekend (S-S) 5,225 4,885 10,110
Appian Way (between Mann Drive and
Tara Hills Drive)
Weekday (M-F) 8,630 8,230 16,860
Weekend (S-S) 6,615 6,470 13,085
Richmond Parkway (between Lakeside Drive and
Blume Drive)
Weekday (M-F) 16,875 19,175 36,050
Weekend (S-S) Missing Data* 15,330 Missing Data*
Hilltop Drive (between Robert Miller Drive
and Shane Drive)
Weekday (M-F) 10,155 8,490 18,645
Weekend (S-S) 7,230 6,510 13.740
El Portal Drive (between Church Lane and
Fordham Street)
Weekday (M-F) 13,495 10,430 23,925
Weekend (S-S) Missing Data* 9,440 Missing Data*
San Pablo Avenue (between Manila Avenue and
Portero Avenue)
Weekday (M-F) 10,360 9,955 20,135
Weekend (S-S) 8,280 7,550 15,830
San Pablo Avenue (between Central Avenue and
Fairmont Avenue)
Weekday (M-F) 12,285 11,345 23,630
Weekend (S-S) 10,475 9,730 20,205
San Pablo Avenue (between Gilman Street and
Monroe Street)
Weekday (M-F) 11,780 13,870 25,650
Weekend (S-S) 9,305 12,265 21,570
San Pablo Avenue (between University Avenue
and Delaware Street)
Weekday (M-F) 11,080 11,730 22,810
Weekend (S-S) 9,495 10,505 20,000
San Pablo Avenue (between Ashby Avenue and
Grayson Street)
Weekday (M-F) 11,785 12,005 23,790
Weekend (S-S) 9,440 10,505 19,945
San Pablo Avenue (between Stanford Avenue and
63rd Street)
Weekday (M-F) 9,540 11,025 20,565
Weekend (S-S) 7,595 9,280 16,875
San Pablo Avenue (between 47th Avenue and
53rd Street)
Weekday (M-F) 11,700 12,255 23,955
Weekend (S-S) 8,825 9,985 18,810
San Pablo Avenue (between Market Street and
27th Street)
Weekday (M-F) 7,680 8,430 16,110
Weekend (S-S) 6,195 6,845 13,040
San Pablo Avenue (between I-80 EB Ramps and
Jackson Street)
Weekday (M-F) 14,035 14,335 28,370
Weekend (S-S) 14,155 12,890 27,045
* Due to count tube displacement, some data was not available
ATTACHMENT C

I-80 ICM Signal Re-timing 7
Final Existing Conditions Memorandum
Table 1 (Continued): 24-hour Average Daily Traffic Volumes Summary
Locations Period EB/NB
Average
WB/SB
Average Total
San Pablo Avenue (between I-80 EB Ramps and
Jackson Street)
Weekday (M-F) 14,035 14,335 28,370
Weekend (S-S) 14,155 12,890 27,045
Central Avenue (between Carlson Boulevard
and San Luis Street/Pierce St)
Weekday (M-F) 9,805 11,370 21,175
Weekend (S-S) 8,790 11,000 19,790
Cutting Boulevard (between San Pablo Avenue
and I-80 WB On-Ramp)
Weekday (M-F) 13,500 12,435 25,935
Weekend (S-S) 9,590 9,740 19,330
Gillman Street (between 6th Street and
8th Street)
Weekday (M-F) 8,165 8,655 16,820
Weekend (S-S) 7,605 7,885 15,490
University Avenue (between 6th Street and
9th Street)
Weekday (M-F) 15,380 16,280 31,660
Weekend (S-S) 14,880 15,745 30,625
Powell Street (between I-80 EB Ramps and
Christie Avenue)
Weekday (M-F) 21,955 20,985 42,940
Weekend (S-S) 20,965 19,160 40,125
West Grand Avenue (between Market Street and
Adeline Street)
Weekday (M-F) 8,575 11,310 19,885
Weekend (S-S) 5,820 8,985 14,805
West Grand Avenue (between Broadway and
Telegraph Avenue)
Weekday (M-F) 9,490 7,480 16,970
Weekend (S-S) 6,340 6,185 12,525
* Due to count tube displacement, some data was not available
Travel Time Surveys
"Before" implementation floating vehicle surveys were conducted along the project corridors to
measure the existing travel time and delays and to observe general traffic operations and
conditions. The travel time surveys were primarily conducted on Wednesday, November 30, 2016
and Thursday, December 1, 2016, with supplemental runs collected thereafter when necessary.
Travel time surveys were collected in both directions along the project corridors between the
following limits:
• Appian Way from Fitzgerald Drive to San Pablo Avenue
• Ashby Avenue from 7th Street to San Pablo Avenue
• Buchanan Street from I-80 WB Ramps to San Pablo Avenue
• Carlson Boulevard from I-80 WB Ramps to I-80 EB Ramps
• Central Avenue from I-80 WB Ramps to San Pablo Avenue
• Cutting Boulevard from I-80 WB Ramps to San Pablo Avenue
• Gilman Street from 6th Street to San Pablo Avenue
• Hilltop Drive from San Pablo Avenue to I-80 EB Ramps
ATTACHMENT C

I-80 ICM Signal Re-timing 8
Final Existing Conditions Memorandum
• Pinole Valley Road from Estates Avenue to San Pablo Avenue
• Potrero Avenue from San Pablo Avenue and Eastshore Boulevard
• Powell Street from Frontage Road to San Pablo Avenue
• Richmond Parkway from San Pablo Avenue to I-80 WB Ramps
• Fitzgerald Drive from I-80 HOV Ramps to Appian Way
• El Portal Drive from San Pablo Avenue to I-80 EB Ramps
• Willow Avenue from I-80 EB Ramps to San Pablo Avenue
• San Pablo Avenue/Willow Road (Segment 1) from 7th Street to Cummings Skyway
• San Pablo Avenue (Segment 2) from Tennent Avenue to Willow Avenue
• San Pablo Avenue (Segment 3) from Hilltop Drive to Tennent Avenue
• San Pablo Avenue (Segment 4) from Broadway Avenue/El Portal Drive to Hilltop Drive
• San Pablo Avenue (Segment 5) from Cutting Boulevard to Broadway Avenue/El Portal
Drive
• San Pablo Avenue (Segment 6) from Gilman Street to Cutting Boulevard
• San Pablo Avenue (Segment 7) from Stanford Avenue to Gilman Street
• San Pablo Avenue (Segment 8) from West Grand Avenue to Stanford Avenue
• San Pablo Dam Road from San Pablo Avenue to I-80 EB Ramps/Amador Street
• University Avenue from 6th Street to San Pablo Avenue
• West Grand Avenue from Wake Avenue to San Pablo Avenue
The results of the “Before” study for each of the project corridors are summarized in Tables 2
through 24. Detailed travel time summaries for the corridors are included in the Appendix.
Table 2: Appian Way “Before” Travel Time Summary
Time Period Direction
Average
Travel Time
(min:sec)
Average
Stop Delay
(min:sec)
Average
Stops
(#)
Average
Speed
(mph)
AM Peak Northbound 2:36 0:47 2.0 21.5
Westbound 3:50 1:56 3.5 14.6
Midday Peak Northbound 2:25 0:40 1.7 23.2
Westbound 3:07 1:11 2.4 18.0
PM Peak Northbound 2:56 1:05 2.5 19.1
Westbound 3:45 1:49 2.8 14.9
Note: Travel time survey conducted between Fitzgerald Drive and San Pablo Avenue
ATTACHMENT C

I-80 ICM Signal Re-timing 9
Final Existing Conditions Memorandum
Table 3: Ashby Avenue “Before” Travel Time Summary
Time Period Direction
Average
Travel Time
(min:sec)
Average
Stop Delay
(min:sec)
Average
Stops
(#)
Average
Speed
(mph)
AM Peak Eastbound 0:55 0:22 0.7 9.1
Westbound 1:40 1:07 1.0 5.0
Midday Peak Eastbound 0:52 0:18 0.8 9.7
Westbound 0:59 0:25 1.3 8.6
PM Peak Eastbound 1:02 0:25 0.9 8.1
Westbound 0:50 0:09 0.6 10.1
Note: Travel time survey conducted between 7th Street and San Pablo Avenue
Table 4: Buchanan Street “Before” Travel Time Summary
Time Period Direction
Average
Travel Time
(min:sec)
Average
Stop Delay
(min:sec)
Average
Stops
(#)
Average
Speed
(mph)
AM Peak Eastbound 2:55 1:25 2.3 14.0
Westbound 2:05 0:41 1.7 19.4
Midday Peak Eastbound 3:25 1:52 3.0 11.9
Westbound 2:05 0:40 1.3 19.5
PM Peak Eastbound 3:43 2:05 2.5 10.9
Westbound 2:33 1:01 2.0 15.9
Note: Travel time survey conducted between I-80 WB Ramp and San Pablo Avenue
Table 5: Carlson Boulevard “Before” Travel Time Summary
Time Period Direction
Average
Travel Time
(min:sec)
Average
Stop Delay
(min:sec)
Average
Stops
(#)
Average
Speed
(mph)
AM Peak Eastbound 0:08 0:00 0.0 27.1
Westbound 0:21 0:14 0.7 10.1
Midday Peak Eastbound 0:09 0:01 0.2 24.6
Westbound 0:16 0:09 0.5 13.3
PM Peak Eastbound 0:18 0:10 0.5 12.3
Westbound 0:08 0:00 0.0 27.1
Note: Travel time survey conducted between I-80 WB Ramp and I-80 EB Ramp
ATTACHMENT C
I-80 ICM Signal Re-timing 10
Final Existing Conditions Memorandum
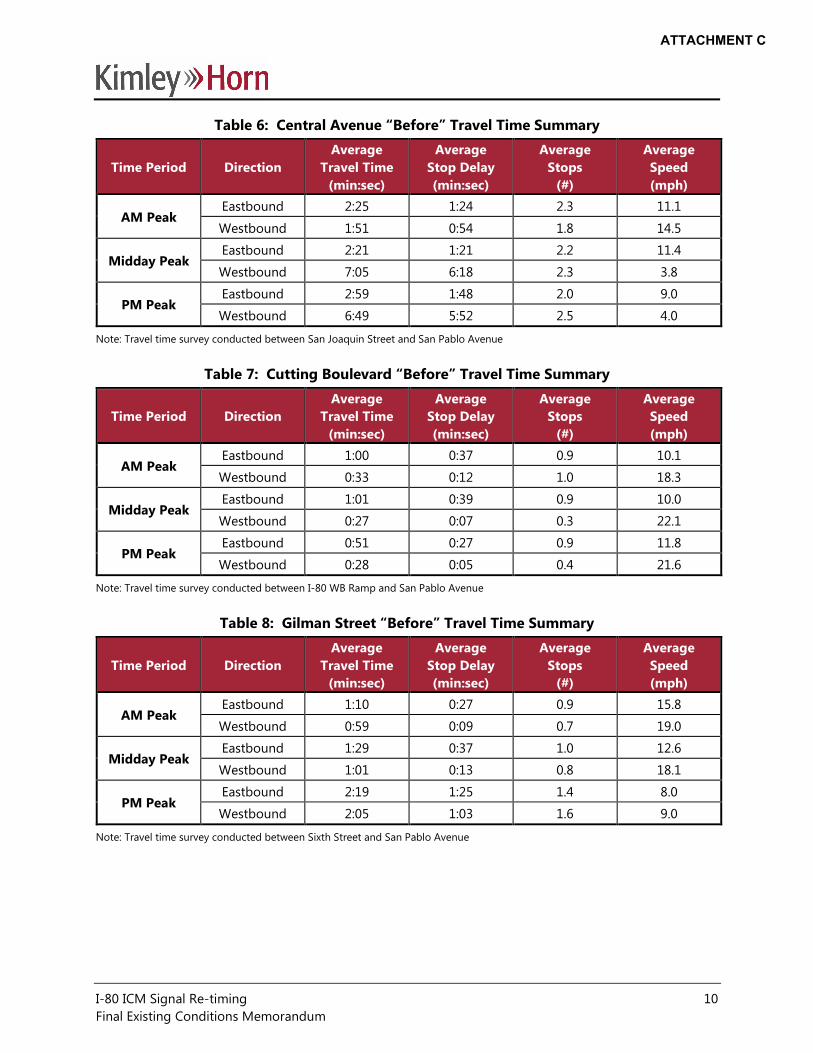
Table 6: Central Avenue “Before” Travel Time Summary
Time Period Direction
Average
Travel Time
(min:sec)
Average
Stop Delay
(min:sec)
Average
Stops
(#)
Average
Speed
(mph)
AM Peak Eastbound 2:25 1:24 2.3 11.1
Westbound 1:51 0:54 1.8 14.5
Midday Peak Eastbound 2:21 1:21 2.2 11.4
Westbound 7:05 6:18 2.3 3.8
PM Peak Eastbound 2:59 1:48 2.0 9.0
Westbound 6:49 5:52 2.5 4.0
Note: Travel time survey conducted between San Joaquin Street and San Pablo Avenue
Table 7: Cutting Boulevard “Before” Travel Time Summary
Time Period Direction
Average
Travel Time
(min:sec)
Average
Stop Delay
(min:sec)
Average
Stops
(#)
Average
Speed
(mph)
AM Peak Eastbound 1:00 0:37 0.9 10.1
Westbound 0:33 0:12 1.0 18.3
Midday Peak Eastbound 1:01 0:39 0.9 10.0
Westbound 0:27 0:07 0.3 22.1
PM Peak Eastbound 0:51 0:27 0.9 11.8
Westbound 0:28 0:05 0.4 21.6
Note: Travel time survey conducted between I-80 WB Ramp and San Pablo Avenue
Table 8: Gilman Street “Before” Travel Time Summary
Time Period Direction
Average
Travel Time
(min:sec)
Average
Stop Delay
(min:sec)
Average
Stops
(#)
Average
Speed
(mph)
AM Peak Eastbound 1:10 0:27 0.9 15.8
Westbound 0:59 0:09 0.7 19.0
Midday Peak Eastbound 1:29 0:37 1.0 12.6
Westbound 1:01 0:13 0.8 18.1
PM Peak Eastbound 2:19 1:25 1.4 8.0
Westbound 2:05 1:03 1.6 9.0
Note: Travel time survey conducted between Sixth Street and San Pablo Avenue
ATTACHMENT C

I-80 ICM Signal Re-timing 11
Final Existing Conditions Memorandum
Table 9: Hilltop Drive “Before” Travel Time Summary
Time Period Direction
Average
Travel Time
(min:sec)
Average
Stop Delay
(min:sec)
Average
Stops
(#)
Average
Speed
(mph)
AM Peak Eastbound 5:00 2:16 3.3 18.0
Westbound 3:58 1:21 2.8 22.7
Midday Peak Eastbound 4:32 1:54 3.1 19.9
Westbound 3:53 1:24 2.9 23.2
PM Peak Eastbound 4:17 1:36 3.2 21.0
Westbound 4:29 1:55 4.6 20.1
Note: Travel time survey conducted between San Pablo Avenue and I-80 EB Ramp
Table 10: Pinole Valley Road “Before” Travel Time Summary
Time Period Direction
Average
Travel Time
(min:sec)
Average
Stop Delay
(min:sec)
Average
Stops
(#)
Average
Speed
(mph)
AM Peak Eastbound 2:53 0:58 2.7 16.0
Westbound 2:46 0:49 1.8 16.8
PM Peak Eastbound 3:11 1:13 2.5 14.5
Westbound 3:18 1:18 3.3 14.0
Note: Travel time survey conducted between Estates Avenue and San Pablo Avenue
Table 11: Potrero Avenue “Before” Travel Time Summary
Time Period Direction
Average
Travel Time
(min:sec)
Average
Stop Delay
(min:sec)
Average
Stops
(#)
Average
Speed
(mph)
AM Peak Eastbound 0:55 0:38 0.7 8.1
Westbound 0:33 0:16 0.6 13.4
Midday Peak Eastbound 0:38 0:20 0.6 11.5
Westbound 0:35 0:19 0.7 12.6
PM Peak Eastbound 0:39 0:20 0.6 11.2
Westbound 0:44 0:25 0.7 10.1
Note: Travel time survey conducted between Eastshore Boulevard and San Pablo Avenue
ATTACHMENT C

I-80 ICM Signal Re-timing 12
Final Existing Conditions Memorandum
Table 12: Powell Street “Before” Travel Time Summary
Time Period Direction
Average
Travel Time
(min:sec)
Average
Stop Delay
(min:sec)
Average
Stops
(#)
Average
Speed
(mph)
AM Peak Eastbound 3:33 1:45 2.0 13.5
Westbound 3:02 1:12 2.0 15.8
Midday Peak Eastbound 3:33 1:44 2.7 13.5
Westbound 3:07 1:23 2.0 15.3
PM Peak Eastbound 5:24 3:36 2.8 8.9
Westbound 4:15 2:23 2.3 11.2
Note: Travel time survey conducted between Frontage Road and San Pablo Avenue
Table 13: Richmond Parkway “Before” Travel Time Summary
Time Period Direction
Average
Travel Time
(min:sec)
Average
Stop Delay
(min:sec)
Average
Stops
(#)
Average
Speed
(mph)
AM Peak Eastbound 5:15 1:31 3.4 22.8
Westbound 5:47 2:07 3.5 20.7
Midday Peak Eastbound 5:50 2:00 4.4 20.5
Westbound 5:13 1:41 3.6 23.0
PM Peak Eastbound 9:37 5:30 4.7 12.5
Westbound 5:54 2:18 4.0 20.3
Note: Travel time survey conducted between San Pablo Avenue and Appian Way
Table 14: San Pablo Avenue/Willow Road (Segment 1) “Before” Travel Time Summary
Time Period Direction
Average
Travel Time
(min:sec)
Average
Stop Delay
(min:sec)
Average
Stops
(#)
Average
Speed
(mph)
AM Peak Northbound 6:11 0:44 3.4 30.1
Southbound 6:15 0:41 2.8 29.8
Midday Peak Northbound 5:43 0:26 2.0 32.5
Southbound 5:58 0:31 2.6 31.2
PM Peak Northbound 5:59 0:32 2.3 31.1
Southbound 6:08 0:39 3.0 30.3
Note: Travel time survey conducted between Willow Road/San Pablo
ATTACHMENT C

I-80 ICM Signal Re-timing 13
Final Existing Conditions Memorandum
Table 15: San Pablo Avenue (Segment 2) “Before” Travel Time Summary
Time Period Direction
Average
Travel Time
(min:sec)
Average
Stop Delay
(min:sec)
Average
Stops
(#)
Average
Speed
(mph)
AM Peak Eastbound 5:08 1:12 3.9 25.8
Westbound 5:04 1:01 3.3 26.2
Midday Peak Eastbound 5:12 1:14 4.0 25.5
Westbound 4:35 0:46 2.9 28.9
PM Peak Eastbound 6:41 2:35 3.7 19.8
Westbound 5:31 1:29 3.0 24.0
Note: Travel time survey conducted between Tennent Avenue and Willow Avenue
Table 16: San Pablo Avenue (Segment 3) “Before” Travel Time Summary
Time Period Direction
Average
Travel Time
(min:sec)
Average
Stop Delay
(min:sec)
Average
Stops
(#)
Average
Speed
(mph)
AM Peak Northbound 6:50 1:30 4.2 26.8
Southbound 7:14 1:47 3.8 25.3
Midday Peak Northbound 6:40 1:21 2.8 27.5
Southbound 6:56 1:23 4.2 26.5
PM Peak Northbound 9:53 4:24 4.2 18.6
Southbound 7:54 2:05 4.8 23.2
Note: Travel time survey conducted between Hilltop Drive and Tennent Avenue
Table 17: San Pablo Avenue (Segment 4) “Before” Travel Time Summary
Time Period Direction
Average
Travel Time
(min:sec)
Average
Stop Delay
(min:sec)
Average
Stops
(#)
Average
Speed
(mph)
AM Peak Northbound 3:36 1:12 2.4 23.1
Southbound 3:14 0:53 1.7 25.6
Midday Peak Northbound 3:18 0:53 2.1 25.1
Southbound 2:57 0:41 1.2 28.1
PM Peak Northbound 3:42 1:11 2.5 22.4
Southbound 3:10 0:49 1.5 26.3
Note: Travel time survey conducted between Broadway Avenue/El Portal Drive and Hilltop Drive
ATTACHMENT C

I-80 ICM Signal Re-timing 14
Final Existing Conditions Memorandum
Table 18: San Pablo Avenue (Segment 5) “Before” Travel Time Summary
Time Period Direction
Average
Travel Time
(min:sec)
Average
Stop Delay
(min:sec)
Average
Stops
(#)
Average
Speed
(mph)
AM Peak Northbound 11:04 3:45 8.8 18.1
Southbound 15:53 8:13 10.3 12.7
Midday Peak Northbound 11:21 3:54 8.5 17.7
Southbound 13:09 5:40 10.8 15.3
PM Peak Northbound 17:26 9:16 12.8 11.5
Southbound 13:13 5:15 10.5 15.2
Note: Travel time survey conducted between Cutting Boulevard and Broadway/El Portal Drive
Table 19: San Pablo Avenue (Segment 6) “Before” Travel Time Summary
Time Period Direction
Average
Travel Time
(min:sec)
Average
Stop Delay
(min:sec)
Average
Stops
(#)
Average
Speed
(mph)
AM Peak Northbound 10:45 3:28 5.8 18.8
Southbound 13:44 5:49 8.7 14.7
Midday Peak Northbound 11:20 4:10 5.8 17.8
Southbound 11:31 4:03 6.5 17.5
PM Peak Northbound 18:16 9:55 9.2 11.0
Southbound 13:55 5:58 7.7 14.5
Note: Travel time survey conducted between Gilman Street and Cutting Boulevard
Table 20: San Pablo Avenue (Segment 7) “Before” Travel Time Summary
Time Period Direction
Average
Travel Time
(min:sec)
Average
Stop Delay
(min:sec)
Average
Stops
(#)
Average
Speed
(mph)
AM Peak Northbound 10:23 3:37 6.8 16.3
Southbound 10:52 4:07 6.7 15.6
Midday Peak Northbound 09:58 3:16 6.8 17.0
Southbound 11:07 4:30 6.3 15.2
PM Peak Northbound 19:16 11:46 10.0 8.8
Southbound 11:12 4:05 6.7 15.1
Note: Travel time survey conducted between Stanford Avenue and Gilman Street
ATTACHMENT C

I-80 ICM Signal Re-timing 15
Final Existing Conditions Memorandum
Table 21: San Pablo Avenue (Segment 8) “Before” Travel Time Summary
Time Period Direction
Average
Travel Time
(min:sec)
Average
Stop Delay
(min:sec)
Average
Stops
(#)
Average
Speed
(mph)
AM Peak Northbound 6:21 1:36 3.0 18.9
Southbound 6:48 1:56 3.8 17.7
Midday Peak Northbound 6:55 2:08 4.0 17.4
Southbound 7:31 2:17 4.5 16.0
PM Peak Northbound 9:23 3:24 4.5 12.8
Southbound 9:12 3:29 4.7 13.1
Note: Travel time survey conducted between West Grand Avenue and Stanford Avenue
Table 22: San Pablo Dam Road “Before” Travel Time Summary
Time Period Direction
Average
Travel Time
(min:sec)
Average
Stop Delay
(min:sec)
Average
Stops
(#)
Average
Speed
(mph)
AM Peak Eastbound 2:28 1:45 1.5 8.0
Westbound 1:23 0:35 1.4 14.1
Midday Peak Eastbound 2:28 1:40 1.8 8.0
Westbound 1:47 0:59 1.7 11.0
PM Peak Eastbound 3:13 2:24 2.0 6.1
Westbound 1:46 0:56 1.4 11.2
Note: Travel time survey conducted between San Pablo Avenue and Amador Street/I-80 EB Ramp
Table 23: University Avenue “Before” Travel Time Summary
Time Period Direction
Average
Travel Time
(min:sec)
Average
Stop Delay
(min:sec)
Average
Stops
(#)
Average
Speed
(mph)
AM Peak Eastbound 1:03 0:21 1.1 17.9
Westbound 1:16 0:31 1.1 14.7
Midday Peak Eastbound 1:41 0:52 1.1 11.2
Westbound 0:59 0:12 0.5 18.8
PM Peak Eastbound 1:59 1:01 1.1 9.5
Westbound 1:57 1:09 1.6 9.6
Note: Travel time survey conducted between 6th Street and San Pablo Street
ATTACHMENT C
I-80 ICM Signal Re-timing 16
Final Existing Conditions Memorandum
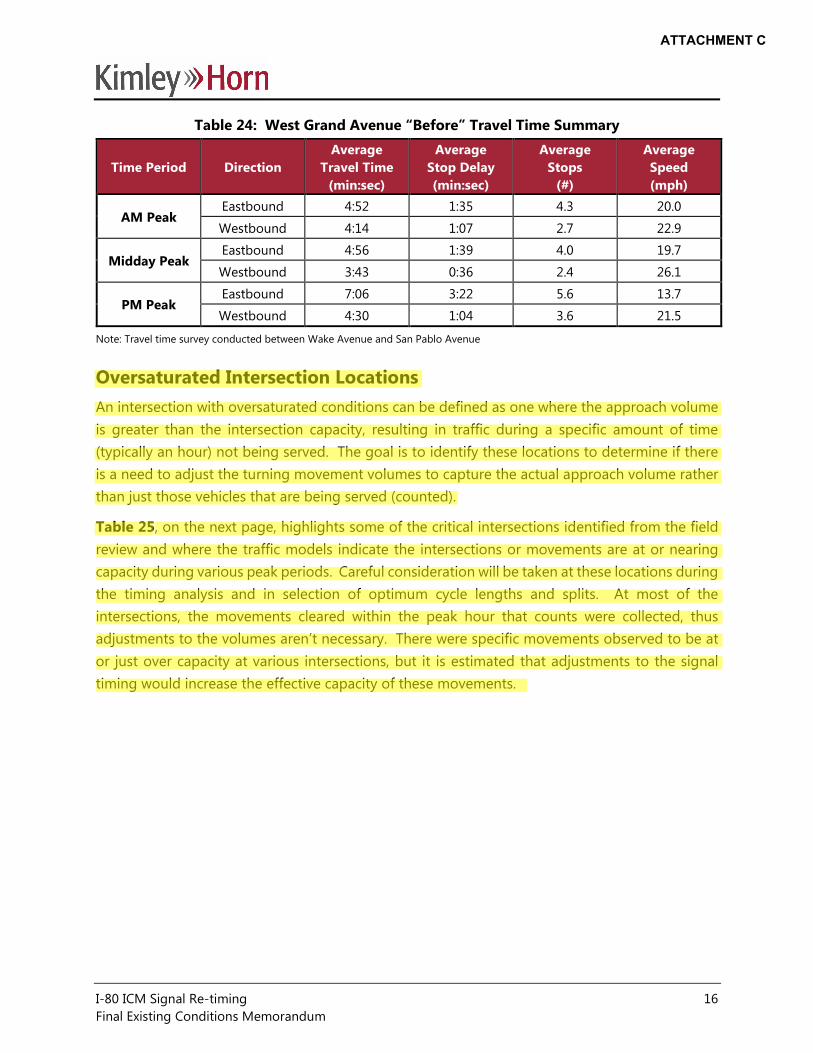
Table 24: West Grand Avenue “Before” Travel Time Summary
Time Period Direction
Average
Travel Time
(min:sec)
Average
Stop Delay
(min:sec)
Average
Stops
(#)
Average
Speed
(mph)
AM Peak Eastbound 4:52 1:35 4.3 20.0
Westbound 4:14 1:07 2.7 22.9
Midday Peak Eastbound 4:56 1:39 4.0 19.7
Westbound 3:43 0:36 2.4 26.1
PM Peak Eastbound 7:06 3:22 5.6 13.7
Westbound 4:30 1:04 3.6 21.5
Note: Travel time survey conducted between Wake Avenue and San Pablo Avenue
Oversaturated Intersection Locations
An intersection with oversaturated conditions can be defined as one where the approach volume
is greater than the intersection capacity, resulting in traffic during a specific amount of time
(typically an hour) not being served. The goal is to identify these locations to determine if there
is a need to adjust the turning movement volumes to capture the actual approach volume rather
than just those vehicles that are being served (counted).
Table 25, on the next page, highlights some of the critical intersections identified from the field
review and where the traffic models indicate the intersections or movements are at or nearing
capacity during various peak periods. Careful consideration will be taken at these locations during
the timing analysis and in selection of optimum cycle lengths and splits. At most of the
intersections, the movements cleared within the peak hour that counts were collected, thus
adjustments to the volumes aren’t necessary. There were specific movements observed to be at
or just over capacity at various intersections, but it is estimated that adjustments to the signal
timing would increase the effective capacity of these movements.
ATTACHMENT C
I-80 ICM Signal Re-timing 17
Final Existing Conditions Memorandum
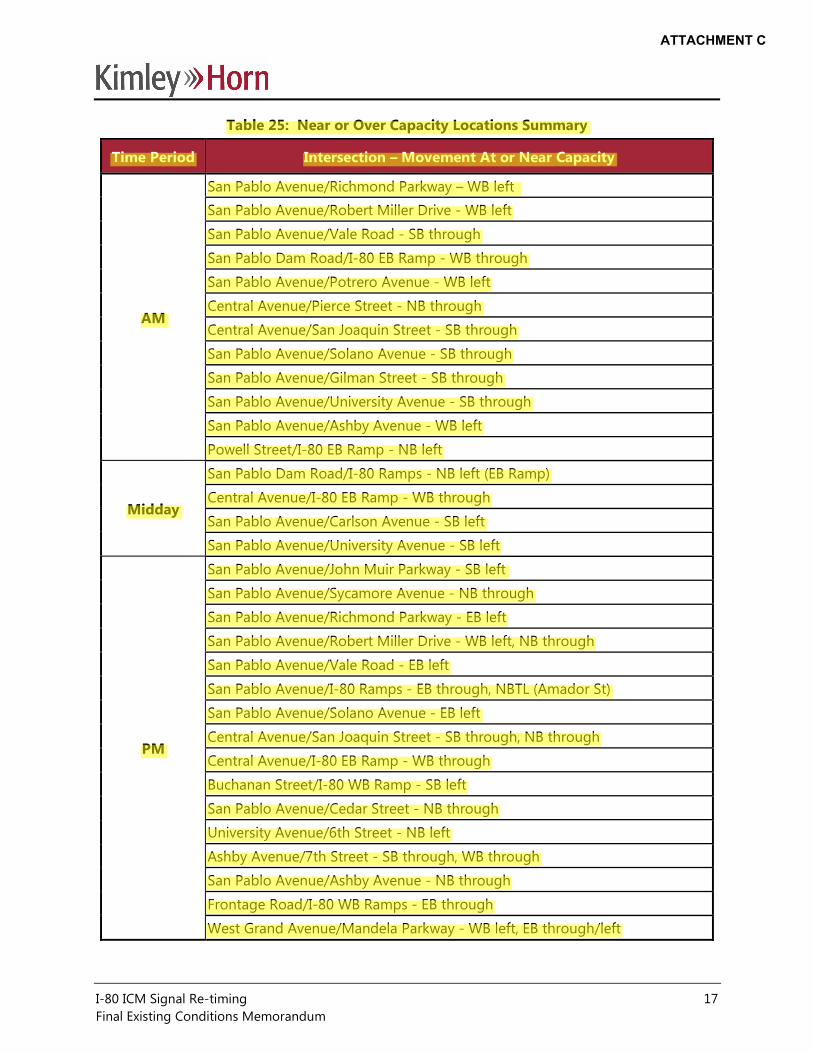
Table 25: Near or Over Capacity Locations Summary
Time Period Intersection – Movement At or Near Capacity
AM
San Pablo Avenue/Richmond Parkway – WB left
San Pablo Avenue/Robert Miller Drive - WB left
San Pablo Avenue/Vale Road - SB through
San Pablo Dam Road/I-80 EB Ramp - WB through
San Pablo Avenue/Potrero Avenue - WB left
Central Avenue/Pierce Street - NB through
Central Avenue/San Joaquin Street - SB through
San Pablo Avenue/Solano Avenue - SB through
San Pablo Avenue/Gilman Street - SB through
San Pablo Avenue/University Avenue - SB through
San Pablo Avenue/Ashby Avenue - WB left
Powell Street/I-80 EB Ramp - NB left
Midday
San Pablo Dam Road/I-80 Ramps - NB left (EB Ramp)
Central Avenue/I-80 EB Ramp - WB through
San Pablo Avenue/Carlson Avenue - SB left
San Pablo Avenue/University Avenue - SB left
PM
San Pablo Avenue/John Muir Parkway - SB left
San Pablo Avenue/Sycamore Avenue - NB through
San Pablo Avenue/Richmond Parkway - EB left
San Pablo Avenue/Robert Miller Drive - WB left, NB through
San Pablo Avenue/Vale Road - EB left
San Pablo Avenue/I-80 Ramps - EB through, NBTL (Amador St)
San Pablo Avenue/Solano Avenue - EB left
Central Avenue/San Joaquin Street - SB through, NB through
Central Avenue/I-80 EB Ramp - WB through
Buchanan Street/I-80 WB Ramp - SB left
San Pablo Avenue/Cedar Street - NB through
University Avenue/6th Street - NB left
Ashby Avenue/7th Street - SB through, WB through
San Pablo Avenue/Ashby Avenue - NB through
Frontage Road/I-80 WB Ramps - EB through
West Grand Avenue/Mandela Parkway - WB left, EB through/left
ATTACHMENT C

I-80 ICM Signal Re-timing 18
Final Existing Conditions Memorandum
Actuated Settings Review
A review of the existing “actuated” (initial timing) settings was conducted to identify opportunities
to minimize delay during non-peak, free or non-coordinated periods and to enhance pedestrian
and bicycle safety. The analysis included a review of the pedestrian intervals, minimum and
maximum green intervals, and yellow intervals.
Phase sequence changes and conditional service will also be reviewed during the coordination
analysis. The following sections outline the recommendations for the various actuated settings.
Pedestrian Timing
A review of the existing pedestrian timing, including pedestrian clearance intervals (flashing don’t
walk or FDW) and Walk intervals, was conducted at each of the project signals. FDW intervals
were reviewed based on the California MUTCD (CA MUTCD) guidance. CA MUTCD guidance for
determining pedestrian clearance intervals, as provided in Section 4E.06 paragraph #8, is as
follows:
“…the pedestrian clearance time should be sufficient to allow a pedestrian crossing in the
crosswalk who left the curb or shoulder at the end of the WALKING PERSON (symbolizing
WALK) signal indication to travel at a walking speed of 3.5 feet per second to at least the far
side of the traveled way or to a median of sufficient width for pedestrians to wait.”
The methodology for calculating FDW intervals varies by agency. The methodology used for each
agency is included in the Appendix along with a table summarizing the crosswalk lengths and
existing and recommended FDW pedestrian intervals.
Yellow and Red Intervals
The latest CA MUTCD guidelines call for establishment of the yellow interval based on the 85th
percentile speed (if available), as shown in Table 26, with the 85th percentile speed rounded up
to the nearest 5 miles per hour. For locations where 85th percentile speeds were not available,
the yellow was reviewed based on posted speed using the values as shown in Table 27.
Table 26: Minimum Yellow Clearance Based on 85th Percentile Speed
Approach Speed – 85th Percentile
(mph)
Yellow Interval
(seconds)
25 or less 3.0
30 3.2
35 3.6
40 3.9
45 4.3
ATTACHMENT C
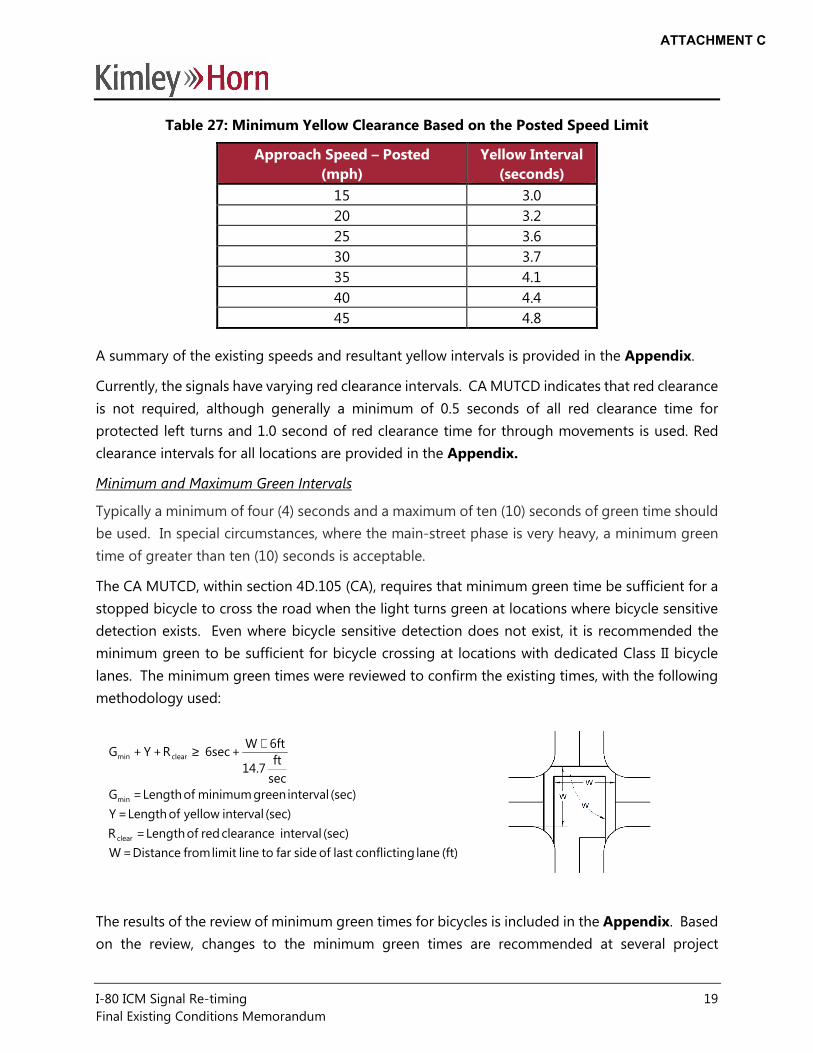
I-80 ICM Signal Re-timing 19
Final Existing Conditions Memorandum
Table 27: Minimum Yellow Clearance Based on the Posted Speed Limit
Approach Speed – Posted
(mph)
Yellow Interval
(seconds)
15 3.0
20 3.2
25 3.6
30 3.7
35 4.1
40 4.4
45 4.8
A summary of the existing speeds and resultant yellow intervals is provided in the Appendix.
Currently, the signals have varying red clearance intervals. CA MUTCD indicates that red clearance
is not required, although generally a minimum of 0.5 seconds of all red clearance time for
protected left turns and 1.0 second of red clearance time for through movements is used. Red
clearance intervals for all locations are provided in the Appendix.
Minimum and Maximum Green Intervals
Typically a minimum of four (4) seconds and a maximum of ten (10) seconds of green time should
be used. In special circumstances, where the main-street phase is very heavy, a minimum green
time of greater than ten (10) seconds is acceptable.
The CA MUTCD, within section 4D.105 (CA), requires that minimum green time be sufficient for a
stopped bicycle to cross the road when the light turns green at locations where bicycle sensitive
detection exists. Even where bicycle sensitive detection does not exist, it is recommended the
minimum green to be sufficient for bicycle crossing at locations with dedicated Class II bicycle
lanes. The minimum green times were reviewed to confirm the existing times, with the following
methodology used:
The results of the review of minimum green times for bicycles is included in the Appendix. Based
on the review, changes to the minimum green times are recommended at several project
(ft) lane gconflictin last of sidefar to line limit from Distance = W
(sec) interval clearance red of Length = R
(sec) interval yellowof Length =Y
(sec) interval green minimum of Length = G
sec
ft14.7
6ftW + 6sec R +Y + G
clear
min
clearmin
+≥
ATTACHMENT C

I-80 ICM Signal Re-timing 20
Final Existing Conditions Memorandum
intersections. In addition, the agencies may want to consider raising the minimum green times at
the locations with less than four (4) seconds. These locations are also highlighted in the
Appendix. At all other intersections, the minimum green times appear to be reasonable and no
changes are recommended.
There is a wide range in maximum green intervals throughout the project intersections.
Adjustments may be necessary once the recommended splits are developed to ensure that the
maximum split times accommodate the new splits or to reduce the amount of time a phase
receives. Additional review of the minimum and maximum green times will be completed during
the coordination analysis and implementation of the coordination plans. Adjustments to these
parameters can typically be identified more often during the detailed coordination analysis and
fine-tuning review.
Existing Conditions Traffic Model
Once all the data was collected, the existing conditions traffic models were developed using the
Synchro 8 software for the AM, midday, and PM peak periods. Peak hour turning movement
volumes, lane information, and travel speeds were used for development of the models. In
addition, existing phasing timing parameters were coded in the model.
The models were calibrated by verifying that the model data, such as queue lengths, degree of
saturation, average delay, and travel time reasonably matched the observed conditions in the
field. Adjustments to input data such as saturation flow rates, travel speeds, traffic volumes, and
lane geometry (i.e. locations where vehicles use a wide single lane as two lanes), were reviewed to
achieve a reasonable match between the model and observed conditions. Existing timing outputs
from the Synchro Models are included in the Appendix.
ATTACHMENT C

I-80 ICM Signal Re-timing 21
Final Existing Conditions Memorandum
APPENDIX
ATTACHMENT C

I-80 ICM Signal Timing
Appendix Table of Contents:Appendix A – Intersection List
Appendix B – 24-hour Tube Counts
Appendix C – “Before” Study Travel Time Summaries
Appendix D – Actuated Timings
Appendix D1 – Albany
Appendix D2 – Berkeley
Appendix D3 – Caltrans
Appendix D4 – Contra Costa County
Appendix D5 – El Cerrito
Appendix D6 – Emeryville
Appendix D7 – Hercules
Appendix D8 – Oakland
Appendix D9 – Pinole
Appendix D10 – Richmond
Appendix D11 – San Pablo
Appendix E – Existing Timing Summaries
Appendix E1 – Albany
Appendix E2 – Berkeley
Appendix E3 – Caltrans
Appendix E4 – Contra Costa County
Appendix E5 – El Cerrito
Appendix E6 – Emeryville
Appendix E7 – Hercules
Appendix E8 – Oakland
Appendix E9 – Pinole
Appendix E10 – Richmond
Appendix E11 – San Pablo
ATTACHMENT C