vibrational thermodynamics
TRANSCRIPT
8/13/2019 Vibrational Thermodynamics
http://slidepdf.com/reader/full/vibrational-thermodynamics 1/145
Vibrational Thermodynamics of Materials
Brent Fultz
California Institute of Technology, W. M. Keck Laboratory, Pasadena CA 91125 USA
July 6, 2009
Abstract. The literature on vibrational thermodynamics of materials is reviewed. The emphasisis on metals and alloys, especially on the progress over the last decade in understanding differencesin the vibrational entropy of different alloy phases and phase transformations. Some results oncarbides, nitrides, oxides, hydrides and lithium-storage materials are also covered.
Principles of harmonic phonons in alloys are organized into thermodynamic models for unmixingand ordering transformations on an Ising lattice, and extended for non-harmonic potentials. Owingto the high accuracy required for the phonon frequencies, quantitative predictions of vibrationalentropy with analytical models prove elusive. Accurate tools for such calculations or measurementswere challenging for many years, but are more accessible today. Ab-initio methods for calculatingphonons in solids are summarized. The experimental techniques of calorimetry, inelastic neutronscattering, and inelastic x-ray scattering are explained with enough detail to show the issues of
using these methods for investigations of vibrational thermodynamics. The explanations extend tomethods of data analysis that affect the accuracy of thermodynamic information.
It is sometimes possible to identify the structural and chemical origins of the differences invibrational entropy of materials, and the number of these assessments is growing. There has beenconsiderable progress in our understanding of the vibrational entropy of mixing in solid solutions,compound formation from pure elements, chemical unmixing of alloys, order-disorder transforma-tions, and martensitic transformations. Systematic trends are available for some of these phasetransformations, although more examples are needed, and many results are less reliable at hightemperatures. Nanostructures in materials can alter sufficiently the vibrational dynamics to affectthermodynamic stability. Internal stresses in polycrystals of anisotropic materials also contributeto the heat capacity. Lanthanides and actinides show a complex interplay of vibrational, electronic,and magnetic entropy, even at low temperatures.
A “quasiharmonic model” is often used to extend the systematics of harmonic phonons tohigh temperatures by accounting for the effects of thermal expansion against a bulk modulus.
Non-harmonic effects beyond the quasiharmonic approximation originate from the interactions of thermally-excited phonons with other phonons, or with the interactions of phonons with electronicexcitations. In the classical high temperature limit, the adiabatic electron-phonon coupling canhave a surprisingly large effect in metals when temperature causes significant changes in the elec-tron density near the Fermi level. There are useful similarities in how temperature, pressure, andcomposition alter the conduction electron screening and the interatomic force constants. Phonon-phonon “anharmonic” interactions arise from those non-harmonic parts of the interatomic potentialthat cannot be accounted for by the quasiharmonic model. Anharmonic shifts in phonon frequencywith temperature can be substantial, but trends are not well understood. Anharmonic phonondamping does show systematic trends, however, at least for fcc metals.
Trends of vibrational entropy are often justified with atomic properties such as atomic size,electronegativity, electron-to-atom ratio, and mass. Since vibrational entropy originates at thelevel of electrons in solids, such rules of thumb prove no better than similar rules devised fortrends in b onding and structure, and tend to be worse. Fortunately, the required tools for accurate
experimental investigations of vibrational entropy have improved dramatically over the past fewyears, and the required ab-initio methods have become more accessible. Steady progress is expectedfor understanding the phenomena reviewed here, as investigations are performed with the new toolsof experiment and theory, sometimes in integrated ways.
8/13/2019 Vibrational Thermodynamics
http://slidepdf.com/reader/full/vibrational-thermodynamics 2/145
II B. Fultz
Table of Contents
I. Principles and Methods
1 Overview 12 Harmonic Lattice Dynamics 22.1 Partition Function 32.2 Hamiltonian for Lattice Dynamics 52.3 Equations of Motion 62.4 The Eigenvalue Problem for the Polarization Vector 72.5 Calculation of the Phonon Density of States 83 Predictions with the Harmonic Model 93.1 Mass, Local Modes, and Resonance Modes 93.2 Long Wavelength Limit and the Debye Model 113.3 Disordered Systems 134 Bond Proportion Model 134.1 Bond Proportion Model and Unmixing on the Ising Lattice 144.2 Bond Proportion Model and Ordering on the Ising Lattice 184.3 Monte Carlo Results 205 Bond-Stiffness-versus-Bond-Length Model 215.1 Phonon Frequencies and Bond Lengths 215.2 Extending the Bond Proportion Model 245.3 Chemical Effects on Bond Stiffness 256 Heat Capacity 256.1 Harmonic Heat Capacity 256.2 Quasiharmonic Thermodynamics 276.3 Anharmonic Heat Capacity 296.4 Thermodynamic Entropy 307 Calorimeters 318 Neutron Scattering 328.1 Elastic and Inelastic Scattering 328.2 One-Phonon and Multiphonon Scattering 358.3 Neutron Weighting 378.4 Direct-Geometry Fermi Chopper Spectrometer 388.5 Triple-Axis Spectrometer 389 Ab-Initio Methods 399.1 Density Functional Theory 409.2 First-Principles Phonon Calculations 409.3 Molecular Dynamics 41
II. Vibrational Entropy of Materials at Lower Temperatures
10 Earlier Investigations 4310.1 Polymorphism 4310.2 Solubilities and Defect Concentrations 4410.3 Carbides, Nitrides, and Oxides 4711 First-Principles Studies of Solutions and Studies of Ordered Compounds 48

8/13/2019 Vibrational Thermodynamics
http://slidepdf.com/reader/full/vibrational-thermodynamics 3/145
Vibrational Thermodynamics of Materials III
11.1 Solubility in Al Alloys 4811.2 Aluminum Compounds 4911.3 Low-Symmetry Phases at High Temperatures 5012 Chemical Order-Disorder Transformations 52
12.1 Transition Metal Aluminides 5212.2 B2 Ordering in CuZn and FeCo 5612.3 L12 Ordering 5713 Unmixing 6213.1 Computational Studies of Unmixing 6213.2 Cluster Expansion Method for Solid Solutions 6413.3 Fe-Cr Solid Solutions 6614 Interstitial Alloys 6814.1 Interstitial Oxygen and Nitrogen 6814.2 Hydrogen and Hydrides 6914.3 Lithium Intercalation and Insertion 7015 Martensite and Twinning 7316 Microstructural Contributions 7616.1 Elastic Energy 7716.2 Nanostructures 7917 f-Electron Metals 8417.1 Cerium 8417.2 Uranium and Plutonium 87
III. Vibrational Entropy of Materials at Higher Temperatures
18 Interactions between Thermal Excitations of Electrons and Phonons 8918.1 Overview of Thermal Effects on Electron and Phonon Energies 8918.2 Formalism of Phonon-Phonon Interactions 9018.3 Formalism of Electron-Phonon Interactions 9319 Phonon-Phonon Anharmonicity 9519.1 Damped Harmonic Oscillator 9519.2 Perturbation Theory 9719.3 Anharmonicities of Individual Phonons 9919.4 Anharmonicity and Heat Capacity 10119.5 Anharmonic Trends of fcc and bcc Metals 10419.6 Thermoelectric Materials 10720 Electron-Phonon Interactions in Metals 10720.1 Fermi Surfaces 10720.2 Phonons at High-Temperatures in Zirconium, Hafnium, Niobium, Molyb-
denum, and Chromium 11020.3 Phonons in Vanadium and Its Alloys 11020.4 The Adiabatic EPI in Superconductors 11520.5 Effects of Pressure, Composition, and Temperature on the Adiabatic
EPI and the Phonon DOS 118
8/13/2019 Vibrational Thermodynamics
http://slidepdf.com/reader/full/vibrational-thermodynamics 4/145
IV B. Fultz
IV. Overview and Summary
21 Systematic Trends of Vibrational Entropy 12121.1 Multiple Effects 121
21.2 Hume–Rothery Rules and Vibrational Entropy 12222 Future Directions 12322.1 Opportunities for Experiment 12322.2 Opportunities for Theory 12322.3 Outlook 12423 Acknowledgments 12524 Bibliography 125Index 135
136

8/13/2019 Vibrational Thermodynamics
http://slidepdf.com/reader/full/vibrational-thermodynamics 5/145
Vibrational Thermodynamics of Materials 1
I. Principles and Methods
1. Overview
Without entropy to complement energy, thermodynamics would have the impactof one hand clapping. Boltzmann’s graveside monument displays an equation forentropy of breathtaking generality
S = kB ln Ω (1)
(modernized slightly, with kB as the Boltzmann constant). The nub of the problem isthe number Ω, which counts the ways of finding the internal coordinates of a systemfor thermodynamically-equivalent macroscopic states. Physical questions are, “Whatdo we count, and how do we count them?”
It is often possible to separate the internal coordinates of a material into con-
figurational ones and dynamical ones. As an example, when the number Ω forconfigurational coordinates counts the spatial arrangements of atoms over the sites of a crystal, this Ω does not depend explicitly on temperature. On the other hand, whenthe number Ω for dynamical coordinates counts the intervals of volume explored asatoms vibrate, this Ω increases with temperature, as does the vibrational entropy.
Configurational entropies of atoms or spins undergo changes during chemicalordering or magnetic phase transformations, respectively.1 Configurational entropywas largely understood by Gibbs, who presented some of the combinatoric calcu-lations of entropy that are used today [1]. The calculation of Ω is more difficultwhen there are local correlations in the system, but cluster approximation methodshave proved powerful and accurate [2, 3, 4]. An important point is that configura-tional coordinates have different equilibrium values at different temperatures, buttemperature does not alter how the configurations are counted to obtain Ω.
Dynamical entropy grows larger as internal degrees of freedom of a solid, such asnormal modes of vibration, become more strongly excited by thermal energy.2 Withincreasing temperature more phonons are created, and the vibrational excursionsof atomic nuclei are larger. Fundamentally, the entropy from dynamical sourcesincreases with temperature because with stronger excitations of dynamical degreesof freedom, the system explores a larger volume in the phase space of position andmomentum. This volume, normalized if necessary, is the Ω for Eq. 1.
Phonon thermodynamics, especially vibrational entropy, is the main focus of thisreview. It turns out that it is important to have rather accurate information onphonon energies or heat capacities to assess the importance of vibrational entropy.3
1 Electronic entropy can also have a configurational component in mixed-valent systems. Nuclearspins undergo ordering transitions at low temperatures, too, although at most temperatures of interest in materials physics the nuclear spins are fully disordered and their entropy does notchange with temperature.
2 Temperature also drives electronic excitations to unoccupied states, and when many states areavailable the electronic entropy is large. Spin excitations are another source of entropy, but caremust be taken when counting them if the configurations of spin disorder are already counted.
3 For example, if we apply Eq. 16 to a case where the phonon density of states curves of theα and β phases have the same shape, but differ in energy scaling by 10%, we obtain a change in
8/13/2019 Vibrational Thermodynamics
http://slidepdf.com/reader/full/vibrational-thermodynamics 6/145
2 B. Fultz
When comparing the phonon entropies of different alloy phases, a 1% accuracy in thedifference in logarithmic-averaged phonon energy is desireable. This is challenging,so although there were many suggestions over many years that vibrational entropycould have a significant effect on the thermodynamics of order-disorder transforma-
tions, until recently accurate computations of phonons were impractical, and theexperimental results were ambiguous. Today, measurements and calculations haveproved sufficiently reliable for useful assessments of the thermodynamic effects of vibrational entropy for different materials. This progress and the trends that havebeen found to date are the subjects of the present review.
The independence of phonons is an important feature of the “harmonic model,”for which there are many useful and powerful mathematical results. The harmonicmodel explains many physical phenomena, especially at low temperatures when thephonons are approximately independent of each other, and independent of othersources of dynamical entropy. It is often extended to higher temperatures as the“quasiharmonic model,” which assumes independent phonons with altered frequen-cies. At high temperatures, however, the different sources of dynamical entropy caninteract in important ways. The existence of phonons alters the energies requiredto create additional phonons (phonon-phonon interaction, PPI), and the electronexcitations are altered by vibrational excitations (electron-phonon interaction, EPI).An understanding of vibrational entropy at high temperatures is emerging.
The first sections of this review develop the principles of phonon thermodynamicsand vibrational entropy. Methods for measurement and calculation are covered next,with emphasis on experimental methods. The third part is on the vibrational en-tropies of materials with different atomic configurations, and phase transformations,emphasizing low temperature b ehavior interpreted with a harmonic model. Thefourth part is on non-harmonic behavior at higher temperatures, including the effectsof electron-phonon and phonon-phonon interactions.
2. Harmonic Lattice Dynamics
The mass of an atom is in its point-like nucleus, and the forces between nuclei aretransmitted through lightweight electrons, which are typically assumed to respondinstantly to nuclear displacements (Born–Oppenheimer approximation). The Born–von Karman model assumes nuclear masses connected by massless electron springs,giving a set of ordinary second-order differential equations of motion. The model isspecific to a crystal with translational periodicity, and its normal modes of vibrationare wavelike and with dispersion relations between frequency and wavevector. TheBorn–von Karman model is expected to be reliable at low temperatures where atom
displacements are small.Normal coordinates offer a sweeping simplification of the vibrational dynamics.In a harmonic solid, each normal mode does not transfer energy to the other modes.Without damping, a normal mode persists forever. This remains true in quantummechanics, although integral numbers of excitations, phonons, exist in each normal
phonon entropy of ∆S ph = 3kB ln(1.1) ≃ 0.3 kB/atom. This change in vibrational entropy is almosthalf of the maximum possible change in configurational entropy of an order-disorder transformationof a binary alloy (which is kB ln 2/atom).
8/13/2019 Vibrational Thermodynamics
http://slidepdf.com/reader/full/vibrational-thermodynamics 7/145
Vibrational Thermodynamics of Materials 3
mode. For harmonic solids, the energy cost for each additional phonon is εi = ωi (ωi is the angular frequency of the oscillator), and is unchanged even as morephonons are added to each normal mode. Phonon modes can therefore be consideredas independent harmonic oscillators, so we start with the thermodynamics of the
quantum harmonic oscillator.
2.1. Partition Function
The partition function for a single harmonic oscillator of frequency ωi = εi/ is
Z i =∞n
e−β (n+1/2)εi , (2)
Z i = e−βεi/2
1 − e−βεi, (3)
where Eq. 3 was obtained by identifying Eq. 2 as a geometric series times the
constant factor exp(−βεi/2), where β ≡ (kB T )−1
. The partition function for aharmonic solid with N atoms and 3N independent oscillators is the product of these individual oscillator partition functions,
Z N =3N
i
e−βεi/2
1 − e−βεi, (4)
from which we can calculate the phonon free energy by the prescription F =−kBT ln Z ,
F vib = 1
2
3N i
εi + kBT 3N
i
ln
1 − e−βεi
, (5)
and the phonon entropy (vibrational entropy) by differentiating with respect to T :
S vib = kB
3N i
− ln
1 − e−βεi
+ βεi
eβεi − 1
. (6)
Using the Planck distribution for phonon occupancy versus temperature, n(εi, T ),
n(εi, T ) = 1
e+βεi − 1 , (7)
− ln
e−βεi − 1
= ln(1 + n) , (8)
βεi = ln1 + n
n , (9)
it is straightforward to show that Eq. 6 reduces to the following form for thevibrational entropy per oscillator, S osc
S osc = +kB
(1 + n) ln(1 + n) − n ln n
. (10)
Equation 10 can also be obtained from Eq. 1 with the combinatoric relationshipΩ = (M + m)! / [M ! m!] for m phonons in M oscillators (with n ≡ m/M ).

8/13/2019 Vibrational Thermodynamics
http://slidepdf.com/reader/full/vibrational-thermodynamics 8/145
4 B. Fultz
Phonons are bosons, so it is interesting to compare Eq. 10 to the analogousequation for fermions, where m electrons are distributed over N states of energy ε.For fermions, the combinatorics give Ω = N ! / [(N − m)! m!]. Fermion entropy is thesame as the entropy of mixing of atoms on a crystal lattice, where each lattice site
can hold only one atom. The entropy of mixing per atom is
S mix = −kB
(1 − c)ln(1 − c) + c ln c
. (11)
Equations 10 and 11 have two differences – all signs are reversed, and n can exceed1, whereas 0 ≤ c ≤ 1.
It is often useful to work with a phonon density of states (DOS), g(ε). For a 3-dimensional solid, 3N g(ε)dε phonon modes are in an energy interval dε. For a DOSacquired as digital data in m intervals of width ∆ε (so ε j = j∆ε), the partitionfunction can be computed numerically
Z N =
m j=1
e−βεj/2
1 − e−βεj3N g(εj)∆ε
, (12)
which becomes at high temperatures
Z N =m
j=1
kBT
ε j
3N g(εj)∆ε
. (13)
Again, using Eqs. 7, 8, 9, we can obtain from Eq. 12 a useful expression for thephonon entropy of a harmonic material at any temperature (cf. Eq. 10)
S vib(T ) = 3kB
∞
0
g(ε) n(ε) + 1 ln n(ε) + 1−n(ε) ln n(ε) dε , (14)
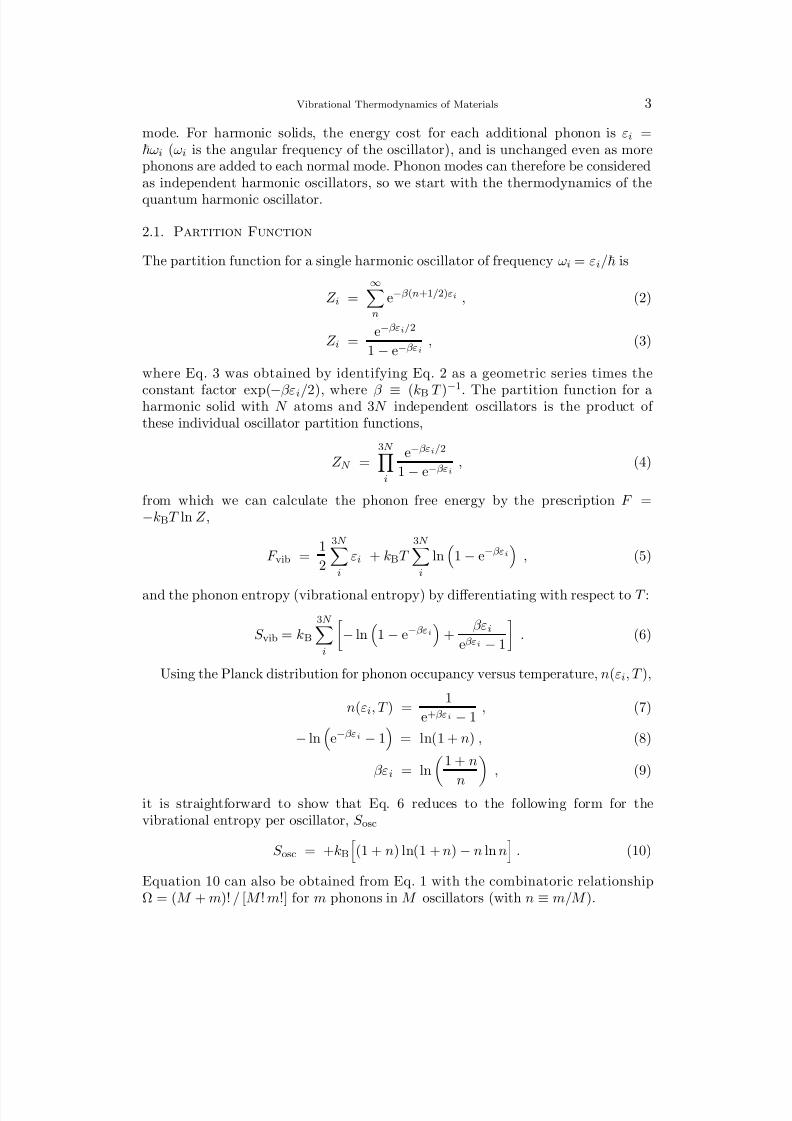
where g(ε) is normalized to 1 and n(ε) is the Planck distribution (Eq. 7) for thetemperature of interest. For thermodynamic calculations, series expansions of Eqs.5 and 6, valid at high temperatures, can be useful. For S ph(T ), Fig. 1 compares theexact expression of Eq. 10 to approximations for up to four terms of a standard high-temperature expansion (terms are presented in the figure). At high temperatures,the following expression works well for the entropy of one oscillator mode with energyε = ω
S vib,ω(T ) = kB
n(ε) + 1
ln
n(ε) + 1− n(ε) ln
n(ε) ≃ kB
ln
kBT
ω
+ 1
, (15)
although the constant factor of kB will cancel in differences of phonon entropy.A handy expression for the high-temperature limit of the difference in vibrationalentropy between two harmonic phases, α and β , can be obtained readily from Eq.14
∆S β −αvib = 3kB
∞ 0
(gα(ε) − gβ (ε))ln(ε) dε . (16)
8/13/2019 Vibrational Thermodynamics
http://slidepdf.com/reader/full/vibrational-thermodynamics 9/145
Vibrational Thermodynamics of Materials 5
Figure 1. Temperature-dependence of entropy calculated for one mode of energy ω, withE = ω(kBT )−1.
The important point about Eq. 12 is that the only material parameter relevant tothe thermodynamic partition function in the harmonic approximation is the phononDOS, g(ε). Measuring or calculating the phonon DOS is central to much of ourunderstanding of the vibrational entropy of materials. It turns out, though, thatfor most problems g(ε) must be known with high accuracy, and this has been achallenge until relatively recently.
2.2. Hamiltonian for Lattice Dynamics
Since most of the atom mass is in the nucleus, for lattice dynamics we consider theHamiltonian for nuclear motions in a crystal
H n =l,κ
p2lκ
2mκ+ Φ , (17)
and the characteristics of the atom vibrations require attention to the potentialenergy, Φ. Following the development of Maradudin, et al. [5] for a crystal latticewith a basis, the basis vectors are rκ, κ = 1, 2...R. Each atom κ, in the unitcell l, is allowed to vibrate about equilibrium with the displacement ulκ(t). The
instantaneous position Rlκ(t) of atom lκ at time t is
Rlκ(t) = rl + rκ + ulκ(t) . (18)
We use Cartesian components uαlκ for the displacement vector, where α = x,y,z.The total potential energy of the crystal, Φ, is a function of the instantaneouspositions of all the atoms in the crystal, but it is expanded in a Taylor series of theatomic displacements about ulκ(t) = 0 (i.e., the equilibrium positions of the atoms

8/13/2019 Vibrational Thermodynamics
http://slidepdf.com/reader/full/vibrational-thermodynamics 10/145
6 B. Fultz
Rlκ = rl + rκ)
Φ = Φ0 +αlκ
Φαlκ uαlκ
+ 12
αlκ
α′l′κ′
Φαα′lκl′κ′ uαlκ uα′l′κ′ + ... , (19)
where the coefficients of the Taylor series are the derivatives of the potential withrespect to the displacements:
Φαlκ = ∂ Φ
∂uαlκ
0
, (20)
Φαα′lκl′κ′ = ∂ 2Φ
∂uαlκ ∂uα′l′κ′
0
, (21)
where the subscript zero means that derivatives are evaluated in the equilibriumconfiguration (all displacements equal to zero) and Φ0 is the static potential en-ergy of the crystal. Because the force on any atom must vanish in the equilibriumconfiguration, we have [5]
Φαlκ = 0 ∀ α,l,κ . (22)
In the harmonic approximation of lattice dynamics we keep only the remainingterms of the series written explicitly in Eq. 19 – we neglect terms of order three andhigher in the displacements
H n =lκ
p2lκ
2mκ
+ Φ0 + 1
2αlκ
α′l′κ′
Φαα′lκl′κ′ uαlκ uα′l′κ′ , (23)
where mκ is the mass of the atom at basis index κ of the unit cell. We rewrite theHamiltonian in matrix form
H n =
lκ
p2lκ
2mκ+ Φ0 +
1
2
lκ
l′κ′
uT lκ Φlκl′κ′ ul′κ′ , (24)
where a 3×3 force-constant sub-matrix is defined for each atom pair (lκ; l′κ′)
Φlκl′κ′ = [Φαα′lκl′κ′] . (25)
If (l, κ)
= (l′, κ′), Eq. 21 applies. If (l, κ) = (l′, κ′), Φαα′lκlκ is a “self-force
constant,” derived from the requirement of no overall translation of the crystal
Φlκlκ = −
(l′,κ′)=(l,κ)
Φlκl′κ′ . (26)
Because equal and opposite forces act between each atom of a pair, Φ lκl′κ′ must bea real symmetric matrix.
8/13/2019 Vibrational Thermodynamics
http://slidepdf.com/reader/full/vibrational-thermodynamics 11/145
Vibrational Thermodynamics of Materials 7
2.3. Equations of Motion
In the harmonic approximation, the equations of motion for all nuclei are
mκ ··ulκ(t) = −l′,κ′
Φlκl′κ′ ul′κ′(t) ∀ l,κ . (27)
In Eq. 27 there are 3 × R × N cell equations of motion to solve for a finite crystalcontaining N cell unit cells. We seek solutions having the form of plane waves4 of wavevector k, angular frequency ω kj, and “polarization” eκj ( k) (where j is a “branch
index” discussed below)
ulκ kj (t) =
2
N mκ ω kj
eκj ( k) ei( k·rl−ω kjt) . (28)
ulκ kj (t) = 2n(ε
kj
, T ) + 1
N mκ ε kjeκj( k) ei(
k·rl−ω kjt) , (29)
where we take the real part to obtain physical displacements, or we use the conven-tion of adding the complex conjugate of the exponential, and halving the prefactor.
The phase factor, ei k·rl , provides all the long-range spatial modulation of ulκ kj (t).
The dependence on κ, a short-range basis vector index, is taken out of the phasefactor and placed in the complex constant eκj ( k). It is convenient for the eκj( k) of Eq. 28 to have modulus unity, as does the exponential. The prefactors are consistentwith the quantization of energy for one phonon, ω = m ω2u2 = 1
2 m ω2 u2max, or for
the thermal population of phonons in mode ε kj, having energy E = ε kj
[n(ε kj, T )+ 1
2 ].
(For root-mean-squared displacements, delete the√
2 in Eqs. 28 and 29.)We impose periodic boundary conditions on the finite crystal. These require the
set of possible wavevectors k to have N cell values, a large number that gives a
very fine mesh of k-points in reciprocal space. With R atoms in the basis of the unitcell, the crystal has 3 × R × N cell vibrational modes, in agreement with its totalnumber of mechanical degrees of freedom. Each wavevector k is associated a-priori
with 3 × R types of vibrational modes, identified by a branch index, j . Each of the3R different modes corresponds to a different polarization vector eκj( k) and angularfrequency ω kj (1 ≤ j ≤ 3R), although degeneracies can be induced by symmetry.
2.4. The Eigenvalue Problem for the Polarization Vector
The polarization vector, eκj ( k), is a characteristic of each vibrational mode
k, j. Thevector eκj( k) contains information on the excursion of each atom κ in the unit cell
for the phonon mode mode k, j. Specifically, it gives 1) the displacement directionof the atom, and 2) its phase lag in time with respect to the other atoms. The
vectors eκj ( k) for all the atoms in the basis (1 ≤ κ ≤ R) and their associated
4 In general, the motion of an atom ulκ(t) will be a sum over many phonons ulκ kj(t) (cf., Eq.143).
8/13/2019 Vibrational Thermodynamics
http://slidepdf.com/reader/full/vibrational-thermodynamics 12/145
8 B. Fultz
angular frequencies ω kj can be calculated by diagonalizing the “dynamical matrix”
D( k). The dynamical matrix is obtained by substituting Eq. 28 into 27. It has the
dimensions (3N × 3N ) and is constructed from (3 × 3) submatrices Dκκ′( k)
D( k) =
D11( k) . . . D1N ( k)...
. . . ...
DN 1( k) · · · DN N ( k)
. (30)
Each sub-matrix Dκκ′( k) is the Fourier transform of the force-constant matrixΦlκl′κ′ , considered as a function of (l′ − l):
Dκκ′( k) = 1√ mκmκ′
l′
Φ0κl′κ′ ei k·(rl′−r0) , (31)
where we set l = 0 because the summation is over all l′ and the origin is arbitrary.
By similarly collecting the polarization vectors into a vector of size 3×R, we rewritethe system of differential equations (Eq. 27) with the plane wave solutions (Eq. 28)as an eigenvalue problem:
D( k) e j( k) = ω2 kj
e j ( k) , (32)
where
e j ( k) =
ex1 j ( k)
ey1 j ( k)
ez1 j( k)
ex2 j ( k)
...
ezN j( k)
. (33)
It can be shown that the (3R×3R) dynamical matrix D( k) is hermitian (for any
value of k). It is fully diagonalizable, and the ω2 kj
are real. The 3R eigenvectors and
eigenvalues of the dynamical matrix evaluated at a particular wavevector k thencorrespond to the 3R eigenmodes of vibration of the crystal for that wavevector.
2.5. Calculation of the Phonon Density of States
To calculate the phonon density of states (DOS) of the crystal, g(ε), the dynamical
matrix is diagonalized at a large number of points in reciprocal space (typicallycovering the first Brillouin zone). The diagonalization of D( k) at each k point returns3R eigenvalues of angular frequency ω kj (1 ≤ j ≤ 3R), which are then binned into
the DOS histogram.A phonon partial DOS, gd(ε), is a similar quantity, but it gives the spectral
distribution of motion by one atom, the species d in the unit cell. Unlike the totalDOS, g(ε), the eigenvalues of the crystal are not weighted equally in the partial
8/13/2019 Vibrational Thermodynamics
http://slidepdf.com/reader/full/vibrational-thermodynamics 13/145
Vibrational Thermodynamics of Materials 9
DOS
gd(ε) =
k
ακj
δ dκ |eακj ( k)|2 g(ε) , (34)
where the Kroneker delta is zero unless the atom species d is at the site κ (whenδ dd = 1). Because the eigenvalues of the dynamical matrix are normalized for each k as
ακj
|eακj ( k)|2 = 1 , (35)
the total DOS is the sum of the partial DOSs of all atoms in the unit cell,
g(ε) =
d
gd(ε) . (36)
To calculate a partial DOS, for each diagonalization of the dynamical matrix at aspecific k point, the partial DOS histogram for atom d is incremented at frequencyω kj by the amount
α e∗αdj ( k) eαdj ( k). The partial DOS for atom d is large at energies
where there are many modes with large displacements of atom d. The histogram forthe phonon partial DOSs are computed simultaneously with the total DOS.
3. Predictions with the Harmonic Model
The harmonic model provides much of the truth about vibrational entropy at lowtemperatures, and its analytical formulation allows a number of important pre-dictions about vibrational entropies of alloying or phase transformations. Some
important results are presented here without full proof. Two classic and sophis-ticated treatments of the harmonic solid are Maradudin, et al. [5], and Born andHuang [6].
3.1. Mass, Local Modes, and Resonance Modes
Otto Stern reported a number of theoretical observations relevant to lattice dynamicsin 1916 [7]. Importantly, he showed that the trace of the dynamical matrix is equalto the product of the normal mode frequencies squared. From this it is possible toshow that mass disorder does not contribute to the vibrational entropy of order-disorder or unmixing transformations, for example. If a new structure is formed byrearranging the same atoms, the effects of the masses on the vibrational entropy can
be neglected, at least in the classical limit. All changes in vibrational entropy areattributed to changes in force constants (or changes in the interatomic potential),and not to rearranging the same masses [8, 9, 10, 11]
The kinetic energy for each atom is p2/(2m), where the momentum, p, is amaximum when the atom is at its equilibrium position (ulκ = 0) and all the thermalenergy is kinetic. Rearranging the different atom masses into different structureshas no effect on the kinetic energy of each atom as it moves across its equilibriumposition. There is no change in the volume of momentum space explored during
8/13/2019 Vibrational Thermodynamics
http://slidepdf.com/reader/full/vibrational-thermodynamics 14/145
10 B. Fultz
vibration. The potential energy of each oscillating atom does not depend on mass,only position. Changing the mass of an atom will not change the range of its motionin the potential well (Max[ulκ(t)]), or the volume of phase space in the positioncoordinates. Since the volume of momentum-position phase space is unchanged by
rearranging the same masses, by Eq. 1 there is no change in vibrational entropyin the classical limit. Only changes in interatomic force constants are importantwhen comparing classical vibrational entropies of different phases in the harmonicmodel. Anharmonicity does not change this independence of mass, but it alters otherresults.5
The Einstein model, which assumes each atom is an independent harmonic oscil-lator, cannot account for wavevector-energy relationships of phonons. Nevertheless,the Einstein model can be useful when little energy is transferred between the atomsin the solid, and there is little change of phonon energy with wavevector. Considerhydrogen atoms in interstitial sites between metal atoms. Owing to its low mass, ahydrogen atom vibrates as if in a cage. Although the neighboring metal atoms mustmove a bit in response to the moving hydrogen atom, these metal atom displacementsare small. If the interatomic forces b etween the metal and hydrogen atoms aremoderate, the system will show a “local mode” at a high frequency, typically abovethe modes of the metal crystal. The local mode is dominated by motions of thehydrogen atoms, although the metal atoms must have some contribution in theirown partial density of states.
The other extreme of a heavy impurity atom in a host of lighter atoms producesa “resonance mode,” where the partial phonon DOS of the heavy impurity is dom-inated by a peaked spectrum at low energy. The neighboring matrix atoms movein response to the local motions of the heavy impurity atom, but the dynamicsis not simple. Because the resonance mode exists at the same frequency as othermodes in the matrix, there is substantial coupling between the resonance mode and
the continuum, so the resonance mode is not an eigenmode of a harmonic solid. Aresonance mode appears as being highly damped, with a short lifetime and a broadwidth in energy, sometimes of the form [5]
∆g(ω) ∝ Γ
(ω − ω0)2 + Γ2 (37)
The resonance mode is not intuitive, and its discovery was an achievement of theoretical work [12, 13, 14, 15].
The existence of a resonance mode depends on the ratios of the masses andinteratomic force constants. If all interatomic force constants are equal, a resonancemode will exist in an fcc lattice if the impurity mass is about 2.6 times heavier thanthe atoms in the matrix [5]. More likely, the interatomic force constants will differ
between the host atoms and the impurity, compared to host-host force constants.Stiffer forces to the neighbors of the impurity effectively increase the mass of thedefect center, favoring a resonance mode.
5 For harmonic oscillators, the thermal energy is equipartitioned between kinetic and potentialenergy. The equipartition of kB T /2 into each degree of freedom of momentum and position origi-nates with these coordinates appearing quadratically in the Hamiltonian H , producing a Gaussianintegration of e−H/kBT . A cubic or quartic term in H causes an imbalance between kinetic andpotential energy.
8/13/2019 Vibrational Thermodynamics
http://slidepdf.com/reader/full/vibrational-thermodynamics 15/145
Vibrational Thermodynamics of Materials 11
3.2. Long Wavelength Limit and the Debye Model
The relative motions of different atoms in the unit cell are easiest to understand inthe long wavelength limit. Each inequivalent atom in a unit cell forms a sublattice
connecting its equivalent atoms in all other unit cells, distinct from the sublatticesof the other atoms. In the limit of long waves (as the wavevector k → 0), thesesublattices move rigidly, as seen on the scale of many unit cells. In optical modes,the sublattices move against each other, out-of-phase for example, but equivalentatoms in adjacent unit cells have the same displacements at the same time. In theacoustic modes, the motions of all sublattices are the same, as adjacent unit cellsdistort their shapes in unison.
Acoustic modes at long wavelengths are elastic waves through solids. The anisotropyof a crystalline solid adds complexity to the problem, but consider the wave equationfor the propagation of a longitudinal wave along the [100] direction:
ω2ρ = C 11k[100] , (38)
which has a wave speed of vl,[100] =
C 11/ρ (C 11 is an elastic constant and ρ isdensity). This wave speed vl,[100] must equal the group velocity obtained from thelongitudinal branch of the phonon dispersion along [100] at small k:
Limk[100]→0
dω/dk =
C 11/ρ . (39)
Relationships like Eqs. 38 and 39 hold true in all directions, although different combi-nations of elastic constants are required. Equation 39 requires a set of relationshipsbetween the elastic constants (such as C 11) and the interatomic force constantsΦlkl′k′, which determine the phonon dispersions through Eqs. 31 and 32. Physically,the elastic constants originate from the interatomic forces, so such a relationship isexpected. The derivations of such relationships are not simple, however, owing tothe anisotropy of the interatomic forces and differences between crystal structures.
Sound velocities are the rigorous limit of dω/dk as k → 0. At the atomic scale,a long wavelength longitudinal phonon is a density wave of compression followedby tension. In a local region (much smaller than λ), all atoms move collectivelytowards and against their neighbors, irrespective of their mass or interatomic forceconstants. When λ exceeds the range of the interatomic forces, the wave propagationbecomes independent of atomic detail, and in a given direction all waves of the samepolarization propagate with the same speed. Continuum behavior is achieved.
A subtlety arises when anharmonicity is significant, such as at high temperatures.Anharmonicity can suppress phonon lifetimes to tens of vibrational periods or less(Sect. 19.5). In this case, the long acoustic waves measured by ultrasonics propa-
gate through a medium influenced by averaged anharmonic effects. On the otherhand, the acoustic phonons measured by neutron inelastic scattering propagate intheir reduced lifetimes across a medium where equilibration of vibrational energyis not taking place between phonon modes. With anharmonicity, the energies anddω/dk of the neutron measurements are often larger than expected from ultrasonicmeasurements.
The Debye model of phonons in solids extrapolates this long wavelength behaviorto all phonon frequencies, ω, by assuming they are linear functions of wavevector, k ≡
8/13/2019 Vibrational Thermodynamics
http://slidepdf.com/reader/full/vibrational-thermodynamics 16/145
12 B. Fultz
2π/λ. This assumption never works for optical phonons, and is erroneous for acousticwaves when k approaches a reciprocal lattice vector (i.e., λ is interatomic distances).In particular, the highest phonon frequency occurs when nearest-neighbor atomsmove out-of-phase with respect to each other. Here there is no wave propagation,
and dω/dk = 0.Comparing the Debye temperatures of phases before and after a phase transfor-
mation allows an estimate of the change in vibrational entropy, using for example ahigh temperature expression like ∆S α→β = 3kB ln(ΘDα/ΘDβ ), where ΘDα and ΘDβ
are Debye temperatures of phases α and β . This must be done with care, however,because the Debye model has a history of misleading the materials physics commu-nity about the importance of vibrational entropy. The Debye model is unreliable forany calculations of vibrational entropy when the Debye temperature is obtained fromexperimental measurements of long wavelength behavior such as sound velocities,because only the low-energy tail of the phonon DOS is sampled. Differences inthis tail usually do not correlate reliably with differences in the phonon spectraof different materials because most of the phonons have wavelengths of atomicdistances. On the other hand, Debye temperatures obtained from heat capacitymeasurements are more representative of the phonon contributions to the entropy,and are more trustworthy for estimates of vibrational entropy. Beware that theDebye temperature is sometimes graphed as a function of temperature, which isa confession that the high frequency phonons cannot be obtained reliably fromlong-wavelength vibrations.
Fernandez Guillermet and Grimvall tested modifications of the Debye tempera-ture for evaluating vibrational entropy and phonon spectra [16]. Specifically theydefined a Debye temperature from the standard entropy of pure elements, as ob-tained for example from the JANAF Thermochemical Tables, with a small correctionfor electronic entropy. A second Debye temperature was obtained from bulk moduli,
but it differed substantially from that for the heat capacity. For Ru, for example, thetwo Debye temperatures were 384 and 555 K, and the effective interatomic force con-stants derived from the two Debye temperatures differed by a factor of two.6 For 3d,4d, and 5d elements in the same column of the periodic table, there are fairly constantratios of the two types of force constants. Nevertheless, the large disparities betweenDebye temperatures obtained from the entropy and from the elastic constants do notbode well for determining vibrational entropy from Debye temperatures. For somebcc and hcp transition metals, the ratios of Debye temperatures deduced from theentropy at ambient temperature and at cryogenic temperature range from 0.8 to 1.0[17]. This indicates that the Debye temperature useful for determining differences invibrational entropy is obtained from the vibrational entropy at the temperature of interest, i.e., the Debye temperature should be a recasting of the vibrational entropy
itself.It is possible to account for the effects of thermal expansion on the Debye temper-
ature with a Debye–Gruneisen approximation, where ΘD(T ) = Θ0D
r0/r(T )
3γ . With
increasing T , ΘD(T ) becomes smaller as r(T ) becomes larger. This approach wasused by Moruzzi, et al. to calculate thermal properties of elements [18]. Sanchez, etal., used this approach to improve the effective cluster interactions for first-principles
6 The force constant, k = M ω2, and with ω = kBΘD, k = M (kBΘD/ )2.
8/13/2019 Vibrational Thermodynamics
http://slidepdf.com/reader/full/vibrational-thermodynamics 17/145
Vibrational Thermodynamics of Materials 13
phase diagram calculations [19]. Tseng and Stark used this Debye–Gruneisen approx-imation to calculate the solubility of Ti in Al at both elevated temperatures, andunder pressure [20].
3.3. Disordered Systems
The pioneering analytical work on the disordered two-component chain by Dyson[21] inspired a number of studies on the dynamics of disordered systems. This fieldis excellent for computational methods, and the value of computer calculations of lattice dynamics was realized as soon as appropriate computing resources wereavailable. Early numerical computations on disordered systems were reviewed in1972 by Dean [22] in a computational science article that is still interesting today.Much later, a pedagogical computational study of phonon propagation in disorderedchains was performed by Allen and Kelner [23]. They showed that with increasingdisorder, phonon propagation evolves from ballistic, to diffusive, to localization of the vibrational energy. The transitions between these three regimes are not abrupt.
With modest disorder, some phonon wavepackets that propagate ballistically can beseen to scatter off the stronger inhomogeneities, and again propagate ballisticallyto their next scattering. These computational studies, although informative in theirown right, were not directed towards the study of vibrational entropy.
4. Bond Proportion Model
If two phases differ in their energies by ∆E and entropies by ∆S , these two phaseswill have the same free energy (i.e., ∆F = ∆E − T c∆S = 0) at the criticaltemperature T c, determined by the condition ∆E = T c∆S . Now suppose that T chas been evaluated for the difference in configurational entropy alone. Calling itT conf
c , we have ∆E = T conf c ∆S conf . Now if, for the same ∆E , we add a difference
in vibrational entropy ∆S vib to the model, the critical temperature of the phasetransformation is changed to T conf+vib
c . In the classical limit, this new critical tem-perature is related to the critical temperature with configurational entropy alone as:T conf+vib
c (∆S conf + ∆S vib) = T conf c ∆S conf . There are handy methods for evaluating
∆E and ∆S conf for configurations of atoms on a lattice. A challenge is to determinehow ∆S vib depends on the configurations of atoms, so that a new critical tempera-ture can be obtained for a more complete model of a phase transformation of atomson a lattice.
The vibrational entropy of phase transformations depends on changes in bondstiffnesses (force constants), so a natural first approach to estimate the vibrational
entropy of a phase transformation is to count the different types of bonds betweenneighboring atoms, and how they change after a phase transformation. With a littlerisk, the accounting can be confined to first-nearest-neighbors (1NN), and with morerisk we can associate the stronger bonds with the stiffer springs. This reasoning isenough to explain qualitatively the effects of vibrational entropy on the critical tem-perature, where a disordered phase at high temperatures transforms upon coolingto either an unmixed or ordered structure. The disordered phase has more bondsthat are energetically unfavorable, and therefore weaker springs between atoms. A
8/13/2019 Vibrational Thermodynamics
http://slidepdf.com/reader/full/vibrational-thermodynamics 18/145
14 B. Fultz
disordered phase is expected to have the larger vibrational entropy, increasing itsrelative stability. The critical temperature for disordering is therefore expected todecrease when vibrational entropy is added to the configurational entropy, and thisis the usual case for real alloys. Assigning a fixed stiffness to a particular type of
chemical bond, and counting these bonds, is called the “bond proportion model.” Ithas a long history [9, 24, 25, 26, 27, 28].
Unfortunately, for quantitative predictions of the vibrational entropies of alloyphases, the bond proportion model is rarely adequate. Local atomic configurationsalter the bond stiffnesses of atom pairs, and Section 5 discusses such effects parame-terized by bond lengths and materials chemistry. Chemical effects are also discussedin Sections 18-20, including effects of temperature.
4.1. Bond Proportion Model and Unmixing on the Ising Lattice
Consider a binary alloy with atom species A and B arranged randomly on thesites of a crystal. The concentration of B-atoms is c, and the concentration of A-
atoms is 1 − c. The crystal has N sites, and therefore a number cN of B-atoms and(1 − c)N of A-atoms. Each site is surrounded by z sites as first-nearest-neighbors(1NN). For simplicity, we make the “point approximation,” and assume that thechemical potential of an atom on a site depends on only the average occupancy of its neighboring sites. For a specified overall composition, we obtain thermodynamicfunctions with only knowledge of the species of atom on each site.
To obtain the total energy of an alloy configuration, we count the number of 1NNpairs: A-A, B-B, (A-B = B-A), each with energy eAA, eBB, eAB. For a random solidsolution, on average each A-atom is surrounded by zc B-atoms, and its other (1−c)zneighbors are A-atoms. Attributing all of the energy of the average A-atom, eA, toits 1NN chemical environment
eA = z
2 (1 − c) eAA + z
2 c eAB , (40)
eB = z
2(1 − c) eAB +
z
2c eBB , (41)
(and likewise for the average B-atom energy, eB). The division by 2 corrects forthe double-counting that occurs when performing the average by summing over allatoms in the crystal (because the bonds from the neighbor atoms back to our centralatom are counted again). The energies eA and eB also include the vibrational energyof the A- and B-atoms, which is 3kBT in the classical limit. Since this is the samefor both types of atoms, however, it does not affect the present analysis of phasetransformations on an Ising lattice.
We define the “interchange energy”
V ≡ (eAA + eBB − 2eAB)/4 . (42)
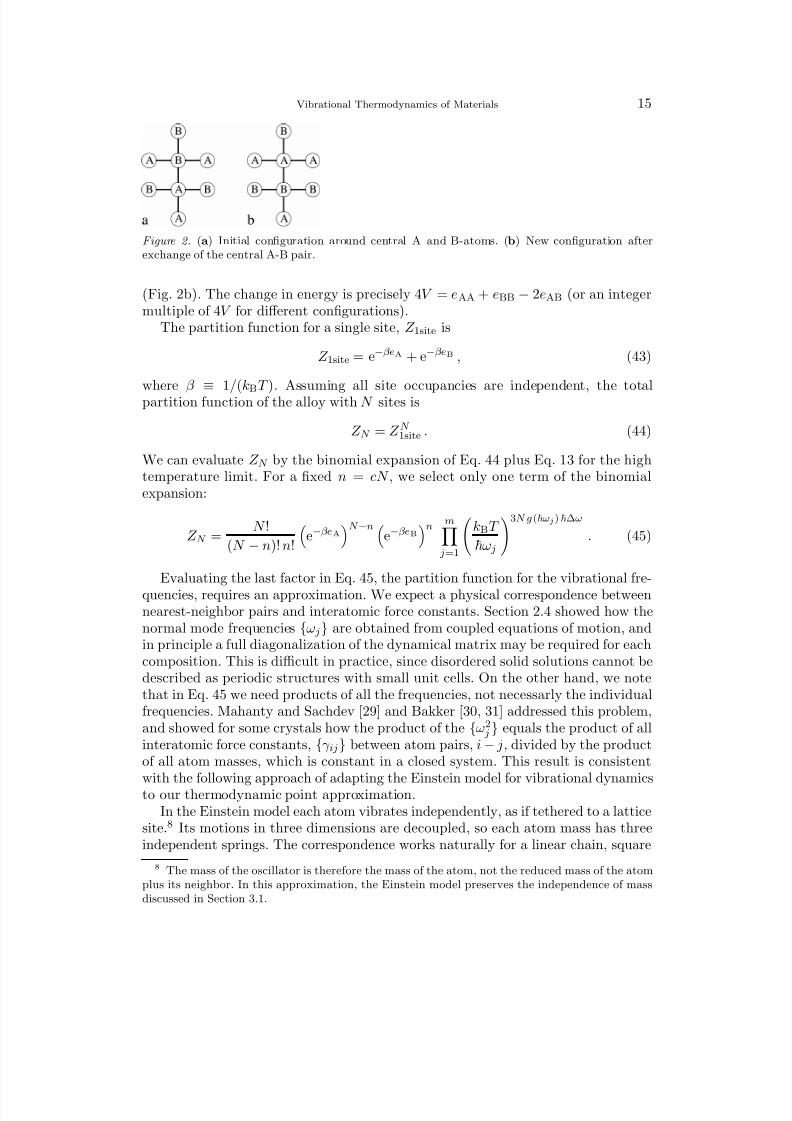
The physical meaning of V is made clear when we consider the interchange of an A-B pair as shown in Fig. 2. For the initial configuration of the central A and B-atomsin Fig. 2a, we count 5 A-B pairs, 1 A-A pair, and 1 B-B pair. After interchange of only the central A and B-atoms,7 we have 3 A-B pairs, 2 A-A pairs, and 2 B-B pairs
7 Note that this interchange conserves the total number of atoms of each type.
8/13/2019 Vibrational Thermodynamics
http://slidepdf.com/reader/full/vibrational-thermodynamics 19/145
Vibrational Thermodynamics of Materials 15
Figure 2. (a) Initial configuration around central A and B-atoms. (b) New configuration afterexchange of the central A-B pair.
(Fig. 2b). The change in energy is precisely 4V = eAA + eBB − 2eAB (or an integermultiple of 4V for different configurations).
The partition function for a single site, Z 1site is
Z 1site = e−βeA + e−βeB , (43)
where β ≡ 1/(kBT ). Assuming all site occupancies are independent, the totalpartition function of the alloy with N sites is
Z N = Z N 1site . (44)
We can evaluate Z N by the binomial expansion of Eq. 44 plus Eq. 13 for the hightemperature limit. For a fixed n = cN , we select only one term of the binomialexpansion:
Z N = N !
(N − n)! n!
e−βeA
N −n e−βeB
n m j=1
kBT
ω j
3N g ( ωj) ∆ω
. (45)
Evaluating the last factor in Eq. 45, the partition function for the vibrational fre-quencies, requires an approximation. We expect a physical correspondence betweennearest-neighbor pairs and interatomic force constants. Section 2.4 showed how thenormal mode frequencies ω j are obtained from coupled equations of motion, andin principle a full diagonalization of the dynamical matrix may be required for eachcomposition. This is difficult in practice, since disordered solid solutions cannot bedescribed as periodic structures with small unit cells. On the other hand, we notethat in Eq. 45 we need products of all the frequencies, not necessarly the individualfrequencies. Mahanty and Sachdev [29] and Bakker [30, 31] addressed this problem,and showed for some crystals how the product of the ω2
j equals the product of allinteratomic force constants, γ ij between atom pairs, i − j, divided by the productof all atom masses, which is constant in a closed system. This result is consistent
with the following approach of adapting the Einstein model for vibrational dynamicsto our thermodynamic point approximation.In the Einstein model each atom vibrates independently, as if tethered to a lattice
site.8 Its motions in three dimensions are decoupled, so each atom mass has threeindependent springs. The correspondence works naturally for a linear chain, square
8 The mass of the oscillator is therefore the mass of the atom, not the reduced mass of the atomplus its neighbor. In this approximation, the Einstein model preserves the independence of massdiscussed in Section 3.1.
8/13/2019 Vibrational Thermodynamics
http://slidepdf.com/reader/full/vibrational-thermodynamics 20/145
16 B. Fultz
lattice, or simple cubic lattice, for which each atom is associated with 1, 2, or 3interatomic springs, with a frequency ωij that depends on the 1NN pair of atoms, iand j . For a simple cubic lattice with z = 6, each atom has z/2 neighbors (bonds arenot overcounted), and z/2 springs (normal modes are not overcounted). When the
coordination number z is not the same as 2D, where D is the number of dimensions,we correct the mode counting with the ratio η = 2D/z, which is 1/2 for an fcc crystal,for example. The vibrational factors in Eq. 45 now include only the frequenciesωAA, ωBB, ωAB. Their exponents for the numbers of modes are replaced by thenumbers of bonds of types A-B, A-A, B-B, adjusted to conserve modes, i.e., ηN AB,ηN AA, ηN BB, giving
Z N (c) ≃
N !
(N − n)! n!
e−βeA
N −n e−βeB
n
×
kBT
ωAB
ηN AB kBT
ωAA
ηN AA kBT
ωBB
ηN BB
. (46)
To obtain N AA for a random solid solution, we consider the average number of A-atom neighbors of an A-atom to be (1 − c)z, so:
N AA = (1 − c)2 zN
2 , (47)
where dividing by 2 avoids double-counting. Likewise, N BB = c2zN /2 and N AB =c(1 − c)zN (where we add A-B and B-A bonds together).
Obtaining the Helmholtz free energy from the expression F (c) = −kBT ln Z (c),and using the Stirling approximation ln(x!) ≃ x ln x − x, we obtain from Eq. 46
F (c) = E conf (c) − T
S conf (c) + S vib(c)
, (48)
where:
E conf (c) =
eAA + 2c(eAB − eAA) + c2(4V ) zN
2 , (49)
S conf (c) = −kB
c ln c + (1 − c)ln(1 − c)
N , (50)
S vib(c) = kB
LAA + 2c(LAB − LAA) + c2(LAA + LBB − 2LAB)
zηN
2 , (51)
S vib(c) = kB
ln
kBT
ωAA+ 2c ln
ωAA
ωAB+ c2 ln
ω2AB
ωAAωBB
DN . (52)
Here E conf (c), S conf (c) and S vib(c) are the configurational energy, configurationalentropy, and vibrational entropy of the random alloy. In Eq. 51 factors were defined
such as LAB ≡ ln(kBT /( ωAB)). In the classical limit of the Planck distribution,n(εAB, T ) of Eq. 7, this LAB is the logarithm of the number of phonons of frequencyωAB. Additionally, kBLAB is the vibrational entropy of an oscillator of frequencyωAB, Eq. 10 in the classical limit. Equations 49 and 51 show that E conf (c) andS vib(c) have identical quadratic forms in c, reflecting the energies or interatomic forceconstants of nearest-neighbor bonds in the point (Bragg–Williams) approximation.
For chemical unmixing we consider the case where V < 0 (from Eq. 42 thismeans that the average of A-A and B-B pairs is more favorable, i.e., their energies
8/13/2019 Vibrational Thermodynamics
http://slidepdf.com/reader/full/vibrational-thermodynamics 21/145
Vibrational Thermodynamics of Materials 17
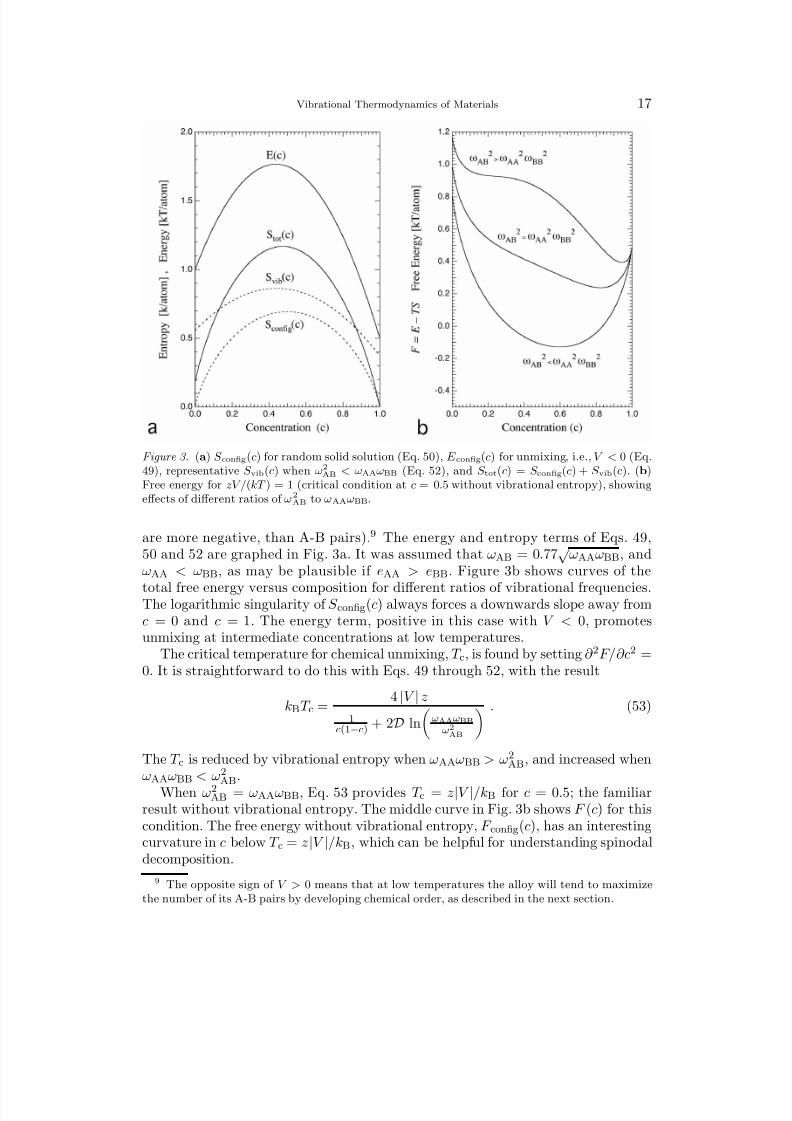
Figure 3. (a) S config(c) for random solid solution (Eq. 50), E config(c) for unmixing, i.e., V < 0 (Eq.49), representative S vib(c) when ω2
AB < ωAAωBB (Eq. 52), and S tot(c) = S config(c) + S vib(c). (b)Free energy for zV /(kT ) = 1 (critical condition at c = 0.5 without vibrational entropy), showingeffects of different ratios of ω2
AB to ωAAωBB.
are more negative, than A-B pairs).9 The energy and entropy terms of Eqs. 49,50 and 52 are graphed in Fig. 3a. It was assumed that ωAB = 0.77
√ ωAAωBB, and
ωAA < ωBB, as may be plausible if eAA > eBB. Figure 3b shows curves of the
total free energy versus composition for different ratios of vibrational frequencies.The logarithmic singularity of S config(c) always forces a downwards slope away fromc = 0 and c = 1. The energy term, positive in this case with V < 0, promotesunmixing at intermediate concentrations at low temperatures.
The critical temperature for chemical unmixing, T c, is found by setting ∂ 2F/∂c2 =0. It is straightforward to do this with Eqs. 49 through 52, with the result
kBT c = 4 |V | z
1c(1−c) + 2D ln
ωAAωBB
ω2AB
. (53)
The T c is reduced by vibrational entropy when ωAAωBB > ω2AB, and increased when
ωAAωBB < ω2
AB
.When ω2
AB = ωAAωBB, Eq. 53 provides T c = z|V |/kB for c = 0.5; the familiarresult without vibrational entropy. The middle curve in Fig. 3b shows F (c) for thiscondition. The free energy without vibrational entropy, F config(c), has an interestingcurvature in c below T c = z|V |/kB, which can be helpful for understanding spinodaldecomposition.
9 The opposite sign of V > 0 means that at low temperatures the alloy will tend to maximizethe number of its A-B pairs by developing chemical order, as described in the next section.
8/13/2019 Vibrational Thermodynamics
http://slidepdf.com/reader/full/vibrational-thermodynamics 22/145
18 B. Fultz
When ω2AB = ωAAωBB, S vib(c) is a quadratic function of c (Eq. 52), much like
E config(c).10
When ω 2AB < ωAAωBB, the vibrational entropy term −T S vib(c) effectively dimin-
ishes E config(c), reducing T c.
When ω2AB > ωAAωBB, T c is raised and the whole unmixing phase bound-ary moves to higher temperatures. If ω2
AB exp(−2/3) > ωAAωBB (approximately0.513 ω2
AB > ωAAωBB), disordering cannot occur at any temperature at c = 0.5.For yet larger ω2
AB with respect to ωAAωBB, the entropy of mixing quickly becomesnegative for intermediate compositions, suppressing disordering. A negative entropyof mixing has been observed in alloys of V-Pt at surprisingly low concentrations of Pt (see Sect. 20.3.2).
4.2. Bond Proportion Model and Ordering on the Ising Lattice
For chemical ordering, we consider the case V > 0 of Eq. 42, where the energeticstends to maximize the number of A-B pairs at low temperatures. At high tempera-
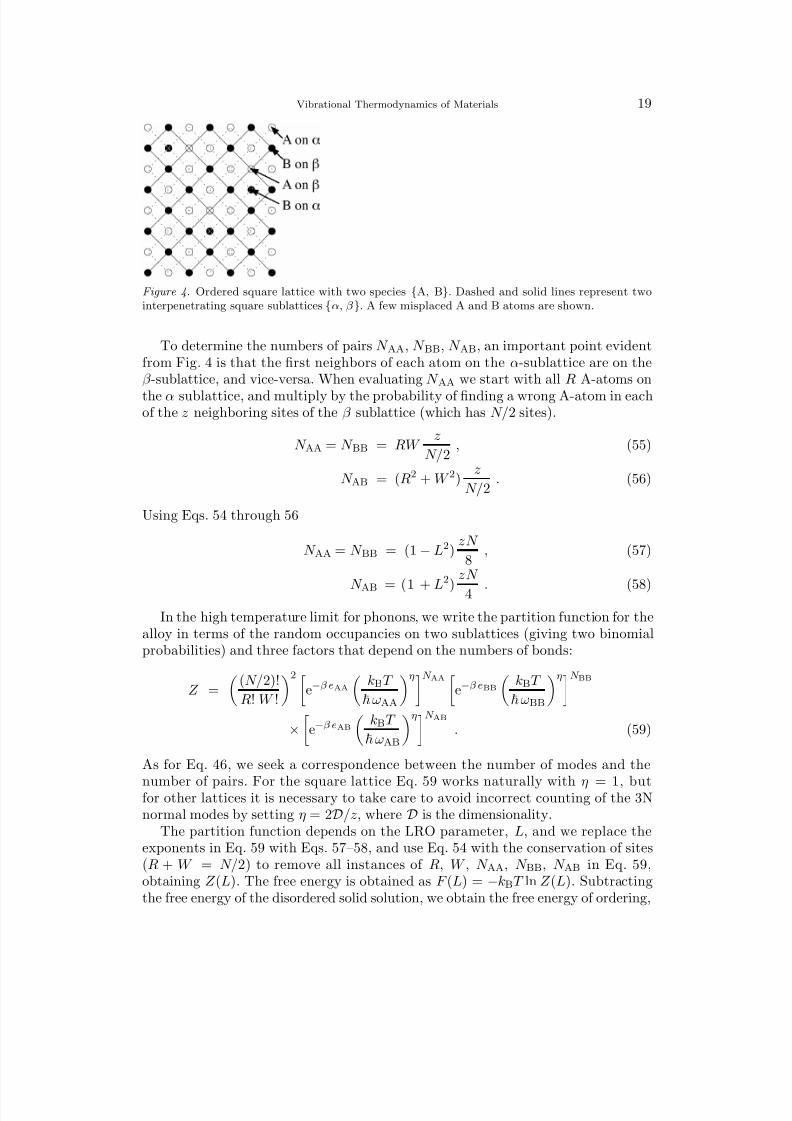
tures, we expect this alloy to become a random solid solution if the configurationalentropy is dominant. For illustration of an ordering transformation we choose anequiatomic A-B alloy on the square lattice shown in Fig. 4. Figure 4 identifies theα- and β -sublattices, each having N/2 sites for a crystal with N sites. Finite tem-peratures favor some disorder in the structure – putting a few atoms on the wrongsublattice gives a big increase in the configurational entropy,11 driving some mixingof A-atoms onto the β -sublattice, in exchange for B-atoms on the α-sublattice.
Figure 4 motivates the definition of four types of sublattice concentration vari-
ables: N αA, N β A, N αB , N β
B, where for example N αA is the number of A-atoms on theα sublattice. For an equiatomic alloy, by conservation of atoms and conservation
of sublattice sites, N αA = N β B ≡ R, where R denotes atoms that are on the “right”
sublattice, and N
β
A = N
α
B ≡ W , denoting “wrong” atoms. The sublattice concen-trations are used to define a “long-range order” (LRO) parameter, L, for the alloy[32, 33, 34]
L ≡ R − W
N/2 . (54)
This L can range from −1 < L < 1. The case of L = 1 corresponds to perfect orderwhere R = N/2 and W = 0. The disordered alloy has as many right as wrong atomson each sublattice, i.e., R = W , so L = 0 for a disordered alloy.
Analogous to the assumption of a random solid solution, we assume that theatoms are placed randomly on a sublattice, e.g., the N αA A-atoms have no preferencefor any site on the α-sublattice, irrespective of the presence of A-atoms or B-atoms
on neighboring sites. This is the “point” or “Bragg–Williams” approximation. Thestrength of this approximation is that it makes it easy to count the bonds betweenthe different species of atoms.
10 A simple approximation is that the strengths of the bonds and spring constants are propor-tional, giving S vib(c) the same shape as E config(c). This is conceptually convenient, and drove someearly studies, but it has weak predictive power.11 The entropy has a logarithmic singularity in sublattice concentrations analogous to the
concentration dependence of Eq. 50 near c = 0.
8/13/2019 Vibrational Thermodynamics
http://slidepdf.com/reader/full/vibrational-thermodynamics 23/145
Vibrational Thermodynamics of Materials 19
Figure 4. Ordered square lattice with two species A, B. Dashed and solid lines represent twointerpenetrating square sublattices α, β . A few misplaced A and B atoms are shown.
To determine the numbers of pairs N AA, N BB, N AB, an important point evidentfrom Fig. 4 is that the first neighbors of each atom on the α-sublattice are on theβ -sublattice, and vice-versa. When evaluating N AA we start with all R A-atoms on
the α sublattice, and multiply by the probability of finding a wrong A-atom in eachof the z neighboring sites of the β sublattice (which has N/2 sites).
N AA = N BB = RW z
N/2 , (55)
N AB = (R2 + W 2) z
N/2 . (56)
Using Eqs. 54 through 56
N AA = N BB = (1 − L2) zN
8 , (57)
N AB = (1 + L2
)
zN
4 . (58)
In the high temperature limit for phonons, we write the partition function for thealloy in terms of the random occupancies on two sublattices (giving two binomialprobabilities) and three factors that depend on the numbers of bonds:
Z =
(N/2)!
R! W !
2 e−β eAA
kBT
ωAA
ηN AA e−β eBB
kBT
ωBB
ηN BB
×
e−β eAB
kBT
ωAB
ηN AB
. (59)
As for Eq. 46, we seek a correspondence between the number of modes and the
number of pairs. For the square lattice Eq. 59 works naturally with η = 1, butfor other lattices it is necessary to take care to avoid incorrect counting of the 3Nnormal modes by setting η = 2D/z, where D is the dimensionality.
The partition function depends on the LRO parameter, L, and we replace theexponents in Eq. 59 with Eqs. 57–58, and use Eq. 54 with the conservation of sites(R + W = N/2) to remove all instances of R, W , N AA, N BB, N AB in Eq. 59,obtaining Z (L). The free energy is obtained as F (L) = −kBT ln Z (L). Subtractingthe free energy of the disordered solid solution, we obtain the free energy of ordering,
8/13/2019 Vibrational Thermodynamics
http://slidepdf.com/reader/full/vibrational-thermodynamics 24/145

8/13/2019 Vibrational Thermodynamics
http://slidepdf.com/reader/full/vibrational-thermodynamics 25/145
Vibrational Thermodynamics of Materials 21
β
∆S vibr = 1/2 ln|Bα| |M β |
|M α
| |Bβ
|
, (63)
where the determinant of the mass matrix M is the product of the atomic masses,and undergoes no change with ordering. The force constant matrix is B . In the caseof a simple cubic A-B alloy with first-neighbor interatomic forces γ AA, γ BB, γ AB,the resulting critical temperature is
kBT c = zV
1 + z8 ln
γ 2
ABγ AAγ BB
, (64)
in agreement with Eq. 62 because γ ∼ ω2M .Tuijn and Bakker [35, 36] computed the effects of vibrational entropy on the
heat capacity of a three-dimensional crystal by counting the number of A-B pairs
in a Monte Carlo simulation. Tuijn’s results are shown in Fig. 5 for various valuesof ∆ ≡ γ AB/[γ AAγ BB]−1/2. As expected, with ∆ > 1, and hence stiffer vibrationsin the ordered phase, the critical temperature is reduced. The critical temperatureis reduced by approximately a factor of 1.8 when ∆ = 2. The transformation stillappears to be continuous, i.e., second order, although the singularity is rounded bythe finite size of the lattice used in the simulations. Figure 5 shows that the moreaccurate Monte Carlo simulations predict a lower T c than Eq. 64, a well-knownresult without vibrational entropy. The relative sensitivity to ∆ is also different forthe Bragg–Williams and Monte Carlo results, however. The best agreement betweena rescaled Eq. 64 and Fig. 5 is found for z = 9, rather than 6. Tuijn and Bakker alsoexplored the effects of second nearest-neighbor interatomic forces and non-centralforces. The heat capacities were similar to those of the simple cubic lattice withfirst-neighbor interactions, except when ∆ ≫ 2.
5. Bond-Stiffness-versus-Bond-Length Model
5.1. Phonon Frequencies and Bond Lengths
The bond proportion model just described, which counts the different types of atompairs, has a deficiency that is easy to understand. The bond lengths between pairs of atoms are different in different structures, and the stiffnesses of a bond is sensitiveto the length of the bond.13 Counting the proportions of atom pairs is importantwhen comparing the vibrational entropies of two different structures, but it is alsoimportant to know how each bond stiffness changes with bond length.
Consider a disordered solid solution with a distribution of interatomic distances,shorter and longer than optimal, owing to the different atomic sizes. The calculationof these distances is not simple because the relaxations in position for each atomdepend in turn on the relaxations of its neighbors. Nevertheless, we can estimate
13 This same characteristic of the interatomic potential also gives rise to quasiharmonic theory,where interatomic forces weaken with thermal expansion.

8/13/2019 Vibrational Thermodynamics
http://slidepdf.com/reader/full/vibrational-thermodynamics 26/145
22 B. Fultz
Figure 5. Heat capacity at constant volume for harmonic solids with different ratios of ∆, as afunction of −T /v ≡ T /2V in the present notation. B.W. denotes Bragg–Williams approximation.After [37].
the size of this effect on phonon frequencies. The Gruneisen parameter γ is definedas:
γ ≡ −V
ω
∂ω
∂V , (65)
where ω is the phonon frequency and V is volume. Recognizing that V ∝ r3 andω ∝ √
ks, where ks is an interatomic force constant
6γ = − r
ks
∂ks
∂r . (66)
There is no universal value for a Gruneisen parameter, but typically γ ≃ 2. Inthis case, Eq. 66 predicts that if the interatomic distance changes by +1%, theinteratomic force changes by –12%. This is a major effect. A change in interatomicdistance of +10% could cause the interatomic force to be lost entirely.
Grimvall and co-workers [38] correlated the interatomic forces of 8 alkali halides
with the NaCl structure to their volume per atom in the crystal structure. (Theinteratomic forces were deduced from the bulk moduli.) The interatomic forcesdecreased approximately inversely with atomic volume per atom as ks = 1300/V where the force (spring) constant ks has units of N/m and V has units of 10−30 m3.Fernandez Guillermet and Grimvall sought similar trends in vanadium and titaniumcompounds with oxygen, nitrogen, and carbon [39]. The trend in this case was arapid increase in the ks with V , and there was a significantly different slope for the
8/13/2019 Vibrational Thermodynamics
http://slidepdf.com/reader/full/vibrational-thermodynamics 27/145
Vibrational Thermodynamics of Materials 23
titanium and vanadium compounds. Evidently the differences between these transi-tion metal compounds are too large for a systematic relationship between kS and V ,even though these also had the NaCl structure. Grimvall and Fernandez-Guillermetcorrelated the thermodynamic Debye temperature to the averaged mass and volume
of a series of sp3-bonded compounds with the sphalerite (ZnS) structure [40]. Thecorrelation included InSb, GaP, GaAs, and the elements Si, Ge, and Sn were addedto the plot. They found a relationship of the form Θ D [K]= 1500 a−1M −1/2 [nm−1
(at.wt.)−1/2] (where, for example ΘD = 600 K corresponds to a−1M −1/2 = 0.4 inthese units). Adding volume differences to these types of correlations for differentcompounds having the same structure accommodates somewhat their differences inbonding and bond stiffness. Suggestions that there should be a correlation betweeninteratomic forces and atomic volume, assuming sufficient similarity in chemistryand structure of the compounds, have been around for many years [41].
Quantitative analyses of the effects of bond length on bond stiffnesses were per-formed by Sluiter, et al. on Al-Li [42] and by van de Walle and Ceder on Pd-V [43].They tested the idea of transferring interatomic forces from one material to another,with the goal of predictive power without major calculations or measurements onevery material. There is some subtlety to the concept of transferrability of forceconstants because different crystal structures have different sets of allowed tensorialforce constants. Force constants must be identically zero if symmetry operationsof the crystal transform them into their negatives. Different symmetry operationsfor different crystal structures therefore make it difficult to transfer tensorial forceconstants from one structure to another. This is not a problem for axial force models,which involve a central-force “stretching” force and a “bending” force, and axialforce models often give adequate descriptions of lattice dynamics. In the “bond-stiffness-versus-bond-length” approach, only first-nearest-neighbor (1NN) bonds aretransferred between different structures [9, 44]. It is also observed that only the
stretching (longitudinal) forces between atoms have a significant dependence on thebond length. The bond bending forces are found to be smaller and less dependenton bond length.
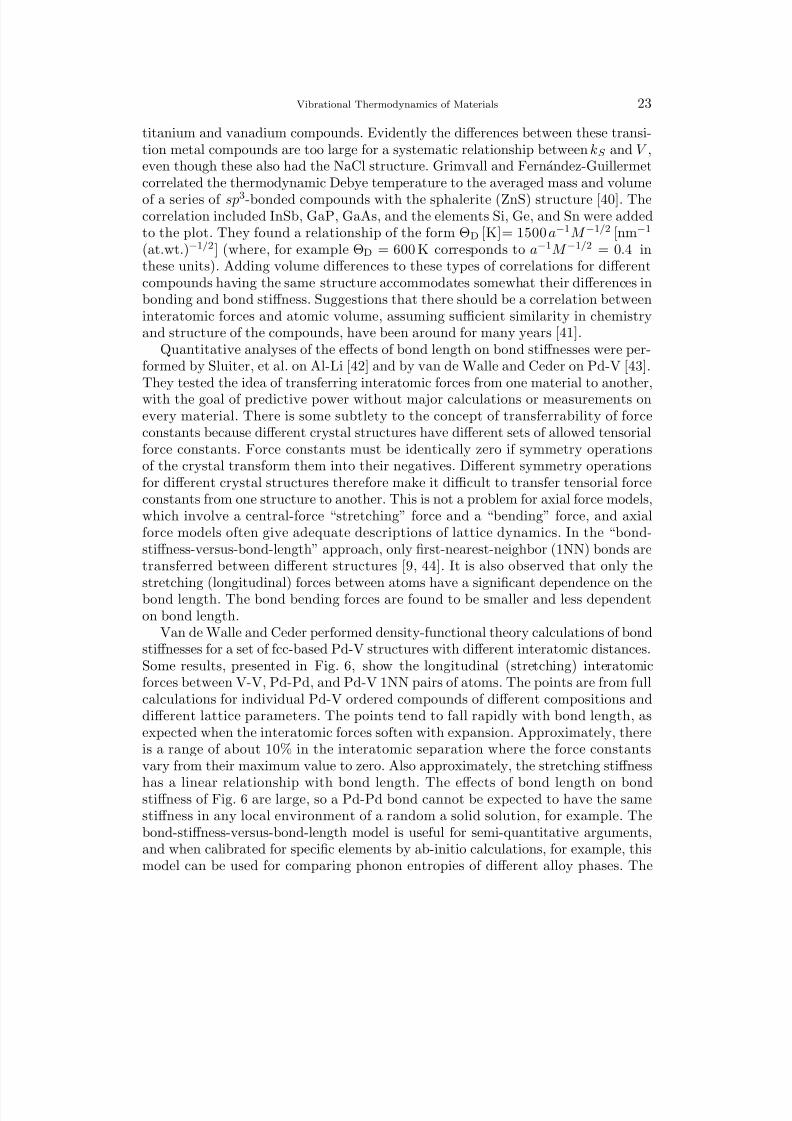
Van de Walle and Ceder performed density-functional theory calculations of bondstiffnesses for a set of fcc-based Pd-V structures with different interatomic distances.Some results, presented in Fig. 6, show the longitudinal (stretching) interatomicforces between V-V, Pd-Pd, and Pd-V 1NN pairs of atoms. The points are from fullcalculations for individual Pd-V ordered compounds of different compositions anddifferent lattice parameters. The points tend to fall rapidly with bond length, asexpected when the interatomic forces soften with expansion. Approximately, thereis a range of about 10% in the interatomic separation where the force constantsvary from their maximum value to zero. Also approximately, the stretching stiffness
has a linear relationship with bond length. The effects of bond length on bondstiffness of Fig. 6 are large, so a Pd-Pd bond cannot be expected to have the samestiffness in any local environment of a random a solid solution, for example. Thebond-stiffness-versus-bond-length model is useful for semi-quantitative arguments,and when calibrated for specific elements by ab-initio calculations, for example, thismodel can be used for comparing phonon entropies of different alloy phases. The

8/13/2019 Vibrational Thermodynamics
http://slidepdf.com/reader/full/vibrational-thermodynamics 28/145
24 B. Fultz
Figure 6. Stretching terms of the nearest-neighbor force constants as a function of bond length of
Pd-V alloys. Each point corresponds to one type of bond in one of a set of fcc crystal structures of different volumes. After [43].
bond-stiffness-versus-bond-length model would reduce to the bond proportion modelif there were no variation of bond stiffness with interatomic distance.
5.2. Extending the Bond Proportion Model
Consider how a bond-stiffness-versus-bond-length relationship alters the free energy(Eq. 60) and the critical temperature (Eq. 62) of the bond proportion model forordering transformations. The free energy F (L) of Eq. 60 is with reference to thedisordered solid solution, and is zero for L = 0 (i.e., F (0) = 0). Consider again the
case of B1 ordering (NaCl prototype) of an AB alloy on a simple cubic lattice, asdiscussed following Eq. 62. In this structure, all 1NN bonds are between A-B pairs,and there is only one bond length. It is the disordered solid solution where thedistortions of bond lengths occur. This is a complex problem owing to the differentrelaxations in the different local environments. We can get to the essence of theproblem by using the same Gruneisen parameter for all bonds (Eq. 65), and bysimplifying the three curves of Fig. 6 by assuming that the bond stiffnesses arezero at the same bond lengths for A-A, B-B, and A-B pairs. In this case, all threefrequencies ωAA, ωBB, ωAB change with volume as:
ωij = ω0ij
1 − γ
δV
V 0
, (67)
where the superscript 0 denotes a reference value for the ordered structure. For smallδV/V 0
ln(ωij ) ≃ ln(ω0ij ) − γ
δV
V 0 . (68)
To the free energy of Eq. 60 we add the term
−T S Gruen = kBT (1 − L2) DN γ δV
V 0 , (69)
8/13/2019 Vibrational Thermodynamics
http://slidepdf.com/reader/full/vibrational-thermodynamics 29/145
Vibrational Thermodynamics of Materials 25
which vanishes when L = 1, but grows with disorder as the number of R-W pairsincreases as 1 − L2. The critical temperature of Eq. 62 becomes:
kBT c = zV
1 + 2Dγ δV V 0 + D
2 ln
ω2AB
ωAAωBB
. (70)
Consider a typical case where the disordered phase has a lattice parameter 1%larger than the ordered phase (so δV /V 0 ≃ 0.03). Assuming γ = 2, the secondterm in the denominator of Eq. 70 is +0.36. The critical temperature is suppressedsubstantially when the average bond length in the disordered solid solution is 1%longer than for the ordered phase.14 Because we assumed the same Gruneisen pa-rameter for all bonds, this effect of bond stiffness versus bond length is independentof the effect on T c from stiffness differences of the different pairs of atoms. In a morecomplete treatment these effects are inter-related.
5.3. Chemical Effects on Bond Stiffness
A closer examination of Fig. 6 shows that the bond stiffnesses for V-V and Pd-Vpairs have considerable scatter about the linear fit. Some of this can be accountedfor by a dependence of bond stiffness on chemical composition (discussed furtherin Sect. 20.1). For example, the addition of B atoms to a host crystal of element Awill fill or deplete the electronic band structure of A, causing changes in the densityof electron states at the Fermi level. The electron screening of the A-ion cores isthereby altered, changing the bond stiffnesses of A-A pairs. Such effects may scalewith the electronegativity difference between A and B atoms, and features of theelectronic structure such as the density of states at the Fermi level. These chemicaleffects are probably less significant for alloys of isoelectronic elements.
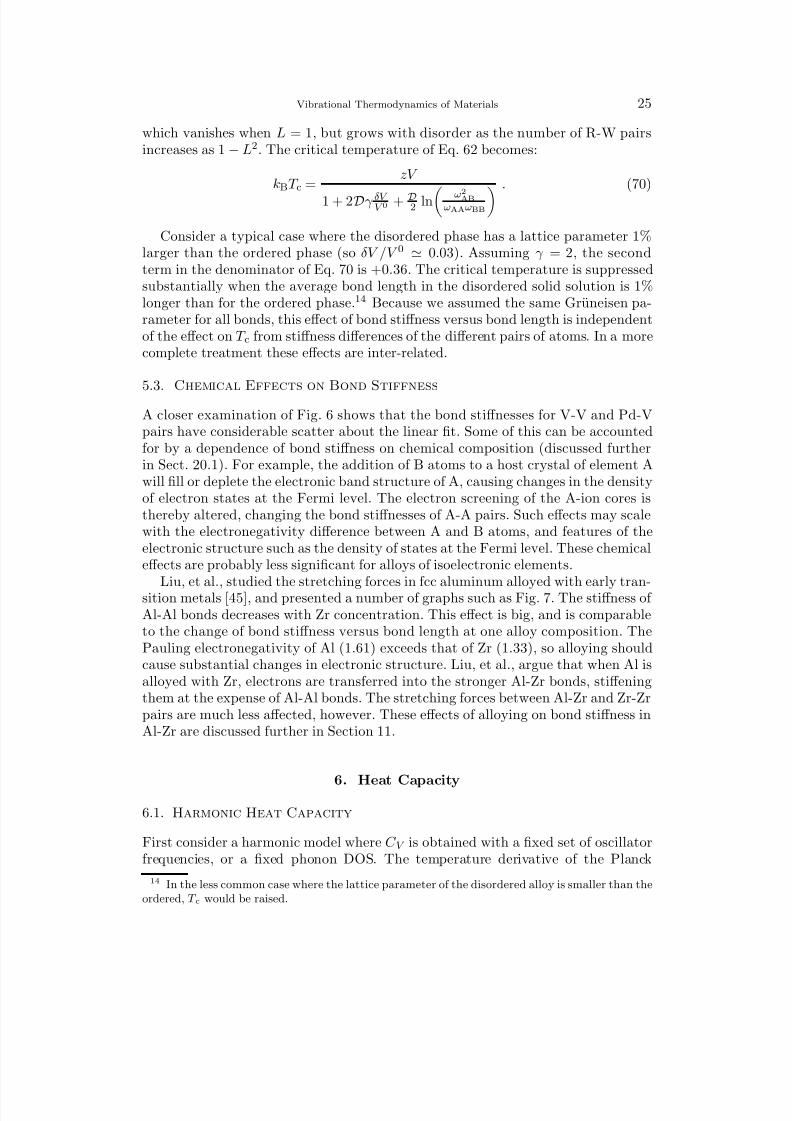
Liu, et al., studied the stretching forces in fcc aluminum alloyed with early tran-sition metals [45], and presented a number of graphs such as Fig. 7. The stiffness of Al-Al bonds decreases with Zr concentration. This effect is big, and is comparableto the change of bond stiffness versus bond length at one alloy composition. ThePauling electronegativity of Al (1.61) exceeds that of Zr (1.33), so alloying shouldcause substantial changes in electronic structure. Liu, et al., argue that when Al isalloyed with Zr, electrons are transferred into the stronger Al-Zr bonds, stiffeningthem at the expense of Al-Al bonds. The stretching forces between Al-Zr and Zr-Zrpairs are much less affected, however. These effects of alloying on bond stiffness inAl-Zr are discussed further in Section 11.
6. Heat Capacity
6.1. Harmonic Heat Capacity
First consider a harmonic model where C V is obtained with a fixed set of oscillatorfrequencies, or a fixed phonon DOS. The temperature derivative of the Planck
14 In the less common case where the lattice parameter of the disordered alloy is smaller than theordered, T c would be raised.
8/13/2019 Vibrational Thermodynamics
http://slidepdf.com/reader/full/vibrational-thermodynamics 30/145
8/13/2019 Vibrational Thermodynamics
http://slidepdf.com/reader/full/vibrational-thermodynamics 31/145
Vibrational Thermodynamics of Materials 27
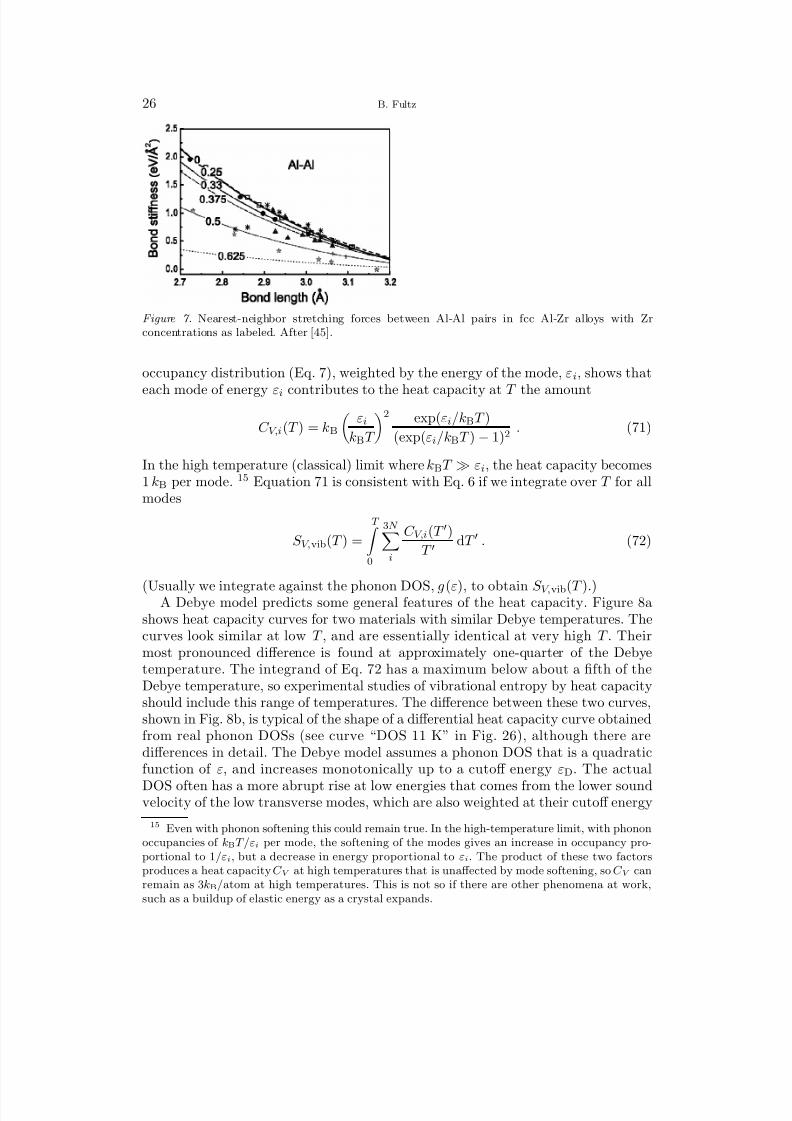
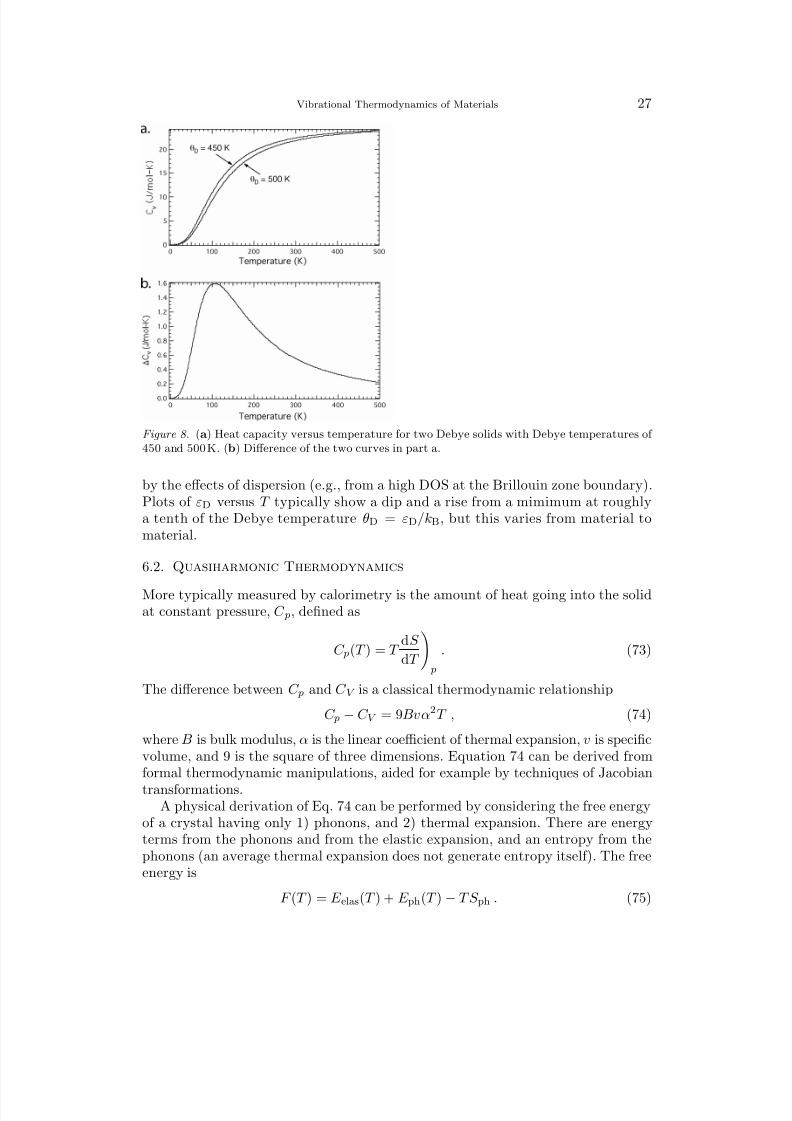
Figure 8. (a) Heat capacity versus temperature for two Debye solids with Debye temperatures of 450 and 500 K. (b) Difference of the two curves in part a.
by the effects of dispersion (e.g., from a high DOS at the Brillouin zone boundary).Plots of εD versus T typically show a dip and a rise from a mimimum at roughlya tenth of the Debye temperature θD = εD/kB, but this varies from material tomaterial.
6.2. Quasiharmonic Thermodynamics
More typically measured by calorimetry is the amount of heat going into the solidat constant pressure, C p, defined as
C p(T ) = T dS
dT
p
. (73)
The difference between C p and C V is a classical thermodynamic relationship
C p − C V = 9Bvα2T , (74)
where B is bulk modulus, α is the linear coefficient of thermal expansion, v is specificvolume, and 9 is the square of three dimensions. Equation 74 can be derived fromformal thermodynamic manipulations, aided for example by techniques of Jacobian
transformations.A physical derivation of Eq. 74 can be performed by considering the free energy
of a crystal having only 1) phonons, and 2) thermal expansion. There are energyterms from the phonons and from the elastic expansion, and an entropy from thephonons (an average thermal expansion does not generate entropy itself). The freeenergy is
F (T ) = E elas(T ) + E ph(T ) − T S ph . (75)

8/13/2019 Vibrational Thermodynamics
http://slidepdf.com/reader/full/vibrational-thermodynamics 32/145
28 B. Fultz
The elastic energy of thermal expansion, using δV/V 0 = 3αT is
E elas = 1
2B
(δV )2
V 0,
E elas = 92
BV 0 α2T 2 , (76)
The phonon energy in the classical limit is
E ph(T ) = 3N kBT . (77)
In the high-temperature limit, the phonon entropy is (cf., Eq. 15)
S ph(T ) = kB
3N j
ln
kBT
ω j
. (78)
Using the same approach as Eq. 68 with ω j = ω0
j
(1−
γδV/V 0) and δV/V 0 = 3αT for the thermal expansion
S ph(T ) = kB
3N j
ln
kBT
ω0 j (1 − 3γαT )
, (79)
S ph(T ) =
kB
3N j
ln
kBT
ω0 j
+ 9NγαkBT , (80)
S ph(T ) = S 0ph(T ) + 9NγαkBT = S 0ph + S q , (81)
where the first term, S 0ph(T ), is the harmonic phonon entropy with phonon frequen-cies characteristic of T = 0, and unchanged with temperature. Using Eqs. 76, 77
and 81 in the free energy expression for the expanded crystal with phonons, Eq. 75
F (T ) = 9
2BV 0α2T 2 + 3NkBT − T S 0ph(T ) − 9NαγkBT 2 . (82)
First we obtain the equilibrium thermal expansion coefficient, α, by calculating
∂F (T )
∂α = 0 = 9BV 0αT 2 − 9NγkBT 2 ,
α = C V γ
3BV 0, (83)
where we have used the classical result C V = 3NkB.16 If the electronic entropy
depends on volume, an additional term, C elV γ el/(3BV 0) is added to the right-handside of Eq. 83.
Substituting Eq. 83 for the thermal expansion into 82 for the free energy
F (T ) = F 0(T ) − 9
2BV 0α2T 2 , (84)
16 The effect of phonon energy is small as discussed in Footnote 15, although there is also a smalleffect from a reduction in zero-point phonon energy as the solid expands.
8/13/2019 Vibrational Thermodynamics
http://slidepdf.com/reader/full/vibrational-thermodynamics 33/145
Vibrational Thermodynamics of Materials 29
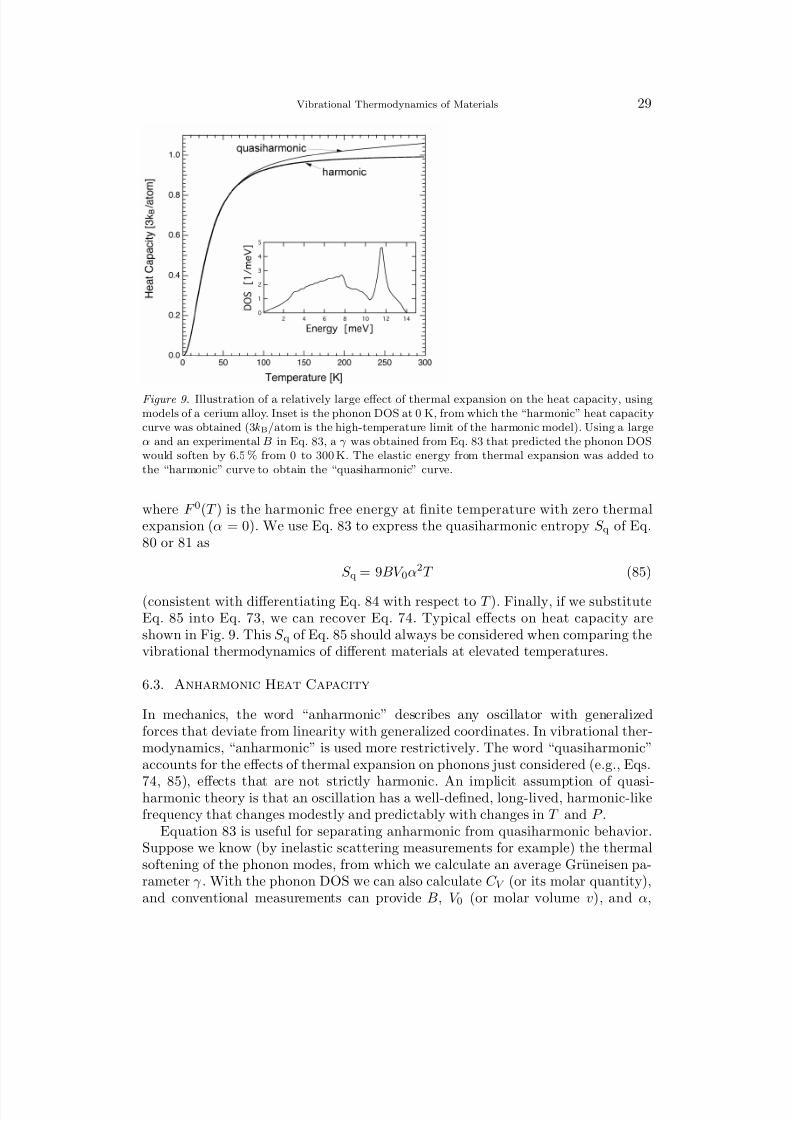
Figure 9. Illustration of a relatively large effect of thermal expansion on the heat capacity, usingmodels of a cerium alloy. Inset is the phonon DOS at 0 K, from which the “harmonic” heat capacitycurve was obtained (3kB/atom is the high-temperature limit of the harmonic model). Using a largeα and an experimental B in Eq. 83, a γ was obtained from Eq. 83 that predicted the phonon DOSwould soften by 6.5 % from 0 to 300 K. The elastic energy from thermal expansion was added tothe “harmonic” curve to obtain the “quasiharmonic” curve.
where F 0(T ) is the harmonic free energy at finite temperature with zero thermalexpansion (α = 0). We use Eq. 83 to express the quasiharmonic entropy S q of Eq.80 or 81 as
S q = 9BV 0α2T (85)
(consistent with differentiating Eq. 84 with respect to T ). Finally, if we substituteEq. 85 into Eq. 73, we can recover Eq. 74. Typical effects on heat capacity areshown in Fig. 9. This S q of Eq. 85 should always be considered when comparing thevibrational thermodynamics of different materials at elevated temperatures.
6.3. Anharmonic Heat Capacity
In mechanics, the word “anharmonic” describes any oscillator with generalizedforces that deviate from linearity with generalized coordinates. In vibrational ther-modynamics, “anharmonic” is used more restrictively. The word “quasiharmonic”accounts for the effects of thermal expansion on phonons just considered (e.g., Eqs.
74, 85), effects that are not strictly harmonic. An implicit assumption of quasi-harmonic theory is that an oscillation has a well-defined, long-lived, harmonic-likefrequency that changes modestly and predictably with changes in T and P .
Equation 83 is useful for separating anharmonic from quasiharmonic behavior.Suppose we know (by inelastic scattering measurements for example) the thermalsoftening of the phonon modes, from which we calculate an average Gruneisen pa-rameter γ . With the phonon DOS we can also calculate C V (or its molar quantity),and conventional measurements can provide B, V 0 (or molar volume v), and α,
8/13/2019 Vibrational Thermodynamics
http://slidepdf.com/reader/full/vibrational-thermodynamics 34/145
30 B. Fultz
accounting for all unknowns in Eq. 83. If Eq. 83 proves to be true with the γ measured from the phonon softening, we say that the solid is “quasiharmonic.”
Anharmonic behavior is identified as phonon softening or stiffening that is incon-sistent with the Gruneisen parameter γ needed for equality in Eq. 83. Anharmonicity
involves phenomena beyond those of independent phonons. Higher-order phonon-phonon interactions are the source of anharmonic behavior as discussed in Sect.18.2. Section 20 discusses electron-phonon interactions, which also vitiate Eq. 83.17
Substantial deviations from quasiharmonic behavior are known for Cr [47], V [48],Ce [49], Mo, W, Si, Ge [50], and anharmonic or non-quasiharmonic effects could beimportant in many other systems.
6.4. Thermodynamic Entropy
The temperature dependence of the entropy
dS (T, V )
dT =
∂S
∂T
V +
∂S
∂V
T
dV
dT (86)
contains harmonic, quasiharmonic, and anharmonic contributions, along with non-harmonic effects from electron-phonon interactions. For the harmonic part of thevibrational entropy we use Eq. 14, with a phonon DOS, g0(ε), from low temperaturemeasurement or calculation (ideally T = 0 K). The harmonic part contributes tothe first term on the right-hand-side of Eq. 86, i.e., ∂S/∂T )V . Harmonic phononsundergo no change in frequency with T or V . The temperature dependence of S h(T )originates with the Planck occupancy factors n(ε, T ).18
Quasiharmonic phonons have frequencies that depend on volume only, and makea contribution through the second term on the right-hand-side of Eq. 86. At a fixedvolume, however, they behave as harmonic oscillators. Their frequencies can changewith temperature, but only because thermal expansion alters the volume of the solid.
Anharmonic entropy, S a, may contribute to either of the two terms on the right-hand side of Eq. 86, but especially the first, a pure temperature-dependence of the vibrational entropy at fixed volume caused by changes in the interatomic forceconstants with temperature. Consider for example a quartic term in the interatomicpotential, which alters the force constants with larger thermal displacements. Thequartic term does not affect the thermal expansion, but it does change the phononfrequencies. It causes a type of “phonon-phonon interaction,” so called becausethe existence of phonons affects the energy to create new phonons, as discussedin Section 19. Other temperature-dependences of force constants at constant vol-ume may arise if the nature of the bonding changes as atoms are displaced further
from their equilibrium positions, or perhaps thermal excitations of electrons alterthe sensitivity of electronic energy to atom displacements (Sections 17, 18.3 and
17 It remains a challenge to differentiate between these sources of non-harmonic behavior [46],so sometimes the effects of electron-phonon interactions are called “anharmonic.” More often“anharmonic” is reserved for phonon-phonon interactions only.18 For harmonic solids at high temperatures, differences in the phonon DOS will cause a difference
in entropy for different phases, but this difference in entropy does not change with temperature.(At high T , S increases with T by the same amount for each phase.)
8/13/2019 Vibrational Thermodynamics
http://slidepdf.com/reader/full/vibrational-thermodynamics 35/145
Vibrational Thermodynamics of Materials 31
20 describe such effects from adiabatic electron-phonon interactions). The secondterm in Eq. 86 is associated with changes of the interatomic force constants withvolume. The quasiharmonic contribution is expected to account for most of it, butthe practice of using harmonic entropy expressions, while correct to first order [46],
is not fully verified. The cubic term associated with thermal expansion also shortensphonon lifetimes, causing energy spreads of phonon linewidths. This may not alterthe vibrational entropy to first order, but again the robustness of the harmonicapproximation is not fully tested.
Analogs exist for magnetic dependencies, as can originate from a coupling be-tween magnetic and vibrational degrees of freedom [51]. Invar behavior is an ex-perimental example, but perhaps this is best understood as a volume-dependentelectronic transition rather than a magnetic one [52, 53, 54].
7. Calorimeters
The word “calorimeter” covers a broad scope of instruments for measuring largeor small transfers of heat to samples at low or high temperatures. From thesemeasurements heat capacity can be determined, or heats of phase transformationsor chemical reactions in the sample can be found. 19 Phase transformations andchemical reactions may involve changes in configurational entropy, however, so forisolating vibrational entropy it is usually better to measure heat capacity data atlower temperatures where no changes in local atomic arrangements are underway.(An exception is the martensitic transformation discussed in Sect. 15.)
Adiabatic calorimeters have performed heat capacity measurements for a century,dating from Nernst and Eucken [55, 56, 57, 58, 59, 60]. The sample and a heater arethermally isolated from their surroundings by vacuum and an adiabatic shield thatis maintained at approximately the same temperature as the sample. The latterminimizes radiative heat transfer, and a thin mechanical suspension such as silkthread minimizes heat conduction. Measured electrical energy is provided to thesample through a heater, and the sample temperature is measured by thermometry.After equilibration the temperature rise is measured, from which the heat capacityof the sample and its holder are obtained. Ideally, the sample weight should be large(1cm3 is relatively small), minimizing background corrections. Heat capacities canbe measured to better than 1% accuracy from typically 10-300K with adiabaticcalorimeters, but there are many instrument designs and operating ranges. A varia-tion on this method is drift calorimetry. The sample is connected to a thermal baththrough a weak thermal link, causing its temperature to drift. Although the rateof drift should be proportional to the heat capacity of the sample, more accurate
data are usually obtained by applying pulses of electrical energy, and identifyingthe extra temperature change over the baseline drift. Another approach is used forheat pulse, or relaxation calorimeters, which also have thermal links between thesample assembly and a thermal anchor. After a pulse of electrical energy raisesthe temperature of the sample, its temperature decays towards that of the thermal
19 Proposals appear with some regularity to use accurate heat capacity data to determine thephonon DOS. These prove to be too optimistic, although some lower moments of the phonon DOScan be determined this way.
8/13/2019 Vibrational Thermodynamics
http://slidepdf.com/reader/full/vibrational-thermodynamics 36/145
32 B. Fultz
anchor. The rate of decay (sometimes modeled as an exponential function or a sumof two exponentials) is used to obtain the heat capacity of the sample, which canbe proportional to the characteristic time of the decay [61, 62, 63, 64]. A relatedtechnique, which also has advantages for small samples, is to apply an oscillating
heating signal to the sample, and measuring the thermal response at the frequencyof the heating signal using a lockin amplifier to minimize noise [65].
Differential measurements can be highly accurate, and are sometimes useful formeasuring differences in vibrational entropy of different materials. A differentialscanning calorimeter heats two samples, perhaps matched in their composition andmass, but with different crystal structures. The electrical heating is performed withfeedback control so that the temperatures of both samples increase at the samerate. Differences in heat capacity are measured by the differences in electrical powerrequired to maintain the same heating rates. This method of differential scanningcalorimetry has, in principle, the advantage that it nulls the background from thesample holder, but background issues prove difficult when highly accurate measure-ments are required. The method also has limitations in the range of temperaturesthat can be achieved, because if there is no adiabatic isolation, the electronic heatingsystem needs to provide considerably higher power at higher temperatures. A simplerdifferential measurement technique, differential thermal analysis, places two samplesin a common thermal environment, such as side-by-side in a furnace. The furnacetemperature is increased uniformly, and the temperature difference between the twosamples is measured to obtain their differential heat capacity. These differentialmeasurements can be accurate to 2% of the total heat capacity, but like all methodsof calorimetry, it is a challenge to obtain high-quality results over a wide range of temperatures.
8. Neutron Scattering
8.1. Elastic and Inelastic Scattering
Figure 10 shows the geometry, wavevectors and position vectors for neutron scat-tering. The plane wave incident from the left, Ψin(r′, t), has the form
Ψin(r′, t) = ei( ki·r′−ωit) . (87)
For scattering from one nucleus (which is essentially a point compared to typicalneutron wavelengths), a spherical wave, Ψsc(r, t), emerges from r′, and reaches thedetector at r at time t′ > t
Ψsc(r, t′) = −1
4π
ei[kf |r−r′|−ωf (t′−t)]
|r − r′| . (88)
The difference, r − r′, is the distance from the nucleus to the detector. Because Eq.88 gives the contribution to the wavefunction at position r caused by a δ -functionat r′, with its prefactor it is the Green’s function of the Schr odinger equation of theneutron scattering problem [34].
In the first Born approximation [34], the amplitude of the scattered wave atthe detector, Ψsc(r, t′), is proportional to the product of: 1) the amplitude of the
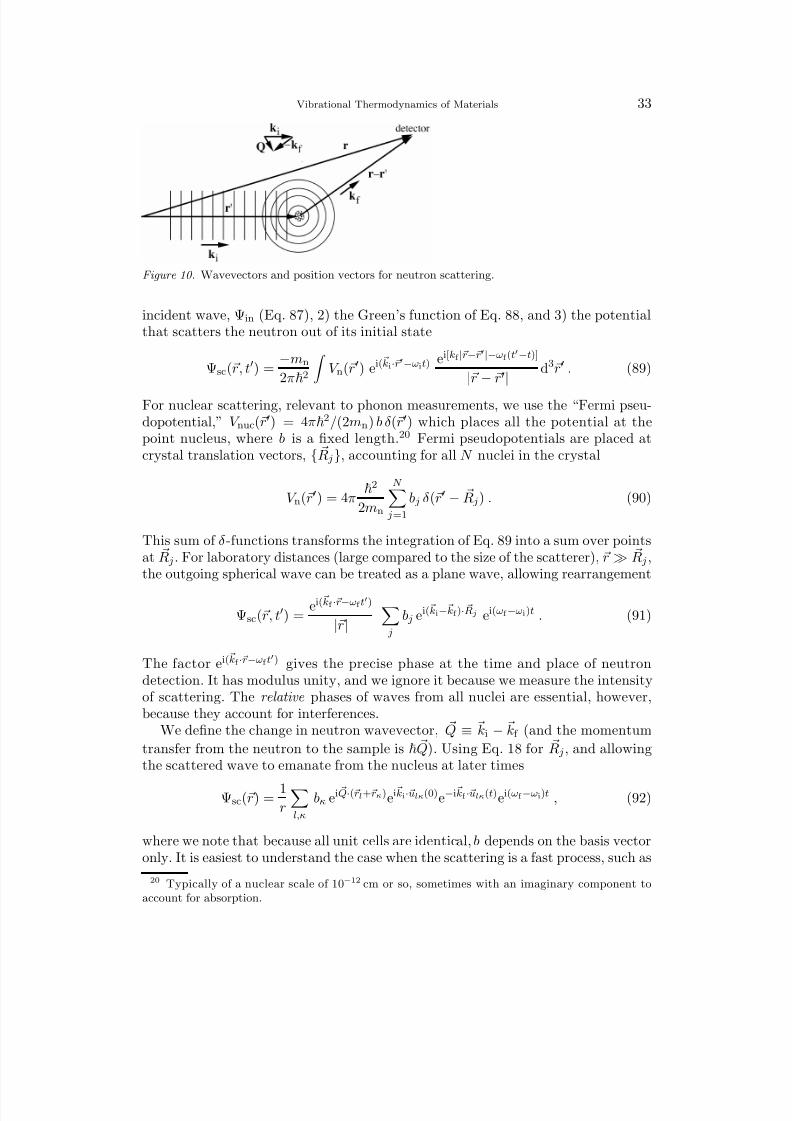
8/13/2019 Vibrational Thermodynamics
http://slidepdf.com/reader/full/vibrational-thermodynamics 37/145
Vibrational Thermodynamics of Materials 33
Figure 10. Wavevectors and position vectors for neutron scattering.
incident wave, Ψin (Eq. 87), 2) the Green’s function of Eq. 88, and 3) the potentialthat scatters the neutron out of its initial state
Ψsc(r, t′) = −mn
2π 2
V n(r′) ei( ki·r′−ωit) ei[kf |r−r′|−ωf (t′−t)]
|r
−r′
|
d3r′ . (89)
For nuclear scattering, relevant to phonon measurements, we use the “Fermi pseu-dopotential,” V nuc(r′) = 4π
2/(2mn) b δ (r′) which places all the potential at thepoint nucleus, where b is a fixed length.20 Fermi pseudopotentials are placed atcrystal translation vectors, R j, accounting for all N nuclei in the crystal
V n(r′) = 4π
2
2mn
N j=1
b j δ (r′ − R j) . (90)
This sum of δ -functions transforms the integration of Eq. 89 into a sum over pointsat R j. For laboratory distances (large compared to the size of the scatterer), r ≫ R j ,the outgoing spherical wave can be treated as a plane wave, allowing rearrangement
Ψsc(r, t′) = ei( kf ·r−ωf t
′)
|r|
j
b j ei( ki− kf )· Rj ei(ωf −ωi)t . (91)
The factor ei( kf ·r−ωf t′) gives the precise phase at the time and place of neutron
detection. It has modulus unity, and we ignore it because we measure the intensityof scattering. The relative phases of waves from all nuclei are essential, however,because they account for interferences.
We define the change in neutron wavevector, Q ≡ ki − kf (and the momentum
transfer from the neutron to the sample is Q). Using Eq. 18 for R j, and allowingthe scattered wave to emanate from the nucleus at later times
Ψsc(r) = 1r
l,κ
bκ ei Q·(rl+rκ)ei ki· ulκ(0)e−i kf · ulκ(t)ei(ωf −ωi)t , (92)
where we note that because all unit cells are identical, b depends on the basis vectoronly. It is easiest to understand the case when the scattering is a fast process, such as
20 Typically of a nuclear scale of 10−12 cm or so, sometimes with an imaginary component toaccount for absorption.
8/13/2019 Vibrational Thermodynamics
http://slidepdf.com/reader/full/vibrational-thermodynamics 38/145
34 B. Fultz
for x-ray scattering, where an x-ray traverses the crystal more rapidly than typicalvibrational periods of atoms. Incoherent neutron scattering is also fast, where thethermal neutron is scattered from individual atomic nuclei without concern for phaserelationships between nuclei. This motivates a first approximation; ignore the time
dependence of the potential by setting ulκ(t) = ulκ(0), and take the time average
Ψelsc( Q, r) =
1
r
l,κ
bκ ei Q·(rl+rκ) ei Q· ulκ(0) 1
τ
τ 0
ei(ωf −ωi)tdt , (93)
Ψelsc( Q, r) =
1
r
l,κ
bκ ei Q·(rl+rκ) ei Q· ulκ(0) δ (ωf − ωi) , (94)
The δ -function enforces no change of frequency or energy, so Eq. 94 pertains toelastic scattering, where the modes of atom vibrations are unchanged. We need toperform an ensemble average over the different values of ulκ(0), which evaluates as21
ei Q
· u(0)
N = e−1
2 [ Q
· u(0)]2
N
≡ e−W
. (95)Equation 94 for elastic scattering becomes
Ψelsc( Q, r) =
e−W
r
κ
bκ ei Q·rκl
ei Q·rl ≡ e−W
r F ( Q) S ( Q) . (96)
Here we separated the sums over basis and lattice vectors into a structure factor,F ( Q), and a shape factor, S ( Q). Equation 96 can be used to calculate the neutrondiffraction pattern from a crystal, giving the average static structure. The factor e−W
is the “Debye–Waller factor,” which becomes appreciably less than 1 when the atomdisplacement uκ is comparable to 1/Q ∼ λ/2π, the wavelength associated with thescattering angle and energy. This is consistent with the origin of the Debye–Waller
factor from the destructive interference of scattered wavelets that are emitted fromdifferent spatial positions of the displaced nuclei. Note that the ensemble average of Eq. 95 does not reveal the energy of an atom vibration, only how displaced atompositions alter the phase.
Next consider a process of scattering that is slow compared to the atomic vi-brational period. Such is the case for coherent scattering of neutrons by phonons,and for nuclear resonant scattering of photons by phonons. For clarity, we considerthe scattering by one phonon of wavevector k. Equation 28 shows that ulκ k(t) =
ulκ k(0)e−iω kt. We need to take a time average of the displacement factors in Eq. 92
ei ki· ulκ k
(0) e−i kf · ulκ k
(t)t = ei ki· ulκ k
(0) e−i kf · ulκ k
(0)e−iω k
tt . (97)
Coherent phonon scattering involves correlations of displacements ulκ k(t) at dif-ferent atom positions at different times. The intensity of the coherent inelastic
21 An approximate demonstration of this is by expanding exp(i Q · u) = 1 + i Q · u + ... and taking
either an ensemble average or a time average. The average of the second term, i Q · u is zero owingto positive and negative excursions of u, leaving the quadratic term, consistent with Eq. 95. Theaverage of the subsequent cubic term also vanishes, conveniently, but unfortunately the quarticterm has the wrong sign. Nevertheless, it can be proved that Eq. 95 is exact if the probabilitydistribution of u is Gaussian about the origin, and this is often reasonable for lattice dynamics.
8/13/2019 Vibrational Thermodynamics
http://slidepdf.com/reader/full/vibrational-thermodynamics 39/145
Vibrational Thermodynamics of Materials 35
scattering proves to be the Fourier transform of the Van Hove space-time correlationfunction [66], and is a rich approach to studying dispersive excitations in solids.The proper quantum mechanical treatment of time and temperature averages isbeyond the scope of this review, but Eq. 98 below is the proper result for incoherent
scattering. Furthermore, it is possible to average the coherent scattering over all Q torecover this incoherent result [67, 68, 69], and the incoherent approximation serves uswell in the following analysis of multiphonon scattering. The loss of phase informa-tion by averaging the coherent scattering over all Q brings us back to considerationof a fast scattering process.
8.2. One-Phonon and Multiphonon Scattering
Equation 96 is the elastic scattering only. It does not conserve the nuclear scatteringcross section. Nuclear interactions do not necessarily depend on the displacements
of atoms, so we need a compensating factor e+( Q· u)2 to conserve the cross-sectionand account for the rest of the scattering intensity. Expanding this new factor, we
calculate the intensity as Ψ∗scΨsc, and for clarity we normalize the intensity
Ψ∗scΨscN =
1
RRκ
e−( Q· uκ)2
×
1 + ( Q · uκ)2 + 1
2(( Q · uκ)2)2 + ...
(98)
The first and second terms in parentheses of Eq. 98 are the fractions of elastic (0-
phonon) and 1-phonon scattering. The third term with the 12 (( Q · uκ)2)2 accounts
for 2-phonon scattering processes. Only the 1-phonon scattering proves useful forobtaining a phonon DOS, but it is important to have an understanding of thehigher-order terms (called “multiphonon scattering”) for designing an experiment,
or performing quantitative corrections of experimental data.A more detailed treatment of coherent 1-phonon scattering includes the ther-
mal factors for phonon populations, giving the double-differential scattering crosssection22
d2σ
dΩ dE =
kf
ki
(2π)3
2V 0
g, k
n( k) + 12 ± 1
2
ω k
×
κ
bκ√ mκ
e−( Q· uκ)2 Q · eκ( k)ei Q·rκ2
× δ ( Q + k ± g) δ (ω − ω k) , (99)
where the phonon occupancy factor, n( k), is the Planck distribution of Eq. 7 at the
temperature of interest and εi = ω k. The signs in the factor n( k) + 1
2 ± 12 in Eq. 99
are such that it is n( k) for phonon annihilation, and n( k)+1 for phonon creation – it
22 A new factor is the ratio kf /ki, which expresses the effect on flux caused by the rate at whichneutrons leave the sample. Compared to an elastically-scattered neutron, fewer neutrons per secondwill pass into an increment of solid angle dΩ if they are slowed to smaller values of kf . Also, theuse of solid angle eliminates the need for the factor r−2.
8/13/2019 Vibrational Thermodynamics
http://slidepdf.com/reader/full/vibrational-thermodynamics 40/145
36 B. Fultz
is always possible to create a phonon, even at T = 0 when no phonon excitations arepresent. The δ ( Q+ k±g) and δ (ω−ω( k)) enforce the conservation of momentum andenergy on the neutron scattering process. The phonons on different branches mustbe considered separately in Eq. 99, and it is traditional to add a “branch index,”
sometimes denoted j, to ω( k), since more than one ω j may correspond to a specific k (cf., Eq. 29).
Why should the expansion of an evidently classical exponential in Eq. 98 producethe series of neutron-phonon interactions? In the classical limit, the scattering of every neutron is inelastic, generating heat composed of a number of phonons withtotal energy, E , the energy transfer from the neutron. For classical scattering, anatom of mass m will recoil with velocity v = Q/m, with momentum transfer Q,and energy transfer
E R =
2 Q2
2m . (100)
In the quantum limit where Q is small, the energy recoil may or may not occur,depending on whether phonons are created or not. The total scattering, S (Q, E ),is the sum of components,
∞n=0 S n(Q, E ), from neutrons scattered after creating
different numbers, n, of phonons in the sample.23 The thermal energy is
kBT = 2mω2u2 (101)
for one harmonic mode of frequency ω . From Eqs. 100 and 101
Q2u2 = E R ω
kBT
ω (102)
This is the quantity in which the multiphonon expansion is performed (Eq. 98).From Eq. 102 we see that the relative intensities of the sequence of phonon scattering
terms scale with 1) the ratio of the recoil energy to the oscillator energy, and 2) theratio of temperature to the oscillator energy. When the first ratio is small, quantummechanics requires that some recoils excite the oscillator, but most do not. Thesame is true for temperature (and at low temperatures we of course have low heatcapacity because the oscillator is usually not excited).
It remains to get the spectral shape of each order of the multiphonon scattering.The spectrum for one-phonon scattering weights more heavily the low-energy modesbecause they have larger amplitudes of motion, providing a factor of g(ε)/ε. Thenumber of phonons is the Planck distribution 1/[exp(ε/kBT )−1], and the two factorsprovide the shape of the 1-phonon profile, A1(ε):
A1(ε) = g(ε)
ε
1
eε/kBT
− 1
. (103)
When two phonons are created simultaneously, the total spectrum of energies isthe convolution of the 1-phonon profile with the 1-phonon profile. 24 The n-phonon
23 Phonon annihilation is handled by extending the range of E to negative values for eachS n(Q, E ).24 Consider each phonon excitation to be a random variable with a probability distribution of
A1. The sum of two random variables has a distribution that is the convolution of the probabilitydistributions A1 ∗ A1.
8/13/2019 Vibrational Thermodynamics
http://slidepdf.com/reader/full/vibrational-thermodynamics 41/145
Vibrational Thermodynamics of Materials 37
profile is the convolution of another 1-phonon profile with the (n−1)-phonon profile
An(ε) = A1 ∗ An−1 =
∞
−∞
A1(ε − ε′) An−1(ε′) dε′ . (104)
Starting with A1, we can generate the spectral shapes of all orders of multiphononscattering by the systematic application of Eq. 104.25 The total scattering is thesum of these spectral profiles, weighted by the corresponding terms of Eq. 98
S (Q, E ) =∞
n=0
exp(−2W )(2W )n
n! An(E ) , (105)
where we have defined S (Q, E ) as the double-differential cross-section d2σ/dΩdE without prefactors.26
In much experimental work, we seek to isolate the single scattering profile, A1(E ),
from the measured S (Q, E ), and then determine the phonon DOS g(E ) by Eq. 103.One way to correct for multiphonon scattering is by iteration on an initial guess of the phonon DOS. With an initial guess at the DOS or A1(E ) (often the S (Q, E ) witha constant background removed), the various A2(E ), A3(E ), A4(E )... are calculatedand subtracted from S (Q, E ) to give a better A1(E ). Iteration is complete whenthere is a good match between the measured S (Q, E ) and the S (Q, E ) recalculatedwith Eq. 105. When the multiphonon scattering is weak, perhaps only two iterationsare necessary. When the multiphonon scattering is strong, the procedure becomesdifficult and slow. If there is strong multiphonon scattering, however, the experi-ment is moving into the limit of classical scattering, so isolating the single phononspectrum becomes more challenging.
8.3. Neutron Weighting
Strictly speaking, the phonon DOS from the procedure outlined above is not thetrue phonon DOS, but rather the neutron-weighted DOS. For an elemental scatterer,the neutron-weighted DOS is identical to the phonon DOS. This is not the usualcase for a sample that contains more than one type of atom. The neutron-weightedphonon DOS is
gNW(ε) ∝
d
gd(ε)exp(−2W d)exp(2W ) σd
md(106)
where the gd(ε) are the phonon partial DOS functions of Eq. 34. The Debye-Wallerfactor is an explicit function of gd(ε). The term exp(2W ) is the average Debye-Waller
25 A subtlety arises for coherent scattering from crystals that are sufficiently anharmonic sothat the phonon lifetime is shorter than the characteristic time for neutron scattering. When, forexample, one phonon decays into two during the scattering, there can be constructive or destructiveinterference between the neutron wavepackets scattered by a one-phonon process and a two-phononprocess. This interference can alter the spectral shape. Although recognized some time ago [70],identifying this effect has been a challenge [71, 72, 73].26 This S (Q, E ), called the “scattering law,” is normalized so that it is the double Fourier
transform of the Van Hove correlation function G(r, t).

8/13/2019 Vibrational Thermodynamics
http://slidepdf.com/reader/full/vibrational-thermodynamics 42/145
38 B. Fultz
correction; it is calculated from the self-consistent neutron-weighted DOS. At lowtemperatures, the factor exp[2(W − W d)] is approximately unity.
For the case where σd/md is the same for all species d, gNW(ε) ≈ g(ε), but ingeneral obtaining the true phonon DOS from the neutron-weighted phonon DOS
requires a full analysis of the lattice dynamics. This can be performed by simulationalprocedures or by some types of analytical methods. These are important analyses,but are mostly beyond the scope of this review. One example is presented in Section13.2.
8.4. Direct-Geometry Fermi Chopper Spectrometer
Chopper spectrometers have evolved with advances in electronics [74, 75, 76, 77, 78].A Fermi chopper is a fast shutter located a fixed distance from the neutron source. Byaligning a slot at the right time after a neutron burst leaves the moderator source, itselects neutrons having a particular velocity, and hence a particular neutron energyE = 1
2 mv2. Its operation is best illustrated with the distance versus time diagram
of Fig. 11. The slopes of the lines are neutron velocities. Neutrons of many velocitiesare emitted from the moderator. The figure depicts two neutron pulses from themoderator, separated in time by perhaps 1/60 sec. The Fermi chopper selects anarrow range of velocities, corresponding to a time window of tens of microseconds.Of course the narrower the window, the more neutrons are blocked by the chopper,and the lower the flux of neutrons on the sample. On the other hand, the narrowerthe window, the more precisely selected are the velocities, and hence better energyresolution is achieved. The Fermi chopper therefore controls the incident energy, theintensity, and the energy resolution of the neutrons incident on the sample.27
The sample usually transmits most of the incident neutrons without energychange, and most of the scattered neutrons are scattered elastically. There is astrong tendency for the lines in Fig. 11 to have unchanged slopes through thesample. Neutrons that are scattered inelastically, however, have lines with kinksat the sample, and have slopes after the sample that are either steeper or shallowerthan for the incident beam.
A Fermi chopper spectrometer works by timing. The time of detection of theelastic neutrons is known from the velocity selected by the Fermi chopper, andthe elastically-scattered neutrons give an intense peak in the time spectra from thedetectors. The neutrons that arrive earlier have gained energy from the sample, andthose that arrive later have lost energy to the sample. The neutron energy spectrumis obtained from the histogram of neutron arrival times. From the energy transferand the scattering angle, the momentum transfer can be determined.
8.5. Triple-Axis Spectrometer
The triple-axis spectrometer, invented by Brockhouse [79, 80, 81], uses a steady beamof neutrons from the core of a nuclear reactor. After the neutrons are moderated tothermal energies, a monochromator crystal selects neutrons of a particular energy
27 The moderator also affects energy resolution. Figure 11 shows emission of neutrons at twopoints in time, but there is actually a spread of emission times, especially for neutrons of lowerenergy.
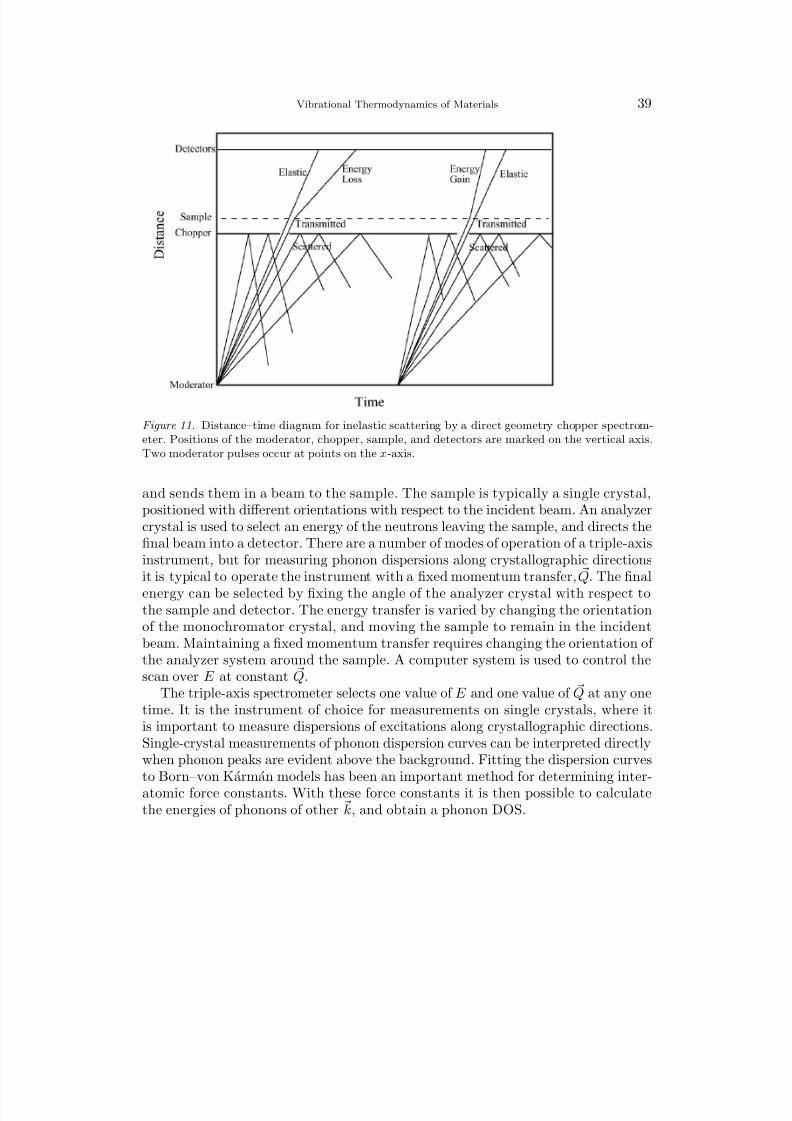
8/13/2019 Vibrational Thermodynamics
http://slidepdf.com/reader/full/vibrational-thermodynamics 43/145
Vibrational Thermodynamics of Materials 39
Figure 11. Distance–time diagram for inelastic scattering by a direct geometry chopper spectrom-eter. Positions of the moderator, chopper, sample, and detectors are marked on the vertical axis.Two moderator pulses occur at points on the x-axis.
and sends them in a beam to the sample. The sample is typically a single crystal,positioned with different orientations with respect to the incident beam. An analyzercrystal is used to select an energy of the neutrons leaving the sample, and directs thefinal beam into a detector. There are a number of modes of operation of a triple-axisinstrument, but for measuring phonon dispersions along crystallographic directionsit is typical to operate the instrument with a fixed momentum transfer, Q. The final
energy can be selected by fixing the angle of the analyzer crystal with respect tothe sample and detector. The energy transfer is varied by changing the orientationof the monochromator crystal, and moving the sample to remain in the incidentbeam. Maintaining a fixed momentum transfer requires changing the orientation of the analyzer system around the sample. A computer system is used to control thescan over E at constant Q.
The triple-axis spectrometer selects one value of E and one value of Q at any onetime. It is the instrument of choice for measurements on single crystals, where itis important to measure dispersions of excitations along crystallographic directions.Single-crystal measurements of phonon dispersion curves can be interpreted directlywhen phonon peaks are evident above the background. Fitting the dispersion curvesto Born–von Karman models has been an important method for determining inter-atomic force constants. With these force constants it is then possible to calculatethe energies of phonons of other k, and obtain a phonon DOS.
8/13/2019 Vibrational Thermodynamics
http://slidepdf.com/reader/full/vibrational-thermodynamics 44/145
40 B. Fultz
9. Ab-Initio Methods
9.1. Density Functional Theory
A large branch of computational materials science owes its predictive power todevelopments in density functional theory (DFT), in conjunction with advancesin computing power. There are excellent reviews and books on density functionaltheory and its applications to materials, some of which offer a broader context of condensed matter theory [82, 83, 84, 85]. This rich field is far too extensive tocover here. The techniques for calculating phonons from first principles also deservea much more extensive presentation [9, 86, 87, 88, 89, 90, 91, 92, 93, 94]. Thisbrief overview of some key methods and concepts is presented with apologies thatnumerous intellectual achievements in this rapidly-moving field cannot be covered.
Density functional theory elevates the importance of the electron density withrespect to the electron wavefunctions, relying on a theorem that all properties of anelectronic system can be obtained from the ground state electron density [95, 96].
A functional relationship must exist between the density and the physical quantityof interest, but finding this relationship is a challenge. The successful approachdeveloped by Kohn and Sham [97] assumes that the ground state electron density of a system of interacting electrons can be equal to that of a non-interacting system of electrons, with an interacting electron density. Working with independent electronsmakes calculations practical, freeing us from time-ordered-fermion field operatorsfor electron-electron interactions. In particular, the electron exchange and Coulombcorrelation energy, which are nonlocal multibody interactions, can be successfullyapproximated with functionals of the local density, or the density and its localgradients, for example. The density is obtained from the electron wavefunctions,so computational algorithms require iteration to self consistency of the potentialand the wavefunctions. The local density functional theory has been surprisinglysuccessful, although problems occur for strongly-correlated electron systems.
9.2. First-Principles Phonon Calculations
Principles for calculating phonon dispersions from the electronic energy were out-lined in the classic work of Ziman [98] and others [99]. Two approaches are used. Thedirect methods impose displacements of atoms, and calculate energies of distortedconfigurations. In the supercell method, pairs of atoms are displaced by u and u′along directions of symmetry, for example, and from the energies of the distortedstructures, E (u, u′), the force constants Φlκl′κ′ of Eq. 27 can be calculated as
Φαα′lκl′κ′ = ∂ 2E (u, u′)∂uαlκ ∂uα′l′κ′
0
, (107)
(cf., Eq. 21). With these ab-initio force constants, the lattice dynamics can be cal-culated [88]. The Hellman-Feynman theorem shows that errors in the wavefunctionsthat cause only second-order errors in energy are responsible for first-order errors inforces, so energy convergence is stringent [9, 92]. With the frozen phonon method, thepotential energy of an individual phonon is calculated directly by generating periodic
8/13/2019 Vibrational Thermodynamics
http://slidepdf.com/reader/full/vibrational-thermodynamics 45/145
Vibrational Thermodynamics of Materials 41
distortions of a cell or supercell [100, 101]. Calculations with direct methods areversatile, and can account for unusual structures. Frozen phonons of different ampli-tudes are a natural way to account for anharmonic potential energies [102, 103, 104],although a good sampling of all phonons is challenging. When periodic boundary
conditions are used, the cell should be comfortably larger than the longest-rangeinteratomic force, and the phonon wavevector should be commensurate with thestructure. With many atoms and electrons in a large supercell, however, the calcu-lations can become unwieldy, especially since the computation time often scales asthe cube of the number of electrons.
The second approach calculates the sensitivities to small density modulation,usually with a linear response theory [86, 87, 89, 105]. These are second derivativesof the energy, and the simplest approach to the problem is with second order per-turbation theory. For periodic crystals with both electrons and phonons expressedas Bloch functions, the density susceptibility function for the Fourier coefficient ( k)of the electron density depends on the Fourier coefficient of the phonon modulation( k′) as
χ( k, k′) = 2
i
j
i|e−i k·r| j j|ei k′·r|iǫi − ǫ j
, (108)
where the intermediate electronic states | j are unoccupied, and the states |i are
occupied. A considerable simplification is that k and k′ must be related by a re-ciprocal lattice vector, reducing the number of terms in Eq. 108, although for morerealistic interacting systems, the situation is not so simple. A variational approachfor obtaining the energy to second order has been developed to obtain a linearresponse to periodic perturbations [89]. In this method, the dynamical matrix canbe calculated directly [90]. It is also possible to recover real-space force constants
by Fourier transformation of the dynamical matrix for appropriate selections of k.
9.3. Molecular Dynamics
Molecular dynamics simulations integrate equations of motion to follow in timethe positions and velocities of all atoms. Many molecular dynamics simulationsare classical or semi-classical, using forces obtained as gradients of model potentialenergy functions, for example. The atoms are allowed to move under Newton’s lawfor a short time, and the forces are recalculated for the new configuration of atoms.These simulations can be extended beyond a microcanonical ensemble by allowingcontact of a small simulation system with a reservoir, accounting for fluctuations of temperature or pressure, for example. Realistic thermostatic or barostatic control
can be achieved by extending the dynamical system with degrees of freedom thatrepresent the external system [106, 107]. Molecular dynamics is not restricted toharmonic forces, and large-amplitude displacements allow investigations of anhar-monic behavior. Accurate force fields that account for all detail of the local atomicenvironment can be a challenge. Such force fields can be obtained from quantummechanics, but often they are empirical.
8/13/2019 Vibrational Thermodynamics
http://slidepdf.com/reader/full/vibrational-thermodynamics 46/145
42 B. Fultz
The velocity-velocity autocorrelation function v(t)|v(0) can be calculated fromthe trajectory of each atom in a molecular dynamics simulation.28 The Fouriertransform of the velocity-velocity autocorrelation function gives the phonon DOS[108]
g(ω) =
eiωt v(t)|v(0)
v(0)|v(0) dt . (109)
In another approach, it is possible to obtain differences in thermodynamic quantitiessuch as phonon free energy by parameterizing a Hamiltonian to allow the systemto switch from one structure to another, and integrating along the path of thisswitching parameter.
It is possible to solve for the forces on the moving nuclei by performing a fullDFT calculation at each timestep of the simulation, but this is cumbersome. TheCar–Parrinello algorithm makes practical quantum molecular dynamics simulationsof greater complexity [109, 110]. It uses the electron degrees of freedom as dynamical
variables in a set of coupled equations of motion for the nuclei and the electrons. Thenuclei have a classical kinetic energy of M/2 [dulκ/dt]2. The trick to the algorithmis that the electrons are given a fictitious kinetic energy of µ/2
[dψ/dt]2dr, with a
mass µ that is an adjustable parameter (that helps with the stability of the numericalcalculations). With this coupling of nuclear and electronic motions, constrainedby the orthogonality of the electron wavefunctions, the electrons stay near theirground states during the simulation. The electron wavefunctions do not need to berecalculated at each step of the simulation, offering an improvement in efficiency.The Car–Parrinello algorithm is an adiabatic approximation.
28 The notation indicates that the velocity history of each atom is multiplied by the velocityhistory shifted by t, and integrated over all time.
8/13/2019 Vibrational Thermodynamics
http://slidepdf.com/reader/full/vibrational-thermodynamics 47/145
Vibrational Thermodynamics of Materials 43
II. Vibrational Entropy of Materials at LowerTemperatures
10. Earlier Investigations
10.1. Polymorphism
Polymorphism is the transformation of a material into a new crystal structure bychanging T or P , without change in composition. The classic texts by J.C. SlaterIntroduction to Chemical Physics (1939) [111] and by F. Seitz Modern Theory of Solids (1940) [112] have explanations of the role of vibrational entropy in polymor-phic phase transformations of pure elements. An early experiment was reported byF. Lange in 1924, who measured the heat capacities of white and gray tin fromnearly liquid helium temperature to ambient [113]. The difference in entropy was
obtained with the Nernst postulate and by integrating the difference in heat capacity(cf., Eq. 72)
∆S α−β vib (T ) =
T 0
C α p (T ′) − C β p (T ′)
T ′ dT ′ . (110)
The enthalpy of the transformation was also obtained, and the critical temperaturewas predicted accurately from the vibrational entropy and the enthalpy [112]. Itappears that the entropy of the tin transformation is mostly vibrational. It is big– white tin has a vibrational entropy 0.9 kB/atom greater than gray tin at roomtemperature. The roles of vibrational entropy in the polymorphism of sulfur, carbon,
and iron are discussed semiquantitatively in Seitz’s book [112].Many elemental metals transform from close-packed structures (fcc or hcp) atlow temperatures to the bcc structure at high temperatures (and ambient pressure).These include metals with very different electronic structures, such as alkali met-als and transition metals. Zener [114] hypothesized that soft transverse phonons,intrinsic to the more open bcc structure, would contribute enough vibrational en-tropy to favor the bcc structure at high temperatures. Many years later, this ideawas subjected to some analysis by Grimvall and Ebbsjo [115], using results frompseudopotential calculations [116, 117] and results from force-field calculations of lattice dynamics [118]. Their assessment showed that phonons in bcc crystals weretypically a few percent softer than in fcc or hcp, especially for the low transversemodes, supporting Zener’s hypothesis. They further argued that this trend could be
understood without anharmonic effects, although perhaps not quantitatively.29 Onthe other hand, the fcc and hcp close packed structures seem to have very similarphonon energies, as shown by neutron scattering measurements on Co [119], forexample. Likewise, the fcc-based L12 structure of Co3V has a vibrational entropy of only 0.07 kB/atom larger than the ordered hexagonal hP24 structure of Co 3V near
29 Their calculations, which assumed a constant volume per atom in both phases [115], areapproximate.
8/13/2019 Vibrational Thermodynamics
http://slidepdf.com/reader/full/vibrational-thermodynamics 48/145
44 B. Fultz
the transition temperature of 1320 K [120, 121]. On the other hand, for pure 57Fe,nuclear resonant inelastic x-ray scattering (NRIXS) measurements of the phononDOS at elevated pressure and temperature show only a small difference for the bccα-phase and the hcp ǫ-phase [122, 123]. Curiously, another NRIXS study has shown
a large difference between the phonon DOS of the hcp ǫ-phase and the fcc γ -phase[124], contrary to the trend for other metals. The phonon DOS of γ -Fe was softerthan the DOS for ǫ-Fe, giving the fcc γ -phase the larger vibrational entropy andlower sound velocities.
Electronic entropy also plays an important role in the hcp–bcc transformation[17]. Especially today, ab-initio methods are well suited for comparing vibrationalfree energies of polymorphic transformations of many elemental metals and com-pounds (e.g., [125]).
10.2. Solubilities and Defect Concentrations
10.2.1. Diffusion
Vibrational entropy originates with atom displacements around equilibrium, whichare small compared to the atomic displacements of diffusional jumps. When thetimes between diffusional jumps become very short, however, the distinction betweenvibrational and configurational degrees of freedom becomes blurred. This is certainlyan issue when jump times are comparable to vibrational periods, or even if jumptimes are comparable to phonon lifetimes. This blurring of vibrational and diffusionalphenomena occurs in liquids, for example, where some low-energy modes of vibrationbecome unstable and atom movements occur. Likewise, soft-mode transformationsrelate vibrational degrees of freedom to structural ones as discussed in Sect. 15.
Even in the common situation where the energetics of the atomic displacementsare of order kBT ≃ 0.1 eV and the activation barriers for diffusion are of order 1 eV,there are relationships between vibrational entropy and diffusional processes. Theactivation free energy for diffusion, ∆G∗, is related to the jump frequency, Γ, as:
Γ(T ) = Γ0 e−∆G∗/kBT = Γ0 e+∆S ∗/kBe−∆H ∗/kBT , (111)
where Γ0 is an attempt frequency related to atom vibrations, and ∆S ∗ is analyzedin terms of vibrations. Zener estimated ∆S ∗ by how elastic constants soften withtemperature [126].
The relationship between atomic vibrations and the entropy of diffusion, ∆S ∗,was developed formally by G. Vineyard, who assigned the origin of ∆S ∗ to thevibrational entropy of all harmonic normal modes of the equilibrium solid ωe
i ,and how they change at the saddle point of the diffusional jump ωs
i [127]. Theexpression for the temperature-independent prefactor of Eq. 111 was found to be
e+∆S ∗/kB =
3N −1i=1 ωe
i3N −1 j=1 ωs
j
, (112)
where the 3Nth frequency of the equilibrium crystal is associated with the attemptfrequency of the diffusive jump, Γ0. Schober, Petry and Trampenau assessed thevibrational entropy and enthalpy of vacancy migration using a lattice Green’s func-tion method. For an idealized activation barrier of vacancy migration, they argued

8/13/2019 Vibrational Thermodynamics
http://slidepdf.com/reader/full/vibrational-thermodynamics 49/145
Vibrational Thermodynamics of Materials 45
that the different phonons should be weighted by the phonon DOS with a factorof 1/(mω)2. This weighting of the phonon DOS accounts for how thermal energycauses larger mean-squared displacements for phonons of lower frequencies [128].Defect formation entropies of order 2 kB/atom were reported, but these values are
not quantitative.
10.2.2. Solubility
The thermodynamics of solubility can be understood with the help of Eq. 48, usingEqs. 49, 50, and 52. In the dilute limit of B-atoms in an A-matrix (small c), the freeenergy is
F (c) ≃ zN/2eAA + 2c(eAB − eAA)
+ kBT N
c ln c + (1 − c)ln(1 − c)
+ kBT DN
ln ωAA + 2c ln(ωAB/ωAA)
. (113)
To calculate the solubility, we find the difference in free energy of a dilute A-B
alloy with respect to pure A and pure B.30 For illustration, assume all materialshave the same crystal structure, and we know that the pure elements have zeroconfigurational entropy of mixing. We calculate F(c=0) and F(c=1), weight themby their proportions, and take the difference
∆F (c) = F (c) − (1 − c)F (0) − cF (1) , (114)
∆F (c) = −czN 2V + cDNkBT
ln
ω2
AB
ωAAωBB
+NkBT c ln c + (1 − c)ln(1 − c)
. (115)
Seeking the minimum of ∆F (c) as ∂ ∆F (c)/∂c = 0, the equilibrium concentrationfor small c is
c =
ωAAωBB
ω2AB
Dexp
z4V
kBT
. (116)
The exponential in Eq. 116 includes the interchange energy of Eq. 42, which isnegative for unmixing systems. The prefactor is exp(−∆S vib/kB), comparable toEq. 112. The configurational entropy does not appear explicitly in Eq. 116, but thederivation assumed that all sites of the A-crystal are equivalent for placing B-atomsolutes.
An analogous expression for a dilute concentration of B-atoms in an A-atommatrix, in equilibrium with a second chemically-ordered phase of precise compositionA1−xBx, is
c = exp
−F (B) − 1
x F (A1−xBx)
kBT
, (117)
c = exp
−
S vib(B) − 1
xS vib(A1−xBx)
exp
−E (B) − 1
x E (A1−xBx)
kBT
, (118)
30 The Hume–Rotherey rules, classic arguments for the size of e, and perhaps extendable toω, are presented in Section 21.2.
8/13/2019 Vibrational Thermodynamics
http://slidepdf.com/reader/full/vibrational-thermodynamics 50/145
8/13/2019 Vibrational Thermodynamics
http://slidepdf.com/reader/full/vibrational-thermodynamics 51/145
Vibrational Thermodynamics of Materials 47
10.3. Carbides, Nitrides, and Oxides
Fernandez Guillermet and Grimvall examined thermodynamic data on transitionmetal carbides, and reported some trends [134]. The standard entropy, primarily
vibrational in these ordered structures, and the standard enthalpy were shownto depend on the electron to atom ratio after the carbides were separated intotwo groups – one with Sc, Ti, V, and the second with Cr, Mn, Fe, Co, Ni. Thefirst group showed stronger variations in the standard enthalpy and entropy withelectron-to-atom ratio than did the second group. For carbides in the first group,standard entropies of formation varied by typically 0.4 kB/atom for different carbonstoichiometries, although the crystal structure also changed. Fernandez Guillermetand Du assessed the thermodynamic properties of the Fe-N system, and noted alarge increase in Debye temperature as the nitrogen concentration was increasedfrom the Fe4N to FeN3 (from 300 to 584 K) [135]. In the high temperature limit,this corresponds to a large difference in vibrational entropy of 3kB ln(300/584) /atom=
−2.0 kB /atom for these two compounds.
The pressure-induced phase transformation of ZnO from the wurtzite structureto the rocksalt structure was the subject of a first-principles computational studyusing the planewave pseudopotential code VASP, with the code PHONON to cal-culate phonon frequencies by the direct method [136]. Vibrational entropy wascalculated with the harmonic expressions for the phonon frequencies obtained atdifferent volumes (i.e., the quasiharmonic approximation). The transition pressurewas found to decrease with temperature (consistent with experimental results), andthis was attributed primarily to a larger vibrational entropy of the high-pressurerocksalt structure. The ZnO-MgO composition–temperature phase diagram was alsocalculated, and it was found that vibrational entropy increases the solubility of ZnOin the rocksalt MgO by about a factor of two at a given temperature, whereasvibrational entropy decreases the solubility of MgO in wurtzite ZnO by a similarfactor [136].
Some of the expectations and rules for metal systems may not be transferrable tonitrides or oxides. Structural units in oxide crystals, i.e., metal-oxygen octahedra,can undergo dynamics at low energies by rotating as a rigid unit, whereas the modesinvolving relative motions of the metal and oxygen atoms typically occur at muchhigher energies. These “rigid unit modes” of the octahedra [137] can break thesymmetry of a structure of packed octahedra, and can be responsible for displacivephase transformations in minerals, for example [138]. In structures where someoxygen atoms at corners of the octahedra are not shared by other octahedra, thereis more freedom in these reorientations. The material ZrW2O8 has such a localstructure, and it exhibits an unusual negative thermal expansion at low tempera-
tures. An analogy is opening a pair of scissors, where the total length is reduced asthe device is opened, but there is enough open space at the side to accommodatethe increase in width. The relevant low energy vibrational modes in ZrW 2O8 havebeen identified by inelastic neutron scattering [139, 140], and they show a stiffeningwith increased temperature. A similar negative thermal expansion was observed forthe related compound HfMo2O8, and a similar interpretation was offered in termsof low-frequency optical modes [141]. For quite some time it has been known thatRbI exhibits a negative thermal expansion, as does silicon at low temperatures. For
8/13/2019 Vibrational Thermodynamics
http://slidepdf.com/reader/full/vibrational-thermodynamics 52/145
48 B. Fultz
RbI the mechanical analogy is to a guitar string, where the increased vibrationalamplitude of the string pulls inwards its points of suspension [139, 142].
11. First-Principles Studies of Solutions and Studies of OrderedCompounds
11.1. Solubility in Al Alloys
The interatomic force constants and the phonon DOS of fcc Al metal were obtainedby analyzing the thermal diffuse x-ray scattering from a single crystal of Al [143].32
Neutron inelastic scattering experiments were later performed on Al, giving similarresults for the lattice dynamics [144, 145]. Many features in the phonon dispersioncurves were identified as Kohn anomalies from electron-phonon interactions (Sect.20). These anomalies are small and difficult to observe, but in principle they couldhave some thermodynamic effect.
Ab-initio electronic structure calculations have proved valuable for calculatingthe energy and vibrational entropy of a matrix with solute atoms, and Eq. 118can be used to find the effects of vibrational entropy on solubility. This approachwas used by Ozolins and Asta, who found a large effect of vibrational entropy onthe solubility of Sc in Al [146, 147]. Although the solubility of Sc in Al is low,calculations without vibrational entropy predict it to be about 27 times lower thanhas been measured, but the inclusion of vibrational entropy brings good agreementwith experient. The Sc dissolved in fcc Al is in equilibrium with Sc in the L1 2-ordered compound Al3Sc, so the energies and entropies of ordered compounds werealso calculated, as discussed below. The L12 structure of Al3Sc proved to be verystiff, with a high bulk modulus and small volume per Sc atom The phonon DOSof the L12 structure had an average frequency higher than either fcc Al or hcp Sc,
giving it a negative entropy of formation. This entropy of formation of Al3Sc from fccAl and hcp Sc was big, −0.70 kB/atom. The strong hybridization between Sc d- andAl p-electrons is responsible for short and stiff bonds in this intermetallic compound.For Sc solutes in fcc Al, stiffer first-nearest-neighbor bonds are also expected, and dooccur. Nevertheless, the vibrational entropy per Sc atom in fcc Al is approximately+0.4 kB/atom, indicating an overall softening of phonon frequencies. The softeningoccurs for Al-Al bonds in the more distant neighbor shells around the Sc atom. Twointer-related contributions were identified as a source of this softening:
− The element Sc is larger than the Al atom, and tends to increase the lat-tice parameter of the alloy. The elongation of the Al-Al bonds is a source of softening.
− Al is more electronegative than Sc, so we expect a charge transfer and a chargeperturbation around Sc atoms. The conduction electrons of Al redistributearound the charge perturbation, much as Friedel oscillations in a free electrongas. The entropic effects of the charge disturbances are of similar size as theeffects of volume expansion.
32 This was sophisticated work, especially in its day, and few other phonon studies have sincebeen done this way.
8/13/2019 Vibrational Thermodynamics
http://slidepdf.com/reader/full/vibrational-thermodynamics 53/145
Vibrational Thermodynamics of Materials 49
Ozolins, Sadigh, and Asta [148] performed a computational study on the sol-ubility of Si in Al. The Al-Si phase diagram is a simple eutectic, so the relevantphases are fcc Al, fcc Al-Si, and dc Si. The phonons in dc Si are quite stiff incomparison to the other phases. Removing a Si atom from covalently-bonded dc Si
and placing it in fcc Al has the net effect of lowering the vibrational frequencies of all atoms. The vibrational frequencies at Al atoms in the vicinity of Si solutes arenot altered significantly. (There is no large charge redistribution as for the case of Sc, for example.) With the dominant effect of solubility being the loss of short, stiff covalent bonds in dc Si, the vibrational entropy of formation for dilute Si in Al wascalculated as being +2.6 kB/Si atom, quite a large effect. This seems qualitativelyconsistent with the softening of transverse acoustic modes measured by inelasticneutron scattering on supersaturated Al-Si solid solutions [149]. It should be notedthat Ozolins, et al., encountered difficulties with the LDA approximation in thisstudy of Si solubility, owing to differences in the exchange-correlation energy causedby charge inhomogeneities in the different phases.
11.2. Aluminum Compounds
Aluminum alloys are of high technological importance because pure Al is mechani-cally soft, and second phases can provide strengthening mechanisms. One of the bestknown examples of precipitation hardening occurs for Al-Cu with the nonequilibriumphases θ′′ and θ′. These eventually transform to the equilibrium θ phase, so thefree energy of the θ phase must be lower than that of the metastable θ′ phase.Nevertheless, Wolverton and Ozolins calculated the electronic energy of the Al2Cuθ phase, and found it to be 15 meV/atom larger than for the θ′ phase [150]. Thestability of the θ phase was attributed to its vibrational entropy, approximately+0.37 kB/atom larger than that of θ′ in the harmonic approximation. An entropicstabilization of the θ phase implies a phase transformation to the lower-energyθ′ phase upon cooling. The transformation temperature is predicted to occur atT c = 15 meV/0.37 kB ≃ 200C. There is weak experimental evidence for this phasetransformation, but it should be quite sluggish at this low temperature.
The entropic stabilization of the θ phase may originate with features of its low-symmetry structure. The lowest-frequency optical modes in the θ phase allow forperpendicular motions of neighboring Al and Cu atoms, with minimal change inAl-Cu bond lengths. Wolverton and Ozolins suggest that vibrational entropy stabi-lization may be important for other low-symmetry structures such as Laves phasesin transition metal systems. The general idea is that the low symmetry may resultin a less favorable bonding energy, but this is compensated at higher temperaturesby a larger vibrational entropy originating from floppy atom motions.
Vibrational entropies of formation were calculated for several intermetallic com-pounds in the Al-Sc system by Asta and Ozolins [147]. Although the vibrationalentropy of formation of the stiff L12 Al3Sc from fcc Al and hcp Sc had the largestmagnitude, −0.77 kB/atom, the B2 AlSc and orthorhombic AlSc compounds hadvibrational entropies of formation of −0.58 kB/atom and −0.24 kB/atom. The or-thorhombic Bf compound (BCr prototype) has a lower symmetry than the cubicL12 and B2 structures, and its low-frequency optical modes give it the least negativevibrational entropy of formation of these compounds with strong Al-Sc bonds.
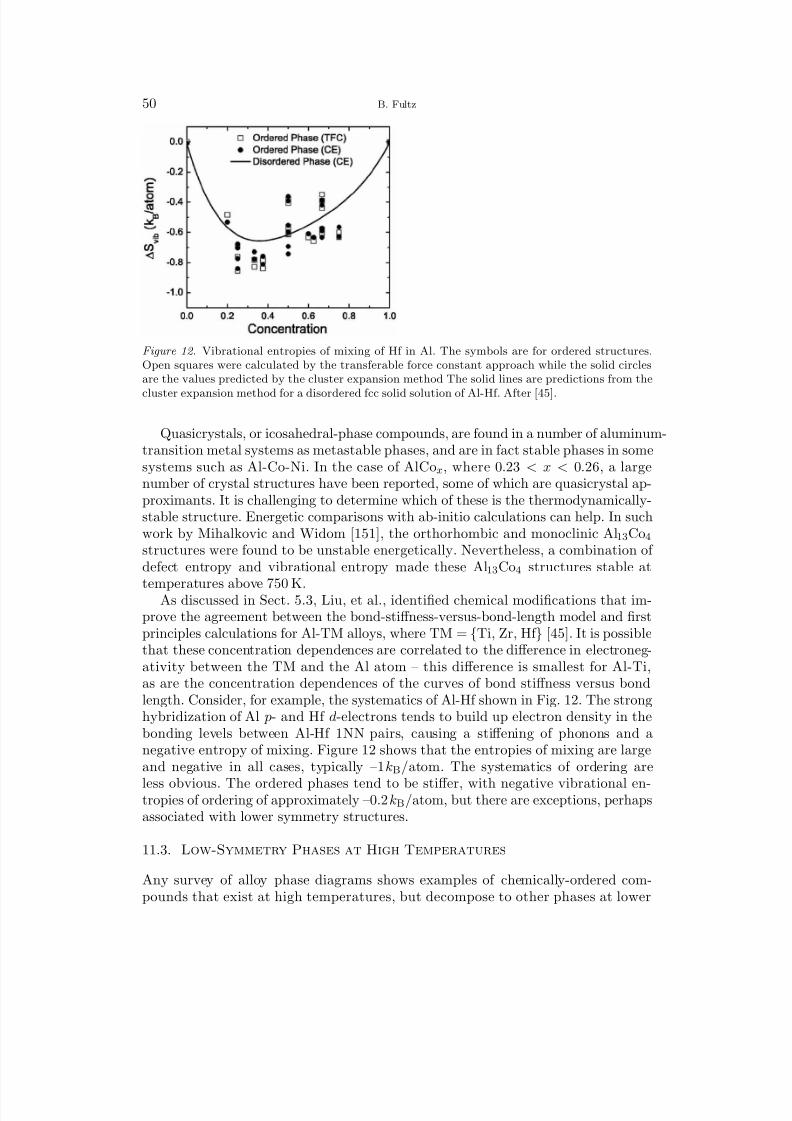
8/13/2019 Vibrational Thermodynamics
http://slidepdf.com/reader/full/vibrational-thermodynamics 54/145
50 B. Fultz
Figure 12. Vibrational entropies of mixing of Hf in Al. The symbols are for ordered structures.Open squares were calculated by the transferable force constant approach while the solid circlesare the values predicted by the cluster expansion method The solid lines are predictions from the
cluster expansion method for a disordered fcc solid solution of Al-Hf. After [45].
Quasicrystals, or icosahedral-phase compounds, are found in a number of aluminum-transition metal systems as metastable phases, and are in fact stable phases in somesystems such as Al-Co-Ni. In the case of AlCox, where 0.23 < x < 0.26, a largenumber of crystal structures have been reported, some of which are quasicrystal ap-proximants. It is challenging to determine which of these is the thermodynamically-stable structure. Energetic comparisons with ab-initio calculations can help. In suchwork by Mihalkovic and Widom [151], the orthorhombic and monoclinic Al13Co4
structures were found to be unstable energetically. Nevertheless, a combination of defect entropy and vibrational entropy made these Al13Co4 structures stable at
temperatures above 750 K.As discussed in Sect. 5.3, Liu, et al., identified chemical modifications that im-prove the agreement between the bond-stiffness-versus-bond-length model and firstprinciples calculations for Al-TM alloys, where TM = Ti, Zr, Hf [45]. It is possiblethat these concentration dependences are correlated to the difference in electroneg-ativity between the TM and the Al atom – this difference is smallest for Al-Ti,as are the concentration dependences of the curves of bond stiffness versus bondlength. Consider, for example, the systematics of Al-Hf shown in Fig. 12. The stronghybridization of Al p- and Hf d-electrons tends to build up electron density in thebonding levels between Al-Hf 1NN pairs, causing a stiffening of phonons and anegative entropy of mixing. Figure 12 shows that the entropies of mixing are largeand negative in all cases, typically –1 kB/atom. The systematics of ordering are
less obvious. The ordered phases tend to be stiffer, with negative vibrational en-tropies of ordering of approximately –0.2 kB/atom, but there are exceptions, perhapsassociated with lower symmetry structures.
11.3. Low-Symmetry Phases at High Temperatures
Any survey of alloy phase diagrams shows examples of chemically-ordered com-pounds that exist at high temperatures, but decompose to other phases at lower
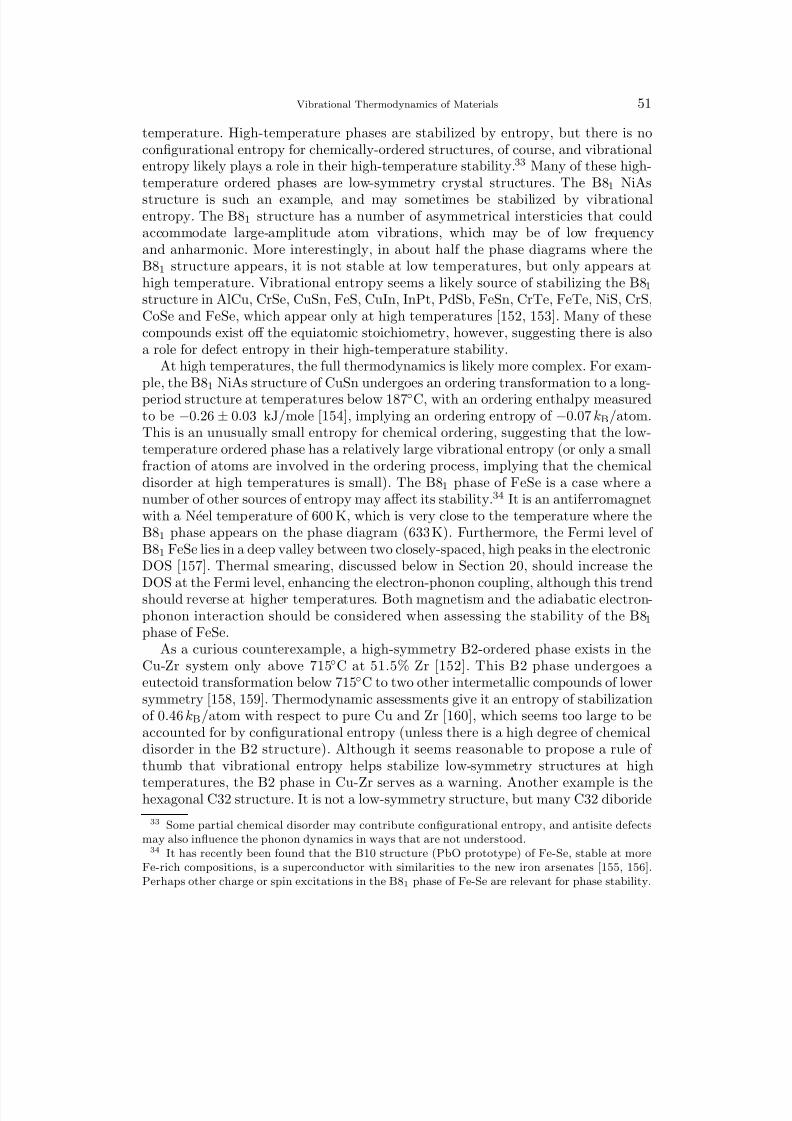
8/13/2019 Vibrational Thermodynamics
http://slidepdf.com/reader/full/vibrational-thermodynamics 55/145
Vibrational Thermodynamics of Materials 51
temperature. High-temperature phases are stabilized by entropy, but there is noconfigurational entropy for chemically-ordered structures, of course, and vibrationalentropy likely plays a role in their high-temperature stability.33 Many of these high-temperature ordered phases are low-symmetry crystal structures. The B81 NiAs
structure is such an example, and may sometimes be stabilized by vibrationalentropy. The B81 structure has a number of asymmetrical intersticies that couldaccommodate large-amplitude atom vibrations, which may be of low frequencyand anharmonic. More interestingly, in about half the phase diagrams where theB81 structure appears, it is not stable at low temperatures, but only appears athigh temperature. Vibrational entropy seems a likely source of stabilizing the B81
structure in AlCu, CrSe, CuSn, FeS, CuIn, InPt, PdSb, FeSn, CrTe, FeTe, NiS, CrS,CoSe and FeSe, which appear only at high temperatures [152, 153]. Many of thesecompounds exist off the equiatomic stoichiometry, however, suggesting there is alsoa role for defect entropy in their high-temperature stability.
At high temperatures, the full thermodynamics is likely more complex. For exam-ple, the B81 NiAs structure of CuSn undergoes an ordering transformation to a long-period structure at temperatures below 187C, with an ordering enthalpy measuredto be −0.26 ± 0.03 kJ/mole [154], implying an ordering entropy of −0.07 kB/atom.This is an unusually small entropy for chemical ordering, suggesting that the low-temperature ordered phase has a relatively large vibrational entropy (or only a smallfraction of atoms are involved in the ordering process, implying that the chemicaldisorder at high temperatures is small). The B81 phase of FeSe is a case where anumber of other sources of entropy may affect its stability.34 It is an antiferromagnetwith a Neel temperature of 600 K, which is very close to the temperature where theB81 phase appears on the phase diagram (633 K). Furthermore, the Fermi level of B81 FeSe lies in a deep valley between two closely-spaced, high peaks in the electronicDOS [157]. Thermal smearing, discussed below in Section 20, should increase the
DOS at the Fermi level, enhancing the electron-phonon coupling, although this trendshould reverse at higher temperatures. Both magnetism and the adiabatic electron-phonon interaction should be considered when assessing the stability of the B81
phase of FeSe.As a curious counterexample, a high-symmetry B2-ordered phase exists in the
Cu-Zr system only above 715C at 51.5% Zr [152]. This B2 phase undergoes aeutectoid transformation below 715C to two other intermetallic compounds of lowersymmetry [158, 159]. Thermodynamic assessments give it an entropy of stabilizationof 0.46 kB/atom with respect to pure Cu and Zr [160], which seems too large to beaccounted for by configurational entropy (unless there is a high degree of chemicaldisorder in the B2 structure). Although it seems reasonable to propose a rule of thumb that vibrational entropy helps stabilize low-symmetry structures at high
temperatures, the B2 phase in Cu-Zr serves as a warning. Another example is thehexagonal C32 structure. It is not a low-symmetry structure, but many C32 diboride
33 Some partial chemical disorder may contribute configurational entropy, and antisite defectsmay also influence the phonon dynamics in ways that are not understood.34 It has recently been found that the B10 structure (PbO prototype) of Fe-Se, stable at more
Fe-rich compositions, is a superconductor with similarities to the new iron arsenates [155, 156].Perhaps other charge or spin excitations in the B81 phase of Fe-Se are relevant for phase stability.
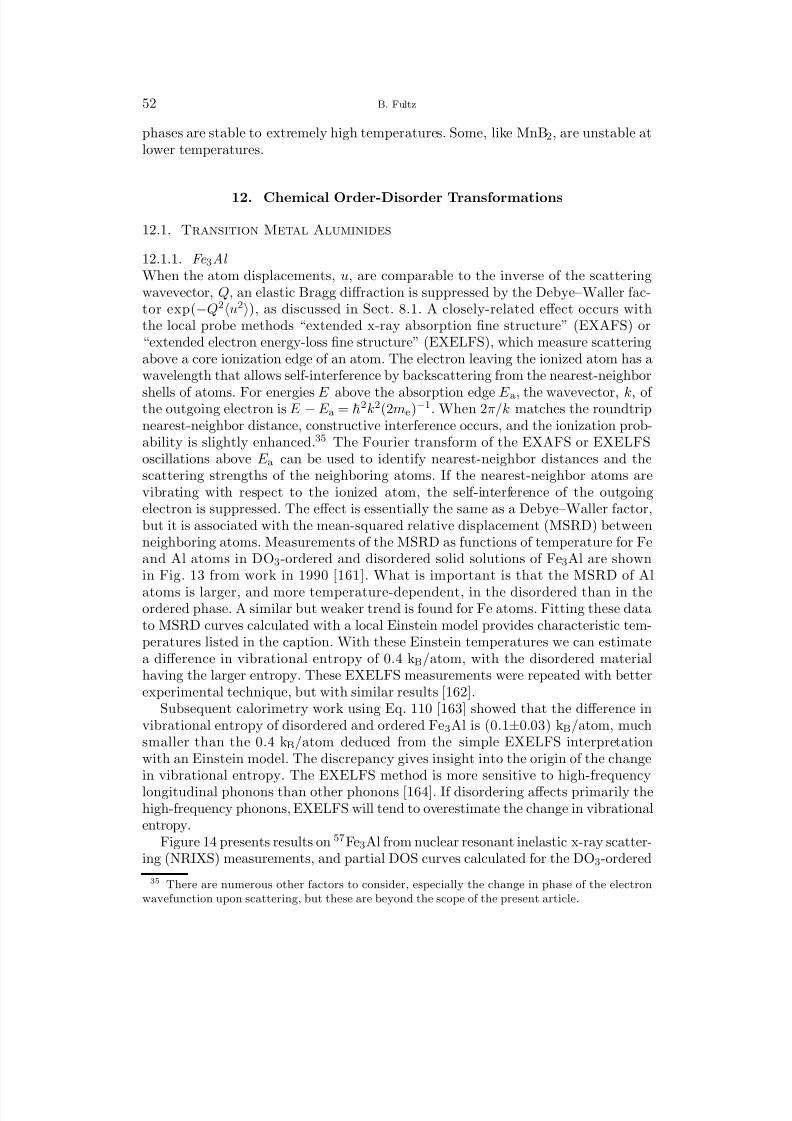
8/13/2019 Vibrational Thermodynamics
http://slidepdf.com/reader/full/vibrational-thermodynamics 56/145
52 B. Fultz
phases are stable to extremely high temperatures. Some, like MnB2, are unstable atlower temperatures.
12. Chemical Order-Disorder Transformations
12.1. Transition Metal Aluminides
12.1.1. Fe 3Al
When the atom displacements, u, are comparable to the inverse of the scatteringwavevector, Q, an elastic Bragg diffraction is suppressed by the Debye–Waller fac-tor exp(−Q2u2), as discussed in Sect. 8.1. A closely-related effect occurs withthe local probe methods “extended x-ray absorption fine structure” (EXAFS) or“extended electron energy-loss fine structure” (EXELFS), which measure scatteringabove a core ionization edge of an atom. The electron leaving the ionized atom has awavelength that allows self-interference by backscattering from the nearest-neighbor
shells of atoms. For energies E above the absorption edge E a, the wavevector, k, of the outgoing electron is E − E a =
2k2(2me)−1. When 2π/k matches the roundtripnearest-neighbor distance, constructive interference occurs, and the ionization prob-ability is slightly enhanced.35 The Fourier transform of the EXAFS or EXELFSoscillations above E a can be used to identify nearest-neighbor distances and thescattering strengths of the neighboring atoms. If the nearest-neighbor atoms arevibrating with respect to the ionized atom, the self-interference of the outgoingelectron is suppressed. The effect is essentially the same as a Debye–Waller factor,but it is associated with the mean-squared relative displacement (MSRD) betweenneighboring atoms. Measurements of the MSRD as functions of temperature for Feand Al atoms in DO3-ordered and disordered solid solutions of Fe3Al are shownin Fig. 13 from work in 1990 [161]. What is important is that the MSRD of Al
atoms is larger, and more temperature-dependent, in the disordered than in theordered phase. A similar but weaker trend is found for Fe atoms. Fitting these datato MSRD curves calculated with a local Einstein model provides characteristic tem-peratures listed in the caption. With these Einstein temperatures we can estimatea difference in vibrational entropy of 0.4 kB/atom, with the disordered materialhaving the larger entropy. These EXELFS measurements were repeated with betterexperimental technique, but with similar results [162].
Subsequent calorimetry work using Eq. 110 [163] showed that the difference invibrational entropy of disordered and ordered Fe3Al is (0.1±0.03) kB/atom, muchsmaller than the 0.4 kB/atom deduced from the simple EXELFS interpretationwith an Einstein model. The discrepancy gives insight into the origin of the changein vibrational entropy. The EXELFS method is more sensitive to high-frequencylongitudinal phonons than other phonons [164]. If disordering affects primarily thehigh-frequency phonons, EXELFS will tend to overestimate the change in vibrationalentropy.
Figure 14 presents results on 57Fe3Al from nuclear resonant inelastic x-ray scatter-ing (NRIXS) measurements, and partial DOS curves calculated for the DO3-ordered
35 There are numerous other factors to consider, especially the change in phase of the electronwavefunction upon scattering, but these are beyond the scope of the present article.
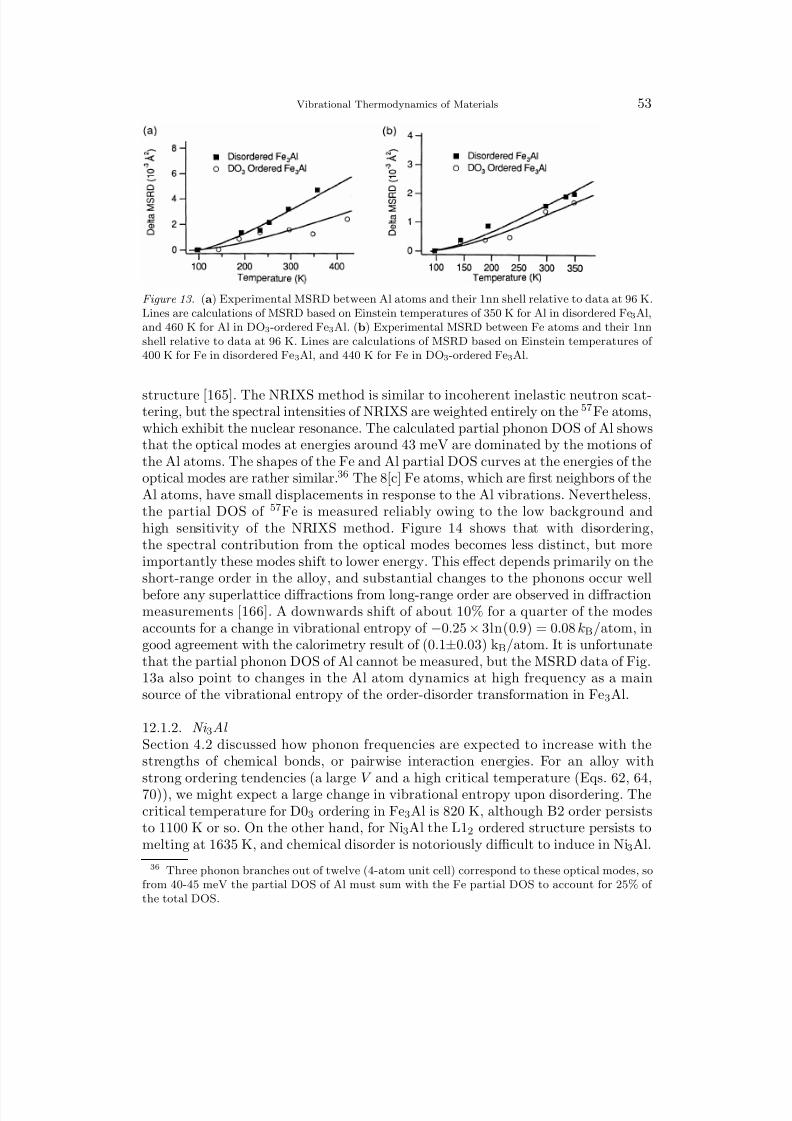
8/13/2019 Vibrational Thermodynamics
http://slidepdf.com/reader/full/vibrational-thermodynamics 57/145
Vibrational Thermodynamics of Materials 53
Figure 13. (a) Experimental MSRD between Al atoms and their 1nn shell relative to data at 96 K.Lines are calculations of MSRD based on Einstein temperatures of 350 K for Al in disordered Fe3Al,and 460 K for Al in DO3-ordered Fe3Al. (b) Experimental MSRD between Fe atoms and their 1nnshell relative to data at 96 K. Lines are calculations of MSRD based on Einstein temperatures of 400 K for Fe in disordered Fe3Al, and 440 K for Fe in DO3-ordered Fe3Al.
structure [165]. The NRIXS method is similar to incoherent inelastic neutron scat-tering, but the spectral intensities of NRIXS are weighted entirely on the 57Fe atoms,which exhibit the nuclear resonance. The calculated partial phonon DOS of Al showsthat the optical modes at energies around 43 meV are dominated by the motions of the Al atoms. The shapes of the Fe and Al partial DOS curves at the energies of theoptical modes are rather similar.36 The 8[c] Fe atoms, which are first neighbors of theAl atoms, have small displacements in response to the Al vibrations. Nevertheless,the partial DOS of 57Fe is measured reliably owing to the low background andhigh sensitivity of the NRIXS method. Figure 14 shows that with disordering,the spectral contribution from the optical modes becomes less distinct, but moreimportantly these modes shift to lower energy. This effect depends primarily on theshort-range order in the alloy, and substantial changes to the phonons occur wellbefore any superlattice diffractions from long-range order are observed in diffractionmeasurements [166]. A downwards shift of about 10% for a quarter of the modesaccounts for a change in vibrational entropy of −0.25 × 3ln(0.9) = 0.08 kB/atom, ingood agreement with the calorimetry result of (0.1±0.03) kB/atom. It is unfortunatethat the partial phonon DOS of Al cannot be measured, but the MSRD data of Fig.13a also point to changes in the Al atom dynamics at high frequency as a mainsource of the vibrational entropy of the order-disorder transformation in Fe 3Al.
12.1.2. Ni 3Al
Section 4.2 discussed how phonon frequencies are expected to increase with thestrengths of chemical bonds, or pairwise interaction energies. For an alloy withstrong ordering tendencies (a large V and a high critical temperature (Eqs. 62, 64,70)), we might expect a large change in vibrational entropy upon disordering. Thecritical temperature for D03 ordering in Fe3Al is 820 K, although B2 order persiststo 1100 K or so. On the other hand, for Ni3Al the L12 ordered structure persists tomelting at 1635 K, and chemical disorder is notoriously difficult to induce in Ni3Al.
36 Three phonon branches out of twelve (4-atom unit cell) correspond to these optical modes, sofrom 40-45 meV the partial DOS of Al must sum with the Fe partial DOS to account for 25% of the total DOS.
8/13/2019 Vibrational Thermodynamics
http://slidepdf.com/reader/full/vibrational-thermodynamics 58/145
54 B. Fultz
Figure 14. Phonon partial DOS curves for 57Fe in 57Fe3Al. Top: Calculated with a Born – vonKarman model using force constants from prior neutron scattering measurements on single crystalsof DO3-ordered Fe3Al, convoluted with an experimental resolution function. Bottom: 57Fe phononpartial DOS curves from Fe3Al with high long-range order (“Ord”), some short-range order (“Par”),and no measurable short-range order (“Dis”).
Disordered samples of Ni-25at.%Al were prepared by physical vapor deposition ontocold substrates, and their heat capacity was compared to annealed samples with L1 2
chemical order using differential scanning calorimetry (Sect. 7) and Eq. 110 [167,168]. X-ray Debye–Waller factor measurements and EXELFS MSRD measurements
were also performed on these pairs of ordered and disordered samples, indicatingthat the vibrational entropy of the disordered Ni3Al was 0.3 kB/atom larger thanthe ordered (error bars are probably ±0.1).
Inelastic neutron scattering measurements were performed on disordered Ni3Alprepared by high-energy ball milling, and experimental spectra are presented in Fig.15a [169]. The optical modes at 39 meV in the ordered alloy are clearly suppressedby disordering, and the disordered spectra show new intensity around 32 meV. Thephonon DOS of the ordered Ni3Al was possible to deduce from the experimentalspectra by a neutron weight correction based on a comparison with a Born-vonKarman calculation from prior work on single crystals of L12 Ni3Al [170]. As ex-pected by footnote 36 for ordered Fe3Al, there is indeed about 25% of the intensityin the optical mode peak around 39 meV in the neutron-weight corrected spectrum
in Fig. 15b. The proper correction for the disordered sample is less obvious, but itshould lie between two extremes. The first, labeled “Dis 1” in Fig. 15b, assumes avirtual crystal, with no neutron weighting of the different parts of the phonon DOS.The intensity at high energies is probably too low, since many Al atoms are stillexpected to vibrate in local modes. The second, labeled “Dis 2” in Fig. 15b, used thesame neutron weight correction as for the ordered alloy. This method probably givestoo much intensity in the modes around 39 meV because with disorder there is clearly
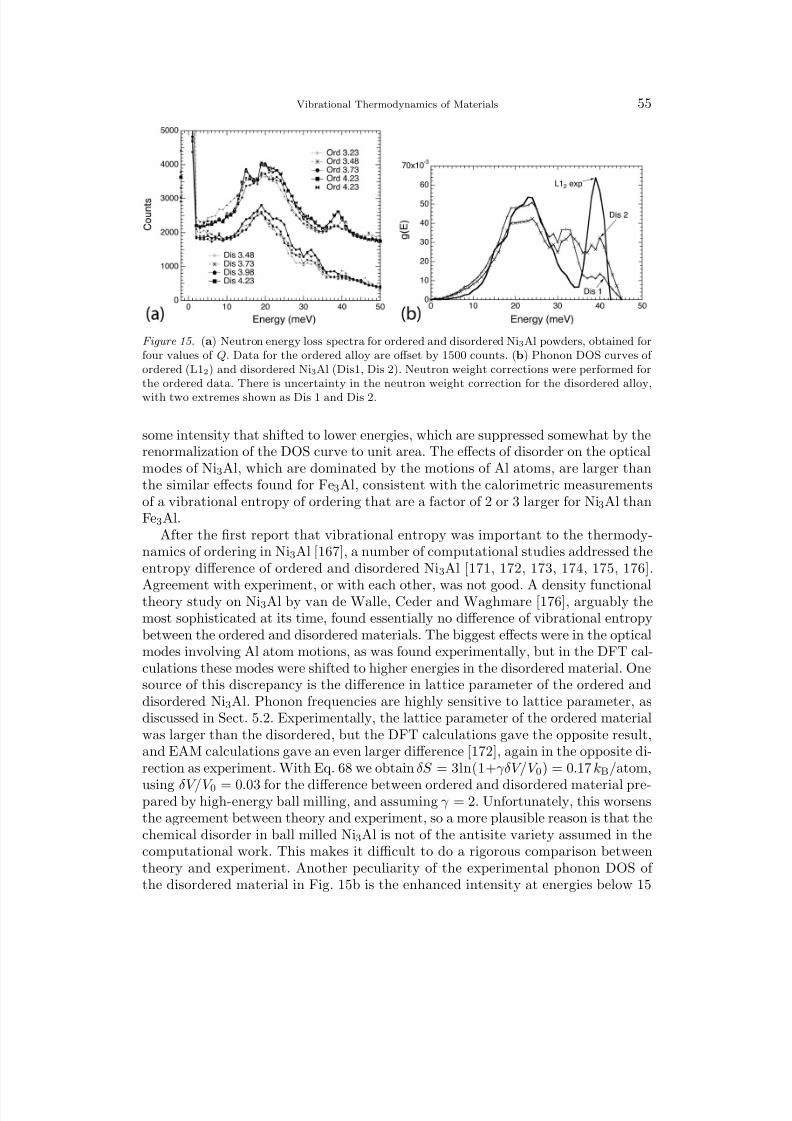
8/13/2019 Vibrational Thermodynamics
http://slidepdf.com/reader/full/vibrational-thermodynamics 59/145
Vibrational Thermodynamics of Materials 55
Figure 15. (a) Neutron energy loss spectra for ordered and disordered Ni3Al powders, obtained forfour values of Q. Data for the ordered alloy are offset by 1500 counts. (b) Phonon DOS curves of ordered (L12) and disordered Ni3Al (Dis1, Dis 2). Neutron weight corrections were performed forthe ordered data. There is uncertainty in the neutron weight correction for the disordered alloy,
with two extremes shown as Dis 1 and Dis 2.
some intensity that shifted to lower energies, which are suppressed somewhat by therenormalization of the DOS curve to unit area. The effects of disorder on the opticalmodes of Ni3Al, which are dominated by the motions of Al atoms, are larger thanthe similar effects found for Fe3Al, consistent with the calorimetric measurementsof a vibrational entropy of ordering that are a factor of 2 or 3 larger for Ni3Al thanFe3Al.
After the first report that vibrational entropy was important to the thermody-namics of ordering in Ni3Al [167], a number of computational studies addressed theentropy difference of ordered and disordered Ni3Al [171, 172, 173, 174, 175, 176].
Agreement with experiment, or with each other, was not good. A density functionaltheory study on Ni3Al by van de Walle, Ceder and Waghmare [176], arguably themost sophisticated at its time, found essentially no difference of vibrational entropybetween the ordered and disordered materials. The biggest effects were in the opticalmodes involving Al atom motions, as was found experimentally, but in the DFT cal-culations these modes were shifted to higher energies in the disordered material. Onesource of this discrepancy is the difference in lattice parameter of the ordered anddisordered Ni3Al. Phonon frequencies are highly sensitive to lattice parameter, asdiscussed in Sect. 5.2. Experimentally, the lattice parameter of the ordered materialwas larger than the disordered, but the DFT calculations gave the opposite result,and EAM calculations gave an even larger difference [172], again in the opposite di-rection as experiment. With Eq. 68 we obtain δS = 3ln(1+γδV/V 0) = 0.17 kB/atom,
using δV/V 0 = 0.03 for the difference between ordered and disordered material pre-pared by high-energy ball milling, and assuming γ = 2. Unfortunately, this worsensthe agreement between theory and experiment, so a more plausible reason is that thechemical disorder in ball milled Ni3Al is not of the antisite variety assumed in thecomputational work. This makes it difficult to do a rigorous comparison betweentheory and experiment. Another peculiarity of the experimental phonon DOS of the disordered material in Fig. 15b is the enhanced intensity at energies below 15
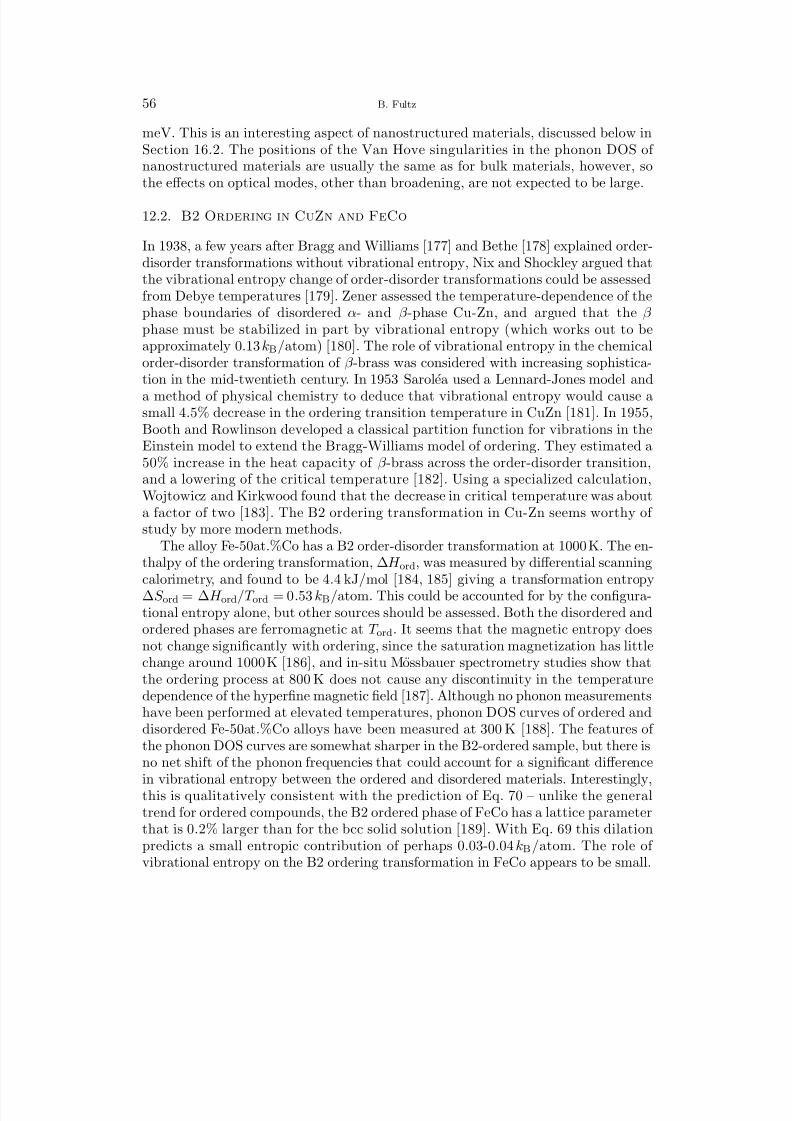
8/13/2019 Vibrational Thermodynamics
http://slidepdf.com/reader/full/vibrational-thermodynamics 60/145
8/13/2019 Vibrational Thermodynamics
http://slidepdf.com/reader/full/vibrational-thermodynamics 61/145
Vibrational Thermodynamics of Materials 57
12.3. L12 Ordering
12.3.1. Cu 3Au
In 1954, Bowen reported measurements of the electrical resistivity of ordered and
disordered Cu3Au over a range of cryogenic temperatures [190]. Debye temperaturesof 175 and 197 K were reported for the disordered and ordered alloys, suggest-ing that the disordered phase had a larger vibrational entropy by the amount37
3 ln(197/175) = 0.35 [kB/atom]. Flinn, McManus and Rayne [191] measured theelastic constants of ordered and disordered Cu3Au from 4.2 to 300K, finding dif-ferences of less than 1%. They criticized Bowen’s results, “It is concluded thatlittle significance can be attached to [Debye temperatures] obtained from resistancemeasurements on Cu3Au.”38 Rayne had performed an earlier calorimetric study onordered and disordered Cu3Au [193], and found evidence that vibrational entropyof ordering was between the values reported in [190] and [191]. Nevertheless, themessage from Flinn, McManus and Rayne was that the difference in vibrationalentropy of ordered and disordered Cu3Au was not important thermodynamically.
This thinking persisted for decades.Differences in the phonon spectra of ordered and disordered Cu3Au were mea-
sured more recently [194] with a triple-axis spectrometer, but the thermodynamicconsequences were not assessed. There is risk, however, in interpreting the peaks inthe phonon scans at constant Q, measured on single crystals of disordered material.Specifically, the peaks in I (ε) from the disordered solid solution of Cu3Au were inter-preted as energies of phonons in a “virtual” fcc crystal, which assumes one speciesof atom with average properties of Cu and Au atoms. The virtual crystal is notexpected to be trustworthy when the Cu and Au atoms differ in mass by a factor of three, and differ considerably in their atomic radius. Nevertheless, this approach wasused in an earlier reconciliation of the phonon dispersion curves with heat capacitydata [168, 195]. The calorimetric measurements by Nagel, et al., showed that as adisordered solid solution, Cu3Au has a larger vibrational entropy than for the L12
structure by about 0.14±0.05 kB/atom [195, 196]. A similar value was obtained froma lattice dynamics calculation with forces derived from tight-binding potentials witha virtual crystal approximation [197] and other potentials [174, 198], although therewere differences in interpretation. Surface effects were also investigated [199].
The neutron weighting problem (Sect. 8.3) is a major challenge for phonon spectraof Cu3Au measured by time-of-flight instruments. An atom of Cu is 3.2 times moreefficient than Au for phonon scattering. Because the atom masses differ by a factorof 3.1, we expect a tendency of Au atoms to have larger displacements in low-energy modes, and Cu atom motions to dominate at higher energies. Correcting forneutron weighting is not difficult when a Born–von Karman model is developed for
ordered phases with a periodic unit cell, but it is difficult to perform for disorderedsolid solutions. It is probably more reliable to work with the entropy as an integralquantity of the phonon DOS, defining a neutron-weighted vibrational entropy, S nw
vib,
37 The factor of 3 arises because each atom has 3 degrees of freedom in 3 dimensions.38 Rossiter and Bykovec later showed that the electrical resitivity of Cu3Au depends in a complex
way on the presence of antiphase domain boundaries, and is not a simple function of order parameter[192].
8/13/2019 Vibrational Thermodynamics
http://slidepdf.com/reader/full/vibrational-thermodynamics 62/145
58 B. Fultz
Figure 16. Phonon DOS curves of ordered and disordered Cu3Au, corrected for neutron weighting[201].
that differs from the true vibrational entropy S vib:
S nwvib =
3.2(1 − x)S Cuvib(x) + xS Au
vib(x)
3.2(1 − x) + x , (119)
S vib = (1 − x)S Cuvib(x) + xS Au
vib(x) , (120)
where S Cuvib(x) and S Au
vib are the phonon partial DOS functions for Cu and Au atthe Au concentration, x.39 Several approaches were used to correct Eq. 119 for theneutron weighting of Cu-Au alloys [200], with the best estimate that the disorderedphase has a larger vibrational entropy than the ordered by 0.15±0.05 kB /atom at300K.
A method for neutron weight correction of solid solutions is described in section
13.2, and an early version of this approach was used to correct the phonon DOScurves in Fig. 16 [188, 200, 201]. The most prominent effect of disorder is a shift of intensity from peaks at 21 and 25 meV to lower energies, increasing the vibrationalentropy of disordered Cu3Au by about 0.15 kB/atom, in general agreement withthe calorimetry results [195]. Other phonon spectra [200], and computational workby Ozolins, Wolverton and Zunger [202], also showed this change in the spectrumat 21 meV owing to changes optical modes (or local oscillations) emphasizing Cuatoms.
Using the force constants of L12-ordered Cu3Au, the motions of atoms in thedifferent modes can be identified. The highest frequency modes around 25 meVinvolve the motions of Cu atoms against Au atoms. The Cu-atom motions werefound primarily in the modes around 21 meV, and are associated with local Cu atom
movements with less response from each Au neighbor. In some of these modes, a Cuatom moves perpendicular to the face of the of the standard L1 2 structural cube.The constraints on the motions of Cu atoms from the framework of the massiveAu atoms, a characteristic of the L12 structure of Cu3Au, could be removed in thedisordered alloy. This may cause a shift of the modes at 21 meV to lower energy.Although we do not have a definitive picture of the lattice dynamics of the disordered
39 Note that when S Cuvib(x) = S Auvib(x), S vib = S nwvib.
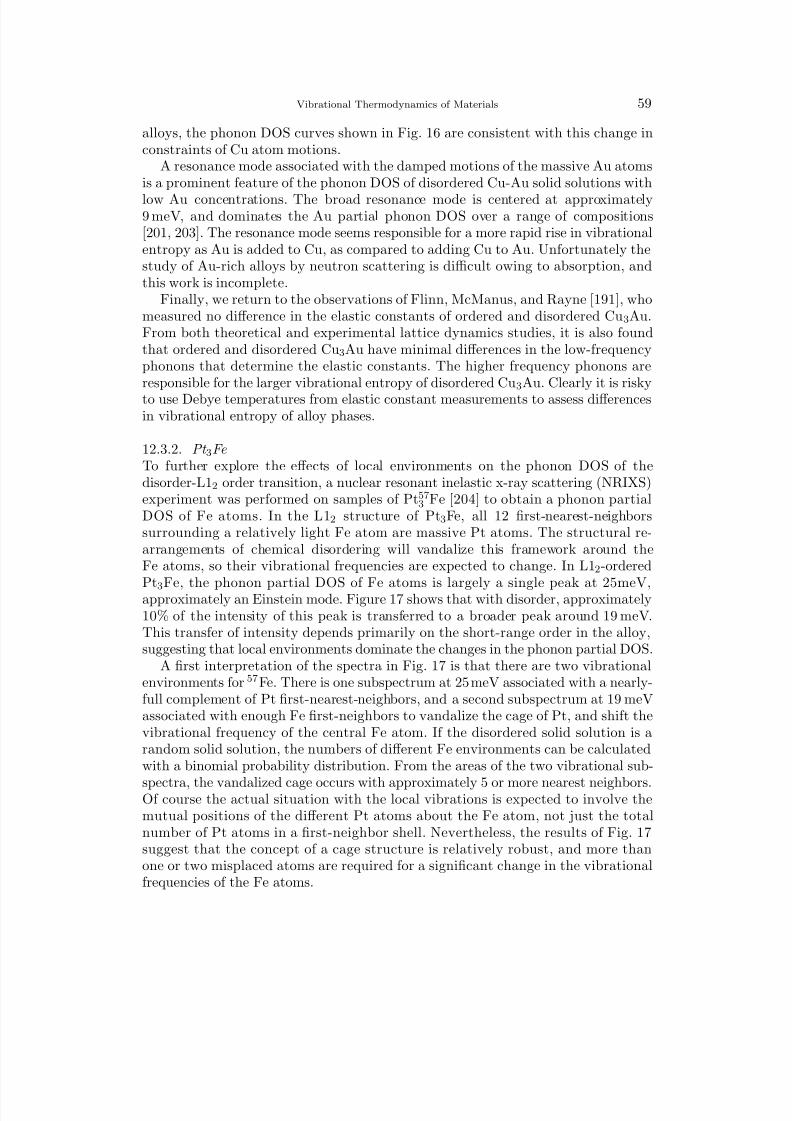
8/13/2019 Vibrational Thermodynamics
http://slidepdf.com/reader/full/vibrational-thermodynamics 63/145
Vibrational Thermodynamics of Materials 59
alloys, the phonon DOS curves shown in Fig. 16 are consistent with this change inconstraints of Cu atom motions.
A resonance mode associated with the damped motions of the massive Au atomsis a prominent feature of the phonon DOS of disordered Cu-Au solid solutions with
low Au concentrations. The broad resonance mode is centered at approximately9 meV, and dominates the Au partial phonon DOS over a range of compositions[201, 203]. The resonance mode seems responsible for a more rapid rise in vibrationalentropy as Au is added to Cu, as compared to adding Cu to Au. Unfortunately thestudy of Au-rich alloys by neutron scattering is difficult owing to absorption, andthis work is incomplete.
Finally, we return to the observations of Flinn, McManus, and Rayne [191], whomeasured no difference in the elastic constants of ordered and disordered Cu 3Au.From both theoretical and experimental lattice dynamics studies, it is also foundthat ordered and disordered Cu3Au have minimal differences in the low-frequencyphonons that determine the elastic constants. The higher frequency phonons areresponsible for the larger vibrational entropy of disordered Cu3Au. Clearly it is riskyto use Debye temperatures from elastic constant measurements to assess differencesin vibrational entropy of alloy phases.
12.3.2. Pt 3Fe
To further explore the effects of local environments on the phonon DOS of thedisorder-L12 order transition, a nuclear resonant inelastic x-ray scattering (NRIXS)experiment was performed on samples of Pt57
3 Fe [204] to obtain a phonon partialDOS of Fe atoms. In the L12 structure of Pt3Fe, all 12 first-nearest-neighborssurrounding a relatively light Fe atom are massive Pt atoms. The structural re-arrangements of chemical disordering will vandalize this framework around theFe atoms, so their vibrational frequencies are expected to change. In L12-ordered
Pt3Fe, the phonon partial DOS of Fe atoms is largely a single peak at 25meV,approximately an Einstein mode. Figure 17 shows that with disorder, approximately10% of the intensity of this peak is transferred to a broader peak around 19 meV.This transfer of intensity depends primarily on the short-range order in the alloy,suggesting that local environments dominate the changes in the phonon partial DOS.
A first interpretation of the spectra in Fig. 17 is that there are two vibrationalenvironments for 57Fe. There is one subspectrum at 25 meV associated with a nearly-full complement of Pt first-nearest-neighbors, and a second subspectrum at 19 meVassociated with enough Fe first-neighbors to vandalize the cage of Pt, and shift thevibrational frequency of the central Fe atom. If the disordered solid solution is arandom solid solution, the numbers of different Fe environments can be calculatedwith a binomial probability distribution. From the areas of the two vibrational sub-
spectra, the vandalized cage occurs with approximately 5 or more nearest neighbors.Of course the actual situation with the local vibrations is expected to involve themutual positions of the different Pt atoms about the Fe atom, not just the totalnumber of Pt atoms in a first-neighbor shell. Nevertheless, the results of Fig. 17suggest that the concept of a cage structure is relatively robust, and more thanone or two misplaced atoms are required for a significant change in the vibrationalfrequencies of the Fe atoms.
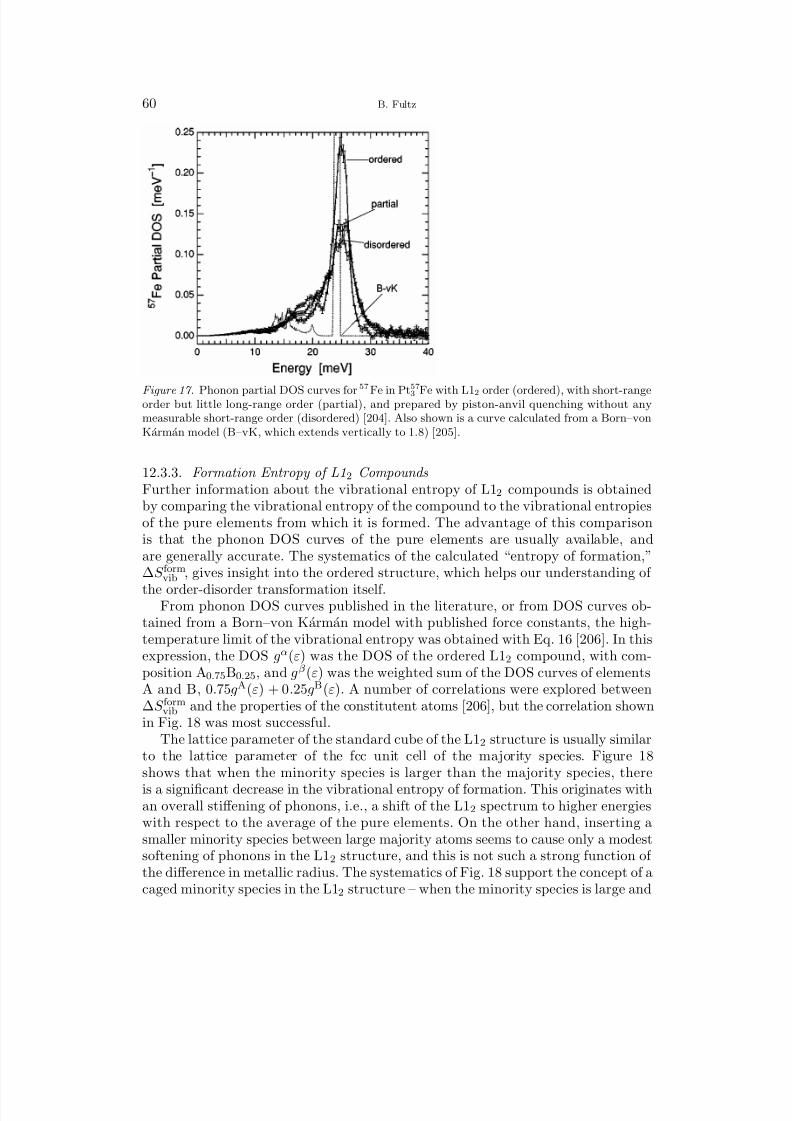
8/13/2019 Vibrational Thermodynamics
http://slidepdf.com/reader/full/vibrational-thermodynamics 64/145
60 B. Fultz
Figure 17. Phonon partial DOS curves for 57
Fe in Pt573 Fe with L12 order (ordered), with short-range
order but little long-range order (partial), and prepared by piston-anvil quenching without anymeasurable short-range order (disordered) [204]. Also shown is a curve calculated from a Born–vonKarman model (B–vK, which extends vertically to 1.8) [205].
12.3.3. Formation Entropy of L12 Compounds
Further information about the vibrational entropy of L12 compounds is obtainedby comparing the vibrational entropy of the compound to the vibrational entropiesof the pure elements from which it is formed. The advantage of this comparisonis that the phonon DOS curves of the pure elements are usually available, andare generally accurate. The systematics of the calculated “entropy of formation,”∆S form
vib , gives insight into the ordered structure, which helps our understanding of
the order-disorder transformation itself.From phonon DOS curves published in the literature, or from DOS curves ob-
tained from a Born–von Karman model with published force constants, the high-temperature limit of the vibrational entropy was obtained with Eq. 16 [206]. In thisexpression, the DOS gα(ε) was the DOS of the ordered L12 compound, with com-position A0.75B0.25, and gβ (ε) was the weighted sum of the DOS curves of elementsA and B, 0.75gA(ε) + 0.25gB(ε). A number of correlations were explored between∆S form
vib and the properties of the constitutent atoms [206], but the correlation shownin Fig. 18 was most successful.
The lattice parameter of the standard cube of the L12 structure is usually similarto the lattice parameter of the fcc unit cell of the majority species. Figure 18shows that when the minority species is larger than the majority species, there
is a significant decrease in the vibrational entropy of formation. This originates withan overall stiffening of phonons, i.e., a shift of the L1 2 spectrum to higher energieswith respect to the average of the pure elements. On the other hand, inserting asmaller minority species between large majority atoms seems to cause only a modestsoftening of phonons in the L12 structure, and this is not such a strong function of the difference in metallic radius. The systematics of Fig. 18 support the concept of acaged minority species in the L12 structure – when the minority species is large and
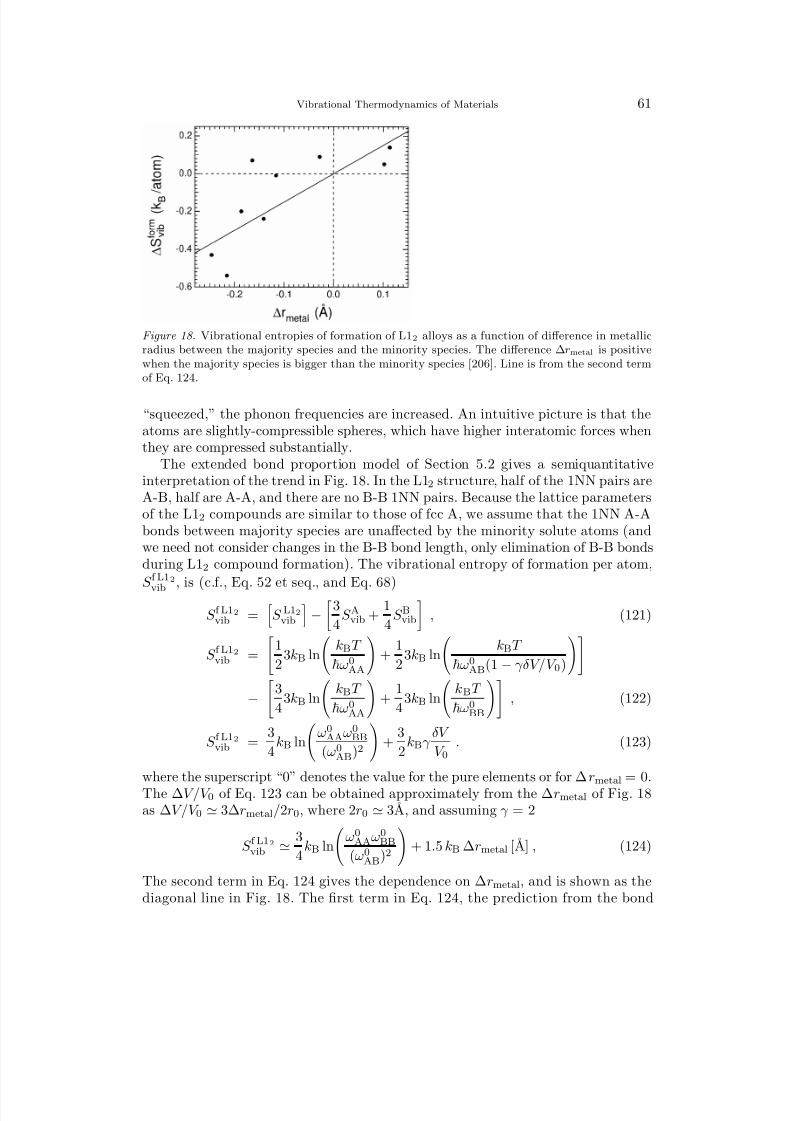
8/13/2019 Vibrational Thermodynamics
http://slidepdf.com/reader/full/vibrational-thermodynamics 65/145
Vibrational Thermodynamics of Materials 61
Figure 18. Vibrational entropies of formation of L12 alloys as a function of difference in metallicradius between the majority species and the minority species. The difference ∆rmetal is positivewhen the majority species is bigger than the minority species [206]. Line is from the second termof Eq. 124.
“squeezed,” the phonon frequencies are increased. An intuitive picture is that theatoms are slightly-compressible spheres, which have higher interatomic forces whenthey are compressed substantially.
The extended bond proportion model of Section 5.2 gives a semiquantitativeinterpretation of the trend in Fig. 18. In the L12 structure, half of the 1NN pairs areA-B, half are A-A, and there are no B-B 1NN pairs. Because the lattice parametersof the L12 compounds are similar to those of fcc A, we assume that the 1NN A-Abonds between majority species are unaffected by the minority solute atoms (andwe need not consider changes in the B-B bond length, only elimination of B-B bondsduring L12 compound formation). The vibrational entropy of formation per atom,
S
f L12
vib , is (c.f., Eq. 52 et seq., and Eq. 68)
S f L12vib =
S L12
vib
−
3
4S Avib +
1
4S Bvib
, (121)
S f L12vib =
1
23kB ln
kBT
ω0AA
+
1
23kB ln
kBT
ω0AB(1 − γδV/V 0)
−
3
43kB ln
kBT
ω0AA
+
1
43kB ln
kBT
ω0BB
, (122)
S f L12vib =
3
4kB ln
ω0
AAω0BB
(ω0AB)2
+
3
2kBγ
δV
V 0. (123)
where the superscript “0” denotes the value for the pure elements or for ∆ rmetal
= 0.The ∆V/V 0 of Eq. 123 can be obtained approximately from the ∆ rmetal of Fig. 18as ∆V/V 0 ≃ 3∆rmetal/2r0, where 2r0 ≃ 3A, and assuming γ = 2
S f L12vib ≃ 3
4kB ln
ω0
AAω0BB
(ω0AB)2
+ 1.5 kB ∆rmetal [A] , (124)
The second term in Eq. 124 gives the dependence on ∆rmetal, and is shown as thediagonal line in Fig. 18. The first term in Eq. 124, the prediction from the bond
8/13/2019 Vibrational Thermodynamics
http://slidepdf.com/reader/full/vibrational-thermodynamics 66/145
62 B. Fultz
proportion model (cf., last term in Eq. 61), should cause the line to be offset fromthe origin. This first term is also expected to cause deviations from the line.
12.3.4. Mass and Volume Effects in Intermetallic Compounds
It is interesting to compare changes in the phonon DOS when one of the atomicspecies in an ordered compound is replaced with atoms of a different element.After this substitution, the vibrational entropy is expected to decrease with forceconstant, increase with mass, and increase with lattice parameter. All such effectscould be present simultaneously, and in different amounts for different alloy systems,so rigorous predictions are challenging. Experimental phonon spectra were usedto test these expected correlations when the minority atoms were replaced andthe crystal structure was largely unchanged [206]. Changes in vibrational entropywere obtained when the minority B-atoms in A3B L12, A3B A15, and A2B Lavesphase compounds were replaced by a different species. The ∆S vib showed a faircorrelation to the expected effects of a change in the mass of the minority species(3/2 c kB ln(m1/m2)), when added to the effects expected from the change in unitcell volume (cf., Eq. 66). A precise correlation is not expected, however, in partbecause the interatomic distances do not track the change in volume of the unit cell.
An example of such a change in vibrational entropy with minority species sub-stitution is shown in Fig. 19 [207]. Figures 19a and 19b show the 57Fe phononpartial DOS of L12-ordered Pt57
3 Fe and Pd573 Fe, together with curves calculated
with force constants from prior inelastic neutron scattering experiments [205, 208].The atoms Pt and Pd have many chemical similarities, so it might be expected thatthe interatomic forces do not change significantly with the substitution of Pd forPt. Figure 19c shows the result of a Born–von K arman calculation that used theforce constants for Pt, but the mass was changed to that of Pd (from 195 to 106).There is a semi-quantitative agreement with the actual 57Fe phonon partial DOS of
L12-ordered Pd
57
3 Fe, suggesting the importance of the mass itself, but quantitativepredictions of vibrational entropy are risky in this system, which undergoes an Invartransition under pressure.
13. Unmixing
13.1. Computational Studies of Unmixing
The transformation from a disordered solid solution to two phases of distinct chemi-cal composition causes major changes in local chemistry, and substantial changes inconfigurational entropy. Nevertheless, there can be a large change in vibrational en-
tropy when forming a disordered solid solution (Section 4.1). There are challenges incalculating phonons in disordered solid solutions. In first-principles electronic struc-ture studies by Ozolins, Wolverton and Zunger [209], effects of vibrational entropywere deduced (and effects on the miscibility gaps were assessed), by subtracting acalculated configurational entropy from an experimental total entropy of formation.This left a residual entropy of formation that was probably vibrational. For theformation of disordered equiatomic Ni-Au from pure Ni and pure Au, the vibrationalentropy of formation was +0.48 kB/atom. For a solid solution of Cu-Ag, the vibra-
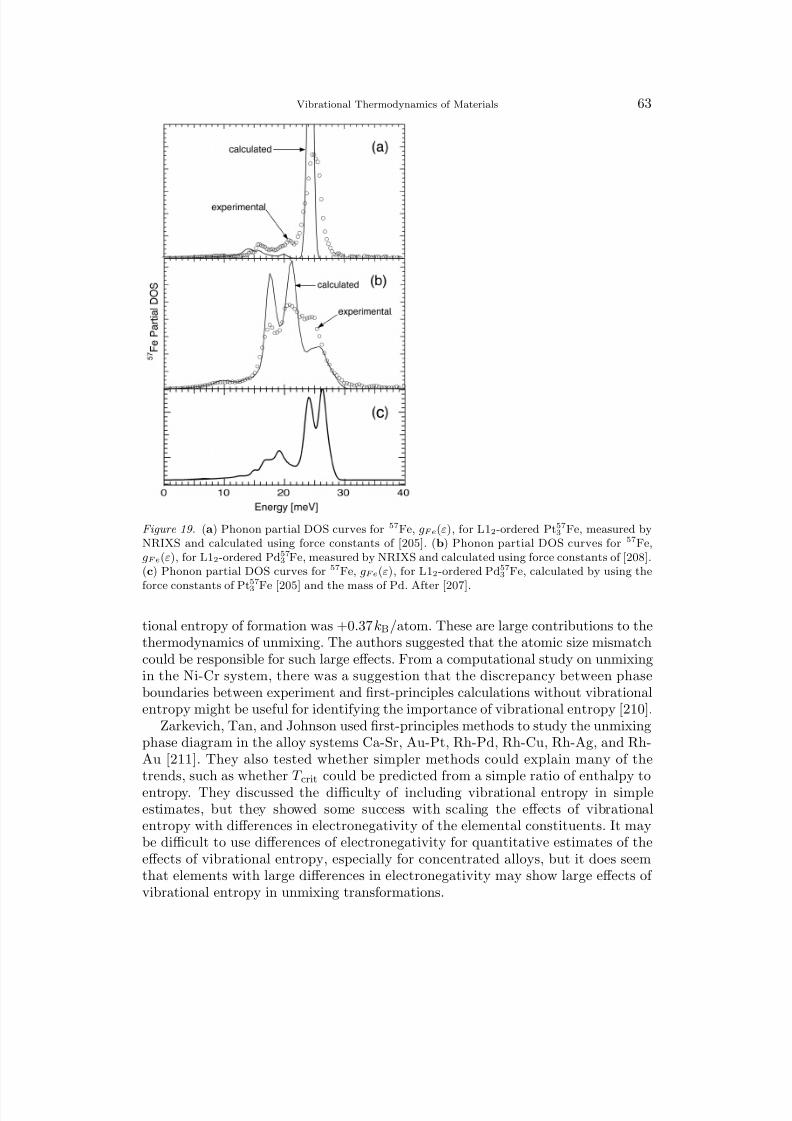
8/13/2019 Vibrational Thermodynamics
http://slidepdf.com/reader/full/vibrational-thermodynamics 67/145
Vibrational Thermodynamics of Materials 63
Figure 19. (a) Phonon partial DOS curves for 57Fe, gFe(ε), for L12-ordered Pt573 Fe, measured byNRIXS and calculated using force constants of [205]. (b) Phonon partial DOS curves for 57Fe,gFe(ε), for L12-ordered Pd573 Fe, measured by NRIXS and calculated using force constants of [208].(c) Phonon partial DOS curves for 57Fe, gFe(ε), for L12-ordered Pd573 Fe, calculated by using the
force constants of Pt57
3 Fe [205] and the mass of Pd. After [207].
tional entropy of formation was +0.37 kB/atom. These are large contributions to thethermodynamics of unmixing. The authors suggested that the atomic size mismatchcould be responsible for such large effects. From a computational study on unmixingin the Ni-Cr system, there was a suggestion that the discrepancy between phaseboundaries between experiment and first-principles calculations without vibrationalentropy might be useful for identifying the importance of vibrational entropy [210].
Zarkevich, Tan, and Johnson used first-principles methods to study the unmixingphase diagram in the alloy systems Ca-Sr, Au-Pt, Rh-Pd, Rh-Cu, Rh-Ag, and Rh-Au [211]. They also tested whether simpler methods could explain many of thetrends, such as whether T crit could be predicted from a simple ratio of enthalpy toentropy. They discussed the difficulty of including vibrational entropy in simpleestimates, but they showed some success with scaling the effects of vibrationalentropy with differences in electronegativity of the elemental constituents. It maybe difficult to use differences of electronegativity for quantitative estimates of theeffects of vibrational entropy, especially for concentrated alloys, but it does seemthat elements with large differences in electronegativity may show large effects of vibrational entropy in unmixing transformations.

8/13/2019 Vibrational Thermodynamics
http://slidepdf.com/reader/full/vibrational-thermodynamics 68/145
64 B. Fultz
Burton, van de Walle and Kattner performed first principles computational stud-ies of unmixing of three quasi-binary systems with the wurtzite structure, AlN-GaN,GaN-InN, and AlN-InN, using the bond-stiffness versus bond-length model [212].With similar structures, there is a general expectation that the solubility should
depend on differences in the ionic size of the metal atoms. The critical temperaturefor unmixing did correlate with the difference in ionic radii, but the effects of vibra-tional entropy did not. For example, although the phonon frequencies are expectedto increase rapidly when larger In atoms are substituted on Al atom sites, theeffects of vibrational entropy on the miscibility gap were surprisingly symmetricalin composition. This may be a consequence of the wurtzite structure, which is notclose packed and may allow more local relaxations.
13.2. Cluster Expansion Method for Solid Solutions
A phonon DOS, a function of energy, pertains to a specific configuration of atoms.The interatomic forces are relatively short-ranged, so we expected that specifying
local configurations of atoms would be sufficient to account for the phonon DOS.The cluster expansion method is a systematic way to construct a phonon DOSby summing contributions from different local clusters of atoms, starting with thechemical composition, and adding contributions from clusters of increasingly largersize. The cluster expansion method, which is extensible to DOS functions [213], ismost useful when the phonon DOS can be accounted for with relatively few terms.
A phonon DOS g j (ε) is related to the local atom arrangements in a struc-ture (the structure is designated j) through “interaction phonon DOS” functions,G0(ε), G1(ε), G2(ε)...Gν −1(ε), where ν is the number of terms in the cluster ex-pansion. The ordered set of interaction DOS functions can be written as a vector, G(ε), so
g j (ε) = G(ε) ξ j , (125)
where ξ j is a set of atom correlation functions, ξ j, in the specific composition orstructure, j. With DOS curves from a set of different compositions or structures,g(ε) = g1(ε), g2(ε)..., again written as a vector, we can solve for a set of differentinteraction DOS functions using an inversion method of Connolly and Williams[214],
G(ε) = g(ε) ξ −−1 , (126)
where the matrix ξ
−
−1 is obtained from the correlation functions below.
The correlation functions ξ j1, ξ j2,... are obtained by geometrical analysis of atom positions in each structure, j . Specifically, for a cluster composed of n atoms:
ξ jn = 1
N n
ni=1
σ pi , (127)
where pi are specific sites. Equation 127 is a product of “spin variables,” whereσ = +1 for an A-atom and σ = −1 for a B-atom in a binary alloy. Consider, for
8/13/2019 Vibrational Thermodynamics
http://slidepdf.com/reader/full/vibrational-thermodynamics 69/145
Vibrational Thermodynamics of Materials 65
example, correlation functions for a disordered solid solution, where each site hasthe probability of xB of being occupied by a B-atom, and 1 −xB by an A-atom. Theaverage for n = 1 is ξ 1 = σBxB +σA(1−xB) = 1−2xB. For clusters of two atoms (i.e.,pairs), both sites are occupied randomly by A- or B-atoms, so ξ 2 = (1
−2xB)2, and
for an n-atom cluster in a random solid solution ξ n = (1− 2xB)n. For an equiatomicalloy with xB = 0.5, ξ n = 0 for all n except n = 0. For n = 0, the interactionphonon DOS, G0(ε), is the phonon DOS of the equiatomic solid solution, and allother Gn(ε) are corrections to this function for deviations from the equiatomic.The cluster functions Gn(ε) contribute to the DOS in proportion to how many nth
clusters there are in a disordered alloy of composition c, compared to how manythere are in an equiatomic disordered alloy.
The same systematics can be used for the phonon partial DOS functions of A-and B-atoms. Here the index d denotes either “A” or “B.” The analogs of Eqs. 125and 126 are
gd,j (ε) = Gd(ε) ξ d,j
−(128)
Gd(ε) = gd(ε) ξ d−−1 (129)
Neutron weighting (Sect. 8.3) is obtained with the phonon partial DOS (PDOS)functions40
gnw j (ε) =
d
xA j σA
M AM/σ gd,j (ε) , (130)
where each contribution to gnw j (ε) (for the composition or structure j) is weighted by
the phonon scattering efficiency of its A- and B-atoms and their partial DOS gd,j (ε).The constant M/σ provides normalization. It can be shown that the neutron-
weighted interaction DOS functions can be written Gnw(ε) =
d
Rd−C d−
ξ d−−1 gd(ε) , (131)
where the matrix C d−accounts for the neutron weighting [188, 215]. The matrix
Rd−relates the interaction DOS (IDOS) functions to the interaction partial DOS
(IPDOS) function of species d (A or B)
G(ε) =
d
Rd− Gd(ε) . (132)
The Rd−
is obtained from the correlation functions of the disordered solid solution.
For a disordered solid solution, Lucas, et al. [188, 215, 216] found strategies tosolve for the phonon partial DOS functions from neutron-weighted DOS curves of
40 There are two subtleties: 1) It is assumed that the Debye-Waller factors for the two species of atoms do not differ significantly. This assumption should be adequate at low temperatures. 2) If the phonon spectra from all structures j do not span the same range of energy, the energy canbe renormalized to the highest energy mode in each structure. This offers a good comparison of partial DOS functions, but requires further assessments for the entropy.
8/13/2019 Vibrational Thermodynamics
http://slidepdf.com/reader/full/vibrational-thermodynamics 70/145
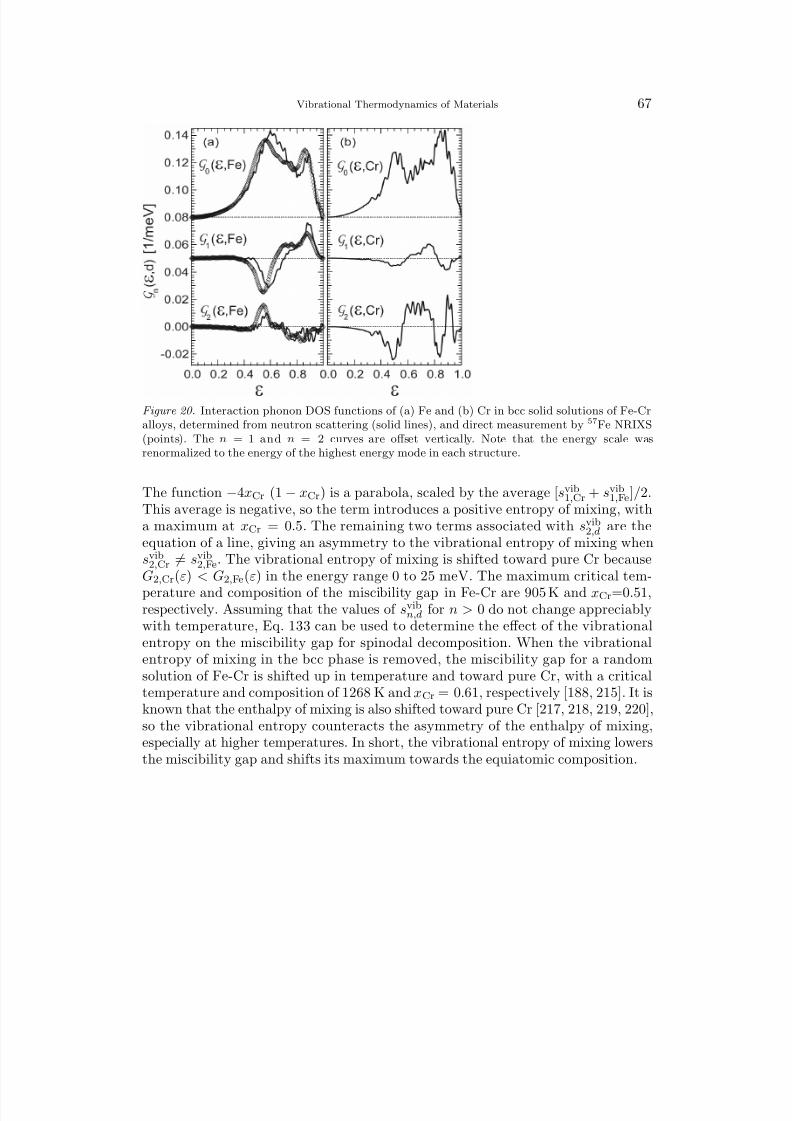
8/13/2019 Vibrational Thermodynamics
http://slidepdf.com/reader/full/vibrational-thermodynamics 71/145
Vibrational Thermodynamics of Materials 67
Figure 20. Interaction phonon DOS functions of (a) Fe and (b) Cr in bcc solid solutions of Fe-Cralloys, determined from neutron scattering (solid lines), and direct measurement by 57Fe NRIXS(points). The n = 1 and n = 2 curves are offset vertically. Note that the energy scale wasrenormalized to the energy of the highest energy mode in each structure.
The function −4xCr (1 − xCr) is a parabola, scaled by the average [svib1,Cr + svib
1,Fe]/2.This average is negative, so the term introduces a positive entropy of mixing, witha maximum at xCr = 0.5. The remaining two terms associated with svib
2,d are theequation of a line, giving an asymmetry to the vibrational entropy of mixing whensvib
2,Cr = svib2,Fe. The vibrational entropy of mixing is shifted toward pure Cr because
G2,Cr(ε) < G2,Fe(ε) in the energy range 0 to 25 meV. The maximum critical tem-
perature and composition of the miscibility gap in Fe-Cr are 905 K and xCr=0.51,respectively. Assuming that the values of svib
n,d for n > 0 do not change appreciablywith temperature, Eq. 133 can be used to determine the effect of the vibrationalentropy on the miscibility gap for spinodal decomposition. When the vibrationalentropy of mixing in the bcc phase is removed, the miscibility gap for a randomsolution of Fe-Cr is shifted up in temperature and toward pure Cr, with a criticaltemperature and composition of 1268 K and xCr = 0.61, respectively [188, 215]. It isknown that the enthalpy of mixing is also shifted toward pure Cr [217, 218, 219, 220],so the vibrational entropy counteracts the asymmetry of the enthalpy of mixing,especially at higher temperatures. In short, the vibrational entropy of mixing lowersthe miscibility gap and shifts its maximum towards the equiatomic composition.
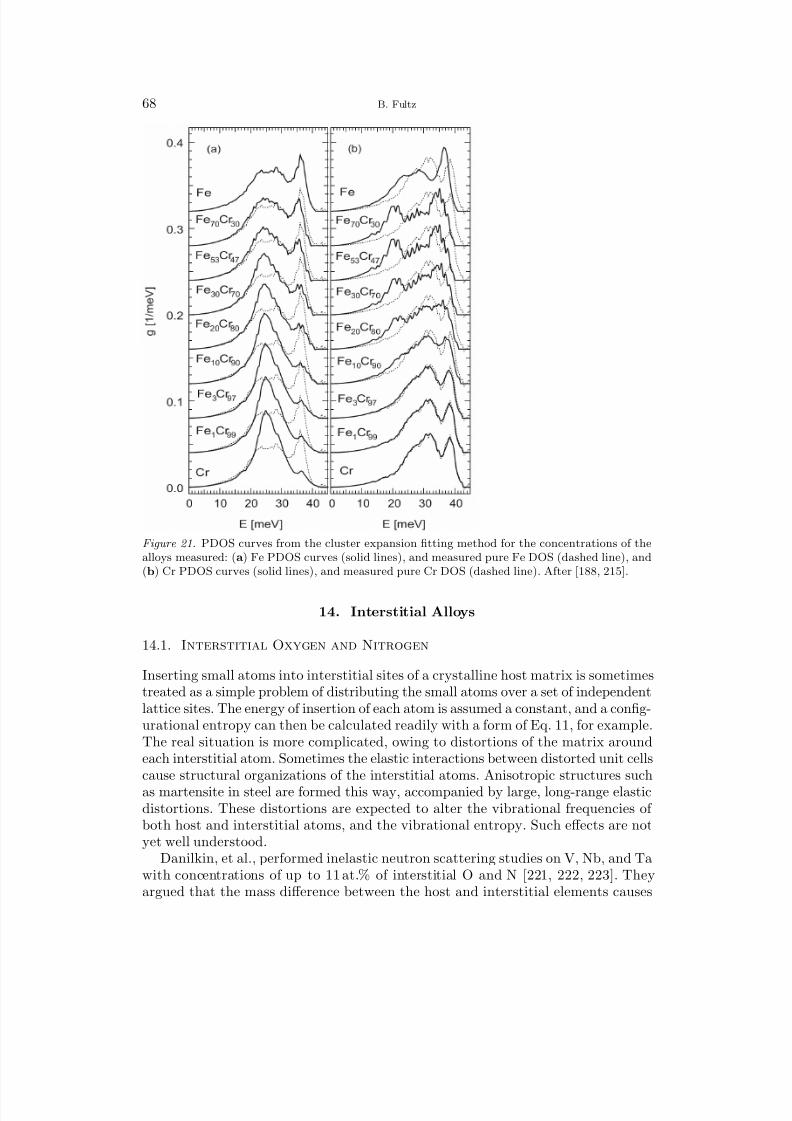
8/13/2019 Vibrational Thermodynamics
http://slidepdf.com/reader/full/vibrational-thermodynamics 72/145
68 B. Fultz
Figure 21. PDOS curves from the cluster expansion fitting method for the concentrations of thealloys measured: (a) Fe PDOS curves (solid lines), and measured pure Fe DOS (dashed line), and(b) Cr PDOS curves (solid lines), and measured pure Cr DOS (dashed line). After [188, 215].
14. Interstitial Alloys
14.1. Interstitial Oxygen and Nitrogen
Inserting small atoms into interstitial sites of a crystalline host matrix is sometimestreated as a simple problem of distributing the small atoms over a set of independentlattice sites. The energy of insertion of each atom is assumed a constant, and a config-urational entropy can then be calculated readily with a form of Eq. 11, for example.The real situation is more complicated, owing to distortions of the matrix aroundeach interstitial atom. Sometimes the elastic interactions between distorted unit cellscause structural organizations of the interstitial atoms. Anisotropic structures suchas martensite in steel are formed this way, accompanied by large, long-range elasticdistortions. These distortions are expected to alter the vibrational frequencies of both host and interstitial atoms, and the vibrational entropy. Such effects are notyet well understood.
Danilkin, et al., performed inelastic neutron scattering studies on V, Nb, and Tawith concentrations of up to 11 at.% of interstitial O and N [221, 222, 223]. Theyargued that the mass difference between the host and interstitial elements causes
8/13/2019 Vibrational Thermodynamics
http://slidepdf.com/reader/full/vibrational-thermodynamics 73/145
Vibrational Thermodynamics of Materials 69
separation of the phonon DOS into bands dominated by the partial DOS of the metalatoms at low energies, and dominated by the partial DOS of the interstitial atomsat high energies. Although a full justification is not presented, it may be reasonableto neglect the contribution from the interstitial partial DOS in the low-energy part
of the spectrum, and ascribe all changes to the phonon partial DOS of the metalatoms. With this assumption, large changes in vibrational entropy of the host metalare obtained. For example, in a V-3 at.%O alloy, the average vibrational frequencyof the V atoms increases by approximately 6%, which is a change of +0.18 kB/Vatom with respect to pure V. This is large compared to the configurational entropyof mixing for an alloy of 3 at.% O, which from Eq. 11 is −0.135 kB/O atom. It is alsointeresting that these effects of interstitial atoms on the vibrations of host atomsare sub-linear at higher solute concentrations. Similar, although somewhat smaller,effects were found for nitrogen in vanadium, and for oxygen in niobium. For alloysof Ta-N, for which the mass difference is quite large, the effects were somewhatsmaller, although the authors point out their concern that the measurements didnot average the coherent scattering from Ta over a sufficiently wide range of Q.
14.2. Hydrogen and Hydrides
Hydrogen and deuterium differ in mass by a factor of two. The characteristic vibra-tional frequencies of H2 and D2 molecules differ by almost exactly
√ 2. Analogous
mass effects are expected for hydrogen in a metal hydride. Owing to its low mass,hydrogen typically has high vibrational frequencies, which can show effects of quan-tized occupancy at temperatures well above room temperature because the Planckoccupancy factor is still small. The V-H and the V-D phase diagrams have beenmeasured, and the phase boundary between the disordered solid solution phase andthe two-phase region is shifted to lower temperature for V-D by approximately 15%[224].42 With deuterium there is a greater difference in the vibrational entropy of the solid solution compared to the unmixed state at lower temperatures, and thisdifference with respect to hydrogen seems understandable as a mass effect [225].It has also been noted that with substitution of deuterium or tritium, the latticeparameter of LiH is reduced at low temperatures, although this difference decreaseswith temperature [226]. At high temperatures in the classical limit, it is expectedthat the mass effects on the thermal expansion of LiH versus LiT will disappear.
The alkali hydrides LiH and NaH both have the B1 (NaCl) structure at ambientpressure, but NaH transforms to the B2 (CsCl) structure at a pressure of 29 GPa,and LiH is predicted to transform to B2 at 308 GPa [227]. A computational studyof phonons in B1 LiH and LiD by Yu, et al. [227], showed a large isotope effecton the three high-frequency optical branches that have a large partial DOS for
H atom motions. A much smaller isotope effect was found for the three acousticbranches. The calculated heat capacity of B1 LiH was in good agreement with exper-imental measurements, which also reported that the Gruneisen parameters increaseat lower temperatures [228]. Since the phonon spectrum extends to approximately100 meV for LiH, the difference in the zero point energies of LiD and LiH at ambienttemperature is important for the vibrational thermodynamics, and there are large
42 There are also differences in the phase fields of the V-H and V-D phase diagrams.
8/13/2019 Vibrational Thermodynamics
http://slidepdf.com/reader/full/vibrational-thermodynamics 74/145
70 B. Fultz
zero-point effects on the lattice parameters and bulk moduli. The calculated phononfrequencies of LiH and NaH varied with volume, and these frequencies were used withthe harmonic entropy expressions (i.e., a quasiharmonic approximation was used)to calculate the Helmholtz free energy. The calculated B1 to B2 transformation
pressure for NaH was in good agreement with experimental measurement [227].Equilibrium between a system containing a hydrogen sorbent in contact with a
gas reservoir at fixed temperature and pressure ensures that the enthalpy of sorption,∆H , is dissipated as heat.
∆H ≡ H g − H s = T (S g − S s) . (134)
with the subscript g for the full system with hydrogen in the gas, and s for the samesystem with hydrogen in or on the solid sorbent. The entropy of hydrogen gas islarge, S gas = 131J(mol K)−1 = 7.9 kB/atom at STP. For the same pressure of gas,sorbents with larger ∆H tend to have higher operating temperatures.
A consequence of Eq. 134 is the release of heat during hydrogen sorption. Consider
the case of lithium borohydride, for which ∆H = 67kJ/mole at 400C. The heatrelease from the sorption of 2500 moles of hydrogen is 167 MJ. For a refueling in 3minutes, one megawatt of heat must be dissipated! Reducing this heat load requireseither lower sorption temperatures, or a reduction of S g −S s. The degrees of freedomof diatomic hydrogen gas that contribute to S g are translational, rotational, vibra-tional, electronic, and nuclear. The first two contributions are big, and generallyunavailable to hydrogen in a solid, reducing the maximum value of S s. On the otherhand, the vibrational frequency of the H2 molecule has a characteristic temperatureof 6215 K, suppressing its contribution to the entropy at ambient temperature. It ispossible to get lower vibrational frequencies in compounds. Ozolins, Majzoub, andWolverton [229] found effects of this sort, and suggested an approach for minimizingS g
−S s. Storing hydrogen in complex anions such as NH2 and BH4 can produce
crystal structures with low-frequency rotational modes, which increase the vibra-tional entropy of S s. After the hydrogen is removed, it is helpful if the solid has alow vibrational entropy owing to stiff phonons, further reducing S g. Nevertheless,with S gas = 7.9 kB/atom, it is a challenge to decrease S g − S s substantially.
14.3. Lithium Intercalation and Insertion
There are numerous electrochemical studies of the insertion and de-insertion of lithium in materials. A few of these studies have reported precise information onthe chemical potential of the Li atoms, and how it changes with concentration. Inequilibrium (i.e., steady-state without changing the charge of the electrochemicalcell), the difference in voltage of the anode and cathode of a reliable electrochemical
cell is precisely the difference in chemical potential of the Li atom between oneelectrode and the other. A counter-electrode of pure Li metal is especially usefulfor thermodynamic measurements, because there is no difference in the chemicalpotential for the different Li atoms as they are deposited on, or removed from,a pure Li metal electrode. By varying temperature, it is possible to measure thetemperature dependence of the free energy per atom, and hence determine the
8/13/2019 Vibrational Thermodynamics
http://slidepdf.com/reader/full/vibrational-thermodynamics 75/145
Vibrational Thermodynamics of Materials 71
entropy of intercalating additional Li into the material
∆S (x) = F ∂E 0
∂T
x
, (135)
where F is the Faraday constant and E 0 is the equilibrium voltage of the cell.Although E 0 may be volts, and may change with temperature by only 0.1 mV per de-gree K, accurate measurements of ∆S (x) are practical with modern instrumentationand good electrochemical cells.
14.3.1. Lithium Intercalation in Graphite
Graphitic carbons are in widespread use as anode materials in rechargeable Libatteries. Under ambient conditions, Li atoms can be inserted into graphite to aconcentration of Li1C6. Several intermediate phases are formed. As the concentrationof Li, x, increases in LixC6, the first phase is a disordered distribution of Li atoms inthe van der Waals gap between graphene planes. Figure 22 shows a large and positiveentropy of insertion for small x. Assuming that all sites in the disordered phase arefilled at x = 0.25, the concentration dependence of Eq. 11 predicts the curved part of ∆S calc, which is in reasonable agreement with the experimental results for ∆ S meas.Over this range of composition, ∆H meas is reasonably constant, so perhaps a latticegas model can successfully explain the intercalation thermodynamics.
It is known that further lithiation occurs in stages. A Stage II compound (withLi atoms filling alternate gaps between graphene planes) is formed up to the con-centration x = 0.5, followed by a Stage I compound (with Li atoms filling allgaps between graphene planes). These compounds form by first-order reactions,with an approximately constant enthalpy and entropy for each additional amountof transformed material. Figure 22 does show that ∆S meas and ∆H meas are fairlyconstant, with a break at the boundary of x = 0.5 that marks the onset of Stage I
compound formation.Figure 22 shows that the entropies of formation of Stage II and Stage I compoundsare negative. Experimental studies of the vibrational spectra of intercalated lithiumatoms provide two Debye temperatures, a θD⊥ ≃ 893K for the one dimension of lithium vibration normal to the graphene planes, and a θD ≃ 392K for the twodimensions of lithium vibrations in the plane of the graphene sheets [230]. With aDebye temperature θD0 ≃ 380 K for bcc Li metal [231], the vibrational entropy of lithiation ∆S calc is obtained as the flat line in Fig. 22. In essence, the vibrational en-tropy of intercalation is negative because the modes of Li vibration perpendicular tothe graphene planes are highly constrained, and have high frequencies. The resultingnegative vibrational entropy of intercalation dominates the entropy. There shouldbe little change in configurational entropy when Stage I or Stage II compounds are
formed because they are ordered.
14.3.2. Lithium Insertion in Li xCoO 2The layered hexagonal compound LixCoO2 preserves a transition-metal oxide crystalframework as Li+ ions are inserted or extracted. Because the chemical potential of the Li atom is lower by approximately 4 eV in LixCoO2 than in graphite, these oxidesare excellent for service in rechargeable Li batteries. The “O3” hexagonal structureis stable over the composition range, ∼ 0.58 < x ≤ 1, the approximate range used
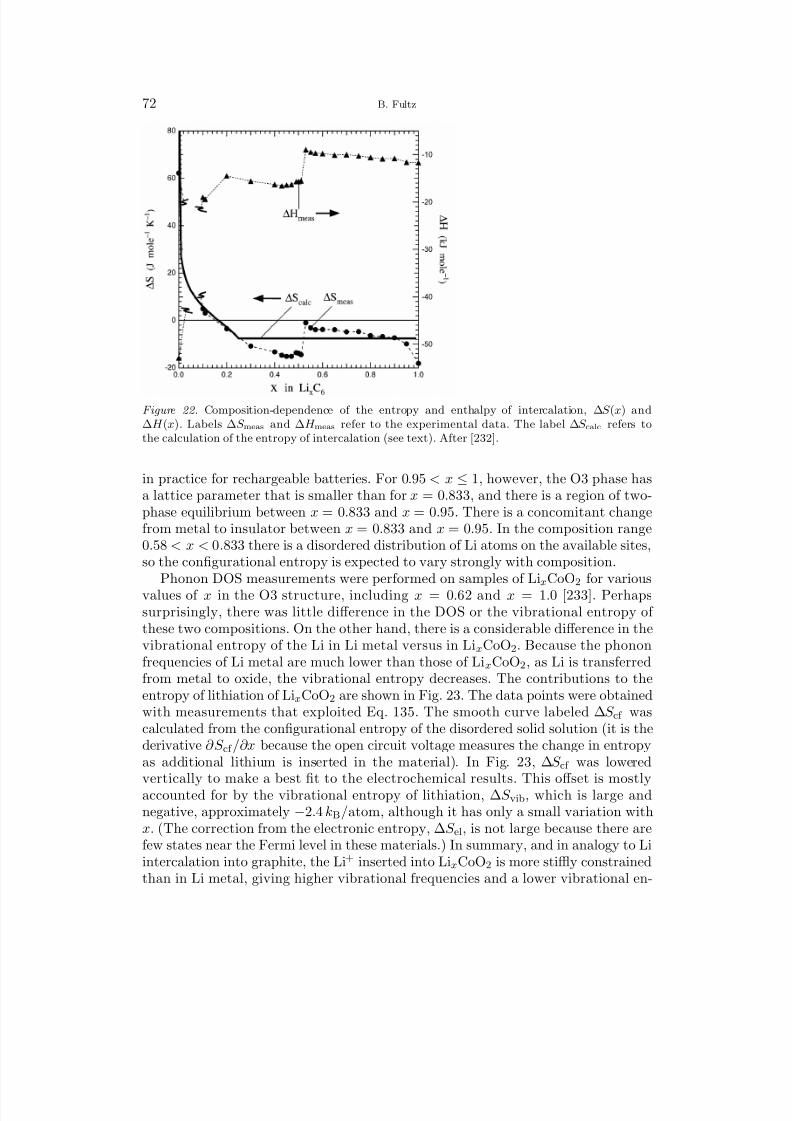
8/13/2019 Vibrational Thermodynamics
http://slidepdf.com/reader/full/vibrational-thermodynamics 76/145
72 B. Fultz
Figure 22. Composition-dependence of the entropy and enthalpy of intercalation, ∆S (x) and∆H (x). Labels ∆S meas and ∆H meas refer to the experimental data. The label ∆S calc refers tothe calculation of the entropy of intercalation (see text). After [232].
in practice for rechargeable batteries. For 0.95 < x ≤ 1, however, the O3 phase hasa lattice parameter that is smaller than for x = 0.833, and there is a region of two-phase equilibrium between x = 0.833 and x = 0.95. There is a concomitant changefrom metal to insulator between x = 0.833 and x = 0.95. In the composition range0.58 < x < 0.833 there is a disordered distribution of Li atoms on the available sites,so the configurational entropy is expected to vary strongly with composition.
Phonon DOS measurements were performed on samples of LixCoO2 for variousvalues of x in the O3 structure, including x = 0.62 and x = 1.0 [233]. Perhapssurprisingly, there was little difference in the DOS or the vibrational entropy of these two compositions. On the other hand, there is a considerable difference in thevibrational entropy of the Li in Li metal versus in LixCoO2. Because the phononfrequencies of Li metal are much lower than those of LixCoO2, as Li is transferredfrom metal to oxide, the vibrational entropy decreases. The contributions to theentropy of lithiation of LixCoO2 are shown in Fig. 23. The data points were obtainedwith measurements that exploited Eq. 135. The smooth curve labeled ∆S cf wascalculated from the configurational entropy of the disordered solid solution (it is thederivative ∂ S cf /∂x because the open circuit voltage measures the change in entropyas additional lithium is inserted in the material). In Fig. 23, ∆S cf was lowered
vertically to make a best fit to the electrochemical results. This offset is mostlyaccounted for by the vibrational entropy of lithiation, ∆S vib, which is large andnegative, approximately −2.4 kB/atom, although it has only a small variation withx. (The correction from the electronic entropy, ∆S el, is not large because there arefew states near the Fermi level in these materials.) In summary, and in analogy to Liintercalation into graphite, the Li+ inserted into LixCoO2 is more stiffly constrainedthan in Li metal, giving higher vibrational frequencies and a lower vibrational en-
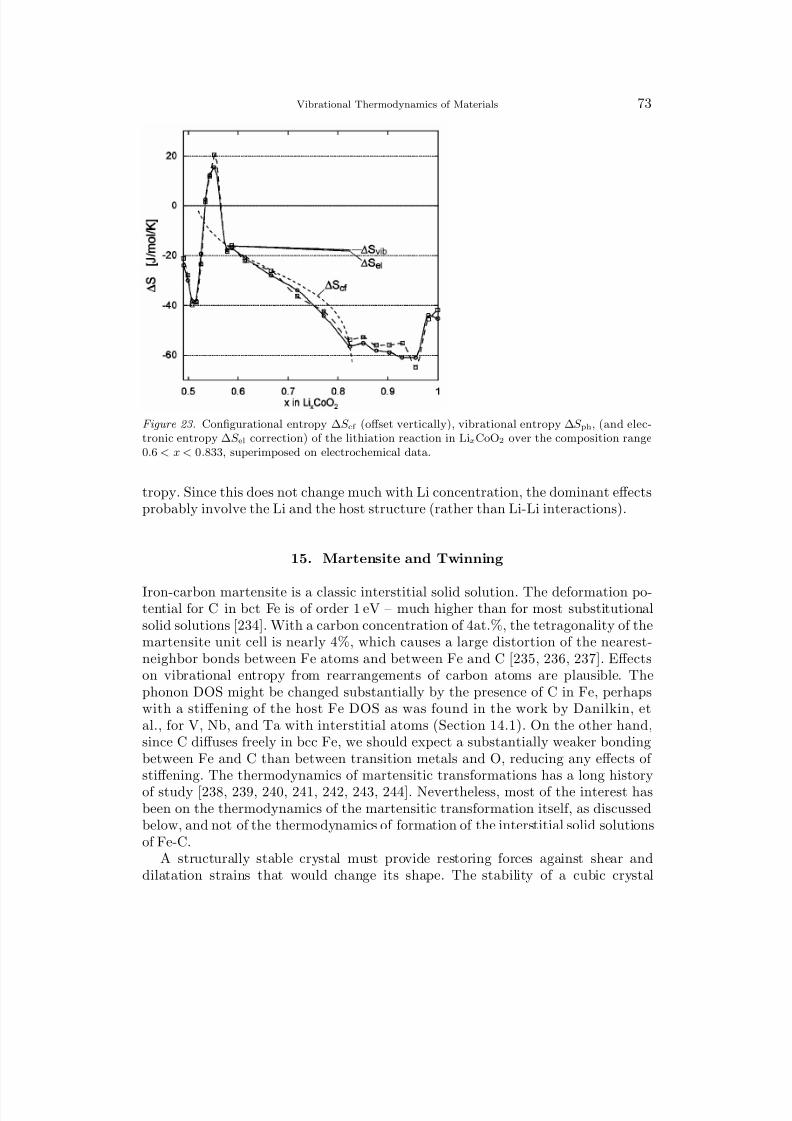
8/13/2019 Vibrational Thermodynamics
http://slidepdf.com/reader/full/vibrational-thermodynamics 77/145
Vibrational Thermodynamics of Materials 73
Figure 23. Configurational entropy ∆S cf (offset vertically), vibrational entropy ∆S ph, (and elec-tronic entropy ∆S el correction) of the lithiation reaction in LixCoO2 over the composition range0.6 < x < 0.833, superimposed on electrochemical data.
tropy. Since this does not change much with Li concentration, the dominant effectsprobably involve the Li and the host structure (rather than Li-Li interactions).
15. Martensite and Twinning
Iron-carbon martensite is a classic interstitial solid solution. The deformation po-tential for C in bct Fe is of order 1 eV – much higher than for most substitutionalsolid solutions [234]. With a carbon concentration of 4at.%, the tetragonality of themartensite unit cell is nearly 4%, which causes a large distortion of the nearest-neighbor bonds between Fe atoms and between Fe and C [235, 236, 237]. Effectson vibrational entropy from rearrangements of carbon atoms are plausible. Thephonon DOS might be changed substantially by the presence of C in Fe, perhapswith a stiffening of the host Fe DOS as was found in the work by Danilkin, etal., for V, Nb, and Ta with interstitial atoms (Section 14.1). On the other hand,since C diffuses freely in bcc Fe, we should expect a substantially weaker bondingbetween Fe and C than between transition metals and O, reducing any effects of stiffening. The thermodynamics of martensitic transformations has a long historyof study [238, 239, 240, 241, 242, 243, 244]. Nevertheless, most of the interest hasbeen on the thermodynamics of the martensitic transformation itself, as discussedbelow, and not of the thermodynamics of formation of the interstitial solid solutionsof Fe-C.
A structurally stable crystal must provide restoring forces against shear anddilatation strains that would change its shape. The stability of a cubic crystal
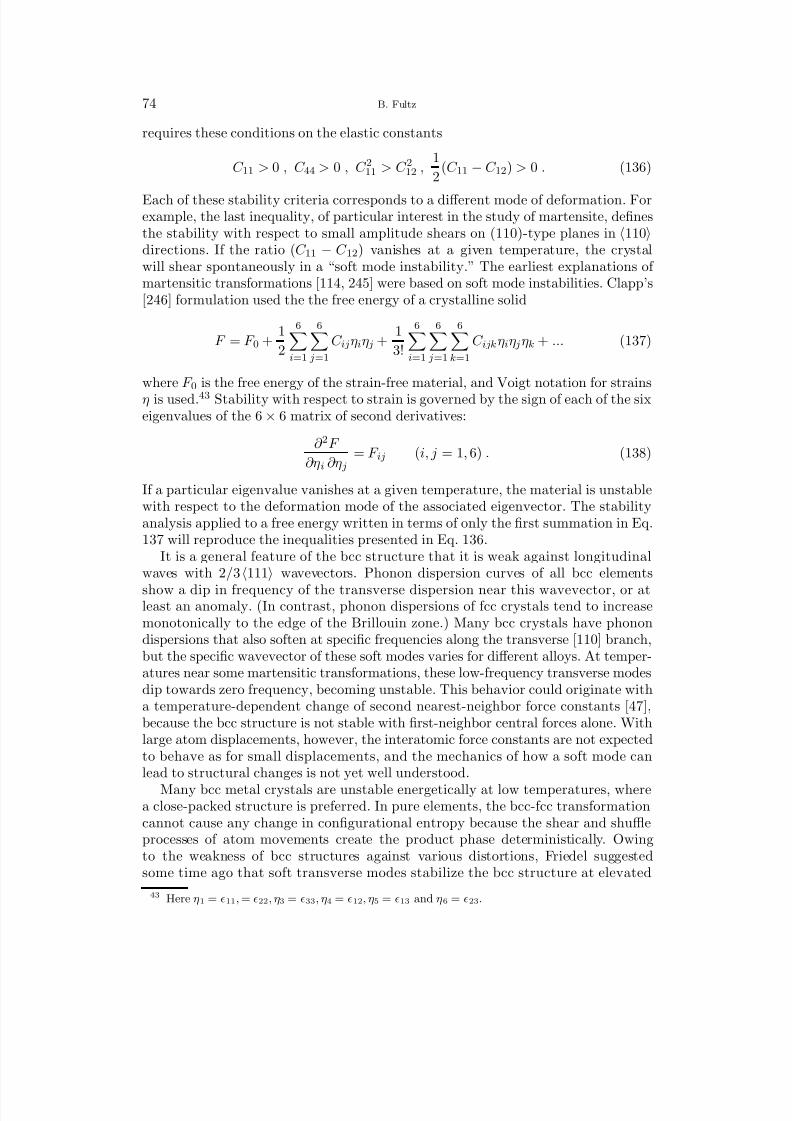
8/13/2019 Vibrational Thermodynamics
http://slidepdf.com/reader/full/vibrational-thermodynamics 78/145
74 B. Fultz
requires these conditions on the elastic constants
C 11 > 0 , C 44 > 0 , C 211 > C 212 , 1
2(C 11 − C 12) > 0 . (136)
Each of these stability criteria corresponds to a different mode of deformation. Forexample, the last inequality, of particular interest in the study of martensite, definesthe stability with respect to small amplitude shears on (110)-type planes in 110directions. If the ratio (C 11 − C 12) vanishes at a given temperature, the crystalwill shear spontaneously in a “soft mode instability.” The earliest explanations of martensitic transformations [114, 245] were based on soft mode instabilities. Clapp’s[246] formulation used the the free energy of a crystalline solid
F = F 0 + 1
2
6i=1
6 j=1
C ijηiη j + 1
3!
6i=1
6 j=1
6k=1
C ijk ηiη j ηk + ... (137)
where F 0 is the free energy of the strain-free material, and Voigt notation for strainsη is used.43 Stability with respect to strain is governed by the sign of each of the sixeigenvalues of the 6 × 6 matrix of second derivatives:
∂ 2F
∂ηi ∂η j= F ij (i, j = 1, 6) . (138)
If a particular eigenvalue vanishes at a given temperature, the material is unstablewith respect to the deformation mode of the associated eigenvector. The stabilityanalysis applied to a free energy written in terms of only the first summation in Eq.137 will reproduce the inequalities presented in Eq. 136.
It is a general feature of the bcc structure that it is weak against longitudinalwaves with 2/3
111
wavevectors. Phonon dispersion curves of all bcc elements
show a dip in frequency of the transverse dispersion near this wavevector, or atleast an anomaly. (In contrast, phonon dispersions of fcc crystals tend to increasemonotonically to the edge of the Brillouin zone.) Many bcc crystals have phonondispersions that also soften at specific frequencies along the transverse [110] branch,but the specific wavevector of these soft modes varies for different alloys. At temper-atures near some martensitic transformations, these low-frequency transverse modesdip towards zero frequency, becoming unstable. This behavior could originate witha temperature-dependent change of second nearest-neighbor force constants [47],because the bcc structure is not stable with first-neighbor central forces alone. Withlarge atom displacements, however, the interatomic force constants are not expectedto behave as for small displacements, and the mechanics of how a soft mode canlead to structural changes is not yet well understood.
Many bcc metal crystals are unstable energetically at low temperatures, wherea close-packed structure is preferred. In pure elements, the bcc-fcc transformationcannot cause any change in configurational entropy because the shear and shuffleprocesses of atom movements create the product phase deterministically. Owingto the weakness of bcc structures against various distortions, Friedel suggestedsome time ago that soft transverse modes stabilize the bcc structure at elevated
43 Here η1 = ǫ11, = ǫ22, η3 = ǫ33, η4 = ǫ12, η5 = ǫ13 and η6 = ǫ23.

8/13/2019 Vibrational Thermodynamics
http://slidepdf.com/reader/full/vibrational-thermodynamics 79/145
Vibrational Thermodynamics of Materials 75
temperatures [247] (also discussed in Section 10.1). Other considerations of entropychanges during martensitic transformations and twinning in alloys were describedby Cahn [248].
Murakami studied the cubic to orthorhombic martensitic transformation in Au-
Cu-Zn alloys [249]. Elastic constants were obtained by ultrasonic measurements, andDebye temperatures were estimated from them. The importance of vibrational en-tropy was demonstrated, at least qualitatively. Tong and Wayman presented similarideas about the fcc to hcp martensitic transformation in Co-Ni [242].
Planes, Ortın, Manosa, et al., performed a number of calorimetric studies of theheats of martensitic transformations in shape-memory alloys, which tend to havegood thermodynamic reversibility. From the measured heats from Cu-Al-Zn, Cu-Al-Ni, and Cu-Al-Be alloys, ∆H , and the temperatures of transformation, the entropywas obtained as ∆S = ∆H/T . A typical value of ∆S was 0.2 kB/atom [250, 251,252]. The size of ∆S increased with the electron/atom ratio of the alloys, with ∆S varying by about 15% over the composition ranges studied. These investigators alsoshowed that when the transformation temperature is low with respect to the Debyetemperature of the alloy, the vibrational entropy of the transformation is suppressed– a consequence expected from a low occupancy of most phonon modes. Finally, theypresented evidence that the martensitic transformation temperature depends on thepresence of low-energy modes in the high temperature phase that help stabilize it,and the transformation is promoted when these modes are depopulated at lowertemperatures.
The martensite-to-austenite transformation in NiTi has a latent heat of (0.5 ±0.05) kB/atom, as measured by calorimetry [253]. The phonon DOS of the two phaseswere obtained from inelastic scattering spectra after using a lattice dynamics simula-tion to correct for the different phonon scattering weights of Ni and Ti. These phononDOS curves of the austenite and martensite, Fig. 24, show substantial differences.
From these data, it seems that all the transformation entropy from calorimetryis vibrational entropy. From simulations and the measured DOS, the vibrationalentropy of austenite was found to be larger than that of martensite because thetransverse acoustic (TA(2)) and longitudinal acoustic modes of austenite are softerthan those of martensite. (Similar changes in acoustic modes of NiTi were reportedpreviously [254].) Simulations suggest that this originates with a large and negative1NN transverse force constant, which may also be responsible for the soft modesinvolved in the mechanism of the martensitic transformation.
The situation for martensitic transformations in Fe alloys is more complicated.Substantial changes in magnetic entropy typically accompany the martensitic trans-formation. For Fe-Ni alloys, the martensitic transformation is from fcc at hightemperatures to approximately bcc at low temperatures. Figure 25 shows phonon
DOS curves from Fe-29 at.% Ni [255]. The phonon DOS curves were corrected forneutron weighting, using the partial DOS of 57Fe atoms measured by Franz, etal., [256]. The vibrational entropy change of the martensitic transformation was∆S vib = 0.12 kB/atom, with the fcc phase having the larger vibrational entropy. Itis interesting to see that the Ni atoms have relatively low vibrational frequencies inthe bcc phase, reducing the vibrational entropy of the transformation. This ∆S vib
was inconsistent with the latent heats of the forward and reverse martensitic trans-
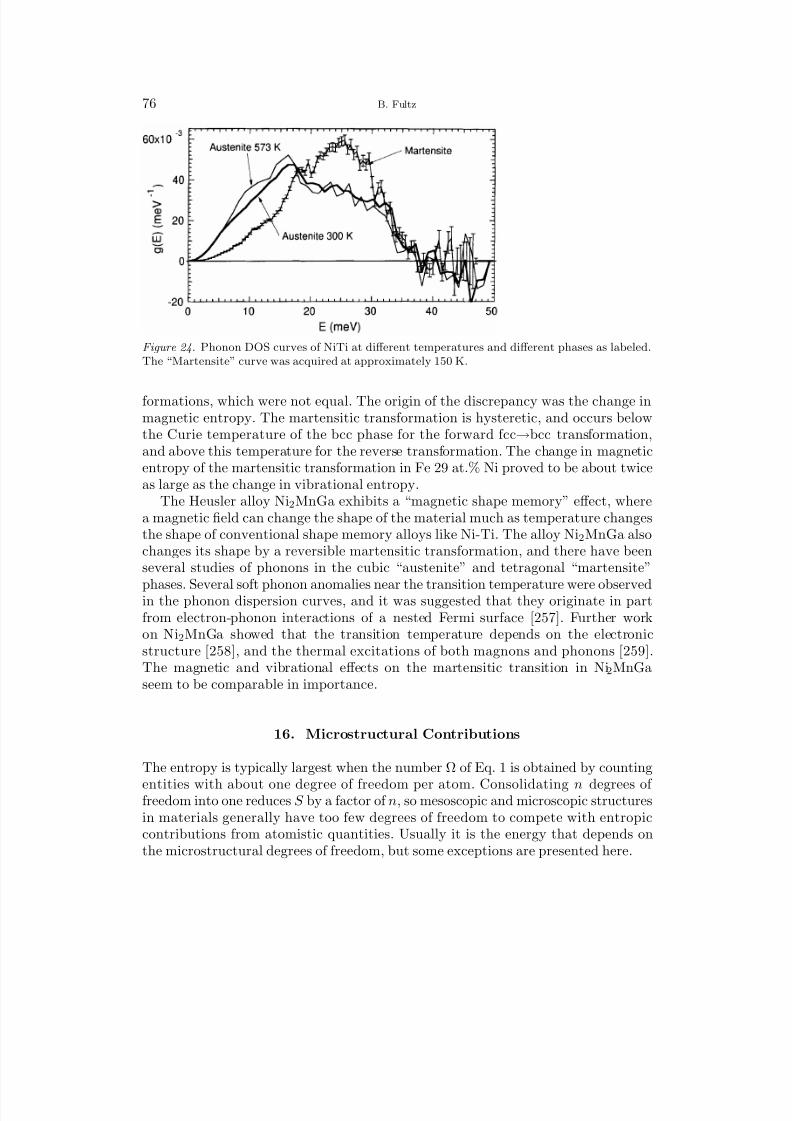
8/13/2019 Vibrational Thermodynamics
http://slidepdf.com/reader/full/vibrational-thermodynamics 80/145
76 B. Fultz
Figure 24. Phonon DOS curves of NiTi at different temperatures and different phases as labeled.The “Martensite” curve was acquired at approximately 150 K.
formations, which were not equal. The origin of the discrepancy was the change inmagnetic entropy. The martensitic transformation is hysteretic, and occurs belowthe Curie temperature of the bcc phase for the forward fcc→bcc transformation,and above this temperature for the reverse transformation. The change in magneticentropy of the martensitic transformation in Fe 29 at.% Ni proved to be about twiceas large as the change in vibrational entropy.
The Heusler alloy Ni2MnGa exhibits a “magnetic shape memory” effect, wherea magnetic field can change the shape of the material much as temperature changesthe shape of conventional shape memory alloys like Ni-Ti. The alloy Ni 2MnGa alsochanges its shape by a reversible martensitic transformation, and there have beenseveral studies of phonons in the cubic “austenite” and tetragonal “martensite”
phases. Several soft phonon anomalies near the transition temperature were observedin the phonon dispersion curves, and it was suggested that they originate in partfrom electron-phonon interactions of a nested Fermi surface [257]. Further workon Ni2MnGa showed that the transition temperature depends on the electronicstructure [258], and the thermal excitations of both magnons and phonons [259].The magnetic and vibrational effects on the martensitic transition in Ni2MnGaseem to be comparable in importance.
16. Microstructural Contributions
The entropy is typically largest when the number Ω of Eq. 1 is obtained by counting
entities with about one degree of freedom per atom. Consolidating n degrees of freedom into one reduces S by a factor of n, so mesoscopic and microscopic structuresin materials generally have too few degrees of freedom to compete with entropiccontributions from atomistic quantities. Usually it is the energy that depends onthe microstructural degrees of freedom, but some exceptions are presented here.
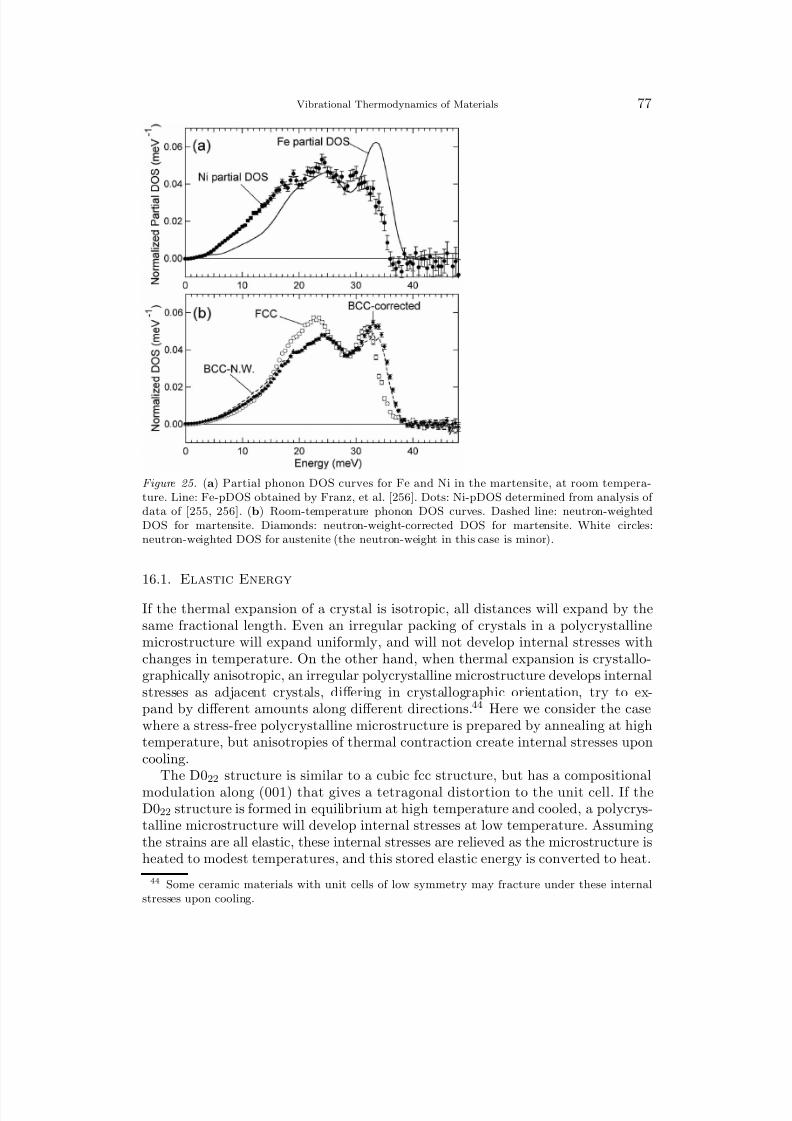
8/13/2019 Vibrational Thermodynamics
http://slidepdf.com/reader/full/vibrational-thermodynamics 81/145
Vibrational Thermodynamics of Materials 77
Figure 25. (a) Partial phonon DOS curves for Fe and Ni in the martensite, at room tempera-ture. Line: Fe-pDOS obtained by Franz, et al. [256]. Dots: Ni-pDOS determined from analysis of data of [255, 256]. (b) Room-temperature phonon DOS curves. Dashed line: neutron-weightedDOS for martensite. Diamonds: neutron-weight-corrected DOS for martensite. White circles:neutron-weighted DOS for austenite (the neutron-weight in this case is minor).
16.1. Elastic Energy
If the thermal expansion of a crystal is isotropic, all distances will expand by thesame fractional length. Even an irregular packing of crystals in a polycrystallinemicrostructure will expand uniformly, and will not develop internal stresses withchanges in temperature. On the other hand, when thermal expansion is crystallo-graphically anisotropic, an irregular polycrystalline microstructure develops internalstresses as adjacent crystals, differing in crystallographic orientation, try to ex-pand by different amounts along different directions.44 Here we consider the casewhere a stress-free polycrystalline microstructure is prepared by annealing at hightemperature, but anisotropies of thermal contraction create internal stresses uponcooling.
The D022 structure is similar to a cubic fcc structure, but has a compositionalmodulation along (001) that gives a tetragonal distortion to the unit cell. If theD022 structure is formed in equilibrium at high temperature and cooled, a polycrys-talline microstructure will develop internal stresses at low temperature. Assumingthe strains are all elastic, these internal stresses are relieved as the microstructure isheated to modest temperatures, and this stored elastic energy is converted to heat.
44 Some ceramic materials with unit cells of low symmetry may fracture under these internalstresses upon cooling.

8/13/2019 Vibrational Thermodynamics
http://slidepdf.com/reader/full/vibrational-thermodynamics 82/145
78 B. Fultz
Figure 26. Dots: differential heat capacity of two samples of Ni3V. Sign is partially-disordered fccminus D022-ordered. After [260, 196].
It therefore takes less heat input to raise the temperature of this microstructure,and its heat capacity is suppressed. Evidence of this suppressed heat capacity wasfound for D022 Ni3V and Pd3V alloys [260, 261]. In these experiments, differentialscanning calorimetry was used to compare alloys in two phases: 1) cubic, preparedby quenching the sample from a high temperature in an fcc region of the phasediagram, and 2) D022 ordered, prepared by annealing in the D022 region of thephase diagram. Figure 26 shows the differential heat capacity of these two samples– the partially disordered cubic sample had the larger heat capacity. The shapeof the differential heat capacity curve is quite different from the shape of Fig. 8b,however. The curve labeled “Microstructure” in Fig. 26 is the contribution obtainedby assuming that the D022 ordered sample retains internal stresses at low temper-ature that are relieved as the solid expands. The curve labeled “DOS” in Fig. 26
was obtained from experimental phonon spectra measured for the two samples byinelastic neutron scattering. The sum of the two contributions better accounts forthe measured differential heat capacity than either contribution alone.
Nevertheless, the fitted shape in Fig. 26 leaves much to be desired. The re-sponse to thermal stresses is probably more complicated than linear elastic behavior.Over a temperature range of 100 K, differences in thermal expansion along differentcrystallographic directions of 10−5/K generate strains in excess of 0.001. Over atemperature range of a few hundred K, local plastic deformation can be induced byanisotropic thermal strains, especially at locations of stress concentrations. Plasticdeformation requires mechanical work to be performed by thermal expansion, in-creasing the apparent heat capacity (as opposed to decreasing it by relief of internalstress). The microstructural contribution to the heat capacity can therefore change
sign, and plastic deformation can cause hysteretic behavior.The effects of elastic and plastic deformation during thermal contraction and
expansion were studied in polycrystalline uranium, and its differential heat capacitywas measured against a single crystal of uranium [262]. Both samples are expectedto have nearly the same phonon entropy, so the study was able to isolate the mi-crostructural effects on the heat capacity. Powder diffractometry was used to obtaininternal strain distributions along different crystallographic directions. These diffrac-
8/13/2019 Vibrational Thermodynamics
http://slidepdf.com/reader/full/vibrational-thermodynamics 83/145
Vibrational Thermodynamics of Materials 79
tion results were used to calculate the elastic energy in the microstructure, and thisanalysis of diffraction results was in reasonable agreement with the measured heatcapacity. The differential heat capacity between polycrystalline and single crystaluranium changed sign with temperature as the relief of elastic stress upon heating
gave way to plastic deformation.These effects are probably not best described as part of the intrinsic thermody-
namics of crystalline phases, but rather a part of the mechanics of the microstruc-ture. They do affect bulk thermodynamic properties measurements, however, andsuch measurements offer a means for studying them.
16.2. Nanostructures
16.2.1. Energy and Entropy of Nanostructures
Nanostructured materials are of widespread interest in many fields of science andengineering. A practical question is whether nanostructures are sufficiently stableat their temperatures of service, and a basic question is how the thermodynamics
of nanostructured materials differs from conventional bulk materials. In short, thesurfaces or interfaces of nanostructures raise the energy. On the other hand, the freeenergy of nanostructured materials could be reduced by sources of entropy associatedwith configurations of atoms or excitations in the structure, helping to stabilize thematerial at finite temperatures. Consider, for example, a nanostructured materialwith a grain boundary enthalpy of 3 kJ/mole [263, 264]. At a temperature of 500 K,an entropy of 0.75 kB/atom (6.2 J(mol K)−1) would null the free energy differencebetween the nanostructured material and the bulk material.
The extra configurational entropy associated with a nanocrystalline microstruc-ture is probably not large. For consolidated nanocrystals, there can be a substantialfraction of atoms in grain boundaries, which are typically of 1 nm in width [264, 265].Atoms in the grain boundary accommodate the mismatch of the bounding crystals,and cannot be positioned as arbitrarily as in a glass. Using a glass transition entropyof ∼ 1 kB/atom would be a generous upper bound. This is shared over all atoms inthe solid, however, so it should b e reduced by the grain boundary fraction of atoms.The positions and orientations of the nanocrystals give other configurational degreesof freedom. Considering each nanocrystal as having nucleated at a point and grownto impingement with other nanocrystals, the configurations can be counted as thenumber of ways of distributing the nucleation points over a lattice of approximatelyatomic spacing. The orientational degrees of freedom can also be counted as rotationsof 1-atom increments at the edge of the nanocrystal. These configurational degreesof freedom are not large for a nanocrystal of 7 nm dimension and 105 atoms, whenaveraged over all atoms in the material. (There will be additional degrees of freedom
if the positions of grain boundaries are decoupled from the centers of the nanocrys-tals.) Perhaps 0.1 kB/atom can be obtained for the excess configurational entropy of such nanocrystals, but this seems generous. In summary, the configurational degreesof freedom of atoms become consolidated into collections of 105 atoms, reducing theentropy by this large factor, but there are nanostructural features that bring somenew degrees of freedom.
The vibrational entropy of nanostructured materials is less well understood.From the measurements available to date, the vibrational entropy difference be-
8/13/2019 Vibrational Thermodynamics
http://slidepdf.com/reader/full/vibrational-thermodynamics 84/145
80 B. Fultz
tween nanostructured and bulk materials is larger than the configurational entropydifference, but it seems half as large as necessary to stabilize thermodynamically ananocrystalline material at a temperature of 500 K. Nevertheless, vibrational entropymakes a difference for the stability of nanocrystalline materials. Furthermore, the
vibrational dynamics of nanostructures are of interest in their own right.
16.2.2. Low-Energy Vibrations of Nanostructures
The eigenmodes of vibrations of small crystals have been calculated both for isolatedcrystals [266, 267, 268]. and for crystals with rigid constraints at their surfaces[269]. A distinguishing feature of these calculations of the DOS, later borne outby experiments, is an enhancement in the number of modes at low energies. Acontinuum analog for some of these low-energy modes are Rayleigh modes overthe surface, which become more distinct from bulk atom motions with increasingmismatch of the acoustic impedances of the crystal and the medium in which it isembedded. These modes involve surface atoms, of course, but they also contribute tothe partial DOS of atoms beneath the surface. A computer simulation of a periodicarray of small nanocrystals with Lennard-Jones interatomic potentials also showedan enhancement of the low-energy modes of the phonon DOS [270]. The calculatedDOS was similar to that of a glass, but curiously, the glass was more stable thanthe nanocrystalline microstructure of this simulation.
Experimental measurements have shown a number of differences in the phononDOS of nanocrystalline and bulk materials. In general, the energies of the van Hovesingularities are the same for materials with nanocrystals or with large crystals,indicating that the interatomic forces are the same for most atoms situated locallyin regions of good crystal [271, 272, 273, 274]. This is seen in the phonon DOS curvesof Fig. 27 – although the DOS is broadened with smaller crystallite size, the energiesof the van Hove singularities do not shift substantially [275]. This remains true asthe nanocrystalline material is subjected to pressure, as shown for bcc Fe in Fig.28 [276]. At pressures of 0.2 and 9.5 GPa both bulk and nanocrystalline sampleswere bcc, but both had transformed to hcp Fe at the highest pressure of 25–27 GPa.The energies of the van Hove singularities changed with crystal structure and withpressure, but these changes were similar for the nanocrystalline and bulk materials.
It is clear from both Figs. 27 and 28 that the phonon DOS in the nanocrystallinematerial has more spectral weight at energies below about 20 meV, and furtheranalysis of the data of Fig. 27 showed that this enhancement at low energies scalesinversely with the crystallite size. This enhancement of the DOS at low energieshas been found in all studies of compacted nanocrystals [272, 273, 274, 275, 277,278]. This trend implies that the extra spectral weight at low energies originatesfrom degrees of freedom in the microstructure, which may include vibrations that
tend to localize at grain boundary regions or propagate along them, motions of thenanocrystals with respect to each other, or some combinations of these degrees of freedom.
For consolidated nanocrystals, the enhancement in the phonon DOS at low en-ergies does not extend to arbitrarily low energies and aritrarily long wavelengths.In measurements of phonons in the µeV energy range [279], it was found that theenhancement in the phonon DOS around 10 µeV was only about half of what wasfound around 10 meV. Some enhancement of the phonon DOS is expected owing

8/13/2019 Vibrational Thermodynamics
http://slidepdf.com/reader/full/vibrational-thermodynamics 85/145
Vibrational Thermodynamics of Materials 81
Figure 27. Phonon DOS curves from nanocrystalline fcc Ni3Fe prepared by high-energy ball milling,followed by subsequent annealing to induce grain growth to sizes as labeled. After [275].
to lower average elastic constants in any composite material with elastically “soft”atom configurations at grain boundaries, and this may explain the suppression of the DOS in the µeV energy range and the reduction in bulk elastic constants. Thebehavior at µeV energies is therefore understood as a continuum limit, so the extraenhancement in the meV energy range is more interesting. It is likely caused bythe extra degrees of freedom of the nanocrystalline microstructure. These probablyoriginate with the spatial dimensions of the nanocrystalline features, of order 10 nm,and these effects therefore do not extend to the continuum limit. We note in passingthat this behavior of an enhancement in the DOS at low, but not arbitrarily low,
energies is reminiscent of the “boson peak,” of glassy materials, hinting that theboson peak may originate from nanostructured features of the glassy structure.
The enhancement of spectral weight at low energies is a widespread phenomenon,and is larger when the nanocrystalline dimensions are smaller. Further insight canbe obtained by assessing whether these low energy excitations show characteristicsof reduced dimensionality. In the continuum limit, all sound waves have linear dis-persions with ε/ = ω ∝ k, so in three dimensions g(ε) ∝ ε2. Especially for DOScurves measured by inelastic nuclear resonant scattering, which offers the advantagesof being both incoherent and with a low background, the exponent n of g(ε) ∝ εn
can be obtained by fitting g(ε) as in Fig. 28. Doing so for three DOS curves inthe bcc phase at different pressures gave n = 2.00(±0.015) for the bulk material,and n = 1.95(
±0.015) for the nanocrystalline material. Some excitations in the
nanocrystalline material may have 2-dimensional character. The nanocrystals usedfor the data of Fig. 28 had grain sizes of 9nm, however, and larger effects mayoccur for smaller nanocrystals, or nanocrystals that are not compacted together.Lower-dimensional excitations were more prominent in a computational study wherethe nanocrystals were individually isolated and were very small (2–3 nm) [280].In a companion experimental study, inelastic scattering from hydrogen atoms wasmeasured, but the motions of hydrogen atoms in grain boundaries may not reflect the
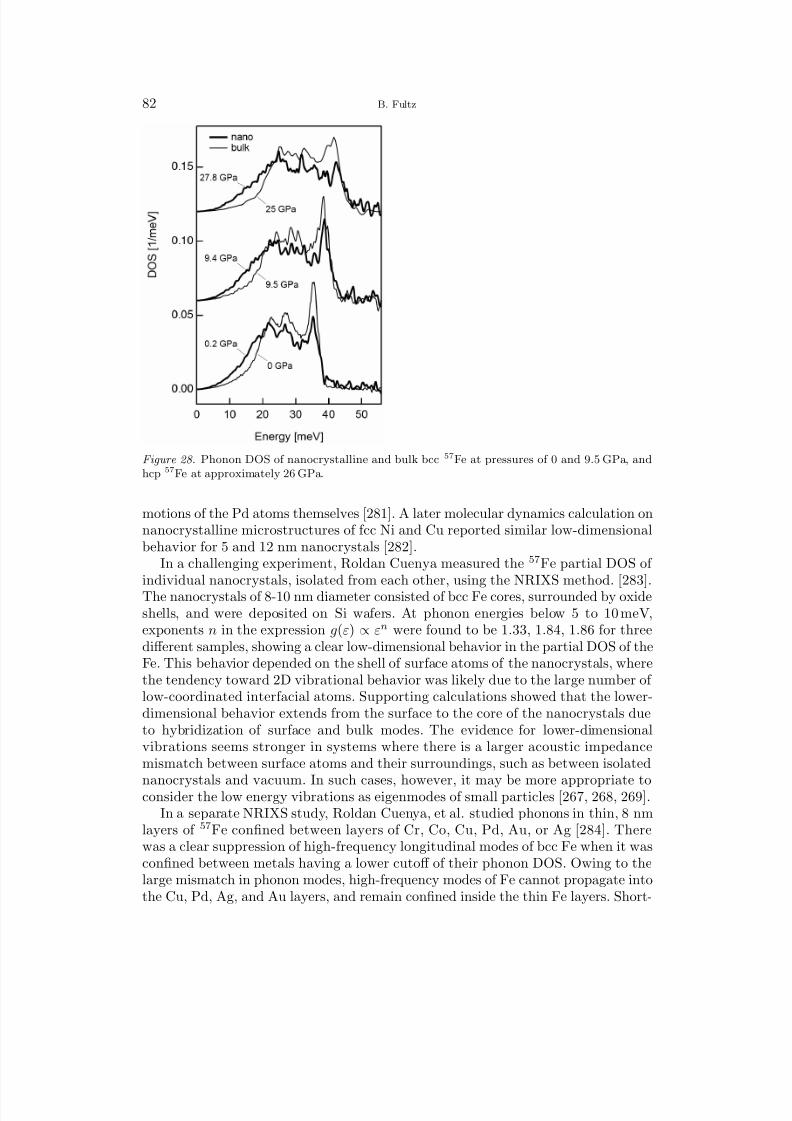
8/13/2019 Vibrational Thermodynamics
http://slidepdf.com/reader/full/vibrational-thermodynamics 86/145
82 B. Fultz
Figure 28. Phonon DOS of nanocrystalline and bulk bcc 57Fe at pressures of 0 and 9.5 GPa, andhcp 57Fe at approximately 26 GPa.
motions of the Pd atoms themselves [281]. A later molecular dynamics calculation onnanocrystalline microstructures of fcc Ni and Cu reported similar low-dimensionalbehavior for 5 and 12 nm nanocrystals [282].
In a challenging experiment, Roldan Cuenya measured the 57Fe partial DOS of individual nanocrystals, isolated from each other, using the NRIXS method. [283].The nanocrystals of 8-10 nm diameter consisted of bcc Fe cores, surrounded by oxideshells, and were deposited on Si wafers. At phonon energies below 5 to 10 meV,exponents n in the expression g(ε) ∝ εn were found to be 1.33, 1.84, 1.86 for threedifferent samples, showing a clear low-dimensional behavior in the partial DOS of theFe. This behavior depended on the shell of surface atoms of the nanocrystals, wherethe tendency toward 2D vibrational behavior was likely due to the large number of low-coordinated interfacial atoms. Supporting calculations showed that the lower-dimensional behavior extends from the surface to the core of the nanocrystals dueto hybridization of surface and bulk modes. The evidence for lower-dimensionalvibrations seems stronger in systems where there is a larger acoustic impedancemismatch between surface atoms and their surroundings, such as between isolated
nanocrystals and vacuum. In such cases, however, it may be more appropriate toconsider the low energy vibrations as eigenmodes of small particles [267, 268, 269].In a separate NRIXS study, Roldan Cuenya, et al. studied phonons in thin, 8 nm
layers of 57Fe confined between layers of Cr, Co, Cu, Pd, Au, or Ag [284]. Therewas a clear suppression of high-frequency longitudinal modes of bcc Fe when it wasconfined between metals having a lower cutoff of their phonon DOS. Owing to thelarge mismatch in phonon modes, high-frequency modes of Fe cannot propagate intothe Cu, Pd, Ag, and Au layers, and remain confined inside the thin Fe layers. Short-
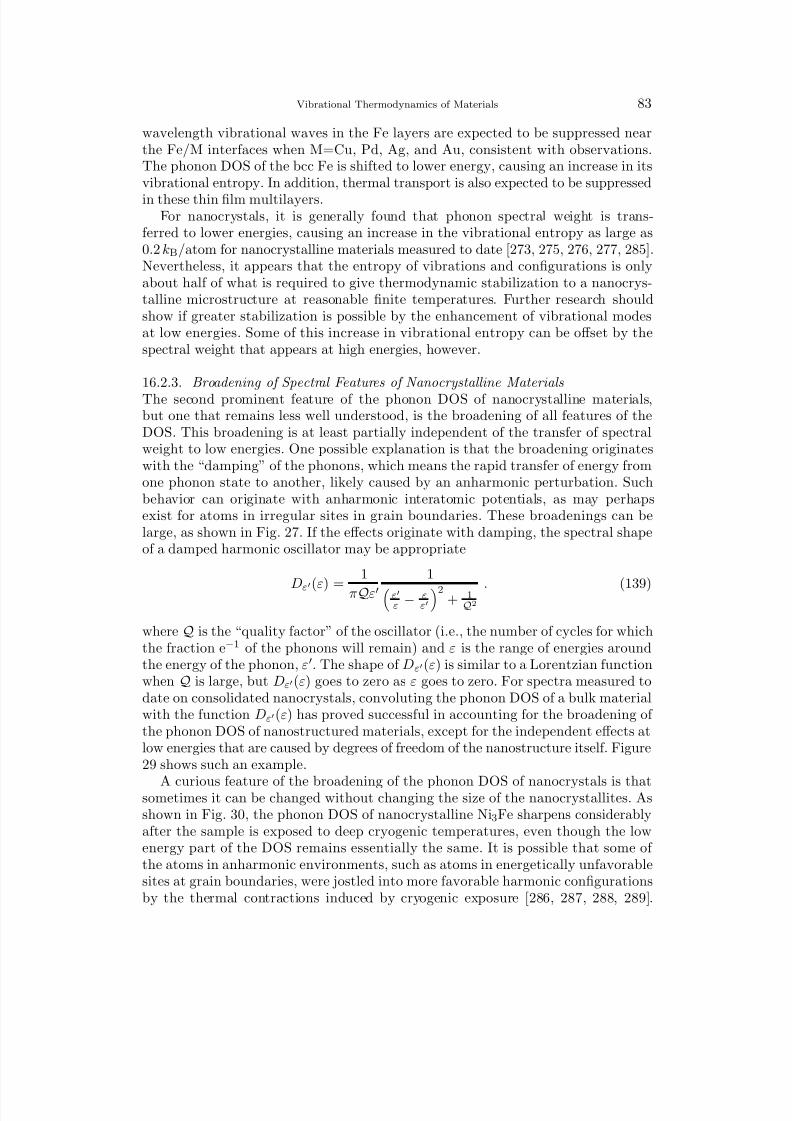
8/13/2019 Vibrational Thermodynamics
http://slidepdf.com/reader/full/vibrational-thermodynamics 87/145
Vibrational Thermodynamics of Materials 83
wavelength vibrational waves in the Fe layers are expected to be suppressed nearthe Fe/M interfaces when M=Cu, Pd, Ag, and Au, consistent with observations.The phonon DOS of the bcc Fe is shifted to lower energy, causing an increase in itsvibrational entropy. In addition, thermal transport is also expected to be suppressed
in these thin film multilayers.For nanocrystals, it is generally found that phonon spectral weight is trans-
ferred to lower energies, causing an increase in the vibrational entropy as large as0.2 kB/atom for nanocrystalline materials measured to date [273, 275, 276, 277, 285].Nevertheless, it appears that the entropy of vibrations and configurations is onlyabout half of what is required to give thermodynamic stabilization to a nanocrys-talline microstructure at reasonable finite temperatures. Further research shouldshow if greater stabilization is possible by the enhancement of vibrational modesat low energies. Some of this increase in vibrational entropy can be offset by thespectral weight that appears at high energies, however.
16.2.3. Broadening of Spectral Features of Nanocrystalline Materials
The second prominent feature of the phonon DOS of nanocrystalline materials,but one that remains less well understood, is the broadening of all features of theDOS. This broadening is at least partially independent of the transfer of spectralweight to low energies. One possible explanation is that the broadening originateswith the “damping” of the phonons, which means the rapid transfer of energy fromone phonon state to another, likely caused by an anharmonic perturbation. Suchbehavior can originate with anharmonic interatomic potentials, as may perhapsexist for atoms in irregular sites in grain boundaries. These broadenings can belarge, as shown in Fig. 27. If the effects originate with damping, the spectral shapeof a damped harmonic oscillator may be appropriate
Dε′
(ε) =
1
πQε′1
ε′
ε − εε′
2 + 1
Q2. (139)
where Q is the “quality factor” of the oscillator (i.e., the number of cycles for whichthe fraction e−1 of the phonons will remain) and ε is the range of energies aroundthe energy of the phonon, ε′. The shape of Dε′(ε) is similar to a Lorentzian functionwhen Q is large, but Dε′(ε) goes to zero as ε goes to zero. For spectra measured todate on consolidated nanocrystals, convoluting the phonon DOS of a bulk materialwith the function Dε′(ε) has proved successful in accounting for the broadening of the phonon DOS of nanostructured materials, except for the independent effects atlow energies that are caused by degrees of freedom of the nanostructure itself. Figure29 shows such an example.
A curious feature of the broadening of the phonon DOS of nanocrystals is thatsometimes it can be changed without changing the size of the nanocrystallites. Asshown in Fig. 30, the phonon DOS of nanocrystalline Ni3Fe sharpens considerablyafter the sample is exposed to deep cryogenic temperatures, even though the lowenergy part of the DOS remains essentially the same. It is possible that some of the atoms in anharmonic environments, such as atoms in energetically unfavorablesites at grain boundaries, were jostled into more favorable harmonic configurationsby the thermal contractions induced by cryogenic exposure [286, 287, 288, 289].
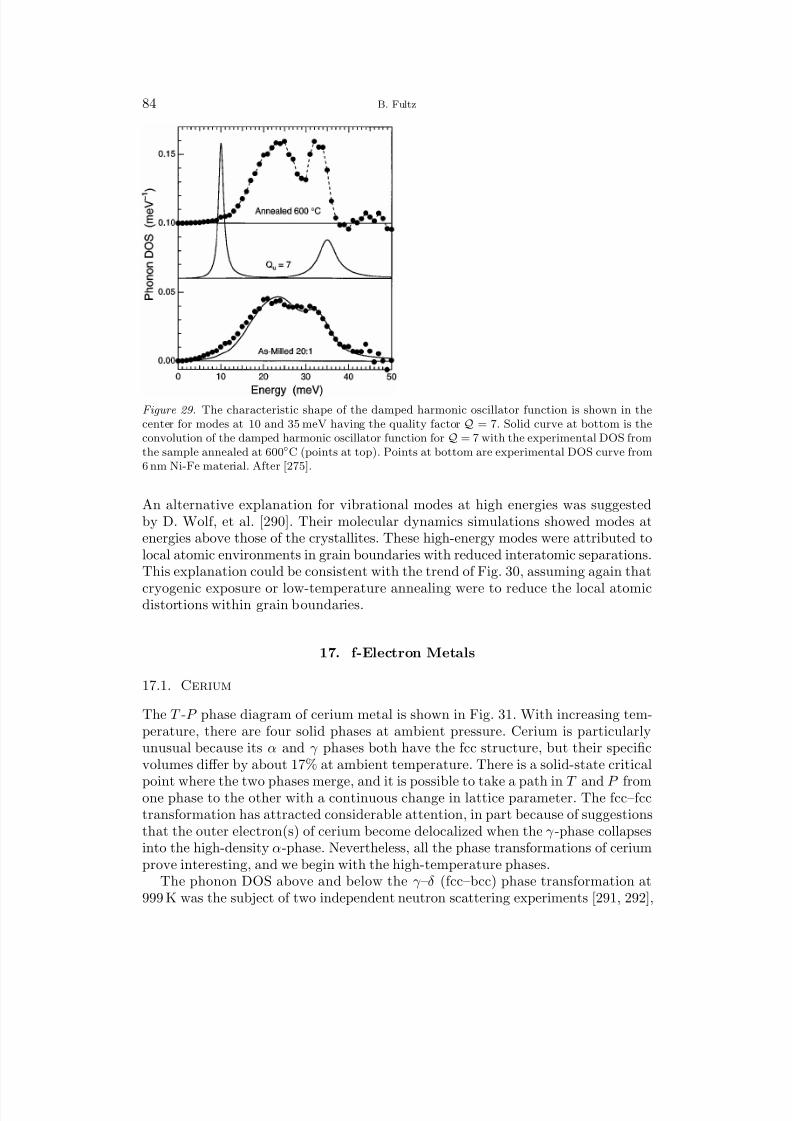
8/13/2019 Vibrational Thermodynamics
http://slidepdf.com/reader/full/vibrational-thermodynamics 88/145
84 B. Fultz
Figure 29. The characteristic shape of the damped harmonic oscillator function is shown in thecenter for modes at 10 and 35 meV having the quality factor Q = 7. Solid curve at bottom is theconvolution of the damped harmonic oscillator function for Q = 7 with the experimental DOS fromthe sample annealed at 600C (points at top). Points at bottom are experimental DOS curve from6 nm Ni-Fe material. After [275].
An alternative explanation for vibrational modes at high energies was suggestedby D. Wolf, et al. [290]. Their molecular dynamics simulations showed modes atenergies above those of the crystallites. These high-energy modes were attributed tolocal atomic environments in grain boundaries with reduced interatomic separations.This explanation could be consistent with the trend of Fig. 30, assuming again that
cryogenic exposure or low-temperature annealing were to reduce the local atomicdistortions within grain boundaries.
17. f-Electron Metals
17.1. Cerium
The T -P phase diagram of cerium metal is shown in Fig. 31. With increasing tem-perature, there are four solid phases at ambient pressure. Cerium is particularlyunusual because its α and γ phases both have the fcc structure, but their specificvolumes differ by about 17% at ambient temperature. There is a solid-state critical
point where the two phases merge, and it is possible to take a path in T and P fromone phase to the other with a continuous change in lattice parameter. The fcc–fcctransformation has attracted considerable attention, in part because of suggestionsthat the outer electron(s) of cerium become delocalized when the γ -phase collapsesinto the high-density α-phase. Nevertheless, all the phase transformations of ceriumprove interesting, and we begin with the high-temperature phases.
The phonon DOS above and below the γ –δ (fcc–bcc) phase transformation at999 K was the subject of two independent neutron scattering experiments [291, 292],

8/13/2019 Vibrational Thermodynamics
http://slidepdf.com/reader/full/vibrational-thermodynamics 89/145
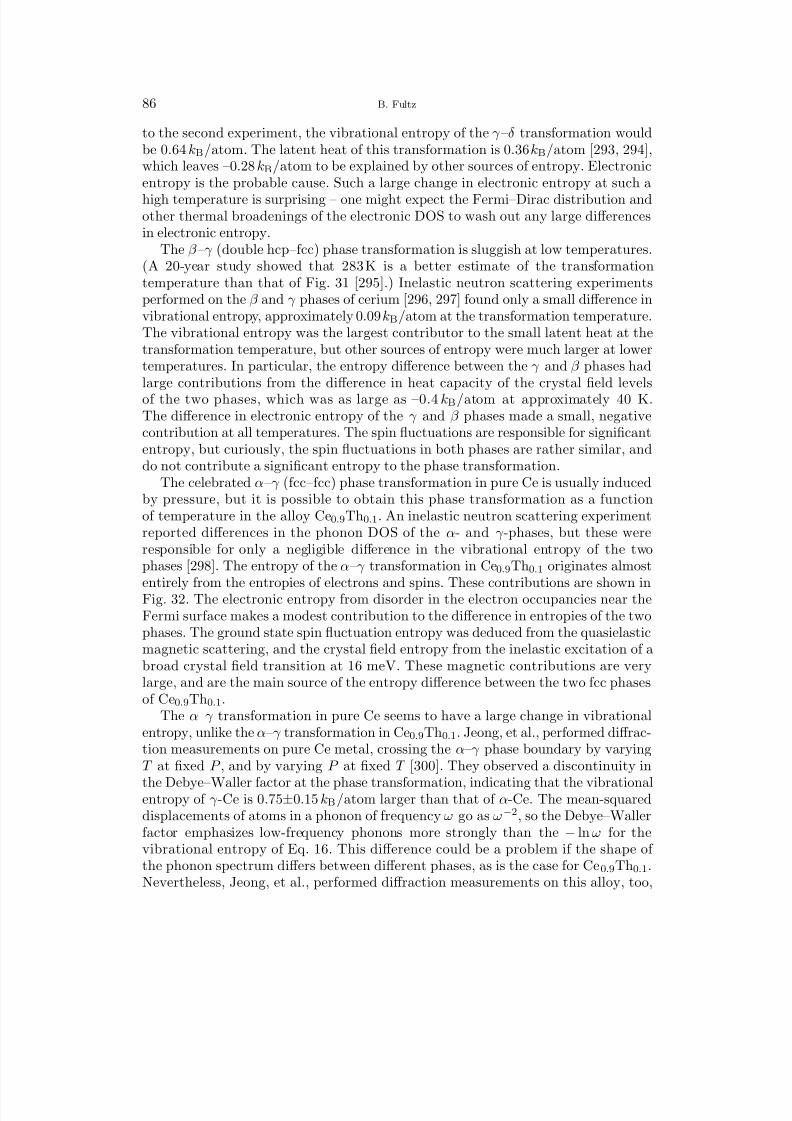
8/13/2019 Vibrational Thermodynamics
http://slidepdf.com/reader/full/vibrational-thermodynamics 90/145
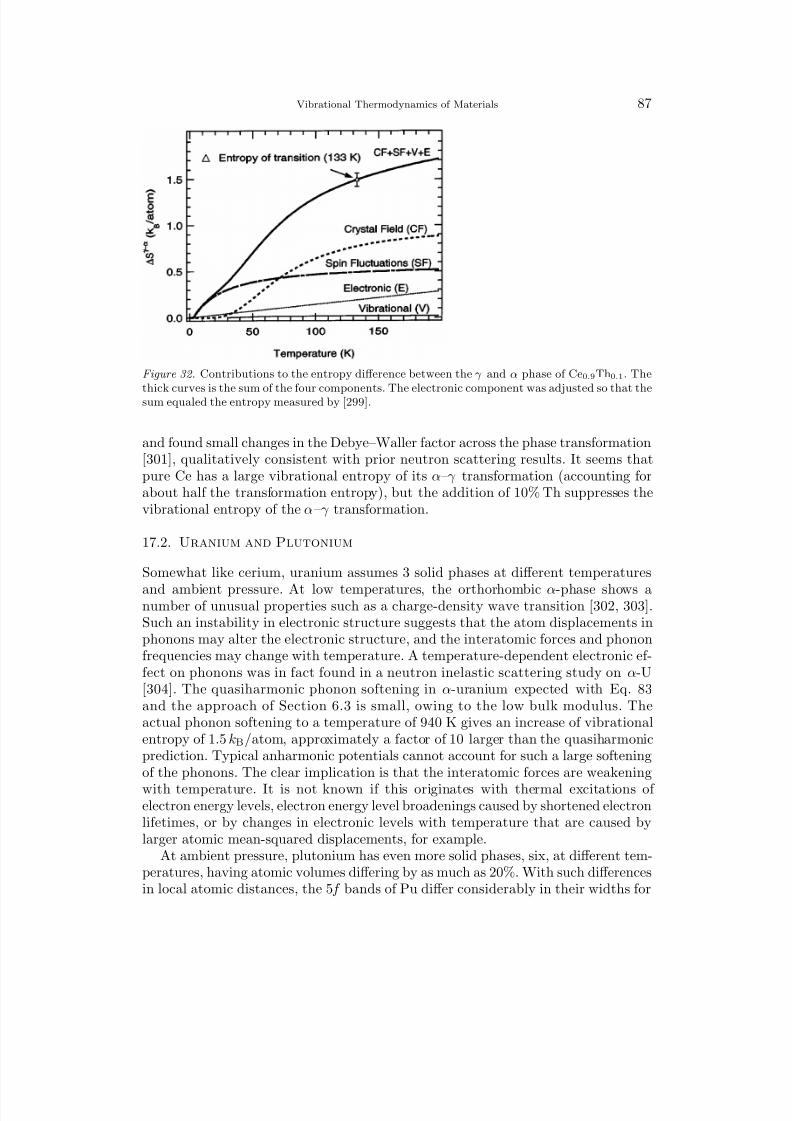
8/13/2019 Vibrational Thermodynamics
http://slidepdf.com/reader/full/vibrational-thermodynamics 91/145
8/13/2019 Vibrational Thermodynamics
http://slidepdf.com/reader/full/vibrational-thermodynamics 92/145
88 B. Fultz
the different phases. For the denser phases, the Peierls distortions of the 5f bands areresponsible for the formation of crystal structures of low symmetry [305, 306]. Thefcc δ -phase of Pu is intermediate in its 5f localization, and temperature causes someodd behavior, such as negative thermal expansion. The fcc δ -phase can be stabilized
over a broad range of temperature by alloying with 2 at.% Ga or 5 at.% Al (althoughthe thermal expansion becomes p ositive for the latter). Thermal neutron scatteringfrom Pu is possible for samples with a high enrichment of the 242Pu isotope, whichhas an acceptable absorption cross section. It is also possible to measure phonondispersions with inelastic x-ray scattering, which does not require isotopic control,and a full set of phonon dispersions were measured on a small single crystal of Pu-2 at.% Ga at ambient temperature [307]. An anomaly in the low transverse [011]phonon branch, and small anisotropic elastic constants were attributed to electron-phonon interactions. Measurements of the phonon DOS at temperatures of 300 Kand below were performed on 35 g of 242 Pu-5 at.% Al [308]. There was generally goodagreement with the results of [307], but from 27 to 300 K there was a large overallsoftening and broadening of the phonon spectrum. Similar to the case of U, forPu the quasiharmonic softening expected from Section 6.3 was more than a factorof ten too small to account for the phonon softening – the softening occurs withrelatively little change in lattice parameter. Such behavior seems plausible becausetemperature should have large effects on electrons in very narrow 5f bands, butdetailed predictions of electron-phonon interactions in Pu are only now becomingavailable [309].
The low temperature phases of Pu tend to have smaller specific volumes thanthe high temperature phases, and the actinide metals to the right of Pu (Am, Cm,Bk...) tend to be much larger in specific volume. It has been suggested that forthe larger phases of Pu, and for the heavier actinides, the 5 f electrons becomelocalized and non-bonding [310]. With these changes we may expect lower phonon
frequencies. Wallace used calorimetric data to show that this trend is generallytrue, and also showed that vibrational entropy plays a big role in stabilizing thehigh temperature phases [311]. The low temperature α-phase of Pu was also shownto be rather anharmonic.
8/13/2019 Vibrational Thermodynamics
http://slidepdf.com/reader/full/vibrational-thermodynamics 93/145
Vibrational Thermodynamics of Materials 89
III. Vibrational Entropy of Materials at HigherTemperatures
18. Interactions between Thermal Excitations of Electrons and
Phonons
18.1. Overview of Thermal Effects on Electron and Phonon Energies
The full Hamiltonian of the crystal, H , is
H = H n + H e + H ep (140)
where H n is the contribution from the nuclei (i.e., phonons as in Eqs. 23 or 141), H eis the contribution from the electrons (including electron-electron interactions andthermal electronic excitations), and H ep is the contribution from electron-phononinteractions (EPI). Figure 33 attempts to illustrate some concepts and definitionsof high temperature phonon thermodynamics, especially the adiabatic EPI. Six dia-grams are shown, with low temperature effects on the bottom and high temperatureeffects at the top. Phonon concepts for a fixed interatomic potential Φ(r) are on theleft; electron concepts with a simple free electron band structure are on the right.
At low temperatures, the vibrating atoms explore a small part of their interatomicpotential wells. A parabolic fit to the interatomic potential is appropriate (at leastwithout zero-point effects), and the harmonic model follows. At higher temperatures,the “quasiharmonic” approximation is often used, where Fig. 33 shows that theparabola is altered in position and curvature to accommodate small shifts in theeffective potential as the atoms vibrate about their points of equilibrium. (Thethermal spread in potential energy, of order k
BT , is shown by light shading.) The
quasiharmonic model assumes that phonons are eigenstates of a phonon Hamiltonianfor the expanded volume of the crystal, and it does not predict any shorteningof phonon lifetimes. This is less appropriate at higher temperatures, where thecubic and quartic contributions to the potential energy are needed to understandthe reduced phonon lifetimes, and shifts with temperature that may not dependquasiharmonically on the volume of the crystal and its bulk modulus (Section 6.3).“Anharmonic” corrections to the quasiharmonic model are needed to account for“phonon-phonon interactions” (PPI).
The electron states at right in Fig. 33 are filled to the Fermi level at T = 0,but at higher temperatures the shading illustrates a thermal spread of energiesassociated with the Fermi-Dirac distribution. At higher temperatures, as the nuclei
move further about their equilibrium positions, the electron band structure is al-tered. If this occurs without thermal excitations of electrons, the change in energyis that for anharmonic phonons, already included in H n. On the other hand, if there are atom displacements from many phonon excitations plus there are thermalelectron excitations, there is a change in energy that depends on both excitations.The conditions for obtaining this extra energy are illustrated at the top of Fig. 33.This is an adiabatic electron-phonon interaction, and makes up H ep of Eq. 140.Although differing in its thermal factor, the adiabatic EPI has similarities to the
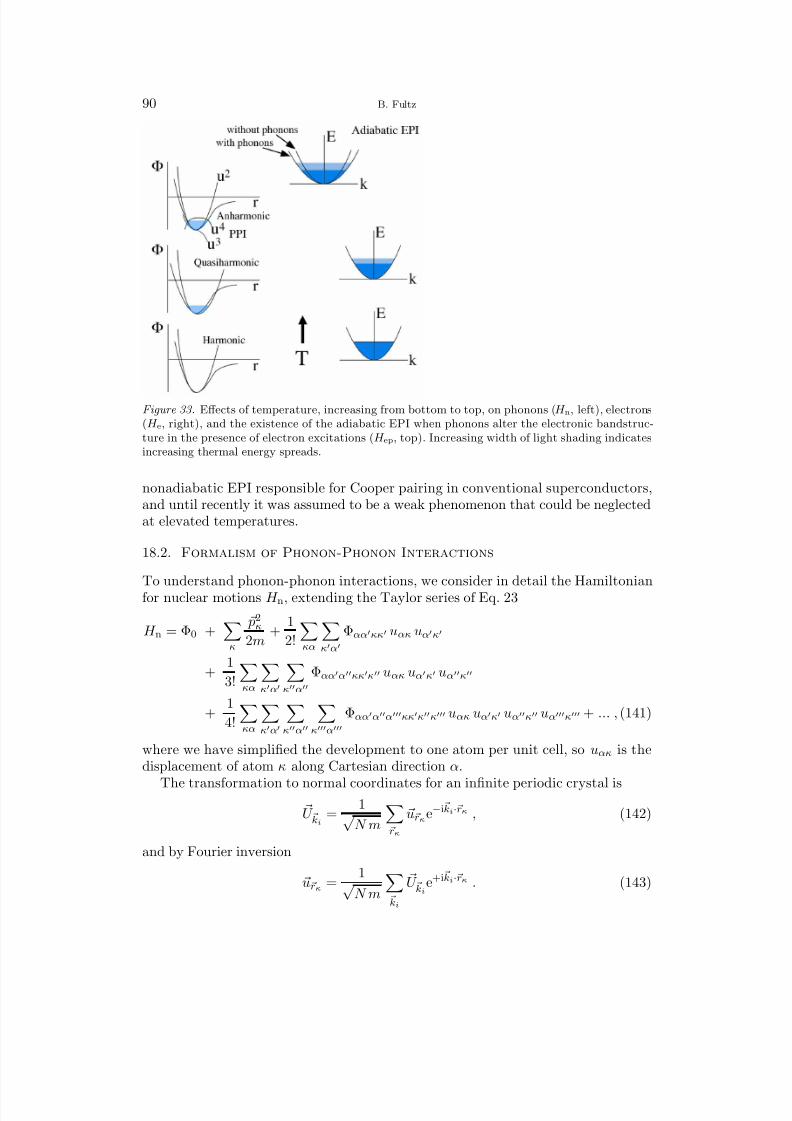
8/13/2019 Vibrational Thermodynamics
http://slidepdf.com/reader/full/vibrational-thermodynamics 94/145
90 B. Fultz
Figure 33. Effects of temperature, increasing from bottom to top, on phonons (H n, left), electrons(H e, right), and the existence of the adiabatic EPI when phonons alter the electronic bandstruc-ture in the presence of electron excitations (H ep, top). Increasing width of light shading indicatesincreasing thermal energy spreads.
nonadiabatic EPI responsible for Cooper pairing in conventional superconductors,and until recently it was assumed to be a weak phenomenon that could be neglectedat elevated temperatures.
18.2. Formalism of Phonon-Phonon Interactions
To understand phonon-phonon interactions, we consider in detail the Hamiltonianfor nuclear motions H n, extending the Taylor series of Eq. 23
H n = Φ0 +
κ
p2κ
2m +
1
2!
κα
κ′α′
Φαα′κκ′ uακ uα′κ′
+ 1
3!
κα
κ′α′
κ′′α′′
Φαα′α′′κκ′κ′′ uακ uα′κ′ uα′′κ′′
+ 1
4!
κα
κ′α′
κ′′α′′
κ′′′α′′′
Φαα′α′′α′′′κκ′κ′′κ′′′ uακ uα′κ′ uα′′κ′′ uα′′′κ′′′ + ... , (141)
where we have simplified the development to one atom per unit cell, so uακ is thedisplacement of atom κ along Cartesian direction α.
The transformation to normal coordinates for an infinite periodic crystal is
U ki=
1√ N m
rκ
urκe−i ki·rκ , (142)
and by Fourier inversion
urκ = 1√
N m
ki
U kie+i ki·rκ . (143)

8/13/2019 Vibrational Thermodynamics
http://slidepdf.com/reader/full/vibrational-thermodynamics 95/145
Vibrational Thermodynamics of Materials 91
Substituting Eq. 143 into Eq. 141, we identify the Fourier transform of Φαα′κκ′,and use it to define the dynamical matrix of Eqs. 30 and 31. Our interest nowis in the higher-order terms of Eq. 141, which cause anharmonic behavior whenthe atoms are vibrating with substantial amplitude. Using Eqs. 141 - 143 we can
assess phonon-phonon interactions with a classical approach, which is valid at hightemperatures.
There is, however, a clarity to be gained in working with the quantized phononfield (a displacement field in the crystal), especially when considering excitations of nonlocal electron states simultaneously with phonon excitations. The phonon fieldoperator is A ki
A ki= a ki
+ a†− ki= A†
− ki. (144)
The raising and lowering operators a† kiand a ki
create and annihilate the phonon ki.
They are constructed from the momentum and position operators of the Hamiltonian
when a plane wave solution is considered for one ki. The reader should have refer-ences showing the properties of a† and a for a simple harmonic oscillator [312], and
the a† kiand a ki
work the same way for a single normal mode of a harmonic crystal.
The formalism is now in the “occupation number representation,” where n phonons
of wavevector ki are created with n raising operations as
a† k
n |0 k = (n!)−1/2|n k.
The phonon field operators are related to the displacements (now operators) asFourier coefficients
u(rκ) = ki
2N m ω ki
e( ki) ei ki·rκ A ki. (145)
Note the similar roles of the phonon field operator A ki in Eq. 145 and the vector U kiin Eq. 143.
By substituting Eq. 145 into Eq. 141, the dynamical matrix is recovered fromthe quadratic term, with prefactors such as /(4ω ki
ω kj). We define similarly the
transformed higher-order terms, so Eq. 141 becomes
H n = Φ0 + ki
ω ki
a† ki
a ki+
1
2
+ ki
kj
kk
V ( ki, k j , kk) A kiA kj
A kk
+ ki
kj
kk
kl
V ( ki, k
j, k
k, k
l) A
kiA
kjA
kkA
kl+ ... , (146)
where the first sum on the right-hand side includes both the kinetic energy andthe harmonic part of the potential energy (following standard development [313]),
and the phonon number operator is a† kia ki
. The V are related to the Φ as Fourier
8/13/2019 Vibrational Thermodynamics
http://slidepdf.com/reader/full/vibrational-thermodynamics 96/145
92 B. Fultz
transforms. For example,
V ( ki, k j , kk) = 1
3!
1
N m3
23 1
ω ki
ω kj
ω kk
δ ( ki + k j + kk − g)
×
αrκeα( ki) eα′( k j ) eα′′( kk) e+i( ki+ kj+ kk)·rκ Φα,α′,α′′κ,κ′,κ′′ , (147)
where the factor δ signifies that the sum ki + k j + kk equals a reciprocal lattice
vector, g. For terminology, the terms with V ( ki, k j , kk) and V ( ki, k j , kk, kl) in Eq.146 give the energies of “phonon-phonon interactions” because they alter the phononenergies when larger vibrational displacements are present in the crystal.
Details of the phonon dispersions are immediately relevant when attempting tocalculate anharmonic behavior, and several concepts have been developed in detail.For example, if the phonon dispersion relation ε( k) were linear, it would be easy
to add two wavevectors k + k′ = k′′, and simultaneously conserve energy ε + ε′ =ε′′. The number of three-phonon processes increases as k2, at least for small k.Many phonon dispersions ε( k) are concave downwards, however, so simultaneousenergy and momentum conservation is often impossible unless at least one phononlies on a different branch. Phonon processes that satisfy momentum and energyconservation depend on the symmetry of the dispersion relations, and on the crystalstructure. For larger phonon wavevectors k, momentum conservation is possible byadding a reciprocal lattice vector. The idea is that the momentum transferred to theentire crystal occurs with zero energy because of the large mass of the crystal. Such“umklapp” processes allow many more three-phonon interactions, but the phononwavevectors must be of length comparable to the reciprocal lattice vector if thesevector additions are possible.
An important question is how many terms are needed in Eq. 146 to accountaccurately for anharmonic behavior. An approximate theory of the lifetimes of optical phonons was developed with 3-phonon processes [314], and was extended to 4-phonon processes to include energy shifts [315]. This approach has found applicationfor the analysis of the thermal shifts and widths of Raman peaks, sometimes withapplications to thermal conductivity (e.g. [316]). We expect the higher-order terms inEq. 141 to be progressively smaller, but the requirement of energy conservation andthe δ -function for momentum conservation in Eq. 147 restricts the allowable three-phonon processes, owing to restrictions imposed by the phonon dispersions ε( k).Fourth-order anharmonicity can therefore play a role as significant as the third.Another complexity is that four-phonon processes can be generated from three-phonon processes. The idea is that two three-phonon process such as k + k′ → k′′
and k′′ →
k′′′ +
k′′′′ can be combined through intermediate states
k′′ to becomea four-phonon process in second-order perturbation theory, which involves matrix
elements as
k′′ k′′′, k′′′′|H ′′′| k′′ k′′|H ′′′| k, k′. With effort, this field theoretic ap-proach has been used for some physical predictions as described below. Approximatesummations of the perturbation series have been performed, and some results foranharmonic heat capacity were reported for solids with Lennard-Jones potentials[318]. This approach also has conceptual value for understanding the meaning of anharmonicity.

8/13/2019 Vibrational Thermodynamics
http://slidepdf.com/reader/full/vibrational-thermodynamics 97/145
Vibrational Thermodynamics of Materials 93
18.3. Formalism of Electron-Phonon Interactions
The large difference in energy scales of phonons and electrons can motivate theseparation of the Hamiltonian of the solid into a term with nuclear coordinates for
the phonons H n, and a term with electron coordinates H e (Eq. 140). The energy of the crystal deformation caused by a phonon originates with the electrons, of course,but although this potential energy of deformation is electronic in origin, it transfersto kinetic energy in the motion of the nuclei.45 If the electrons were always in theirground states, all this energy of deformation would be associated with H n alone(i.e., the phonons). Treating the electron system and the phonon system as twoindependent thermodynamic systems becomes inconsistent at finite temperature,however, because the presence of phonons alters the thermal excitations of electrons.
Very generally, the electron-phonon interaction (EPI) requires the coordinates of the electrons rel
λ , and coordinates of the nuclei rn j
H ep =λ,j
V (relλ , rn
j ) . (148)
First assume the nuclear motions are slow enough so the electron levels adaptcontinuously to the evolving structure, i.e., the Born–Oppenheimer approximation.This “adiabatic approximation” does not allow the nuclear kinetic energy to alterthe electron states.46 The adiabatic EPI increases with the number of phonons,but it also scales with the thermal excitations of electrons. (Effects from how theinteratomic potential depends on phonon populations alone are already counted asphonon-phonon interactions.)
In this adiabatic picture, unique electron eigenstates exist for a snapshot of thenuclear thermal displacements, but these evolve continuously as the nuclei move.Taking for reference a ground state with the nuclear positions of a perfectly periodic
crystal and the electronic structure at 0 K, we seek to account for how the displacednuclear positions alter the thermally-excited electronic energy levels (changing theelectronic excitations induced by temperature). For a given electronic structure, theadiabatic electron-phonon interaction is proportional to the number of phonons,n(ε, T ) + 1/2, times the difference of electron occupancy with respect to the groundstate, f (T ) − f (0), where f (T ) is the Fermi-Dirac distribution. When there aresharp features in the electronic DOS near the Fermi level, there will be a shift of electron chemical potential with temperature, and other temperature-dependencesassociated with the thermal sampling of the excited electron states.
How the electron eigenstates change with nuclear displacements is a problem thatgenerally requires considerable detail about the states of electrons and phonons. Asimple approach is to consider an electronic band formed from isotropic s-electrons,
and a uniform dilation as may be associated with longitudinal phonons of long45 For a harmonic phonon, the electron-phonon interaction affects equally the energies of the
electrons and the phonons.46 The “non-adiabatic” electron-phonon interaction accounts for how the electronic states are
altered by the nuclear kinetic energy, not the potential energy of displaced nuclei as for the adia-batic case. The non-adiabatic EPI does not require thermal activation, and can be responsible forsuperconductivity.
8/13/2019 Vibrational Thermodynamics
http://slidepdf.com/reader/full/vibrational-thermodynamics 98/145
94 B. Fultz
wavelength,
H Dep = −
λ
D∆(relλ ) . (149)
where ∆(relλ ) is the fractional change in volume at relλ , and D is a “deformationpotential,” typically a few eV.47 This simple approach is convenient because the∆(rel
λ ) is related to the displacement u as through its divergence: ∆(relλ ) = ∇ · u, so
H Dep = −D
λ
∇ · u(relλ ) . (150)
For longitudinal phonons
e( ki) = ki
ki, (151)
and by taking the divergence of Eq. 145 we have, now in the occupation number
representation
H Dep = −iDrelλ
ki
2N m ω ki
| ki| ei ki·relλ A ki(152)
Consistent with the second quantization formalism for phonons, fermion fieldoperators are used for the electrons
Ψ†(relλ ) =
kλ
C † kλe−i kλ·relλ , (153)
which when applied to a multi-electron state, places an electron in the state kλ (the
operator C kλremoves an electron from this state). When small, H Dep in Eq. 152
is a perturbation that mixes electronic states as Ψf |H Dep|Ψi. This integral can be
evaluated by using the fermion field operators C and C †, where the exponential phasefactors cancel the k-space integration unless there is a conservation of wavevector.This forces the same total kλ + ki for the creation operators as for the annihilationoperators
H Dep = −iD
2N m
electron kλ
phonon ki
ki
cLA ki
C † kλ+ kiC kλ
, (154)
plus an analogous term with A† ki
C kλ+ kiC † kλ
for phonon creation. For Eq. 154 we also
used a linear dispersion relationship ωL(ki) = cLki, appropriate for long-wavelength,
longitudinal acoustic phonons. In accounting for the effects of phonons on the elec-tron states, it is usually necessary to consider a more general case than the isotropicdeformation potential of Eq. 149 as
I ∝
kλ + kλ
e j( k j ) · ∇rnj
V (relλ , rn
j ) kλ
, (155)
47 It is not typical to have electron energies shifted by several eV under high compressions, so theD typically pertain to small elastic distortions over a finite volume of crystal.
8/13/2019 Vibrational Thermodynamics
http://slidepdf.com/reader/full/vibrational-thermodynamics 99/145
Vibrational Thermodynamics of Materials 95
where the gradient is with respect to the nuclear coordinates.48
In general, there are two lower order terms that are used to describe the electron-phonon interaction. The first is a generalization of the previous result Eq. 154
H 1ep = ki
kλ
V ep
( ki, kλ) A kiC † kλ+ kiC kλ . (156)
It accounts for the processes where an electron is excited from state kλ to kλ + ki, simultaneously with the annihilation of a phonon in state ki, or creation of aphonon in state − ki. Momentum conservation restricts significantly these three-phonon processes. The second low-order term for electron-phonon coupling is H 2ep,
and it includes a factor from second-order perturbation theory,
k′ k|Ω| k′ k′|Ω| k.
Note that the initial and final states of the electron have the same k, so there is nochange of electron state by this process. Nevertheless, the scattering into the virtualstates k′ serve to alter the self-energy of the electron.
For calculating the thermodynamic effects of electron-phonon coupling, it is moreuseful to know how the electron-phonon coupling depends on energy, rather thanmomentum as in Eq. 156 for H 1ep. This requires averaging over all electron states
near the Fermi surface separated by k j and differing in energy by a selected ω.Most work on electron-phonon coupling has focused on superconductivity, where ω is rather small, and the electron states are close enough to the Fermi surfacethat it is reasonable to use ground state Fermi surface properties. The Eliashbergcoupling function α2g(ω), where g(ω) is the phonon DOS, accounts for all scatteringbetween electron states on the Fermi surface. The function α2g(ω) often looks similarg(ω), although some parts of the spectrum are given different weights. An importantmoment is calculated by weighting by ω−1, and can be shown to be
2 ωmax
0
α2g(ω)
ω dω = N (E
F)I 2
M ω2 = λ (157)
where I 2 is an average of I ∗I of Eq. 155 (or its analog) over all directions, ω2is a second moment of the phonon DOS, N (E F) is the electron DOS at the Fermisurface, and λ is the “electron-phonon coupling parameter.” The strength of theelectron-phonon coupling scales with λ.
19. Phonon-Phonon Anharmonicity
19.1. Damped Harmonic Oscillator
The equation of motion for a classical damped harmonic oscillator is
md2x
dt2 + b
dx
dt − kx = 0 . (158)
48 “Frolich coupling” is another example of an EPI, where longitudinal optical phonons create anelectric field in an ionic solid. In this case, the Fourier transform of a Coulomb potential gives afactor of 4πk−2
i , and with two ions involved, H Frep goes as k−1i (instead of the k+1/2i for H Dep in Eq.
154). Transition rates, or scattering rates, go as the square of these quantities.
8/13/2019 Vibrational Thermodynamics
http://slidepdf.com/reader/full/vibrational-thermodynamics 100/145
96 B. Fultz
We define the dimensionless quality factor Q as
Q ≡√
km
b . (159)
A solution of Eq. 158 is
x(t) = X 0 e−[i+(2Q)−1] ωt , (160)
where the frequency ω differs somewhat from that of the undamped harmonicoscillator (for which ω0 =
k/m)
ω = ω0
1
1 + (2Q)−2 . (161)
When Q is large, the frequency shift ∆ is approximately
∆ = −ω
02 1
2Q2
. (162)
The energy spectrum of the damped harmonic oscillator was given in Eq. 139for ε′ = ω. When Q is large, Eq. 139 has the form of a Lorentzian function withhalf-width-at-half-maximum, Γ, of
Γ = ω0
2Q . (163)
For a damped classical harmonic oscillator, the ratio of peak broadening to peakshift is
Γ
∆
=
−4
Q. (164)
Equation 164 is convenient for testing against experimental measurements.When the vibrational entropy is evaluated with Eq. 14, there is a change to S vib
when a DOS curve g(ε) is broadened by the damped harmonic oscillator powerspectrum of Eq. 139. The shape of the damped oscillator spectrum is asymmetrical,going to zero at ε = 0, and having more weight on its higher energy side. At hightemperatures, where the phonon occupancy is large, the broadening serves to reducethe vibrational entropy.49 (There is a compensating effect from the lowering of thefrequencies by damping, but this effect is smaller.)
The damping of a classical harmonic oscillator is understood as a dissipativeprocess that transforms the energy of a macroscopic system into heat. Phonons arethe heat, however, so the damping of a phonon cannot be understood in the sameway. For example, adding a dissipative term to the Schrodinger equation woulddissipate probability, not energy. It is necessary to treat phonon lifetimes as thetransfer of energy between phonon modes, so a multi-body quantum mechanics isimmediately necessary. The coupling of anharmonic quantum oscillators allows prob-ability to transfer between the different oscillators, sometimes with energy shared
49 When two DOS curves such as gα(ε) and gβ(ε) of Eq. 16 are both broadened by dampedoscillator functions of the same Q, there is no effect on ∆S β−αvib .
8/13/2019 Vibrational Thermodynamics
http://slidepdf.com/reader/full/vibrational-thermodynamics 101/145
Vibrational Thermodynamics of Materials 97
by more than one. Such a model is convenient because it conserves energy, and aHamiltonian can be written for the problem. If only a few oscillators are involved,however, a state will recur with some characteristic time. This may or may not be anissue for understanding experimental measurements of phonon lifetimes, but it will
lead to confusion about the meaning of dissipation and irreversibility. The solutionto the problem is to have a dense distribution of oscillators in the heat bath, whichis an appropriate model for a macroscopic system with many degrees of freedom.For this reason, the damping of a quantum oscillator is sometimes analyzed as theimaginary part of the dynamical susceptibility of an external field interacting withthe oscillator [319].
Self-consistent phonon theories offer an alternative to the perturbation theoryapproach described in Section 19.2. In essence, these methods make a modificationto the dynamical matrix of harmonic theory. Horton and Cowley develop a simpleone-dimensional example where the force constant, d2V /dx2, is convoluted with aGaussian function in x [320]. A set of equations is solved for consistency betweenthe breadth of this Gaussian and the phonon frequency. This first-order approachuses a symmetrical interatomic potential without odd terms in x. This is also truefor the more general first-order self-consistent phonon theory developed by Wallace,who then demonstrates interactions between the first-order phonons from the cubicterms in the potential [46].
19.2. Perturbation Theory
The usual approach to calculating how the frequencies and lifetimes of phononschange with temperature is with perturbation theory, using harmonic phonons as abasis set, and the last two terms of Eq. 146 as perturbations that alter the energies of the vibrational states. The phonon lifetime is calculated from Fermi’s second goldenrule, where transition rates are calculated individually by expanding the operatorsA ki
in Eq. 146, and using these to couple the initial and final states of harmonic orquasiharmonic phonons.
Perturbation theory is performed for the atoms about their equilibrium config-uration at elevated temperature, i.e., the thermal expansion consistent with quasi-harmonic theory is already taken into account. For centro-symmetric crystals, thecubic terms in Eq. 141 with Φαα′α′′κκ′κ′′ uακ uα′κ′ uα′′κ′′ vanish because they are oddin the atom displacements, u. For example, the cubic energy contribution from thepositive displacement of an atom with respect to its neighbor on the right is exactlycancelled by its negative displacement with respect to the atom at its left. Forquantized vibrations, there is no energy change when V ( ki, k j , kk) from Eq. 146 (or147) is treated as a first-order perturbation of quasiharmonic phonon states. The
first non-vanishing first-order perturbation is the fourth-order term V ( ki,
k j ,
kk,
kl)in Eq. 146. It is physically reasonable, but argued more rigorously by Van Hove [321],
that with respect to the harmonic term of relative strength 1, the energy of the nth-order perturbation goes as (u/a)n−2, where u is the displacement, and a is the 1NNdistance. We note that the fourth-order term in first-order perturbation theory isof relative strength (u/a)2, but the third-order term in second-order perturbationtheory is of equal strength, i.e., (u/a)3−2 × (u/a)3−2 = (u/a)2. The standard treat-ment of anharmonicity by perturbation theory includes these two parts, the quartic
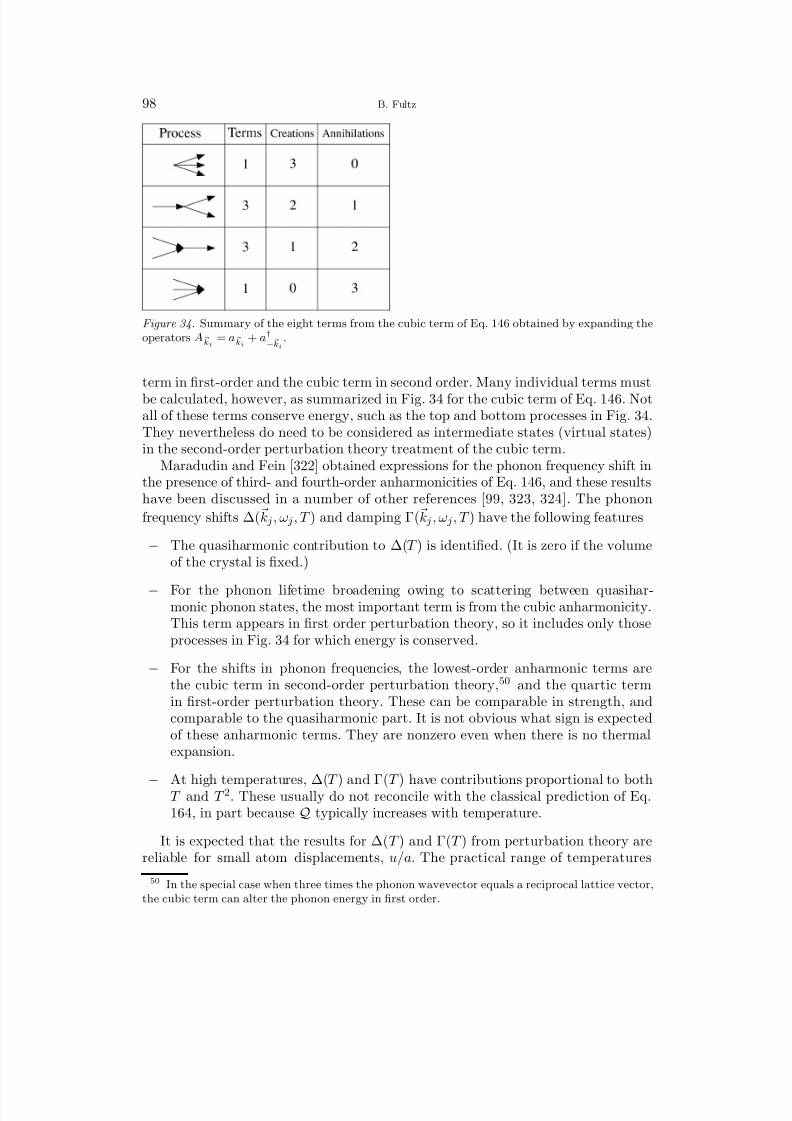
8/13/2019 Vibrational Thermodynamics
http://slidepdf.com/reader/full/vibrational-thermodynamics 102/145
98 B. Fultz
Figure 34. Summary of the eight terms from the cubic term of Eq. 146 obtained by expanding theoperators A ki
= a ki + a†− ki
.
term in first-order and the cubic term in second order. Many individual terms mustbe calculated, however, as summarized in Fig. 34 for the cubic term of Eq. 146. Notall of these terms conserve energy, such as the top and bottom processes in Fig. 34.They nevertheless do need to be considered as intermediate states (virtual states)in the second-order perturbation theory treatment of the cubic term.
Maradudin and Fein [322] obtained expressions for the phonon frequency shift inthe presence of third- and fourth-order anharmonicities of Eq. 146, and these resultshave been discussed in a number of other references [99, 323, 324]. The phonon
frequency shifts ∆( k j, ω j, T ) and damping Γ( k j , ω j, T ) have the following features
− The quasiharmonic contribution to ∆(T ) is identified. (It is zero if the volumeof the crystal is fixed.)
− For the phonon lifetime broadening owing to scattering between quasihar-monic phonon states, the most important term is from the cubic anharmonicity.This term appears in first order perturbation theory, so it includes only thoseprocesses in Fig. 34 for which energy is conserved.
− For the shifts in phonon frequencies, the lowest-order anharmonic terms arethe cubic term in second-order perturbation theory,50 and the quartic termin first-order perturbation theory. These can be comparable in strength, andcomparable to the quasiharmonic part. It is not obvious what sign is expectedof these anharmonic terms. They are nonzero even when there is no thermalexpansion.
− At high temperatures, ∆(T ) and Γ(T ) have contributions proportional to bothT and T 2. These usually do not reconcile with the classical prediction of Eq.164, in part because Q typically increases with temperature.
It is expected that the results for ∆(T ) and Γ(T ) from perturbation theory arereliable for small atom displacements, u/a. The practical range of temperatures
50 In the special case when three times the phonon wavevector equals a reciprocal lattice vector,the cubic term can alter the phonon energy in first order.
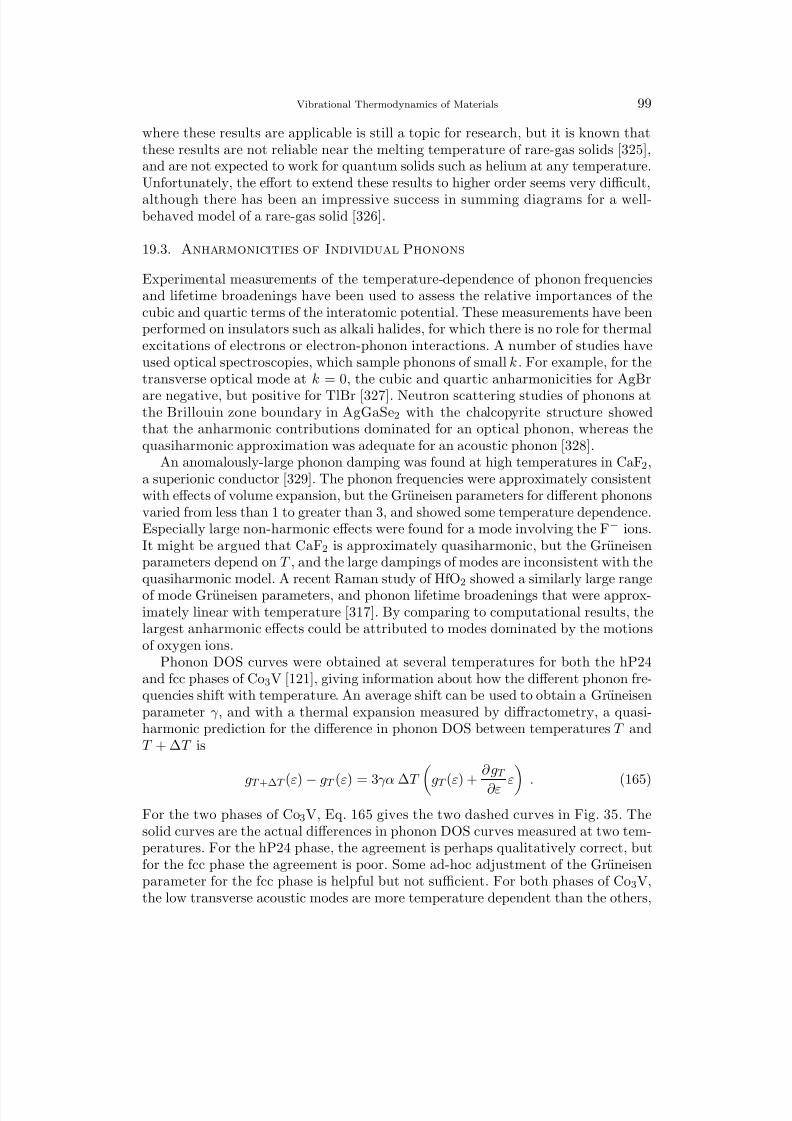
8/13/2019 Vibrational Thermodynamics
http://slidepdf.com/reader/full/vibrational-thermodynamics 103/145
Vibrational Thermodynamics of Materials 99
where these results are applicable is still a topic for research, but it is known thatthese results are not reliable near the melting temperature of rare-gas solids [325],and are not expected to work for quantum solids such as helium at any temperature.Unfortunately, the effort to extend these results to higher order seems very difficult,
although there has been an impressive success in summing diagrams for a well-behaved model of a rare-gas solid [326].
19.3. Anharmonicities of Individual Phonons
Experimental measurements of the temperature-dependence of phonon frequenciesand lifetime broadenings have been used to assess the relative importances of thecubic and quartic terms of the interatomic potential. These measurements have beenperformed on insulators such as alkali halides, for which there is no role for thermalexcitations of electrons or electron-phonon interactions. A number of studies haveused optical spectroscopies, which sample phonons of small k . For example, for thetransverse optical mode at k = 0, the cubic and quartic anharmonicities for AgBr
are negative, but positive for TlBr [327]. Neutron scattering studies of phonons atthe Brillouin zone boundary in AgGaSe2 with the chalcopyrite structure showedthat the anharmonic contributions dominated for an optical phonon, whereas thequasiharmonic approximation was adequate for an acoustic phonon [328].
An anomalously-large phonon damping was found at high temperatures in CaF2,a superionic conductor [329]. The phonon frequencies were approximately consistentwith effects of volume expansion, but the Gruneisen parameters for different phononsvaried from less than 1 to greater than 3, and showed some temperature dependence.Especially large non-harmonic effects were found for a mode involving the F− ions.It might be argued that CaF2 is approximately quasiharmonic, but the Gruneisenparameters depend on T , and the large dampings of modes are inconsistent with thequasiharmonic model. A recent Raman study of HfO2 showed a similarly large rangeof mode Gruneisen parameters, and phonon lifetime broadenings that were approx-imately linear with temperature [317]. By comparing to computational results, thelargest anharmonic effects could be attributed to modes dominated by the motionsof oxygen ions.
Phonon DOS curves were obtained at several temperatures for both the hP24and fcc phases of Co3V [121], giving information about how the different phonon fre-quencies shift with temperature. An average shift can be used to obtain a Gruneisenparameter γ , and with a thermal expansion measured by diffractometry, a quasi-harmonic prediction for the difference in phonon DOS between temperatures T andT + ∆T is
gT +∆T (ε) − gT (ε) = 3γα ∆T
gT (ε) +
∂ gT
∂ε ε
. (165)
For the two phases of Co3V, Eq. 165 gives the two dashed curves in Fig. 35. Thesolid curves are the actual differences in phonon DOS curves measured at two tem-peratures. For the hP24 phase, the agreement is perhaps qualitatively correct, butfor the fcc phase the agreement is poor. Some ad-hoc adjustment of the Gruneisenparameter for the fcc phase is helpful but not sufficient. For both phases of Co3V,the low transverse acoustic modes are more temperature dependent than the others,
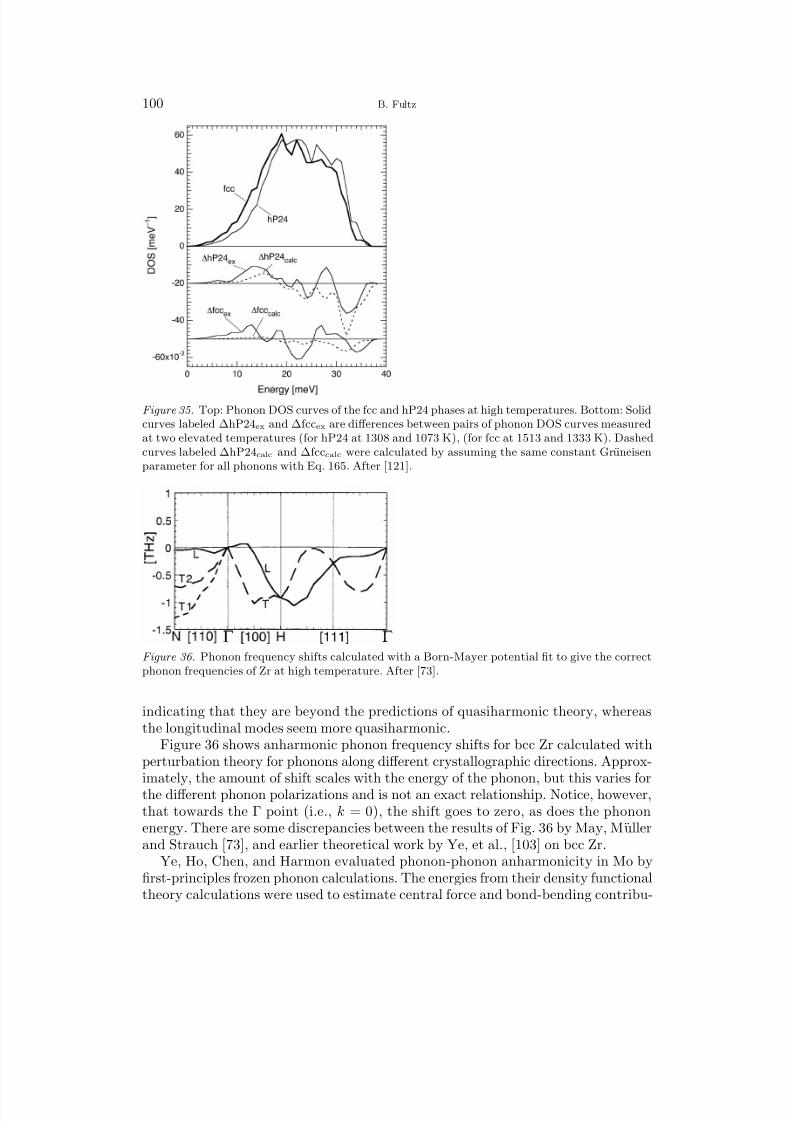
8/13/2019 Vibrational Thermodynamics
http://slidepdf.com/reader/full/vibrational-thermodynamics 104/145
100 B. Fultz
Figure 35. Top: Phonon DOS curves of the fcc and hP24 phases at high temperatures. Bottom: Solidcurves labeled ∆hP24ex and ∆fccex are differences between pairs of phonon DOS curves measuredat two elevated temperatures (for hP24 at 1308 and 1073 K), (for fcc at 1513 and 1333 K). Dashedcurves labeled ∆hP24calc and ∆fcccalc were calculated by assuming the same constant Gruneisenparameter for all phonons with Eq. 165. After [121].
Figure 36. Phonon frequency shifts calculated with a Born-Mayer potential fit to give the correctphonon frequencies of Zr at high temperature. After [73].
indicating that they are beyond the predictions of quasiharmonic theory, whereasthe longitudinal modes seem more quasiharmonic.
Figure 36 shows anharmonic phonon frequency shifts for bcc Zr calculated withperturbation theory for phonons along different crystallographic directions. Approx-
imately, the amount of shift scales with the energy of the phonon, but this varies forthe different phonon polarizations and is not an exact relationship. Notice, however,that towards the Γ point (i.e., k = 0), the shift goes to zero, as does the phononenergy. There are some discrepancies between the results of Fig. 36 by May, M ullerand Strauch [73], and earlier theoretical work by Ye, et al., [103] on bcc Zr.
Ye, Ho, Chen, and Harmon evaluated phonon-phonon anharmonicity in Mo byfirst-principles frozen phonon calculations. The energies from their density functionaltheory calculations were used to estimate central force and bond-bending contribu-
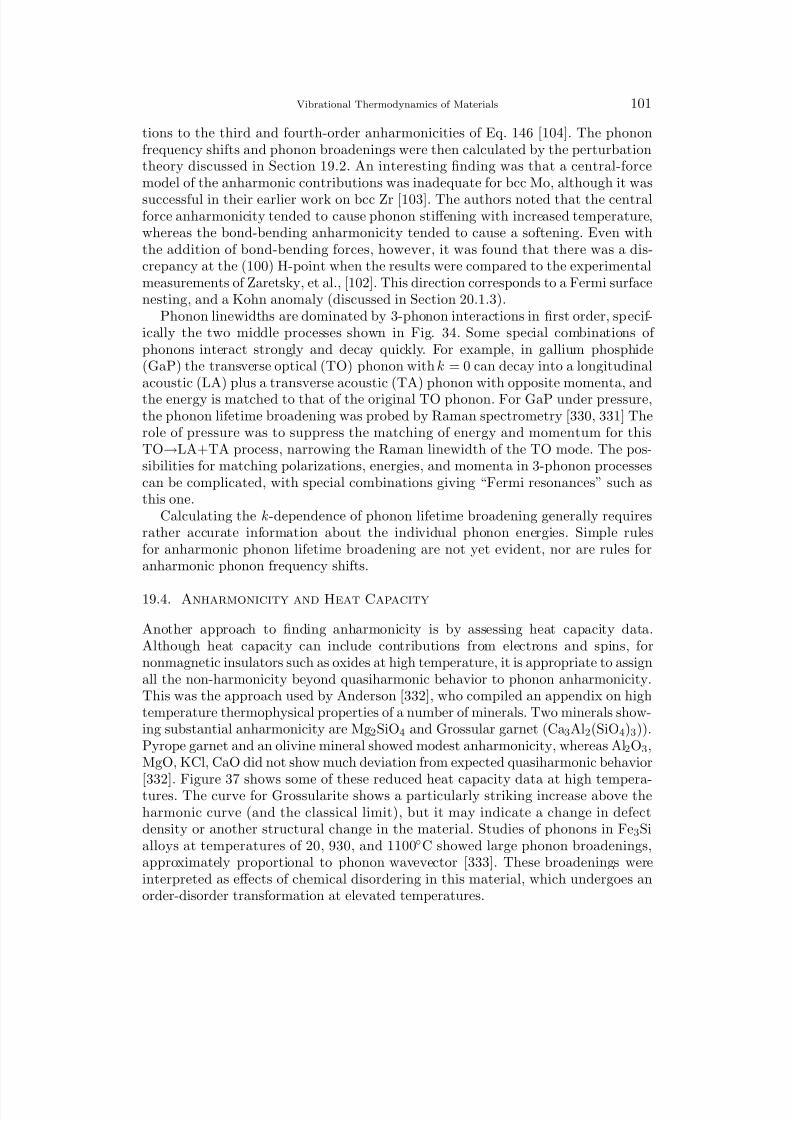
8/13/2019 Vibrational Thermodynamics
http://slidepdf.com/reader/full/vibrational-thermodynamics 105/145
Vibrational Thermodynamics of Materials 101
tions to the third and fourth-order anharmonicities of Eq. 146 [104]. The phononfrequency shifts and phonon broadenings were then calculated by the perturbationtheory discussed in Section 19.2. An interesting finding was that a central-forcemodel of the anharmonic contributions was inadequate for bcc Mo, although it was
successful in their earlier work on bcc Zr [103]. The authors noted that the centralforce anharmonicity tended to cause phonon stiffening with increased temperature,whereas the bond-bending anharmonicity tended to cause a softening. Even withthe addition of bond-bending forces, however, it was found that there was a dis-crepancy at the (100) H-point when the results were compared to the experimentalmeasurements of Zaretsky, et al., [102]. This direction corresponds to a Fermi surfacenesting, and a Kohn anomaly (discussed in Section 20.1.3).
Phonon linewidths are dominated by 3-phonon interactions in first order, specif-ically the two middle processes shown in Fig. 34. Some special combinations of phonons interact strongly and decay quickly. For example, in gallium phosphide(GaP) the transverse optical (TO) phonon with k = 0 can decay into a longitudinalacoustic (LA) plus a transverse acoustic (TA) phonon with opposite momenta, andthe energy is matched to that of the original TO phonon. For GaP under pressure,the phonon lifetime broadening was probed by Raman spectrometry [330, 331] Therole of pressure was to suppress the matching of energy and momentum for thisTO→LA+TA process, narrowing the Raman linewidth of the TO mode. The pos-sibilities for matching polarizations, energies, and momenta in 3-phonon processescan be complicated, with special combinations giving “Fermi resonances” such asthis one.
Calculating the k-dependence of phonon lifetime broadening generally requiresrather accurate information about the individual phonon energies. Simple rulesfor anharmonic phonon lifetime broadening are not yet evident, nor are rules foranharmonic phonon frequency shifts.
19.4. Anharmonicity and Heat Capacity
Another approach to finding anharmonicity is by assessing heat capacity data.Although heat capacity can include contributions from electrons and spins, fornonmagnetic insulators such as oxides at high temperature, it is appropriate to assignall the non-harmonicity beyond quasiharmonic behavior to phonon anharmonicity.This was the approach used by Anderson [332], who compiled an appendix on hightemperature thermophysical properties of a number of minerals. Two minerals show-ing substantial anharmonicity are Mg2SiO4 and Grossular garnet (Ca3Al2(SiO4)3)).Pyrope garnet and an olivine mineral showed modest anharmonicity, whereas Al2O3,MgO, KCl, CaO did not show much deviation from expected quasiharmonic behavior
[332]. Figure 37 shows some of these reduced heat capacity data at high tempera-tures. The curve for Grossularite shows a particularly striking increase above theharmonic curve (and the classical limit), but it may indicate a change in defectdensity or another structural change in the material. Studies of phonons in Fe 3Sialloys at temperatures of 20, 930, and 1100C showed large phonon broadenings,approximately proportional to phonon wavevector [333]. These broadenings wereinterpreted as effects of chemical disordering in this material, which undergoes anorder-disorder transformation at elevated temperatures.
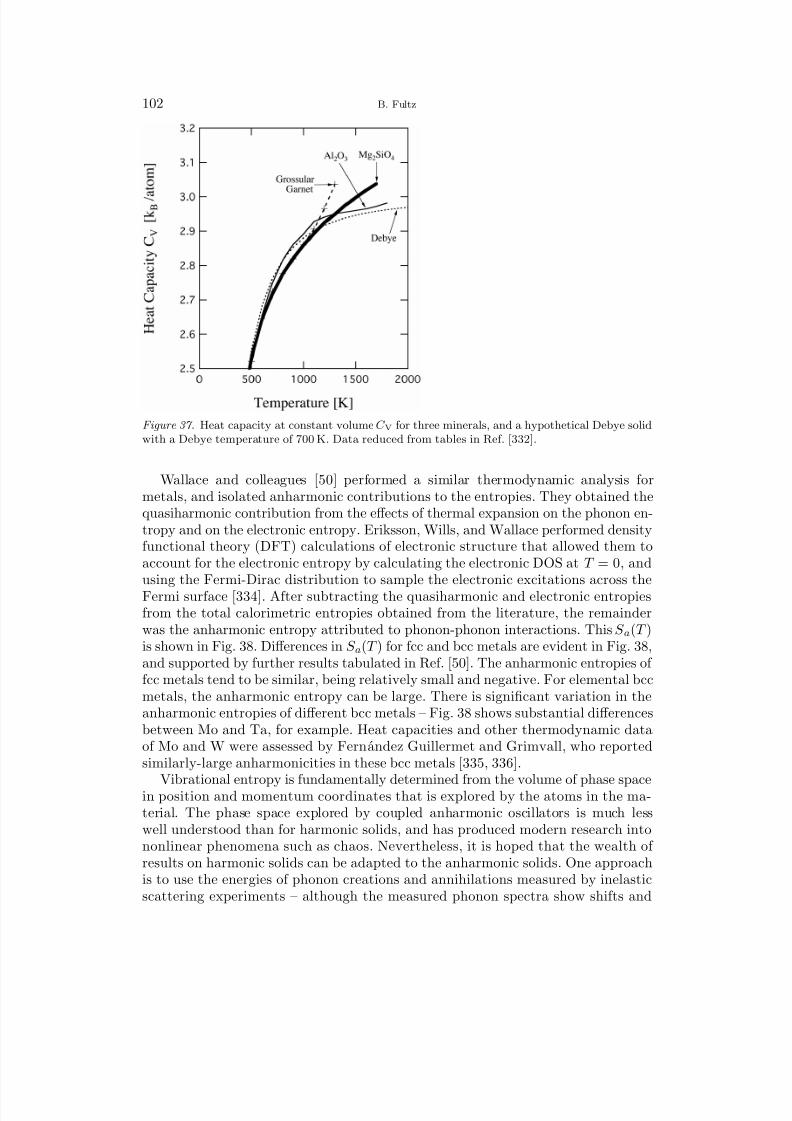
8/13/2019 Vibrational Thermodynamics
http://slidepdf.com/reader/full/vibrational-thermodynamics 106/145
102 B. Fultz
Figure 37. Heat capacity at constant volume C V for three minerals, and a hypothetical Debye solidwith a Debye temperature of 700 K. Data reduced from tables in Ref. [332].
Wallace and colleagues [50] performed a similar thermodynamic analysis formetals, and isolated anharmonic contributions to the entropies. They obtained thequasiharmonic contribution from the effects of thermal expansion on the phonon en-tropy and on the electronic entropy. Eriksson, Wills, and Wallace performed densityfunctional theory (DFT) calculations of electronic structure that allowed them toaccount for the electronic entropy by calculating the electronic DOS at T = 0, andusing the Fermi-Dirac distribution to sample the electronic excitations across theFermi surface [334]. After subtracting the quasiharmonic and electronic entropiesfrom the total calorimetric entropies obtained from the literature, the remainderwas the anharmonic entropy attributed to phonon-phonon interactions. This S a(T )is shown in Fig. 38. Differences in S a(T ) for fcc and bcc metals are evident in Fig. 38,and supported by further results tabulated in Ref. [50]. The anharmonic entropies of fcc metals tend to be similar, being relatively small and negative. For elemental bccmetals, the anharmonic entropy can be large. There is significant variation in theanharmonic entropies of different bcc metals – Fig. 38 shows substantial differencesbetween Mo and Ta, for example. Heat capacities and other thermodynamic dataof Mo and W were assessed by Fernandez Guillermet and Grimvall, who reportedsimilarly-large anharmonicities in these bcc metals [335, 336].
Vibrational entropy is fundamentally determined from the volume of phase spacein position and momentum coordinates that is explored by the atoms in the ma-terial. The phase space explored by coupled anharmonic oscillators is much lesswell understood than for harmonic solids, and has produced modern research intononlinear phenomena such as chaos. Nevertheless, it is hoped that the wealth of results on harmonic solids can be adapted to the anharmonic solids. One approachis to use the energies of phonon creations and annihilations measured by inelasticscattering experiments – although the measured phonon spectra show shifts and
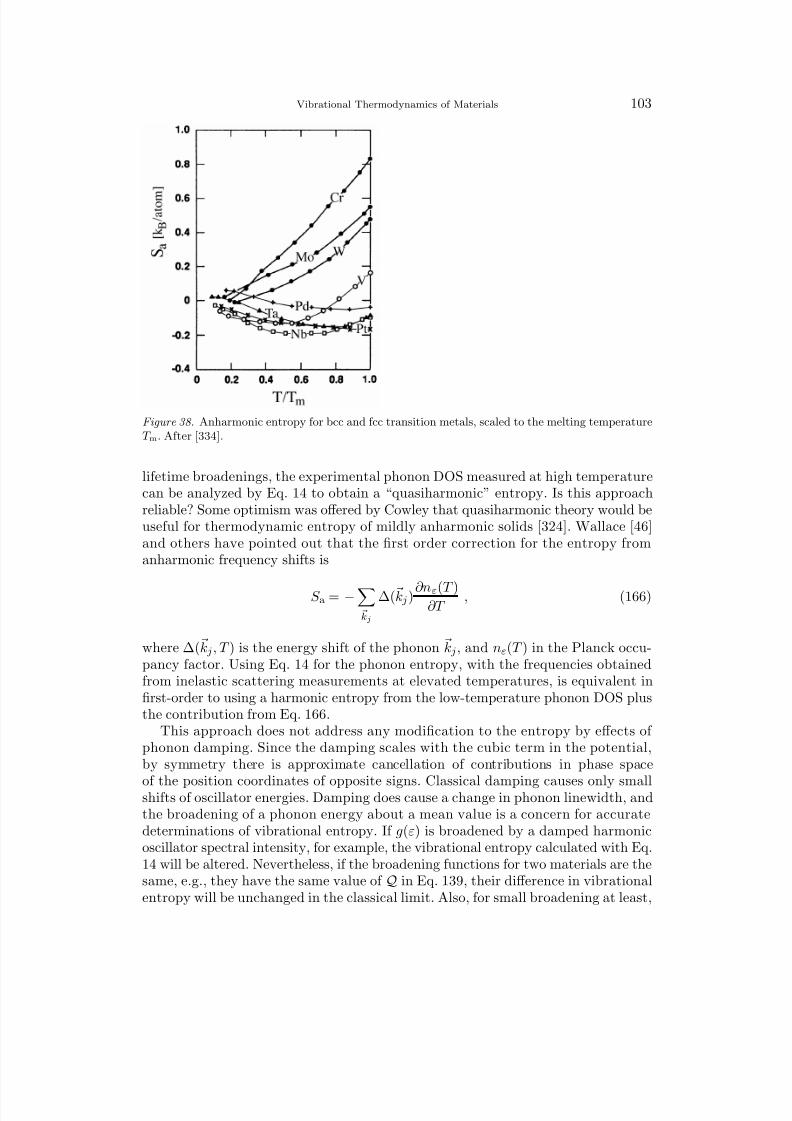
8/13/2019 Vibrational Thermodynamics
http://slidepdf.com/reader/full/vibrational-thermodynamics 107/145
Vibrational Thermodynamics of Materials 103
Figure 38. Anharmonic entropy for bcc and fcc transition metals, scaled to the melting temperatureT m. After [334].
lifetime broadenings, the experimental phonon DOS measured at high temperaturecan be analyzed by Eq. 14 to obtain a “quasiharmonic” entropy. Is this approachreliable? Some optimism was offered by Cowley that quasiharmonic theory would beuseful for thermodynamic entropy of mildly anharmonic solids [324]. Wallace [46]and others have pointed out that the first order correction for the entropy fromanharmonic frequency shifts is
S a = − kj
∆( k j ) ∂nε(T )∂T
, (166)
where ∆( k j, T ) is the energy shift of the phonon k j, and nε(T ) in the Planck occu-pancy factor. Using Eq. 14 for the phonon entropy, with the frequencies obtainedfrom inelastic scattering measurements at elevated temperatures, is equivalent infirst-order to using a harmonic entropy from the low-temperature phonon DOS plusthe contribution from Eq. 166.
This approach does not address any modification to the entropy by effects of phonon damping. Since the damping scales with the cubic term in the potential,by symmetry there is approximate cancellation of contributions in phase space
of the position coordinates of opposite signs. Classical damping causes only smallshifts of oscillator energies. Damping does cause a change in phonon linewidth, andthe broadening of a phonon energy about a mean value is a concern for accuratedeterminations of vibrational entropy. If g(ε) is broadened by a damped harmonicoscillator spectral intensity, for example, the vibrational entropy calculated with Eq.14 will be altered. Nevertheless, if the broadening functions for two materials are thesame, e.g., they have the same value of Q in Eq. 139, their difference in vibrationalentropy will be unchanged in the classical limit. Also, for small broadening at least,
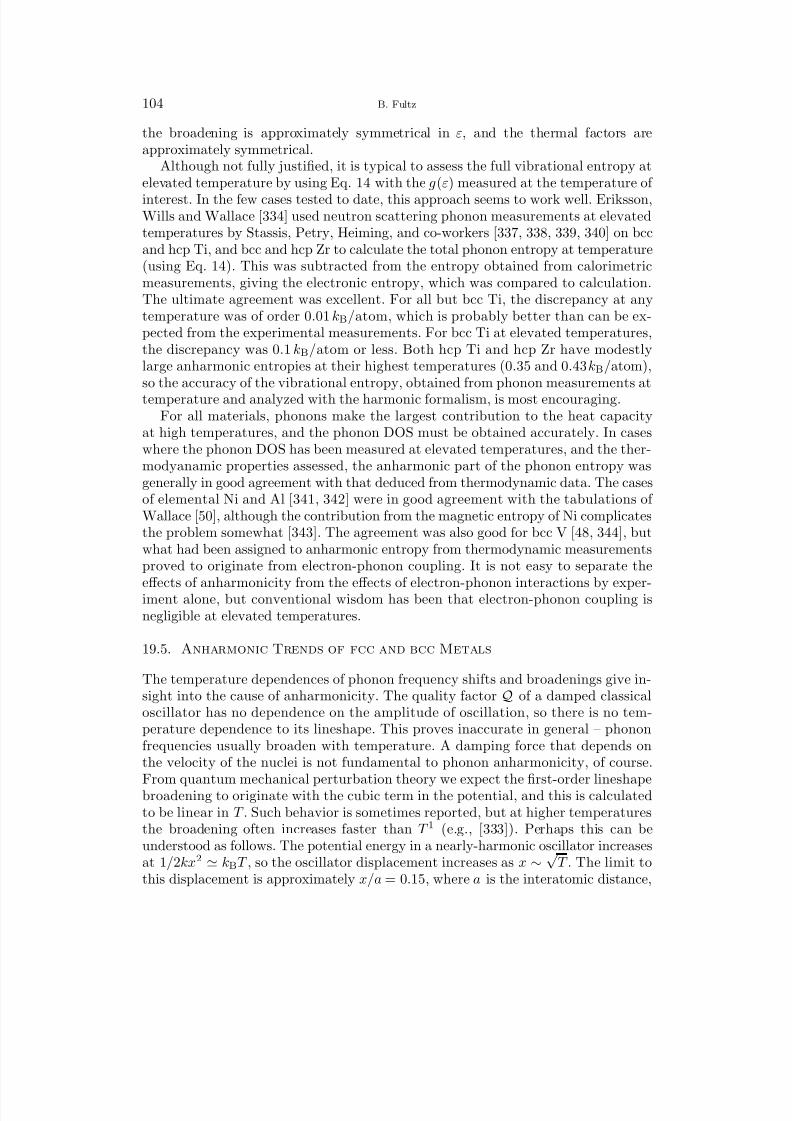
8/13/2019 Vibrational Thermodynamics
http://slidepdf.com/reader/full/vibrational-thermodynamics 108/145
104 B. Fultz
the broadening is approximately symmetrical in ε, and the thermal factors areapproximately symmetrical.
Although not fully justified, it is typical to assess the full vibrational entropy atelevated temperature by using Eq. 14 with the g(ε) measured at the temperature of
interest. In the few cases tested to date, this approach seems to work well. Eriksson,Wills and Wallace [334] used neutron scattering phonon measurements at elevatedtemperatures by Stassis, Petry, Heiming, and co-workers [337, 338, 339, 340] on bccand hcp Ti, and bcc and hcp Zr to calculate the total phonon entropy at temperature(using Eq. 14). This was subtracted from the entropy obtained from calorimetricmeasurements, giving the electronic entropy, which was compared to calculation.The ultimate agreement was excellent. For all but bcc Ti, the discrepancy at anytemperature was of order 0.01 kB/atom, which is probably better than can be ex-pected from the experimental measurements. For bcc Ti at elevated temperatures,the discrepancy was 0.1 kB/atom or less. Both hcp Ti and hcp Zr have modestlylarge anharmonic entropies at their highest temperatures (0.35 and 0.43 kB/atom),so the accuracy of the vibrational entropy, obtained from phonon measurements attemperature and analyzed with the harmonic formalism, is most encouraging.
For all materials, phonons make the largest contribution to the heat capacityat high temperatures, and the phonon DOS must be obtained accurately. In caseswhere the phonon DOS has been measured at elevated temperatures, and the ther-modyanamic properties assessed, the anharmonic part of the phonon entropy wasgenerally in good agreement with that deduced from thermodynamic data. The casesof elemental Ni and Al [341, 342] were in good agreement with the tabulations of Wallace [50], although the contribution from the magnetic entropy of Ni complicatesthe problem somewhat [343]. The agreement was also good for bcc V [48, 344], butwhat had been assigned to anharmonic entropy from thermodynamic measurementsproved to originate from electron-phonon coupling. It is not easy to separate the
effects of anharmonicity from the effects of electron-phonon interactions by exper-iment alone, but conventional wisdom has been that electron-phonon coupling isnegligible at elevated temperatures.
19.5. Anharmonic Trends of fcc and bcc Metals
The temperature dependences of phonon frequency shifts and broadenings give in-sight into the cause of anharmonicity. The quality factor Q of a damped classicaloscillator has no dependence on the amplitude of oscillation, so there is no tem-perature dependence to its lineshape. This proves inaccurate in general – phononfrequencies usually broaden with temperature. A damping force that depends onthe velocity of the nuclei is not fundamental to phonon anharmonicity, of course.
From quantum mechanical perturbation theory we expect the first-order lineshapebroadening to originate with the cubic term in the potential, and this is calculatedto be linear in T . Such behavior is sometimes reported, but at higher temperaturesthe broadening often increases faster than T 1 (e.g., [333]). Perhaps this can beunderstood as follows. The potential energy in a nearly-harmonic oscillator increasesat 1/2kx2 ≃ kBT , so the oscillator displacement increases as x ∼ √
T . The limit tothis displacement is approximately x/a = 0.15, where a is the interatomic distance,
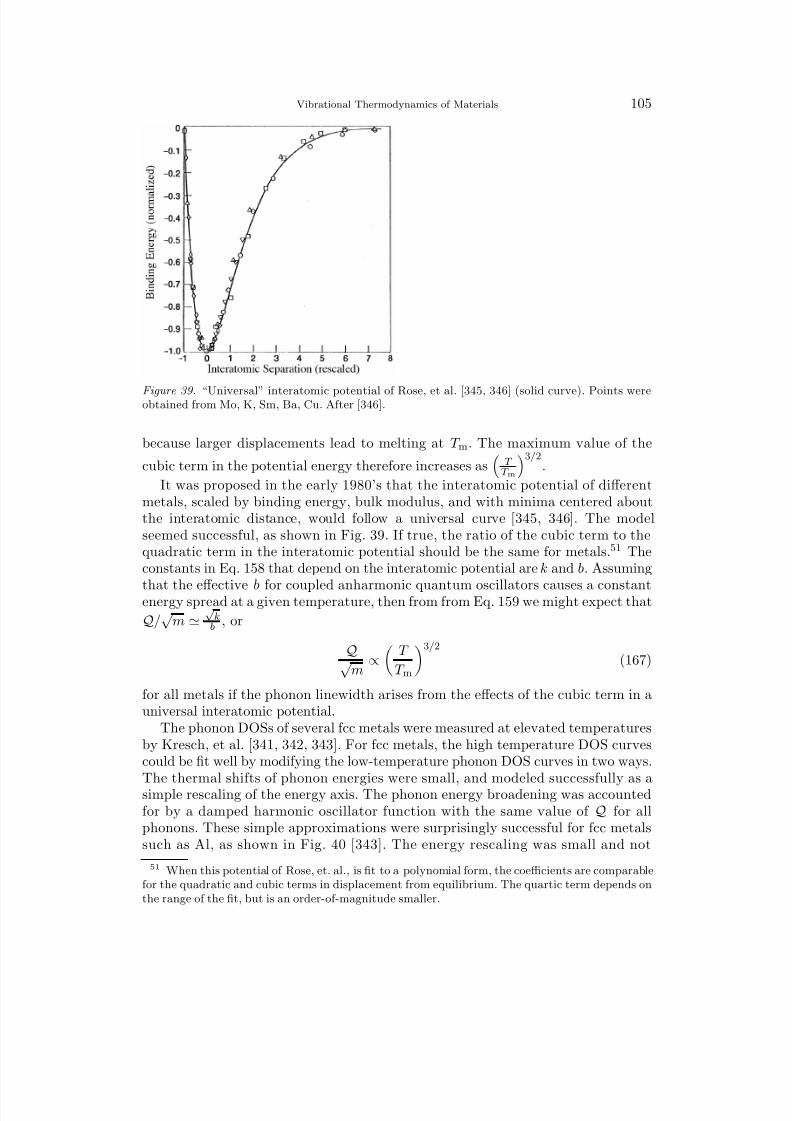
8/13/2019 Vibrational Thermodynamics
http://slidepdf.com/reader/full/vibrational-thermodynamics 109/145
Vibrational Thermodynamics of Materials 105
Figure 39. “Universal” interatomic potential of Rose, et al. [345, 346] (solid curve). Points wereobtained from Mo, K, Sm, Ba, Cu. After [346].
because larger displacements lead to melting at T m. The maximum value of the
cubic term in the potential energy therefore increases as
T T m
3/2.
It was proposed in the early 1980’s that the interatomic potential of differentmetals, scaled by binding energy, bulk modulus, and with minima centered aboutthe interatomic distance, would follow a universal curve [345, 346]. The modelseemed successful, as shown in Fig. 39. If true, the ratio of the cubic term to thequadratic term in the interatomic potential should be the same for metals. 51 Theconstants in Eq. 158 that depend on the interatomic potential are k and b. Assuming
that the effective b for coupled anharmonic quantum oscillators causes a constantenergy spread at a given temperature, then from from Eq. 159 we might expect that
Q/√
m ≃√
kb , or
Q√ m
∝
T
T m
3/2
(167)
for all metals if the phonon linewidth arises from the effects of the cubic term in auniversal interatomic potential.
The phonon DOSs of several fcc metals were measured at elevated temperaturesby Kresch, et al. [341, 342, 343]. For fcc metals, the high temperature DOS curvescould be fit well by modifying the low-temperature phonon DOS curves in two ways.
The thermal shifts of phonon energies were small, and modeled successfully as asimple rescaling of the energy axis. The phonon energy broadening was accountedfor by a damped harmonic oscillator function with the same value of Q for allphonons. These simple approximations were surprisingly successful for fcc metalssuch as Al, as shown in Fig. 40 [343]. The energy rescaling was small and not
51 When this potential of Rose, et. al., is fit to a polynomial form, the coefficients are comparablefor the quadratic and cubic terms in displacement from equilibrium. The quartic term depends onthe range of the fit, but is an order-of-magnitude smaller.
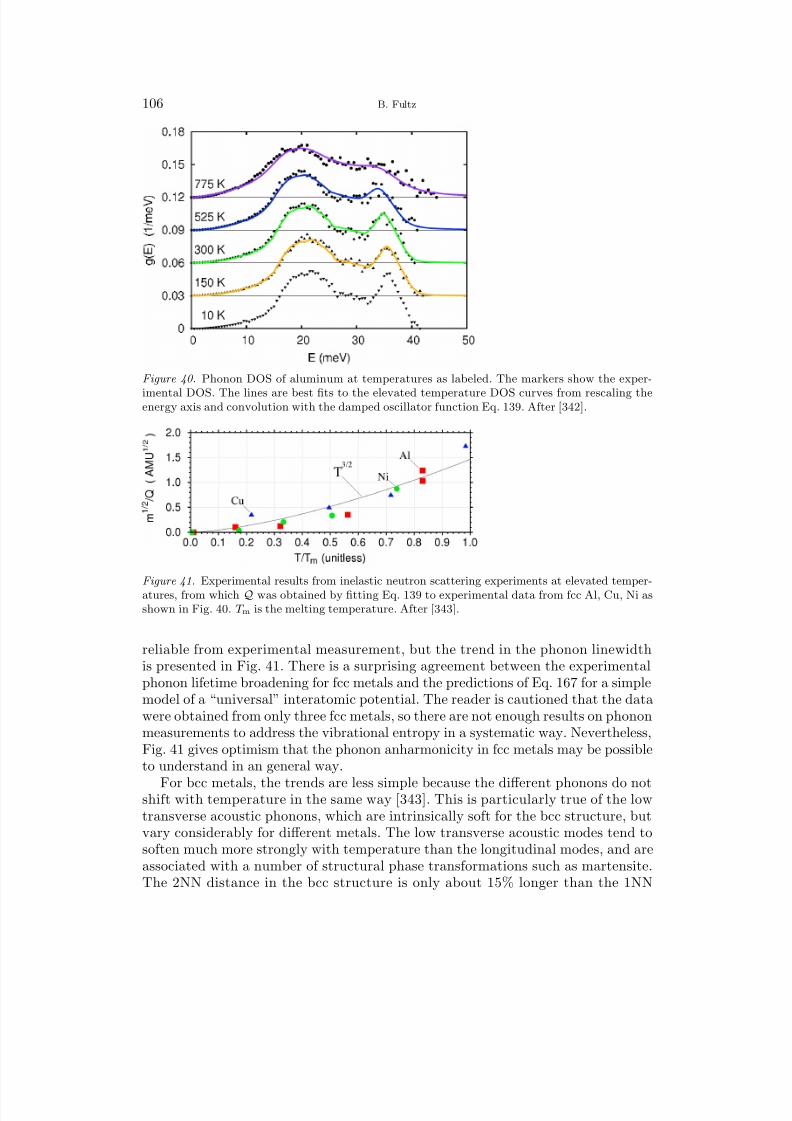
8/13/2019 Vibrational Thermodynamics
http://slidepdf.com/reader/full/vibrational-thermodynamics 110/145
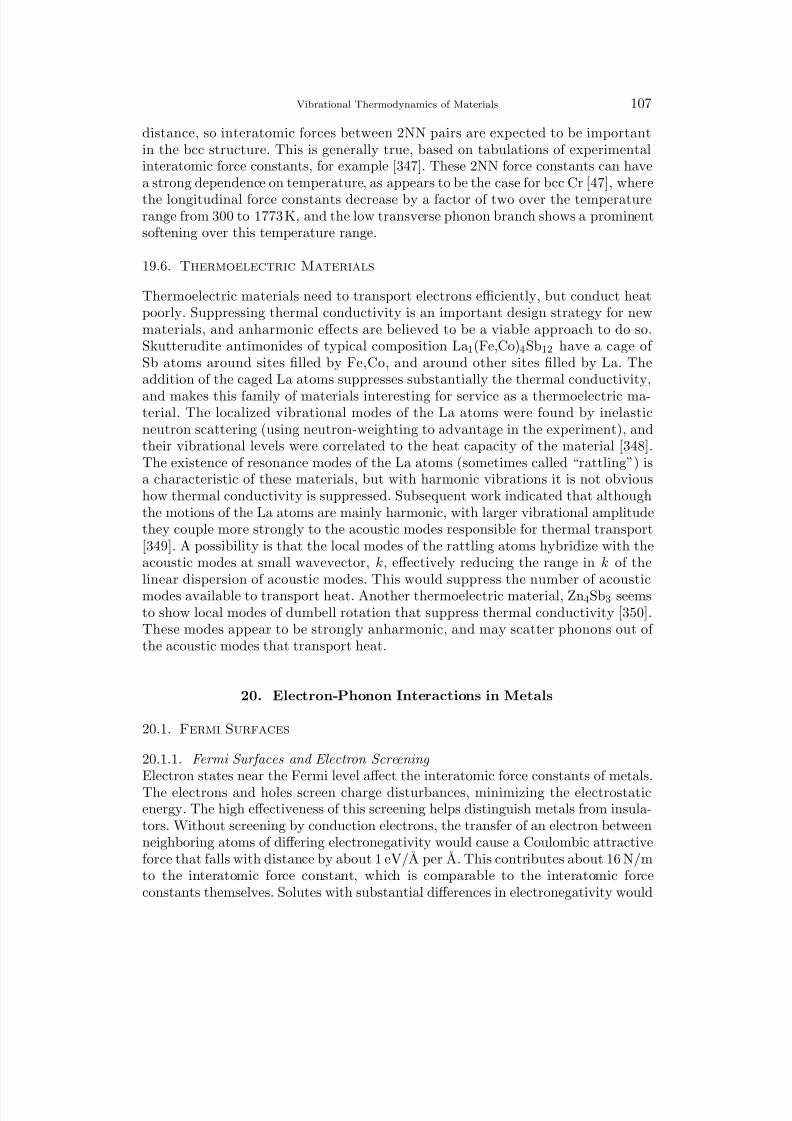
8/13/2019 Vibrational Thermodynamics
http://slidepdf.com/reader/full/vibrational-thermodynamics 111/145
Vibrational Thermodynamics of Materials 107
distance, so interatomic forces between 2NN pairs are expected to be importantin the bcc structure. This is generally true, based on tabulations of experimentalinteratomic force constants, for example [347]. These 2NN force constants can havea strong dependence on temperature, as appears to be the case for bcc Cr [47], where
the longitudinal force constants decrease by a factor of two over the temperaturerange from 300 to 1773 K, and the low transverse phonon branch shows a prominentsoftening over this temperature range.
19.6. Thermoelectric Materials
Thermoelectric materials need to transport electrons efficiently, but conduct heatpoorly. Suppressing thermal conductivity is an important design strategy for newmaterials, and anharmonic effects are believed to be a viable approach to do so.Skutterudite antimonides of typical composition La1(Fe,Co)4Sb12 have a cage of Sb atoms around sites filled by Fe,Co, and around other sites filled by La. Theaddition of the caged La atoms suppresses substantially the thermal conductivity,
and makes this family of materials interesting for service as a thermoelectric ma-terial. The localized vibrational modes of the La atoms were found by inelasticneutron scattering (using neutron-weighting to advantage in the experiment), andtheir vibrational levels were correlated to the heat capacity of the material [348].The existence of resonance modes of the La atoms (sometimes called “rattling”) isa characteristic of these materials, but with harmonic vibrations it is not obvioushow thermal conductivity is suppressed. Subsequent work indicated that althoughthe motions of the La atoms are mainly harmonic, with larger vibrational amplitudethey couple more strongly to the acoustic modes responsible for thermal transport[349]. A possibility is that the local modes of the rattling atoms hybridize with theacoustic modes at small wavevector, k, effectively reducing the range in k of thelinear dispersion of acoustic modes. This would suppress the number of acousticmodes available to transport heat. Another thermoelectric material, Zn 4Sb3 seemsto show local modes of dumbell rotation that suppress thermal conductivity [350].These modes appear to be strongly anharmonic, and may scatter phonons out of the acoustic modes that transport heat.
20. Electron-Phonon Interactions in Metals
20.1. Fermi Surfaces
20.1.1. Fermi Surfaces and Electron Screening
Electron states near the Fermi level affect the interatomic force constants of metals.The electrons and holes screen charge disturbances, minimizing the electrostaticenergy. The high effectiveness of this screening helps distinguish metals from insula-tors. Without screening by conduction electrons, the transfer of an electron betweenneighboring atoms of differing electronegativity would cause a Coulombic attractiveforce that falls with distance by about 1 eV/A per A. This contributes about 16 N/mto the interatomic force constant, which is comparable to the interatomic forceconstants themselves. Solutes with substantial differences in electronegativity would
8/13/2019 Vibrational Thermodynamics
http://slidepdf.com/reader/full/vibrational-thermodynamics 112/145
108 B. Fultz
then cause enormous distortions of interatomic distances and enormous changes inthe phonon frequencies. The actual effects of alloying on lattice parameters andphonon DOS curves in metals are much smaller because screening is so effective.Since the atom displacements in a phonon distort the charge density, any changes
in screening caused by alloying cause changes in the energy of a phonon. Likewise,it is important to look for changes in screening when considering how the phononsare affected by pressure or temperature. This Section 20 addresses how composition,temperature, and pressure alter the screening.
Electron screening depends on the size and shape of the Fermi surface in k-space.For example, the free electron model gives a spherical shape and an electron DOSthat tends to be small at the Fermi level. Fermi surfaces are much more complexfor transition metals, lanthanides, actinides, and their alloys [351]. Given the sametopology of the Fermi surface, however, increasing the electron DOS at the Fermilevel will increase screening, softening the phonons. Sometimes the simple parameterof the electron DOS at the Fermi level can be useful for understanding commonfeatures of how the phonon DOS is altered by effects of composition. The electronDOS at the Fermi level can also be used to understand the effects of temperatureand pressure, although the effects of temperature require additional concepts.
20.1.2. Fermi Surfaces and the Electron-Phonon Interaction
To isolate the electron-phonon interaction, we reference the electronic energy tothat of an undistorted, periodic structure without phonons and without thermalexcitations of electrons. As discussed in Section 18.3, the “adiabatic” electron-phonon interaction requires simultaneous thermal excitations of both electrons andphonons. For a free electron gas with a spherical Fermi surface, we expect a strongcontribution from H Dep of Eq. 154 when ki = 2kF. Momentum conservation requiresthe three operators in Eq. 154 to give an annihilation of a phonon with wavevector
of 2kFz, for example, an electron moved into a state with wavevector −kFz, andan electron removed from a state with wavevector kFz. Both the electron states areat the Fermi level, so at finite temperature there is a good chance that the initialstates are occupied and unoccupied as required. For a free electron gas, if ki differssignificantly from 2kF, one or more of the electron states is very far from the Fermisurface, and excitation is improbable, even at elevated temperature.
The Fermi–Dirac distribution blurs the Fermi surface. The thermal smearingfunction that accounts for thermal excitations across the Fermi surface is approxi-mately a Gaussian of standard deviation 2kBT . The available thermal energy alsoscales with T , so the energy of thermal electronic excitations scales as T 2. Thetemperature-derivative of this energy is of course the electronic heat capacity, whichis linear in T . These changes in electronic occupancies can alter the screening char-
acteristics of the conduction electrons in some cases, but the effect can be smallin others. For the spherical Fermi surface of a free electron gas, with increasedtemperature there is only a small change in the numbers of electrons and holesthat participate in screening. It is often found that the elastic constants of metalshave little explicit temperature dependence at a fixed volume. For many metals,most of the temperature-dependence of the elastic constants originates from theanharmonicity of phonon-phonon interactions, as described in Section 18.2, so effects
8/13/2019 Vibrational Thermodynamics
http://slidepdf.com/reader/full/vibrational-thermodynamics 113/145
Vibrational Thermodynamics of Materials 109
of “adiabatic electron-phonon interactions,” as described in Section 20.3.1, are oftenneglected at high temperatures.
Suppose the electron-phonon interaction is strong. At higher temperatures whenmore phonons are present, there is a proportionate increase in electron scattering
and a shortening of the electron lifetime, τ . A consequence is the lifetime broad-ening of the electron DOS by the characteristic energy ∆E = /τ . This lifetimebroadening proves to be tricky to calculate because the increased scattering reducesthe strength of the electron-phonon interaction that causes scattering. Nevertheless,in an approximate treatment [352] the resulting electronic broadening function is aLorentzian function of full-width-at-half-maximum 2πλkBT . When λ (the electron-phonon coupling parameter of Eq. 157) is approximately 1, this lifetime broadeningexceeds the energy broadening caused by the Fermi-Dirac distribution. Furthermore,a Lorentzian function has slowly-decaying tails that sample a wide energy spread of the electron DOS.
20.1.3. Kohn Anomalies and Electronic Topological Transitions
For more complex Fermi surfaces, the situation is especially interesting when twosheets are parallel, or displaced by a common vector. This structure, sometimescalled “nesting” of the sheets of the Fermi surface, allows many electron and holestates near the Fermi surface to be separated by the same wavevector. For a phononof this wavevector, the screening of the charge disturbance is especially effective,reducing the energy cost of the phonon. This causes a reduction of the phononenergies in a narrow range of wavevector, called a “Kohn anomaly.” Many Kohnanomalies have been reported (e.g., [353]).
An “electronic topological transition” can occur when alloying fills (or depletes)the bands with electrons, and a feature of the Fermi surface is created or eliminated[354]. A feature of the Fermi surface for early transition metals is a hole pocket at the
center of the Brillouin zone (the “Γ-point,” located at k = 0). Filling it causes a lossof states at the Fermi level and a loss of electrons that can participate in screening.52
There are a number of discussions about how electronic topological transitions alterphysical properties of metals and alloys such as elastic constants [355, 356, 357, 358,359, 360]. Electronic topological transitions alter phonons by changing the adiabaticEPI. There have been relatively few systematic experimental studies of these effects,and most previous work was focused on selected phonon branches [361, 362, 363,364]. An early study of phonon dispersions in single crystals of bcc Nb-Mo alloysshowed large changes in phonons at a composition of approximately 66 at.% Mothat were interpreted with a rigid band model as an electronic topological transitioncaused by filling the hole pocket at the Γ-point [361]. At higher Nb concentrationsthe picture is more complicated, since an electron “jack” appears in the Fermi surface
of Mo around the Γ-point. Adding Nb to pure Mo causes some phonons to stiffenand some to soften [361]. More recently an electronic topological transition at 30at.% Mo was calculated from first principles methods, but in the virtual crystalapproximation, and was argued to account for some of the phonon anomalies near
52 The electron DOS of vanadium, discussed below in the context of Fig. 43a, shows a drop of afactor of two at 0.35 eV above the Fermi level caused by filling the hole pocket around the Γ point.
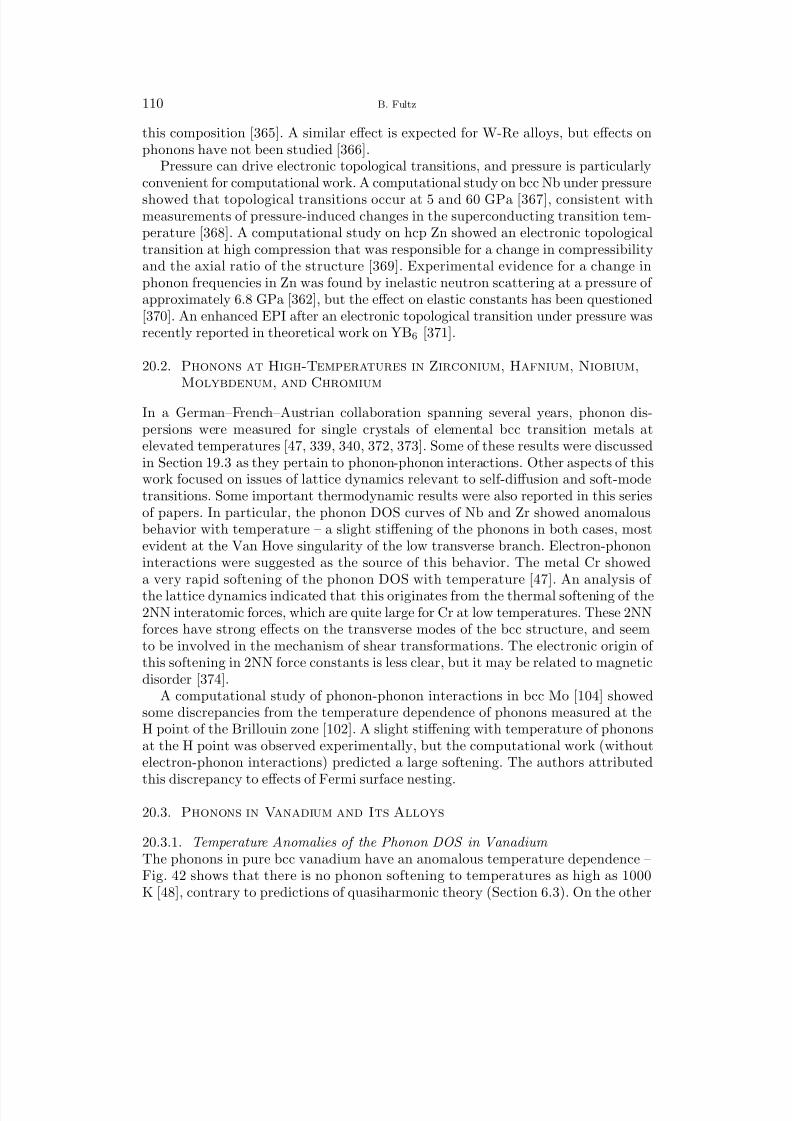
8/13/2019 Vibrational Thermodynamics
http://slidepdf.com/reader/full/vibrational-thermodynamics 114/145
110 B. Fultz
this composition [365]. A similar effect is expected for W-Re alloys, but effects onphonons have not been studied [366].
Pressure can drive electronic topological transitions, and pressure is particularlyconvenient for computational work. A computational study on bcc Nb under pressure
showed that topological transitions occur at 5 and 60 GPa [367], consistent withmeasurements of pressure-induced changes in the superconducting transition tem-perature [368]. A computational study on hcp Zn showed an electronic topologicaltransition at high compression that was responsible for a change in compressibilityand the axial ratio of the structure [369]. Experimental evidence for a change inphonon frequencies in Zn was found by inelastic neutron scattering at a pressure of approximately 6.8 GPa [362], but the effect on elastic constants has been questioned[370]. An enhanced EPI after an electronic topological transition under pressure wasrecently reported in theoretical work on YB6 [371].
20.2. Phonons at High-Temperatures in Zirconium, Hafnium, Niobium,
Molybdenum, and Chromium
In a German–French–Austrian collaboration spanning several years, phonon dis-persions were measured for single crystals of elemental bcc transition metals atelevated temperatures [47, 339, 340, 372, 373]. Some of these results were discussedin Section 19.3 as they pertain to phonon-phonon interactions. Other aspects of thiswork focused on issues of lattice dynamics relevant to self-diffusion and soft-modetransitions. Some important thermodynamic results were also reported in this seriesof papers. In particular, the phonon DOS curves of Nb and Zr showed anomalousbehavior with temperature – a slight stiffening of the phonons in both cases, mostevident at the Van Hove singularity of the low transverse branch. Electron-phononinteractions were suggested as the source of this behavior. The metal Cr showeda very rapid softening of the phonon DOS with temperature [47]. An analysis of the lattice dynamics indicated that this originates from the thermal softening of the2NN interatomic forces, which are quite large for Cr at low temperatures. These 2NNforces have strong effects on the transverse modes of the bcc structure, and seemto be involved in the mechanism of shear transformations. The electronic origin of this softening in 2NN force constants is less clear, but it may be related to magneticdisorder [374].
A computational study of phonon-phonon interactions in bcc Mo [104] showedsome discrepancies from the temperature dependence of phonons measured at theH point of the Brillouin zone [102]. A slight stiffening with temperature of phononsat the H point was observed experimentally, but the computational work (withoutelectron-phonon interactions) predicted a large softening. The authors attributed
this discrepancy to effects of Fermi surface nesting.
20.3. Phonons in Vanadium and Its Alloys
20.3.1. Temperature Anomalies of the Phonon DOS in Vanadium
The phonons in pure bcc vanadium have an anomalous temperature dependence –Fig. 42 shows that there is no phonon softening to temperatures as high as 1000K [48], contrary to predictions of quasiharmonic theory (Section 6.3). On the other
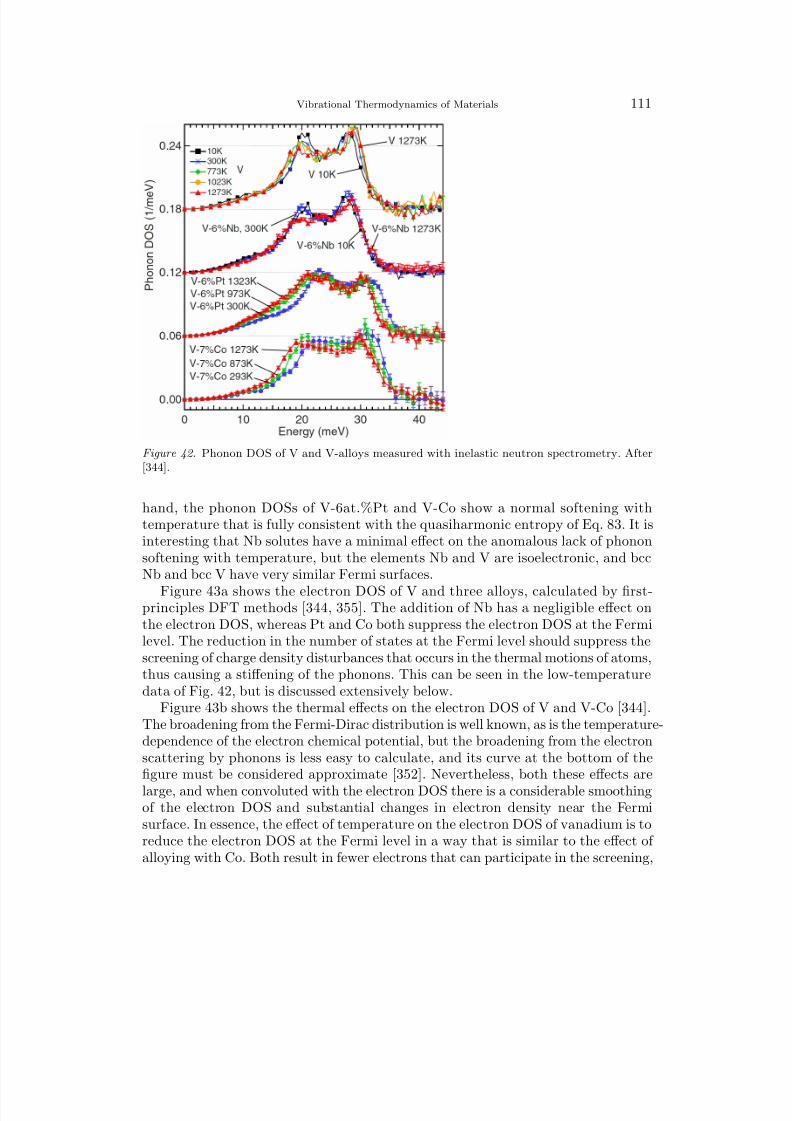
8/13/2019 Vibrational Thermodynamics
http://slidepdf.com/reader/full/vibrational-thermodynamics 115/145
Vibrational Thermodynamics of Materials 111
Figure 42. Phonon DOS of V and V-alloys measured with inelastic neutron spectrometry. After[344].
hand, the phonon DOSs of V-6at.%Pt and V-Co show a normal softening withtemperature that is fully consistent with the quasiharmonic entropy of Eq. 83. It isinteresting that Nb solutes have a minimal effect on the anomalous lack of phononsoftening with temperature, but the elements Nb and V are isoelectronic, and bccNb and bcc V have very similar Fermi surfaces.
Figure 43a shows the electron DOS of V and three alloys, calculated by first-principles DFT methods [344, 355]. The addition of Nb has a negligible effect onthe electron DOS, whereas Pt and Co both suppress the electron DOS at the Fermilevel. The reduction in the number of states at the Fermi level should suppress thescreening of charge density disturbances that occurs in the thermal motions of atoms,thus causing a stiffening of the phonons. This can be seen in the low-temperaturedata of Fig. 42, but is discussed extensively below.
Figure 43b shows the thermal effects on the electron DOS of V and V-Co [344].The broadening from the Fermi-Dirac distribution is well known, as is the temperature-dependence of the electron chemical potential, but the broadening from the electronscattering by phonons is less easy to calculate, and its curve at the bottom of thefigure must be considered approximate [352]. Nevertheless, both these effects are
large, and when convoluted with the electron DOS there is a considerable smoothingof the electron DOS and substantial changes in electron density near the Fermisurface. In essence, the effect of temperature on the electron DOS of vanadium is toreduce the electron DOS at the Fermi level in a way that is similar to the effect of alloying with Co. Both result in fewer electrons that can participate in the screening,
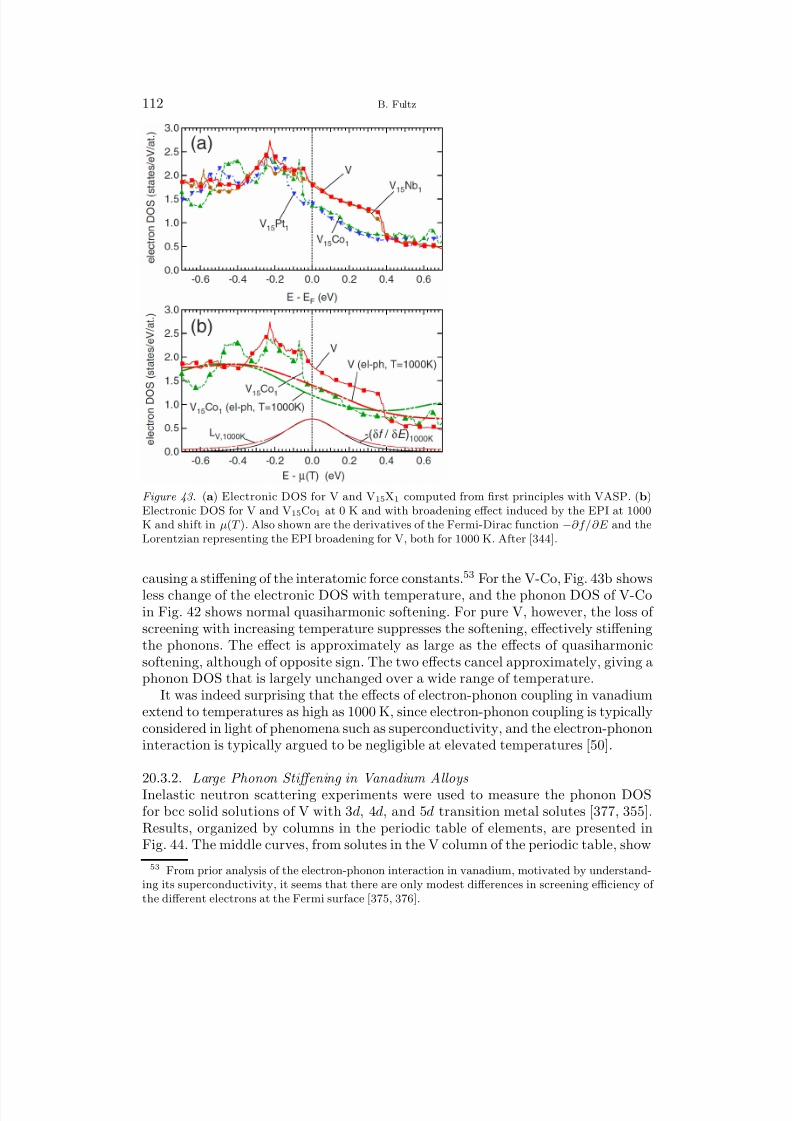
8/13/2019 Vibrational Thermodynamics
http://slidepdf.com/reader/full/vibrational-thermodynamics 116/145

8/13/2019 Vibrational Thermodynamics
http://slidepdf.com/reader/full/vibrational-thermodynamics 117/145
Vibrational Thermodynamics of Materials 113
Figure 44. Neutron-weighted phonon DOS for solutes down the Ni, V, and Ti columns. After [377].
little change with alloying. The lower curves, from solutes one position to the left of V on the periodic table, show a slight softening of phonons with alloying. The topcurves, from the elements in the Ni column of the periodic table, show a substantialstiffening. A vibrational entropy of mixing, ∆S mix
vib , can be defined for a V-X alloyas the difference in vibrational entropy of the alloy and the vibrational entropy of the pure elements V and X, weighted by their atomic fractions. For dissolving 6.25at.% Pt in V, ∆S mix
vib is −0.272 kB/atom from Eq. 14. It exceeds the configurationalentropy of mixing S mix(0.0625) = +0.234 kB/atom of Eq. 11. For a V-6.25% Ptalloy, the total entropy of mixing is therefore negative. Assuming the effects of soluteatoms on the phonon spectrum are linear in the solute concentration, as expectedat low concentrations, the entropy of mixing will be negative for all concentrationsexceeding about 3.4% Pt. The configurational entropy of mixing will dominate atlower concentrations, owing to the logarithmic singularity of the first term in Eq. 11.Nevertheless, the composition where the total entropy of mixing is zero decreasesapproximately exponentially with the vibrational entropy contribution of the soluteatom. A hypothetical solute causing twice the vibrational effect of Pt would have anegative entropy of mixing for compositions as low as 0.04 at.%.
To perform the neutron weight corrections needed for thermodynamic accuracyof these results, a Born – von Karman model of lattice dynamics was developed for a16-atom cubic supercell containing 8 BCC unit cells of V atoms, except the centralatom was a solute atom. The supercell dynamics allowed calculation of both the truephonon DOS and the experimental neutron-weighted phonon DOS (Sect. 8.3) by
iterating interatomic force constants Φαα′
lκl′
κ′
to find a best fit to the experimentalphonon DOS. For the alloy V-6.25at.%Pt, where the phonons stiffened considerablywith respect to vanadium, a large Pt-V 1NN longitudinal force constant was foundresponsible for the change in phonon DOS of Fig. 44. The changes in the total DOS
8/13/2019 Vibrational Thermodynamics
http://slidepdf.com/reader/full/vibrational-thermodynamics 118/145
114 B. Fultz
Figure 45. Partial DOS curves for the solute atom and its V neighbors up to 3NN shell, obtainedfrom the optimized supercell lattice dynamics. After [378].
were dominated by the partial DOS of V atoms having solutes in their 1NN shell(Fig. 45).54
Figure 46 shows a good correlation between the vibrational entropy of alloyingand the electronegativity of transition metal solutes across the 3d row, and with 4dand 5d solutes down several columns of the periodic table. First-principles calcula-tions on supercells matching the experimental compositions predicted a systematiccharge redistribution in the nearest neighbor shell around the solute atoms. Thecharge transfers between atoms were evaluated with the Bader algorithm (whichtends to overestimate the charge transfer in metals, although it follows the Paulingelectronegativity scale). Although this correlation points to the importance of elec-
tronic rearrangements on phonon frequencies (as opposed to atomic size or mass,for example), more fundamentally it is the screening of ion motions by the electrondensity that governs the restoring forces on the ions and hence the phonon frequen-cies (Sect. 20.1.1 and [379]). The d states of the late transition metal solutes Ni,Pd, and Pt are lower in energy than the rest of the alloy valence bands, leading toa split band for Pd and Pt solutes and considerable distortions of the band shape.Correspondingly, there is a systematic depletion of the number of states at the Fermilevel for solutes toward the end of the transition metal series (about 20% for 6-7%solutes from the Ni column). This will reduce the number of weakly localized statesavailable for screening the displacements of vanadium ions, causing higher energiesfor these displacements and higher phonon frequencies. The efficacy of screeningdepends on the available electronic excitations. The change with temperature of the
screening can be attributed to an adiabatic electron-phonon interaction (EPI) asdiscussed next, even though the temperatures are quite high.55
54 Note also the resonance modes (Sect. 3.1) in the partial DOS curves of Pd and Pt around12 meV.55 It has been argued that the EPI is negligible above about a quarter of the Debye temperature
of vanadium [17].
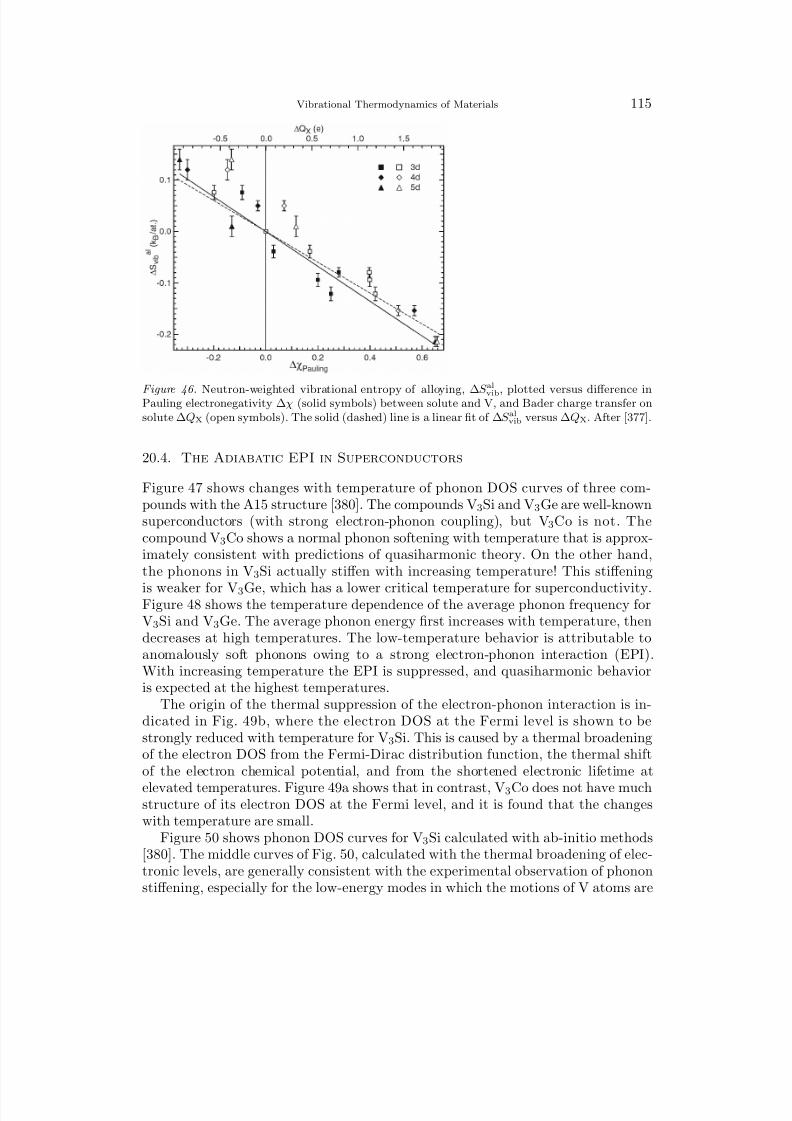
8/13/2019 Vibrational Thermodynamics
http://slidepdf.com/reader/full/vibrational-thermodynamics 119/145
Vibrational Thermodynamics of Materials 115
Figure 46. Neutron-weighted vibrational entropy of alloying, ∆S al
vib, plotted versus difference inPauling electronegativity ∆χ (solid symbols) between solute and V, and Bader charge transfer onsolute ∆QX (open symbols). The solid (dashed) line is a linear fit of ∆S alvib versus ∆QX. After [377].
20.4. The Adiabatic EPI in Superconductors
Figure 47 shows changes with temperature of phonon DOS curves of three com-pounds with the A15 structure [380]. The compounds V3Si and V3Ge are well-knownsuperconductors (with strong electron-phonon coupling), but V3Co is not. Thecompound V3Co shows a normal phonon softening with temperature that is approx-imately consistent with predictions of quasiharmonic theory. On the other hand,the phonons in V3Si actually stiffen with increasing temperature! This stiffening
is weaker for V3Ge, which has a lower critical temperature for superconductivity.Figure 48 shows the temperature dependence of the average phonon frequency forV3Si and V3Ge. The average phonon energy first increases with temperature, thendecreases at high temperatures. The low-temperature behavior is attributable toanomalously soft phonons owing to a strong electron-phonon interaction (EPI).With increasing temperature the EPI is suppressed, and quasiharmonic behavioris expected at the highest temperatures.
The origin of the thermal suppression of the electron-phonon interaction is in-dicated in Fig. 49b, where the electron DOS at the Fermi level is shown to bestrongly reduced with temperature for V3Si. This is caused by a thermal broadeningof the electron DOS from the Fermi-Dirac distribution function, the thermal shiftof the electron chemical potential, and from the shortened electronic lifetime at
elevated temperatures. Figure 49a shows that in contrast, V3Co does not have muchstructure of its electron DOS at the Fermi level, and it is found that the changeswith temperature are small.
Figure 50 shows phonon DOS curves for V3Si calculated with ab-initio methods[380]. The middle curves of Fig. 50, calculated with the thermal broadening of elec-tronic levels, are generally consistent with the experimental observation of phononstiffening, especially for the low-energy modes in which the motions of V atoms are
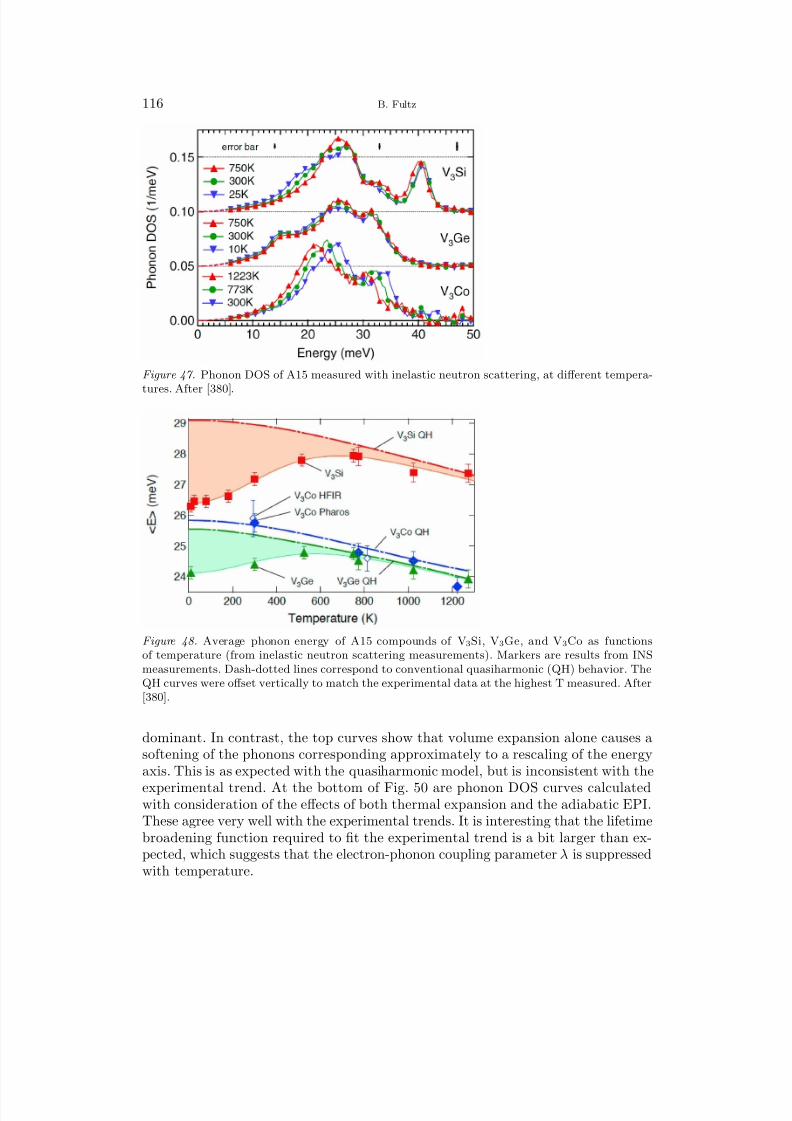
8/13/2019 Vibrational Thermodynamics
http://slidepdf.com/reader/full/vibrational-thermodynamics 120/145
116 B. Fultz
Figure 47. Phonon DOS of A15 measured with inelastic neutron scattering, at different tempera-
tures. After [380].
Figure 48. Average phonon energy of A15 compounds of V3Si, V3Ge, and V3Co as functionsof temperature (from inelastic neutron scattering measurements). Markers are results from INSmeasurements. Dash-dotted lines correspond to conventional quasiharmonic (QH) behavior. TheQH curves were offset vertically to match the experimental data at the highest T measured. After[380].
dominant. In contrast, the top curves show that volume expansion alone causes asoftening of the phonons corresponding approximately to a rescaling of the energyaxis. This is as expected with the quasiharmonic model, but is inconsistent with the
experimental trend. At the bottom of Fig. 50 are phonon DOS curves calculatedwith consideration of the effects of both thermal expansion and the adiabatic EPI.These agree very well with the experimental trends. It is interesting that the lifetimebroadening function required to fit the experimental trend is a bit larger than ex-pected, which suggests that the electron-phonon coupling parameter λ is suppressedwith temperature.

8/13/2019 Vibrational Thermodynamics
http://slidepdf.com/reader/full/vibrational-thermodynamics 121/145
Vibrational Thermodynamics of Materials 117
Figure 49. (a) Electronic DOS for A15 V3Si, V3Ge, and V3Co from first-principles VASP cal-culations. (b) Electronic DOS for V3Si broadened by EPI at 25 K, 300 K, and 1000 K, usingelectron-phonon coupling parameter λ = 1.0 at all T. Energies are with respect to the electronchemical potential µ(T ). Inset: broadening function at 300 K and 1000 K.
Figure 50. Top: Phonon DOS for V3Si calculated from first principles for two different volumes(V high = 1.03 × V low). Middle: Calculated DOS for different electronic broadenings σ . Bottom: Thesame as above for two different (V and σ) combinations (σlow = 50 meV and σhigh = 200 meV).The calculated DOS was obtained from the neutron-weighted contributions of V and Si species andconvolved with the experimental instrument resolution. The markers are experimental results forV3Si at 25 and 1023 K.
Perhaps the most surprising result is that the EPI is thermodynamically impor-tant to 1000 K in A15 V3Si and V3Ge, defying much conventional wisdom and manycalculations of the effect of the EPI on the free energy of metals [50, 352]. Such apossibility was suggested by a few early theoretical papers that addressed EPI effectson the heat capacity [381]. More recent calculations on free-electron metals withoutstructure in the electron DOS near their Fermi levels found effects of the adiabaticEPI at high temperatures, but these effects were small [382, 383, 384] (discussed

8/13/2019 Vibrational Thermodynamics
http://slidepdf.com/reader/full/vibrational-thermodynamics 122/145
118 B. Fultz
in Section 20.5). Other studies of early transition metals [385] and superconductors[386] suggested the importance of electron-phonon interactions on phonon dynamics.
Phonons in the C32 phase of MgB2 have been studied thoroughly at low temper-atures, since the (nonadiabatic) EPI is the origin of its conventional superconductiv-
ity. It is possible to fully substitute Al for Mg [387], obtaining the same C32 structureacross the (Mg,Al)11B2 “quasibinary” system, and C32 AlB2 is not superconducting.Phonons have been studied with different Al and Mg concentrations [388], and thesuperconducting Mg-rich alloys show considerable softening of the high-frequencyoptical modes, consistent with a strong EPI and larger vibrational entropy. Earlywork indicated that superconductivity in MgB2 [389] originated with a strong EPIcaused by anharmonic E 2g phonons. Later this interpretation has been called intoquestion, and it has been argued that MgB2 is not particularly anharmonic [390].Furthermore, the adiabatic approximation itself has been questioned because theelectrons may not respond instantly to nuclear displacements [390]. A limitation of the previous work on phonon anharmonicity in MgB2 is that the measurements wereat temperatures of 300 K and below, such as the extensive Raman spectrometry workthat has been performed on MgB2 and related materials [388, 391, 392, 393, 394].
20.5. Effects of Pressure, Composition, and Temperature on the
Adiabatic EPI and the Phonon DOS
For understanding how changes in the adiabatic EPI cause changes in phonons, weneed some level of information about changes in the electronic structure near theFermi level. If similar changes are caused by either temperature, composition, orpressure, we expect similar changes in electron screening, and similar effects on thephonons. For a simple example, increasing the band filling by alloying should havethe same effect on the elastic moduli as a band filling caused by a reduction involume with pressure.56 For simple free-electron metals the effect of temperature isdifferent, however, being a smearing the electron DOS.
Bock, Coffey, and Wallace considered the adiabatic and non-adiabatic electron-phonon interactions with results from a pseudopotential perturbation theory [382,383, 384]. In essence, free electron theory was extended with perturbations frompseudopotentials, and perturbations from nuclear displacements, giving effects fromthe EPI that were second order in the pseudopotential. The non-adiabatic EPI wasfound to be small, in the range of 10−5 to 10−4 eV (but increasingly larger for K,Na, Pb, and Al), and weakly decreasing with temperature. The adiabatic EPI wascalculated with phonon dispersions from experimental lattice dynamics, and withsimple free electron dispersions for the electronic structure. For a reference stateof a perfectly periodic crystal with no electronic excitations, the dominant effect of
temperature was from the Fermi-Dirac distribution, f (T ), which gave a factor of T 2, and from the phonon occupancy factor n(ε, T ), which gave a factor of T 1 atmodest temperatures. The numerical results for the adiabatic EPI were negligibleat low temperatures, but increased as T 3 and exceeded the non-adiabatic EPI atthe melting temperatures. Except for Al, however, the non-adiabatic EPI was a
56 For a free electron gas with a spherical and featureless Fermi surface, we need only the electronDOS at the Fermi level to predict, for example, that the bulk modulus scales with the electron DOSat the Fermi level.
8/13/2019 Vibrational Thermodynamics
http://slidepdf.com/reader/full/vibrational-thermodynamics 123/145
Vibrational Thermodynamics of Materials 119
small effect. For Al at melting, the adiabatic EPI was 10−3 eV, which correspondsto an entropic effect of order 10−2 kB/atom. It seems that the adiabatic EPI for freeelectron metals is not so important thermodynamically, but it is within an order of magnitude of being so.
Metals with sharp features at the Fermi surface have larger thermal effects fromthe adiabatic EPI. The thermal broadening of the electron DOS can be understood astaking sharp peaks near the Fermi level and leveling them, or alternatively as fillingstates at low points in the DOS. We might expect that the detailed 3D structure of the Fermi surface could be important for understanding how phonon frequencies areaffected by the adiabatic EPI, but the thermal effects of Sects. 20.3.1, 20.3.2, and20.4 showed good correlations to the simpler density of states at the Fermi level. Forexample, for A15 V3Si Fig. 49b shows that the Fermi level is at a peak in the electronDOS, so the thermal smearing and the shift in electron chemical potential reducemarkedly the numbers of electrons and holes available for screening, reducing theEPI. Semiquantitatively, at least, this contributes more to the stiffening of phononsthan in the case of pure bcc V, where Fig. 43 shows a more mild effect of temperature.The electronic DOS curves of the A15 compounds and bcc V are similar, however,with a Fermi level crossing the upper edge of a peak in the DOS.57
Nevertheless, generalizations of the effects of pressure, composition and temper-ature may be risky. In particular, under pressure the electron states remain welldefined and long-lived. With increased pressure a complex Fermi surface is expectedto remain anisotropic, and retain its complex features. With temperature, however,the electrons scatter out of their ground states owing to interactions with phonons,giving a lifetime broadening of the electron energy levels. A similar effect is expectedfrom the effects of composition (if solutes are treated as scattering electrons fromthe states of a pure element). Intricate structures of the Fermi surface at T = 0 willbe lost at high temperatures owing to thermal broadening of the electron energies,
however. The lifetime broadening causes a more interesting effect on the states atthe Fermi level that participate in the EPI:
− The lifetime broadening of the states at the Fermi surface owing to adia-batic electron-phonon interactions is dependent on the strength of the electron-phonon interaction in different directions in k-space.
− Those directions in k-space with the stronger electron-phonon interactions willbroaden more with temperature, suppressing the electron-phonon interaction.
− The suppression of the electron-phonon interaction along directions in k-spacewhere it is strong will tend to equalize the strength of the electron-phononinteraction in all directions.
The thermal smearing of the electron states and the increased isotropy of theelectron-phonon interaction will therefore wash out the detailed structure of theFermi surface. For a Fermi surface with one sheet, its low-temperature structure
57 It is quite possible for the opposite effect to occur. When the Fermi level lies in a valley betweenregions of high electron DOS, it is expected that temperature will increase the number of electronsavailable for screening, and cause a further softening beyond what is expected from quasiharmonicbehavior.
8/13/2019 Vibrational Thermodynamics
http://slidepdf.com/reader/full/vibrational-thermodynamics 124/145
120 B. Fultz
will evolve towards a fuzzy sphere at high temperatures. For a Fermi surface withisolated pockets, the anisotropy may persist to higher temperatures, but the detailedsystematics require further research.
Owing to the complexity and different structures of Fermi surfaces, further studies
are needed to understand how well the effects of temperature on vibrational entropycan be predicted with only the electron DOS near the Fermi level. Furthermore,some conceptual issues such as how best to account for the lifetime broadeningof electron states remain a challenge. Nevertheless, our present understanding of the concepts suggests that studies of phonons at high temperatures may provideuseful information about the EPI, and perhaps about superconductivity, althoughthe latter is more sensitive to the anisotropies of the EPI.
8/13/2019 Vibrational Thermodynamics
http://slidepdf.com/reader/full/vibrational-thermodynamics 125/145
8/13/2019 Vibrational Thermodynamics
http://slidepdf.com/reader/full/vibrational-thermodynamics 126/145
122 B. Fultz
near the Fermi level. Pressure and composition can cause similar effects on theelectron screening.
21.2. Hume–Rothery Rules and Vibrational Entropy
The long previous list of phenomena affecting vibrational entropy may discour-age simple rules of thumb, but simple rules are used for other quantities in alloythermodynamics. Assessing differences in vibrational entropy by rules analogousto Hume–Rothery rules [153, 395, 396] for metallic alloys risks predictions thatare no better than the Hume–Rotherey rules for enthalpy, and likely worse. TheHume–Rothery rules of alloy phase formation are based on atomic properties: 1)electronegativity, 2) metallic radius, and 3) electron-to-atom ratio, with the firsttwo factors being the most important. For phonon entropy, we should add 4) atommass, to this list.
− Electronegativity. This is a measure of the tendency for electron transfer to anatom during chemical bonding, which provides information on the strength of the bond and its stiffness. In metals this is only a part of the picture, becauseconduction electrons are highly effective in screening the charge disturbancesthat occur with electron transfer, but changes in the screening are also expectedto scale with differences in electronegativity. Screening depends on the Fermisurface, but we expect systematic trends with electronegativity if, for example,the band structure is little changed with alloying.
− Metallic Radius. Inserting a larger solute atom will cause a local compressionin the host crystal. Since interatomic forces generally become stiffer undercompression, alloying with large atoms tends to reduce the vibrational entropy.
− Electron-to-Atom Ratio. This accounts for non-local Fermi surface effects inmetals. The e/a ratio is expected to be a useful parameter if the rigid bandmodel is reasonably reliable, and could be used to predict changes in screening,for example.
− Mass. There is a general relationship for an oscillator of ω =
k/M , wherethe frequency, ω, scales as the inverse root of the mass, M , assuming that thespring constant, k, is in fact a constant. Across the periodic table the atomicmass varies from 1 to 238 and beyond, and for a matrix having atoms of massM 0, and solutes having mass M S , with respect to the host the phonon entropyof the alloy scales with ln(M 0/M S ) [206]. No effects of mass are expected whena phase transformation rearranges the same atoms into a different structure,
however.
8/13/2019 Vibrational Thermodynamics
http://slidepdf.com/reader/full/vibrational-thermodynamics 127/145
Vibrational Thermodynamics of Materials 123
22. Future Directions
22.1. Opportunities for Experiment
Measurements of the phonon DOS have long been possible with Fermi chopperspectrometers, but the experimental situation has changed markedly with the adventof new and efficient facilities for inelastic neutron scattering. There is now enoughintensity so that dispersive information from coherent scattering can be measuredreliably over wide ranges of Q and E . For powder samples this Q-information isrich in detail, but it is averaged over different crystallographic directions. Withcomputational support, the S (Q, E ) from polycrystalline samples can progress to-wards the more detailed information obtained from single crystals. Nevertheless,single crystal studies are possible with chopper spectrometers. With measurementsat multiple crystal orientations, these studies should prove an efficient way to obtainphonon dispersions. Improved rates of data acquisition now allow more systematicmeasurements of phonons at elevated temperatures and modest pressures of a few
GPa.A triple axis spectrometer is highly accurate in its energy and momentum mea-
surements, and when a full set of phonon dispersions are measured on single crystalsof ordered compounds, the phonon DOS derived from a lattice dynamics modelis highly reliable. This technique is not so reliable for disordered solid solutions,unfortunately, because the dispersions are inherently broadened, and this broaden-ing need not be symmetrical in energy. Nevertheless, the biggest challenge remainsobtaining single crystals of the material of interest. On the horizon are high inten-sity beams of long wavelength neutrons, which should offer new opportunities forstudying long wavelength and low energy excitations in mesoscopic systems. Thesecold neutrons may also provide better energy resolution for phonon studies usingphonon annihilations.
Phonon dispersions can now be measured on very small single crystals by inelasticx-ray scattering. In spite of flux limitations, these experiments are practical todayfor many chemical compositions. This method could make significant advances withmodest investments in energy analyzer systems. Inelastic nuclear resonant scatteringis an incoherent scattering technique for determining phonon partial DOS curves of isotopes such as 57Fe and 119Sn, and is reasonably mature. Both these synchrotronmethods offer the opportunities for measuring phonon information under extremeconditions of pressure and temperature, and these opportunities are starting to beexploited.
22.2. Opportunities for Theory
At low temperatures it is possible to use electronic structure calculations with thelocal density approximation to calculate phonon frequencies with good accuracy,but a 1% accuracy remains a challenge for many systems. Nevertheless, present-day DFT calculations are invaluable for finding trends in vibrational entropy withcomposition and pressure, and will see more widespread use. Better methods forelectronic structure calculations are under active development. Improvements inab-initio calculations on magnetic systems are expected as the exchange energy is
8/13/2019 Vibrational Thermodynamics
http://slidepdf.com/reader/full/vibrational-thermodynamics 128/145
124 B. Fultz
handled by methods beyond the local density approximation, but the cooperativenature of the magnetic transition or the magnetic susceptibility remains a compu-tational challenge. Density functional theory is not on solid ground when electronicexcitations are considered, but there are developments in time-dependent DFT
methods, and GW calculations give a more rigorous correlation energy. Path integralquantum Monte Carlo methods are also under development. These methods shouldprove valuable when considering matter in extreme conditions [397, 398]. Many of these computational methods will benefit from the ongoing rapid improvements incomputing capabilities. Quantum molecular dynamics offers opportunities to handleanharmonic forces in a fundamental way, and with better computing resources theseab-initio molecular dynamics studies will be practical for larger systems and longertimes.
At modest temperatures, the suppression of the electron DOS near the Fermilevel owing to the effects of electron lifetime is not well understood. The adia-batic electron-phonon coupling can be obtained from band structure calculationson supercells with atoms in static positions characteristic of thermal displacements.Results from an ensemble of such calculations give a broadening of the electronband structure that increases with temperature. Better calculations on the adi-abatic electron-phonon interaction can be used for more detailed predictions of thermal effects along different crystallographic directions. It may be possible todo this self-consistently, so the directions with the stronger EPI are more sensitiveto temperature.
The dynamics of disordered, nonlinear, or anharmonic systems have a long his-tory. The entropy of anharmonic systems will likely remain a challenge for manyyears to come. In the interim, it seems possible that better molecular dynam-ics calculations, perhaps ab-initio calculations, will play an increasingly importantrole in sorting out the dynamics of anharmonic materials and their temperature
dependences.
22.3. Outlook
Much of the subject of vibrational thermodynamics of materials is based on thestatistical mechanics of harmonic oscillators. It is fortunate that the harmonic ap-proximation gives a good start in understanding basic trends, because there are somany useful and powerful mathematical results for harmonic vibrations. Deviationsfrom harmonicity are important, however, and understanding them is essential. Hightemperature behavior requires more concepts, and more complexity of analysis,but high temperature behavior is especially relevant to phase transformations inmaterials science and engineering.
Experimental facilities for inelastic scattering of neutrons and x-rays have madelarge advances in the past decade, and offer to make routine the acquisition of systematic data. Many of the barriers to high quality experimental results are nowon the analysis side of the work, rather than on the instrumentation side, as has beenthe case historically. Calculations of vibrational entropy are fruitful today, and willget better as computational resources improve and new approaches become available.The strengths and weaknesses of experiment and theory can often be overcome byworking with data and computation in the same computing environment, using

8/13/2019 Vibrational Thermodynamics
http://slidepdf.com/reader/full/vibrational-thermodynamics 129/145
Vibrational Thermodynamics of Materials 125
the strengths of theory to support weaknesses in experimental measurements, andvice-versa.
Many important systematic trends on the vibrational thermodynamics of materi-als are now known. Nevertheless, relatively few materials have been studied to date,
and there is much more to do. The situation has a parallel to the atomic structureof materials, which has been an active area of research for a hundred years. Thevibrational motions of atoms in materials, and how they originate from structureand in turn influence the thermodynamic stability of the structure, will remain richfor discovery for years to come.
23. Acknowledgments
This work would not have been possible without the contributions of my juniorcollaborators at Caltech, especially L. Anthony, L.J. Nagel, H.N. Frase, A.F. Yue,M.E. Manley, P.D. Bogdanoff, J.Y.Y. Lin, T.L. Swan–Wood, A.B. Papandrew, O.Delaire, M.S. Lucas, M.G. Kresch, M.L. Winterrose, and J. Purewal, several of whomare taking this field into new directions. I acknowledge a debt to my collaboratorsin research, especially R. Nicklow, J.L. Robertson, R. Osborn, S. Rosenkranz, R.Ravelo, M. Baskes, R.J. McQueeney, W. Sturhahn, T.S. Toellner, E.E. Alp, I.Halevy, D. Abernathy, D.A. Neuman, L. Nazar, H-K. Mao. Software developmentand computational science were important in this work, and will be more so inthe future. For this I acknowledge contributions from M.A.G. Aivazis, T.M. Kelley,M. McKerns, J.B. Keith. Important ideas have come from stimulating conversationsover the years with A. van de Walle, V. Ozolins, G. Ceder, M. Asta, D.D. Johnson, D.de Fontaine, A.G. Khachaturyan, A. Zunger, and P. Rez. This work was supportedby the DOE BES under grant DE-FG02-03ER46055.
24. Bibliography
References
1. J.W. Gibbs, Trans. Conn. Acad. 11, 382 (1873).2. R. Kikuchi, Phys. Rev. 81, 988 (1951).3. R. Kikuchi, J. Chem. Phys. 60, 1071 (1974).4. D. de Fontaine, Solid State Physics 34, 73 (1979).5. A.A. Maradudin, E. W. Montroll, G.H. Weiss, and I.P. Ipatova Theory of Lattice
Dynamics in the Harmonic Approximation (Academic Press, New York, 1971).6. M. Born and K. Wang, Dynamical Theory of Crystal Lattices (Oxford Classic Texts, Claren-
don Press, Oxford, 1988).7. O. Stern, Ann. Phys. (4e Folge), 51, 237 (1916).8. F. Ducastelle, Order and Phase Stability in Alloys (North-Holland, Amsterdam, 1991).9. A. van de Walle and G. Ceder, Revs. Mod. Phys. 74, 11 (2002).
10. J. Rosen and G. Grimvall, Phys. Rev. B, 27, 7199 (1983).11. G.D. Garbulsky and G. Ceder, Phys. Rev. B 49, 6327 (1994).12. R. Brout and W.M. Visscher, Phys. Rev. Lett. 9, 54 (1962).13. Yu.M. Kagan and Ya.A. Iosilevskii, Zh. Eksp. Teor. Fiz. 42, 259 (1962). [English translation
Sov. Phys. JETP 15, 182 (1962).]
8/13/2019 Vibrational Thermodynamics
http://slidepdf.com/reader/full/vibrational-thermodynamics 130/145
126 B. Fultz
14. I.M. Lifshitz, Adv. Phys. 13, 483 (1964).15. A.A. Maradudin, in Solid State Physics, F. Seitz and D. Turnbull, eds., 18, 273 (Academic
Press, New York, 1966). Ibid. 19, 1 (1966).16. A. Fernandez Guillermet and G. Grimvall, Phys. Rev. B 40, 1521 (1989).17. E.G. Moroni, G. Grimvall, and T. Jarlborg, Phys. Rev. Lett. 76, 2758 (1996).18. V.L. Moruzzi, J.F. Janak, and K. Schwarz, Phys. Rev. B 37, 790 (1988).19. J.M. Sanchez, J.P. Stark, and V.L. Moruzzi, Phys. Rev. B 44, 5411 (1991).20. W.-T. Tseng and J.P. Stark, Philos. Mag. B 70, 919 (1990).21. F.J. Dyson, Phys. Rev. 92, 1331 (1953).22. P. Dean, Rev. Mod. Phys. 44, 127 (1972).23. P.B. Allen and J. Kelner, Amer. J. Phys. 66, 497 (1998).24. G. Moraitis and F. Gautier, J. Phys. F: Metal Phys. 7, 1421 (1977).25. J.A.D. Matthew, R.E. Jones, and V.M. Dwyer, J. Phys. F: Metal Phys. 13, 581 (1983).26. A.A.H.J. Waegemaekers and H. Bakker, Mat. Res. Soc. Symp. Proc. 21, 343 (1984).27. G.D. Garbulsky and G. Ceder, Phys. Rev. B 53, 8993 (1996).28. S. Baer, J. Phys. C: Solid State Phys. 16, 4103 (1983).29. J. Mahanty and M. Sachdev, J. Phys. C 3, 773 (1970).30. H. Bakker, Philos. Mag. A 45, 213 (1982).31. H. Bakker, Phys. Stat. Solidi (b) 109, 211 (1982).32. W.L. Bragg and E.J. Williams, Proc. Roy Soc. London A 151, 540 (1935).33. B.E. Warren X-Ray Diffraction (Dover, Mineola New York, 1990).34. Brent Fultz and James M. Howe, Transmission Electron Microscopy and Diffractometry of
Materials Third Edition, (Springer-Verlag, Heidelberg 2007).35. H. Bakker and C. Tuijn, J. Phys. C-Solid State 19, 5585 (1986).36. C. Tuijn and H. Bakker, Phys. Stat, Solidi B 155, 107 (1989).37. Cornelis Tuijn, Ph.D. Dissertation, van der Waals–Zeeman Institute, Univ. Amsterdam
(1997).38. G. Grimvall and A. Fernandez Guillermet, Chapter 10 in Thermodynamic Data, edited by
S.K. Saxena (Springer–Verlag 1992).39. A. Fernandez Guillermet and G. Grimvall, Phys. Rev. B 40, 10582 (1989).40. G. Grimvall and A. Fernandez Guillermet, Int. J. Thermophysics 15, 1353 (1994).41. O.L. Anderson and J.E. Nafe, J. Geophys. Res. 70, 3951 (1965).42. M.H.F. Sluiter, M. Weinert, and Y. Kawazoe, Phys. Rev. B 59, 4100 (1999).43. A. van de Walle and G. Ceder, Phys. Rev. B 61, 5972 (2000).44. E.J. Wu, G. Ceder, and A. van de Walle, Phys. Rev. B 67, 134103 (2003).45. J.Z. Liu, G. Ghosh, A. van de Walle, and M. Asta, Phys. Rev. B 75, 104117 (2007).46. D.C. Wallace, Thermodynamics of Crystals (Dover, Mineola, New York, 1998).47. J. Trampenau, W. Petry, C. Herzig, Phys. Rev. B 47, 3132 (1993).48. P.D. Bogdanoff, B. Fultz, J.L. Robertson and L. Crow, Phys. Rev. B 65, 014303 (2002).49. M.E. Manley, R.J. McQueeney, B. Fultz, R. Osborn, G.H. Kwei, and P.D. Bogdanoff, Phys.
Rev. B 65, 144111 (2002).50. D.C. Wallace, Statistical Physics of Crystals and Liquids: A Guide to Highly Accurate Equations
of State (World Scientific, Singapore, 2003).51. C. Triguero, M. Porta, and A. Planes, Phys. Rev. B 73, 054401 (2006).52. P. Entel, E. Hoffmann, P. Mohn, K. Schwarz, and V. L. Moruzzi, Phys. Rev. B 47, 8706
(1993).53. Y. Wang, G. M. Stocks, D. M. C. Nicholson. W. A. Shelton, V. P. Antropov, and B. N.
Harmon, J. Appl. Phys. 81, 3873 (1997).54. M. van Schilfgaarde, I. A. Abrikosov, and B. Johansson, Nature (London) 400, 46 (1999).55. W. Nernst and F.A. Lindemann, Berl. Ber. 494, (1911).56. E.S.R. Gopal, Specific Heats at Low Temperatures, (Plenum, New York, 1966).57. J.P. McCullough and D.W. Scott, eds. Experimental Thermodynamics Volume 1 Calorimetry of
Non-reacting systems (Plenum, New York, 1968).58. G.K. White, Experimental Techniques in Low-Temperature Physics (Oxford, 1979).59. R. Stevens, J. Boerio-Goates, J. Chem. Thermodynamics 36, 857 (2004).
8/13/2019 Vibrational Thermodynamics
http://slidepdf.com/reader/full/vibrational-thermodynamics 131/145
Vibrational Thermodynamics of Materials 127
60. B.E. Lang, J. Boerio-Goates and B.F. Woodfield, J. Chem. Thermodynamics 38, 1655 (2006).61. R. Bachmann, et al., Rev. Sci. Instr. 43, 205 (1972).62. G.R. Stewart, Rev. Sci. Instr. 54, 1 (1983).63. J.C. Lashley, et al. Cryogenics 43, 369 (2003).64. C.A. Kennedy, et al., Cryogenics 47 107 (2007).65. P.F. Sullivan and G. Seidel, Phys. Rev. 173, 679 (1968).66. L. Van Hove, Phys. Rev. 95, 249 (1954).67. V.S. Oskotskii, Fiz. Tverdogo Tela 9, 550 (1967). [English translation Sov. Phys. – Solid
State 9, 420 (1967).]68. M.M. Bredov, B.A. Kotov, N.M. Okuneva, V.S. Oskotskii, and A.L. Shakh–Budagov Fiz.
Tverdogo Tela 9, 287 (1967). [English translation Sov. Phys. – Solid State 9, 214 (1967).]69. F.W. de Wette and A. Rahman, Phys. Rev. 176, 784 (1968).70. V. Ambegaokar, J.M. Conway, and G. Baym, in Lattice Dynamics, R.F. Wallis Ed.,
(Pergamon Press, Oxford, 1965) 261.71. R.A. Cowley and W.J.L. Buyers, J. Phys. C: Solid State 2, 2262 (1969).72. W.J.L. Buyers and R.A. Cowley, Phys. Rev. 180, 755 (1969).73. T. May, W. Muller and D. Strauch, Phys. Rev. B 57 5758 (1998).74. C.G. Windsor, Pulsed Neutron Scattering (Taylor & Francis, London 1981).75. http://neutrons.ornl.gov/instrument systems/sns instruments.shtml76. http://www.isis.rl.ac.uk/instruments/index.htm77. http://lansce.lanl.gov/lujan/instruments/Pharos/index.html78. http://j-parc.jp/index-e.html79. B.N. Brockhouse, Phys. Rev. 98, 1171 (1955).80. A.D.B. Woods, W. Cochran, and B.N. Brockhouse, Phys Rev. 119, 980 (1960).81. G. Shirane, S.M. Shapiro, and J.M. Tranquada, Neutron Scattering with a Triple-Axis Spectrometer
(Cambridge, 2002).82. R.M. Martin, Electronic Structure (Basic Theory and Practical Methods) (Cambridge,
2005).83. C. Fiolhais, Fernando Nogueira, Miguel A.L. Marques, Editors, A Primer in
Density Functional Theory (Lecture Notes in Physics) (Springer–Verlag, Berlin 2003).
84. M. Finnis, Interatomic Forces in Condensed Matter (Oxford Series on Materials Modelling, 1)
(Cambridge, 2004).
85. J. Kohanoff, Electronic Structure Calculations for Solids and Molecules: Theory and ComputationalMethods (Cambridge University Press, 2006).
86. S. Baroni, P. Giannozzi, and A. Testa, Phys. Rev. Lett 58, 1861 (1987).87. S. Baroni, S. de Gironcoli, and P. Giannozzi, Phys. Rev. Lett 65, 84 (1990).88. S. Wei and M.Y Chou, Phys. Rev. Lett. 69, 2799 (1992).89. X. Gonze, Phys. Rev. B 55, 10337 (1997).90. X. Gonze and C. Lee, Phys. Rev. B 55, 10355 (1997).91. K. Parlinski, Z.Q. Li, Y. Kawazoe, Phys. Rev. Lett 78 4063 (1997).92. G.J. Ackland, M.C. Warren, and S.J. Clark, J. Phys.: Condens. Matter 9, 7861 (1997).93. X. Gonze, G.M. Rignanese, R. Caracas, Z. Krist. 220, 458 (2005).94. http://www.abinit.org/95. P. Hohenberg and W. Kohn, Phys. Rev. 136, B864 (1964).96. N.D. Mermin, Phys. Rev. 137, A1441 (1965).97. W. Kohn and L.J. Sham, Phys. Rev. 140, A1133 (1965).
98. J.M. Ziman, Electrons and Phonons (Oxford, 1963).99. Peter Bruesch, Phonons: Theory and Experiments One (Springer, 1982).
100. M.T. Yin and M.L. Cohen, Phys. Rev. Lett. 45 1004 (1980).101. K. Kunc and R.M. Martin, Phys. Rev. B 24, 2311 (1981).102. J. Zaretsky, C. Stassis, B.N. Harmon, K.-M. Ho, and C.-L. Fu, Phys. Rev. B 28, 697 (1983).103. Y.-Y. Ye, Y. Chen, K.-M. Ho and B.N. Harmon, Phys. Rev. Lett. 58, 1769 (1987).104. Y.-Y. Ye, Y. Chen, K.-M. Ho and B.N. Harmon, J. Phys.: Condens. Matter 3, 9629 (1991).105. A.A. Quong and B.M. Klein, Phys. Rev. B 46, 10734 (1992).106. S. Nose, J. Chem. Phys. 81, 511 (1984).
8/13/2019 Vibrational Thermodynamics
http://slidepdf.com/reader/full/vibrational-thermodynamics 132/145
128 B. Fultz
107. W.G. Hoover, A.J.C. Ladd, and B. Moran, Phys. Rev. Lett. 48, 1818 (1982).108. J.M. Dickey and A. Paskin, Phys. Rev. 188, 1407 (1969).109. R. Car and M. Parrinello, Phys. Rev. Lett. 55, 2471 (1985).110. T.D. Kuhne, M. Krack, F.R. Mohamed and M. Parrinello, Phys. Rev. Lett. 98, 066401 (2007).111. Slater, J.C. (1939) Introduction to Chemical Physics, McGraw-Hill, New York, Chapter 13.112. F. Seitz, The Modern Theoery of Solids (McGraw-Hill, New York, 1940) Chapter 14.113. F. Lange, Z. Physik. Chem. 30A, 601 (1924).114. C. Zener, Elasticity and Anelasticity of Metals (University of Chicago Press, Chicago, 1948).115. G. Grimvall and I. Ebbsjo, Physica Scripta 12, 168 (1975).116. A.O.E. Animalu, Phys. Rev. 161, 445 (1967).117. R. Pynn and I. Ebbsjo, J. Phys. F: Metal Phys. 1, 744 (1971).118. D.C. Wallace, Phys. Rev. 176, 832 (1968).119. F. Frey, W. Prandl, C. Zeyen, and K. Ziebeck, J. Phys. F: Maetal Phys. 9, 603 (1979).120. L.J. Nagel, B. Fultz, and J.L. Robertson, Philos. Mag. B 75, 681 (1997).121. J.L. Robertson, B. Fultz, and H.N. Frase, Phys. Rev. B 60, 9329 (1999).122. R. Lubbers, H.F. Grunsteudel, A.I. Chumakov, and G. Wortmann, Science 287, 1250 (2000).123. H.-K. Mao, V. Struzhkin, J. Shu, R.J. Hemley, W. Sturhahn, M.Y. Hu, E.E. Alp, L. Vocadlo,
D. Alfe, G.D. Price, M.J. Gillan, M. Schwoerer-Bohning, D. Hausermann, P. Eng, G. Shen,H. Geifers, R. Lubers, G. Wortmann, Science 292, 914 (2001).
124. G. Shen, W. Sturhahn, E.E. Alp, J. Zhao, T.S. Toellner, V.B. Prakapenka, Y. Meng, andH.-K. Mao, Phys. Chem. Minerals 31, 353 (2004).
125. A. van de Walle, A. Moser, and W. Gasior Archives of Metallurgy and Materials, 49, 535(2004).
126. C. Zener, J. Appl. Phys. 22, 372 (1951).127. G.H. Vineyard, J. Phys. Chem. Solids 3, 121 (1957).128. H.R. Schoeber, W. Petry and J. Trampenau, J. Phys. Condens. Matter 4, 9321 (1992).129. C. Zener, in Thermodynamics in Physical Metallurgy, C. Zener ed., (ASM, Cleveland, 1950)
p. 16.130. H.B. Huntington, G.A. Shirn and E.S. Wajda, Phys. Rev. 99, 1085 (1955).131. J.F. Freedman and A.S. Nowick, Acta Metal. 6, 176 (1956).132. W. Desorbo, Acta Metall. 3, 227 (1955).133. R.A. Oriani, Acta Metall. 3, 232 (1955).134. A. Fernandez Guillermet and G. Grimvall, J. Phys. Chem. Solids 53, 105 (1991).135. A. Fernandez Guillermet and H. Du, Z. Metallkunde 85, 154 (1994).136. A. Seko, F. Oba, A. Kuwabara, and I. Tanaka, Phys. Rev. B 72, 024107 (2005).137. A.P. Giddy, M.T. Dove, G.S. Pawley, and V. Heine Acta Crystallogr. A 49, 697 (1993).138. M.T. Dove, Introduction to Lattice Dynamics , Cambridge Topics in Mineral Physics and
Chemistry (Cambridge Univ. Press, 1993).139. G. Ernst, C. Broholm, G.R. Kowach, and A.P. Ramirez, Nature 396, 147 (1998).140. R. Mittal, S.L. Chaplot, H. Schober, and T.A. Mary, Phys. Rev. Lett 86, 4692 (2001).141. C.A. Kennedy, M.A. White, A.P. Wilkinson, T. Varga, Phys. Rev. B 75, 224302 (2007).142. M. Blackman, Proc. Phys. Soc. B 70, 827 (1957).143. G.B. Walker, Phys. Rev. 103, 547 (1956).144. R. Stedman and G. Nilsson, Phys. Rev. Lett. 15, 634 (1965).145. G. Gilat and R. M. Nicklow, Phys. Rev. 143, 487 (1965).146. V. Ozolins and M. Asta, Phys. Rev. Lett. 86, 448 (2001).147. M. Asta and V. Ozolins, Phys. Rev. B 64, 094104 (2001).148. V. Ozolins, B. Sadigh, and M. Asta, J. Phys.: Condens. Matter 17, 2197 (2005).149. J. Chevrier, J.B. Suck, J.C. Lasjaunias, M. Perroux, and J.J. Capponi, Phys. Rev. B 49, 961
(1994).150. C. Wolverton and V. Ozolins, Phys. Rev. Lett. 86, 5518 (2001).151. M. Mihalkovic and M. Widom, Phys. Rev. B 75, 014207 (2007).152. H. Okamoto, Phase Diagrams for Binary Alloys (Desk Handbook), (ASM International,
Materials Park, OH, 2000).

8/13/2019 Vibrational Thermodynamics
http://slidepdf.com/reader/full/vibrational-thermodynamics 133/145
Vibrational Thermodynamics of Materials 129
153. W. Hume-Rothery and G.V. Raynor, The Structure of Metals and Alloys (Institute of Metals, London, 1962).
154. A. Gangulee, G.C. Das, and M.B. Bever, Metall. Trans. 4, 2063 (1973).155. Fong-Chi Hsu, Jiu-Yong Luo, Kuo-Wei Yeh, Ta-Kun Chen, Tzu-Wen Huang, Phillip
M. Wu, Yong-Chi Lee, Yi-Lin Huang, Yan-Yi Chu, Der-Chung Yan, Maw-Kuen Wu,“Superconductivity in the PbO-type Structure alpha-FeSe,” arXiv:0807.2369.
156. A. Subedi, L. Zhang, D.J. Singh, and H.M. Du, Phys. Rev. B 78, 134514 (2008).157. H. Ikeda, M. Shirai, N. Suzuki, and K. Motizuki, Jpn. J. Appl. Phys. 32 Suppl. 32-3, 301
(1993).158. E.M. Carvaljo, I.R. Harris, J. Mater. Sci. 15, 1224 (1980).159. E. Kneller, Y. Khan, and U. Gorres, Z. Metallkunde 77, 43 (1986).160. K.-J. Zeng, M. Hamalainen, and H.L. Lukaz, J. Phase Equilibria 15, 577 (1994).161. J. Okamoto, C. Ahn, and B. Fultz, in Microbeam Analysis – 1990, J.R. Michael and P.
Ingram, eds. (San Francisco Press, 1990) p. 56.162. L.J. Nagel, L. Anthony, J. K. Okamoto, and B. Fultz, Journal of Phase Equilibria 18, 551
(1997).163. L. Anthony, L. J. Nagel, J. K. Okamoto, and B. Fultz, Phys. Rev. Lett. 73, 3034 (1994).164. James Kozo Okamoto, Ph.D. Thesis in Applied Physics, California Institute of Technology,
May 6, 1993.165. B. Fultz, W. Sturhahn, T.S. Toellner, and E.E. Alp, in MRS Symposium Proceedings 590,
Applications of Synchrotron Radiation Techniques to Materials Science V, S.R. Stock, S.M.Mini, and D.L. Perry, eds. (Materials Research Society, Warrrendale, PA 2000) p. 91.
166. B. Fultz, T.A. Stephens, W. Sturhahn, T.S. Toellner, and E.E. Alp, Phys. Rev. Lett. 80,3304 (1998).
167. L. Anthony, J. K. Okamoto, and B. Fultz, Phys. Rev. Lett. 70, 1128 (1993).168. L. Anthony, L. J. Nagel, and B. Fultz, in Solid-Solid Phase Transformations, W.C. Johnson,
J. Howe, D.E. Laughlin, and W.A. Soffa, eds. (TMS, Warrendale, 1994) 467.169. B. Fultz, L. Anthony, L.J. Nagel, R.M. Nicklow and S. Spooner, Phys. Rev. B 52, 3315
(1995).170. C. Stassis, F.X. Kayser, C.-K. Loong, and D. Arch, Phys Rev. B 24, 3048 (1981).171. J.D. Althoff, D. Morgan, D. de Fontaine, M. Asta, S.M. Foiles, and D.D. Johnson, Phys. Rev.
B 56, R5705 (1997).172. R. Ravelo, J. Aguilar, M. Baskes, J.E. Angelo, B. Fultz, and B.L. Holian, Phys. Rev. B 57,
862 (1998).173. J.D. Althoff, D. Morgan, D. de Fontaine, M. Asta, S.M. Foiles, and D.D. Johnson, Comp.
Mater. Sci. 10, 411 (1998).174. D. Morgan, J.D. Althoff and D. de Fontaine, J. Phase Equilibria 19, 559 (1998).175. S.J. Liu, S.Q. Duan, and B.K. Ma, Phys. Rev. B 58, 9705 (1998).176. A. van de Walle, G. Ceder, and U.V. Waghmare, Phys. Rev. Lett. 80, 4911 (1998).177. W.L. Bragg and E.J. Williams, Proc. Roy. Soc. A 145, 699 (1934).178. H.A. Bethe Proc. Roy. Soc. A, 150, 552 (1935).179. F.C. Nix and W. Shockley, Rev. Mod. Phys. 10, 1 (1938).180. C. Zener, Phys. Rev. 71, 846 (1947).181. L. Sarolea, Physica 19, 615 (1953).182. C. Booth and J.S. Rowlinson Trans. Faraday Soc. 51, 463 (1955).183. P.J. Wojtowciz and J.G. Kirkwood, J. Chem. Phys. 33, 1299 (1960).184. Douglas Harvey Pearson, Ph.D. Thesis in Applied Physics, California Institute of Technology,
September 30, 1991.185. A.S. Normanton, P.E. Bloomfield, F.R. Sale, and B.B. Argent, Metal Science 9 510 (1975).186. T. Eguchi, H. Matsuda and K. Oki, IEEE Trans. Magnetics Mag-4, 476 (1968).187. H.H. Hamdeh, J. Okamoto, and B. Fultz, Phys. Rev. B 42, 6694 (1990).188. Matthew S. Lucas, Ph.D. Thesis in Materials Science, California Institute of Technology, July
25, 2008.189. D.W. Clegg and R.A. Buckley, Metal Science 7, 48 (1973).190. D.B. Bowen, Acta Metall. 2, 573 (1954).
8/13/2019 Vibrational Thermodynamics
http://slidepdf.com/reader/full/vibrational-thermodynamics 134/145
130 B. Fultz
191. P.A. Flinn, G.M. McManus and J.A. Rayne, J. Phys. Chem. Solids 15, 189 (1960).192. P.L. Rossiter and B. Bykovec, Philos. Mag. B 38, 555 (1978).193. J. Rayne, Phys. Rev. 108, 649 (1957).194. S. Katano, M. Iizumi, Y. Noda, J. Phys. F. 18, 2195 (1988).195. L.J. Nagel, L. Anthony and B. Fultz, Philos. Mag. Lett. 72, 421 (1995).196. Laura Jeanne Nagel, Ph.D. in Materials Science, California Institute of Technology, June 18,
1996.197. F. Cleri and V. Rosato, Philos. Mag. Lett. 67, 369 (1993).198. G.J. Ackland, in Alloy Modeling and Design, G. M. Stocks and P. Turchi, eds. (The Metals,
Minerals and Materials Society, Warrendale, PA 1994) 149.199. W. B. Fei, A. Kara, T. S. Rahman, Phys. Rev. B 61, 16105 (2000).200. P. D. Bogdanoff, B. Fultz, and S. Rosenkranz, Phys. Rev. B 60, 3976 (1999).201. P.D. Bogdanoff, T. Swan-Wood, and B. Fultz, Phys. Rev. B 68, 014301 (2003).202. V. Ozolins, C. Wolverton and A. Zunger, Phys. Rev. B 58, R5897 (1998).203. R.J. Elliott and D.W. Taylor, Proc. R. Soc. London, Ser. A 296, 161 (1967).204. B. Fultz, T.A. Stephens, E.E. Alp, M.Y. Hu, J.P. Sutter, T.S. Toellner, and W. Sturhahn,
Phys. Rev. B 61, 14517 (2000).205. Y. Noda and Y. Endoh, J. Phys. Soc. Japan 57, 4225 (1988).206. P.D. Bogdanoff and B. Fultz, Philos. Mag. B 79, 753 (1999).207. A. F. Yue, I. Halevy, A. Papandrew, P. D. Bogdanoff, B. Fultz, W. Sturhahn, E. E. Alp, and
T. S. Toellner, Hyperfine Interact. 141, 249 (2002).208. W.G. Stirling, R.A. Cowley and M.W. Stringfellow, J. Phys. F: Metal Phys. 2, 421 (1972).209. V. Ozolins, C. Wolverton, and A. Zunger, Phys. Rev. B 57, 6427 (1998).210. P.J. Craievich and J.M. Sanchez, Computational Materials Science 8, 92 (1997).211. N.A. Zarkevich, T.L. Tan, and D.D. Johnson, Phys. Rev. B 75, 104203 (2007).212. B.P. Burton, A. van de Walle and U. Kattner, J. App. Phys. 100, 113528 (2006).213. H.Y. Genga, M.H.F Sluiter, and N.X. Chen, J. Chem. Phys. 122, 214706 (2005).214. J.W.D. Connolly and A.R. Williams, Phys, Rev. B 27, 5169 (1983).215. M.S. Lucas, M. Kresch, R. Stevens, and B. Fultz, Phys. Rev. B 77, 184303 (2008).216. M.S. Lucas, A. Papandrew, B. Fultz and M.Y. Hu, Phys. Rev. B 75, 054307 (2007).217. T. Chart, F. Putland, and A. Dinsdale, CALPHAD: Comput. Coupling Phase Diagrams
Thermochem. 4, 27 (1980).218. A. Caro, M. Caro, E.M. Lapasso, and D.A. Crowson, Appl. Phys. Lett. 89, 121902 (2006).219. P. Olsson, I.A. Abrikosov, L. Vitos, and J. Wallenius, J. Nucl. Mater. 321, 84 (2003).220. E.G. Moroni and T. Jarlborg, Phys. Rev. B 47, 3255 (1993).221. S.A. Danilkin, M.G. Zemlyanov, V.P. Minaev, P.P. Parshin, and V.V. Sumin, Fiz. Tverd. Tela
(Leningrad) 29, 2122 (1987). [English translation Sov. Phys. Solid State 29, 1213 (1987).]222. S.A. Danilkin, M.G. Zemlyanov, V.P. Minaev, P.P. Parshin, and V.V. Sumin, Fiz. Tverd.
Tela (Leningrad) 31, 8 (1989). [English translation Sov. Phys. Solid State 31, 725 (1989).]223. S.A. Danilkin, V.P. Minaev, and V.V. Sumin, Physica B 174, 241 (1991).224. W. Luo, J.D. Clewley and T.B. Flanagan, J. Chem. Phys. 93, 6710 (1990).225. G. Grimvall, J. Alloys and Compounds 233, 183 (1996).226. J.L. Anderson, J. Nasise, K. Philipson, and F.E. Pretzel, J. Phys. Chem. Solids 31, 613
(1970).227. W. Yu, C. Jin, and A. Kohlmeyer, J. Phys.: Condens. Matter 19, 086209 (2007).228. B. Yates, G.H. Wostenholm, and J.K. Bingham, J. Phys. C: Solid State Phys. 7, 1769 (1974).229. V. Ozolins, E.H. Majzoub, and C. Wolverton, J. Am. Chem. Soc. (2009).230. R. Moreh, N. Shnieg, H. Zabel, Phys. Rev. B 44, 13111 (1994).231. M.M. Beg, M. Nielsen, Phys. Rev. B 14, 4266 (1976).232. Y. Reynier, R. Yazami, and B. Fultz, J. Power Sources 119-121, 850 (2003).233. Y. Reynier, J. Graetz, T. Swan–Wood, P. Rez, R. Yazami and B. Fultz, Phys. Rev. B 70,
174304 (2004).234. G.V. Kurdjumov and A.G. Khachaturyan, Metall Trans. 3, 1069 (1972).235. P.C. Chen, B.O. Hall, and P.G. Winchell, Metall Trans. A 11, 1323 (1980).236. K.A. Taylor and M. Cohen, Prog. Mater. Sci. 36, 225 (1992).

8/13/2019 Vibrational Thermodynamics
http://slidepdf.com/reader/full/vibrational-thermodynamics 135/145
8/13/2019 Vibrational Thermodynamics
http://slidepdf.com/reader/full/vibrational-thermodynamics 136/145
132 B. Fultz
282. P.M. Derlet, R. Meyer, L.J. Lewis, U. Stuhr, and H. van Swygenhoven, Phys. Rev. Lett. 87,205501 (2001).
283. B. Roldan Cuenya, A. Naitabdi, J. Croy, W. Sturhahn, J. Y. Zhao, E.E. Alp, R. Meyer, D.Sudfeld, E. Schuster, and W. Keune, Phys. Rev. B 76, 195422 (2007).
284. B. Roldan Cuenya, W. Keune, R. Peters, E. Schuster, B. Sahoo, U. von Horsten, W. Sturhahn,J. Zhao, T.S. Toellner, E.E. Alp and S.D. Bader, Phys. Rev. B 77, 165410 (2008).
285. H.N. Frase, L.J. Nagel, J.L. Robertson, and B. Fultz, in E. Ma, B. Fultz, R. Shull, J. Morral,and P. Nash, eds., Chemistry and Physics of Nanostructures and Related Non-EquilibriumMaterials, (TMS, Warrendale, PA, 1997), ISBN No. 0-87339-358-8. p. 125.
286. H.N. Frase, B. Fultz, S. Spooner, and J.L. Robertson, J. Appl. Phys. 85, 7097 (1999).287. H.N. Frase, B. Fultz, J. L. Robertson and S. Spooner, Philos. Mag. B 80, 1545 (2000).288. B. Fultz and H. N. Frase, in Ultrafine Grained Materials, R. S. Mishra, S. L. Semiatin, C.
Suryanarayana N.N. Thadhani, and T. C. Lowe, eds., (TMS, Warrendale PA, 2000) p. 3.289. B. Fultz and H. N. Frase, Hyperfine Interact. 130, 81 (2000).290. D. Wolf, J. Wang, S. R. Phillpot, and H. Gleiter, Phys. Rev. Lett. 74, 4686 (1995).291. J.L. Robertson, H.N. Frase, P.D. Bogdanoff, M.E. Manley, and B. Fultz, Philos. Mag. Lett.
79, 297 (1999).292. M.E. Manley, R.J. McQueeney, J.L. Robertson, B. Fultz, and D.A. Neumann, Philos. Mag.
Lett. 80, 591 (2000).293. G. Beggerow, in Landolt–Bornstein, New Series, Numerical Data and Functional Relationships
in Science and Technology, K.H. Hellwege, (Ed.), Group IV, Vol. 4 (Springer–Verlag, Berlin,1980) p. 9.
294. I. Barhin and G. Platzki, Thermochemical Data of Pure Substances, Vol. I (VCH, Weinheim,1995) p. 507.
295. K.A. Gschneidner, Jr., V.K. Pecharsky, J. Cho, and S.W. Martin, Scr. Mater. 34, 1717 (1996).296. M.E. Manley, R.J. McQueeney, B. Fultz, R. Osborn, G.H. Kwei, and P.D. Bogdanoff, Phys.
Rev. B. 65, 144111 (2002).297. R.J. McQueeney, M.E. Manley, R. Osborn, B. Fultz, G.H. Kwei, and P.D. Bogdanoff, Philos.
Mag. B 81, 675 (2002).298. M.E. Manley, R.J. McQueeney, B. Fultz, T. Swan–Wood, O. Delaire, E.A. Gorymychkin,
J.C. Cooley, W.L. Hults, J.C. Lashley, R. Osborn, and J.L. Smith, Phys. Rev. B 67, 014103(2003).
299. K.A. Gschneidner, Jr., R.O. Elliott, and R.R. McDonald, J. Phys. Chem. Solids 23, 1191(1962).
300. I.-K. Jeong, T.W. Darling, M.J. Graf, Th. Proffen, R.H. Heffner, Y. Lee, T. Vogt, and J.D.Jorgensen, Phys. Rev. Lett. 92, 105702 (2004).
301. I.-K. Jeong, T.W. Darling, R.H. Heffner, A. Llobet, and J.C. Lashley, Philos. Mag. Lett. 88,607 (2008).
302. J.C. Marmeggi and A. Delapalme, Physica (Amsterdam) 120B, 309 (1980).303. G.H. Lander, E.S. Fisher, and S.D. Bader, Adv. Phys. 43, 1 (1994).304. M.E. Manley, B. Fultz, R.J. McQueeney, C.M. Brown, W.L. Hults, J.L. Smith, D.J. Thomas,
R. Osborn, and J.L. Robertson, Phys. Rev. Lett. 86, 3076 (2001).305. P. Soderlind, O. Eriksson, B. Johansson, J. M. Wills, and A. M. Boring, Nature (London)
374, 524 (1995).306. K.T. Moore and G. van der Laan, Rev. Modern Phys. 81, 235 (2009).307. J. Wong, M. Krisch, D.L. Farber, F. Occelli, A.J. Schwartz, T.C. Chiang, M. Wall, C. Boro,
and X.Q. Xu, Science 301, 1078 (2003).308. R.J. McQueeney, A.C. Lawson, A. Migliori, T.M. Kelley, B. Fultz, M. Ramos, B. Martinez,
J.C. Lashley, and S.C. Vogel, Phys. Rev. Lett 92, 146401 (2004).309. X. Dai, et al., Science 300, 953 (2003).310. W.H. Zachariasen, in The Metal Plutonium, A.S. Coffinberry and W.N. Miner, eds., (Univ.
Chicago Press, Chicago, 1961) p. 99.311. D.C. Wallace, Phys. Rev. B 58, 15433 (1998).312. P.A.M. Dirac, The Principles of Quantum Mechanics (Oxford, Clarendon Press, 1958).
8/13/2019 Vibrational Thermodynamics
http://slidepdf.com/reader/full/vibrational-thermodynamics 137/145
Vibrational Thermodynamics of Materials 133
313. N.W. Ashcroft and N.D. Mermin, Solid State Physics (Holt, Rinehart and Winston NewYork, 1976) Appendix L.
314. P.G. Klemens, Phys. Rev. 148, 845 (1966).315. M. Balkanski, R.F. Wallis, and E. Haro, Phys. Rev. B 28, 1928 (1983).316. G. Morell, W. Perez, E. Ching-Prado, and R.S. Katiyar, Phys. Rev. B, 53, 5388 (1996).317. L. Chen, M. McKerns, and B. Fultz, Phys. Rev. B, in press (2009).318. R.C. Shukla and E.R. Cowley, Phys. Rev. B 3, 4055 (1971). Ibid. 58, 2596 (1998). Ibid. 62,
3232 (2000).319. S.W. Lovesey, Condensed Matter Physics: Dynamic Correlations Second Edition (Ben-
jamin/Cummings, Menlo Park, CA, 1986) Chapter 1.320. G.K. Horton and E.R. Cowley, Chaos 133, 667 (2003).321. L. Van Hove, M. N. Hugenholz, and L.P. Howland, Quantum Theory of Many-Particle
Systems (Benjamin, New York, 1961).322. A.A. Maradudin and A.E. Fein, Phys. Rev. 128, 2589 (1962).323. R.A. Cowley, Adv. Phys. 12, 421 (1963).324. R.A. Cowley, Repts. Prog. Phys. 31, 123 (1968).325. R.C. Shukla and E.R. Cowley, Phys. Rev. B 31, 372 (1985).326. E.R. Cowley and G.K. Horton, Phys. Rev. Lett. 58, 789 (1987).327. R.P. Lowndes, Phys. Rev. B 6, 1490 (1972).328. P. Derollez, J. Gonzalez, B. Hennion, R. Fouret, Physica B 4 305, 191 (2001).329. K. Schmalzl, D. Strauch, and H. Schober, Phys. Rev. B 68, 144301 (2003).330. S. Ves, I. Loa, K. Syassen, F. Widulle and M. Cardona, Phys. Stat. Solidi (b), 223, 241
(2001).331. M. Cardona, High Pressure Research 24, 17 (2004).332. O. Anderson, Equations of State of Solids for Geophysicists and Ceramic Science (Oxford
University Press, New York, 1995).333. O.G. Randl, G. Vogl, W. Petry, B. Hennion, B. Sepiol, K. Nembach, J. Phys.: Condens.
Matter 7, 5983 (1995).334. O. Eriksson, J.M. Wills, and D. Wallace, Phys. Rev. B 46, 5221 (1992).335. G. Grimvall, M. Thiessen, and A. Fernandez Guillermet, Phys. Rev. B 36, 7816 (1987).336. A. Fernandez Guillermet and G. Grimvall, Phys. Rev. B 44, 4332 (1991).337. C. Stassis, J. Zaretsky, D. Arch, O.D. McMasters and B.N. Harmon, Phys. Rev. B 18, 2632
(1978).338. C. Stassis, G.S. Smith, B.N. Harmon, K.-M. Ho and Y. Chen, Phys. Rev. B 19, 181 (1979).339. W. Petry, A. Heiming, J. Trampenau, M. Alba, C. Herzig, H.R. Schober, and G. Vogl, Phys.
Rev. B 43, 10933 (1991).340. A. Heiming, W. Petry, J. Trampenau, M. Alba, C. Herzig, H.R. Schober, and G. Vogl, Phys.
Rev. B 43, 10948 (1991).341. M. Kresch, O. Delaire, R. Stevens, J.Y.Y. Lin, and B. Fultz, Phys. Rev. B 75, 104301 (2007).342. M. Kresch, M. Lucas, and B. Fultz, Phys. Rev. B 77, 024301 (2008).343. M.G. Kresch, Ph.D. Thesis in Materials Science, California Institute of Technology, Dec. 5,
2008.344. O. Delaire, M.G. Kresch, J. Munoz, M.S. Lucas, J.Y.Y. Lin, and B. Fultz, Phys. Rev. B 77,
214112 (2008).345. J.H. Rose, J. Ferrante, and J.R. Smith, Phys. Rev. Lett. 47, 675 (1981).346. J.H. Rose, J.R. Smith, F. Guinea, and J. Ferrante, Phys. Rev. B 29, 2963 (1984).347. H.R. Schober and P.H. Dederichs, in Landolt–Bornstein Numerical Data and Functional
Relationships in Science and Technology New Series 13a K.-H. Hellwege, ed. (Springer–Verlag, Berlin, 1981).
348. V. Keppens, D. Mandrus, B.C. Sales, B.C. Chakoumakos, P. Dai, R. Coldea, M.B. Maple,D.A. Gajewski, E.J. Freemen, and S. Bennington, Nature 395, 876 (1998).
349. J.L. Feldman, D.J. Singh, I.I. Mazin, D. Mandrus, and B.C. Sales, Phys. Rev. B 61, R9209(2000).
350. W. Schweike, R.P. Hermann, M. Prager, J. Persson, and V. Keppens, Phys. Rev. Lett. 99,125501 (2007).
8/13/2019 Vibrational Thermodynamics
http://slidepdf.com/reader/full/vibrational-thermodynamics 138/145
134 B. Fultz
351. http://www.phys.ufl.edu/fermisurface/352. G. Grimvall, The Electron-Phonon Interaction in Metals (North-Holland, Amsterdam,
1981).353. H. Chou and S.M. Shapiro, Phys. Rev. B 48, 16088 (1993).354. I. M. Lifshitz, Zh. Eksp. Teor. Fiz. 33, 1569 (1960). [English translation Sov. Phys. JETP
11, 1130 (1960).355. Olivier Delaire, Ph.D. Thesis in Materials Science, California Institute of Technology, May
12, 2006.356. Y.M. Blanter, M.I. Kaganov, A.V. Pantsulaya, A.A. Varlamov, Phys. Repts. 245, 160 (1994).357. Y. Ding, R. Ahuja, J.F. Shu, P. Chow, W. Luo, H.-K. Mao, Phys. Rev. Lett 98, 085502
(2007).358. A. Landa, J. Klepeis, P. Soderlind, I. Naumov, O. Velikokhatnyi, L. Vitos, A. Ruban, J.
Phys. Chem. Solids, 9-10, 2056 (2006).359. L. Koci, Y. Ma, A.R. Oganov, P. Souvatzis, and R. Ahuja, Phys. Rev. B. 77, 214101 (2008).360. L. Dagens, J. Phys. F: Metal Phys. 8, 2093 (1978).361. B.M. Powell, P. Martel, and A.D.B. Woods, Phys. Rev. B 171, 727 (1968).362. J.G. Morgan, R.B. Von Dreele, P. Wochner P, and S.M. Shapiro, Phys. Rev. B 54, 812 (1996).363. S.C. Ng. and B.N. Brockhouse, Solid State Commun. 5, 79 (1967).364. A.P. Roy and B.N. Brockhouse, Can. J. Phys. 48, 1781 (1970).365. O. De la Pena-Seaman, R. de Coss, R. Heid, and K.-P. Bohnen Phys. Rev. B 76, 174205
(2007).366. N.V. Skorodumova, S.I. Simak, I.A. Abrikosov, B. Johansson, and Yu. Kh. Vekilov, Phys.
Rev. B 57, 14673 (1998).367. John S. Tse, Zhiqiang Li, Kentaro Uehara, and Yanming Ma, Phys. Rev. B 69, 132101 (2004).368. V.V. Struzhkin, et al., Phys. Rev. Lett. 79, 4262 (1997).369. Z. Li and J.S. Tse, Phys. Rev. Lett. 85, 5130 (2000).370. G. Steinle-Neumann, L. Stixrude and R.E. Cohen, Phys. Rev. B 63, 054103 (2001).371. Ying Xu, Lijun Zhang, Tian Cui, Yan Li, Yu Xie, Wen Yu, Yanming Ma, and Guangtian
Zou, Phys. Rev. B 76, 214103 (2007).372. W. Petry, T. Flottmann, A. Heiming, J. Trampenau, M. Alba, and G. Vogl, Phys. Rev. Lett.
61, 722 (1988).373. J. Trampenau, W. Petry, A. Heiming, M. Alba, C. Herzig, H.R. Schober, Phys. Rev. B 43,
10963 (1991).374. G. Grimvall, J. Haglund, and A.F. Guillermet, Phys. Rev. B 47, 15338 (1993).375. S.Y. Savrasov and D.Y. Savrasov, Phys. Rev. B 54, 16487 (1996).376. B.N. Harmon and S.K. Sinha, Phys. Rev. B 16, 3919 (1977).377. O. Delaire and B. Fultz, Phys. Rev. Lett. 97, 245701 (2006).378. O. Delaire, T. Swan–Wood, and B. Fultz, Phys. Rev. Lett. 93, 185704 (2004).379. K.-M. Ho, C.-L. Fu, and B. N. Harmon, Phys. Rev. B 29, 1575 (1984).380. O. Delaire, M.S. Lucas, J.A. Munoz, M. Kresch, and B. Fultz, Phys. Rev. Lett. 101, 105504
(2008).381. P.B. Allen and J.C.K. Hui, Z. Phys. B 37, 33 (1980).382. N. Bock, D. Coffey, and D.C. Wallace, Phys. Rev. B 72, 155120 (2005).383. N. Bock, D.C. Wallace, and D. Coffey, Phys. Rev. B 73, 075114 (2006).384. N. Bock and D. Coffey, Phys. Rev. B 76, 174513 (2007).385. L. Koci, Y. Ma, A.R. Oganov, P. Souvatzis, and R. Ahuja, Phys. Rev. B. 77, 214101 (2008).386. B. Sadigh and V. Ozolins, Phys. Rev. B 57, 2793 (1998).387. P. Villars, Ed., ASM Alloy Phase Diagrams Center, web service of ASM Int’l, Materials Park,
OH, USA, 2007.388. B. Renker, K.B. Bohnen, R. Heid, D. Ernst, H. Schober, M. Koza, P. Adelmann, P. Schweiss,
T. Wolf, Phys. Rev. Lett. 88, 067001 (2002).389. T. Yildirim, O. Gulseren, J.W. Lynn, C.M. Brown, T.J. Udovic, Q. Huang, N. Rogado, K.A.
Regan, M.A. Hayward, J.S. Slusky, T. He, M.K. Haas, P. Khalifah, K. Inumaru, R.J. Cava,Phys. Rev. Lett. 87, 037001 (2001).

8/13/2019 Vibrational Thermodynamics
http://slidepdf.com/reader/full/vibrational-thermodynamics 139/145
Vibrational Thermodynamics of Materials 135
390. M. d’Astuto, M. Calandra, S. Reich, A. Shukla, M. Lazzeri, F. Mauri, J. Karpinski, N.D.Zhigadlo, A. Bossak, and M. Krisch, Phys. Rev. B 75, 174508 (2007).
391. K.-P. Bohnen, R. Heid, and B. Renker, Phys. Rev. Lett. 86, 5771 (2001).392. X.K. Chen, M.J. Konstantinovic, J.C. Irwin, D.D. Lawrie, J.P. Franck, Phys. Rev. Lett. 87,
157002 (2001).393. J.W. Quilty, S. Lee, A. Yamamoto, and S. Tajima, Physica C 38, 378 (2002).394. K.A. Yates, G. Burnell, N.A. Stelmashenko, D.-J. Kang, H.N. Lee, B. Oh, and M.G. Blamire,
Phys. Rev. B 68, 220512(R) (2003).395. A. Cottrell, Introduction to the Theory of Metals (Institute of Metals, London, 1988).396. L. S. Darken and R. W. Gurry, Physical Chemistry of Metals (McGraw-Hill, New York,
1953), p. 74.397. A. Hellman, B. Razaznejad, and B.I. Lundqvist, J. Chem. Phys. 130, 4593 (2004).398. P.H. Hahn, W.G. Schmidt, and F. Bechstedt, Phys. Rev. B 72, 245425 (2005).
8/13/2019 Vibrational Thermodynamics
http://slidepdf.com/reader/full/vibrational-thermodynamics 140/145
A2B, 62
A15, 62, 115activation barrier, 44adiabatic
electron-phonon interaction, 109adiabatic approximation, 42, 93adiabatic EPI
P,c,T, 118Ag-Ni, 46Ag/Fe/Ag, 82AgBr, 99AgGaSe2, 99Al, 48, 104, 105
alloys, 48Al2O3, 101
Al-Co, 50Al-Co-Ni, 50Al-Cu, 49Al-Hf, 50Al-Li, 23Al-Sc, 48Al-Si, 49Al-Ti, 13, 50Al-Zr, 25, 50AlCu, 51alkali halide, 22AlN-GaN, 64AlN-InN, 64aluminides, 52
anharmonic, 29anharmonicity, 29
cubic, 92heat capacity, 101quartic, 92
annihilation, 36atomic volume, 23, 62Au-Ni, 46Au-Pt, 63Au/Fe/Au, 82autocorrelation function, 42
B2, 51, 56B81, 51
Ba, 105Bader algorithm, 114barostat, 41bcc, 43, 104bcc metal, 102, 104, 106bcc structure, 74
2NN forces, 74binary alloy, 14binomial expansion, 15
Boltzmann, 1
bond length, 24bond lengths, 21bond proportion model, 13bond stiffness
chemical effects, 25bond stiffness vs. bond length model, 21Born approximation, 32Born–Oppenheimer approximation, 2, 93Born–von Karman model, 2, 60, 62Born-Mayer potential, 46Born-von Karman model, 54Bose-Einstein distribution, 35boson, 4boson peak, 81
Bragg–Williams approximation, 16, 18Bragg-Williams model, 56Brockhouse, 38bulk modulus, 27
CV , 27Cp, 27C-Li, 71Ca-Sr, 63CaF2, 99calorimeter, 31
accuracy, 32adiabatic, 31differential scanning, 32
drift, 31heat pulse, 31
CaO, 101Car–Parrinello algorithm, 42carbides, 47Ce, 30, 84
phases, 84chaos, 102charge transfer, 25chopper spectrometers, 38classical scattering, 37cluster expansion, 64cluster function, 65Co, 43
Co/Fe/Co, 82composite, 81computing power, 40computing resources, 124conceptual difficulties, 120configurational coordinates, 1configurational entropy, 45
nanostructure, 79constant Q scan, 39

8/13/2019 Vibrational Thermodynamics
http://slidepdf.com/reader/full/vibrational-thermodynamics 141/145
Vibrational Thermodynamics of Materials 137
continuum limit, 81convolution, 36Cooper pair, 90coordinates, 1
coordination number, 14correlation functionatom, 64
CoSe, 51Coulomb force, 107Cr, 30, 110
2NN forces, 107Cr/Fe/Cr, 82creation, 36critical point
solid state, 84critical temperature, 13, 14, 17, 43
change with ∆S vib, 13ordering, 20, 25, 53
unmixing, 14, 17CrS, 51CrSe, 51CrTe, 51Cu, 105Cu3Au, 57Cu-Fe, 46Cu/Fe/Cu, 82cubic term
symmetry, 97CuIn, 51CuSn, 51CuZn, 56CuZr, 51
D022, 77damped harmonic oscillator, 95Debye model, 11, 26Debye temperature, 57, 59Debye temperatures, 12Debye–Gruneisen approximation, 12Debye–Waller factor, 34, 52deformation potential, 94degrees of freedom
microstructure, 76density functional theory, 40deuterium vs. hydrogen, 69DFT calculations, 123
differential scanning calorimeter, 32diffusion, 44
entropy, 44dilation
electron energy, 94dilute solutions, 45dimensionality, 81direct method, 40disordered systems, 13
dispersions of excitations, 39dissipative process, 96DO3, 54double-differential cross-section, 37
dynamical coordinates, 1dynamical matrix, 8Dyson, 13
eigenvalues, 8eigenvectors, 8
of dynamical matrix, 8Einstein model, 10, 15, 46, 52, 56elastic anisotropy, 77elastic constants, 11, 81elastic energy, 27, 77, 79elastic scattering, 32electrochemical measurements, 70electron jack, 109
electron lifetime, 109electron-phonon coupling, 87, 104, 112temperature effect, 116
electron-phonon coupling parameter, 95electron-phonon interaction, 93, 95, 107electron-phonon interactions, 30, 88, 89electron-to-atom ratio, 122electronegativity, 25, 48, 63, 107, 114, 122electronic entropy, 28, 86electrons
independent, 40strongly-correlated, 40
Eliashberg coupling function, 95energy, 17
ensemble average, 34entropy, 17
crystal field, 86lithiation, 72magnetic, 76microstructure, 76phonon, 3spin fluctuations, 86
entropy of formation, 60entropy of mixing
negative, 113equations of motion, 7EXAFS, 52EXELFS, 52
experimental facilitiesfuture, 123, 124
f electrons, 84, 88Faraday, 71fcc, 43fcc metal, 102, 104, 105Fe, 81
nanocrystal, 82
8/13/2019 Vibrational Thermodynamics
http://slidepdf.com/reader/full/vibrational-thermodynamics 142/145
138 B. Fultz
Fe3Al, 52Fe-C, 73Fe-Cr, 66Fe-N, 47
Fe-Ni, 75FeCo, 56Fermi
chopper, 38golden rule, 97level, 111, 115pseudopotential, 33resonance, 101surface, 101, 107
topological transition, 109surface nesting, 109surface topology, 108, 119
Fermi surface, 76, 95pressure, 110
thermal smearing, 119fermion, 4fermion field operator, 94FeS, 51FeSe, 51FeSn, 51FeTe, 51force constants, 5four-phonon process, 92Frolich coupling, 95free energy
phonon, 3thermal expansion, 29
Friedel, 75
frozen phonon, 41, 100fuzzy sphere, 120
GaAs, 23GaN-InN, 64GaP, 23, 101Ge, 23, 30Gibbs, 1glass, 81Gruneisen parameter, 22, 24, 29grain boundary, 79graphite intercalation, 71Green’s function, 32Grossularite, 101
harmonic approximation, 4, 6, 29harmonic model, 2harmonic oscillator, 3hcp, 43, 104heat capacity, 25, 26, 101
quasiharmonic, 27Helmholtz free energy, 16Hf, 110
high temperaturesimportance of, 124
high-temperature limit, 4hole pocket, 109honon DOS
interaction, 64Hume–Rothery rules, 122hydrides, 69
independent electrons, 40inelastic scattering, 32InPt, 51InSb, 23instability eigenvector, 74interaction DOS, 65interaction partial DOS, 65interaction phonon DOS, 64interaction phonon partial entropy, 66interatomic force constants, 11intercalation, 70interchange energy, 14, 45intermetallic compound, 62internal stress, 78interstitial alloys, 68, 73interstitial O and N, 68Invar, 31irreversibility, 97Ising lattice, 14
ordering, 18isolated pockets, 120
K, 105KCl, 101
kinetic energy, 9, 93Kohn anomaly, 101, 109
L12, 54, 59, 62Al3Sc, 48
latent heat, 86lattice dynamics, 5, 6Laves phase, 49, 62Lennard-Jones solid, 92Li, 71Li battery, 71Li intercalation, 70LixCoO2, 71Li-C, 71
Li-H, 69local mode, 10long wavelength limit, 11long-range order, 18long-wavelength neutrons, 123Lorentzian function, 83Lorentzian lineshape, 96low-symmetry phase, 51lowering operator, 91
8/13/2019 Vibrational Thermodynamics
http://slidepdf.com/reader/full/vibrational-thermodynamics 143/145
Vibrational Thermodynamics of Materials 139
Lucas, 66
magnetic degrees of freedom, 31, 76magnon, 76martensite, 68, 73, 75, 106mass, 9, 62, 122metallic radius, 122Mg2SiO4, 101MgB2, 118MgO, 101microstructure, 76miscibility gap, 67Mo, 30, 100, 102, 105, 109, 110molecular dyanamics
quantum, 124molecular dynamics, 41Monte Carlo simulation, 20MSRD, 52multiphonon expansion, 36multiphonon scattering, 35
NaCl, 22nanostructure, 79
Fe-Ni, 85high-energy modes, 84low-energy modes, 80phonon broadening, 83
Nb, 109, 110Nb-Mo, 109, 110Nb-O, 69negative entropy of mixing, 113negative thermal expansion, 88neutron scattering, 32
triple axis spectrometer, 123neutron weighting, 37, 57neutron-weight
correction, 65Ni, 104Ni2MnGa, 76Ni3Al, 53Ni3V, 78Ni-Au, 62Ni-Cr, 62NiAs structure, 51NiS, 51NiTi, 75nitrides, 47
normal coordinates, 2, 90NRIXS, 53, 59, 82number operator, 91
one phonon scattering, 35
partial DOS, 8partition function, 3
configurational, 15
harmonic oscillator, 3ordering, 19
Pd3Fe, 62Pd3V, 78
Pd-V, 23Pd/Fe/Pd, 82PdSb, 51periodic boundary conditions, 7phase space, 102phonon
and lattice parameter, 55branches, 36damping, 83density of states, 4energy broadening, 96, 98energy shift, 96, 98entropy, 3extreme environments, 123
free energy, 3in multilayers, 83lifetime, 98self-consistent theory, 97thermodynamics, 29
phonon annihilation, 35phonon creation, 35phonon dispersion, 92phonon dispersions, 40, 123phonon DOS, 4, 8
neutron-weighted, 38phonon entropy, 27phonon field operator, 91phonon partial DOS, 8
phonon propagation, 13phonon-phonon interaction, 30phonon-phonon interactions, 89, 90Planck distribution, 3plastic deformation, 78polarization, 7polarizations, 8polymorphism, 43potential energy, 10, 93pressure, 13, 110Pt3Fe, 59, 62Pu, 87
phases, 87
Q information, 123quality factor, Q, 104quality factor, Q, 83quantum field theory
results, 92quantum oscillator
damping, 97quasicrystal, 50quasiharmonic, 29
8/13/2019 Vibrational Thermodynamics
http://slidepdf.com/reader/full/vibrational-thermodynamics 144/145
140 B. Fultz
reliability of theory, 103
raising operator, 91Raman spectrometry, 92Raman spectroscopy, 101, 118random solid solution, 14rare gas solid, 99Rayleigh mode, 80recoil energy, 36resonance mode, 10, 59Rh alloys, 63
scatteringcoherent, 34incoherent, 34quasielastic, 86
Schrodinger equation, 32screening, 107, 118second quantization, 91, 94
self-force constant, 6shape factor, 34shape memory alloy, 75
magnetic, 76Si, 23, 30, 49single crystals, 123Sm, 105small displacements, 6Sn, 23, 43soft mode, 74solid solution, 64solubility, 44, 45sphalerite, 23spin excitations, 1
spin fluctuations, 86spin variable, 64spinodal decomposition, 17, 67square lattice, 18Stirling approximation, 16strongly-correlated electrons, 40structure factor, 34sublattice, 18supercell method, 40superconductivity, 112, 118superconductor, 90superionic conductor, 99switch Hamiltonian, 42
Ta, 102Ta-N, 69Taylor series, 6theory
future, 123thermal conductivity, 92thermal electronic excitations, 89thermal energy, 36thermal excitations, 108
thermal expansion, 27, 78free energy, 29negative, 88
thermodynamicsphonon, 29
thermoelectric materials, 107thermostat, 41three-phonon process, 92, 95Ti, 104time average, 34timing, 38titanium compounds, 23TlBr, 99topological transition, 109transition metal, 118transition metals, 12twinning, 73
U, 78, 87phases, 87
umklapp process, 92universal potential curve, 105unmixing, 62
V, 30, 104, 110V alloys, 112V3Co, 115V3Ge, 115V3Si, 115V-Co, 111V-D, 69V-H, 69V-N, 69
V-Nb, 111V-Ni, 114V-O, 69V-Pd, 114V-Pt, 18, 111, 114V-X, 110van Hove
singularity, 80Van Hove correlation function, 35vanadium compounds, 23vandalized cage, 59variational method, 41vibrational entropy
multiple origins, 121
Vineyard, 44
W, 30, 102W-Re, 110waves
phases, 33wurtzite, 64
YB6, 110

8/13/2019 Vibrational Thermodynamics
http://slidepdf.com/reader/full/vibrational-thermodynamics 145/145
Vibrational Thermodynamics of Materials 141
Zener, 44, 56bcc hypothesis, 43
Zn, 110Zr, 100, 104, 110