victorian teacher supply and demand report 2017 ... · web viewvictorian teacher supply and demand...
TRANSCRIPT
VICTORIAN TEACHER SUPPLY AND DEMAND REPORT 2017 SUPPLEMENTARY APPENDIX
SUPPLEMENTARY APPENDIX

CONTENTSGeographical reference table by LGA...............................................................................................................6Geographical reference table by Department Area...........................................................................................7
A Initial teacher education application...................................................................................8Applications, offers and acceptances...............................................................................................8
Table 1.1: Victorian ITE course first preference applications, offers and acceptances (2007-2017), by course type.................................................................................................................................................................... 8
ATAR scores.........................................................................................................................................8Table 2.1: ATAR breakdown of initial teacher education, by year.....................................................................8Table 2.2: ATAR breakdown of initial teacher education (2016), by field of education......................................8
B Initial teacher education....................................................................................................10Undergraduate ITE enrolments........................................................................................................10
Table 3.1a: First year undergraduate enrolments at ITE providers (2017), by qualification type.....................10Table 3.1b: Second year undergraduate enrolments at ITE providers (2017), by qualification type................10Table 3.1c: Third year undergraduate enrolments at ITE providers (2017), by qualification type....................10Table 3.1d: Fourth year undergraduate enrolments at ITE providers (2017), by qualification type..................11Table 3.2: Undergraduate enrolments at ITE providers (2014-2017), by enrolment year and qualification type........................................................................................................................................................................ 11
Postgraduate ITE enrolments...........................................................................................................11Table 4.1a: First year postgraduate enrolments at ITE providers (2017), by qualification type.......................11Table 4.1b: Second year postgraduate enrolments at ITE providers (2017), by qualification type..................12Table 4.2: Postgraduate enrolments at ITE providers (2014-2017), by enrolment year and qualification type 12
ITE course subject specialisation....................................................................................................12Table 6.1a: Number of enrolled final year ITE students studying subject specialisations (2017), by ITE provider............................................................................................................................................................ 13
ITE course practicums......................................................................................................................16Table 7.1a: Number of practicums administered by ITE providers during the calendar year (2017), by educational setting........................................................................................................................................... 16Table 7.1b: Number of practicums administered by ITE providers during the calendar year (2017), by location........................................................................................................................................................................ 17Table 7.1c: Number of practicums administered by ITE providers during the calendar year (2017), by sector........................................................................................................................................................................ 17Table 7.1d: Number of practicums administered by ITE providers during the calendar year (2017), by delivery type.................................................................................................................................................................. 17Table 7.2a: Distribution of practicums administered by ITE providers (2014-2017), by educational setting....18Table 7.2b: Distribution of practicums administered by ITE providers (2014-2017), by location......................18Table 7.2c: Distribution of practicums administered by ITE providers (2014-2017), by sector........................18Table 7.2d: Distribution of practicums administered by ITE providers (2014-2017), delivery type...................18
C Graduation.......................................................................................................................... 19ITE course graduations.....................................................................................................................19
Table 8.1: Graduates from ITE providers (2017), by course level and qualification type.................................19Table 8.2: ITE graduates (2014-2017), by qualification type...........................................................................19
ITE graduate supply...........................................................................................................................20Table 9.1: Modelled available supply from ITE graduation (2012-2021), by qualification type........................20Table 9.2: Historically collected ITE graduate numbers, by educational setting..............................................20
ITE graduates - Employment outcomes and course experience..................................................20Table 9.3: Employed graduates by industry (2017), by course type................................................................20Table 9.4: Employment outcomes (2017), by course type...............................................................................20Table 9.5: Positive ratings of course experience metrics (2017), by course type............................................20
ITE graduates - Further study...........................................................................................................21Table 10.1: Further study outcomes compared with employment outcomes (2017)........................................21Table 10.2: Next qualification level of further study (2017), by course type.....................................................21Table 10.3: Chosen field of education of further study (2017), by course type................................................21
ITE graduates - Longitudinal employment outcomes and further study......................................22Table 11.1: Employment and further study outcomes, by year........................................................................22
Victorian Teacher Supply and Demand Report 2017 SUPPLEMENTARY APPENDIX 2

Table 11.2: Further study field of education, by year.......................................................................................22Table 11.3: Employment destination, by year..................................................................................................22
D Registration.........................................................................................................................23Registration characteristics - Registered teachers........................................................................23
Table 12.1: Registration type of registered teachers (2017), by sector............................................................23Table 12.2: Registration type of registered teachers (2017), by ITE qualification course length.....................23
Registration characteristics - Demographic characteristics.........................................................23Table 13.1: Age distribution of early childhood teachers (2017)......................................................................23Table 13.2: Age distribution of returning teachers from non-practising registration (2017)..............................23Table 13.3: Age distribution of ceased or expired registration (2017)..............................................................23
E Recruitment.........................................................................................................................25Vacancies and Applications.............................................................................................................25
Table 14.1: Vacancies, applications and application rate for the Victorian government teaching workforce (2017), by LGA................................................................................................................................................ 25Table 14.2: Vacancies and no appointment rate by subject area....................................................................25
Recruitment challenges - No appointments....................................................................................26Table 15.1: No appointment rate (2017), by department area.........................................................................26Table 15.2: No appointment rate (2017), by employment classification...........................................................26Table 15.3: No appointment rate (2017), by school type.................................................................................26
F Victorian workforce............................................................................................................27Victorian teaching workforce............................................................................................................27
Table 16.1: Number of FTE teaching staff in Victorian primary schools, by sector..........................................27Table 16.2: Number of FTE teaching staff in Victorian secondary schools, by sector.....................................27
Government funded kindergarten program workforce..................................................................27Table 17.1: Actual (2007-2017) and forecast (2018-2023) demand for Victorian government funded kindergarten program teachers........................................................................................................................ 27Table 17.2 Additional teachers forecast to be required due to the introduction of the universal three year-old kindergarten initiative....................................................................................................................................... 28Table 17.3: Age distribution of government funded kindergarten program workforce (2017).........................28Table 17.4: Working hour distribution of government funded kindergarten program workforce (2017)..........28
Long day care workforce..................................................................................................................28Analysis assumptions for long day care...........................................................................................................28Table 18.1: Actual (2014-2017) and forecast (2018-2023) FTE teacher requirement at unfunded long day care, by maximum number of approved places...............................................................................................29Table 18.2: Extra 2020 FTE teacher requirement at funded long day care with 60-80 maximum approved places.............................................................................................................................................................. 30Table 18.3: Extra 2020 FTE teacher requirement at funded long day care with >80 maximum approved places.............................................................................................................................................................. 31
Primary teaching workforce..............................................................................................................33Table 19.1: Actual (2007-2017) and forecast (2018-2023) headcount demand for teachers at Victorian primary schools, by sector............................................................................................................................... 33Table 19.2: Actual (2007-2017) and forecast (2018-2023) student to teacher ratios (headcount) at Victorian primary schools, by sector............................................................................................................................... 33
Secondary teaching workforce.........................................................................................................34Table 20.1: Actual (2007-2017) and forecast (2017-2023) headcount demand for teachers at Victorian secondary schools, by sector.......................................................................................................................... 34Table 20.2: Actual (2007-2017) and forecast (2018-2023) student to teacher ratios (headcount) at Victorian secondary schools by sector........................................................................................................................... 34
Special and EAL teaching workforce...............................................................................................35Table 21.1: Actual (2007-2017) and forecast (2017-2023) headcount demand for teachers at Victorian special schools, by sector............................................................................................................................................ 35Table 21.2: Actual (2007-2017) and forecast (2018-2023) headcount demand for teachers at Victorian EAL schools............................................................................................................................................................ 35
G Government workforce......................................................................................................36Government teacher - Demographic characteristics.....................................................................36
Table 22.1: Government teacher headcount (2017), by LGA..........................................................................36
Victorian Teacher Supply and Demand Report 2017 SUPPLEMENTARY APPENDIX 3

Table 22.2: Age distribution of active government teaching workforce (2017), by gender...............................36
Government teacher - Employment characteristics.......................................................................36Table 23.1: Employment classification of the active government workforce (2017), by educational setting....37Table 23.2: Time fraction employment of the active government workforce (2017), by educational setting....37Table 23.3: Employment type of the active government workforce (2017), by educational setting..................37
Government graduate teachers - Employment and demographic characteristics.....................37Table 24.1: Victorian government graduate teachers (2017) by LGA, full time, employment, and by educational setting........................................................................................................................................... 37Table 24.2: Age distribution of government graduate teaching workforce (2017), by gender..........................39
Government graduate teachers - Qualification characteristics....................................................39Table 25.1: Subject specialisation of Victorian government graduate teachers (2017), by qualification name 39Table 25.2: Year of graduation of Victorian government graduate teachers (2017), by qualification name.....39Table 25.3: Location of graduation of Victorian government graduate teachers (2017), by qualification type. 39
Government Casual Relief Teachers...............................................................................................40Table 26.1: Victorian government casual relief teacher numbers (2017), by LGA...........................................40Table 26.2: Victorian government casual relief teacher numbers, by year......................................................40Table 26.3: Victorian government casual relief teacher difficult to fill vacancies..............................................40
Student Family Occupation Education Index (SFOE)....................................................................41Table 27.1: Attrition by SFOE quartile.............................................................................................................41Table 27.2: Application rate by SFOE quartile.................................................................................................42Table 27.3: No appointment rate by SFOE quartile.........................................................................................42Table 27.4: Percentage of teachers who are graduates by SFOE quartile......................................................42Table 27.5: Number of schools by SFOE quartile............................................................................................42Table 27.6: Number of teachers by SFOE quartile..........................................................................................42Table 27.7: Average FTE student/ teacher ratio..............................................................................................42
H Catholic workforce.............................................................................................................43Demographic characteristics............................................................................................................43
Table 28.1: Number of FTE Catholic teachers (2017), by department area....................................................43Table 28.2: Age distribution of Catholic workforce (2017)..................................Error! Bookmark not defined.
Employment characteristics.............................................................................................................44Table 29.1: Employment classification of the Catholic teaching workforce (2017)..........................................44Table 29.2: Time fraction employment of Catholic teaching workforce (2017), by gender...............................44Table 29.3: Employment type of Catholic teaching workforce (2017)..............................................................44Table 29.4: School curriculum of Catholic teaching workforce (2017), by gender...........................................44
I Independent school workforce...........................................................................................45Employment characteristics.............................................................................................................45
Table 30.1: Independent school workforce by school type..............................................................................45Table 30.2: Independent school workforce by school type..............................................................................45Table 30.3: Independent school workforce by gender.....................................................................................45Table 30.4: Independent school workforce by age bands................................................................................45
J Attrition................................................................................................................................45Government workforce attrition.......................................................................................................45
Table 31.1: Victorian government workforce attrition (2017), by LGA.............................................................45Table 31.2: Victorian government workforce attrition (2017), by employment type.........................................46Table 31.3: Victorian government workforce attrition (2017), by age...............................................................46Table 31.4: Victorian government resignations and retirement rate by gender................................................46Table 31.5: Victorian government resignations and retirement rate by time fraction.......................................46Table 31.6: Victorian government resignations and retirement rate by geographic remoteness.....................46Table 31.7: Victorian government resignations and retirement rate by school type.........................................47Table 31.8: Victorian government resignations and retirement rate by age band............................................47Table 31.9: Victorian government workforce attrition (2017), by year..............................................................47
Catholic workforce attrition..............................................................................................................47Table 32.1: Catholic workforce attrition (2017), by department area...............................................................47Table 32.3: Catholic workforce attrition (2017), by employment type..............................................................47Table 32.4: Catholic workforce attrition (2017), by age....................................................................................48Table 32.5: Catholic workforce attrition (2017), by year...................................................................................48
K Early childhood...................................................................................................................49Victorian Teacher Supply and Demand Report 2017 SUPPLEMENTARY APPENDIX 4

Kindergarten enrolments..................................................................................................................49Table 33.1: Actual (2007-2017) and forecast (2018-2023) child enrolments in Victorian government funded kindergarten programs and early start kindergarten........................................................................................49Table 33.2: Additional enrolments forecast due to the introduction of the universal three year-old kindergarten initiative....................................................................................................................................... 49Table 33.3: Child enrolments in government funded kindergarten programs (2017), including early start kindergarten, by LGA....................................................................................................................................... 49
L Primary students.................................................................................................................51Primary student enrolments.............................................................................................................51
Table 34.1: Actual (2007-2017) and forecast (2018-2023) student enrolments at Victorian primary schools, by sector............................................................................................................................................................... 51Table 34.2: 2017 FTE student enrolments at Victorian primary schools, by LGA............................................51
M Secondary students...........................................................................................................52Secondary student enrolments........................................................................................................52
Table 35.1: Actual (2007-2017) and forecast (2018-2023) student enrolments at Victorian secondary schools, by sector.......................................................................................................................................................... 52Table 35.2: 2017 FTE student enrolments at Victorian secondary schools, by LGA.......................................52
N Special students.................................................................................................................53Special student enrolments..............................................................................................................53
Table 36.1: Actual (2007-2017) and forecast (2018-2023) student enrolments at Victorian special schools, by sector............................................................................................................................................................... 53Table 36.2: 2017 FTE student enrolments at Victorian special schools, by LGA.............................................53
O EAL students......................................................................................................................55EAL student enrolments....................................................................................................................55
Table 37.1: Actual (2007-2017) and forecast (2018-2023) student enrolments at Victorian EAL schools, by sector............................................................................................................................................................... 55Table 37.2: 2017 FTE student enrolments at Victorian EAL schools, by LGA.................................................55
P Supply and demand............................................................................................................57Total teacher supply and demand....................................................................................................57
Table 38.1: Forecast additional supply of all available teachers, by supply source.........................................57Analysis notes for supply pipeline forecasting.................................................................................................57Table 38.2: Forecast additional teacher demand, by educational setting........................................................57
Early childhood teacher supply and demand.................................................................................58Table 39.1: Forecast additional supply of available early childhood teachers, by supply source.....................58Table 39.2: Forecast additional early childhood teacher demand....................................................................58
Primary teacher supply and demand...............................................................................................59Table 40.1: Forecast additional supply of available primary teachers, by supply source.................................59Table 40.2: Forecast additional primary school teacher demand....................................................................59
Secondary teacher supply and demand..........................................................................................60Table 41.1: Forecast additional supply of available secondary teachers, by supply source............................60Table 41.2: Forecast additional secondary school teacher demand................................................................60
Victorian Teacher Supply and Demand Report 2017 SUPPLEMENTARY APPENDIX 5

Geographical reference table by LGAThe following reference table outlines the department area and ABS geographic remoteness classes corresponding to each local government area. This table has been sorted alphabetically by local government area.
LGA Department Area ABS Geographic Remoteness LGA Department Area ABS Geographic
RemotenessAlpine Ovens Murray Outer Regional Mansfield Ovens Murray Outer Regional
Ararat Central Highlands Inner Regional Maribyrnong Western Melbourne Major City
Ballarat Central Highlands Inner Regional Maroondah Outer Eastern Melbourne Major City
Banyule North Eastern Melbourne Major City Melbourne Western
Melbourne Major City
Bass Coast Inner Gippsland Inner Regional Melton Brimbank Melton Major CityBaw Baw Inner Gippsland Inner Regional Mildura Mallee Outer Regional
Bayside Bayside Peninsula Major City Mitchell Goulburn Inner Regional
Benalla Ovens Murray Inner Regional Moira Goulburn Inner Regional
Boroondara Inner Eastern Melbourne Major City Monash Inner Eastern
Melbourne Major City
Brimbank Brimbank Melton Major City Moonee Valley Western Melbourne Major City
Buloke Mallee Outer Regional Moorabool Central Highlands Inner RegionalCampaspe Loddon Inner Regional Moreland Hume Moreland Major City
Cardinia Southern Melbourne Major City Mornington
Peninsula Bayside Peninsula Major City
Casey Southern Melbourne Major City Mount Alexander Loddon Inner Regional
Central Goldfields Loddon Inner Regional Moyne Wimmera South West Inner Regional
Colac-Otway Barwon Inner Regional Murrindindi Goulburn Inner Regional
Corangamite Wimmera South West Inner Regional Nillumbik North Eastern
Melbourne Major City
Darebin North Eastern Melbourne Major City Northern
Grampians Wimmera South West Outer Regional
East Gippsland Outer Gippsland Remote Port Phillip Bayside Peninsula Major City
Frankston Bayside Peninsula Major City Pyrenees Central Highlands Inner Regional
Gannawarra Mallee Outer Regional Queenscliffe Barwon Inner Regional
Glen Eira Bayside Peninsula Major City South Gippsland Inner Gippsland Inner Regional
Glenelg Wimmera South West Outer Regional Southern
Grampians Wimmera South West Outer Regional
Golden Plains Central Highlands Inner Regional Stonnington Bayside Peninsula Major City
Greater Bendigo Loddon Inner Regional Strathbogie Goulburn Inner RegionalGreater Dandenong
Southern Melbourne Major City Surf Coast Barwon Inner Regional
Greater Geelong Barwon Major City Swan Hill Mallee Outer RegionalGreater Shepparton Goulburn Inner Regional Towong Ovens Murray Outer Regional
Hepburn Central Highlands Inner Regional Unincorporated Vic Inner Gippsland Outer Regional
Hindmarsh Wimmera South West Remote Wangaratta Ovens Murray Inner Regional
Hobsons Bay Western Melbourne Major City Warrnambool Wimmera South
West Inner Regional
Horsham Wimmera South West Outer Regional Wellington Outer Gippsland Inner Regional
Hume Hume Moreland Major City West Wimmera Wimmera South West Outer Regional
Indigo Ovens Murray Inner Regional Whitehorse Inner Eastern Melbourne Major City
LGA Department Area ABS Geographic Remoteness LGA Department Area ABS Geographic
Remoteness
Kingston Bayside Peninsula Major City Whittlesea North Eastern
Melbourne Major City
Knox Outer Eastern Melbourne Major City Wodonga Ovens Murray Inner Regional
Latrobe Inner Gippsland Inner Regional Wyndham Western Major City
Victorian Teacher Supply and Demand Report 2017 SUPPLEMENTARY APPENDIX 6

LGA Department Area ABS Geographic Remoteness LGA Department Area ABS Geographic
RemotenessMelbourne
Loddon Loddon Inner Regional Yarra North Eastern Melbourne Major City
Macedon Ranges Loddon Inner Regional Yarra Ranges Outer Eastern Melbourne Major City
Manningham Inner Eastern Melbourne Major City Yarriambiack Wimmera South
West Remote
Geographical reference table by Department AreaThe following reference table outlines the department area and ABS geographic remoteness classes corresponding to each local government area. This table has been sorted alphabetically by department area.
LGA Department Area ABS Geographic Remoteness LGA Department Area ABS Geographic
RemotenessColac-Otway Barwon Inner Regional Mount Alexander Loddon Inner RegionalGreater Geelong Barwon Major City Buloke Mallee Outer RegionalQueenscliffe Barwon Inner Regional Gannawarra Mallee Outer RegionalSurf Coast Barwon Inner Regional Mildura Mallee Outer RegionalBayside Bayside
PeninsulaMajor City Swan Hill Mallee Outer Regional
Frankston Bayside Peninsula
Major City Banyule North Eastern Melbourne
Major City
Glen Eira Bayside Peninsula
Major City Darebin North Eastern Melbourne
Major City
Kingston Bayside Peninsula
Major City Nillumbik North Eastern Melbourne
Major City
Mornington Peninsula
Bayside Peninsula
Major City Whittlesea North Eastern Melbourne
Major City
Port Phillip Bayside Peninsula
Major City Yarra North Eastern Melbourne
Major City
Stonnington Bayside Peninsula
Major City Knox Outer Eastern Melbourne
Major City
Brimbank Brimbank Melton Major City Maroondah Outer Eastern Melbourne
Major City
Melton Brimbank Melton Major City Yarra Ranges Outer Eastern Melbourne
Major City
Ararat Central Highlands Inner Regional East Gippsland Outer Gippsland RemoteBallarat Central Highlands Inner Regional Wellington Outer Gippsland Inner RegionalGolden Plains Central Highlands Inner Regional Alpine Ovens Murray Outer RegionalHepburn Central Highlands Inner Regional Benalla Ovens Murray Inner RegionalMoorabool Central Highlands Inner Regional Indigo Ovens Murray Inner RegionalPyrenees Central Highlands Inner Regional Mansfield Ovens Murray Outer RegionalGreater Shepparton
Goulburn Inner Regional Towong Ovens Murray Outer Regional
Mitchell Goulburn Inner Regional Wangaratta Ovens Murray Inner RegionalMoira Goulburn Inner Regional Wodonga Ovens Murray Inner RegionalMurrindindi Goulburn Inner Regional Cardinia Southern
MelbourneMajor City
Strathbogie Goulburn Inner Regional Casey Southern Melbourne
Major City
Hume Hume Moreland Major City Greater Dandenong
Southern Melbourne
Major City
Moreland Hume Moreland Major City Corangamite Wimmera South West
Inner Regional
Boroondara Inner Eastern Melbourne
Major City Glenelg Wimmera South West
Outer Regional
Manningham Inner Eastern Melbourne
Major City Hindmarsh Wimmera South West
Remote
Monash Inner Eastern Melbourne
Major City Horsham Wimmera South West
Outer Regional
Whitehorse Inner Eastern Melbourne
Major City Moyne Wimmera South West
Inner Regional
Bass Coast Inner Gippsland Inner Regional Northern Grampians
Wimmera South West
Outer Regional
Baw Baw Inner Gippsland Inner Regional Southern Grampians
Wimmera South West
Outer Regional
Latrobe Inner Gippsland Inner Regional Warrnambool Wimmera South West
Inner Regional
Victorian Teacher Supply and Demand Report 2017 SUPPLEMENTARY APPENDIX 7

LGA Department Area ABS Geographic Remoteness LGA Department Area ABS Geographic
RemotenessSouth Gippsland Inner Gippsland Inner Regional West Wimmera Wimmera South
WestOuter Regional
Unincorporated Vic
Inner Gippsland Outer Regional Yarriambiack Wimmera South West
Remote
Campaspe Loddon Inner Regional Hobsons Bay Western Melbourne
Major City
Central Goldfields Loddon Inner Regional Maribyrnong Western Melbourne
Major City
Greater Bendigo Loddon Inner Regional Melbourne Western Melbourne
Major City
Loddon Loddon Inner Regional Moonee Valley Western Melbourne
Major City
Macedon Ranges Loddon Inner Regional Wyndham Western Melbourne
Major City
A Initial teacher education applicationApplications, offers and acceptancesThe following reference table provides an overview of the number of first preference applications, offers and acceptances to Victorian initial teacher education (ITE) courses between 2007 and 2017. This data is available publicly from the Victorian Tertiary Admissions Centre (VTAC).
Table 1.1: Victorian ITE course first preference applications, offers and acceptances (2007-2017), by course type
YearFirst
Preference Applications - Undergraduate
First Preference
applications - Postgraduate
Total Offers -Undergraduate
Total Offers - Postgraduate
Acceptances -Undergraduate
Acceptances - Postgraduate
2007 6,122 4,045 3,750 3,385 2,613 2,2892008 5,653 3,437 3,445 2,890 2,362 1,8722009 5,778 3,622 3,856 2,832 2,660 1,8632010 6,514 4,763 4,279 3,597 2,915 2,2732011 6,283 4,468 4,772 3,397 3,502 2,1272012 6,330 4,412 5,323 3,688 3,893 2,3382013 6,439 4,874 5,684 4,018 4,144 2,5092014 7,049 4,395 5,593 3,741 4,667 2,6222015 4,372 3,753 4,116 3,143 3,294 2,5462016 3,448 2,795 3,169 2,608 2,569 2,1142017 4,615 386 3,924 1,474 2,995 1,125
ATAR scoresThe following reference table provides an overview of the ATAR breakdown of students admitted to ITE courses in Victoria between 2012 and 2016 on a secondary basis of admission. This data was sourced from the AU DET’s ‘Higher education statistics data set,’ with ITE courses labelled as ‘Teacher Education’
Table 2.1: ATAR breakdown of initial teacher education, by year
Year <60 60-69.99 70-79.99 80-100 ATAR not available
2012 434 339 367 394 3542013 581 398 374 374 3122014 532 357 343 483 5442015 517 284 276 445 4812016 524 258 325 462 396
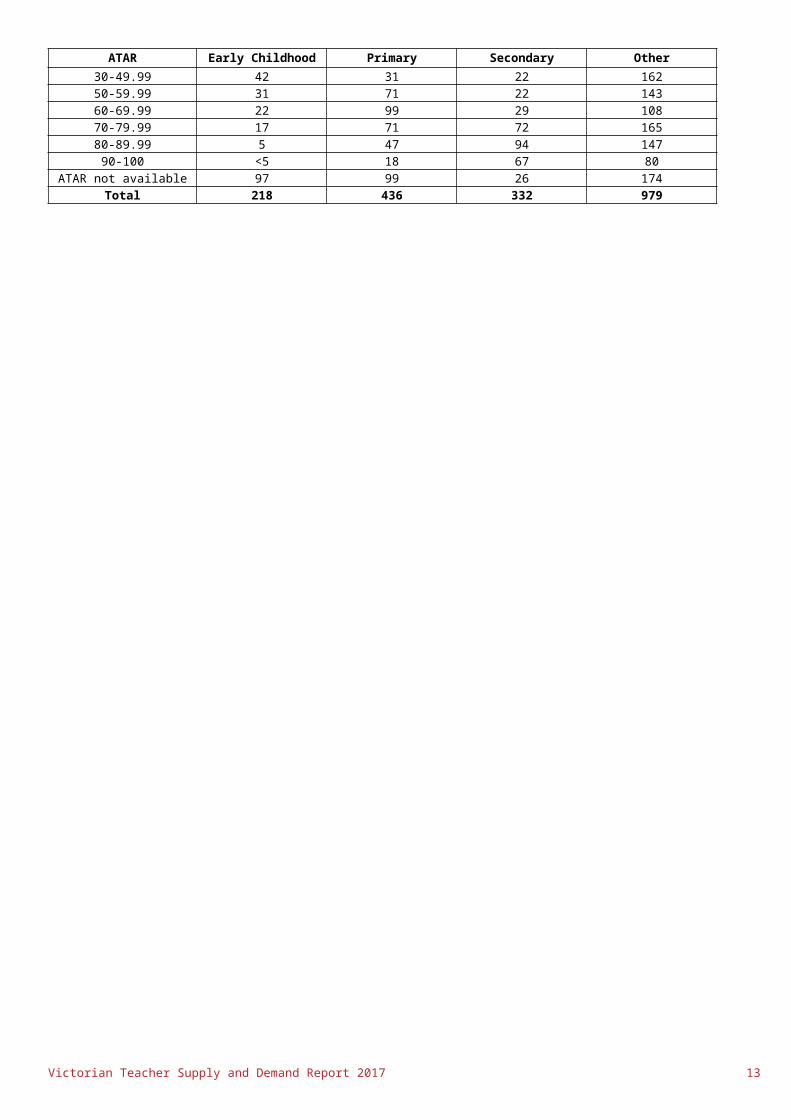
The following reference table provides an overview of the ATAR breakdown of students admitted to ITE courses in Victoria in 2016 on a secondary basis of admission. This data was sourced from the AU DET’s ‘Higher education statistics data set,’ with ITE courses labelled as ‘Teacher Education’
Table 2.2: ATAR breakdown of initial teacher education (2016), by field of educationATAR Early Childhood Primary Secondary Other
30-49.99 42 31 22 16250-59.99 31 71 22 14360-69.99 22 99 29 10870-79.99 17 71 72 16580-89.99 5 47 94 14790-100 <5 18 67 80
ATAR not available 97 99 26 174
Victorian Teacher Supply and Demand Report 2017 SUPPLEMENTARY APPENDIX 8

ATAR Early Childhood Primary Secondary OtherTotal 218 436 332 979
Victorian Teacher Supply and Demand Report 2017 SUPPLEMENTARY APPENDIX 9

B Initial teacher educationUndergraduate ITE enrolmentsThe following four reference tables provide an overview of the number of first, second, third and fourth year undergraduate enrolments at Victorian ITE providers and interstate online ITE providers with enrolled Victorian students in 2017. Enrolments across the different provider courses have been aggregated into qualification types. Only ITE providers which reported students in the given enrolment years have been included in the corresponding tables. This data was sourced directly from the ITE providers. Table 3.1a: First year undergraduate enrolments at ITE providers (2017), by qualification type
ITE ProviderEarly Childhood
Early Childhood / Primary Primary
Primary / Secondary Secondary
ACU <5 96 245 <5 241CDU <5 <5 23 2 10CQU <5 <5 <5 <5 <5CSU <5 27 91 27 13Curtin 48 <5 214 <5 <5Deakin 208 <5 331 <5 267Eastern College <5 <5 5 <5 <5ECU <5 <5 <5 <5 <5Federation <5 99 123 64 137Holmesglen <5 17 <5 <5 <5La Trobe 78 5 61 6 63Melbourne Polytechnic <5 8 <5 <5 <5Monash <5 61 102 159 250RMIT <5 30 103 <5 <5Swinburne 411 <5 997 <5 50UTas 7 <5 58 11 <5VU <5 240 <5 400 <5Total 762 584 2,355 669 1,035
Table 3.1b: Second year undergraduate enrolments at ITE providers (2017), by qualification type
ITE Provider Early ChildhoodEarly Childhood / Primary Primary
Primary / Secondary Secondary
ACU <5 87 273 <5 211CSU <5 125 238 125 24Deakin 189 <5 482 <5 99Eastern College <5 <5 <5 <5Federation 8 38 101 9 85Holmesglen <5 27 <5 <5 <5La Trobe 25 20 115 31 122Melbourne Polytechnic <5 6 <5 <5 <5Monash <5 90 118 132 281RMIT <5 33 130 36 <5Swinburne 325 <5 548 <5 61VU <5 115 <5 245 <5Total 547 541 2,007 578 884
Table 3.1c: Third year undergraduate enrolments at ITE providers (2017), by qualification typeITE provider Early Childhood Early Childhood / Primary Primary Primary / Secondary SecondaryACU <5 75 170 <5 79Deakin 288 <5 573 <5 98Eastern College <5 <5 <5 <5 <5Federation 10 28 83 15 83Holmesglen <5 30 <5 <5 <5La Trobe 62 <5 101 172 153Melbourne Polytechnic <5 13 <5 <5 <5Monash <5 69 119 157 218RMIT <5 38 92 40 <5Swinburne 126 <5 208 <5 15VU <5 100 <5 332 <5
Victorian Teacher Supply and Demand Report 2017 SUPPLEMENTARY APPENDIX 10

Total 486 352 1,346 716 649
Table 3.1d: Fourth year undergraduate enrolments at ITE providers (2017), by qualification type
ITE Provider Early ChildhoodEarly Childhood / Primary Primary
Primary / Secondary Secondary
ACU <5 91 162 <5 52Deakin 205 <5 511 <5 87Eastern College <5 <5 <5 <5 <5Federation <5 11 124 8 66Holmesglen <5 22 <5 <5 <5La Trobe 79 <5 163 315 193Melbourne Polytechnic <5 10 <5 <5 <5Monash <5 79 88 153 199RMIT <5 44 201 92 <5Swinburne 27 <5 75 <5 <5VU <5 90 <5 344 <5Total 314 347 1,323 912 599
The following reference tables provide an overview of the undergraduate enrolment numbers at Victorian ITE providers and interstate providers with Victorian-based students during the 2014-2017 calendar years. The enrolments are broken down by enrolment year and qualification type. This data was sourced directly from the ITE providers. Note, annual differences in the data collection methodology, courses offered and the response rate from ITE providers limit the ability to accurately compare across calendar years. As such, the enrolment numbers should be considered as indicative of the trend.
Table 3.2: Undergraduate enrolments at ITE providers (2014-2017), by enrolment year and qualification type
Calendar Year Enrolment Year
Early Childhood
Early Childhood /
primaryPrimary Primary /
Secondary Secondary
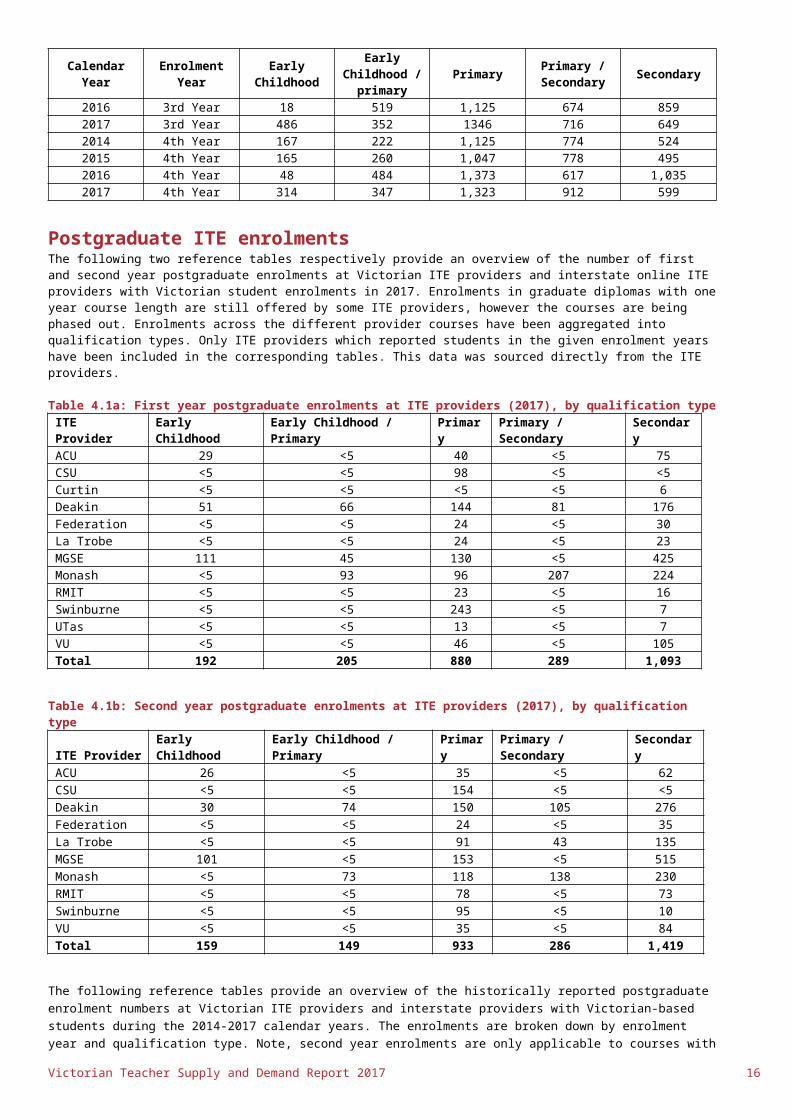
2014 1st Year 684 524 2,176 1,248 7672015 1st Year 520 587 2,155 990 8482016 1st Year 644 763 2,304 800 7872017 1st Year 762 584 2,355 669 1,0352014 2nd Year 617 369 1,586 1,022 7982015 2nd Year 443 630 1,717 1,089 7142016 2nd Year 215 673 1,758 576 8712017 2nd Year 547 541 2,007 578 8842014 3rd Year 490 244 1,196 779 5812015 3rd Year 619 418 1,355 872 6972016 3rd Year 18 519 1,125 674 8592017 3rd Year 486 352 1346 716 6492014 4th Year 167 222 1,125 774 5242015 4th Year 165 260 1,047 778 4952016 4th Year 48 484 1,373 617 1,0352017 4th Year 314 347 1,323 912 599
Postgraduate ITE enrolments The following two reference tables respectively provide an overview of the number of first and second year postgraduate enrolments at Victorian ITE providers and interstate online ITE providers with Victorian student enrolments in 2017. Enrolments in graduate diplomas with one year course length are still offered by some ITE providers, however the courses are being phased out. Enrolments across the different provider courses have been aggregated into qualification types. Only ITE providers which reported students in the given enrolment years have been included in the corresponding tables. This data was sourced directly from the ITE providers.
Table 4.1a: First year postgraduate enrolments at ITE providers (2017), by qualification typeITE Provider Early Childhood Early Childhood / Primary Primary Primary / Secondary SecondaryACU 29 <5 40 <5 75CSU <5 <5 98 <5 <5Curtin <5 <5 <5 <5 6Deakin 51 66 144 81 176Federation <5 <5 24 <5 30La Trobe <5 <5 24 <5 23MGSE 111 45 130 <5 425Monash <5 93 96 207 224RMIT <5 <5 23 <5 16
Victorian Teacher Supply and Demand Report 2017 SUPPLEMENTARY APPENDIX 11

Swinburne <5 <5 243 <5 7UTas <5 <5 13 <5 7VU <5 <5 46 <5 105Total 192 205 880 289 1,093
Table 4.1b: Second year postgraduate enrolments at ITE providers (2017), by qualification typeITE Provider Early Childhood Early Childhood / Primary Primary Primary / Secondary SecondaryACU 26 <5 35 <5 62CSU <5 <5 154 <5 <5Deakin 30 74 150 105 276Federation <5 <5 24 <5 35La Trobe <5 <5 91 43 135MGSE 101 <5 153 <5 515Monash <5 73 118 138 230RMIT <5 <5 78 <5 73Swinburne <5 <5 95 <5 10VU <5 <5 35 <5 84Total 159 149 933 286 1,419
The following reference tables provide an overview of the historically reported postgraduate enrolment numbers at Victorian ITE providers and interstate providers with Victorian-based students during the 2014-2017 calendar years. The enrolments are broken down by enrolment year and qualification type. Note, second year enrolments are only applicable to courses with length of greater than one year. This data was sourced directly from the ITE providers. Note, annual differences in the data collection methodology, courses offered and the response rate from ITE providers limit the ability to accurately compare across calendar years. For example, the graduate diploma was phased out by ITE providers during this period. As such, the enrolment numbers should be considered as indicative of the trend.
Table 4.2: Postgraduate enrolments at ITE providers (2014-2017), by enrolment year and qualification type
Calendar Year Enrolment Year
Early Childhood
Early Childhood /
PrimaryPrimary Primary /
Secondary Secondary
2014 1st Year 126 <5 1,542 213 1,8742015 1st Year 88 74 1,176 337 1,4582016 1st Year 36 129 1,366 395 1,2022017 1st Year 192 205 880 289 1,0932014 2nd Year 118 <5 604 24 4542015 2nd Year 122 5 718 135 5572016 2nd Year 44 144 777 287 1,2622017 2nd Year 159 149 933 286 1,419
ITE course subject specialisation The following reference table provides an overview of the subject specialisations studied by final year enrolments at Victorian ITE providers and interstate online ITE providers, who enrolled Victorian students in 2017. This data was sourced directly from the ITE providers, which include: Australian Catholic University (ACU), Charles Darwin University (CDU), Central Queensland University (CQU), Charles Sturt University (CSU), Deakin, Eastern College, Federation, La Trobe, Melbourne Graduate School of Education (MGSE), Monash, RMIT, University of Tasmania (UTAS) and Victoria University (VU).
SubjectVCAA Subject Area
ACU CDU CQU CSU Deakin Eastern College Federation La
Trobe MGSE Monash RMIT VU
Accounting
Humanities- Economics and business
<5 <5 <5 <5 <5 <5 <5 <5 <5 33 <5 <5
Arabic Languages <5 <5 <5 <5 <5 <5 <5 <5 <5 <5 <5 <5
Art/ Visual Arts
Arts-Media and visual 14 <5 <5 <5 29 <5 <5 6 <5 25 <5 38
Art/visual Arts (Double)
Arts-Media and visual <5 <5 <5 <5 <5 <5 17 <5 <5 <5 <5 <5
Auslan Languages <5 <5 <5 <5 <5 <5 <5 <5 <5 <5 <5 <5
Victorian Teacher Supply and Demand Report 2017 SUPPLEMENTARY APPENDIX 12
SubjectVCAA Subject Area
ACU CDU CQU CSU Deakin Eastern College Federation La
Trobe MGSE Monash RMIT VU
Biology Science <5 <5 <5 <5 74 <5 5 8 <5 56 <5 9
Business
Humanities- Economics and business
5 <5 <5 <5 15 <5 <5 <5 <5 35 <5 19
Business Studies
Humanities- Economics and business
<5 <5 <5 <5 <5 <5 <5 <5 <5 <5 <5 <5
Business studies-double
Humanities- Economics and business
<5 <5 <5 <5 <5 <5 <5 <5 <5 <5 <5 <5
Chemistry Science <5 <5 <5 <5 29 <5 <5 <5 <5 37 <5 <5
Chinese Languages <5 <5 <5 <5 <5 <5 <5 <5 <5 <5 <5 <5
Commerce & Bus. Studies
Humanities- Economics and business
<5 <5 <5 <5 <5 <5 <5 <5 <5 <5 <5 <5
Commercial studies
Humanities- Economics and business
<5 <5 <5 <5 <5 <5 <5 <5 <5 <5 <5 <5
Computer Studies/ Information Technology
Digital technology <5 <5 <5 <5 <5 <5 <5 <5 <5 7 <5 <5
Table 6.1a: Number of enrolled final year ITE students studying subject specialisations (2017), by ITE provider
SubjectVCAA
Subject Area
ACU CDU CQU CSU Deakin Eastern College Federation La
Trobe MGSE Monash RMIT VU
DancePerforming arts/music <5 <5 <5 <5 11 <5 <5 <5 <5 <5 <5 <5
Digital Technologies
Digital technology <5 <5 <5 <5 <5 <5 <5 <5 <5 <5 <5 <5
DramaPerforming arts/music <5 <5 <5 <5 26 <5 <5 <5 <5 10 <5 <5
Earth Science Science <5 <5 <5 <5 <5 <5 <5 <5 <5 <5 <5 <5
Economics
Humanities- Economics and business
<5 <5 <5 <5 <5 <5 <5 <5 <5 23 <5 <5
English English 33 <5 <5 <5 104 <5 37 38 <5 66 <5 18
English B English <5 <5 <5 <5 <5 <5 <5 <5 <5 <5 <5 <5
Environmental Studies/Science
Science <5 <5 <5 <5 10 <5 <5 <5 <5 <5 <5 <5
ESL English 6 <5 <5 <5 17 <5 <5 <5 <5 35 <5 13
Food Science Design <5 <5 <5 <5 <5 <5 <5 <5 <5 <5 <5 <5Victorian Teacher Supply and Demand Report 2017 SUPPLEMENTARY APPENDIX 13

Technology
French Languages <5 <5 <5 <5 <5 <5 <5 <5 <5 5 <5 <5
Further Humanities
Humanities - General <5 <5 <5 <5 <5 <5 <5 <5 <5 <5 <5 <5
Geography
Humanities- Geography <5 <5 <5 <5 <5 <5 <5 <5 <5 12 <5 <5
German Languages <5 <5 <5 <5 <5 <5 <5 <5 <5 <5 <5 <5
Greek-mod Languages <5 <5 <5 <5 <5 <5 <5 <5 <5 <5 <5 <5
Health HPE <5 <5 <5 <5 <5 <5 <5 <5 <5 <5 <5 <5
Health Education
HPE 24 <5 <5 <5 6 <5 65 18 <5 71 61 127
Hebrew Languages <5 <5 <5 <5 <5 <5 <5 <5 <5 <5 <5 <5
History
Humanities- History and Civics 31 <5 <5 7 68 <5 37 23 <5 50 <5 <5
Home Economics
Design Technology <5 <5 <5 <5 <5 <5 <5 <5 <5 <5 <5 <5
HumanitiesHumanities - General 16 <5 <5 5 11 <5 5 <5 <5 <5 <5 103
Humanities (Additional)
Humanities - General <5 <5 <5 <5 <5 <5 <5 <5 <5 <5 <5 <5
Indonesian Languages <5 <5 <5 <5 <5 <5 <5 <5 <5 <5 <5 <5
SubjectVCAA Subject Area
ACU CDU CQU CSU Deakin Eastern College Federation La
Trobe MGSE Monash RMIT VU
Information Technology
Digital technology <5 <5 <5 <5 <5 <5 <5 <5 <5 <5 <5 <5
Italian Languages <5 <5 <5 <5 <5 <5 <5 <5 <5 5 <5 <5
Japanese Languages <5 <5 <5 <5 <5 <5 <5 <5 <5 9 <5 <5
Jewish Studies
Humanities- History and Civics <5 <5 <5 <5 <5 <5 <5 <5 <5 <5 <5 <5
Korean Languages <5 <5 <5 <5 <5 <5 <5 <5 <5 <5 <5 <5
Languages Languages <5 <5 <5 <5 <5 <5 <5 <5 <5 <5 <5 <5
Latin Languages <5 <5 <5 <5 <5 <5 <5 <5 <5 <5 <5 <5
Legal Studies
Humanities- Economics and business
<5 <5 <5 <5 <5 <5 <5 <5 <5 47 <5 <5
Library/ Information studies
Exclude <5 <5 <5 <5 <5 <5 <5 <5 <5 <5 <5 <5
Literary studies English <5 <5 <5 <5 37 <5 <5 <5 <5 <5 <5 <5
LOTE Languages <5 <5 <5 <5 <5 <5 <5 <5 <5 <5 <5 <5Victorian Teacher Supply and Demand Report 2017 SUPPLEMENTARY APPENDIX 14

LOTE -unspecified
Languages <5 <5 <5 <5 <5 <5 <5 <5 <5 <5 <5 12
Macedonian Languages <5 <5 <5 <5 <5 <5 <5 <5 <5 <5 <5 <5
Mandarin Languages <5 <5 <5 <5 <5 <5 <5 <5 <5 36 <5 <5
MathematicsMathematics 16 <5 <5 <5 62 <5 37 7 <5 42 <5 35
Mathematics (Additional)
Mathematics <5 <5 <5 <5 <5 <5 <5 <5 <5 <5 <5 <5
Maths-senior/additional
Mathematics <5 <5 <5 <5 9 <5 <5 <5 <5 <5 <5 <5
Media StudiesArts-Media and visual <5 <5 <5 <5 <5 <5 <5 <5 <5 <5 <5 <5
Media/FilmArts-Media and visual 5 <5 <5 <5 28 <5 <5 5 <5 33 <5 7
MusicPerforming arts/music <5 <5 <5 <5 10 <5 <5 <5 <5 42 <5 15
Music APerforming arts/music <5 <5 <5 <5 <5 <5 <5 <5 <5 <5 <5 <5
Music BPerforming arts/music <5 <5 <5 <5 <5 <5 <5 <5 <5 <5 <5 <5
Music B/ Instrumental/
Performing arts/music 8 <5 <5 <5 <5 <5 <5 <5 <5 20 <5 <5
Outdoor Education
HPE 9 <5 <5 <5 <5 <5 24 <5 <5 29 <5 18
Physical Education
HPE 31 <5 <5 <5 59 <5 14 10 <5 75 61 85
Physics Science <5 <5 <5 <5 16 <5 <5 <5 <5 17 <5 <5
SubjectVCAA Subject Area
ACU CDU CQU CSU Deakin Eastern College Federation La
Trobe MGSE Monash RMIT VU
Politics
Humanities- History and Civics <5 <5 <5 <5 <5 <5 <5 <5 <5 <5 <5 <5
Psychology Science 34 <5 <5 <5 27 <5 14 12 <5 28 <5 55
Religious education
Humanities- History and Civics 36 <5 <5 <5 <5 <5 <5 <5 <5 <5 <5 <5
Russian Languages <5 <5 <5 <5 <5 <5 <5 <5 <5 <5 <5 <5
Science Science <5 <5 <5 <5 <5 <5 <5 <5 <5 <5 <5 <5
Science - General
Science 8 <5 <5 <5 24 <5 24 <5 <5 48 <5 62
Senior science Science 5 <5 <5 <5 <5 <5 8 <5 <5 <5 <5 <5
SOSEHumanities - General <5 <5 <5 <5 <5 <5 <5 <5 <5 <5 <5 <5
SOSE / Social Studies
Humanities- History and Civics <5 <5 <5 <5 66 <5 22 7 <5 56 <5 <5
Spanish Languages <5 <5 <5 <5 <5 <5 <5 <5 <5 <5 <5 <5
Student Welfare
Exclude <5 <5 <5 <5 <5 <5 <5 5 <5 <5 <5 9
Victorian Teacher Supply and Demand Report 2017 SUPPLEMENTARY APPENDIX 15
Technology studies
Digital technology <5 <5 <5 <5 <5 <5 <5 <5 <5 <5 <5 <5
TESOL TESOL <5 <5 <5 <5 <5 <5 <5 <5 <5 <5 <5 <5
Turkish Languages <5 <5 <5 <5 <5 <5 <5 <5 <5 <5 <5 <5
VET Exclude <5 <5 <5 <5 <5 <5 <5 <5 <5 <5 <5 <5
Vietnamese Languages <5 <5 <5 <5 <5 <5 <5 <5 <5 <5 <5 <5
Visual ArtArts-Media and visual <5 <5 <5 <5 <5 <5 <5 <5 <5 <5 <5 <5
Visual Art (Additional)
Arts-Media and visual <5 <5 <5 <5 <5 <5 <5 <5 <5 <5 <5 <5
Total 311 19 4 24 745 <5 327 155 <5 958 122 629
ITE course practicumsThe following reference tables provide an overview of the number of practicums administered by Victorian ITE providers and interstate providers with Victorian-based students during 2017 calendar year. The respective breakdowns are by educational setting (7.1a), location (7.1b), sector (7.1c), delivery type (7.1d). This data was sourced directly from the ITE providers. Only breakdown data that was reported by ITE providers is displayed in the tables.
Table 7.1a: Number of practicums administered by ITE providers during the calendar year (2017), by educational setting
ITE Provider Early Childhood Primary Primary /
Secondary Secondary Special EAL
ACU 156 992 10 751 <5 <5CDU <5 23 <5 10 <5 <5CQU <5 <5 <5 <5 <5 <5CSU <5 81 11 20 <5 <5Curtin 64 244 <5 <5 <5 <5Deakin <5 3,341 599 1,573 32 35Eastern College <5 9 <5 15 <5 <5Edith Cowan University <5 <5 <5 <5 <5 <5Federation University <5 819 48 480 24 8Holmesglen <5 <5 <5 <5 <5 <5Latrobe <5 1,248 354 660 94 <5Melbourne Polytechnic <5 65 <5 <5 <5 <5MGSE <5 576 <5 707 <5 7Monash <5 2,789 905 2,904 65 12RMIT <5 1,912 12 209 162 <5Swinburne <5 74 25 48 <5 <5UTas <5 66 9 18 5 <5Victoria University 732 1,630 82 988 43 47
Total 952 13,877 2,058 8,384 430 113
Table 7.1b: Number of practicums administered by ITE providers during the calendar year (2017), by locationITE Provider Metropolitan Regional / Rural
ACU 1737 160CDU 39 6CQU 5 <5CSU 15 142Curtin 211 97Deakin 4,541 1,737Eastern College 24 <5Edith Cowan University <5 <5Federation University 303 1,076Holmesglen <5 <5Latrobe 1,034 1,322Melbourne Polytechnic 64 <5MGSE 1,263 27Monash 5,244 1,431RMIT 2,292 6Swinburne 134 13UTas 66 32Victoria University 3,112 64
Victorian Teacher Supply and Demand Report 2017 SUPPLEMENTARY APPENDIX 16

ITE Provider Metropolitan Regional / RuralTotal 20,088 6,116
Table 7.1c: Number of practicums administered by ITE providers during the calendar year (2017), by sectorITE Provider Government Catholic Independent
ACU 736 975 200CDU 34 <5 9CQU 5 <5 <5CSU 91 31 22Curtin 255 18 35Deakin <5 <5 <5Eastern College 15 <5 9Edith Cowan University <5 17 <5Federation University 1,252 85 42Holmesglen <5 <5 3Latrobe 1,862 260 234Melbourne Polytechnic 58 5 <5MGSE 1,046 121 123Monash 5,077 391 1,207RMIT 2,261 6 31Swinburne 110 9 28UTas 63 24 11Victoria University 2,286 381 508
Total 15,154 2,329 2,464
Table 7.1d: Number of practicums administered by ITE providers during the calendar year (2017), by delivery typeITE Provider Block Distributed Internship
ACU 20 <5 <5CDU 36 9 <5CQU <5 <5 <5CSU 12 157 <5Curtin 12 <5 8Deakin 6,433 <5 37Eastern College 22 <5 <5Edith Cowan University <5 <5 <5Federation University 1,251 128 <5Holmesglen <5 <5 <5Latrobe 2,324 554 <5Melbourne Polytechnic 65 4,025 <5MGSE 736 209 <5Monash 2,650 <5 <5RMIT 2,298 <5 <5Swinburne 147 <5 <5UTas 98 <5 <5Victoria University 1,480 1,695 <5
Total 17,590 6,716 46
The following reference tables provide an overview of the distribution of practicums administered by Victorian ITE providers and interstate providers with Victorian-based students during the 2014-2017 calendar years. The respective breakdowns are by educational setting (7.2a), location (7.2b), sector (7.2c), and delivery type (7.2d). This data was sourced directly from the ITE providers. Note, annual differences in the data collection methodology, courses offered and the response rate from ITE providers limit the ability to accurately compare across calendar years. As such, the percentages provided should be considered as indicative of the trend.
Table 7.2a: Distribution of practicums administered by ITE providers (2014-2017), by educational settingYear Early Childhood Primary Secondary P-12 Special EAL2014 0.0% 51.3% 31.9% 5.2% 1.1% 10.5%2015 0.0% 54.9% 28.9% 5.1% 1.4% 9.6%2016 3.9% 54.3% 32.3% 7.8% 1.5% 0.2%2017 3.7% 53.8% 32.5% 8.0% 1.7% 0.4%
Table 7.2b: Distribution of practicums administered by ITE providers (2014-2017), by locationYear Metropolitan Region/rural2014 75.1% 24.9%2015 75.9% 24.1%2016 72.0% 28.0%2017 77.0% 23.0%
Victorian Teacher Supply and Demand Report 2017 SUPPLEMENTARY APPENDIX 17

Table 7.2c: Distribution of practicums administered by ITE providers (2014-2017), by sectorYear Government Catholic Independent2014 78.0% 12.2% 9.8%2015 77.3% 12.7% 9.9%2016 71.8% 14.7% 13.6%2017 76.0% 12.0% 12.0%
Table 7.2d: Distribution of practicums administered by ITE providers (2014-2017), delivery typeYear Block Distributed Internship2014 69.7% 30.2% 0.2%2015 69.4% 30.3% 0.3%2016 75.3% 23.0% 1.7%2017 72.0% 28.0% 0.19%
Victorian Teacher Supply and Demand Report 2017 SUPPLEMENTARY APPENDIX 18

C GraduationITE course graduationsThe following reference table provides an overview of the number of graduates from Victorian ITE providers and Victorian graduates from interstate online ITE providers in 2017. Graduates across the different provider courses have been grouped by course level (undergraduate, master or graduate diploma) and further aggregated into qualification types. Only ITE providers which reported graduates have been included in the corresponding course level groupings. This data was sourced directly from the ITE providers.
Table 8.1: Graduates from ITE providers (2017), by course level and qualification type
ITE Provider Course Level Early Childhood
Early Childhood / Primary
Primary Primary / Secondary Secondary
ACU Undergraduate
<5 111 118 <5 38
CDU Undergraduate
5 <5 <5 <5 <5
CQU Undergraduate
<5 <5 <5 <5 <5
CSU Undergraduate
<5 26 <5 13 <5
Curtin Undergraduate
19 <5 75 <5 <5
Deakin Undergraduate
118 <5 390 <5 63
Eastern College Undergraduate
<5 <5 <5 <5 <5
Edith Cowan University
Undergraduate
<5 <5 <5 <5 <5
Federation University Undergraduate
<5 11 64 99 84
Holmesglen Undergraduate
<5 23 <5 <5 <5
Latrobe Undergraduate
37 <5 79 114 43
Melbourne Polytechnic Undergraduate
<5 25 <5 <5 <5
Monash Undergraduate
<5 50 137 92 104
RMIT Undergraduate
<5 <5 157 40 <5
Swinburne Undergraduate
<5 <5 46 <5 <5
UTas Undergraduate
<5 <5 24 <5 <5
Victoria University Undergraduate
<5 92 <5 333 <5
ACU Master 9 <5 28 <5 26CQU Master <5 <5 <5 <5 <5CSU Master <5 <5 23 <5 <5Deakin Master 24 10 70 35 133Federation University Master <5 <5 30 <5 48Latrobe Master <5 <5 36 33 92MGSE Master 16 <5 133 <5 40Monash Master <5 28 81 73 213RMIT Master <5 <5 32 <5 35Swinburne Master <5 <5 32 <5 <5UTas Master <5 <5 6 <5 <5Victoria University Master <5 <5 <5 <5 <5ACU Grad. Diploma <5 <5 <5 <5 54CQU Grad. Diploma <5 <5 <5 <5 <5Eastern College Grad. Diploma <5 <5 <5 <5 <5Edith Cowan University
Grad. Diploma <5 <5 <5 <5 <5
Federation University Grad. Diploma <5 <5 <5 <5 <5Latrobe Grad. Diploma <5 <5 <5 <5 <5MGSE Grad. Diploma 71 <5 <5 <5 40Monash Grad. Diploma <5 <5 <5 <5 <5RMIT Grad. Diploma <5 <5 <5 <5 <5Swinburne Grad. Diploma <5 <5 <5 <5 <5Victoria University Grad. Diploma <5 <5 140 <5 105
Victorian Teacher Supply and Demand Report 2017 SUPPLEMENTARY APPENDIX 19

ITE Provider Course Level Early Childhood
Early Childhood / Primary
Primary Primary / Secondary Secondary
Total 302 376 1,704 835 1,126
The following reference tables provide an overview of the number of ITE graduates from Victorian ITE providers and interstate providers with Victorian-based students during the 2014-2017 calendar years. This data was sourced directly from the ITE providers. Note, annual differences in the data collection methodology, courses offered and the response rate from ITE providers limit the ability to accurately compare across calendar years. As such, the enrolment numbers should be considered as indicative of the trend.
Table 8.2: ITE graduates (2014-2017), by qualification typeYear Early Childhood Early
Childhood / Primary
Primary Primary / Secondary
Secondary
2014 224 265 1,540 392 1,897 2015 326 308 1,368 428 1,877 2016 206 401 1,782 843 2,023 2017 302 376 1,704 835 1,126
ITE graduate supply The following reference table provides an overview of the modelled available supply of teachers from ITE graduation. The 2012-2017 modelled figures are based off historically collected ITE graduation figures. Note, differences in the data collection methodology and response rates of ITE providers across the years may affect the reliability to compare historical supply figures. The modelling assumption applied to ITE graduate figures is that 20% of ITE graduates will be unavailable to teach, hence 80% of the annual graduate cohort are considered as available to enter the teacher supply pool. Forecast modelled available supply for 2018 – 2021 from ITE graduates is based on current 2017 undergraduate and postgraduate enrolment data, not on historical figures.
Table 9.1: Modelled available supply from ITE graduation (2012-2021), by qualification type
Year Early ChildhoodEarly
Childhood / Primary
Primary Primary / Secondary Secondary
2012 41 201 1,469 495 1,8652013 47 259 1,590 526 2,0502014 179 212 1,232 314 1,5182015 261 246 1,094 342 1,5022016 165 321 1,426 674 1,6182017 193 241 1,091 534 7212018 343 362 1,796 883 1,3692019 520 393 1,790 717 1,1832020 550 556 1,990 651 1,5262021 685 610 2,312 755 1,845
The following reference table provides an overview of the historically collected and reported ITE graduate numbers by educational setting. Note, differences in the data collection methodology and response rates of ITE providers across the years may affect the reliability to compare graduate pool numbers. Dual qualified graduates are considered in both pools i.e. early childhood / primary qualified ITE graduates are counted in both the early childhood pool and primary pool.
Table 9.2: Historically collected ITE graduate numbers, by educational settingYear Early Childhood Pool Primary Pool Secondary Pool2012 302 2,706 2,9502013 383 2,968 3,2192014 489 2,197 2,2892015 634 2,104 2,3052016 607 3,026 2,8662017 678 2,915 1,961
ITE graduates - Employment outcomes and course experienceThe following reference table outlines the number of 2017 graduates who found employment in industry. This data was sourced from a customised data set requested from the Social Research Centre’s ‘Graduate Outcome Survey’.
Table 9.3: Employed graduates by industry (2017), by course typeIndustry Undergraduate Postgraduate
Administrative and Support Services 60 41Education and Training 713 666Health Care and Social Assistance 57 22Other 62 90
Victorian Teacher Supply and Demand Report 2017 SUPPLEMENTARY APPENDIX 20

Industry Undergraduate PostgraduateRetail Trade 34 14
Total 926 833
The following reference table outlines the distribution of employment outcomes of 2017 graduates. This data was sourced from a customised data set requested from the Social Research Centre’s ‘Graduate Outcome Survey’.
Table 9.4: Employment outcomes (2017), by course typeEmployment outcome Undergraduate Postgraduate
Full time 68.8% 60.5%Part time 22.3% 28.5%Not employed 8.9% 11.0%
Total 100% 100%
The following reference table outlines the positive rating of course experience metrics by 2017 graduates. Respondents answer a series of questions related to their course experience, and their average response is then classified as ‘positive’ or ‘not positive’. There was a total of 2,381 undergraduate and 2,179 postgraduate respondents to this component of the survey. This data was sourced from a customised data set requested from the Social Research Centre’s ‘Graduate Outcome Survey’.
Table 9.5: Positive ratings of course experience metrics (2017), by course typeCourse experience scale Undergraduate Postgraduate
Overall satisfaction 845 784Good teaching scale 665 674Generic skills scale 871 721
Total 2,381 2,179
ITE graduates - Further studyThe following reference table outlines the further study and employment outcomes of 2017 graduates. There was a total of 1,952 respondents to this component of the survey. The outcome of ‘not in work’ also includes those not participating in the labour force. This data was sourced from a customised data set requested from the Social Research Centre’s ‘Graduate Outcome Survey’.
Table 10.1: Further study outcomes compared with employment outcomes (2017)Further study and employment outcome Graduates
Not in further study - In full-time work 1,219Not in further study - In part-time work 452Not in further study and not in work 183In further study and in part-time work 42In further study and in full-time work 46In further study and not in work 10
Total 1,952
The following reference table outlines the next qualification level of 2017 graduates who pursued further study. This data was sourced from a customised data set requested from the Social Research Centre’s ‘Graduate Outcome Survey’.
Table 10.2: Next qualification level of further study (2017), by course typeNext qualification level of further study Undergraduate Postgraduate
Bachelor 17 <5Masters 9 34Doctorate <5 <5Graduate diploma / diploma 6 8Other 7 8
Total 39 56
The following reference table outlines the chosen field of education of 2017 graduates who pursued further study. This data was sourced from a customised data set requested from the Social Research Centre’s ‘Graduate Outcome Survey’.
Table 10.3: Chosen field of education of further study (2017), by course typeField of Education Undergraduate Postgraduate coursework
Education 28 40Society and Culture 6 8Other <5 <5Creative Arts <5 <5Health <5 <5
Total 39 56
Victorian Teacher Supply and Demand Report 2017 SUPPLEMENTARY APPENDIX 21

ITE graduates - Longitudinal employment outcomes and further studyThe following reference table outlines the longitudinal participation in work and further study for the same cohort across 2014 and 2017. A survey respondent may work and study at the same time. As such, employment outcome metrics and further study are treated as mutually exclusive. This data was sourced from a customised data set requested from the Social Research Centre’s ‘Graduate Outcome Survey’.
Table 11.1: Employment and further study outcomes, by yearEmployment and further study outcome 2014 2017
Full time work 377 501Part time work 284 133Further study 117 86
Total 778 720
The following reference table outlines the longitudinal differences in the field of education for further study of the same cohort across 2014 and 2017. This data was sourced from a customised data set requested from the Social Research Centre’s ‘Graduate Outcome Survey’.
Table 11.2: Further study field of education, by yearFurther study field of education 2014 2017
Education 100 56Other <5 8Society and Culture 12 10Natural and Physical Sciences <5 <5Creative Arts <5 <5Health <5 5
Total 117 86
The following reference table outlines the longitudinal differences in the employment destination of the same cohort across 2014 and 2017. This data was sourced from a customised data set requested from the Social Research Centre’s ‘Graduate Outcome Survey’.
Table 11.3: Employment destination, by yearEmployment destination 2014 2017
Education and Training 464 513Other 81 76Retail Trade 36 13Health Care and Social Assistance 54 24Administrative and Support Services 26 8
Total 661 634
Victorian Teacher Supply and Demand Report 2017 SUPPLEMENTARY APPENDIX 22

D RegistrationRegistration characteristics - Registered teachersThe following reference table provides an overview of the number of registered teachers (including early childhood registered teachers) for each sector, by registration type. The data was collected from a ‘Customised VIT registered teachers data set’ from the VIT.
Table 12.1: Registration type of registered teachers (2017), by sectorRegistration Type Government Catholic Independent No Sector
Full Registration 45,011 16,752 13,808 26,118Provisional Registration 2,547 1,031 1,102 11,620
Permission to Teach 321 83 212 496Returning 128 64 50 552Non- Practising 133 7 10 3,442
Total 48,140 17,937 15,182 42,228
The following reference table provides an overview of the number of registered teachers that hold a registration type, by the length of their ITE qualification. The length of time it took a teacher to complete their longest ITE course is recorded as a proxy for their ITE qualification. Data was only available for those granted registration post-2006, hence figures represent approximately 50% of all registered teachers. The data was collected from a ‘Customised VIT registered teacher’s data set’ from the VIT.
Table 12.2: Registration type of registered teachers (2017), by ITE qualification course lengthRegistration
Type 1 Year 1.5 Years 2 Years 3 Years 4 Years
Full Registration 21,631 1,741 4,725 2,629 24,823Provisional Registration
2,829 439 1,174 257 2,841
Returning 168 <5 33 27 202Non- Practising 182 8 28 34 144
TOTAL 24,810 2,192 5,960 2,947 28,010
Registration characteristics - Demographic characteristicsThe following reference table provides an overview of the age of teachers. The data was collected from a ‘Customised VIT registered teacher’s data set’ from the VIT.
Table 13.1: Age distribution of registered teachers (2017)Age Band Number of Teachers
< 25 4,00225 - 34 35,55235 - 44 31,69345 - 54 27,64355 - 64 25,665
65+ 6,320Total 130,876
The following reference table provides an overview of the age distribution of teachers returning from non-practising registration. The data was collected from a ‘Customised VIT registered teacher’s data set’ from the VIT.
Table 13.2: Age distribution of returning teachers from non-practising registration (2017)Age Band Number of Teachers
25-29 1930-34 11235-39 17040-44 9545-49 5850-54 2355-59 1360-64 2365-69 2070+ <5
Total 536
The following reference table provides an overview of the age distribution of teachers who have ceased or expired registrations. The data was collected from a ‘Customised VIT registered teachers data set’ from the VIT.
Table 13.3: Age distribution of ceased or expired registration (2017)
Victorian Teacher Supply and Demand Report 2017 SUPPLEMENTARY APPENDIX 23

Age Band Teacher<25 15
25-29 26130-34 55835-39 40640-44 32245-49 24250-54 22155-59 42560-64 97365-69 91570+ 387
Total 4,725
Victorian Teacher Supply and Demand Report 2017 SUPPLEMENTARY APPENDIX 24

E RecruitmentVacancies and ApplicationsThe following reference table provides an overview of the vacancies, vacancy rate, applications and application rate for teaching service positions in the Victorian government sector for the 2017 calendar by LGA. The data was collected from the ‘Customised Recruitment Online data set’ provided by the Victorian Department of Education and Training. Note that data in table 14.2 Vacancies and no appointment rate by subject area only contains data on vacancies that were tagged to a specific subject in the recruitment online system.
Table 14.1: Vacancies, applications and application rate for the Victorian government teaching workforce (2017), by LGA
Department Area Vacancies Applications Application RateBarwon 622 11,878 19.1Bayside Peninsula 1,637 28,909 17.7Brimbank Melton 998 12,730 12.8Central Highlands 360 5,424 15.1Goulburn 527 3,437 6.5Hume Moreland 1,045 16,503 15.8Inner Eastern Melbourne 1,588 28,613 18.0Inner Gippsland 413 3,567 8.6Loddon 553 5,676 10.3Mallee 299 1,176 3.9North Eastern Melbourne 1,467 23,473 16.0Outer Eastern Melbourne 849 13,904 16.4Outer Gippsland 296 1,293 4.4Ovens Murray 474 3,094 6.5Southern Melbourne 1,461 24,095 16.5Wimmera South West 479 2,170 4.5Western Melbourne 1,721 23,179 13.5No Assigned Area 79 793 10.0Total 14,868 209,914 14.1
Table 14.2: Vacancies and no appointment rate by subject areaVCAA subject area No appointments Vacancies No appointment rate
Digital Technology 106 278 38.1%Languages 165 650 25.4%Design Technology 118 538 21.9%Mathematics 280 1,445 19.4%Special Education 114 712 16.0%Science 193 1,176 16.4%Performing Arts/Music 120 754 15.9%Humanities - Economics and Business 54 304 17.8%English 234 1,650 14.2%Humanities - Geography 86 741 11.6%Arts - Media and Visual 50 599 8.3%HPE 89 1,161 7.7%Humanities - History and Civics 7 75 9.3%Total 1,616 10,083 16.0%
Victorian Teacher Supply and Demand Report 2017 SUPPLEMENTARY APPENDIX 25

Recruitment challenges - No appointmentsThe following reference table provides an overview of the no appointment rates for each department area. The data was collected from a ‘Customised Recruitment Online data set’ provided by the Victorian Department of Education and Training.
Table 15.1: No appointment rate (2017), by department areaDepartment Area No Appointment Rate
Barwon 9.2%Bayside Peninsula 9.4%Brimbank Melton 17.1%Central Highlands 6.7%Goulburn 11.6%Hume Moreland 18.1%Inner Eastern Melbourne 11.5%Inner Gippsland 10.2%Loddon 10.9%Mallee 22.3%North Eastern Melbourne 10.9%Outer Eastern Melbourne 9.3%Outer Gippsland 24.3%Ovens Murray 12.1%Southern Melbourne 12.0%Wimmera South West 14.4%Western Melbourne 17.6%
Table 15.2: No appointment rate (2017), by employment classificationEmployment classification Vacancies No Appointments No appointment rate
Teacher Class 12,990 1,686 13.0%
Leading Teacher 932 117 12.6%
Assistant Principal 337 28 7.3%
Table 15.3: No appointment rate (2017), by school typeEmployment classification Vacancies No Appointments No appointment rate
Primary 7,133 679 9.5%
Primary/ Secondary 1,632 244 15.0%
Secondary 4,878 773 15.8%
Other* 1,225 242 19.8%
Victorian Teacher Supply and Demand Report 2017 SUPPLEMENTARY APPENDIX 26

F Victorian workforceVictorian teaching workforceThe following reference table provides an overview of the number of FTE teaching staff in Victorian primary schools. The data was sourced from ‘NSSC Table 51a: In-school Staff (FTE), ABS 4221.0 Schools Australia.’
Table 16.1: Number of FTE teaching staff in Victorian primary schools, by sectorYear Government Catholic Independent Total
2007 19,822.3 5,940.6 3,415.1 29,178.02008 19,858.3 6,068.6 3,539.6 29,466.52009 19,889.1 6,096.1 3,614.4 29,599.62010 20,004.8 6,229.6 3,693.0 29,927.42011 20,556.7 6,372.3 3,834.3 30,763.32012 21,472.9 6,629.6 3,943.2 32,045.72013 21,566.2 6,893.6 4,008.6 32,468.42014 22,244.8 7,031.2 4,131.5 33,407.52015 22,757.8 7,187.5 4,258.5 34,203.82016 24,249.6 7,405.1 4,441.3 36,096.02017 25,008.3 7,525.3 4,557.1 37,090.7
The following reference table provides an overview of the number of FTE teaching staff in Victorian secondary schools. The data was sourced from ‘NSSC Table 51a: In-school Staff (FTE), ABS 4221.0 Schools Australia.’
Table 16.2: Number of FTE teaching staff in Victorian secondary schools, by sectorYear Government Catholic Independent Total
2007 19,120.9 6,745.2 7,092.5 32,958.62008 19,056.2 6,877.2 7,354.5 33,287.92009 19,046.1 6,914.9 7,429.8 33,390.82010 19,150.6 6,978.4 7,462.7 33,591.72011 19,200.8 7,122.8 7,634.0 33,957.62012 18,923.8 7,255.8 7,732.4 33,912.02013 18,393.9 7,373.9 7,802.3 33,570.12014 18,010.1 7,450.6 7,911.5 33,372.22015 18,096.0 7,545.6 8,008.7 33,650.32016 18,404.4 7,654.9 8,244.3 34,303.62017 19,062.7 7,770.6 8,378.1 35,211.4
Government funded kindergarten program workforceThe following reference table provides an overview of the number of teachers required to meet demand at Victorian government funded kindergarten programs, including early start kindergarten programs, between 2007 and 2023. The number of teachers required to meet demand was forecasted using a vector autoregression model with exogenous variables. The exogenous variables used were number of children enrolled, hours per child per week, ratio of children to teachers and child to educator ratio. These exogenous variables have been outlined in the reference table below. The data used for the forecasts was sourced from ‘ABS 3222.0 Population Projections, Australia, 2012 (base) to 2101, Series B’ and ‘Kindergarten Program Administrative Data set, Vic DET.’
Table 17.1: Actual (2007-2017) and forecast (2018-2023) demand for Victorian government funded kindergarten program teachers
Year Teachers Hours per child per week
Ratio of children to teachers
Child to educator ratio
2007 2,047 10 29 132008 2,150 10 28 132009 2,193 10 29 132010 2,369 10 28 132011 2,610 10 27 122012 2,935 11 25 112013 3,193 15 23 112014 3,485 15 22 102015 3,619 15 21 92016 3,804 15 20 82017 4,013 15 20 82018 4,162 15 20 82019 4,250 15 20 82020 4,342 15 20 82021 4,498 15 20 82022 5,495 15 20 82023 5,889 15 20 8
Victorian Teacher Supply and Demand Report 2017 SUPPLEMENTARY APPENDIX 27
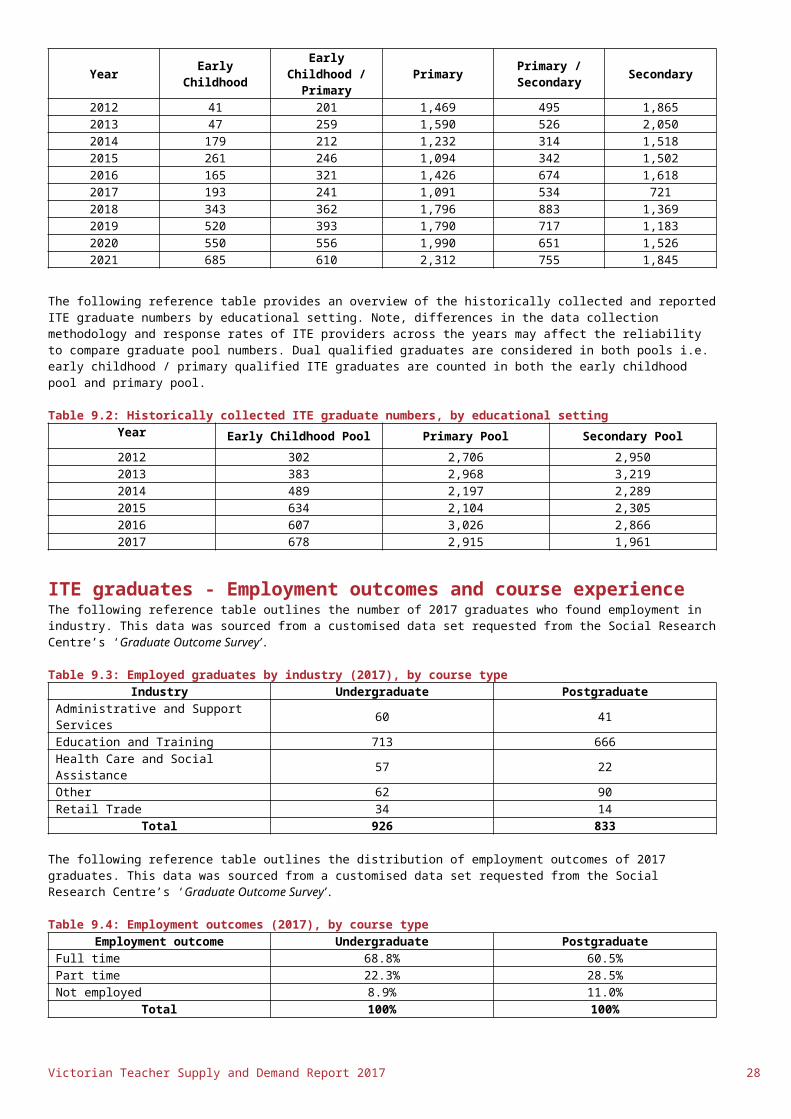
Table 17.2 Additional teachers forecast to be required due to the introduction of the universal three-year-old kindergarten initiativeThe following reference table provides an overview of the forecast amount of additional kindergarten teachers required to provide services to new three-year-old kindergarten enrolments to the introduction of the Victorian government’s universal three-year-old kindergarten initiative. Data was sourced from internal Department of Education and Training modelling.
Year Additional teachers required
2017 0
2018 0
2019 0
2020 34
2021 149
2022 1,117
2023 1,493
The following reference table provides an overview of the age distribution of the government funded kindergarten program workforce. The data used was sourced from the ‘Kindergarten Program Administrative Data set’ provided by the Victorian Department of Education and Training.
Table 17.3: Age distribution of government funded kindergarten program workforce (2017)Age bracket Number of kindergarten teachers
<25 8425-34 1,12335-44 1,14145-54 1,07955-64 52265+ 64
Total 4,013
Table 17.4: Working hour distribution of government funded kindergarten program workforce (2017)Working hours Number of kindergarten teachers
<10 14310-19 25820-29 1,27430-39 2,05240+ 286
Total 4,013
Long day care workforceAnalysis assumptions for long day careDue to data limitations for long day care services and for the purposes of analysis, the following key assumptions have been made:
1. The Education and Care Services National Law Act (2010) and the Education and Care Services National Regulations (2011) require an early childhood teacher or a suitably qualified person to be in attendance. The qualifications of the other suitably qualified person are yet to be decided nationally. This analysis therefore assumes that these additional educators will be qualified early childhood teachers.
2. The number of children preschool aged, or under provided education and care on a given day is equal to the maximum number of approved places for the long day care service.
3. Weekly operation hours of a long day care service is 50 hours.
4. Analysis of current FTE teacher staffing levels at LDC is based on funded kindergarten program data. There may be other teachers employed by services that are not included in this data.
5. Extra FTE demand for early childhood teachers in 2020 is calculated as per requirements in regulations 133(1)(b) and 134(1)(b).
6. Extra demand for one FTE early childhood teacher is equivalent to an extra headcount demand for 1 early childhood teacher.
The following reference table provides an overview of the number of suitably qualified early childhood teachers required to be employed at unfunded long day care (LDC) services, grouped by size i.e. maximum number of approved places. The analysis accounts for the historical trend of unfunded LDC services, as well as the distribution of maximum number of approved places. Requirements for FTE early childhood teachers, outlined in the Education and Care Services National Regulations, are then applied to this distribution of unfunded LDC service The data used for the forecasts was sourced from the Victorian Department of Education and Training’s ‘Customised unfunded long day care data set (2014-2017)’.Victorian Teacher Supply and Demand Report 2017 SUPPLEMENTARY APPENDIX 28

Table 18.1: Actual (2014-2017) and forecast (2018-2023) FTE teacher requirement at unfunded long day care, by maximum number of approved places
Year <25 25-59 60-80 >80 Total
2014 3 104 49.6 43.2 199.8
2015 2.8 99.2 52 48 2022016 2 78.4 29.6 25.6 135.62017 3.4 79.2 38.4 96.8 217.82018 3 86.4 40.8 56 186.22019 3 86.4 40.8 56 186.22020 3 86.4 61.2 112 262.62021 3 86.4 61.2 112 262.62022 3 86.4 61.2 112 262.62023 3 86.4 61.2 112 262.6
Victorian Teacher Supply and Demand Report 2017 SUPPLEMENTARY APPENDIX 29

The following reference table provides an overview of the number of suitably qualified FTE early childhood teachers required to be employed at funded long day care (LDC) services, with maximum approved places between 60 to 80 children. The following calculations are performed as part of the analysis:
1. Extra FTE requirement for 2020: Based on the Education and Care Services National Regulation 133(1)(b), those services who are already complying with the 2020 requirements are assigned a 0.0 extra FTE requirement.
2. Number of funded LDC services impacted: Based on current FTE employment data for 2017 funded LDC.3. FTE Demand: The product of the first and second calculations.
The data used for the forecasts was sourced from the Victorian Department of Education and Training’s ‘Customised funded long day care data set (2017)’.
Table 18.2: Extra 2020 FTE teacher requirement at funded long day care with 60-80 maximum approved places
Extra FTE Requirement for 2020Number of funded LDC services
impacted FTE Demand
0.00 85 0.000.05 2 0.110.08 1 0.080.09 1 0.090.13 14 1.860.17 3 0.510.19 89 16.610.20 61 12.200.21 5 1.070.23 3 0.680.24 3 0.720.27 1 0.270.28 2 0.560.29 2 0.590.30 1 0.300.31 2 0.610.33 2 0.670.35 4 1.390.36 1 0.360.38 1 0.380.39 1 0.390.40 4 1.600.47 3 1.400.52 1 0.520.53 1 0.530.60 5 3.000.61 1 0.610.64 1 0.640.72 1 0.720.75 1 0.750.88 1 0.880.97 1 0.970.99 1 0.991.00 1 1.00
2020 Total FTE Demand 53.05
Victorian Teacher Supply and Demand Report 2017 SUPPLEMENTARY APPENDIX 30

The following reference table provides an overview of the number of suitably qualified FTE early childhood teachers required to be employed at funded long day care (LDC) services, with greater than 80 maximum approved places. The following calculations are performed as part of the analysis:
1. Extra FTE requirement for 2020: Based on the Education and Care Services National Regulation 134(1)(b), those services who are already complying with the 2020 requirements are assigned a 0.0 extra FTE requirement.
2. Number of funded LDC services impacted: Based on current FTE employment data for 2017 funded LDC.3. FTE Demand: The product of the first and second calculations.
The data used for the forecasts was sourced from the Victorian Department of Education and Training’s ‘Customised funded long day care data set (2017)’.
Table 18.3: Extra 2020 FTE teacher requirement at funded long day care with >80 maximum approved places
Extra FTE Requirement for 2020Number of funded LDC services
impacted FTE Demand
0.00 185 0.000.01 1 0.010.03 1 0.030.05 2 0.110.07 1 0.070.08 1 0.080.09 1 0.090.11 1 0.110.15 1 0.150.17 1 0.170.20 1 0.200.24 1 0.240.27 2 0.530.28 4 1.120.31 1 0.310.32 1 0.320.37 4 1.490.40 3 1.200.44 1 0.440.45 1 0.450.47 5 2.330.48 2 0.960.51 2 1.010.52 2 1.040.53 16 8.530.56 1 0.560.57 2 1.140.58 1 0.580.59 116 68.070.60 119 71.400.61 2 1.230.62 2 1.240.63 2 1.260.64 6 3.840.65 2 1.310.67 6 4.000.68 2 1.360.69 1 0.690.72 1 0.720.73 3 2.200.75 2 1.490.77 2 1.550.80 11 8.800.83 1 0.830.85 3 2.560.88 1 0.880.93 2 1.870.96 2 1.920.99 1 0.991.00 1 1.001.01 1 1.011.03 1 1.031.15 1 1.151.32 1 1.321.37 2 2.751.38 1 1.38
Victorian Teacher Supply and Demand Report 2017 SUPPLEMENTARY APPENDIX 31

Extra FTE Requirement for 2020Number of funded LDC services
impacted FTE Demand
1.39 2 2.771.40 1 1.401.56 1 1.56
2020 Total FTE Demand 216.84
Victorian Teacher Supply and Demand Report 2017 SUPPLEMENTARY APPENDIX 32

Primary teaching workforceThe following reference table provides an overview of the number of teachers required to meet demand at Victorian primary schools between 2007 and 2023 by sector. The number of teachers required to meet demand was forecast by matching the student to teacher ratio (headcount) to number of students enrolled at primary schools for each sector. The lower 95% and upper 95% confidence intervals for the forecast number of primary teacher headcount demand by government, Catholic and independent sectors are also provided. The data used to develop these forecasts was sourced from ‘Cat. No. 4221.0 Schools, Australia’, ‘February School Census (1987-2017), Vic DET’ and ‘Cat. No. 3412.0, Migration, Australia (2005-2017) from the ABS.’
Table 19.1: Actual (2007-2017) and forecast (2018-2023) headcount demand for teachers at Victorian primary schools, by sector
YearGovernmen
t Lower 95%
Government Headcount Number
Government Upper
95%
Catholic Lower 95%
Catholic Headcount Number
Catholic Upper 95%
Independent Lower
95%
Independent Headcount Number
Independent Upper
95%
2007 - 21,623 - - 7,125 - - 4,110 -2008 - 21,852 - - 7,253 - - 4,198 -2009 - 21,993 - - 7,333 - - 4,325 -2010 - 22,117 - - 7,474 - - 4,431 -2011 - 22,743 - - 7,618 - - 4,590 -2012 - 23,341 - - 7,940 - - 4,689 -2013 - 23,880 - - 8,232 - - 4,821 -2014 - 24,659 - - 8,341 - - 4,848 -2015 - 25,282 - - 8,531 - - 5,062 -2016 - 26,946 - - 8,739 - - 5,255 -2017 - 27,947 - - 8,935 - - 5,321 -2018 28,447 28,629 28,812 8,870 8,923 8,975 5,445 5,478 5,5122019 29,177 29,363 29,549 9,064 9,117 9,170 5,617 5,651 5,6852020 29,854 30,043 30,232 9,234 9,287 9,340 5,742 5,777 5,8112021 30,592 30,784 30,977 9,406 9,459 9,512 5,859 5,894 5,9292022 31,312 31,507 31,702 9,557 9,610 9,663 5,956 5,991 6,0252023 32,030 32,228 32,426 9,694 9,747 9,800 6,038 6,073 6,108
The following reference table provides an overview of the student to teacher ratios (headcount) at Victorian primary schools between 2007 and 2023. The student to teacher ratios (headcount) were projected by using a vector autoregression model with the student to teacher ratios in each sector used as an explanatory variable between 2001 and 2017. The model assumes that the student to teacher ratio in the government sector will impact the ratio in the Catholic and independent sectors and vice versa. The data used for the forecasts was sourced from ‘ABS 4221.0 Schools Australia.’
Table 19.2: Actual (2007-2017) and forecast (2018-2023) student to teacher ratios (headcount) at Victorian primary schools, by sector
Year Government Catholic Independent
2007 14.2 13.8 10.52008 14.0 13.6 10.62009 13.9 13.7 10.62010 13.9 13.6 10.62011 13.6 13.6 10.62012 13.5 13.3 10.72013 13.5 13.1 10.72014 13.5 13.2 10.92015 13.5 13.0 10.82016 13.0 12.8 10.72017 12.9 12.6 10.92018 12.9 12.6 10.92019 12.8 12.5 10.92020 12.7 12.4 11.02021 12.6 12.3 11.02022 12.5 12.2 11.12023 12.4 12.1 11.2
Victorian Teacher Supply and Demand Report 2017 SUPPLEMENTARY APPENDIX 33
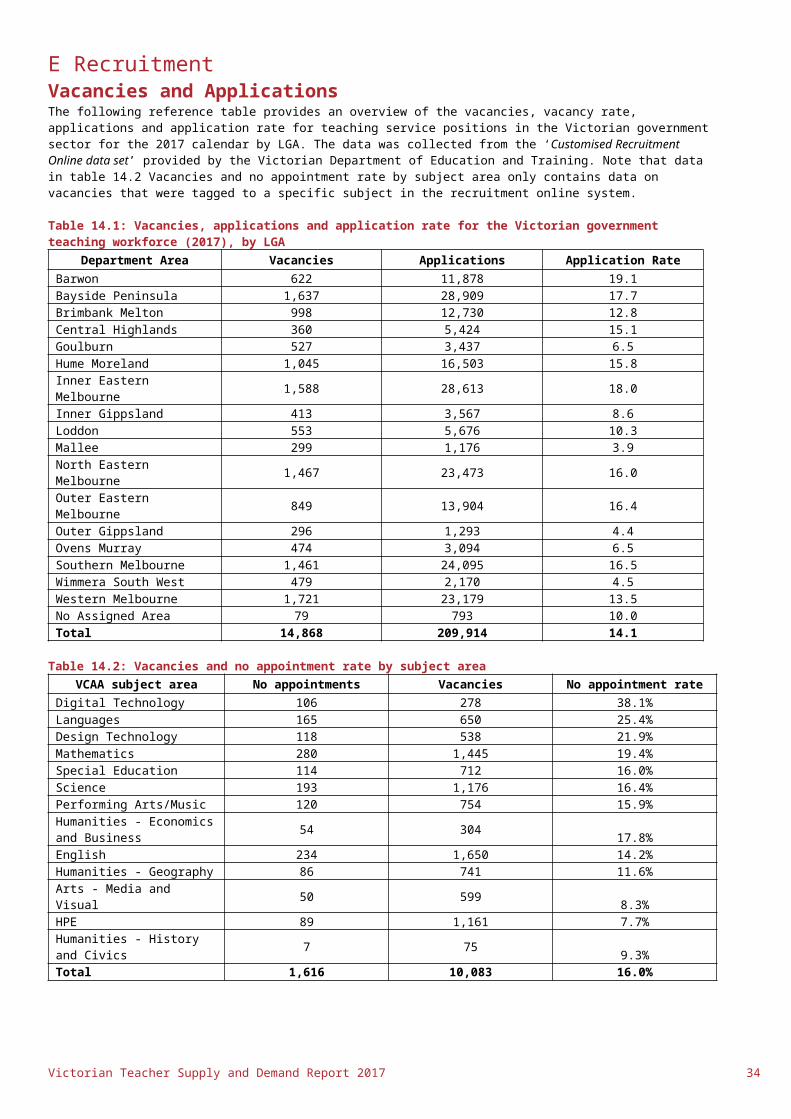
Secondary teaching workforceThe following reference table provides an overview of the number of teachers required to meet demand at Victorian secondary schools between 2007 and 2023 by sector. The number of teachers required to meet demand was forecast by matching the student to teacher ratio (headcount) to number of students enrolled at secondary schools for each sector. The lower 95% and upper 95% confidence intervals for the forecast number of secondary teacher headcount demand by government, Catholic and independent sectors are also provided. The data used to develop these forecasts was sourced from ‘Cat. No. 4221.0 Schools, Australia’, ‘February School Census (1987-2017), Vic DET’ and ‘Cat. No. 3412.0, Migration, Australia (2005-2017) from the ABS.’
Table 20.1: Actual (2007-2017) and forecast (2017-2023) headcount demand for teachers at Victorian secondary schools, by sector
YearGovernmen
t Lower 95%
Government Headcount
Number
Government Upper
95%Catholic
Lower 95%Catholic
Headcount Number
Catholic Upper 95%
Independent Lower
95%
Independent Headcount
Number
Independent Upper
95%
2007 - 20,858 - - 8,090 - - 8,536 -2008 - 20,969 - - 8,219 - - 8,722 -2009 - 21,061 - - 8,318 - - 8,892 -2010 - 21,173 - - 8,373 - - 8,953 -2011 - 21,242 - - 8,516 - - 9,138 -2012 - 20,570 - - 8,689 - - 9,196 -2013 - 20,367 - - 8,805 - - 9,385 -2014 - 19,964 - - 8,839 - - 9,304 -2015 - 20,103 - - 8,956 - - 9,520 -2016 - 20,451 - - 9,034 - - 9,756 -2017 - 21,304 - - 9,226 - - 9,780 -2018 21,236 21,489 21,742 8,998 9,098 9,198 10,022 10,136 10,2502019 21,547 21,806 22,065 9,328 9,431 9,535 10,449 10,568 10,6872020 22,099 22,358 22,617 9,735 9,840 9,944 10,919 11,039 11,1602021 22,694 22,953 23,212 10,133 10,238 10,343 11,379 11,501 11,6222022 23,348 23,607 23,865 10,537 10,642 10,748 11,860 11,982 12,1052023 24,018 24,276 24,535 10,943 11,049 11,155 12,358 12,481 12,604
The following reference table provides an overview of the student to teacher ratios (headcount) at Victorian secondary schools between 2007 and 2023. The student to teacher ratios (headcount) were projected by using a vector autoregression model with the student to teacher ratios in each sector used as an explanatory variable between 2001 and 2017. The model assumes that the student to teacher ratio in the government sector will impact the ratio in the Catholic and independent sectors and vice versa. The data used for the forecasts was sourced from ‘ABS 4221.0 Schools Australia.’
Table 20.2: Actual (2007-2017) and forecast (2018-2023) student to teacher ratios (headcount) at Victorian secondary schools by sector
Year Government Catholic Independent
2007 10.7 10.6 8.22008 10.7 10.6 8.32009 10.6 10.6 8.32010 10.6 10.7 8.22011 10.4 10.6 8.12012 10.7 10.5 8.12013 10.8 10.7 8.02014 11.0 10.7 8.12015 11.0 10.7 8.12016 11.0 10.6 8.02017 10.7 10.4 8.22018 10.7 10.5 8.12019 10.8 10.5 8.02020 10.9 10.5 8.02021 10.9 10.5 7.92022 10.9 10.5 7.92023 10.9 10.5 7.9
Victorian Teacher Supply and Demand Report 2017 SUPPLEMENTARY APPENDIX 34

Special and EAL teaching workforceThe following reference table provides an overview of the number of teachers required to meet demand at Victorian special schools between 2007 and 2023 by sector. The number of teachers required to meet demand was forecast by matching the student to teacher ratio (headcount) to number of students enrolled at special schools for each sector. The data used to develop these forecasts was sourced from ‘Cat. No. 4221.0 Schools, Australia’, ‘February School Census (1987-2017), Vic DET’ and ‘Cat. No. 3412.0, Migration, Australia (2005-2017) from the ABS.’
Table 21.1: Actual (2007-2017) and forecast (2017-2023) headcount demand for teachers at Victorian special schools, by sector
YearGovernmen
t Lower 95%
Government Headcount Number
Government Upper
95%
Catholic Lower 95%
Catholic Headcount Number
Catholic Upper 95%
Independent Lower
95%
Independent Headcount Number
Independent Upper
95%
2007 - 1,826 - - 31 - - 22 -2008 - 1,932 - - 33 - - 25 -2009 - 2,029 - - 26 - - 42 -2010 - 2,044 - - 22 - - 19 -2011 - 2,080 - - 34 - - 20 -2012 - 2,124 - - 34 - - 19 -2013 - 2,243 - - 29 - - 25 -2014 - 2,353 - - 30 - - 26 -2015 - 2,435 - - 31 - - 27 -2016 - 2,530 - - 32 - - 28 -2017 - 2,636 - - 34 - - 29 -2018 2,678 2,740 2,803 35 36 37 30 31 322019 2,738 2,833 2,929 36 37 38 31 32 332020 2,786 2,914 3,041 36 38 40 32 33 352021 2,817 2,977 3,138 37 39 41 32 34 362022 2,825 3,021 3,217 37 39 42 32 34 372023 2,806 3,041 3,277 37 40 43 32 35 37
The following reference table provides an overview of the number of teachers required to meet demand at Victorian EAL schools between 2007 and 2023 by sector. Data is only available for the government sector EAL schools. The number of teachers required to meet demand was forecast by matching the student to teacher ratio (headcount) to number of students enrolled at EAL schools for each sector. The data used to develop these forecasts was sourced from ‘Cat. No. 4221.0 Schools, Australia’, ‘February School Census (1987-2017), Vic DET’ and ‘Cat. No. 3412.0, Migration, Australia (2005-2017) from the ABS.’
Table 21.2: Actual (2007-2017) and forecast (2018-2023) headcount demand for teachers at Victorian EAL schools
Year Government Lower 95% Government Headcount number Government Upper 95%
2007 - 292 -2008 - 534 -2009 - 634 -2010 - 1,068 -2011 - 1,029 -2012 - 765 -2013 - 664 -2014 - 574 -2015 - 574 -2016 - 481 -2017 - 330 -2018 319 358 3972019 356 396 4372020 392 433 4742021 431 472 5132022 471 512 5542023 511 552 593
Victorian Teacher Supply and Demand Report 2017 SUPPLEMENTARY APPENDIX 35

G Government workforceGovernment teacher - Demographic characteristicsThe following reference table provides an overview of the active government teacher headcount in 2017, distributed across LGAs. The data is sourced from the Victorian Department of Education and Training’s ‘Customised EduPay data set’
Table 22.1: Government teacher headcount (2017), by LGA
LGANumber of teachers LGA
Number of teachers LGA
Number of teachers LGA
Number of teachers
Alpine 190 Gannawarra 107 Mansfield 69 Queenscliffe 17
Ararat 98 Glen Eira 868 Maribyrnong 747 South Gippsland 300
Ballarat 862 Glenelg 206 Maroondah 836 Southern Grampians 144
Banyule 1,102 Golden Plains 150 Melbourne 411 Stonnington 303
Bass Coast 275 Greater Bendigo 997 Melton 1,182 Strathbogie 83
Baw Baw 500 Greater Dandenong 1,307 Mildura 641 Surf Coast 228
Bayside 634 Greater Geelong 1,873 Mitchell 380 Swan Hill 223
Benalla 95 Greater Shepparton 633 Moira 216 Towong 100
Boroondara 1,191 Hepburn 114 Monash 1,759 Unincorporated Vic <5
Brimbank 1,740 Hindmarsh 93 Moonee Valley 882 Wangaratta 223
Buloke 133 Hobsons Bay 763 Moorabool 237 Warrnambool 291Campaspe 365 Horsham 184 Moreland 872 Wellington 366
Cardinia 754 Hume 1,891 Mornington Peninsula 1,272 West Wimmera 66
Casey 2,886 Indigo 131 Mount Alexander 161 Whitehorse 1,324
Central Goldfields 128 Kingston 1,058 Moyne 115 Whittlesea 1,596
Colac-Otway 184 Knox 1,018 Murrindindi 169 Wodonga 383Corangamite 209 Latrobe 648 Nillumbik 517 Wyndham 1,970
Darebin 1,200 Loddon 105 Northern Grampians 123 Yarra 678
East Gippsland 424 Macedon
Ranges 364 Port Phillip 492 Yarra Ranges 1,351
Frankston 1,303 Manningham 909 Pyrenees 61 Yarriambiack 107Non-School 316
Total 48,905
The following reference table provides an overview of age distribution of active government teachers in 2017, broken down by gender. The data is sourced from the Victorian Department of Education and Training’s ‘Customised EduPay data set’.
Table 22.2: Age distribution of active government teaching workforce (2017), by genderAge Bracket Female Male Total
<25 1,736 417 2,15325-29 6,089 1,968 8,05730-34 5,279 2,209 7,48835-39 4,355 1,963 6,31840-44 3,710 1,534 5,24445-49 3,520 1,251 4,77150-54 3,709 1,216 4,92555-59 3,753 1,477 5,23060-64 2,573 1,084 3,65765+ 693 369 1,062
Total 35,417 13,488 48,905
Government teacher - Employment characteristicsThe following reference table provides an overview of the employment classification of active government teachers in 2017, broken down by educational setting. The data is sourced from the Victorian Department of Education and Training’s ‘Customised EduPay data set’.
Victorian Teacher Supply and Demand Report 2017 SUPPLEMENTARY APPENDIX 36
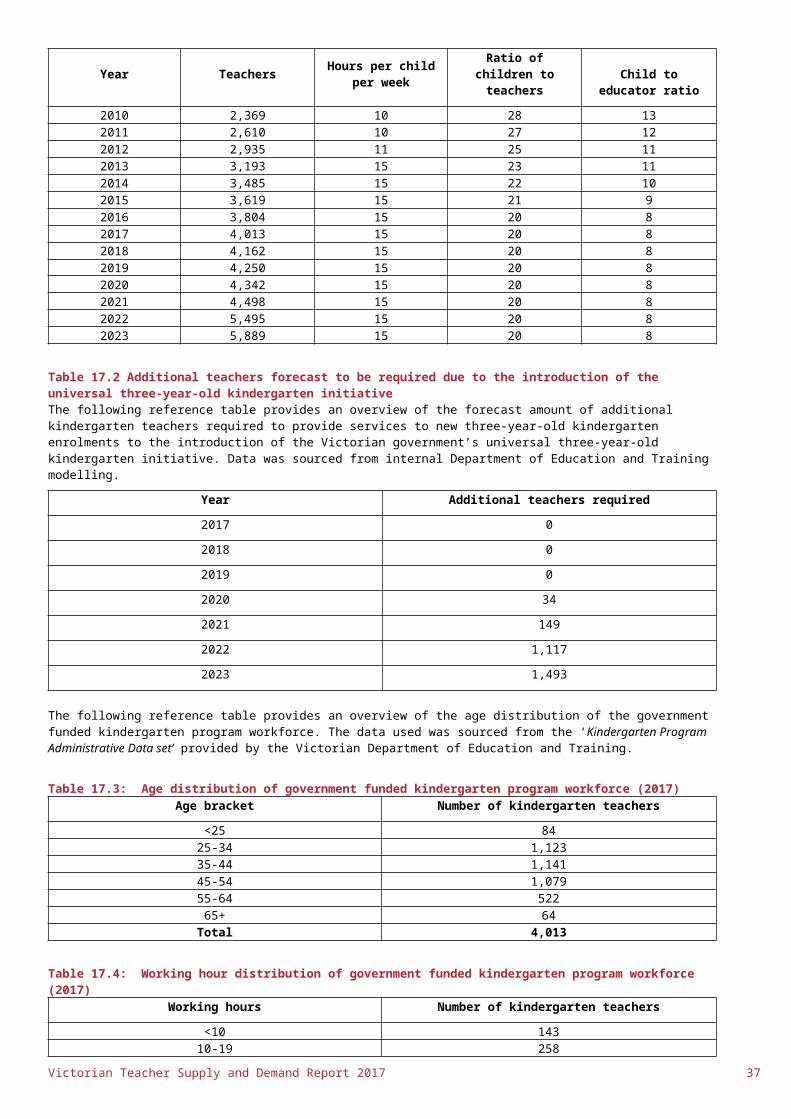
Table 23.1: Employment classification of the active government workforce (2017), by educational settingEmployment classification Primary Primary/Secondary Secondary
Special and other Total
Paraprofessional 7 38 202 46 293Teacher Class 21,199 3,846 14,660 2,633 42,338Leading Teacher 922 334 1,566 264 3,086Assistant Principal 786 172 532 116 1,606Principal 1,052 75 212 126 1,465Executive Class <5 5 12 97 117
Total 23,969 4,470 17,184 3,282 48,905
The following reference table provides an overview of the time fraction employment of active government teachers in 2017, broken down by educational setting. The data is sourced from the Victorian Department of Education and Training’s ‘Customised EduPay data set’.Table 23.2: Time fraction employment of the active government workforce (2017), by educational setting
Time fraction PrimaryPrimary/
Secondary SecondarySpecial and
other Total
Part Time 5,668 1,020 4,728 773 12,189Full Time 18,301 3,450 12,456 2509 36,716
Total 23,969 4,470 17,184 3,282 48,905
The following reference table provides an overview of the employment type of active government teachers in 2017, broken down by educational setting. The data is sourced from the Victorian Department of Education and Training’s ‘Customised EduPay data set’.
Table 23.3: Employment type of the active government workforce (2017), by educational settingEmployment
type PrimaryPrimary/
Secondary SecondarySpecial and
other Total
Fixed term 5,818 985 2,807 1,023 10,633Ongoing 18,151 3,485 14,377 2,259 38,272
Total 23,969 4,470 17,184 3,282 48,905
Government graduate teachers - Employment and demographic characteristicsThe following reference table provides an overview of the employment characteristics of graduate teachers employed in the Victorian government sector by LGA for the 2017 calendar year. The data is collected from the Victorian Department of Education and Training’s annual ‘Graduate recruitment census’. The following breakdowns are provided:
Number of graduate teachers employed at Victorian government schools Percentage of government graduate teachers employed on a full-time basis Percentage of government graduate teachers employed on a fixed term contract Percentage of government graduate teachers employed by educational setting (Primary, Secondary,
Primary/Secondary as well as Special and EAL) Number of graduate teachers employed at Victorian government schools by age band and gender.
Note, missing survey data means that not all government graduate teachers are reflected in each data table.
Table 24.1: Victorian government graduate teachers (2017) by LGA, full time, employment, and by educational setting
LGA
Number of graduate teachers
Full time
Fixed term Primary Primary/Secondary Secondary
Special and EAL
Alpine 7 86% 100% 29% 43% 29% 0%Ararat 7 86% 100% 57% 14% 29% 0%
Ballarat 42 79% 95% 62% 21% 17% 0%Banyule 66 97% 91% 64% 0% 30% 6%
Bass Coast 23 91% 83% 39% 0% 61% 0%Baw Baw 35 94% 94% 54% 0% 46% 0%Bayside 36 92% 97% 83% 8% 8% 0%Benalla 7 86% 100% 14% 0% 86% 0%
Boroondara 79 85% 95% 92% 3% 5% 0%Brimbank 94 85% 97% 55% 1% 40% 3%
Buloke 9 100% 100% 0% 33% 44% 22%Campaspe 24 88% 96% 58% 0% 42% 0%
Cardinia 63 95% 90% 75% 10% 16% 0%Casey 179 91% 92% 49% 15% 17% 20%
Central Goldfields 8 100% 100% 50% 50% 0% 0%Colac-Otway 8 100% 100% 50% 13% 25% 13%Corangamite 12 92% 100% 100% 0% 0% 0%
Victorian Teacher Supply and Demand Report 2017 SUPPLEMENTARY APPENDIX 37

LGA
Number of graduate teachers
Full time
Fixed term Primary Primary/Secondary Secondary
Special and EAL
Darebin 72 88% 94% 63% 4% 31% 3%East Gippsland 23 96% 96% 35% 13% 48% 4%
Frankston 81 81% 96% 51% 0% 42% 7%Gannawarra 7 100% 100% 71% 0% 29% 0%
Glen Eira 42 81% 100% 71% 10% 17% 2%Glenelg 14 64% 93% 71% 0% 29% 0%
Golden Plains 6 100% 100% 100% 0% 0% 0%Greater Bendigo 41 85% 93% 61% 12% 24% 2%
Greater Dandenong 78 97% 97% 55% 6% 37% 1%Greater Geelong 74 84% 97% 55% 14% 24% 7%
Greater Shepparton 35 77% 97% 83% 3% 14% 0%Hepburn 6 50% 100% 100% 0% 0% 0%
Hindmarsh 9 100% 56% 22% 33% 44% 0%Hobsons Bay 48 90% 98% 63% 0% 27% 10%
Horsham 6 83% 100% 67% 0% 17% 17%Hume 168 91% 90% 54% 2% 39% 5%Indigo 10 90% 90% 60% 0% 40% 0%
Kingston 47 94% 98% 77% 0% 23% 0%Knox 51 92% 94% 53% 0% 33% 14%
Latrobe 36 97% 97% 67% 6% 22% 6%Loddon 8 100% 100% 50% 0% 50% 0%
Macedon Ranges 25 92% 96% 56% 4% 40% 0%Manningham 54 93% 91% 65% 2% 30% 4%
Mansfield <5 75% 75% 100% 0% 0% 0%Maribyrnong 39 74% 97% 77% 0% 8% 15%Maroondah 46 89% 91% 59% 4% 30% 7%Melbourne 22 95% 95% 73% 0% 27% 0%
Melton 107 88% 86% 50% 13% 29% 8%Mildura 26 96% 92% 50% 15% 35% 0%Mitchell 33 88% 100% 61% 18% 21% 0%Moira 12 92% 50% 58% 0% 42% 0%
Monash 90 90% 94% 64% 1% 31% 3%Moonee Valley 33 91% 100% 61% 15% 24% 0%
Moorabool 7 71% 100% 71% 0% 29% 0%Moreland 64 92% 97% 69% 9% 20% 2%
Mornington Peninsula 64 92% 98% 78% 2% 9% 11%
Mount Alexander 8 75% 100% 88% 0% 13% 0%Moyne <5 67% 100% 100% 0% 0% 0%
Murrindindi 3 67% 100% 100% 0% 0% 0%Nillumbik 34 97% 91% 76% 0% 12% 12%Northern
Grampians 9 100% 100% 56% 0% 44% 0%Port Phillip 23 87% 96% 30% 22% 48% 0%Pyrenees 5 100% 100% 100% 0% 0% 0%
Queenscliffe <5 100% 100% 0% 0% 0%South Gippsland 16 88% 100% 94% 0% 6% 0%
Southern Grampians 10 80% 100% 90% 0% 10% 0%Stonnington 19 95% 100% 100% 0% 0% 0%Strathbogie 3 67% 100% 67% 0% 33% 0%Surf Coast 12 83% 100% 42% 58% 0% 0%Swan Hill 10 80% 50% 20% 0% 60% 20%Towong 8 88% 100% 25% 0% 75% 0%
Unincorporated Vic <5 100% 100% 100% 0% 0% 0%Wangaratta 12 83% 92% 50% 0% 33% 17%
Warrnambool 10 90% 80% 50% 0% 50% 0%Wellington 21 86% 86% 67% 5% 29% 0%
West Wimmera 6 100% 83% 17% 0% 83% 0%Whitehorse 94 88% 96% 71% 1% 19% 9%Whittlesea 107 93% 88% 61% 9% 21% 8%Wodonga 13 69% 100% 38% 0% 62% 0%Wyndham 159 92% 91% 52% 6% 36% 5%
Yarra 62 82% 98% 50% 2% 48% 0%Yarra Ranges 84 82% 99% 60% 12% 26% 2%Yarriambiack <5 67% 100% 0% 67% 33% 0%
Total 2,923 89% 94% 61% 6% 28% 5%
Victorian Teacher Supply and Demand Report 2017 SUPPLEMENTARY APPENDIX 38
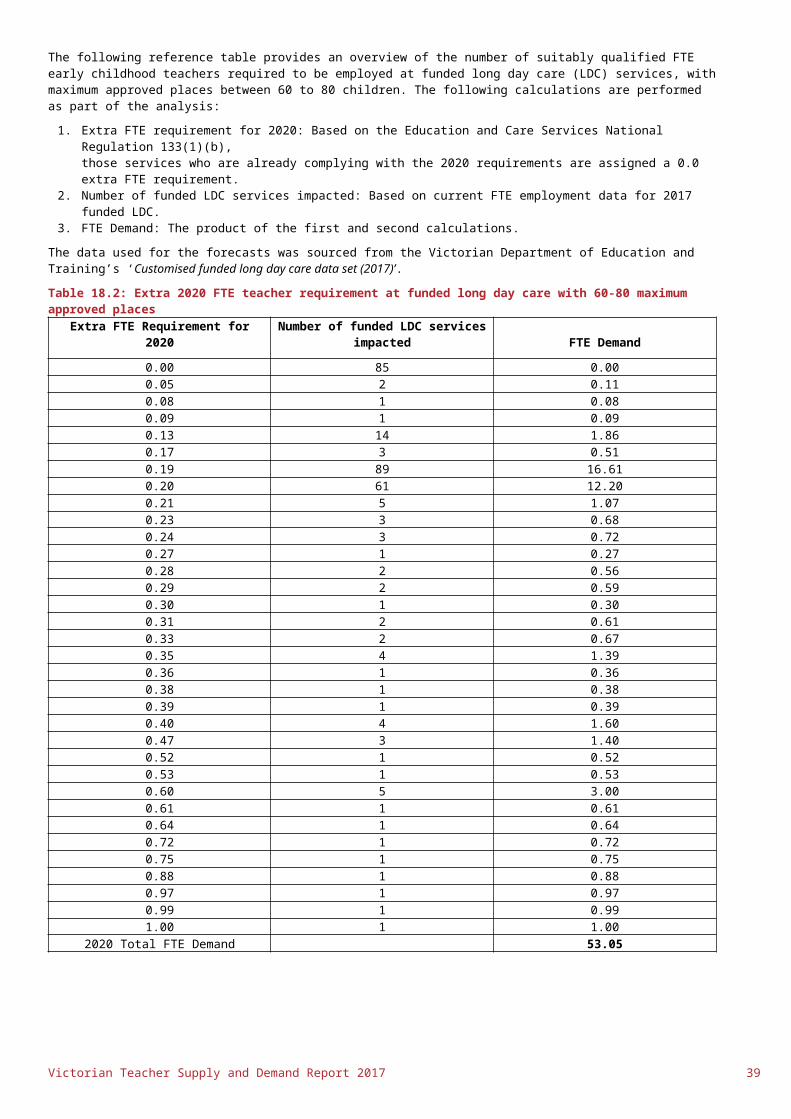
Table 24.2: Age distribution of government graduate teaching workforce (2017), by genderAge Bracket Female Male Total
<25 1,040 275 1,31525-29 654 299 95330-34 173 89 26235-44 220 71 29145-54 68 21 8955+ 4 7 11
Total 2,159 762 2,921
Government graduate teachers - Qualification characteristicsThe following reference table provides an overview of the subject specialisations by qualification name of graduate teachers employed in the Victorian government sector for the 2017 calendar year. A graduate teacher may nominate multiple subject specialisations; therefore, a single graduate teacher may be counted multiple times. The data is collected from the Victorian Department of Education and Training’s annual ‘Graduate recruitment census’.
Table 25.1: Subject specialisation of Victorian government graduate teachers (2017), by qualification nameSubject
SpecialisationEarly
ChildhoodEarly childhood /
Primary Primary Primary / Secondary Secondary
TESOL <5 <5 <5 10 9Special
Education <5 <5 28 16 <5
Digital Technology <5 <5 21 19 40
Music <5 <5 19 20 40Languages <5 <5 17 16 53
Mathematics <5 <5 41 69 188The Arts <5 <5 79 77 150
Other <5 <5 15 21 5SOSE <5 <5 28 101 255English <5 <5 76 109 254Science <5 <5 80 115 391
HPE <5 <5 133 279 233General Primary 10 102 1149 223 <5
Total 12 114 1,689 1,075 1,624
The following reference table provides an overview of the year of graduation by graduate teachers employed in the Victorian government sector for the 2017 calendar year. The data is collected from the Victorian Department of Education and Training’s annual ‘Graduate recruitment census’.
Table 25.2: Year of graduation of Victorian government graduate teachers (2017), by qualification nameYear of Graduation Early Childhood Early Childhood / Primary Primary Primary / Secondary Secondary
Prior to 2014 <5 5 88 40 772014 <5 8 186 94 1112015 <5 65 918 350 5022016 <5 15 97 49 842017 12 110 1,380 562 858
The following reference table provides an overview of the location of graduation by graduate teachers employed in the Victorian government sector for the 2017 calendar year. The data is collected from the Victorian Department of Education and Training’s annual ‘Graduate recruitment census’. Totals may not add up to 2,923 due to missing responses in the survey data.
Table 25.3: Location of graduation of Victorian government graduate teachers (2017), by qualification type
Location Early childhoodEarly childhood /
primary PrimaryPrimary /
secondary SecondaryVictorian 8 97 1,266 537 803Interstate <5 12 106 20 40Overseas <5 <5 7 5 15
Total 12 110 1,379 562 858
Government Casual Relief Teachers
Victorian Teacher Supply and Demand Report 2017 SUPPLEMENTARY APPENDIX 39

The following reference table provides an overview of the number of casual relief teachers employed in the Victorian government sector in 2017, broken down by LGA. The data is sourced from the Victorian Department of Education and Training’s ‘Customised casual relief teacher census’.
Table 26.1: Victorian government casual relief teacher numbers (2017), by LGA
LGANumber of CRTs LGA
Number of CRTs LGA
Number of CRTs LGA
Number of CRTs
Alpine 29 Gannawarra 20 Mansfield 11 Queenscliffe <5Ararat 15 Glen Eira 148 Maribyrnong 139 South Gippsland 50
Ballarat 156 Glenelg 38 Maroondah 130 Southern Grampians 24
Banyule 176 Golden Plains 33 Melbourne 33 Stonnington 51
Bass Coast 61 Greater Bendigo 127 Melton 206 Strathbogie 17
Baw Baw 88 Greater Dandenong 255 Mildura 102 Surf Coast 33
Bayside 95 Greater Geelong 340 Mitchell 49 Swan Hill 27
Benalla 13 Greater Shepparton 73 Moira 14 Towong 17
Boroondara 171 Hepburn 17 Monash 319 Unincorporated Vic. <5
Brimbank 290 Hindmarsh 6 Moonee Valley 147 Wangaratta 46
Buloke 16 Hobsons Bay 75 Moorabool 28 Warrnambool 53Campaspe 58 Horsham 14 Moreland 151 Wellington 49
Cardinia 102 Hume 344 Mornington Peninsula 248 West Wimmera 5
Casey 511 Indigo 23 Mount Alexander 39 Whitehorse 233
Central Goldfields 28 Kingston 162 Moyne 18 Whittlesea 261
Colac-Otway 30 Knox 172 Murrindindi 8 Wodonga 44Corangamite 21 Latrobe 111 Nillumbik 122 Wyndham 371
Darebin 154 Loddon 16 Northern Grampians 17 Yarra 85
East Gippsland 60 Macedon
Ranges 45 Port Phillip 65 Yarra Ranges 201
Frankston 185 Manningham 115 Pyrenees 6 Yarriambiack 13Total 7,826
The following reference table provides an overview of the total number of casual relief teachers employed in the Victorian government from 2008-2017. The data is sourced from the Victorian Department of Education and Training’s ‘Customised casual relief teacher census’.
Table 26.2: Victorian government casual relief teacher numbers, by yearYear Number of Casual Relief Teachers
2008 7,3332009 7,4042010 8,3492011 7,4452012 6,4842013 6,8902014 7,3352015 7,7782016 8,2882017 7,826
Table 26.3: Victorian government casual relief teacher difficult to fill vacanciesThe following reference table provides an overview of the total number of casual relief teacher roles that were recorded in the difficult to fill vacancies census in 2017. The data is sourced from the Victorian Department of Education and Training’s ‘Customised casual relief teacher census’.
SubjectVCAA Subject Area Number of Difficult to Fill CRT
Vacancies
AccountingHumanities- Economics and
business 1Art/Visual art Arts-Media and visual 8
Victorian Teacher Supply and Demand Report 2017 SUPPLEMENTARY APPENDIX 40

SubjectVCAA Subject Area Number of Difficult to Fill CRT
Vacancies
Asian Studies Humanities- History and Civics 1Automotive Design Technology 3
Biology Science 1
Business/CommerceHumanities- Economics and
business 1Chemistry Science 2
Chinese (Mandarin) Languages 1Drama/Theatre Studies Performing arts/music 2
EconomicsHumanities- Economics and
business 1English English 25
ESL English 12Food technology & Catering Design Technology 3
French Languages 1General Primary NA 369
Geography Humanities- Geography 1German Languages 1
Health Education HPE 1Hospitality & Tourism Design Technology 1
Indonesian Languages 4Information Technology/Computer
Science Digital technology 4Italian Languages 6
Japanese Languages 4
Legal StudiesHumanities- Economics and
business 1Library NA 1
Mathematics Mathematics 25Mathematics - VCE Mathematics 7
Mathematics - Years 7-10 Mathematics 1Music - Instrumental/Performing Arts Performing arts/music 1
Other Activities NA 2Other languages Languages 1
Outdoor Education/Outdoor & Environmental Science HPE 3
Physical Education HPE 27Physics Science 1
Psychology Science 3Science - General Science 13
Social Studies/Humanities/Sociology Humanities- Geography 3Special Education/Integration NA 47
Teacher of the Deaf NA 2Technology Studies - General Digital technology 8
VCAL NA 2Visual Communication & Design Design Technology 1
Wood technology/Carpentry/Building & Construction Design Technology 3
Student Family Occupation Education Index (SFOE)The Victorian Department of Education and Training uses Student Family Occupation and Education (SFOE) data to identify and fund socially disadvantaged students in government schools. Each year government schools collect data from parents regarding their occupation and level of educational attainment. SFOE data is used to allocate each student an equity score ranging from zero (most advantaged SFOE category) to one (most disadvantaged SFOE category). The Department uses student SFOE data to calculate an SFOE Index for each government school, which informs the average level of social disadvantage across a school’s student cohort.
Table 27.1: Teacher attrition by SFOE quartileSFOE Quartile Attrition rateMost advantage 4.5%
Moderate advantage 4.9%Moderate disadvantage 5.3%
Most disadvantage 5.7%
Table 27.2: Application rate by SFOE quartileVictorian Teacher Supply and Demand Report 2017 SUPPLEMENTARY APPENDIX 41

SFOE Quartile Application rateMost advantage 20.3
Moderate advantage 13.9Moderate disadvantage 10.3
Most disadvantage 10.0
Table 27.3: No appointment rate by SFOE quartileSFOE Quartile No appointment rateMost advantage 8.3%
Moderate advantage 14.6%Moderate disadvantage 14.0%
Most disadvantage 15.6%
Table 27.4: Percentage of teachers who are graduates by SFOE quartileSFOE Quartile Percentage of teachersMost advantage 5.5%
Moderate advantage 5.7%Moderate disadvantage 5.4%
Most disadvantage 5.4%
Table 27.5: Number of schools by SFOE quartileSFOE Quartile Primary Primary/Secondary Secondary TotalMost advantage 29% 9% 18% 23%
Moderate advantage 26% 28% 22% 25%Moderate disadvantage 24% 38% 28% 25%
Most disadvantage 21% 24% 33% 26%
Table 27.6: Number of teachers by SFOE quartileSFOE Quartile Major city Inner regional Outer regional and remoteMost advantage 35% 7% 3%
Moderate advantage 23% 29% 22%Moderate disadvantage 18% 33% 41%
Most disadvantage 23% 31% 33%
Table 27.7: Average FTE student/ teacher ratioSFOE Quartile RatioMost advantage 14.2
Moderate advantage 13.3Moderate disadvantage 12.3
Most disadvantage 10.8
Victorian Teacher Supply and Demand Report 2017 SUPPLEMENTARY APPENDIX 42
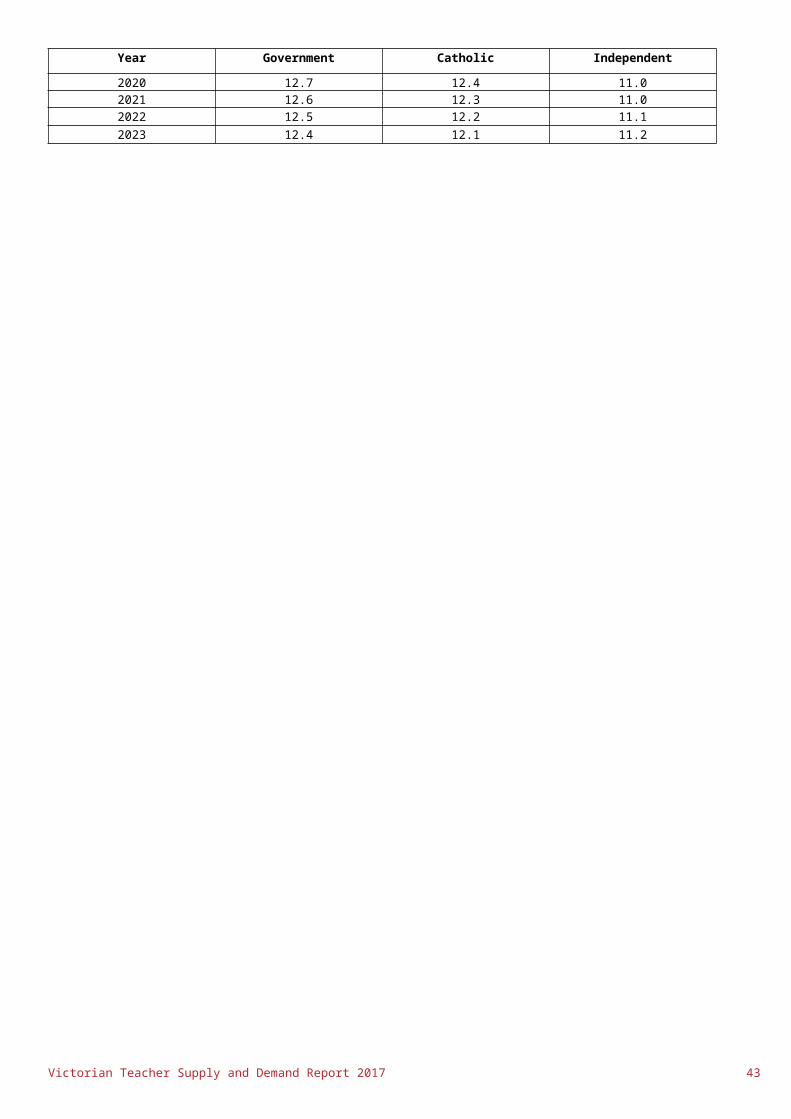
H Catholic workforceDemographic characteristicsThe following reference table provides an overview of the active FTE number of Catholic teachers in 2017, distributed across department areas. The data is collected during the August Catholic schools census, and sourced from Catholic Education Melbourne’s ‘Customised Catholic teaching workforce data set’.
Table 28.1: Number of FTE Catholic teachers (2017), by department areaDepartment area Number of FTE teachers
Barwon 849Bayside Peninsula 2,026Brimbank Melton 896Central Highlands 573Goulburn 451Hume Moreland 895Inner Eastern Melbourne 1,766Inner Gippsland 415Loddon 721Mallee 266North Eastern Melbourne 1,516Outer Eastern Melbourne 738Outer Gippsland 238Ovens Murray 427Southern Melbourne 1,085Wimmera South West 462Western Melbourne 1,733Unassigned area 197
Total 15,254
The following reference table provides an overview of the age distribution of the 2017 Catholic FTE teaching workforce. The percentage data is sourced from Catholic Education Melbourne’s ‘Customised Catholic teaching workforce data set’. Note, age distribution data is not sourced from the August Catholic workforce census. Percentage breakdowns have been provided by Catholic Education Melbourne based on internal systems taken at a different time point. These percentages have been applied to the 15,296 total teaching FTE reported in ‘NSSC Table 51a: In-school Staff (FTE), ABS 4221.0 Schools, Australia’ in order to provide an indicative distribution of the equivalent number of FTE teachers.
Table 28.2: Age distribution of Catholic workforce (2017)Age bracket Percentage Equivalent ABS FTE teacher number
< 25 2.48% 379.325 - 34 25.49% 3,899.135 - 44 21.76% 3,328.045 - 54 26.45% 4,046.255 - 64 21.11% 3,229.2
65+ 2.64% 404.1Total 15,296
Victorian Teacher Supply and Demand Report 2017 SUPPLEMENTARY APPENDIX 43

Employment characteristicsThe following reference table provides an overview of the employment classification of the 2017 FTE Catholic teaching workforce. The percentage data is sourced from Catholic Education Melbourne’s ‘Customised Catholic teaching workforce data set’. Note, employment classification data is not sourced from the annual August Catholic workforce census. Percentage breakdowns have been provided by Catholic Education Melbourne based on internal systems taken at a different time point. These percentages have been applied to the 15,296 total teaching FTE reported in ‘NSSC Table 51a: In-school Staff (FTE), ABS 4221.0 Schools, Australia’ in order to provide an indicative distribution of the equivalent number of FTE teachers.
Table 29.1: Employment classification of the Catholic teaching workforce (2017)Employment classification Percentage Equivalent ABS FTE teacher number
Para -professional 0.4% 59.5Teacher 92.5% 14,148.8Deputy Principal 3.7% 567.8Principal 3.4% 520.6
Total 15,296
The following reference table provides an overview of the time fraction employment of the 2017 FTE Catholic teaching workforce, broken down by gender. The data is collected during the August Catholic schools census, and sourced from Catholic Education Melbourne’s ‘Customised Catholic teaching workforce data set’.
Table 29.2: Time fraction employment of Catholic teaching workforce (2017), by genderTime Fraction Percentage Teacher Number
Full time 75.7% 11,548Part time 24.3% 3,705
Total 15,252.9
The following reference table provides an overview of the employment type of the 2017 FTE Catholic teaching workforce. The percentage data is sourced from Catholic Education Melbourne’s ‘Customised Catholic teaching workforce data set’. Note, employment classification data is not sourced from the annual August Catholic workforce census. Percentage breakdowns have been provided by Catholic Education Melbourne based on internal systems taken at a different time point. These percentages have been applied to the 15,296 total teaching FTE reported in ‘NSSC Table 51a: In-school Staff (FTE), ABS 4221.0 Schools, Australia’ in order to provide an indicative distribution of the equivalent number of FTE teachers.
Table 29.3: Employment type of Catholic teaching workforce (2017)Employment type Percentage Equivalent ABS FTE teacher number
Fixed-term 18.5% 2,829.2Ongoing 81.1% 12,396.0
Total 15,225
The following reference table provides an overview of the school curriculum where the 2017 FTE Catholic teaching workforce works, broken down by gender. The data is collected during the August Catholic schools census, and sourced from Catholic Education Melbourne’s ‘Customised Catholic teaching workforce data set’.
Table 29.4: School curriculum of Catholic teaching workforce (2017), by genderSchool Curriculum Female Male All
Primary 5,972.4 1,196.5 7,168.9Secondary 4,165.7 2,740.0 6,905.7Combined 693.5 442.8 1,136.3Special 27.8 14.2 42.0
Total 10,859.4 4,393.5 15,252.9
Victorian Teacher Supply and Demand Report 2017 SUPPLEMENTARY APPENDIX 44

I Independent school workforceEmployment characteristics
The following reference table provides an overview of the employment classification of the 2017 FTE Independent teaching workforce. The percentage data is sourced from The Independent Schools Victoria ‘Annual HR survey’.
Table 30.1: Independent school workforce by school typeSchool type Percentage
Early childhood and primary 2%
Early childhood, primary and secondary 72%
Primary 2%
Primary and secondary 24%
Secondary 1%
Table 30.2: Independent school workforce by school typeSchool type Early Learning teachers Primary Teachers Secondary Teachers
Early childhood and primary 19 111 0
Early childhood, primary and secondary 259 1,917 4,296
Primary 1 117 46
Primary and secondary 0 752 1,346
Secondary 0 0 89
Table 30.3: Independent school workforce by genderGender Percentage
Female 70%
Male 30%
Table 30.4: Independent school workforce by age bandsAge Percentage
<25 1%
25- 34 21%
35 -44 27%
45-54 28%
55-64 19%
65+ 4%
J AttritionGovernment workforce attritionThe following reference table provides an overview of the attrition rate of the Victorian government workforce in 2017, broken down by LGA. The data is sourced from the Victorian Department of Education and Training’s ‘Customised attrition data set’.
Table 31.1: Victorian government workforce attrition (2017), by LGA
LGAAttrition
rate LGAAttrition
rate LGAAttrition
rate LGAAttrition
rate
Alpine 2.7% Gannawarra 7.7% Mansfield 8.3% Queenscliffe 17.1%Ararat 13.2% Glen Eira 4.4% Maribyrnong 4.7% South Gippsland 5.8%
Ballarat 5.8% Glenelg 5.5% Maroondah 5.6% Southern Grampians 9.1%
Victorian Teacher Supply and Demand Report 2017 SUPPLEMENTARY APPENDIX 45

LGAAttrition
rate LGAAttrition
rate LGAAttrition
rate LGAAttrition
rate
Banyule 4.2% Golden Plains 5.3% Melbourne 4.1% Stonnington 3.8%Bass Coast 3.6% Greater Bendigo 3.3% Melton 5.0% Strathbogie 11.0%
Baw Baw 4.4% Greater Dandenong 5.9% Mildura 6.0% Surf Coast 1.7%
Bayside 4.4% Greater Geelong 4.8% Mitchell 5.4% Swan Hill 6.9%
Benalla 8.5% Greater Shepparton 3.7% Moira 8.2% Towong 9.0%
Boroondara 4.9% Hepburn 5.8% Monash 4.6% Wangaratta 9.1%Brimbank 4.4% Hindmarsh 9.8% Moonee Valley 5.5% Warrnambool 7.2%Buloke 7.5% Hobsons Bay 5.9% Moorabool 4.0% Wellington 7.7%Campaspe 6.8% Horsham 6.7% Moreland 6.2% West Wimmera 7.7%
Cardinia 3.6% Hume 5.0% Mornington Peninsula 4.8% Whitehorse 5.2%
Casey 3.9% Indigo 6.6% Mount Alexander 6.0% Whittlesea 3.9%Central Goldfields 12.5% Kingston 5.8% Moyne 6.4% Wodonga 4.8%
Colac-Otway 4.9% Knox 6.2% Murrindindi 5.0% Wyndham 3.6%Corangamite 11.1% Latrobe 6.7% Nillumbik 5.2% Yarra 6.1%
Darebin 5.3% Loddon 5.7% Northern Grampians 6.1% Yarra Ranges 5.0%
East Gippsland 5.8% Macedon Ranges 6.3% Port Phillip 5.5% Yarriambiack 7.1%
Frankston 4.3% Manningham 4.9% Pyrenees 6.2% Non-school (Unknown) 7.4%
The following reference table provides an overview of the attrition rate of the Victorian government workforce in 2017, broken down by employment type. The data is sourced from the Victorian Department of Education and Training’s ‘Customised attrition data set’.
Table 31.2: Victorian government workforce attrition (2017), by employment typeEmployment Type Attrition rate
Paraprofessional 27.5%Classroom Teacher 5.1%
Leading Teacher 3.7%Assistant Principal 4.3%
Principal 6.9%
The following reference table provides an overview of the attrition rate of the Victorian government workforce in 2017, broken down by age bracket. The data is sourced from the Victorian Department of Education and Training’s ‘Customised attrition data set’.
Table 31.3: Victorian government workforce attrition (2017), by ageAge bracket Attrition rate
<35 3.2%35-44 3.9%45-54 3.0%55-64 10.0%65+ 22.8%
Table 31.4: Victorian government resignations and retirement rate by genderGender Resignations Retirements
Women 3.1% 1.6%
Men 3.3% 2.0%
Table 31.5: Victorian government resignations and retirement rate by time fractionGender Resignations Retirements
Full time 3.1% 1.4%
Part time 3.7% 3.3%
Table 31.6: Victorian government resignations and retirement rate by geographic remotenessGender Resignations Retirements
Victorian Teacher Supply and Demand Report 2017 SUPPLEMENTARY APPENDIX 46

Major city 3.1% 1.5%
Inner regional 3.3% 2.3%
Outer regional and remote 4.1% 2.2%
Table 31.7: Victorian government resignations and retirement rate by school typeGender Resignations Retirements
Primary 2.7% 1.7%
Primary/ secondary 3.4% 1.7%
Secondary 3.7% 1.7%
EAL 1.8% 0.7%
Special 4.6% 2.3%
Table 31.8: Victorian government resignations and retirement rate by age bandAge bracket Resignations Retirements
<35 3.1% 0%35-44 3.7% 0%45-54 2.7% 0.2%55-64 3.1% 6.5%65+ 3.7% 18.0%
Table 31.9: Victorian government workforce attrition (2017), by yearYear Attrition rate
2012 4.7%2013 4.4%2014 5.0%2015 5.0%2016 5.1%2017 5.1%
Catholic workforce attritionThe following reference table provides an overview of the attrition rate of the Victorian government workforce in 2017, broken down by department area. The data is sourced from Catholic Education Melbourne’s ‘Customised attrition data set’.
Table 32.1: Catholic workforce attrition (2017), by department areaDepartment area Attrition rate
Barwon 3.9%Bayside Peninsula 5.3%Brimbank Melton 3.1%Central Highlands 5.0%Goulburn 5.3%Hume Moreland 3.7%Inner Eastern Melbourne 4.7%Inner Gippsland 4.5%Loddon 5.1%Mallee 3.9%North Eastern Melbourne 5.2%Outer Eastern Melbourne 7.0%Outer Gippsland 8.7%Ovens Murray 4.1%Southern Melbourne 4.5%Wimmera South West 4.4%Western Melbourne 4.7%
The following reference table provides an overview of the attrition rate of the Victorian government workforce in 2017, broken down by employment type. The data is sourced from Catholic Education Melbourne’s ‘Customised attrition data set’.
Table 32.3: Catholic workforce attrition (2017), by employment typeEmployment Type Attrition rate
Teacher 5.0%Deputy Principal 2.3%
Principal 3.5%Victorian Teacher Supply and Demand Report 2017 SUPPLEMENTARY APPENDIX 47

The following reference table provides an overview of the attrition rate of the Victorian government workforce in 2017, broken down by age bands. The data is sourced from Catholic Education Melbourne’s ‘Customised attrition data set’.
Table 32.4: Catholic workforce attrition (2017), by ageAge bracket Attrition rate
<25 5.1%25-35 3.9%35-44 4.2%45-54 2.4%55-64 6.2%65+ 20.8%
The following reference table provides an overview of the attrition rate of the Victorian government workforce in 2017, broken down by year. The data is sourced from Catholic Education Melbourne’s ‘Customised attrition data set’.
Table 32.5: Catholic workforce attrition (2017), by yearYear Attrition rate
2012 4.8%2013 4.5%2014 4.3%2015 4.6%2016 4.6%2017 4.8%
Victorian Teacher Supply and Demand Report 2017 SUPPLEMENTARY APPENDIX 48

K Early childhoodKindergarten enrolmentsThe following reference table provides an overview of actual and forecast number of enrolments in Victorian government funded kindergarten and early start kindergarten (ESK) programs between 2007 and 2023. The proportion of children aged three, four, five and six years old’s attending government funded kindergarten programs were projected using a univariate ARIMA model and applied to the ABS Series B population projections. The reference table below also provides number of children enrolled, children with disability, and repeating children in government funded kindergarten programs, which are a subset of total kindergarten enrolments. This data is sourced from ‘ABS 3222.0 Population Projections, Australia, 2012 (base) to 2101, Series B’, ‘Kindergarten Program Administrative Data set, Vic DET,” and ‘Early start kindergarten data set (2008-2017), Victorian Department of Education and Training’.
Table 33.1: Actual (2007-2017) and forecast (2018-2023) child enrolments in Victorian government funded kindergarten programs and early start kindergarten
YearKindergarten
enrolment
Early start kindergarten
enrolment Enrolment total
Kindergarten child with disability Repeating
2007 59,453 - 59,453 3,427 1,9562008 60,968 109 61,077 3,694 2,1512009 62,365 272 62,637 4,138 2,6252010 66,651 463 67,114 4,139 2,5132011 69,980 554 70,534 2,884 2,6742012 72,159 571 72,730 2,989 2,8672013 72,774 524 73,298 3,042 3,0042014 74,356 791 75,147 2,925 3,2002015 74,650 1,006 75,656 3,163 3,2102016 76,627 1,189 77,816 3,520 3,1162017 79,349 1,529 80,878 3,984 3,7402018 81,354 1,758 83,112 4,085 3,8342019 82,507 2,022 84,529 4,143 3,8892020 84,145 2,278 86,424 4,200 3,9422021 87,215 2,298 89,513 4,253 3,9932022 146,133 <5 146,133 4,300 4,0362023 152,899 <5 152,899 4,338 4,072
Table 33.2: Additional enrolments forecast due to the introduction of the universal three year-old kindergarten initiativeThe following reference table provides an overview of the forecast amount of additional kindergarten enrolments due to the introduction of the Victorian government’s universal three-year-old kindergarten initiative. Data was sourced from internal Department of Education and Training modelling.
Year Additional Kindergarten Enrolments
2017 0
2018 0
2019 0
2020 500
2021 2,500
2022 60,500
2023 66,500
The following reference table provides an overview of the distribution of child enrolments in government funded kindergarten programs, including early start kindergarten. This data is sourced from the Victorian Department of Education and Training’s ‘Kindergarten Program Administrative Data set’ and ‘Early start kindergarten data set (2008-2017)’.
Table 33.3: Child enrolments in government funded kindergarten programs (2017), including early start kindergarten, by LGA
LGA Child enrolment LGA Child
enrolment LGA Child enrolment LGA Child
enrolment
Alpine 139 Gannawarra 111 Mansfield 85 Queenscliffe 37
Ararat 130 Glen Eira 1,793 Maribyrnong 1,013 South Gippsland 366
Ballarat 1,540 Glenelg 237 Maroondah 1,526 Southern Grampians 200
Banyule 1,643 Golden Plains 270 Melbourne 964 Stonnington 1,053
Victorian Teacher Supply and Demand Report 2017 SUPPLEMENTARY APPENDIX 49
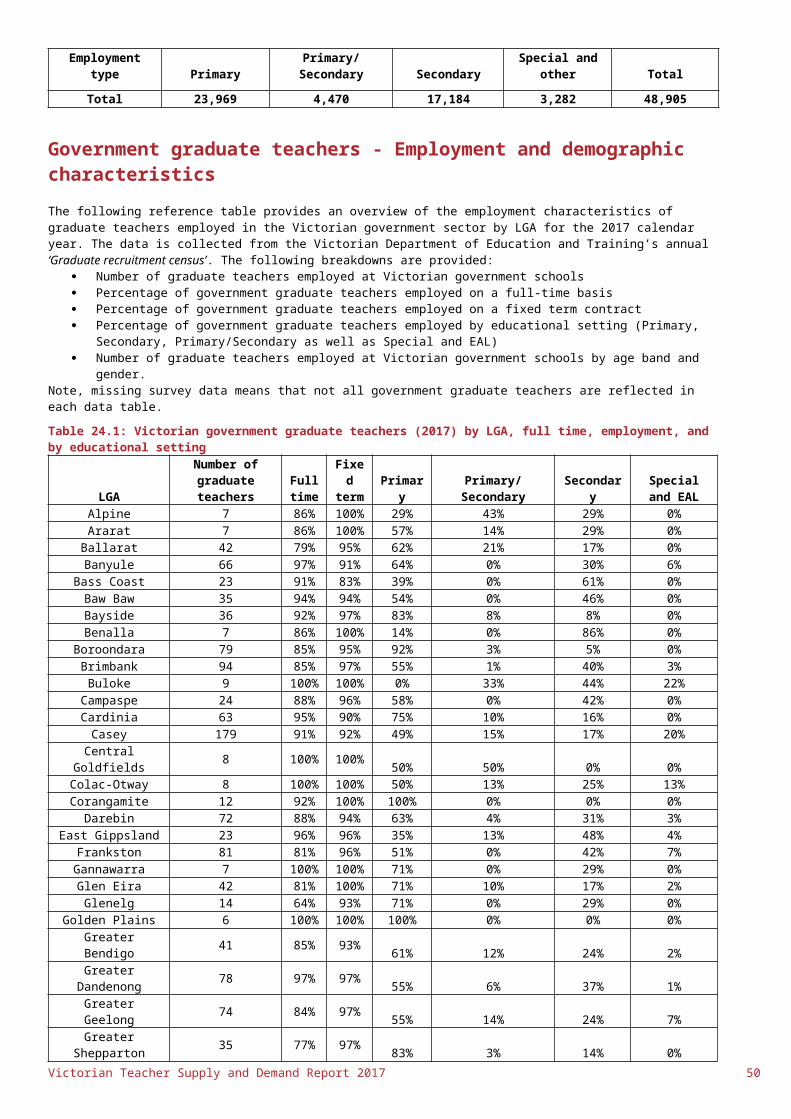
LGA Child enrolment LGA Child
enrolment LGA Child enrolment LGA Child
enrolment
Bass Coast 371 Greater Bendigo 1,662 Melton 2,488 Strathbogie 104
Baw Baw 627 Greater Dandenong 2,143 Mildura 762 Surf Coast 445
Bayside 1239 Greater Geelong 3,308 Mitchell 611 Swan Hill 329
Benalla 151 Greater Shepparton 983 Moira 378 Towong 56
Boroondara 1,868 Hepburn 169 Monash 2,301 Wangaratta 366Brimbank 2,792 Hindmarsh 62 Moonee Valley 1,601 Warrnambool 481
Buloke 61 Hobsons Bay 1,322 Moorabool 434 Wellington 539
Campaspe 527 Horsham 281 Moreland 2,151 West Wimmera 31
Cardinia 1,806 Hume 3,124 Mornington Peninsula 1,992 Whitehorse 2,015
Casey 4,683 Indigo 208 Mount Alexander 187 Whittlesea 3,233
Central Goldfields 163 Kingston 1,744 Moyne 183 Wodonga 729
Colac-Otway 301 Knox 1,856 Murrindindi 125 Wyndham 4,455Corangamite 243 Latrobe 1,048 Nillumbik 853 Yarra 977
Darebin 1,617 Loddon 61 Northern Grampians 144 Yarra Ranges 1,967
East Gippsland 491 Macedon
Ranges 668 Port Phillip 896 Yarriambiack 61
Frankston 1,919 Manningham 1,319 Pyrenees 59Total 80,877
Victorian Teacher Supply and Demand Report 2017 SUPPLEMENTARY APPENDIX 50

L Primary studentsPrimary student enrolmentsThe following reference tables provides an overview of the number of student enrolments on an FTE basis at Victorian primary schools between 2007 and 2023, broken down by sector. The forecasts between 2017 and 2023 were projected using a vector autoregression model with exogenous variables. The exogenous variables used were the lagged enrolments of the previous grade and net migration of five to eleven-year-olds to Victoria. The lower 95% and upper 95% confidence intervals for forecast primary enrolments by government, Catholic and independent sectors are also provided. The data used for the forecasts was sourced from the ‘February School Census (1987-2017), Vic DET’ and ‘Cat. No. 3412.0, Migration, Australia (2015-2017), ABS.’ Overall totals between ‘February School Census (1987-2017) (Table 34.1) and ‘All Schools FTE enrolments - Feb 2017’ (Table 34.2) are different due to possible differences in data collection methodology and timing.
Table 34.1: Actual (2007-2017) and forecast (2018-2023) student enrolments at Victorian primary schools, by sector
YearGovernmen
t Lower 95%
Government FTE
EnrolmentGovernment Upper 95%
Catholic Lower 95%
Catholic FTE
Enrolment
Catholic Upper 95%
Independent Lower
95%
Independent FTE
Enrolment
Independent Upper
95%
2007 - 306,223 - - 98,307 - - 43,282 -2008 - 305,005 - - 98,979 - - 44,707 -2009 - 306,304 - - 100,257 - - 45,786 -2010 - 306,685 - - 101,554 - - 47,046 -2011 - 309,092 - - 103,545 - - 48,525 -2012 - 315,031 - - 105,877 - - 50,136 -2013 - 323,086 - - 108,137 - - 51,362 -2014 - 332,016 - - 110,175 - - 53,045 -2015 - 340,845 - - 111,233 - - 54,661 -2016 - 350,583 - - 111,657 - - 56,267 -2017 - 361,722 - - 112,354 - - 57,854 -2018 368,356 370,722 373,089 111,508 112,168 112,828 59,403 59,769 60,1352019 374,671 377,061 379,451 113,333 113,992 114,650 61,486 61,860 62,2342020 380,246 382,654 385,063 114,560 115,214 115,868 63,139 63,518 63,8972021 386,514 388,941 391,368 115,777 116,427 117,076 64,738 65,121 65,5052022 392,416 394,861 397,307 116,719 117,363 118,007 66,130 66,517 66,9042023 398,167 400,632 403,097 117,492 118,131 118,769 67,386 67,776 68,166
The following reference table provides an overview of the number of FTE student enrolments at Victorian primary schools in 2017, broken down by local government area (LGA). The data was sourced from the Victorian Department of Education and Training’s ‘All Schools FTE enrolments - Feb 2017’ data set. Note that 37 students in the Unincorporated Victoria LGA are not presented in the summary figure.
Table 34.2: 2017 FTE student enrolments at Victorian primary schools, by LGALGA FTE LGA FTE LGA FTE LGA FTE
Alpine 1,039 Gannawarra 781 Mansfield 767 Queenscliffe 339Ararat 929 Glen Eira 12,116 Maribyrnong 5,482 South Gippsland 2,501
Ballarat 10,218 Glenelg 1,445 Maroondah 9,080 Southern
Grampians 1,473Banyule 11,475 Golden Plains 1,909 Melbourne 4,148 Stonnington 5,815
Bass Coast 2,713 Greater Bendigo 10,371 Melton 15,002 Strathbogie 789
Baw Baw 5,451Greater
Dandenong 13,516 Mildura 5,324 Surf Coast 2,869Bayside 9,854 Greater Geelong 21,331 Mitchell 3,929 Swan Hill 2,007
Benalla 917Greater
Shepparton 6,408 Moira 2,621 Towong 435Boroondara 16,845 Hepburn 1,142 Monash 15,720 Wangaratta 2,674Brimbank 18,219 Hindmarsh 418 Moonee Valley 11,956 Warrnambool 3,303
Buloke 538 Hobsons Bay 8,313 Moorabool 3,795 Wellington 3,886Campaspe 3,474 Horsham 1,756 Moreland 12,115 West Wimmera 288
Cardinia 10,111 Hume 21,806Mornington Peninsula 14,919 Whitehorse 13,665
Casey 31,403 Indigo 1,348Mount
Alexander 1,475 Whittlesea 18,657Central
Goldfields 1,044 Kingston 12,836 Moyne 1,341 Wodonga 4,139Colac-Otway 1,825 Knox 12,473 Murrindindi 1,038 Wyndham 25,698Corangamite 1,514 Latrobe 6,317 Nillumbik 6,452 Yarra 5,888
Darebin 10,191 Loddon 496Northern
Grampians 824 Yarra Ranges 14,012East
Gippsland 3,554 Macedon Ranges 4,875 Port Phillip 4,911 Yarriambiack 568Frankston 11,235 Manningham 9,463 Pyrenees 353 Total 531,931
Victorian Teacher Supply and Demand Report 2017 SUPPLEMENTARY APPENDIX 51
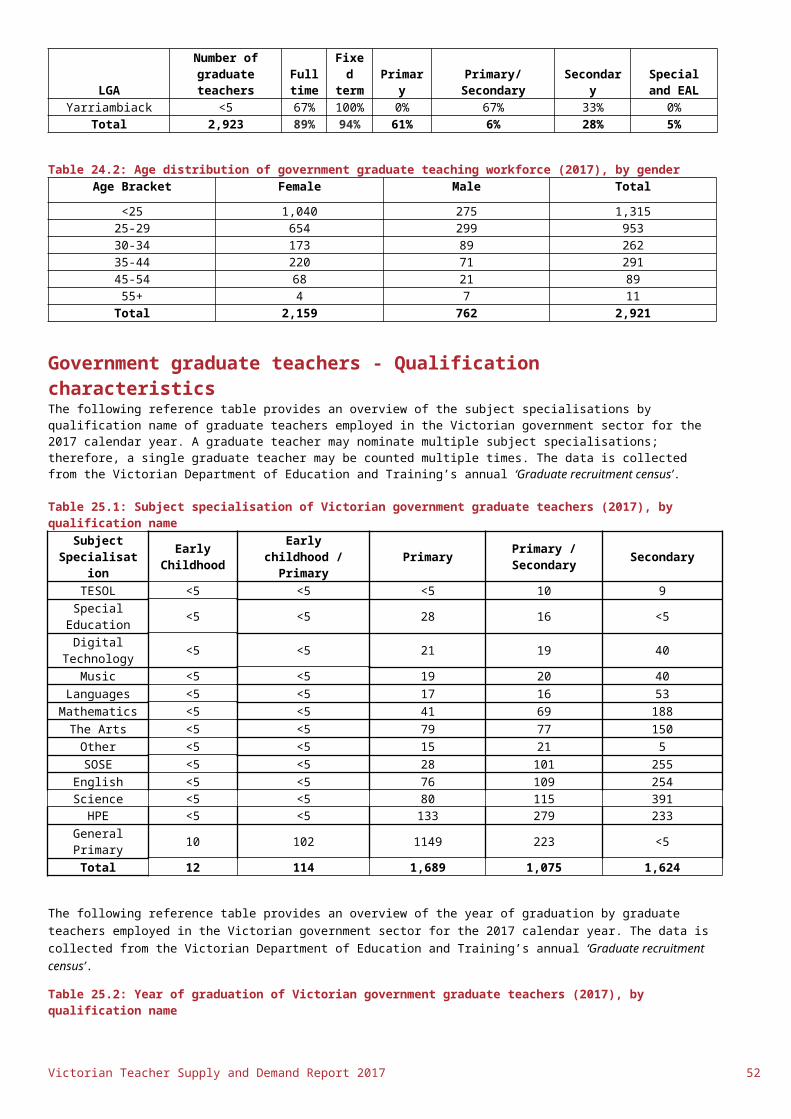
M Secondary studentsSecondary student enrolmentsThe following reference table provides an overview of the number of student enrolments on an FTE basis at Victorian secondary schools between 2007 and 2023, broken down by sector. The forecasts between 2017 and 2023 were projected using a vector autoregression model with exogenous variables. The exogenous variables used were the lagged enrolments of the previous grade and net migration of 12 to 19-year-olds to Victoria. The lower 95% and upper 95% confidence intervals for forecast secondary enrolments by government, Catholic and independent sectors are also provided. The data used for the forecasts was sourced from the ‘February School Census (1987-2017), Vic DET’ and ‘Cat. No. 3412.0, Migration, Australia (2015-2017), ABS.’ Overall totals between ‘February School Census (1987-2017) (Table 35.1) and ‘All Schools FTE enrolments - Feb 2017’ (Table 35.2) are different due to possible differences in data collection methodology and timing.
Table 35.1: Actual (2007-2017) and forecast (2018-2023) student enrolments at Victorian secondary schools, by sector
YearGovernmen
t Lower 95%
Government FTE
EnrolmentGovernment Upper 95%
Catholic Lower 95%
Catholic FTE
Enrolment
Catholic Upper 95%
Independent Lower
95%
Independent FTE
Enrolment
Independent Upper
95%
2007 - 223,290 - - 85,604 - - 70,293 -2008 - 223,331 - - 87,016 - - 72,623 -2009 - 223,423 - - 87,964 - - 73,629 -2010 - 223,414 - - 89,192 - - 73,808 -2011 - 221,728 - - 90,259 - - 74,110 -2012 - 219,755 - - 91,616 - - 74,713 -2013 - 219,169 - - 93,784 - - 74,682 -2014 - 219,543 - - 94,646 - - 75,495 -2015 - 221,458 - - 95,394 - - 76,738 -2016 - 224,221 - - 96,036 - - 77,849 -2017 - 227,395 - - 96,076 - - 80,369 -2018 227,884 230,600 233,315 94,720 95,771 96,822 80,948 81,867 82,7862019 232,758 235,556 238,354 98,154 99,243 100,332 83,511 84,463 85,4142020 239,797 242,608 245,418 102,277 103,374 104,471 86,869 87,828 88,7862021 247,047 249,865 252,683 106,355 107,457 108,559 90,345 91,309 92,2742022 254,874 257,699 260,524 110,545 111,651 112,757 94,032 95,002 95,9732023 262,902 265,733 268,564 114,785 115,894 117,003 97,859 98,835 99,811
The following reference table provides an overview of the number of FTE student enrolments at Victorian secondary schools in 2017, broken down by local government area (LGA). The data was sourced from the Victorian Department of Education and Training’s ‘All Schools FTE enrolments - Feb 2017’ data set.
Table 35.2: 2017 FTE student enrolments at Victorian secondary schools, by LGALGA FTE LGA Total LGA Total LGA Total
Alpine 702 Gannawarra 601 Mansfield 446 Queenscliffe <5Ararat 819 Glen Eira 9,472 Maribyrnong 5,338 South Gippsland 2,024
Ballarat 9,433 Glenelg 1,208 Maroondah 8,469 Southern Grampians 1,405
Banyule 11,815 Golden Plains <5 Melbourne 6,967 Stonnington 7,655
Bass Coast 1,885 Greater Bendigo 8,335 Melton 8,044 Strathbogie 355
Baw Baw 4,835 Greater Dandenong 11,661 Mildura 4,291 Surf Coast 847
Bayside 5,893 Greater Geelong 19,368 Mitchell 3,447 Swan Hill 1,600
Benalla 790 Greater Shepparton 5,089 Moira 2,126 Towong 591
Boroondara 19,367 Hepburn 459 Monash 15,701 Unincorporated Vic <5
Brimbank 12,099 Hindmarsh 411 Moonee Valley 10,236 Wangaratta 2,389Buloke 486 Hobsons Bay 5,554 Moorabool 1,829 Warrnambool 3,233
Campaspe 2,956 Horsham 1,401 Moreland 5,408 Wellington 3,034
Cardinia 7,890 Hume 15,514 Mornington Peninsula 10,946 West Wimmera 263
Casey 18,029 Indigo 531 Mount Alexander 649 Whitehorse 10,798Central
Goldfields 1,039 Kingston 9,220 Moyne 224 Whittlesea 10,180
Colac-Otway 1,404 Knox 7,079 Murrindindi 646 Wodonga 3,694Corangamite 1,195 Latrobe 4,276 Nillumbik 4,103 Wyndham 14,975
Darebin 7,342 Loddon 392 Northern Grampians 602 Yarra 4,460
East 2,537 Macedon 3,191 Port Phillip 4,210 Yarra Ranges 11,098Victorian Teacher Supply and Demand Report 2017 SUPPLEMENTARY APPENDIX 52

LGA FTE LGA Total LGA Total LGA Total
Gippsland RangesFrankston 9,254 Manningham 7,783 Pyrenees 183 Yarriambiack 441
Total 404,219
N Special studentsSpecial student enrolmentsThe following reference table provides an overview of the number of student enrolments on an FTE basis at Victorian special schools between 2007 and 2023, broken down by sector. The forecasts between 2017 and 2023 were projected using a vector autoregression model with exogenous variables. The exogenous variable used was the net migration of five to 19-year-olds to Victoria. The data used for the forecasts was sourced from the ‘February School Census (1987-2017), Vic DET’ and ‘Cat. No. 3412.0, Migration, Australia (2015-2017), ABS.’ Overall totals between ‘February School Census (1987-2017) (Table 36.1) and ‘All Schools FTE enrolments - Feb 2017’ (Table 36.2) are different due to possible differences in data collection methodology and timing.
Table 36.1: Actual (2007-2017) and forecast (2018-2023) student enrolments at Victorian special schools, by sector
YearGovernmen
t Lower 95%
Government FTE
EnrolmentGovernment Upper 95%
Catholic Lower 95%
Catholic FTE
Enrolment
Catholic Upper 95%
Independent Lower
95%
Independent FTE
Enrolment
Independent Upper
95%
2007 - 8,005 - - 154 - - 446 -2008 - 8,579 - - 182 - - 430 -2009 - 9,012 - - 185 - - 429 -2010 - 9,562 - - 210 - - 396 -2011 - 9,989 - - 305 - - 486 -2012 - 10,342 - - 373 - - 548 -2013 - 11,048 - - 343 - - 559 -2014 - 11,551 - - 421 - - 555 -2015 - 12,076 - - 559 - - 566 -2016 - 12,504 - - 648 - - 742 -2017 - 14,153 - - 184 - - 161 -2018 14,376 14,712 15,048 187 192 196 163 167 1712019 14,699 15,214 15,728 192 198 205 167 173 1792020 14,959 15,644 16,328 195 204 213 170 178 1852021 15,124 15,986 16,847 197 208 220 172 181 1912022 15,167 16,220 17,273 198 211 225 172 184 1962023 15,064 16,330 17,595 196 213 229 171 185 200
The following reference table provides an overview of the number of FTE student enrolments at Victorian secondary schools in 2017, broken down by local government area (LGA). The data was sourced from the Victorian Department of Education and Training’s ‘All Schools FTE enrolments - Feb 2017’ data set. Note 137 special students could not be mapped to a specific LGA.
Table 36.2: 2017 FTE student enrolments at Victorian special schools, by LGALGA FTE LGA FTE LGA FTE LGA FTE
Alpine <5 Gannawarra <5 Mansfield 23 Queenscliffe <5 Ararat <5 Glen Eira 266 Maribyrnong 189 South Gippsland 43 Ballarat 459 Glenelg 45 Maroondah 101 Southern
Grampians 38
Banyule 491 Golden Plains <5 Melbourne 476 Stonnington 83 Bass Coast 62 Greater Bendigo 403 Melton 276 Strathbogie <5 Baw Baw 215 Greater
Dandenong 724 Mildura 202 Surf Coast <5
Bayside 113 Greater Geelong 677 Mitchell <5 Swan Hill 102Benalla 26 Greater
Shepparton 179 Moira 47 Towong <5
Boroondara 257 Hepburn <5 Monash 495 Unincorporated Vic
<5
Brimbank 486 Hindmarsh <5 Moonee Valley 102 Wangaratta 184 Buloke <5 Hobsons Bay 435 Moorabool <5 Warrnambool 130 Campaspe 112 Horsham 94 Moreland 201 Wellington 69 Cardinia 222 Hume 916 Mornington
Peninsula 208 West Wimmera <5
Casey 498 Indigo <5 Mount Alexander <5 Whitehorse 485 Central Goldfields
<5 Kingston 240 Moyne <5 Whittlesea 106
Colac-Otway 68 Knox 220 Murrindindi <5 Wodonga 191 Corangamite 55 Latrobe 235 Nillumbik 137 Wyndham 493
Victorian Teacher Supply and Demand Report 2017 SUPPLEMENTARY APPENDIX 53
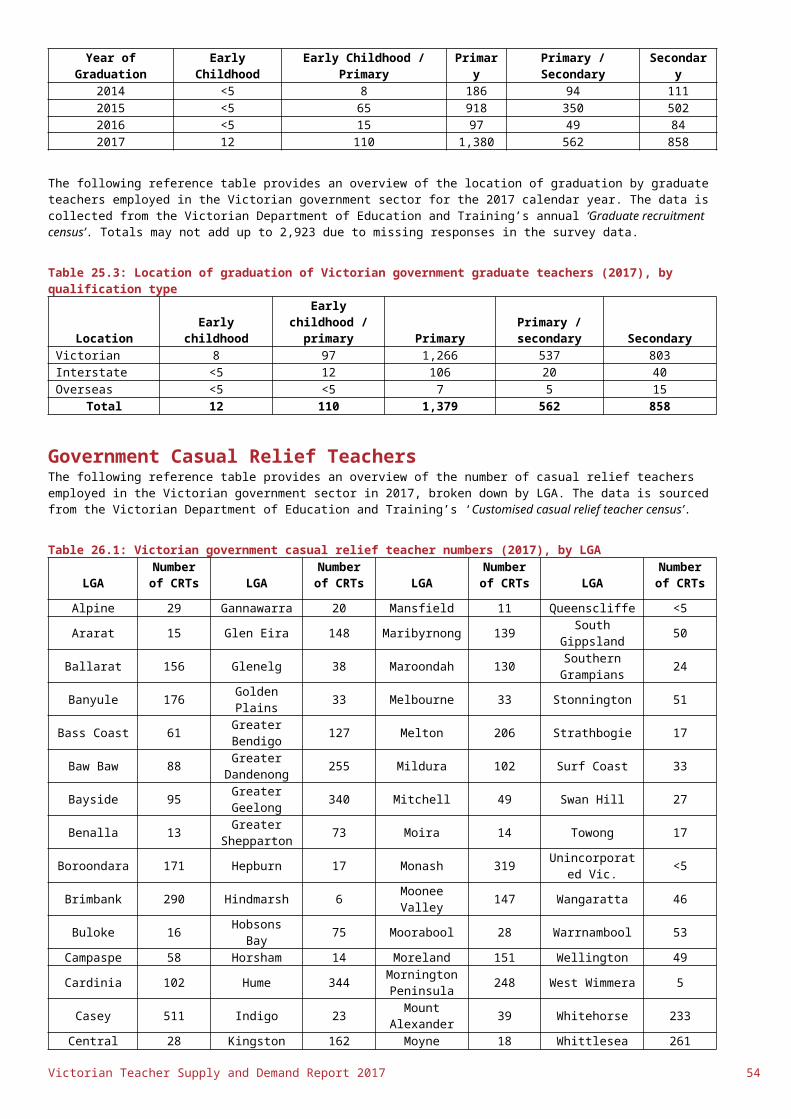
LGA FTE LGA FTE LGA FTE LGA FTE
Darebin 469 Loddon <5 Northern Grampians
41 Yarra 43
East Gippsland
109 Macedon Ranges
297 Port Phillip 268 Yarra Ranges 268
Frankston 407 Manningham 537 Pyrenees <5 Yarriambiack 32 Total 14,353
Victorian Teacher Supply and Demand Report 2017 SUPPLEMENTARY APPENDIX 54
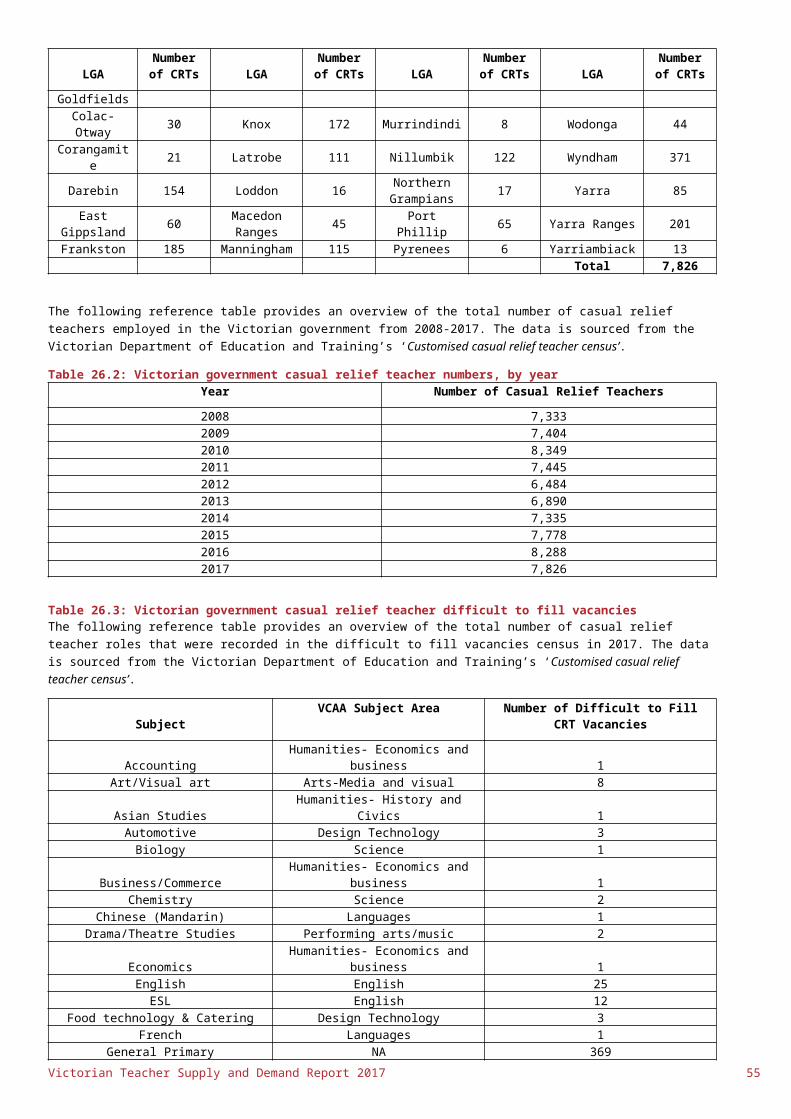
O EAL studentsEAL student enrolmentsThe following reference table provides an overview of the number of student enrolments on an FTE basis at Victorian and EAL schools at a state level between 1987 and 2021. The forecasts between 2017 and 2023 were projected using a vector autoregression model with exogenous variables. The exogenous variable used was the net migration of five to 19-year-olds to Victoria. The data used for the forecasts was sourced from the ‘February School Census (1987-2017), Vic DET and Cat. No. 3412.0, Migration, Australia (2005-2015), ABS.’ Overall totals between ‘February School Census (1987-2017) (Table 37.1) and ‘All Schools FTE enrolments - Feb 2017’ (Table 37.2) are different due to possible differences in data collection methodology and timing.
Table 37.1: Actual (2007-2017) and forecast (2018-2023) student enrolments at Victorian EAL schools, by sectorYear Lower 95% FTE enrolment number Upper 95%
2007 - 1,339 -2008 - 1,200 -2009 - 1,314 -2010 - 1,253 -2011 - 1,182 -2012 - 1,309 -2013 - 1,380 -2014 - 2,004 -2015 - 1,629 -2016 - 1,601 -2017 - 1,918 -2018 1,853 2,080 2,3072019 2,067 2,304 2,5422020 2,279 2,517 2,7562021 2,506 2,745 2,9842022 2,740 2,979 3,2172023 2,972 3,211 3,449
The following reference table provides an overview of the number of FTE student enrolments at Victorian EAL schools in 2017, broken down by local government area (LGA). The data was sourced from the Victorian Department of Education and Training’s ‘All Schools FTE enrolments - Feb 2017’ data set.
Table 37.2: 2017 FTE student enrolments at Victorian EAL schools, by LGALGA FTE LGA FTE LGA FTE LGA FTE
Alpine <5 Gannawarra <5 Mansfield <5 Queenscliffe <5
Ararat <5 Glen Eira <5 Maribyrnong 377 South Gippsland <5
Ballarat <5 Glenelg <5 Maroondah <5 Southern Grampians <5
Banyule <5 Golden Plains <5 Melbourne <5 Stonnington <5
Bass Coast <5 Greater Bendigo <5 Melton <5 Strathbogie <5
Baw Baw <5 Greater Dandenong 658 Mildura <5 Surf Coast <5
Bayside <5 Greater Geelong <5 Mitchell <5 Swan Hill <5
Benalla <5 Greater Shepparton <5 Moira <5 Towong <5
Boroondara <5 Hepburn <5 Monash <5 Unincorporated Vic <5
Brimbank <5 Hindmarsh <5 Moonee Valley <5 Wangaratta <5
Buloke <5 Hobsons Bay <5 Moorabool <5 Warrnambool <5Campaspe <5 Horsham <5 Moreland <5 Wellington <5
Cardinia <5 Hume <5 Mornington Peninsula <5 West Wimmera <5
Casey <5 Indigo <5 Mount Alexander <5 Whitehorse 344
Central Goldfields <5 Kingston <5 Moyne <5 Whittlesea <5
Colac-Otway <5 Knox <5 Murrindindi <5 Wodonga <5Corangamite <5 Latrobe <5 Nillumbik <5 Wyndham <5
Darebin <5 Loddon <5 Northern Grampians <5 Yarra 254
East Gippsland <5 Macedon
Ranges <5 Port Phillip <5 Yarra Ranges <5
Frankston <5 Manningham <5 Pyrenees <5 Yarriambiack <5
Victorian Teacher Supply and Demand Report 2017 SUPPLEMENTARY APPENDIX 55
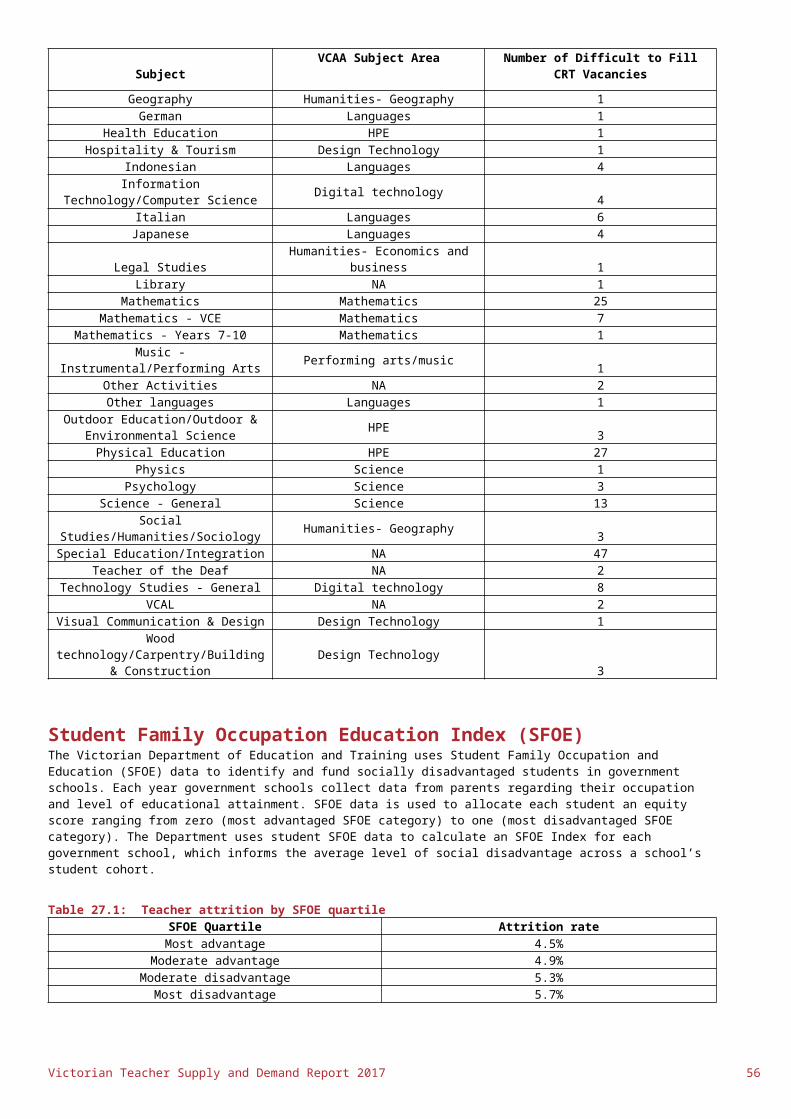
LGA FTE LGA FTE LGA FTE LGA FTE
Non school location 285 Total 1,918
Victorian Teacher Supply and Demand Report 2017 SUPPLEMENTARY APPENDIX 56

P Supply and demandTotal teacher supply and demand The following reference table provides an overview of the forecast supply for early childhood teachers. See ‘analysis notes for supply pipeline forecasting’ for further notes regarding how the figures are derived. As this table deals with the total available teacher pool, the future employment destination is not considered. Hence, dual qualified graduates and migrants are only included a single time in this table. The data used in this reference table was sourced from ‘Customised ITE provider enrolment data set, ITE providers, 2017’ and ‘VIT Annual Reports, VIT, 2007-2017’.
Table 38.1: Forecast additional supply of all available teachers, by supply source
Year Dual ITE Graduation Single ITE Graduation Dual Migration Single Migration Total Additional Supply
2018 1,245 3,508 302 851 5,906 2019 1,110 3,493 275 864 5,742 2020 1,208 4,067 259 870 6,4042021 1,366 4,842 247 875 7,330 2022 1,366 4,842 247 875 7,330 2023 1,366 4,842 247 875 7,330
Analysis notes for supply pipeline forecastingReference tables 38.1, 39.1 and 40.1 respectively provide an overview of the forecast supply for early childhood, primary and secondary teachers. Supply forecasting analysis notes:
The total supply is comprised of supply from future graduation and migration. Graduate and migrant teachers are made up of dual ITE (early childhood/primary and primary/secondary) or single
ITE course qualified teachers. The employment destination of ITE graduates with dual qualification is unknown, and hence as a result they are
included in all applicable available supply figures. The ITE graduates entering the supply pipeline are projected between 2017 and 2023 using enrolment data provided
by ITE providers. An assumption of 20% enrolment attrition during ITE courses and 20% of graduates being unavailable have been
applied to the supply projections. In addition, an assumption has been made that 50% of migrant teachers are unavailable to teach in Victoria.
The following reference table provides an overview of the future additional demand for teachers across educational settings. See tables 38.2, 39.2 and 40.2 for further notes on the derivation of these figures.
Table 38.2: Forecast additional teacher demand, by educational settingYear Early Childhood Primary Secondary Total additional
Demand
2018 193 2,210 1,999 4,402 2019 168 2,520 2,712 5,400 2020 562 2,427 3,118 6,107 2021 251 2,513 3,197 5,961 2022 1,107 2,484 3,342 6,933 2023 641 2,484 3,441 6,566
Victorian Teacher Supply and Demand Report 2017 SUPPLEMENTARY APPENDIX 57

Early childhood teacher supply and demandThe following reference table provides an overview of the forecast supply for early childhood teachers. Early childhood ITE graduates may be qualified to teach a number of different age ranges, including birth to five years (single qualification), birth to eight years and birth to 12 years (dual qualification). Breakdowns of ITE graduates have been provided in the data table below. Note, ITE graduates qualified to teach children aged zero to eight have been counted as single ITE graduates for the early childhood pool in the report, as they are not considered part of the available primary supply pool. The data used in this reference table was sourced from ‘Customised ITE provider enrolment data set, ITE providers, 2017’ and ‘VIT Annual Reports, VIT, 2007-2017’.
Table 39.1: Forecast additional supply of available early childhood teachers, by supply source
Year Dual ITE Graduation Single ITE Graduation Dual Migration Single Migration
Total Additional
Supply
2018 362 343 68 65 8382019 393 520 78 102 1,0932020 556 550 96 94 1,2962021 610 685 90 101 1,4852022 610 685 90 101 1,4852023 610 685 90 101 1,485
The following reference table provides an overview of the future additional demand for early childhood teachers at both government funded kindergarten and long day care services between 2017 and 2023. The total demand is derived from calculating expansion demand and replacement needs. Kindergarten program administrative data was used to map the inflow and outflow of teachers from the Kindergarten workforce over time, in order to calculate a net replacement need rate. The net replacement rate calculated for kindergarten teachers is applied to both kindergarten and long day care workforces to derive the respective replacement headcount needs.
The data used for the forecasts was sourced from: ‘Kindergarten program administrative data set, Vic DET’, ‘Customised unfunded long day care data set (2017), Vic DET’ and Customised funded long day care data set (2017), Vic DET’.
Table 39.2: Forecast additional early childhood teacher demand
Year
Kindergarten Expansion
Demand
Kindergarten Replacement
Needs
3-year-old Kindergarten
Demand
(DET Modelling)
Long Day Care
Expansion Demand
Long Day Care Replacement
Needs
Total Additional Demand
2018 149 75 0 -35 4 1932019 88 76 0 0 4 1682020 58 78 34 381 11 5622021 42 78 120 0 11 2512022 29 79 988 0 11 1,1072023 18 79 533 0 11 641
Victorian Teacher Supply and Demand Report 2017 SUPPLEMENTARY APPENDIX 58

Primary teacher supply and demand The following reference table provides an overview of the forecast supply for primary school teachers. The data used in this reference table was sourced from ‘Customised ITE provider enrolment data set, ITE providers, 2017’ and ‘VIT Annual Reports, VIT, 2007-2017’.
Table 40.1: Forecast additional supply of available primary teachers, by supply source
YearDual ITE
GraduationSingle ITE Graduation Dual Migration Single Migration Total Additional
Supply
2018 1,245 1,796 233 344 3,6182019 1,110 1,790 219 355 3,4742020 1,207 1,990 209 345 3,7522021 1,365 2,312 202 342 4,2212022 1,365 2,312 202 342 4,2212023 1,365 2,312 202 342 4,221
The following reference table provides an overview of the future additional demand for primary school teachers. The total demand is derived from calculating expansion demand and replacement needs due to teacher attrition. The data used to derive the reference table was ‘NSSC Table 51a: In-school Staff (FTE), ABS, 4221.0 Schools, Australia’, ‘NSSC Table 50a: In-school Staff (number), ABS 4221.0 Schools, Australia’, and ‘February School Census (1987-2017)’.
Table 40.2: Forecast additional primary school teacher demandYear Expansion Demand Replacement Needs Total Additional Demand
2018 827 1,383 2,2102019 1,101 1,419 2,5202020 977 1,450 2,4272021 1,030 1,483 2,5132022 970 1,514 2,4842023 939 1,545 2,484
Victorian Teacher Supply and Demand Report 2017 SUPPLEMENTARY APPENDIX 59
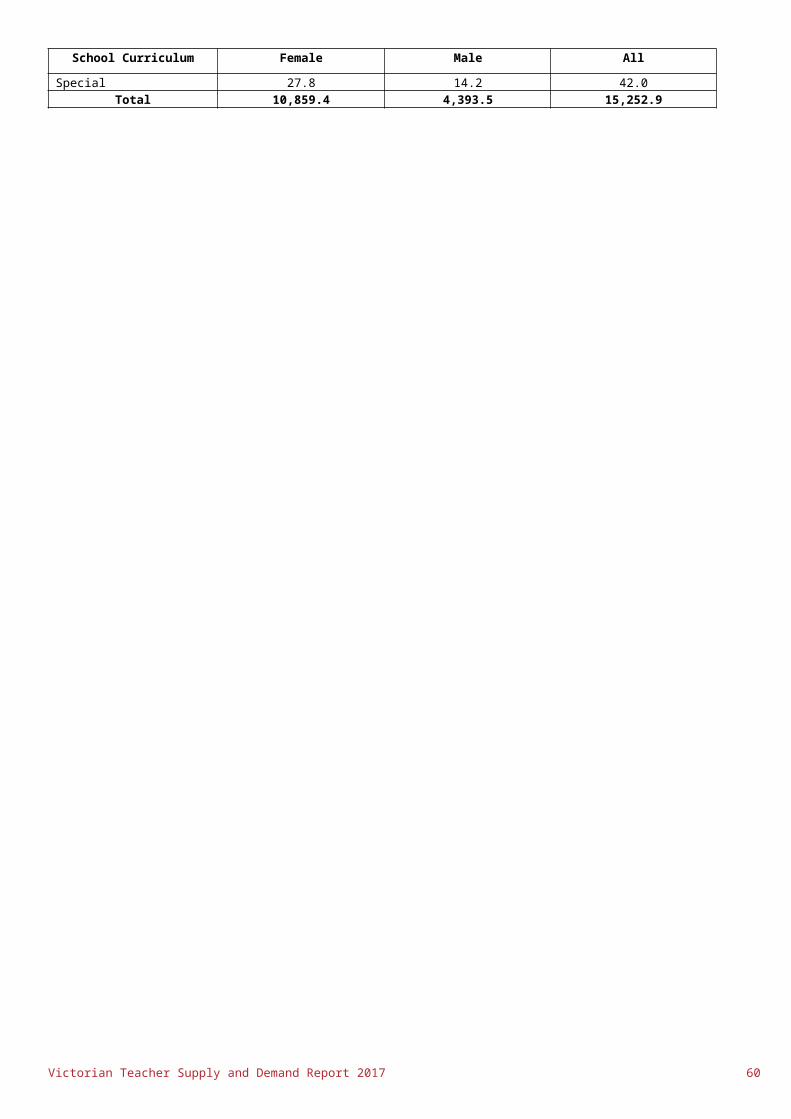
Secondary teacher supply and demand The following reference table provides an overview of the forecast supply for secondary school teachers. The data used in this reference table was sourced from ‘Customised ITE provider enrolment data set, ITE providers, 2017’ and ‘VIT Annual Reports, VIT, 2007-2017’
Table 41.1: Forecast additional supply of available secondary teachers, by supply source
YearDual ITE
Graduation Single ITE Graduation Dual Migration Single Migration Total Additional Supply
2018 883 1,369 165 278 2,9652019 717 1,183 141 244 2,2852020 651 1,526 113 272 2,5622021 755 1,845 112 276 2,9882022 755 1,845 112 276 2,9882023 755 1,845 112 276 2,988
The following reference table provides an overview of the future additional demand for secondary school teachers. The total demand is derived from calculating expansion demand and replacement needs due to teacher attrition. The data used to derive the reference table was ‘NSSC Table 51a: In-school Staff (FTE), ABS, 4221.0 Schools, Australia’, ‘NSSC Table 50a: In-school Staff (number), ABS 4221.0 Schools, Australia’, and ‘February School Census (1987-2017)’.
Table 41.2: Forecast additional secondary school teacher demandYear Expansion Demand Replacement Needs Total Additional Demand
2018 411 1588 19992019 1082 1630 27122020 1432 1686 31182021 1454 1743 31972022 1539 1803 33422023 1576 1864 3440
Victorian Teacher Supply and Demand Report 2017 SUPPLEMENTARY APPENDIX 60