victoria's economic development: a state of cities
TRANSCRIPT

Victoria’s Economic Development| 13 October 2014
Victoria’s Economic Development
Presented by Brian HaratsisMonday 13 October 2014
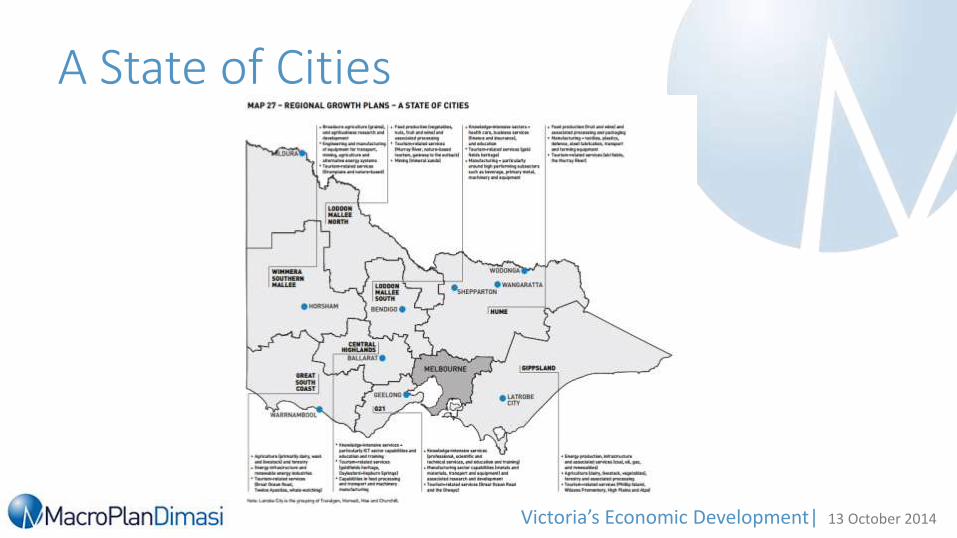
A State of Cities
Victoria’s Economic Development| 13 October 2014
Strategic Direction
+
Infrastructure
+
Economic Restructuring
+
Governance
Victoria’s Economic Development| 13 October 2014
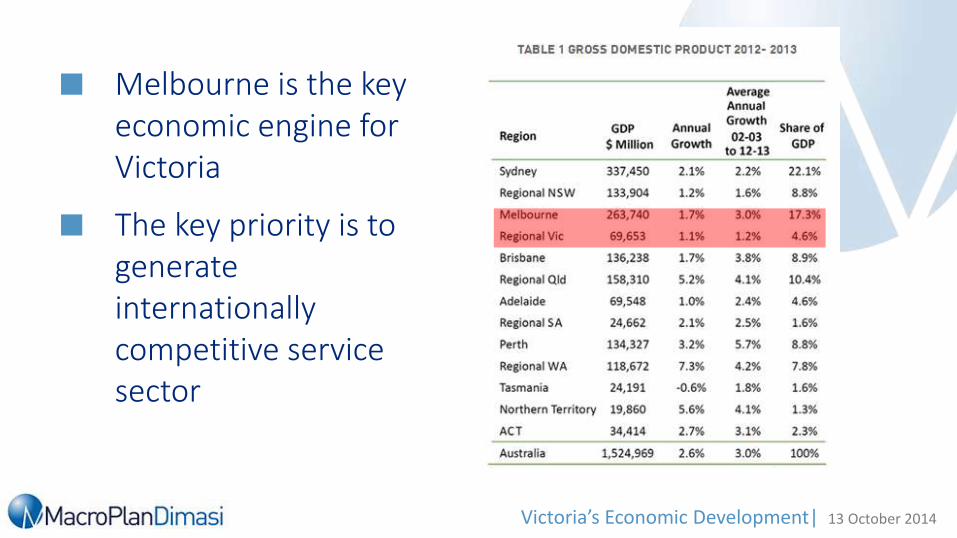
Melbourne is the key economic engine for Victoria
The key priority is to generate internationally competitive service sector
Victoria’s Economic Development| 13 October 2014
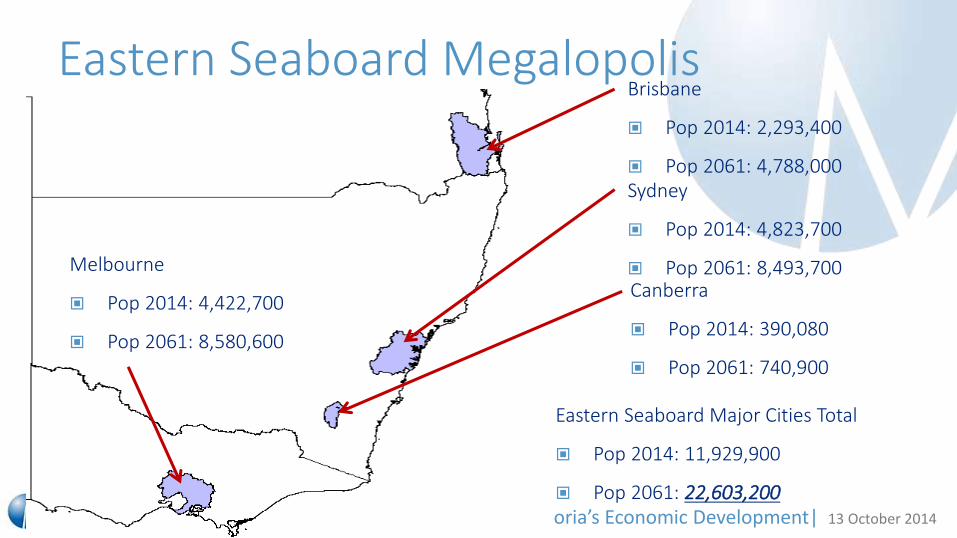
Eastern Seaboard Megalopolis
Sydney
Pop 2014: 4,823,700
Pop 2061: 8,493,700Melbourne
Pop 2014: 4,422,700
Pop 2061: 8,580,600
Canberra
Pop 2014: 390,080
Pop 2061: 740,900
Brisbane
Pop 2014: 2,293,400
Pop 2061: 4,788,000
Eastern Seaboard Major Cities Total
Pop 2014: 11,929,900
Pop 2061: 22,603,200
Victoria’s Economic Development| 13 October 2014
A State of Cities
Victoria’s Economic Development| 13 October 2014
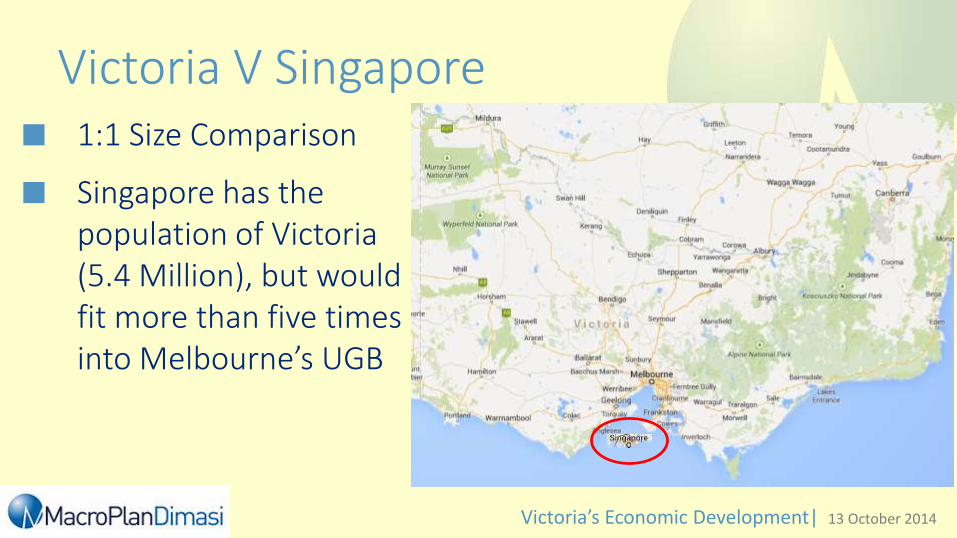
Victoria V Singapore 1:1 Size Comparison
Singapore has the population of Victoria (5.4 Million), but would fit more than five times into Melbourne’s UGB
Victoria’s Economic Development| 13 October 2014
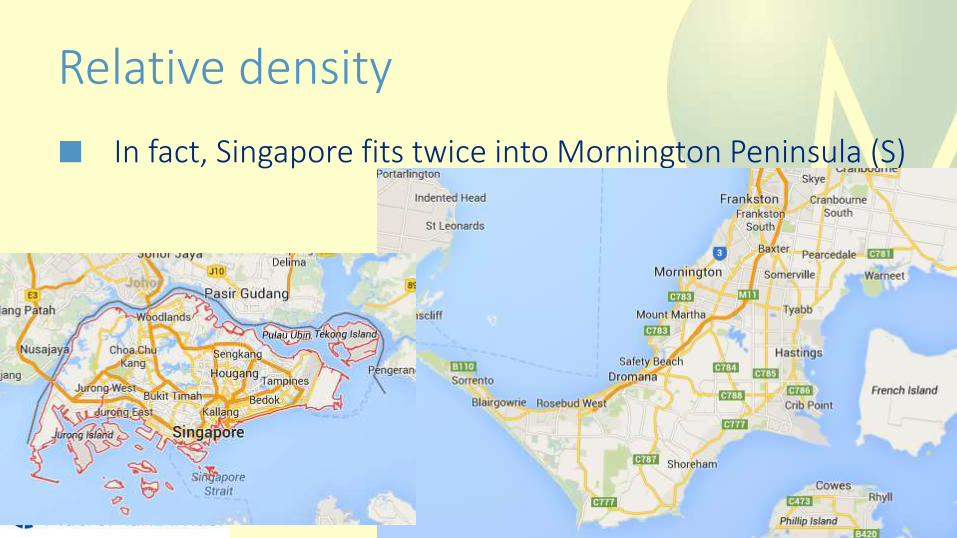
Relative density
In fact, Singapore fits twice into Mornington Peninsula (S)

Victoria’s Economic Development| 13 October 2014
Melbourne’s Future in a State of Cities
Becoming a ‘Global City’
Restructuring from ‘Australian’ settlement pattern to ‘Global’ settlement model.
Recognises:
Asia
Global Services Sector
Cities for Service Sector Exports Only
Export ‘Heavy Lifting’ Done by Resources and Energy
Victoria’s Economic Development| 13 October 2014
A Forecast of 10 million Victorians
The target of 7.7 million residents of Melbourne by 2051 is explicit in PLAN Melbourne
It is based on data from Victoria in Future’s 2012 release; In its the most recent release, VIF revised this figure up to 7.8 million people, a figure in accord with ABS B series forecasts.
Reaching a target of 7.7 million people in Melbourne by 2051 would require a population increase between 86,000-94,000 people per year, or a growth rate of 2.1%, declining to 1.1% by 2051.
VIF’s 2014 report forecasts consistent growth in Victoria’s regions to 2051, when they will have a population of 2.2 million
Victoria’s Economic Development| 13 October 2014
Plan Melbourne… A State of CitiesKey facts and figures
Melbourne’s population is expected to be between 7.6 and 8.5 million people by 2050. At this point it will be more populous than Sydney.
Recent bureau figures imply that Melbourne today is home to 4.35 million people, and 27% bigger than the city it was at the start of 2000.
Melbourne is forecast to grow by 90,000 persons and 27,800 dwellings per annum to 2030.
The proportion of people aged 65+ is expected to increase from 14% to 22% by 2050.

Victoria’s Economic Development| 13 October 2014
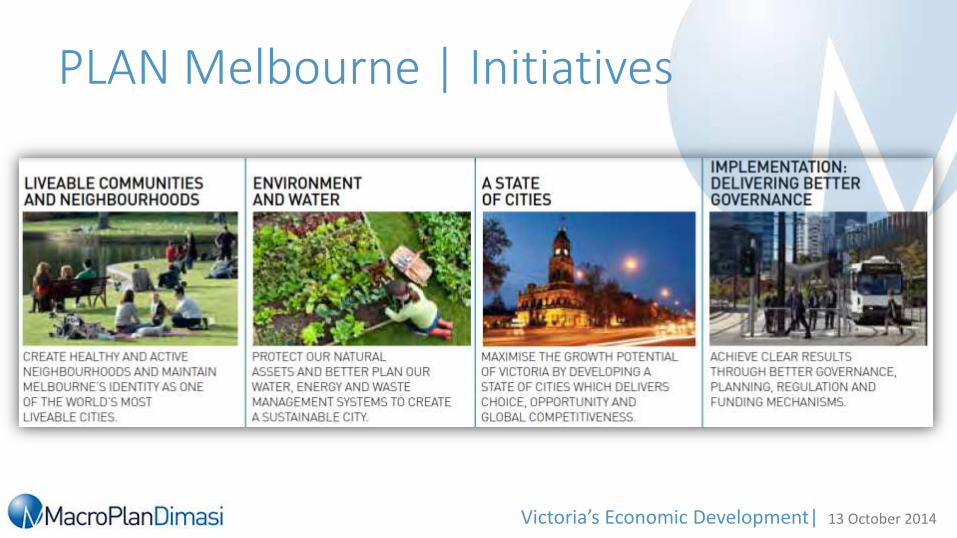
PLAN Melbourne | Initiatives
Victoria’s Economic Development| 13 October 2014
PLAN Melbourne | Initiatives
Victoria’s Economic Development| 13 October 2014
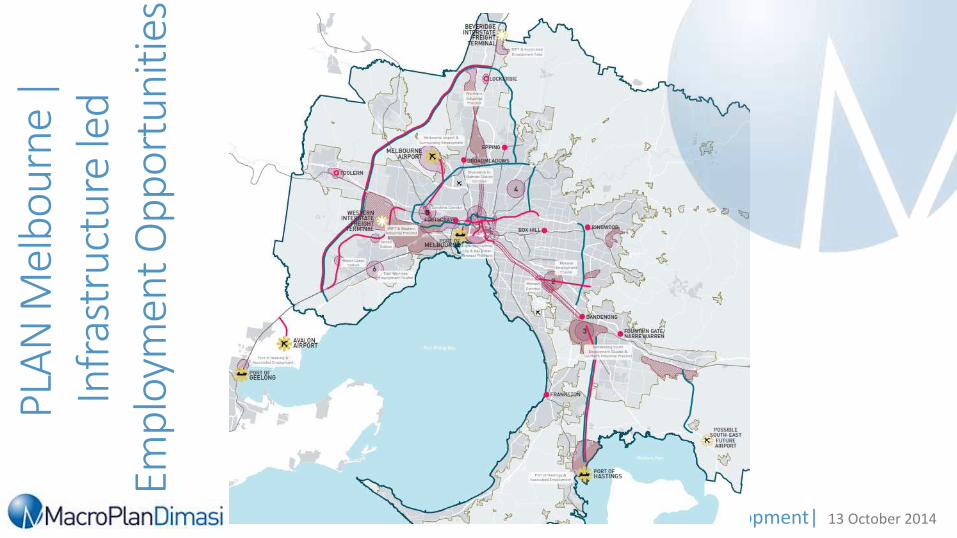
PLA
N M
elbo
urne
|
Infr
astr
uctu
re le
d Em
ploy
men
t Opp
ortu
nitie
s
Victoria’s Economic Development| 13 October 2014
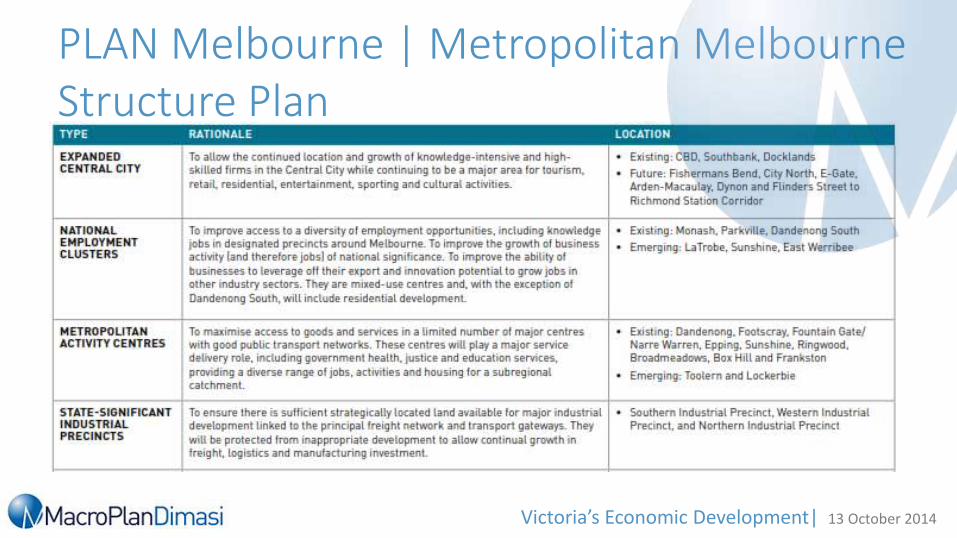
PLAN Melbourne | Metropolitan Melbourne Structure Plan
Victoria’s Economic Development| 13 October 2014
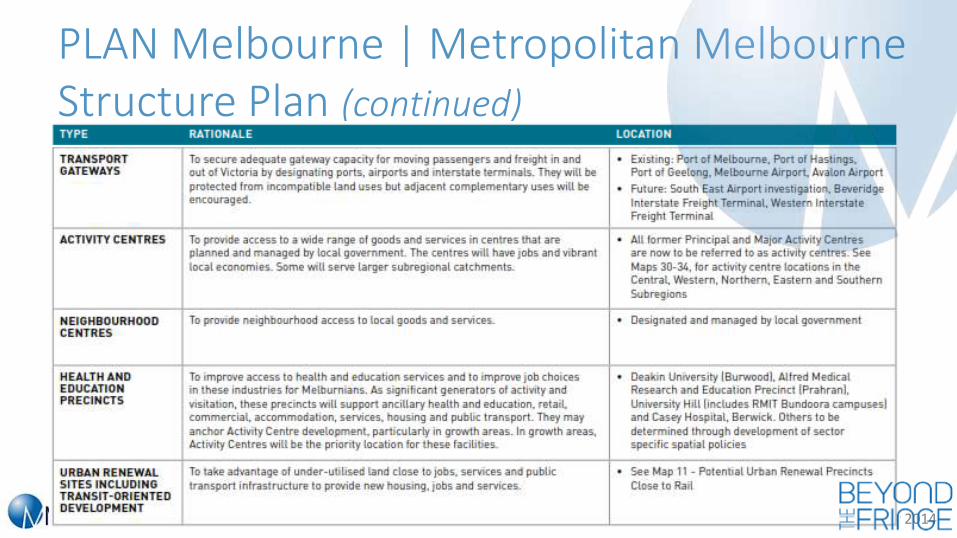
PLAN Melbourne | Metropolitan Melbourne Structure Plan (continued)
Victoria’s Economic Development| 13 October 2014
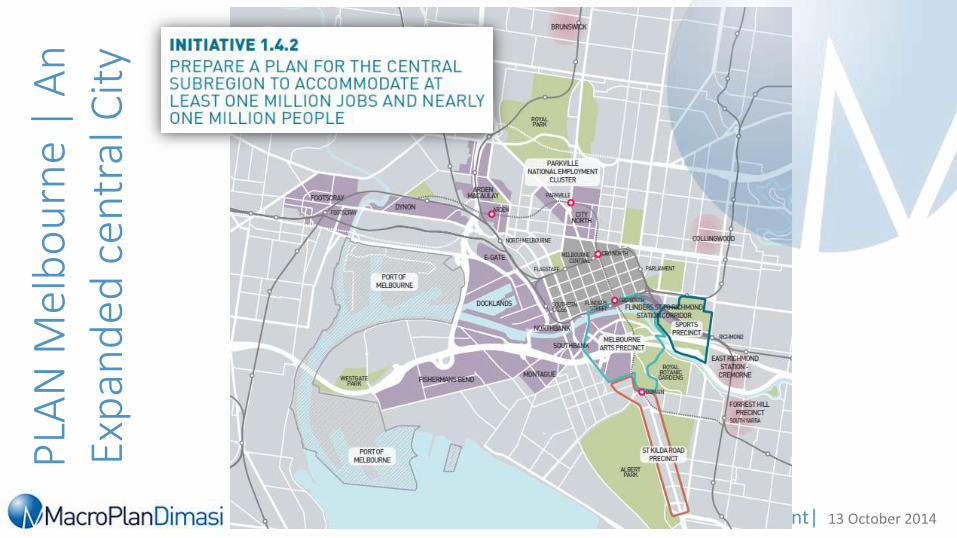
PLA
N M
elb
ou
rne
| A
n
Exp
and
ed c
entr
al C
ity
Victoria’s Economic Development| 13 October 2014
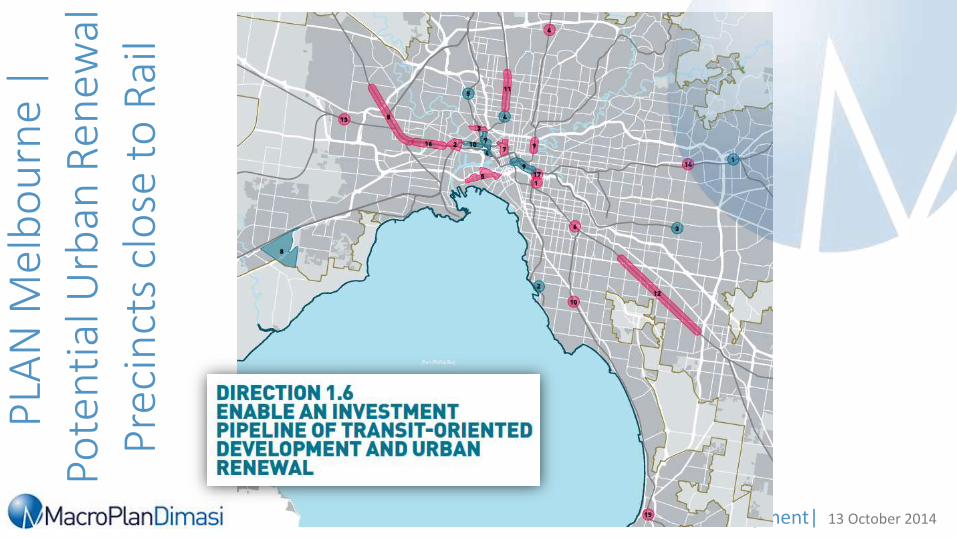
PLA
N M
elb
ou
rne
| Po
ten
tial
Urb
an R
enew
al
Prec
inct
s cl
ose
to
Rai
l
Victoria’s Economic Development| 13 October 2014
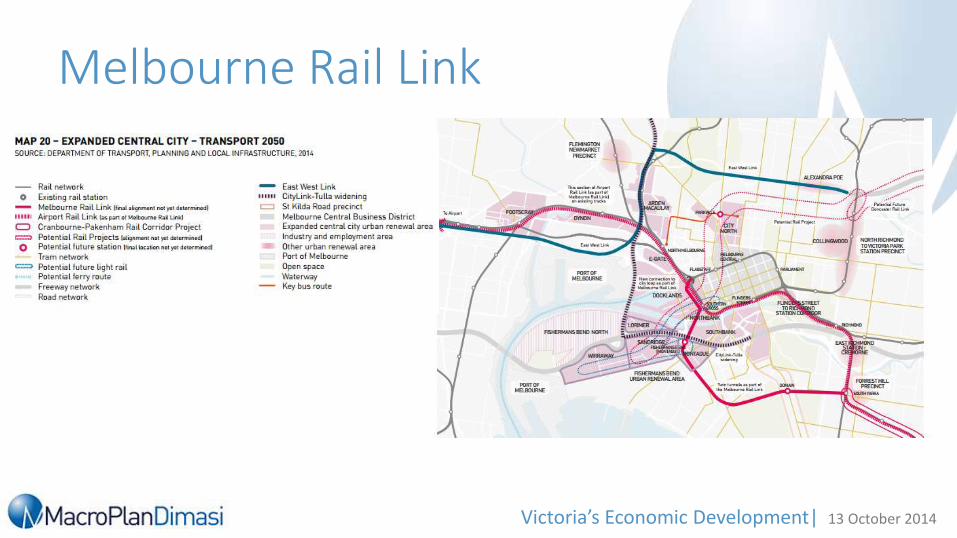
Melbourne Rail Link

Victoria’s Economic Development| 13 October 2014
Housing Demand
A recent forecast by Macroplan Dimasi shows an increase in expected dwelling growth from 30,000 to 40,000 dwellings per annum, this is to be caused by the appearance of a new urban renewal market
High and medium density dwellings are expected to make up about 60% of future dwelling demand to 2031 (approx. 24,000 dwellings p.a.)
At 40,000 dwellings per annum, Melbourne will be producing the same number of dwellings annually as New York and London
Victoria’s Economic Development| 13 October 2014
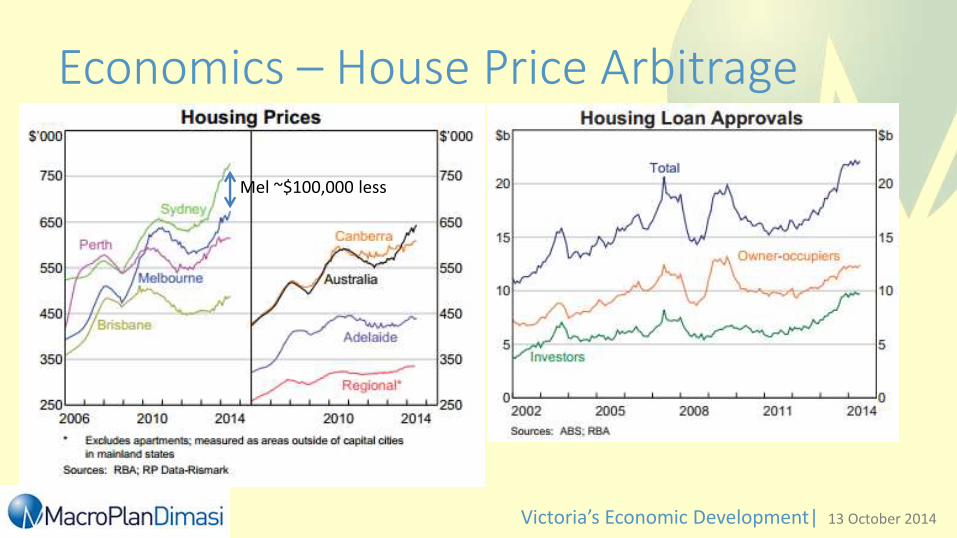
Economics – House Price Arbitrage
Mel ~$100,000 less

Victoria’s Economic Development| 13 October 2014
Economics – Job Growth Top 15 Employment Growth Regions, 2013-2018
15.4
16.1
16.2
16.5
18.1
18.6
18.9
18.9
29.4
31.4
32.9
32.9
34.1
34.8
42.5
0.00 10.00 20.00 30.00 40.00 50.00
Sydney - Eastern…
Sydney - Baulkham…
Fitzroy
Ipswich
Brisbane - South
Brisbane Inner City
Sydney - Inner South…
Sunshine Coast
Sydney - City and…
Perth - South East
Melbourne - Inner
Gold Coast
Perth - North West
Melbourne - South East
Melbourne - West
Employed Persons ('000)
351.1
309.6
281.7
253.2
247.1
229.0
183.0
142.1
141.0
118.6
117.4
110.1
98.8
80.7
58.7
58.0
43.2
37.1
13.5
0.0 100.0 200.0 300.0 400.0
Health Care and Social Assistance
Retail Trade
Manufacturing
Professional, Scientific and…
Construction
Education and Training
Accommodation and Food Services
Public Administration and Safety
Transport, Postal and Warehousing
Wholesale Trade
Financial and Insurance Services
Other Services
Administrative and Support Services
Agriculture, Forestry and Fishing
Arts and Recreation Services
Information Media and…
Rental, Hiring and Real Estate…
Electricity, Gas, Water and Waste…
Mining
Employed Persons ('000s)
Victoria, Projected employment growth ('000) - five years to November 2018

Victoria’s Economic Development| 13 October 2014
Economics

Victoria’s Economic Development| 13 October 2014
Demographics | population growth
Source: ABS Cat 3101

Victoria’s Economic Development| 13 October 2014
Interstate Migration | Victoria
Source: Australian Bureau of Statistics
-6,000
-4,000
-2,000
0
2,000
4,000
6,000
8,000
10,000
1997 1998 1999 2000 2001 2002 2003 2004 2005 2006 2007 2008 2009 2010 2011 2012 2013
0-14 15-24 25-34 35-54 55-64 65+
Victoria’s Economic Development| 13 October 2014
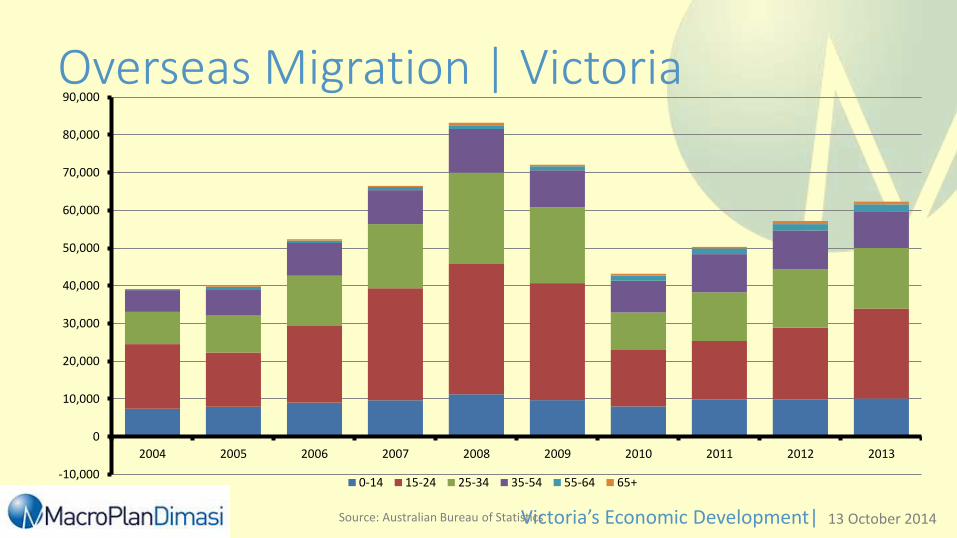
Overseas Migration | Victoria
Source: Australian Bureau of Statistics
-10,000
0
10,000
20,000
30,000
40,000
50,000
60,000
70,000
80,000
90,000
2004 2005 2006 2007 2008 2009 2010 2011 2012 2013
0-14 15-24 25-34 35-54 55-64 65+
Victoria’s Economic Development| 13 October 2014
The Future of Chinese Tourism: Australia and Victoria have Capacity and Strategic Issues
Tourism Research Australia forecast in 2011 that the number of outbound Chinese tourists would likely reach 100 million annually by 2020
It is estimated by CLSA (Asia’s leading equity broker and investment group) that this figure was reached in 2013 and that the annual number of outbound Chinese tourists will be closer to 200 million by 2020
Victoria’s Economic Development| 13 October 2014
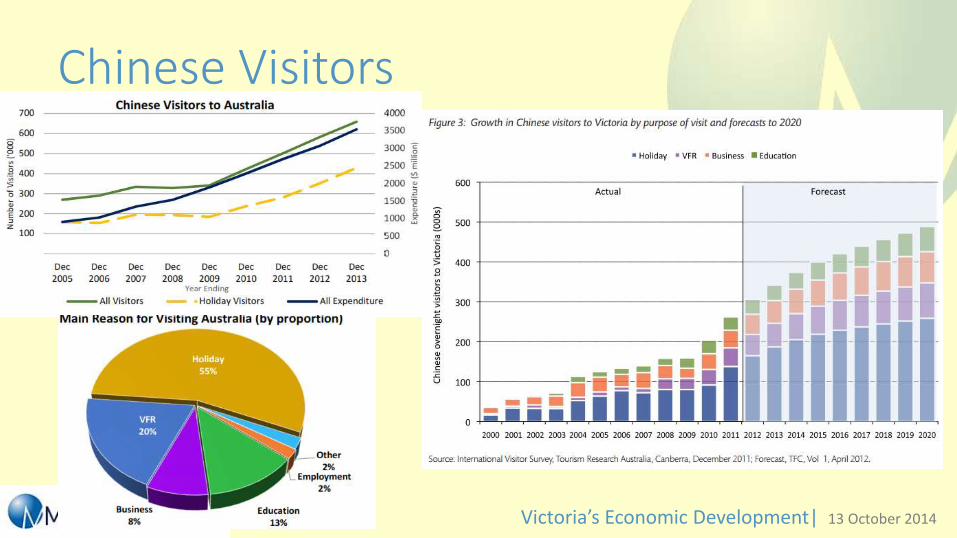
Chinese Visitors

Victoria’s Economic Development| 13 October 2014
The Significance of Chinese Tourism
Victoria’s Economic Development| 13 October 2014
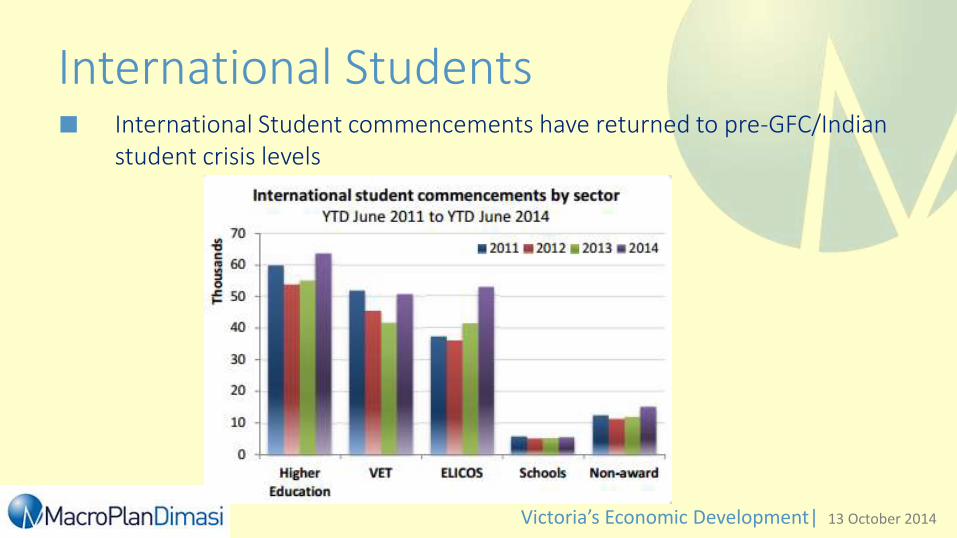
International Students International Student commencements have returned to pre-GFC/Indian
student crisis levels

Victoria’s Economic Development| 13 October 2014
Manufacturing
Victoria’s manufacturing sector
295,000 employees (the State’s largest full-time employer)
Over 25,000 manufacturing firms
$110 billion in economic activity per annum
$30.8 billion in gross value add (10.8% of GSP)
$15.3 billion in exports
$1.5 billion spent on research and development
Victoria’s Economic Development| 13 October 2014
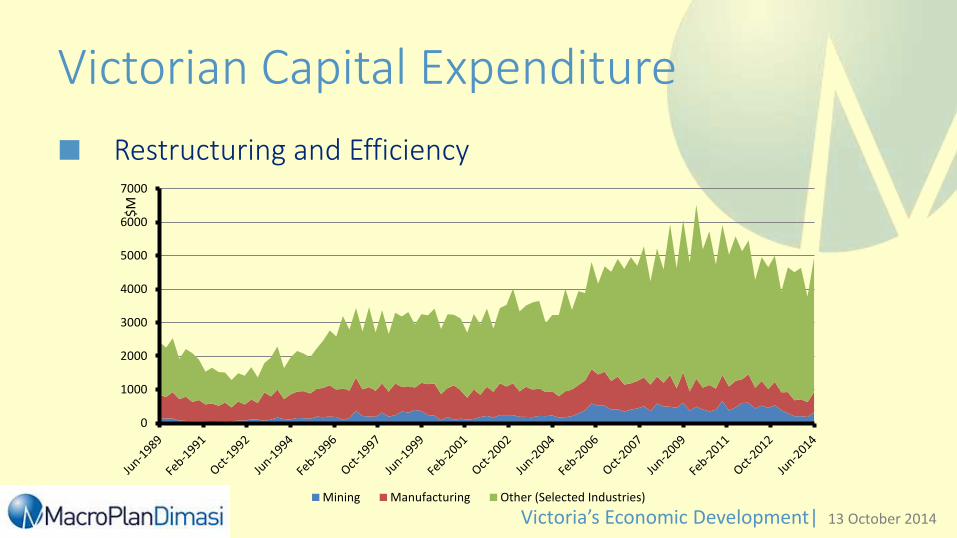
Victorian Capital Expenditure
Restructuring and Efficiency
0
1000
2000
3000
4000
5000
6000
7000
Mining Manufacturing Other (Selected Industries)
$M

Victoria’s Economic Development| 13 October 2014
Agriculture
Victoria remains one of the Nation’s largest agricultural producers
Source: ABS
Gross Value of Agricultural Commodities Produced 2012/13
Gross Value of Production ($M) Australia
New South
Wales Victoria Queensland
South
Australia
Western
Australia Tasmania
Northern
Territory
Australian
Capital
Territory
Crops 28,048.28 7,591.06 5,620.11 5,583.51 3,719.70 4,871.66 522.44 Not available Not available
Livestock slaughtered and other disposals 13,187.75 3,012.87 3,001.50 4,202.78 1,288.38 1,070.05 266.67 342.17 3.34
Livestock products 6,811.99 1,524.24 3,009.03 513.72 613.42 748.56 401.22 Not available Not available
Agriculture - Total 48,048.02 12,128.17 11,630.64 10,300.01 5,621.50 6,690.26 1,190.34 478.59 8.52

Victoria’s Economic Development| 13 October 2014
Health and Biomedical Research The Bio21 Cluster
As well as being home to a number of health biotechnology organisations, Victoria’s North biotechnology precinct is the hub of Victoria’s agricultural biotechnology activity. Located approximately 15km north of the Melbourne CBD, Bundoora in the North precinct was recently named as one of Melbourne’s ten 'most liveable suburbs' (Herald Sun newspaper, 2008).
The North precinct is currently undergoing significant expansion with a number of developments in progress. The AU$230 million AgriBio centre is a joint initiative between the Victorian Government, through the Department of Primary Industries, and La Trobe University. It will be a world-class facility for agricultural biosciences research and development.
The North precinct is also home to the Global Headquarters of Siemens VDO.
Monash Biotech Cluster
Located 25 kilometres from Melbourne’s CBD (approximately 25 minutes drive), the South East Biotechnology Precinct is home to Monash University, CSIRO, Southern Health (the largest public healthcare provider in Victoria), the Monash Health Translation Precinct, the Australian Synchrotron and Melbourne’s key pharmaceutical and biotechnology industries, including GlaxoSmithKline, Bristol Myers Squibb, Servierand others.

Victoria’s Economic Development| 13 October 2014
Victorian Infrastructure PipelineProject Name Stage Value of Project
North Road Level Crossing Removal Committed within Forward Estimates
Burke Road Level Crossing Removal Committed within Forward Estimates
Princes Highway Duplication Project - Winchelsea to Colac Committed within Forward Estimates $250M - $500M
Blackburn Road Level Crossing Removal Committed within Forward Estimates
Main Road Level Crossing Removal Committed within Forward Estimates
Princes Highway East (Traralgon to Sale) Under Construction $100M - $250M
RAAF Base East Sale Redevelopment Approvals $100M - $250M
CGD Municipal Building Project Under Construction $50M - $100M
Springvale Road Grade Separation Project Under Construction $100M - $250M
Mitcham Road and Rooks Road Rail Grade Separation Project Under Construction $100M - $250M
Port of Melbourne Port Capacity Project Tender $1B - $5B
Koo Wee Rup Bypass Under Construction $50M - $100M
Ballarat to Stawell Duplication Committed within Forward Estimates $500M - $1B
Geelong Hospital - Major Upgrade Committed within Forward Estimates $50M - $100M
Geelong Ring Road - Stage 4C, Surf Coast Highway Connection Under Construction $50M - $100M
Construction of Ravenhall Prison and Additional Prison Beds Committed beyond Forward Estimates $500M - $1B
Monash Children's Hospital Committed within Forward Estimates
Royal Victorian Eye and Ear Hospital Committed within Forward Estimates
East West Link - Eastern Section Tender Greater than $5B
Dingley Bypass - Warrigal Road to Westall Road Tender $100M - $250M
Western Highway Duplication - Ballarat to Stawell (Section 2A - Beaufort to Buangor) Tender $100M - $250M
Port Rail Shuttle (Metropolitan Intermodal System) Committed within Forward Estimates $50M - $100M
Waurn Ponds Community Hospital Committed beyond Forward Estimates $50M - $100M
Cranbourne-Pakenham Rail Corridor Project Tender $1B - $5B
Calder Highway Interchange Committed within Forward Estimates $50M - $100M
Melbourne Park redevelopment - Stage 2 Committed within Forward Estimates $250M - $500M
Murray Basin Rail project Committed within Forward Estimates $100M - $250M
Shepparton Law Courts Planning $50M - $100M
East West Link - Western Section Committed within Forward Estimates Greater than $5B
Latrobe Regional Hospital redevelopment - stage 2A Planning $50M - $100M
Melbourne Rail Link (including Airport Rail Link) Committed within Forward Estimates Greater than $5B
Victoria’s Economic Development| 13 October 2014
Governance
Metropolitan Planning Authority
New planning authority inside the UGB and potentially outside
Unsolicited Bids
Harnessing the private sector

Victoria’s Economic Development| 13 October 2014
The Wish List…
Cruise Ship Terminal
East West Link
High Speed Airport Rail
Western Intermodal/ Kalkallo/ Inland Rail Link
Inner Melbourne – 1 million population/ 1 million jobs
Fishermans Bend/ Link to Bay/ Active Waterfront

Victoria’s Economic Development| 13 October 2014
The Wish List… (Cont.)
New Tourism/ Cultural Asset ‘Asian Attraction’
Global Media Hub
Global Headquarters for Food/Fibre
Redirect Population Growth to regional Cities
High Security Buildings/ Hub/ Conferencing
Additional Global University
Victoria’s Economic Development| 13 October 2014
Thank you.