vietnam pharmaceutical industry report...
TRANSCRIPT
1
VIETNAM PHARMACEUTICAL INDUSTRY REPORT Q4/2017

Content
Executive Summary 4
1. Business Environment 6
1.1 Macroeconomic Situation 6
1.2 Legal Barriers 10
1.3 Impacts of Free Trade Agreement 18
2. Vietnam Pharmaceutical Industry Overview 25
2.1 Global Pharmaceutical Industry 25
2.1.1 Production - Consumption 26
2.1.2 Export - Import 29
2.1.3 Production and Consumption Situation in major countries 30
2.1.4 Large Enterprises in the world 33
2.2 Vietnam Pharmaceutical Industry Overview 35
2.2.1 History of Vietnam Pharmaceutical Industry 36
2.2.2 Industry Position 37
2.2.3 Industry Scale and Feature 38
2.2.4 Value Chain of Vietnam Pharmaceutical Industry 41
2.2.5 Raw Materials 42
2.2.6 Production Technology 45
2
2.2.7 Research and Development 47
2.5.8 Production 48
2.2.9 Consumption 51
2.2.10 Export - Import 59
2.2.11 Price Movement 63
2.2.12 Distribution System 66
2.3 Risks and Challenges 72
2.4 Industry Planning 79
2.5 Driving Forces and Forecast 81
3. Enterprise Analysis 91
3.1 Profitability Ratios 94
3.2 Cost Structure 98
3.3 Asset Management Ratios 101
3.4 Capital Structure 105
3.5 Solvency Ratios 107
3.6 Returns Ratios 109
4. Appendix – Financial Statement 111
3
ETC Ethical drugs
EU-GMP Europe Good Manufacturing Practice
EVFTA EU – Vietnam Free Trade Agreement
GDP Good Distribution Practice
Generic Drug
Drug product that is comparable to a brand/reference
listed drug product in dosage form, strength, quality
and performance characteristics, and intended use."
GLP Good Laboratory Practice
GMP Good Manufacturing Practice
GMP - WHOGood Manufacturing Practice recommended by the
World Health Organization (WHO - GMP)
GPP Good Pharmacy Practice
GSP Good Storage Practice
Abbreviations
OTC Over The Counter (nonprescription-drugs)
Patent Drug Drugs under intellectual property rights
Pharmerging Countries with emerging Pharmaceutical Industry
PIC/S - GMPPharmaceutical Inspection Co-operation Scheme on Good
Manufacturing Practice (EU-GMP)
GDC General Department of Vietnam Custom
GSO General Statistic Office of Vietnam
TPP Trans-Pacific Partnership
WHO World Health Organization
WTO World Trade Organization
MOH Ministry of Health
DAV Drug Administration of Vietnam
4
Executive Summary
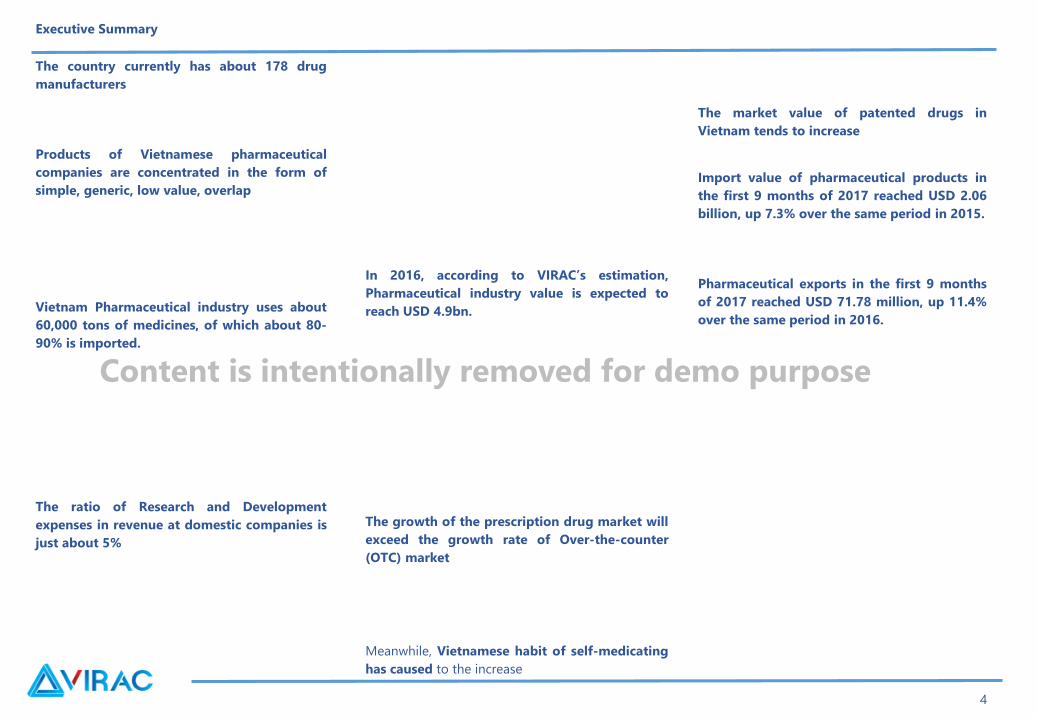
The country currently has about 178 drug
manufacturers
Products of Vietnamese pharmaceutical
companies are concentrated in the form of
simple, generic, low value, overlap
Vietnam Pharmaceutical industry uses about
60,000 tons of medicines, of which about 80-
90% is imported.
The ratio of Research and Development
expenses in revenue at domestic companies is
just about 5%
In 2016, according to VIRAC’s estimation,
Pharmaceutical industry value is expected to
reach USD 4.9bn.
The growth of the prescription drug market will
exceed the growth rate of Over-the-counter
(OTC) market
Meanwhile, Vietnamese habit of self-medicating
has caused to the increase
The market value of patented drugs in
Vietnam tends to increase
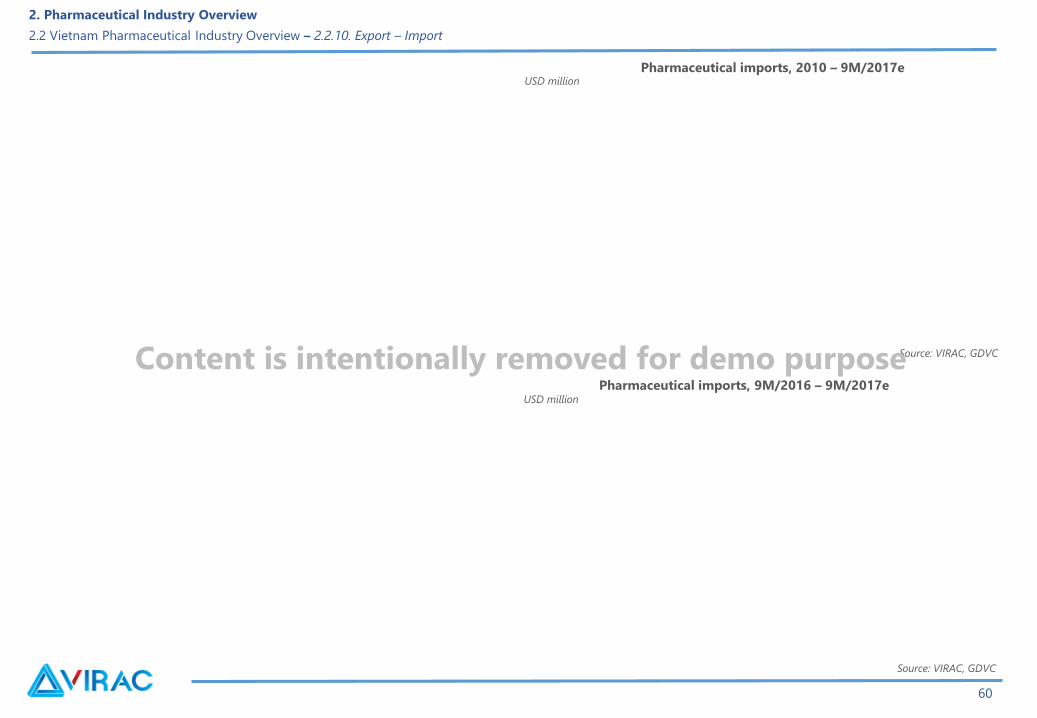
Import value of pharmaceutical products in
the first 9 months of 2017 reached USD 2.06
billion, up 7.3% over the same period in 2015.
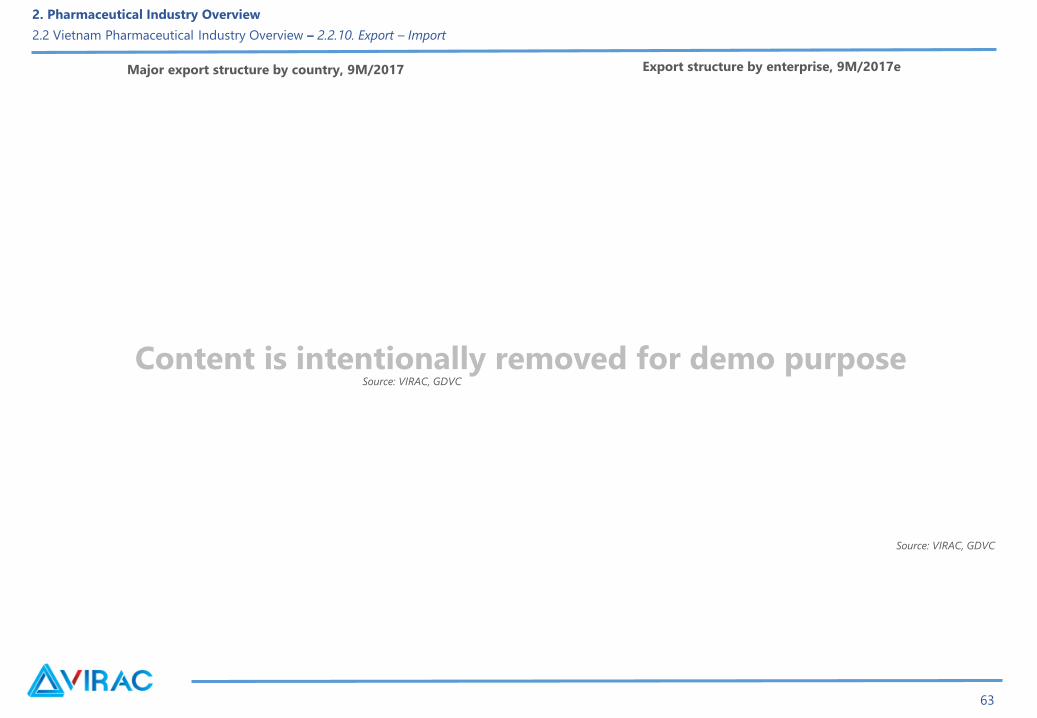
Pharmaceutical exports in the first 9 months
of 2017 reached USD 71.78 million, up 11.4%
over the same period in 2016.
Content is intentionally removed for demo purpose
5
Executive Summary
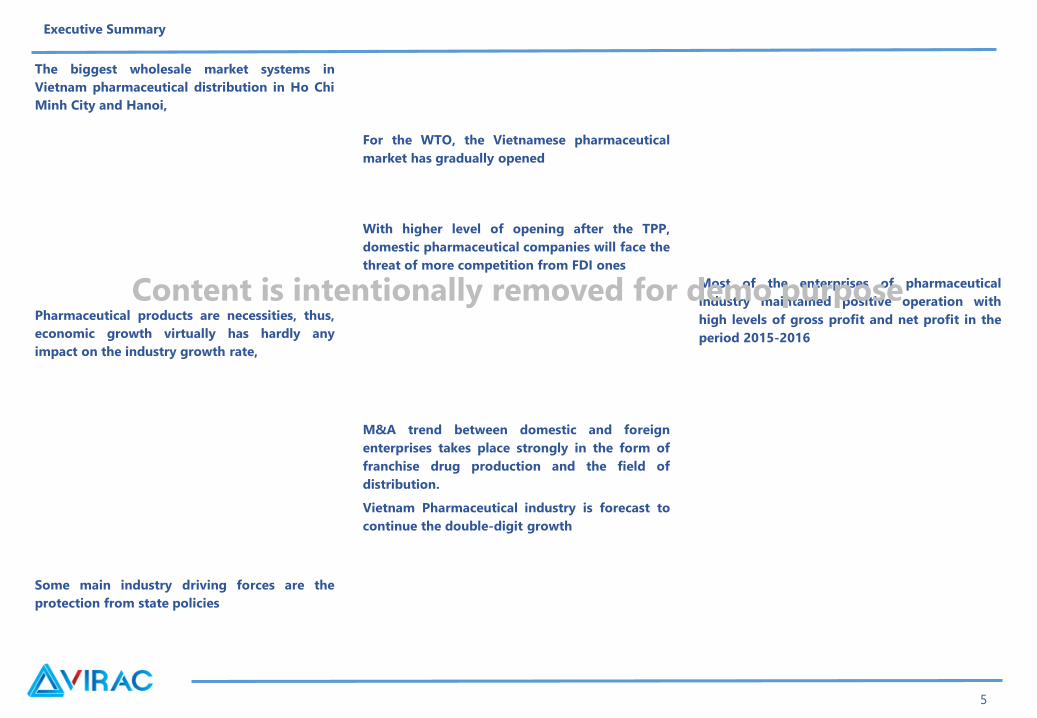
The biggest wholesale market systems in
Vietnam pharmaceutical distribution in Ho Chi
Minh City and Hanoi,
Pharmaceutical products are necessities, thus,
economic growth virtually has hardly any
impact on the industry growth rate,
Some main industry driving forces are the
protection from state policies
For the WTO, the Vietnamese pharmaceutical
market has gradually opened
With higher level of opening after the TPP,
domestic pharmaceutical companies will face the
threat of more competition from FDI ones
M&A trend between domestic and foreign
enterprises takes place strongly in the form of
franchise drug production and the field of
distribution.
Vietnam Pharmaceutical industry is forecast to
continue the double-digit growth
Most of the enterprises of pharmaceutical
industry maintained positive operation with
high levels of gross profit and net profit in the
period 2015-2016
Content is intentionally removed for demo purpose

6
1. Business Environment
1.1 Macroeconomic Situation
1.2 Legal Barriers
1.3 Impacts of Free Trade Agreement
Content

7
1. Business Environment
1.1 Macroeconomic Situation
Source: VIRAC, GSO
GDP growth, 2011 – 9M/2017
Source: VIRAC, GSO
Consumer Price Index for Medicines and Health Services, 2012
– 9M/2017
Content is intentionally removed for demo purpose
8
1. Business Environment
1.1 Macroeconomic Situation
Source: VIRAC, SBV Source: VIRAC
VND/USD exchange rate, 2016-9/2017 VND/CNY exchange rate, 2016 – 9/2017
Content is intentionally removed for demo purpose

9
Million people
1. Business Environment
1.1 Macroeconomic Situation
Population and growth, 2006 -2016
Source: VIRAC, GSO
Source: VIRAC, GSO
Population structure, 1999 - 2016
Content is intentionally removed for demo purpose
10
1. Business Environment
1.1 Macroeconomic Situation
1.2 Legal Barriers
1.3 Impacts of Free Trade Agreement
Content
11
1. Business Environment
1.2 Legal Barriers
Regulations on standards of Pharmaceutical Industry
Standard of Good Manufacturing Practice recommended by the World Health Organization (WHO - GMP)
Standard of Good Storing Practice (GSP)
Content is intentionally removed for demo purpose
12
Regulations on drug registration
Regulations on control of drug price
1. Business Environment
1.2 Legal Barriers
Content is intentionally removed for demo purpose
13
Regulations on import-export
Regulations on drug advertising information
1. Business Environment
1.2 Legal Barriers
Content is intentionally removed for demo purpose

Regulations on drug promotion
Distribution
Decision No.10/2007/QD-BTM and Circular 34/2013/TT-BCT:
Bidding
14
1. Business Environment
1.2 Legal Barriers
Content is intentionally removed for demo purpose
15
Regulations on importing pharmaceutical materials
Circular No. 03/2016/TT-BYT taking effective from Mar 6th 2016.
1. Business Environment
1.2 Legal Barriers
Content is intentionally removed for demo purpose
16
On Apr 6th 2016, Draft Law on Pharmacy (amended) wass passed and this Law will take effect from Jan 1st 2017
Controlling the rising price of brand-name drugs
Controlling the drug prescription for commissions,
Pharmaceutical Law 2016 contains regulations on preferential domestically produced medicines consistent with the Law on Bidding,
Allowing the sales of drugs in supermarkets
Prohibiting the advertising, prescription of products which are not drugs
1. Business Environment
1.2 Legal Barriers
Content is intentionally removed for demo purpose
17
On August 05, 2017, the Prime Minister signed Decree No. 54/2017/ND-CP detailing some articles and measures to enforce the Pharmaceutical Law
2016. The decree takes effect from July 01, 2017.
1. Business Environment
1.2 Legal Barriers
Content is intentionally removed for demo purpose
18
1. Business Environment
1.1 Macroeconomic Situation
1.2 Legal Barriers
1.3 Impacts of Free Trade Agreement
Content

Source: VIRAC, DAV
1. Business Environment
1.3 Impacts of Free Trade Agreement
19
1.3.1. WTO - Vietnam became the 150th member of WTO on 11/07/2006 Import value of pharmaceutical products, 2010 – 2015USD million
Content is intentionally removed for demo purpose
20
1. Business Environment
1.3 Impacts of Free Trade Agreement
Content is intentionally removed for demo purpose

21
1. Business Environment
1.3 Impacts of Free Trade Agreement
Content is intentionally removed for demo purpose
22
1.3.2 TPP – Trans-Pacific Partnership, signed on 02/04/2016 in Auckland, New Zealand
1. Business Environment
1.3 Impacts of Free Trade Agreement
Content is intentionally removed for demo purpose
23
1. Business Environment
1.3 Impacts of Free Trade Agreement
Content is intentionally removed for demo purpose
24
1.3.3 Other Free Trade Agreements
1. Business Environment
1.3 Impacts of Free Trade Agreement
Content is intentionally removed for demo purpose

25
2. Vietnam Pharmaceutical Industry Overview
2.1 Global Pharmaceutical Industry
2.2 Vietnam Pharmaceutical Industry Overview
2.3 Risks and Challenges
2.4 Industry Planning
2.5 Driving Forces and Forecast
Content
26
Source: VIRAC, IMS health
2. Vietnam Pharmaceutical Industry Overview
2.1 Global Pharmaceutical Industry – 2.1.1 Production – Consumption
World medicine expenditure, 2010 - 2016e
USD billion
Content is intentionally removed for demo purpose
27
Source: VIRAC, EvaluatePharma
2. Vietnam Pharmaceutical Industry Overview
2.1 Global Pharmaceutical Industry – 2.1.1 Production – Consumption
Source: VIRAC, IMS health
Worldwide prescription drug sales, 2010 - 2016USD billion
Consumption share by drug type, 2011 - 2016
Content is intentionally removed for demo purpose
28
Top 10 pharmaceutical products consumed the most in the world, 2015Source: VIRAC, IMS health
Source: VIRAC, IMS health
2. Vietnam Pharmaceutical Industry Overview
2.1 Global Pharmaceutical Industry – 2.1.1 Production – Consumption
Consumption share by group, 2016
Content is intentionally removed for demo purpose
29
ExportValue
(USD billion)Import
Value
(USD billion)
Top countries importing and exporting of pharmaceuticals, 2016
Source: VIRAC, UN Comtrade
2. Vietnam Pharmaceutical Industry Overview
2.1 Global Pharmaceutical Industry – 2.1.2 Export-Import
Source: VIRAC, UN Comtrade
Source: VIRAC, UN Comtrade
USD billion
World pharmaceutical imports, 2012 – 2016e
World pharmaceutical exports, 2012 – 2016e
Content is intentionally removed for demo purpose
30
2. Japan
2. Vietnam Pharmaceutical Industry Overview
2.1 Global Pharmaceutical Industry – 2.1.3 Typical countries
1. The U.SGeneral information about the US health sector, 2015
Content is intentionally removed for demo purpose
31
3. China
2. Vietnam Pharmaceutical Industry Overview
2.1 Global Pharmaceutical Industry – 2.1.3 Typical countries
General information about China health sector, 2015
Content is intentionally removed for demo purpose

32
4. Germany
5. France
2. Vietnam Pharmaceutical Industry Overview
2.1 Global Pharmaceutical Industry – 2.1.3 Typical countries
Content is intentionally removed for demo purpose
33
Company General information
Johnson &
Johnson
(America)
Pfizer
(America)
Roche
(Switzerland)
Novartis
(Switzerland)
2. Vietnam Pharmaceutical Industry Overview
2.1 Global Pharmaceutical Industry – 2.1.4 Top 10 typical pharmaceutical enterprises
USD billion
Top 10 Pharmaceutical enterprises with the largest revenue, 2016
Content is intentionally removed for demo purpose

Merck (America)
Sanofi (France)
Gilead Sciences
(America)
AbbVie (America)
AstraZeneca (The U.K)
Amgen (America)
34
2. Vietnam Pharmaceutical Industry Overview
2.1 Global Pharmaceutical Industry – 2.1.4 Top 10 typical pharmaceutical enterprises
Content is intentionally removed for demo purpose
35
2. Vietnam Pharmaceutical Industry Overview
2.1 Global Pharmaceutical Industry
2.2 Vietnam Pharmaceutical Industry Overview
2.3 Risks and Challenges
2.4 Industry Planning
2.5 Driving Forces and Forecast
Content
36
2005
1990
2. Vietnam Pharmaceutical Industry Overview
2.2 Vietnam Pharmaceutical Industry – 2.2.1 History of Vietnam Pharmaceutical Industry
Content is intentionally removed for demo purpose
37
2. Vietnam Pharmaceutical Industry Overview
2.2 Vietnam Pharmaceutical Industry – 2.2.2 Industry Position
Content is intentionally removed for demo purpose
38
2. Vietnam Pharmaceutical Industry Overview
2.2 Vietnam Pharmaceutical Industry – 2.2.3 Industry Scale and Features
Content is intentionally removed for demo purpose
39
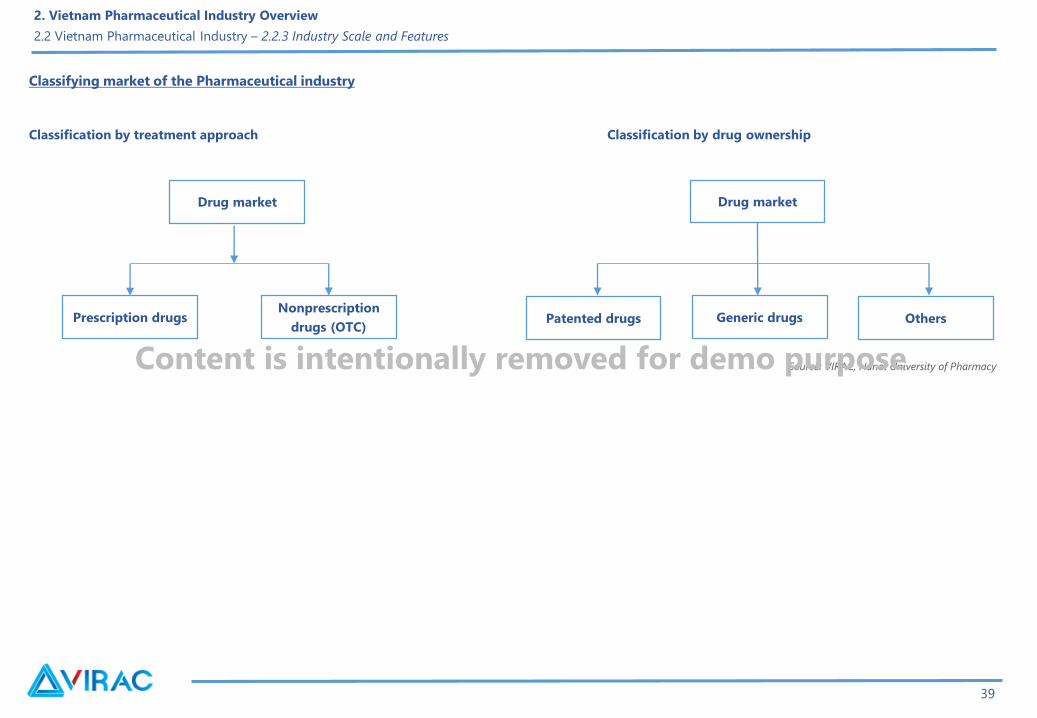
Drug market
Patented drugsNonprescription
drugs (OTC)Prescription drugs Generic drugs Others
Drug market
Classification by treatment approach Classification by drug ownership
Classifying market of the Pharmaceutical industry
Source: VIRAC, Hanoi University of Pharmacy
2. Vietnam Pharmaceutical Industry Overview
2.2 Vietnam Pharmaceutical Industry – 2.2.3 Industry Scale and Features
Content is intentionally removed for demo purpose
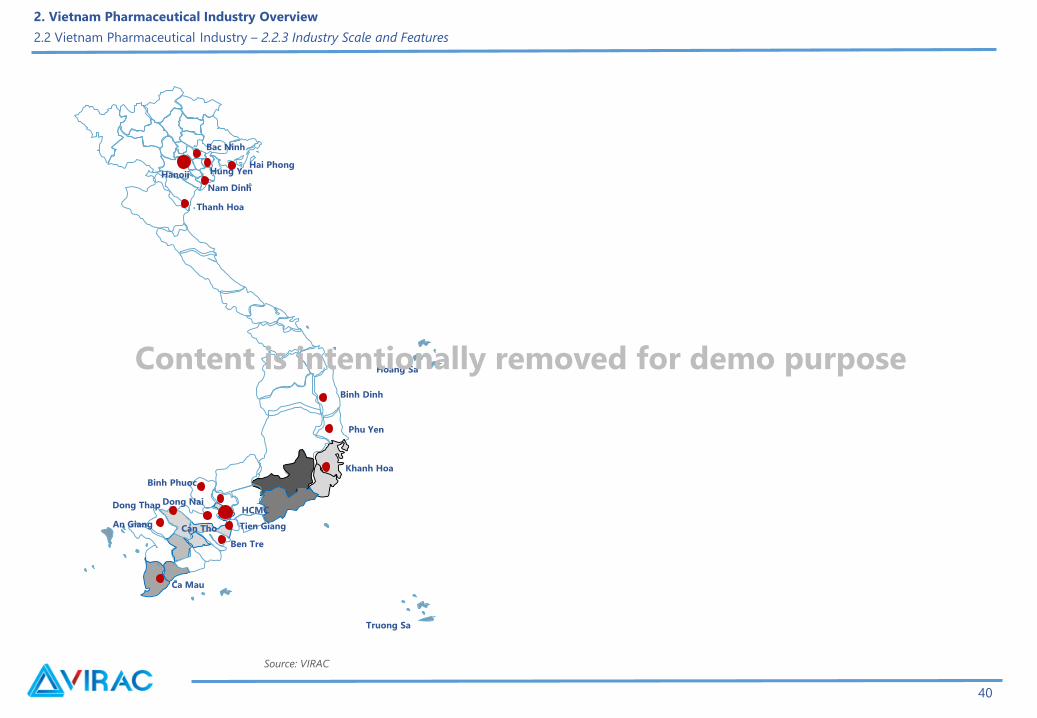
40
Hanoii
Hoang Sa
Truong Sa
Nam Dinh
Dong NaiHCMC
An Giang
Phu Yen
Khanh Hoa
Bac Ninh
Tien Giang
Dong Thap
Ca Mau
Hai Phong
Binh Dinh
Binh Phuoc
Ben Tre
Thanh Hoa
Can Tho
Hung Yen
Source: VIRAC
2. Vietnam Pharmaceutical Industry Overview
2.2 Vietnam Pharmaceutical Industry – 2.2.3 Industry Scale and Features
Content is intentionally removed for demo purpose
41
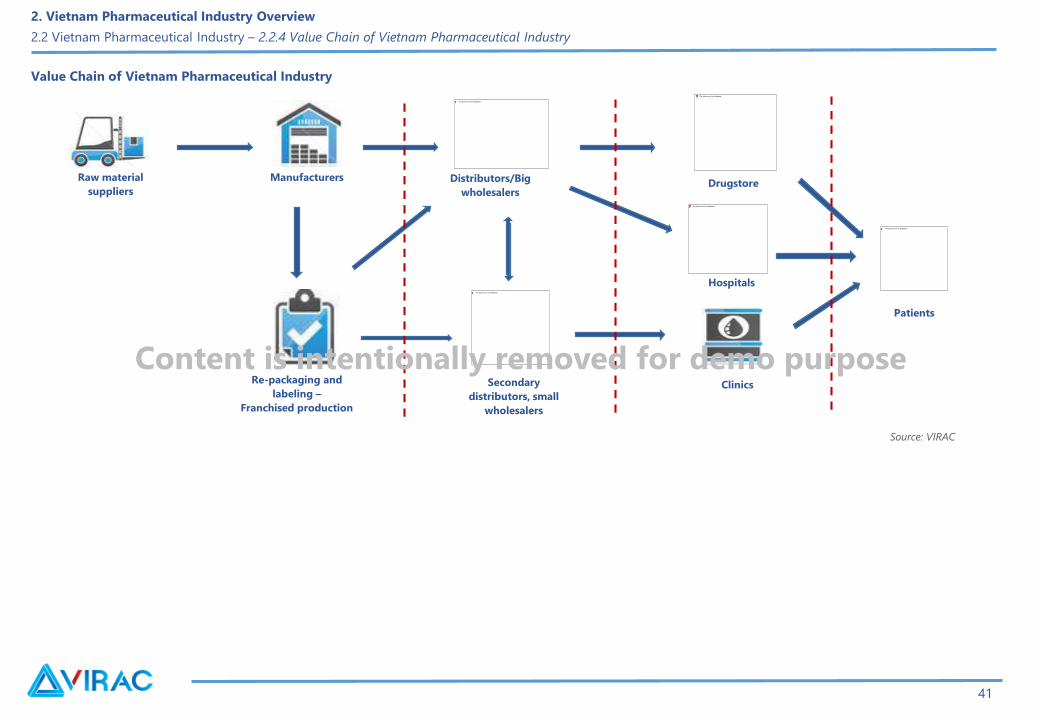
Hospitals
Raw material
suppliers
Manufacturers Distributors/Big
wholesalers
Re-packaging and
labeling –
Franchised production
Secondary
distributors, small
wholesalers
Drugstore
Clinics
Patients
Value Chain of Vietnam Pharmaceutical Industry
Source: VIRAC
2. Vietnam Pharmaceutical Industry Overview
2.2 Vietnam Pharmaceutical Industry – 2.2.4 Value Chain of Vietnam Pharmaceutical Industry
Content is intentionally removed for demo purpose
42
Classification of pharmaceutical raw materials
2. Vietnam Pharmaceutical Industry Overview
2.2 Vietnam Pharmaceutical Industry – 2.2.5 Raw Materials
Content is intentionally removed for demo purpose
43
2. Vietnam Pharmaceutical Industry Overview
2.2 Vietnam Pharmaceutical Industry – 2.2.5 Raw Materials
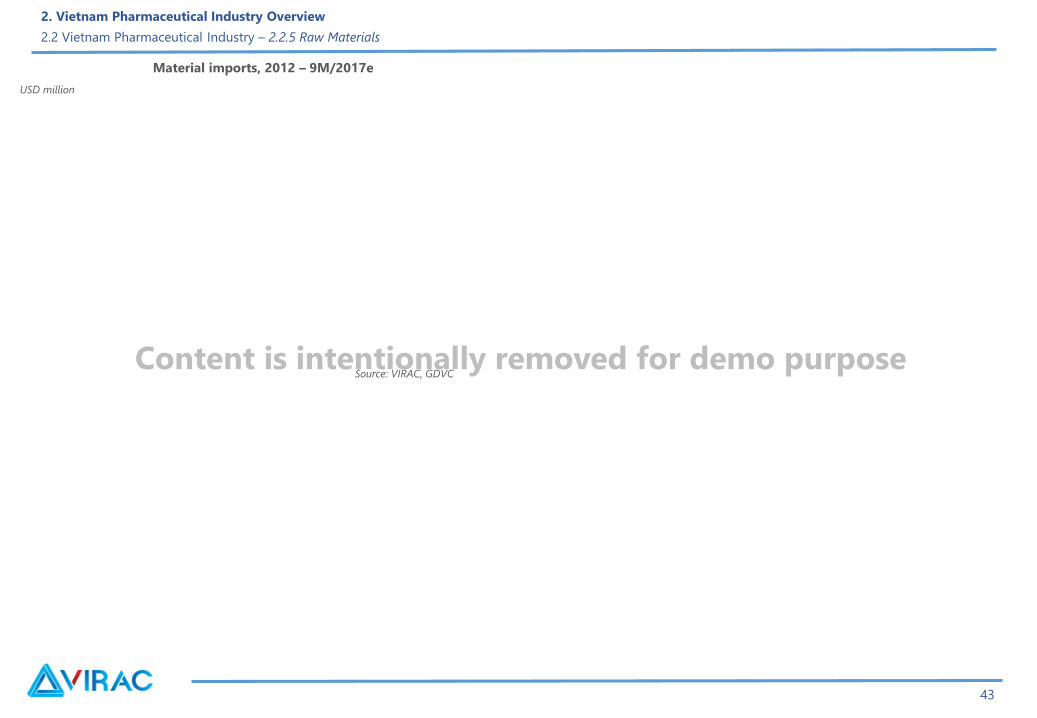
Source: VIRAC, GDVC
Material imports, 2012 – 9M/2017e
USD million
Content is intentionally removed for demo purpose
44
2. Vietnam Pharmaceutical Industry Overview
2.2 Vietnam Pharmaceutical Industry – 2.2.5 Raw Materials
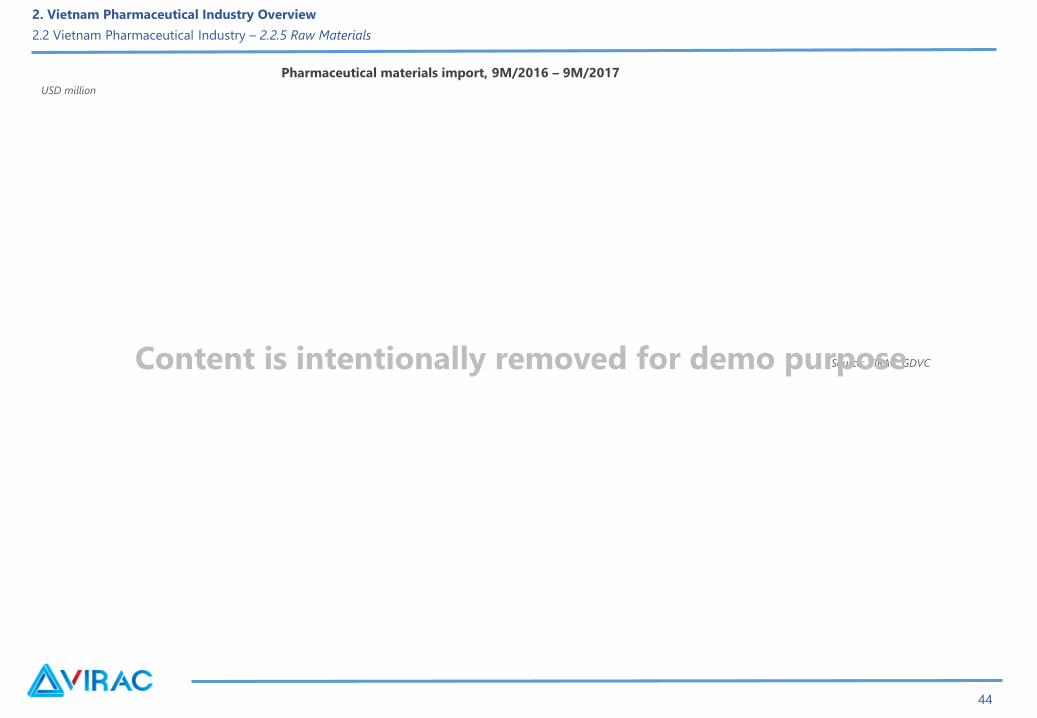
Pharmaceutical materials import, 9M/2016 – 9M/2017
Source: VIRAC, GDVC
USD million
Content is intentionally removed for demo purpose

45
Company
Machinery origin
Vietnam China
Countries
with average
technology
level (India,
Korea and
etc.)
Countries
with
average
technology
level (Japan,
Italy and
Germany)
Machinery origin of large pharmaceutical manufacturers
Source: VIRAC
No. Machinery name Year of use Origin Price
Source: VIRAC
Major equipment in pharmaceutical production lines
2. Vietnam Pharmaceutical Industry Overview
2.2 Vietnam Pharmaceutical Industry – 2.2.6 Production Technology
Content is intentionally removed for demo purpose

46
2. Vietnam Pharmaceutical Industry Overview
2.2 Vietnam Pharmaceutical Industry – 2.2.6 Production Technology
Content is intentionally removed for demo purpose
47
2. Vietnam Pharmaceutical Industry Overview
2.2 Vietnam Pharmaceutical Industry – 2.2.7 Research and Development
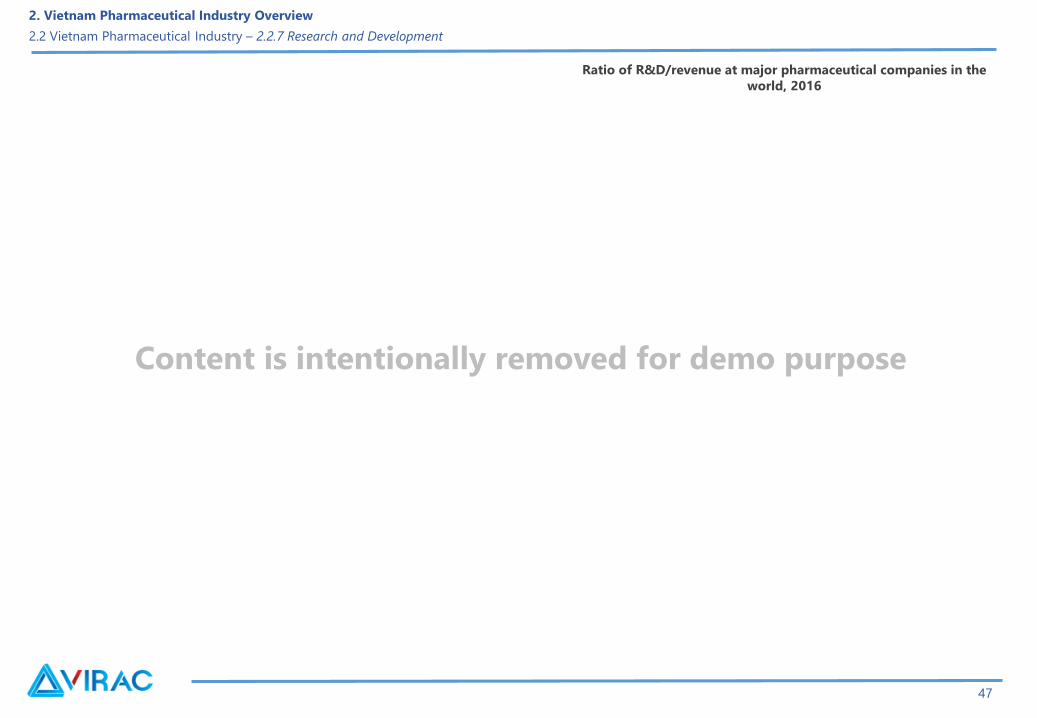
Ratio of R&D/revenue at major pharmaceutical companies in the
world, 2016
Content is intentionally removed for demo purpose
48
2. Vietnam Pharmaceutical Industry Overview
2.2 Vietnam Pharmaceutical Industry – 2.2.8 Production
Content is intentionally removed for demo purpose
49
2. Vietnam Pharmaceutical Industry Overview
2.2 Vietnam Pharmaceutical Industry – 2.2.8 Production
Source: VIRAC, DAV
USD billion
Domestic pharmaceutical production value, 2010 – 2016e
Content is intentionally removed for demo purpose
50
Source: VIRAC, GSO
2. Vietnam Pharmaceutical Industry Overview
2.2 Vietnam Pharmaceutical Industry – 2.2.8 Production
Products Unit 2012 2013 2014 2015e 2016e 9M/2017e
Statistics of produced medicines by type, 2010 – 9 months/2017e
Content is intentionally removed for demo purpose

51
Source: VIRAC, DAV
2. Pharmaceutical Industry Overview
2.2 Vietnam Pharmaceutical Industry Overview – 2.2.9 Consumption
0.6 0.7
Pharmaceutical market value, 2010 – 2016e
USD billion
Content is intentionally removed for demo purpose
52
Source: VIRAC, DAV
2. Pharmaceutical Industry Overview
2.2 Vietnam Pharmaceutical Industry Overview – 2.2.9 Consumption
0.6 0.7
Structure of medicine comsumption, 2009 – 2015e
Content is intentionally removed for demo purpose
53
Source: VIRAC, GSO
2. Pharmaceutical Industry Overview
2.2 Vietnam Pharmaceutical Industry Overview – 2.2.9 Consumption
0.6 0.7
VND trillion
Domestically produced medicine consumption, 2010 – 9M/2017e
Content is intentionally removed for demo purpose
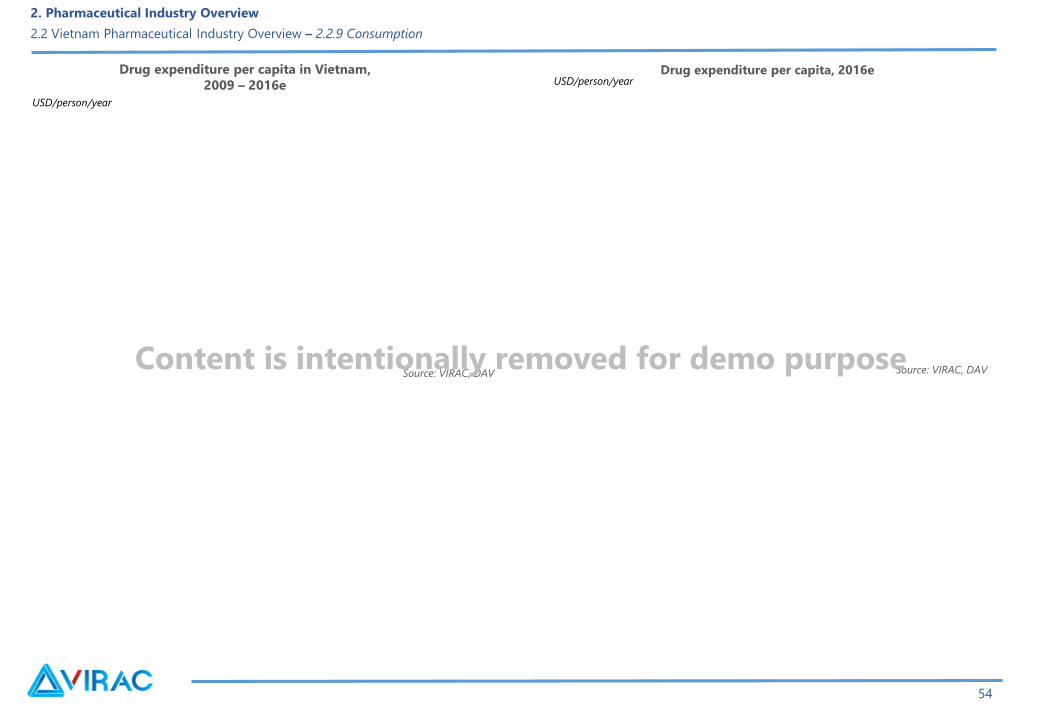
USD/person/year
Source: VIRAC, DAV
2. Pharmaceutical Industry Overview
2.2 Vietnam Pharmaceutical Industry Overview – 2.2.9 Consumption
54
Drug expenditure per capita in Vietnam,
2009 – 2016e USD/person/year
Source: VIRAC, DAV
Drug expenditure per capita, 2016e
Content is intentionally removed for demo purpose

55
Source: VIRAC, DAV
2. Pharmaceutical Industry Overview
2.2 Vietnam Pharmaceutical Industry Overview – 2.2.9 Consumption
Patent and Generic medicines consumption structure, 2010 - 2016eSource: VIRAC, DAV
Structure of medicine consumption by channel, 2010 - 2016e
Content is intentionally removed for demo purpose
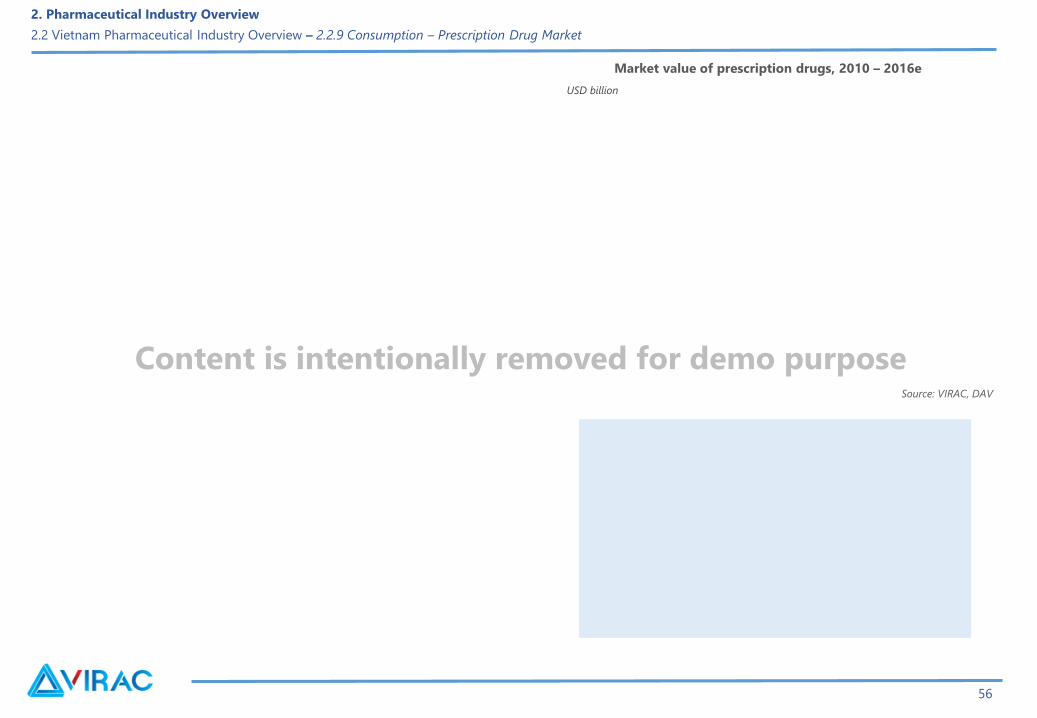
USD billion
Source: VIRAC, DAV
2. Pharmaceutical Industry Overview
2.2 Vietnam Pharmaceutical Industry Overview – 2.2.9 Consumption – Prescription Drug Market
56
Market value of prescription drugs, 2010 – 2016e
Content is intentionally removed for demo purpose
USD billion
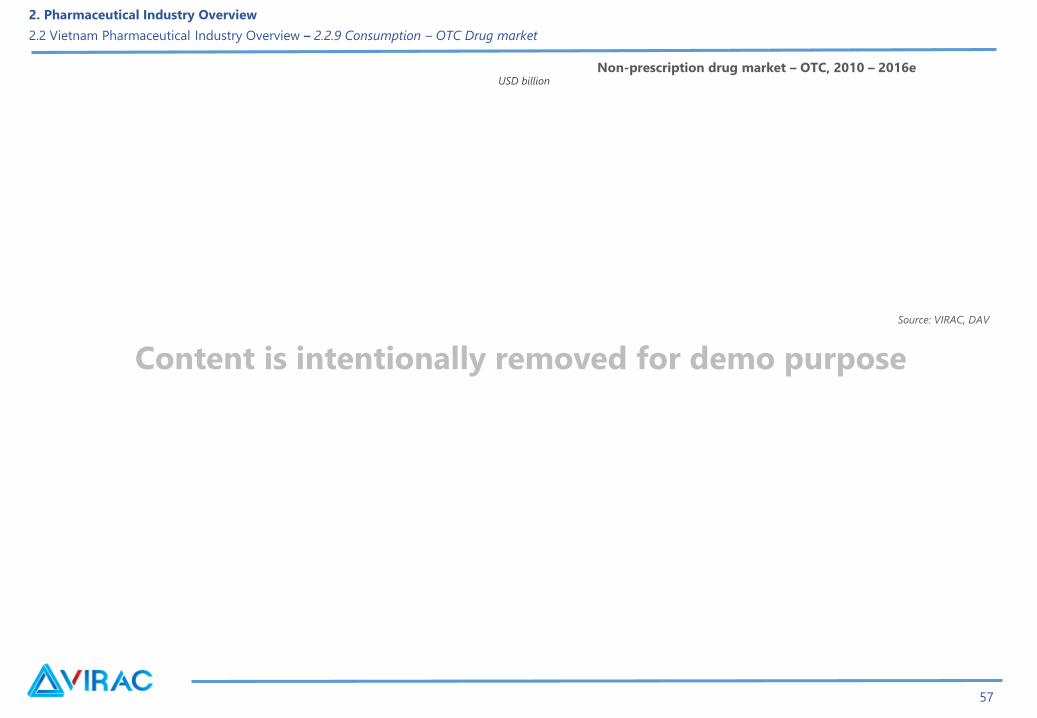
Source: VIRAC, DAV
2. Pharmaceutical Industry Overview
2.2 Vietnam Pharmaceutical Industry Overview – 2.2.9 Consumption – OTC Drug market
57
Non-prescription drug market – OTC, 2010 – 2016e
Content is intentionally removed for demo purpose
USD billion
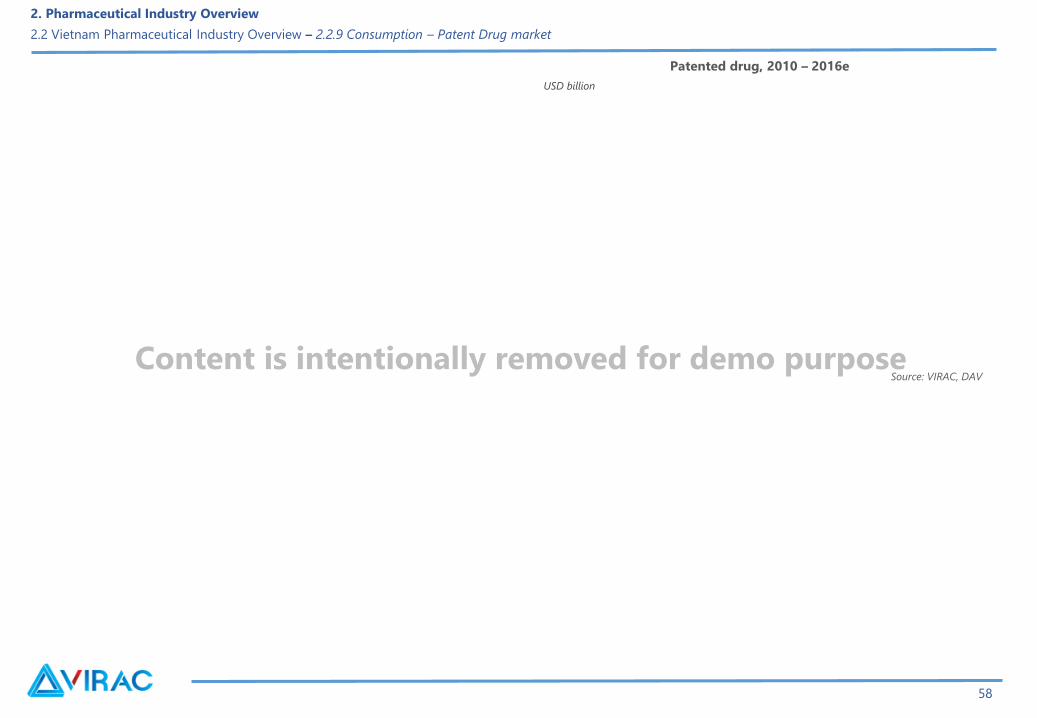
2. Pharmaceutical Industry Overview
2.2 Vietnam Pharmaceutical Industry Overview – 2.2.9 Consumption – Patent Drug market
Source: VIRAC, DAV
58
Patented drug, 2010 – 2016e
Content is intentionally removed for demo purpose

USD billion
Source: VIRAC, DAV
2. Pharmaceutical Industry Overview
2.2 Vietnam Pharmaceutical Industry Overview – 2.2.9 Consumption – Generic Drug Market
59
Generic drug market, 2010 – 2016e
Content is intentionally removed for demo purpose
2. Pharmaceutical Industry Overview
2.2 Vietnam Pharmaceutical Industry Overview – 2.2.10. Export – Import
60
Pharmaceutical imports, 2010 – 9M/2017eUSD million
USD million
Source: VIRAC, GDVC
Source: VIRAC, GDVC
Pharmaceutical imports, 9M/2016 – 9M/2017e
Content is intentionally removed for demo purpose
61
Source: VIRAC, GDVC
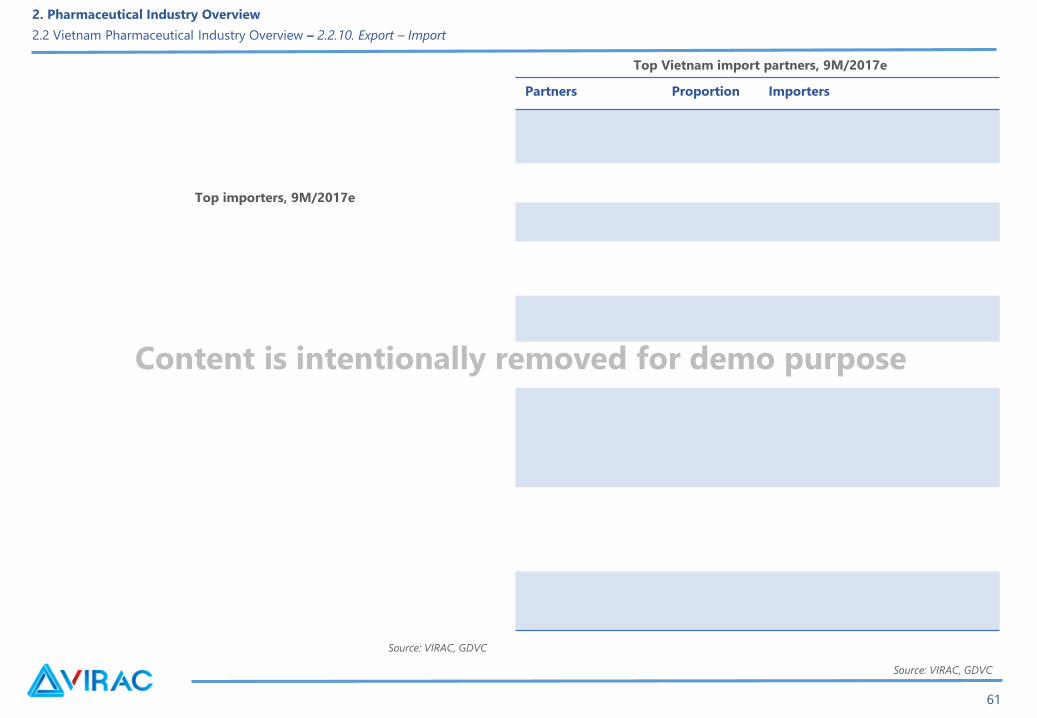
2. Pharmaceutical Industry Overview
2.2 Vietnam Pharmaceutical Industry Overview – 2.2.10. Export – Import
Top importers, 9M/2017e
Partners Proportion Importers
Source: VIRAC, GDVC
Top Vietnam import partners, 9M/2017e
Content is intentionally removed for demo purpose
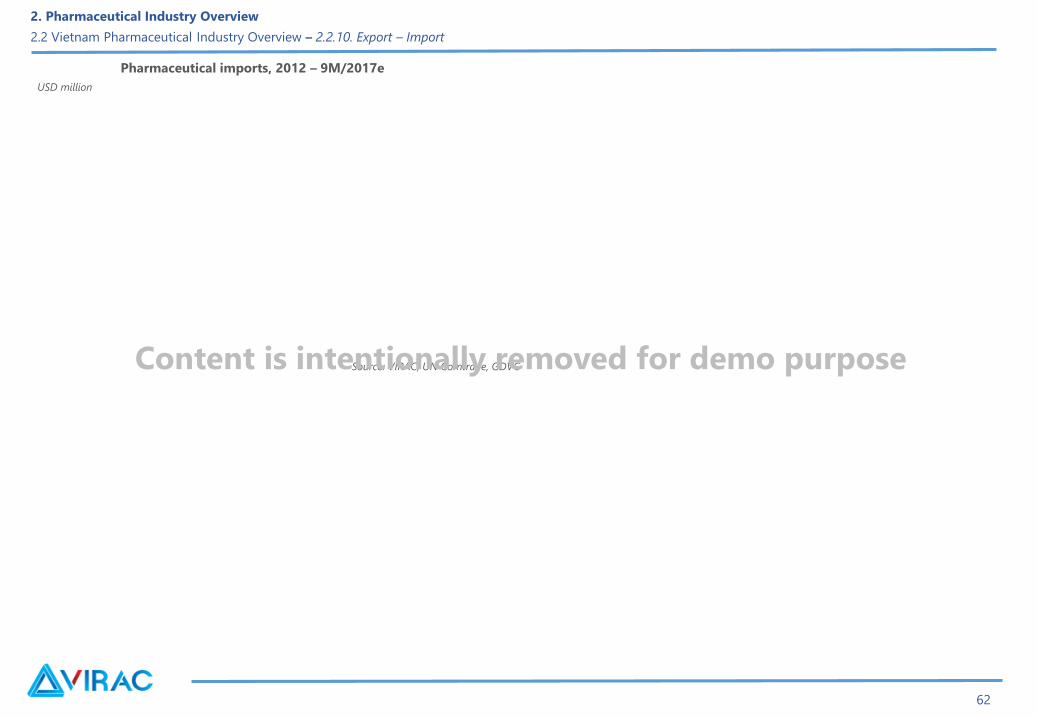
2. Pharmaceutical Industry Overview
2.2 Vietnam Pharmaceutical Industry Overview – 2.2.10. Export – Import
Source: VIRAC, UN Comtrade, GDVC
62
Pharmaceutical imports, 2012 – 9M/2017e
USD million
Content is intentionally removed for demo purpose
63
2. Pharmaceutical Industry Overview
2.2 Vietnam Pharmaceutical Industry Overview – 2.2.10. Export – Import
Source: VIRAC, GDVC
Source: VIRAC, GDVC
Export structure by enterprise, 9M/2017eMajor export structure by country, 9M/2017
Content is intentionally removed for demo purpose
Source: VIRAC, DAV
2. Pharmaceutical Industry Overview
2.2 Vietnam Pharmaceutical Industry Overview – 2.2.11. Price Movement
64
Rate of drug re-price (increase), 2013 - 2016
Content is intentionally removed for demo purpose
No. Drug Units Producers 6/2016 9/2016 12/2016 3/2017 9/2017
Compared
to the
beginning
of the same
period
65
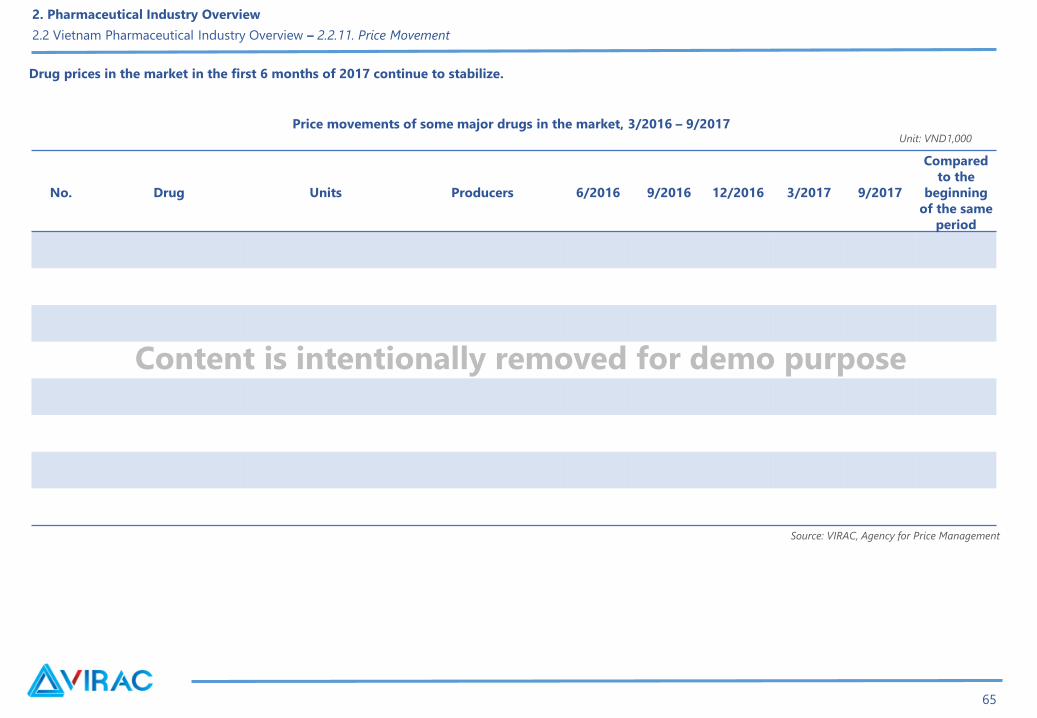
Price movements of some major drugs in the market, 3/2016 – 9/2017Unit: VND1,000
Source: VIRAC, Agency for Price Management
2. Pharmaceutical Industry Overview
2.2 Vietnam Pharmaceutical Industry Overview – 2.2.11. Price Movement
Drug prices in the market in the first 6 months of 2017 continue to stabilize.
Content is intentionally removed for demo purpose

Drugs name Highest price Lowest price Price Diference
The difference in the price of some drugs at Hapulico market, 2017
Source: VIRAC
2. Pharmaceutical Industry Overview
2.2 Vietnam Pharmaceutical Industry Overview – 2.2.11. Price Movement
66
Unit: VND thousand
Content is intentionally removed for demo purpose
Drugs distribution network in Vietnam
Source: VIRAC
2. Pharmaceutical Industry Overview
2.2 Vietnam Pharmaceutical Industry Overview – 2.2.12. Distribution System
67
Content is intentionally removed for demo purpose
The distribution system in Vietnam includes these main components:
1. Professional pharmaceutical distribution enterprises
2. Pharmaceutical Industry Overview
2.2 Vietnam Pharmaceutical Industry Overview – 2.2.12. Distribution System
68
Top pharmaceuticals distribution enterprise by revenue, 2016
Source: VIRAC
Content is intentionally removed for demo purpose
2. Pharmaceutical companies producing along with distributing
3. The wholesale market system
2. Pharmaceutical Industry Overview
2.2 Vietnam Pharmaceutical Industry Overview – 2.2.12. Distribution System
69
Content is intentionally removed for demo purpose

4. Public and private hospitals system
5.The private clinics system
2010 2011 2012 2013 2014 2015
The number of medical facilities, 2010 - 2015Unit: number of facilities
Source: VIRAC, GSO
2. Pharmaceutical Industry Overview
2.2 Vietnam Pharmaceutical Industry Overview – 2.2.12. Distribution System
70
Content is intentionally removed for demo purpose
6. Drugstores system:
2. Pharmaceutical Industry Overview
2.2 Vietnam Pharmaceutical Industry Overview – 2.2.12. Distribution System
71
Content is intentionally removed for demo purpose
72
2. Pharmaceutical Industry Overview
2.2 Vietnam Pharmaceutical Industry Overview – 2.2.12. Distribution System
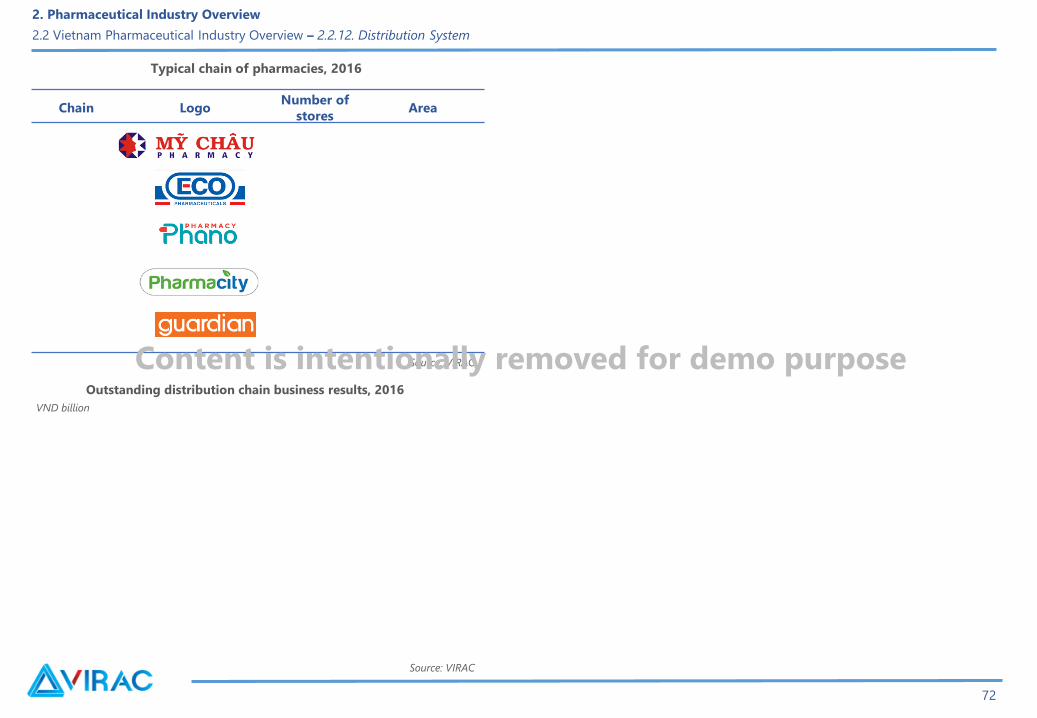
Chain LogoNumber of
storesArea
Typical chain of pharmacies, 2016
Source: VIRAC
VND billion
Source: VIRAC
Outstanding distribution chain business results, 2016
Content is intentionally removed for demo purpose

2. Pharmaceutical Industry Overview
2.1 Global Pharmaceutical Industry Overview
2.2 Vietnam Pharmaceutical Industry Overview
2.3 Risks and Challenges
2.4 Industry Planning
2.5 Driving Forces and Forecast
Content
73
2. Pharmaceutical Industry Overview
2.3. Risks and Challenges – 2.3.1. Legal Risks
74
Content is intentionally removed for demo purpose

Material risk
2. Pharmaceutical Industry Overview
2.3 Risks and Challenges – 2.3.2. Industry Risks
75
Content is intentionally removed for demo purpose
Market risks
Competition risks
The risks on products and technology
2. Pharmaceutical Industry Overview
2.3 Risks and Challenges – 2.3.2. Industry Risks
76
Content is intentionally removed for demo purpose
77
Investment risk and failure in research and development
2. Pharmaceutical Industry Overview
2.3 Risks and Challenges – 2.3.2. Industry Risks
Number of new
drugs allowed to
circulate
Average cost Cost of R&D
research for 10
years
Average cost
for each new
drug
Average cost of R&D to produce new drugs (USD million)
Source: VIRAC, Innothink
Exchange rate risk
Content is intentionally removed for demo purpose

78
Drug prices
Production licensing time
Source: VIRAC, DAV
Substitute products
Poor – quality drug situation
2. Pharmaceutical Industry Overview
2.3 Risks and Challenges – 2.3.3 Challenges
Unqualified sample ratio, 2010 – 2016e
Content is intentionally removed for demo purpose
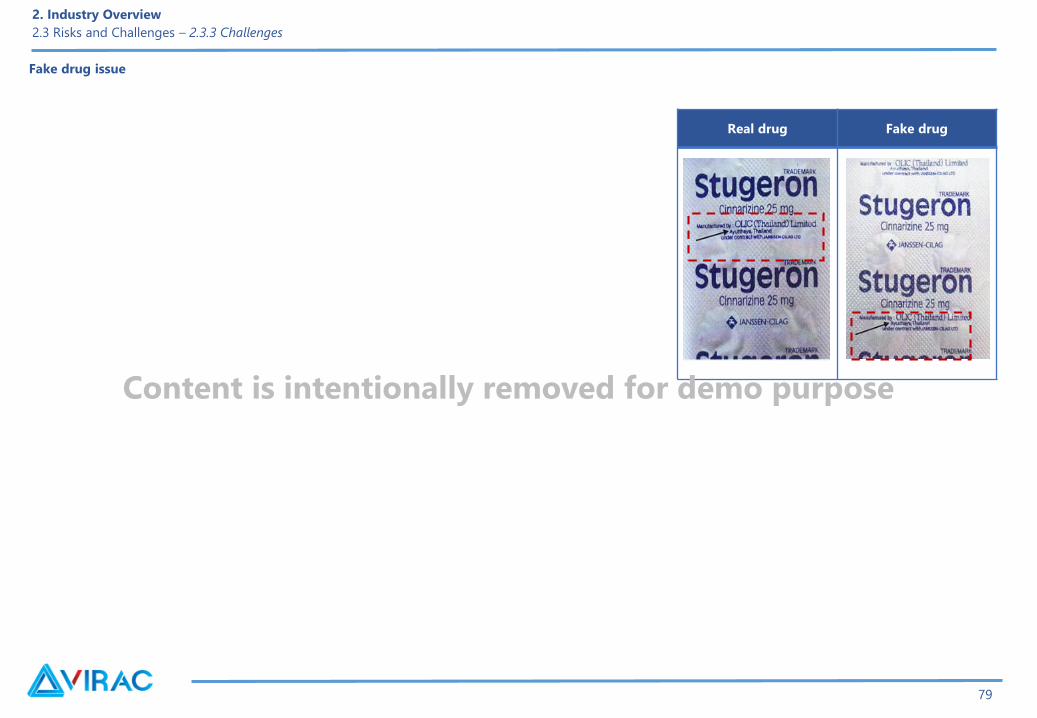
Fake drug issue
Real drug Fake drug
2. Industry Overview
2.3 Risks and Challenges – 2.3.3 Challenges
79
Content is intentionally removed for demo purpose
2. Pharmaceutical Industry Overview
2.1 Global Pharmaceutical Industry Overview
2.2 Vietnam Pharmaceutical Industry Overview
2.3 Risks and Challenges
2.4 Industry Planning
2.5 Driving Forces and Forecast
Content
80

2. Industry Overview
2.4. Industry Planning
81
Content is intentionally removed for demo purpose
2. Pharmaceutical Industry Overview
2.1 Global Pharmaceutical Industry Overview
2.2 Vietnam Pharmaceutical Industry Overview
2.3 Risks and Challenges
2.4 Industry Planning
2.5 Driving Forces and Forecast
Content
82

2. Industry Overview
2.5. Driving Forces and Forecast – Driving Forces
83
Source: VIRAC, WHO
Content is intentionally removed for demo purpose
84
Population motivation and healthcare awareness:
Source: VIRAC, WHO
2. Industry Overview
2.5. Driving Forces and Forecast – Driving Forces
USD million
Total healthcare expenses, 2010 – 2016f
Source: VIRAC, IMS health
Million people
Over-60 population growth in the world, 1950 – 2050
Source: VIRAC, GSO
Population tower, 2016
Content is intentionally removed for demo purpose

85
2. Industry Overview
2.5. Driving Forces and Forecast – Industry development trend
Content is intentionally removed for demo purpose
86
2016 is a blurry year compared to the record breaking 2015 in the Mergers
and Acquisitions (M&A) market.
2. Industry Overview
2.5. Driving Forces and Forecast – M&A Trend in the World
Source: VIRAC, EvaluatePharma
M&A of pharmaceutical industry, 2010 – 2016e
Content is intentionally removed for demo purpose
2. Industry Overview
2.5. Driving Forces and Forecast – M&A Trend in Vietnam
87
Content is intentionally removed for demo purpose
Country Growth rate
Source: VIRAC, IMS Health
2. Industry Overview
2.5. Driving Forces and Forecast – Global Forecast
88
Content is intentionally removed for demo purpose
DrugsUSD
billion
1
2
3
4
5
6
7
8
9
10
DrugsUSD
billion
1
2
3
4
5
6
7
8
9
10
The increase of cure
The revenue of top drugs in developed countries, 2018 The revenue of top drugs in developing countries, 2018
Source: VIRAC, IMS Health Source: VIRAC, IMS Health
2. Industry Overview
2.5. Driving Forces and Forecast – Global Forecast
89
Content is intentionally removed for demo purpose

2. Industry Overview
2.5. Driving Forces and Forecast – Vietnam Forecast
90
Content is intentionally removed for demo purpose
Source: VIRAC
2. Industry Overview
2.5. Driving Forces and Forecast – Vietnam Forecast
91
The growth of total drug consumption and average drug spending per capita,
2010-2020f
Content is intentionally removed for demo purpose

3. Enterprise Analysis
3.1 Profitability Ratios
3.2 Cost Structure
3.3 Asset Management Ratios
3.4 Capital Structure
3.5 Solvency Ratios
3.6 Return Ratios
Content
92
3. Enterprise Analysis
10 typical pharmaceutical enterprises in 2015
No. Company Major sector
Revenue
(VND
billion)
Main features
1
2
3
4
5
10 typical pharmaceutical enterprises in 2015
Source: VIRAC
78
Content is intentionally removed for demo purpose

3. Enterprise Analysis
10 typical pharmaceutical enterprises in 2015
No. Company Major sector
Revenue
(VND
billion)
Main features
6
7
8
9
10
Source: VIRAC
79
Content is intentionally removed for demo purpose
3. Enterprise Analysis
3.1 Profitability Ratios
3.2 Cost Structure
3.3 Asset Management Ratios
3.4 Capital Structure
3.5 Solvency Ratios
3.6 Return Ratios
Content
77

3. Enterprise Analysis
3.1 Profitability Ratios
96
Pharmaceutical companies have a good business year when they have a positive profit margin, with the average group of producers having higher gross
margins and ROS than the distribution group.
Profit indicators, 2015 - 2016
VND billion
Source: VIRAC
Content is intentionally removed for demo purpose
97
3. Enterprise Analysis
3.1 Profitability Ratios
Content is intentionally removed for demo purpose

98
3. Enterprise Analysis
3.1 Profitability Ratios
Source: VIRAC
COGS/NR, 2016
Content is intentionally removed for demo purpose
3. Enterprise Analysis
3.1 Profitability Ratios
3.2 Cost Structure
3.3 Asset Management Ratios
3.4 Capital Structure
3.5 Solvency Ratios
3.6 Return Ratios
Content
77
100
The group of manufacturing enterprises spent more on selling than the distribution group
3. Enterprise Analysis
3.2. Cost Structure
Source: VIRAC
Selling costs, 2015 - 2016
Content is intentionally removed for demo purpose
101
3. Enterprise Analysis
3.2. Cost Structure
Source: VIRAC
General and administrative expenses, 2015 - 2016
Content is intentionally removed for demo purpose
3. Enterprise Analysis
3.1 Profitability Ratios
3.2 Cost Structure
3.3 Asset Management Ratios
3.4 Capital Structure
3.5 Solvency Ratios
3.6 Return Ratios
Content
77
The total days in inventory of the whole pharmaceutical industry in 2014 – 2016 increased slightly.
3. Enterprise Analysis
3.3. Asset Management Ratios
103
Day
Source: VIRAC
Inventory days, 2016
Content is intentionally removed for demo purpose

Days
Source: VIRAC
3. Enterprise Analysis
3.3. Asset Management Ratios
104
Average collecting period, 2016
Content is intentionally removed for demo purpose

Source: VIRAC
3. Enterprise Analysis
3.3. Asset Management Ratios
105
Asset turnover, 2016
Content is intentionally removed for demo purpose
3. Enterprise Analysis
3.1 Profitability Ratios
3.2 Cost Structure
3.3 Asset Management Ratios
3.4 Capital Structure
3.5 Solvency Ratios
3.6 Return Ratios
Content
77

3. Enterprise Analysis
3.4. Capital Structure
Source: VIRAC
107
Self-funding ratio, 2015 - 2016
Content is intentionally removed for demo purpose

3. Enterprise Analysis
3.1 Profitability Ratios
3.2 Cost Structure
3.3 Asset Management Ratios
3.4 Capital Structure
3.5 Solvency Ratios
3.6 Return Ratios
Content
77
Source: VIRAC
3. Enterprise Analysis
3.5. Solvency Ratio
109
Solvency, 2015 - 2016
Content is intentionally removed for demo purpose
3. Enterprise Analysis
3.1 Profitability Ratios
3.2 Cost Structure
3.3 Asset Management Ratios
3.4 Capital Structure
3.5 Solvency Ratios
3.6 Return Ratios
Content
77
3. Enterprise Analysis
3.6. Return Ratio
Source: VIRAC
111
Profit ratio, 2015 - 2016
Content is intentionally removed for demo purpose
112
4. Appendix
Financial Statement
Content
DHG Pharmaceutical Jsc.
BALANCE SHEETS
Unit: VND 2015 2016
A. SHORT-TERM ASSETS
I. Cash and cash equivalents
II. Short-term financial investments
III. Short-term receivable
1. Short-term receivables of customers
IV. Inventories
B. LONG-TERM ASSETS
TOTAL ASSETS
A. LIABILITIES
I. Current liabilities
1. Borrowings and short-term financial leased
liabilities
2. Taxes and other payables to the State budget
II. Long-term Liabilities
1. Borrowings and long-term financial leased
liabilities
2. Provision for long-term payables
B. OWNER’S EQUITY
TOTAL CAPITAL RESOURCES
113
INCOME STATEMENT
Unit: VND million 2015 2016
Net revenue
Cost of goods
Gross profit
Revenue from financing activities
Financial expense
Loan interest expenses
Cost of sales
Enterprise administration expenses
Net profit from business operations
Total accounting profit before tax
Costs of current corporate income tax
Costs of deferred corporate income tax
Profit after tax
CASH FLOW STATEMENT
Unit: VND million 2015 2016
I. Cash Flow From Operating Activities
Depreciation of fixed assets
Unrealized foreign exchange profit(loss)
Net Cash Flow From Operations
II Cash flow from investing activities
Purchases of fixed assets and other long-term assets
Net cash flow from investing activities
III. Cash flow from financing activities
Net cash flow from financing activities
Effect of foreign exchange differences
Net cash flow of the year
4. Appendix
Financial Statement
Content is intentionally removed for demo purpose

Traphaco Jsc.
BALANCE SHEETS
Unit: VND 2015 2016
A. SHORT-TERM ASSETS
I. Cash and cash equivalents
II. Short-term financial investments
III. Short-term receivable
1. Short-term receivables of customers
IV. Inventories
B. LONG-TERM ASSETS
TOTAL ASSETS
A. LIABILITIES
I. Current liabilities
1. Borrowings and short-term financial leased
liabilities
2. Taxes and other payables to the State budget
II. Long-term Liabilities
1. Borrowings and long-term financial leased
liabilities
2. Provision for long-term payables
B. OWNER’S EQUITY
TOTAL CAPITAL RESOURCES
114
INCOME STATEMENT
Unit: VND million 2015 2016
Net revenue
Cost of goods
Gross profit
Revenue from financing activities
Financial expense
Loan interest expenses
Cost of sales
Enterprise administration expenses
Net profit from business operations
Total accounting profit before tax
Costs of current corporate income tax
Costs of deferred corporate income tax
Profit after tax
CASH FLOW STATEMENT
Unit: VND million 2015 2016
I. Cash Flow From Operating Activities
Depreciation of fixed assets
Unrealized foreign exchange profit(loss)
Net Cash Flow From Operations
II Cash flow from investing activities
Purchases of fixed assets and other long-term assets
Net cash flow from investing activities
III. Cash flow from financing activities
Net cash flow from financing activities
Effect of foreign exchange differences
Net cash flow of the year
4. Appendix
Financial Statement
Content is intentionally removed for demo purpose
Domesco Medical Import Export Jsc.
BALANCE SHEETS
Unit: VND 2015 2016
A. SHORT-TERM ASSETS
I. Cash and cash equivalents
II. Short-term financial investments
III. Short-term receivable
1. Short-term receivables of customers
IV. Inventories
B. LONG-TERM ASSETS
TOTAL ASSETS
A. LIABILITIES
I. Current liabilities
1. Borrowings and short-term financial leased
liabilities
2. Taxes and other payables to the State budget
II. Long-term Liabilities
1. Borrowings and long-term financial leased
liabilities
2. Provision for long-term payables
B. OWNER’S EQUITY
TOTAL CAPITAL RESOURCES
115
INCOME STATEMENT
Unit: VND million 2015 2016
Net revenue
Cost of goods
Gross profit
Revenue from financing activities
Financial expense
Loan interest expenses
Cost of sales
Enterprise administration expenses
Net profit from business operations
Total accounting profit before tax
Costs of current corporate income tax
Costs of deferred corporate income tax
Profit after tax
CASH FLOW STATEMENT
Unit: VND million 2015 2016
I. Cash Flow From Operating Activities
Depreciation of fixed assets
Unrealized foreign exchange profit(loss)
Net Cash Flow From Operations
II Cash flow from investing activities
Purchases of fixed assets and other long-term assets
Net cash flow from investing activities
III. Cash flow from financing activities
Net cash flow from financing activities
Effect of foreign exchange differences
Net cash flow of the year
4. Appendix
Financial Statement
Content is intentionally removed for demo purpose
Imexpharm Pharmaceutical Jsc.
BALANCE SHEETS
Unit: VND 2015 2016
A. SHORT-TERM ASSETS
I. Cash and cash equivalents
II. Short-term financial investments
III. Short-term receivable
1. Short-term receivables of customers
IV. Inventories
B. LONG-TERM ASSETS
TOTAL ASSETS
A. LIABILITIES
I. Current liabilities
1. Borrowings and short-term financial leased
liabilities
2. Taxes and other payables to the State budget
II. Long-term Liabilities
1. Borrowings and long-term financial leased
liabilities
2. Provision for long-term payables
B. OWNER’S EQUITY
TOTAL CAPITAL RESOURCES
116
INCOME STATEMENT
Unit: VND million 2015 2016
Net revenue
Cost of goods
Gross profit
Revenue from financing activities
Financial expense
Loan interest expenses
Cost of sales
Enterprise administration expenses
Net profit from business operations
Total accounting profit before tax
Costs of current corporate income tax
Costs of deferred corporate income tax
Profit after tax
CASH FLOW STATEMENT
Unit: VND million 2015 2016
I. Cash Flow From Operating Activities
Depreciation of fixed assets
Unrealized foreign exchange profit(loss)
Net Cash Flow From Operations
II Cash flow from investing activities
Purchases of fixed assets and other long-term assets
Net cash flow from investing activities
III. Cash flow from financing activities
Net cash flow from financing activities
Effect of foreign exchange differences
Net cash flow of the year
4. Appendix
Financial Statement
Content is intentionally removed for demo purpose

OPC Pharmaceutical JSC.
BALANCE SHEETS
Unit: VND 2015 2016
A. SHORT-TERM ASSETS
I. Cash and cash equivalents
II. Short-term financial investments
III. Short-term receivable
1. Short-term receivables of customers
IV. Inventories
B. LONG-TERM ASSETS
TOTAL ASSETS
A. LIABILITIES
I. Current liabilities
1. Borrowings and short-term financial leased
liabilities
2. Taxes and other payables to the State budget
II. Long-term Liabilities
1. Borrowings and long-term financial leased
liabilities
2. Provision for long-term payables
B. OWNER’S EQUITY
TOTAL CAPITAL RESOURCES
117
INCOME STATEMENT
Unit: VND million 2015 2016
Net revenue
Cost of goods
Gross profit
Revenue from financing activities
Financial expense
Loan interest expenses
Cost of sales
Enterprise administration expenses
Net profit from business operations
Total accounting profit before tax
Costs of current corporate income tax
Costs of deferred corporate income tax
Profit after tax
CASH FLOW STATEMENT
Unit: VND million 2015 2016
I. Cash Flow From Operating Activities
Depreciation of fixed assets
Unrealized foreign exchange profit(loss)
Net Cash Flow From Operations
II Cash flow from investing activities
Purchases of fixed assets and other long-term assets
Net cash flow from investing activities
III. Cash flow from financing activities
Net cash flow from financing activities
Effect of foreign exchange differences
Net cash flow of the year
4. Appendix
Financial Statement
Content is intentionally removed for demo purpose
S.P.M Corp
BALANCE SHEETS
Unit: VND 2015 2016
A. SHORT-TERM ASSETS
I. Cash and cash equivalents
II. Short-term financial investments
III. Short-term receivable
1. Short-term receivables of customers
IV. Inventories
B. LONG-TERM ASSETS
TOTAL ASSETS
A. LIABILITIES
I. Current liabilities
1. Borrowings and short-term financial leased
liabilities
2. Taxes and other payables to the State budget
II. Long-term Liabilities
1. Borrowings and long-term financial leased
liabilities
2. Provision for long-term payables
B. OWNER’S EQUITY
TOTAL CAPITAL RESOURCES
118
INCOME STATEMENT
Unit: VND million 2015 2016
Net revenue
Cost of goods
Gross profit
Revenue from financing activities
Financial expense
Loan interest expenses
Cost of sales
Enterprise administration expenses
Net profit from business operations
Total accounting profit before tax
Costs of current corporate income tax
Costs of deferred corporate income tax
Profit after tax
CASH FLOW STATEMENT
Unit: VND million 2015 2016
I. Cash Flow From Operating Activities
Depreciation of fixed assets
Unrealized foreign exchange profit(loss)
Net Cash Flow From Operations
II Cash flow from investing activities
Purchases of fixed assets and other long-term assets
Net cash flow from investing activities
III. Cash flow from financing activities
Net cash flow from financing activities
Effect of foreign exchange differences
Net cash flow of the year
4. Appendix
Financial Statement
Content is intentionally removed for demo purpose

Vimedimex Medi – Pharma Jsc.
BALANCE SHEETS
Unit: VND 2015 2016
A. SHORT-TERM ASSETS
I. Cash and cash equivalents
II. Short-term financial investments
III. Short-term receivable
1. Short-term receivables of customers
IV. Inventories
B. LONG-TERM ASSETS
TOTAL ASSETS
A. LIABILITIES
I. Current liabilities
1. Borrowings and short-term financial leased
liabilities
2. Taxes and other payables to the State budget
II. Long-term Liabilities
1. Borrowings and long-term financial leased
liabilities
2. Provision for long-term payables
B. OWNER’S EQUITY
TOTAL CAPITAL RESOURCES
119
INCOME STATEMENT
Unit: VND million 2015 2016
Net revenue
Cost of goods
Gross profit
Revenue from financing activities
Financial expense
Loan interest expenses
Cost of sales
Enterprise administration expenses
Net profit from business operations
Total accounting profit before tax
Costs of current corporate income tax
Costs of deferred corporate income tax
Profit after tax
CASH FLOW STATEMENT
Unit: VND million 2015 2016
I. Cash Flow From Operating Activities
Depreciation of fixed assets
Unrealized foreign exchange profit(loss)
Net Cash Flow From Operations
II Cash flow from investing activities
Purchases of fixed assets and other long-term assets
Net cash flow from investing activities
III. Cash flow from financing activities
Net cash flow from financing activities
Effect of foreign exchange differences
Net cash flow of the year
4. Appendix
Financial Statement
Content is intentionally removed for demo purpose

Ha Tay Pharmaceutical JSC.
BALANCE SHEETS
Unit: VND 2015 2016
A. SHORT-TERM ASSETS
I. Cash and cash equivalents
II. Short-term financial investments
III. Short-term receivable
1. Short-term receivables of customers
IV. Inventories
B. LONG-TERM ASSETS
TOTAL ASSETS
A. LIABILITIES
I. Current liabilities
1. Borrowings and short-term financial leased
liabilities
2. Taxes and other payables to the State budget
II. Long-term Liabilities
1. Borrowings and long-term financial leased
liabilities
2. Provision for long-term payables
B. OWNER’S EQUITY
TOTAL CAPITAL RESOURCES
120
INCOME STATEMENT
Unit: VND million 2015 2016
Net revenue
Cost of goods
Gross profit
Revenue from financing activities
Financial expense
Loan interest expenses
Cost of sales
Enterprise administration expenses
Net profit from business operations
Total accounting profit before tax
Costs of current corporate income tax
Costs of deferred corporate income tax
Profit after tax
CASH FLOW STATEMENT
Unit: VND million 2015 2016
I. Cash Flow From Operating Activities
Depreciation of fixed assets
Unrealized foreign exchange profit(loss)
Net Cash Flow From Operations
II Cash flow from investing activities
Purchases of fixed assets and other long-term assets
Net cash flow from investing activities
III. Cash flow from financing activities
Net cash flow from financing activities
Effect of foreign exchange differences
Net cash flow of the year
4. Appendix
Financial Statement
Content is intentionally removed for demo purpose
Ben Tre Pharmaceutical Jsc.
BALANCE SHEETS
Unit: VND 2015 2016
A. SHORT-TERM ASSETS
I. Cash and cash equivalents
II. Short-term financial investments
III. Short-term receivable
1. Short-term receivables of customers
IV. Inventories
B. LONG-TERM ASSETS
TOTAL ASSETS
A. LIABILITIES
I. Current liabilities
1. Borrowings and short-term financial leased
liabilities
2. Taxes and other payables to the State budget
II. Long-term Liabilities
1. Borrowings and long-term financial leased
liabilities
2. Provision for long-term payables
B. OWNER’S EQUITY
TOTAL CAPITAL RESOURCES
121
INCOME STATEMENT
Unit: VND million 2015 2016
Net revenue
Cost of goods
Gross profit
Revenue from financing activities
Financial expense
Loan interest expenses
Cost of sales
Enterprise administration expenses
Net profit from business operations
Total accounting profit before tax
Costs of current corporate income tax
Costs of deferred corporate income tax
Profit after tax
CASH FLOW STATEMENT
Unit: VND million 2015 2016
I. Cash Flow From Operating Activities
Depreciation of fixed assets
Unrealized foreign exchange profit(loss)
Net Cash Flow From Operations
II Cash flow from investing activities
Purchases of fixed assets and other long-term assets
Net cash flow from investing activities
III. Cash flow from financing activities
Net cash flow from financing activities
Effect of foreign exchange differences
Net cash flow of the year
4. Appendix
Financial Statement
Content is intentionally removed for demo purpose
Lam Dong Pharmaceutical Jsc.
BALANCE SHEETS
Unit: VND 2015 2016
A. SHORT-TERM ASSETS
I. Cash and cash equivalents
II. Short-term financial investments
III. Short-term receivable
1. Short-term receivables of customers
IV. Inventories
B. LONG-TERM ASSETS
TOTAL ASSETS
A. LIABILITIES
I. Current liabilities
1. Borrowings and short-term financial leased
liabilities
2. Taxes and other payables to the State budget
II. Long-term Liabilities
1. Borrowings and long-term financial leased
liabilities
2. Provision for long-term payables
B. OWNER’S EQUITY
TOTAL CAPITAL RESOURCES
122
INCOME STATEMENT
Unit: VND million 2015 2016
Net revenue
Cost of goods
Gross profit
Revenue from financing activities
Financial expense
Loan interest expenses
Cost of sales
Enterprise administration expenses
Net profit from business operations
Total accounting profit before tax
Costs of current corporate income tax
Costs of deferred corporate income tax
Profit after tax
CASH FLOW STATEMENT
Unit: VND million 2015 2016
I. Cash Flow From Operating Activities
Depreciation of fixed assets
Unrealized foreign exchange profit(loss)
Net Cash Flow From Operations
II Cash flow from investing activities
Purchases of fixed assets and other long-term assets
Net cash flow from investing activities
III. Cash flow from financing activities
Net cash flow from financing activities
Effect of foreign exchange differences
Net cash flow of the year
4. Appendix
Financial Statement
Content is intentionally removed for demo purpose

REPORT DISCLAIMER
REPORT DISCLAIMER
This document has been prepared in good faith on the basis of information available at the date of publication without any
independent verification. VIRAC has produced this report for private circulation to professional clients only. All information and
statistical data herein have been obtained from sources we believe to be reliable and made to ensure the accuracy of the contents of
the pages of the report at the time of preparation. Such information has not been independently verified and VIRAC makes no
representation or warranty, whether express or implied, of any kind with respect to the document and its contents, information and
materials. The content found in this report is proprietary to VIRAC and is provided solely for your personal and non-commercial use.
You agree that you will not use this report for any purpose that is unlawful and that you will not reproduce the report or redistribute it
outside your organisation, or place it on a website for public access without the express written permission of VIRAC.
SHOULD YOU NEED ANY ASSISTANCE, PLEASE CONTACT US:
VIETNAM INDUSTRY RESEARCH AND CONSUTANT (VIRAC JSC.,)
6th Floor, Anh Minh Building, 36 Hoang Cau, O Cho Dua, Dong Da, Hanoi, Vietnam
Website: http://virac.com.vn/
Email: [email protected] | Tel: +84 463289520
123

Thank you !