· web viewaxometrics, inc. 103 quality circle, suite 215. huntsville, al 35806. phone: (256)...
TRANSCRIPT

Axometrics, Inc.103 Quality Circle, Suite 215Huntsville, AL 35806Phone: (256) 704-3332Fax: (256) 971-2073
E-Mail: [email protected]: http://www.axometrics.com
AxoStepTM
Imaging Mueller Matrix Polarimeter
OPERATOR’S SOFTWARE MANUAL
©2012 Axometrics, Inc. All rights reserved.AxoStep, AxoScan, Axometrics and the Axometrics logo are trademarks of Axometrics, Inc.

Axometrics, Inc.AxoStep Polarimeter, Rev 3.0
ii

Please read these instructions completely and carefully before operating the Mueller Matrix Polarimeter. If you have any questions, or experience any difficulties, please contact Axometrics or the representative from whom the instrument was purchased.
Axometrics, Inc.AxoStep Polarimeter, Rev 3.0
iii

Axometrics, Inc.AxoStep Polarimeter, Rev 3.0
iv

CONTENTS
1 Introduction......................................................................................................................................... 41.1 Installed Software...................................................................................................................... 41.2 Instrument Files Directory..........................................................................................................4
2 The AxoStep Viewer Graphical User Interface (GUI).........................................................................52.1 Main Image................................................................................................................................ 52.2 Options Tab............................................................................................................................... 72.3 Registration Tab........................................................................................................................ 8
2.3.1 Manual Registration...............................................................................................................92.3.2 Auto Registration................................................................................................................... 92.3.3 Define a reference angle.......................................................................................................9
2.4 Mask Tab................................................................................................................................. 102.4.1 Threshold Mask...................................................................................................................112.4.2 Selected Area......................................................................................................................11
2.5 Measurement Tab.................................................................................................................... 112.5.1 Single Measurement............................................................................................................122.5.2 Tilt Scan Measurements......................................................................................................132.5.3 Wavelength Scan Measurements........................................................................................142.5.4 Rotation Scan Measurements.............................................................................................152.5.5 XY Scan Measurements......................................................................................................16
2.6 XY Stage Tab.......................................................................................................................... 162.7 Calibration Tab........................................................................................................................17
2.7.1 Automatic Calibration..........................................................................................................182.7.2 Advanced Calibration Functions..........................................................................................202.7.3 Before Version 1.9.0............................................................................................................22
2.8 Polarimeter Coordinate System...............................................................................................232.9 Toolbars................................................................................................................................... 25
2.9.1 Basic Tools..........................................................................................................................252.9.2 measurement information....................................................................................................252.9.3 Cross section plots..............................................................................................................262.9.4 Poincare sphere..................................................................................................................282.9.5 3D plot................................................................................................................................. 282.9.6 Statistics.............................................................................................................................. 302.9.7 reduced parameters............................................................................................................312.9.8 edge detection.....................................................................................................................312.9.9 Optical Gauging Measurement............................................................................................322.9.10 image measurements......................................................................................................322.9.11 user defined Calculation..................................................................................................322.9.12 Launch AxoStep..............................................................................................................332.9.13 Auto Calibrate................................................................................................................. 332.9.14 launch tip tilt controller.....................................................................................................342.9.15 launch X-y controller........................................................................................................352.9.16 Image through Crossed Polarizer....................................................................................372.9.17 Pitch Measurement Utility................................................................................................372.9.18 apply retardance order....................................................................................................372.9.19 Rth calculation.................................................................................................................372.9.20 LCD tools........................................................................................................................382.9.21 Mapping selection...........................................................................................................38
2.10 Menu Bar................................................................................................................................. 392.10.1 File menu........................................................................................................................392.10.2 Edit menu........................................................................................................................402.10.3 view menu.......................................................................................................................412.10.4 Tools menu..................................................................................................................... 422.10.5 hardware menu...............................................................................................................44
Axometrics, Inc.AxoStep Polarimeter, Rev 3.0
1

2.10.6 Help menu....................................................................................................................... 442.11 Special Notes on Testing Polarization Elements.....................................................................44
2.11.1 CAL-VIS-1 Reference Retarder.......................................................................................442.11.2 CAL-VIS-2 Reference Polarizer......................................................................................45
3 LCD Production................................................................................................................................ 463.1 Define a Pixel........................................................................................................................... 463.2 Perform a Test Measurement..................................................................................................483.3 Define your output Regions.....................................................................................................48
3.3.1 Configure the Output Regions.............................................................................................503.4 Configure the Robots...............................................................................................................523.5 x,y Coordinates Setup..............................................................................................................53
3.5.1 Discrete Holes.....................................................................................................................573.6 Tilt, Rotation Angles................................................................................................................. 573.7 Wavelengths............................................................................................................................ 593.8 Perform a Test Measurement..................................................................................................60
4 Appendix.......................................................................................................................................... 634.1 Reduced Parameters...............................................................................................................63
4.1.1 Retardance..........................................................................................................................644.1.2 Diattenuation.......................................................................................................................65
4.2 Calculated Parameters............................................................................................................664.3 A Note about Retardance Order and “Unwrapping”.................................................................68
Axometrics, Inc.AxoStep Polarimeter, Rev 3.0
2

1 INTRODUCTION The AxoStep™ Imaging Mueller Matrix Polarimeter is an optical instrument for capturing and image of all of the polarization properties of a sample. A sequence of intensity images are acquired as retarders rotate within the Polarization State Generator and the Polarization State Analyzer heads. These images are then processed to calculate the 16 two dimensional arrays that comprise the Mueller Matrix Image of the sample which characterizes all of the polarization transformations for that sample. A single or sequence of Mueller Matrix Images can be saved to a file for analysis in other computer programs.
A Mueller Matrix image is generally identical to an XY map of Mueller Matrices obtained using an AxoScan system. There are two superficial features that distinguish a Mueller Matrix Image from a Mueller Matrix XY Map
1. The Mueller Matrix Image is generally contains a much larger grid of points (usually greater than 100x100), and will always be arranged in a rectangular array.
2. The Mueller Matrix image generally measures a much smaller area (less than 2cm) than a typical XY map.
Nevertheless, apart from these superficial features, the data contained in a Mueller Matrix image and the data contained XY map is identical.
1.1 Installed SoftwareThe following software has been installed on the Control Unit computer:
Licensed copy of Microsoft Windows™ operating system
AXOSTEP ENGINE and related configuration files
AXOSTEP VIEWER and related configuration files
Any optional Axometrics’ Software
This manual describes all of the features in the AxoStep Viewer software package which is used to analyze Mueller Matrix Image datasets, and can control the AxoStep Engine via TCP/IP communication for performing basic measurement tasks.
While installing additional software (such as data analysis software, word processors, etc.) on the dedicated Control Unit computer is unlikely to affect the polarimeter, Axometrics discourages installing additional software, especially software that may run background processes causing the instrument program to compete for system resources thereby degrading instrument performance.
In the event of a catastrophic computer problem it may be necessary to reinstall the operating system or reformat the hard drive. Please contact Axometrics for detailed instructions or assistance.
1.2 Instrument Files DirectoryAll AxoStep instrument program files and support files are located at the following directory:
C:\AxoView\Current Version
Do not change directory locations or filenames.
.
Axometrics, Inc.AxoStep Polarimeter, Rev 3.0
3

2 THE AXOSTEP VIEWER GRAPHICAL USER INTERFACE (GUI)
The AxoStep Viewer GUI is the main control program which acquires data, provides data visualization (2D image, 3D image, cross section plot and on the Poincaré sphere), streams the measurements to disk, and creates measurement reports.
The AxoStep Viewer can be used to analyze individual Mueller Matrix Image datasets as well as scans of multiple ones. Each Mueller Matrix Image is a multiple dimensional dataset containing 38 individual data images consisting of 16 images corresponding to the Mueller Matrix elements and 22 images corresponding to Reduced Parameter Images (Such as Retardation, Diattenuation, etc).
The main screen of the AxoStep Viewer GUI is shown in the following figure.
2.1 Main Image
On the front panel of the AxoStep Viewer program is the main image window.
Axometrics, Inc.AxoStep Polarimeter, Rev 3.0
4

Current Image: Allows the user to select between multiple Mueller Matrix Image datasets that are currently available (such as multiple images from a scan measurement).
Parameter to Plot: Allows the user to select between multiple parameters to show, like elements of Mueller Matrix and calculated parameters from Mueller Matrix Image that are currently available.
Current Parameter: Shows the parameter that is currently selected. The user can change how the current parameter to be shown (like adjusting the data range) on the Options Tab (described below). The user can also directly change the value on the color map to adjust the data range. The user needs to adjust the data range in order to see some feature on some samples. Otherwise the feature cannot be seen on the intense background.
Cursor Location: Shows the location of the cursor in units of pixels or actual units. User can select which unit is shown on the Program Options from the Tools menu. For showing the actual units (µm or mm), user needs to set what objective is using on the Calibration Tab of AxoStep Engine.
Parameter Value: Shows the parameter value at the current cursor location.
Convenient Buttons: Allows the user to access the frequently used buttons. The details about each button will be described in the following sections.
Parameter Category: Allows the user to choose which kind of parameters to plot, reduced parameter (like total retardance) or calculated parameter (like Rth).
Picture Controls: The following picture controls are available.
Cursor Control: Generates the cross-hair cursor shown in the image above.
Zoom in control: Allows the user to zoom into a selected area.
Axometrics, Inc.AxoStep Polarimeter, Rev 3.0
5

Drag control: Allows the user to drag the magnified view.
Line control: Draws a line on the image.
Box control: Selects a rectangular region in the image.
Circle control: Selects a circular region in the image.
Unzoom control: Returns the view to the full image.
2.2 Options Tab
Sometimes the user needs to adjust the data range in order to see some features on some samples. Otherwise the features cannot be seen on some background. Options tab shown below provides the controls to adjust the data range.
Smart Autoscale: Set the data range on the image to be following scales.
Range (Max-Min): Set the data range on the image to be possible maximum and minimum value.
Axometrics, Inc.AxoStep Polarimeter, Rev 3.0
6

Standard Deviation: Set the image scale to be ±N standard deviations from the mean value. A value of 0 means to autoscale over the full range.
Percentage: Set the image scale such that N percent of the pixels lie within the color range.
Sort Images: Sort the scanned or multiple images in the different order, like Tilt Angle, Rotation Angle, Wavelength, XY scan, etc.
2.3 Registration Tab
In order to calculate Rth or LC cell parameters from tip-tilt measurements, sometimes user needs to perform the registration (alignment) for multiple images from a scan measurement or multiple single measurements. The controls in the Registration tab are shown below.
2.3.1 MANUAL REGISTRATION
Axometrics, Inc.AxoStep Polarimeter, Rev 3.0
Manual RegistrationBy Distance
Auto Registration
Define a Reference Angle
Manual RegistrationBy Coordinates
7

Delta X: Set the number of pixels to translate in the X-direction.
Delta Y: Set the number of pixels to translate in the Y-direction.
Translate: Translate the current image by Delta X and Delta Y.
: Translate the current image step by step.
Define Point: Define a reference point using the current cursor location.
Select the reference point on or near a clear reference feature in the image.
Translate to point: Translate the current point to the location of the reference point.
Change images and move the cursor to the same reference feature in the new image. When you press the Translate to Point button, the new image will align with the previous image. Repeat this procedure for each image in the scan dataset.
2.3.2 AUTO REGISTRATION
Auto registration uses a Fourier transform correlation algorithm (http://en.wikipedia.org/wiki/Phase_correlation) to automatically register all the images currently available.
Auto Registration Type: The user can select between 1 dimensional correlation along X or Y (used on images that are only variable in 1-dimension, such as striped retarders) and generalized 2-dimensional correlation (used on images that are variable in 2-dimension, such as LCD pixels).
Registration Parameter: The user needs to select the parameter that will be used to perform the image correlation. It is recommended to select a parameter that has high contrast that does not change appreciably from image to image (such as transmittance on LCD cells, or retardance orientation on patterned retarders)
Reference Image for Registration: This is the image that the others will be aligned to. This image will not be translated.
Auto Register: Perform the auto registration process.
2.3.3 DEFINE A REFERENCE ANGLE
The user can define a reference angle so that the orientations, such as Retardance and Diattenuation Orientation, can be clearly shown with respect to a clear reference feature in the image. After the reference angle is defined, the user can select the User Defined Orientation (Retardance, Diattenuation and Polarizance) from Parameter to Plot list to be shown in current image.
Define Angle: Define the reference angle by drawing a straight line using Line Control.
Coordinates: Choose a coordinate (AxoStep or Image) in which the angle is given.
Axometrics, Inc.AxoStep Polarimeter, Rev 3.0
8

2.4 Mask Tab
Use the Mask tab to define a masked area where data points within that area are ignored so that the user can focus on the important part of data images. There are two mask types available.
1. Threshold Mask: The masked pixels are defined by the measurement values of the image. Masked data points can either be inside a parameter range, or outside a parameter range.
2. Selected Area Mask: The masked pixels are either inside, or outside an area selected by the user using either the box tool or circle tool.
Apply Mask: Applies the currently defined mask to all of the data sets in memory.
Create New Mask: Creates a mask based on the parameters set by the user (Any mask currently in memory will be erased). The Apply Mask box is automatically checked when the user presses the Create New Mask Button.
Combine with current mask: When the user presses this button, the mask created by the current parameters is multiplicatively combined with the mask currently in memory.
Clear Mask: Clears the current mask from memory.
Axometrics, Inc.AxoStep Polarimeter, Rev 3.0
9

2.4.1 THRESHOLD MASK.
Max and Min define the range for the threshold mask.
In Range will keep all pixels that are within the range defined by Max and Min. Pixels outside of this range will be masked.
Out of Range keep all pixels that are outside the range defined by Max and Min. Pixels within this range will be masked.
Mask Parameter is the parameter in which the range defined by Max and Min is applied to. The threshold range will be taken from the dataset currently displayed (shown in the Current Image selector on the main front panel)
2.4.2 SELECTED AREA
The Selected Area tab will create a mask defined by an area selected by the user using either the box tool or circle tool. The masked area can either be inside the selected area or outside the selected area.
2.5 Measurement Tab
The controls for making basic measurements are available on the Measurement Tab. The controls in the measurement tab are shown below.
Axometrics, Inc.AxoStep Polarimeter, Rev 3.0
10

Note, the AxoStep Engine must be running to be able to perform measurements. Usually calibration is required before measuring samples. See Calibration section for the details.
2.5.1 SINGLE MEASUREMENT
Single measurements can be performed by setting the desired Wavelength, Number to Average, Rotation Angle, Tilt Angle and Position, and pressing the Measure Once button.
Note, the Tip-Tilt stage is required for setting Rotating and Tilt Angle. The XY Scan stage is required for setting the XY Position.
Once the Measure Once button is pressed, the AxoStep engine will perform a single measurement, and the Tilt and Rotation Corrections are performed and the Reduced Parameters are calculated. A file dialog box will appear prompting the user to save the data as a *.cmmi file. Then, a file dialog box will
Axometrics, Inc.AxoStep Polarimeter, Rev 3.0
Single Measurements
Scan Measurements
11

appear prompting the user to choose: add the measured data to the Current Image pull-down menu, or replace the images in the Current Image pull-down menu with measured data. The data will be the Current Image on the main front panel.
Wavelength: Allows the user to set the wavelength at which the measurement is performed.
Number to Average: Allows the user to select the number of images that will be acquired at every step of retarder rotation to calculate the Mueller Matrix. The larger number provides lower noise, higher measurement repeatability and longer measurement.
Note, the Number to Average is different from the Measurement Steps in AxoStep Engine. The Measurement Step is the times of retarder rotation to perform a complete measurement. The default value of Measurement Steps is 40, which is the best value for most of measurements.
Rotation Angle: Allows the user to set the rotation angle at which the measurement is performed.
Tilt Angle: Allows the user to set the tilt angle at which the measurement is performed.
X position: Allows the user to set the x position at which the measurement is performed.
Y position: Allows the user to set the y position at which the measurement is performed.
Use Current Position: The measurement is performed at current position.
2.5.2 TILT SCAN MEASUREMENTS
Note, the Tip-Tilt stage is required for making Tilt Scan Measurements.
Tilt Scan measurements are performed by selecting Tilt Scan from the Scan Type pull-down menu on the Measurement Tab.
Enter the scan parameters: (Wavelength, Rotation angle, Maximum Tilt Angle, Tilt Increment, and Number to Average)
Axometrics, Inc.AxoStep Polarimeter, Rev 3.0
12

Press the Scan Button to perform the measurement. The following progress dialog box will appear.
The Total Progress indicator shows which point in the scan is currently being acquired.
The progress bar for Data Acquisition displays the progress of the current Mueller Matrix Image measurement being performed.
The progress bar for Image Processing displays the progress of the image processing (data reduction, tilt/rotation correction) on the most recently acquired Mueller matrix image data set.
Once the measurement is complete a file dialog box will appear prompting the user to save the scan data as a *.astp file. Then, a file dialog box will appear prompting the user to choose: add the scan measured data to the Current Image pull-down menu, or replace the images in the Current Image pull-down menu with the scan measured data. The scan data will be loaded into the viewer, and each scan image will become available in the Current Image pull-down menu on the main front panel.
2.5.3 WAVELENGTH SCAN MEASUREMENTS
Wavelength Scan measurements are performed by selecting Wavelength Scan from the Scan Type pull-down menu on the Measurement Tab.
Axometrics, Inc.AxoStep Polarimeter, Rev 3.0
13

Enter the scan parameters: (Minimum Wavelength, Maximum Wavelength, Increment, Rotation angle, Tilt Angle, and Number to Average)
Press the Scan Button to perform the measurement. A dialog box similar to the one displayed for a Tilt Scan measurement will appear.
Once the measurement is complete a file dialog box will appear prompting the user to save the scan data as a *.astp file. Then, a file dialog box will appear prompting the user to choose: add the scan measured data to the Current Image pull-down menu, or replace the images in the Current Image pull-down menu with the scan measured data. The scan data will be loaded into the viewer, and each scan image will become available in the Current Image pull-down menu on the main front panel.
2.5.4 ROTATION SCAN MEASUREMENTS
Note, the Tip-Tilt stage is required for making Rotation Scan Measurements.
Rotation Scan measurements are performed by selecting Rotation Scan from the Scan Type pull-down menu on the Measurement Tab.
Enter the scan parameters: (Wavelength, Minimum Rotation Angle, Maximum Rotation Angle, Rotation Increment, Tilt Angle, and Number to Average)
Press the Scan Button to perform the measurement. A dialog box similar to the one displayed for a Tilt Scan measurement will appear.
Once the measurement is complete a file dialog box will appear prompting the user to save the scan data as a *.astp file. Then, a file dialog box will appear prompting the user to choose: add the scan measured data to the Current Image pull-down menu, or replace the images in the Current Image pull-down menu with the scan measured data. The scan data will be loaded into the viewer, and each scan image will become available in the Current Image pull-down menu on the main front panel.
Axometrics, Inc.AxoStep Polarimeter, Rev 3.0
14

2.5.5 XY SCAN MEASUREMENTS
Note, the XY scan stage is required for making XY Scan Measurements.
XY Scan measurements are performed by selecting XY Scan from the Scan Type pull-down menu on the Measurement Tab.
Enter the scan parameters: (XY Coordinates, Wavelength, Rotation Angle, Tilt Angle, and Number to Average). XY Coordinates List can be input by Load From File and Enter By Hand, through Wizard or using Discrete Holes.
Press the Scan Button to perform the measurement. A dialog box similar to the one displayed for a Tilt Scan measurement will appear.
Once the measurement is complete a file dialog box will appear prompting the user to save the scan data as a *.astp file. Then, a file dialog box will appear prompting the user to choose: add the scan measured data to the Current Image pull-down menu, or replace the images in the Current Image pull-down menu with the scan measured data. The scan data will be loaded into the viewer, and each scan image will become available in the Current Image pull-down menu on the main front panel.
2.6 XY Stage Tab
(Requires XY stage to be installed) The XY Stage Tab, allows the user to move the XY Stage to a given position. The controls on the XY Stage Tab function just like the controls on the XY Control Utility (See Section 2.9.15
Axometrics, Inc.AxoStep Polarimeter, Rev 3.0
15

2.7 Calibration Tab
The most critical aspect of precise optical metrology is the issue of calibration. Proper calibration insures that the measurements performed by your AxoStep Mueller matrix polarimeter accurately represent the physical properties of the optical samples being measured. Each instrument is calibrated by Axometrics prior to shipment, to insure proper operation.
Although their effects are small, polarization properties of the Microscope Objectives do affect the measurements performed by AxoStep. Therefore, the system must be recalibrated each whenever the microscope objective is changed.
Additionally, re-calibration should be performed when the PSG and PSA heads have been moved or when the bulb of the light source has changed or new PSG or PSA heads have been installed.
1. Calibration (Low Level Hardware Calibration): A procedure for completely recalibrating the optical components in the AxoStep measurement heads. Each time a Calibration is performed, a Point-By-Point Baseline is also performed. It is recommended that the system be recalibrated when any of the following have occured
a. The Microscope Objective has been changedb. The Shutter Speed or Gain of the AxoStep camera has been changed.c. The PSG or PSA head has been removed or changed.
Axometrics, Inc.AxoStep Polarimeter, Rev 3.0
16

2. Spectral Orientation Calibration: This is a procedure used to define the Zero Orientation of the AxoStep system, as well as correct any systematic orientation variations that occur with respect to wavelength or X and Y Position. In general a Calculated Mueller Matrix Image (*.cmmi) file is measured of the Cal-Vis-1 for each calibrated wavelength and is stored in the software directory. The Orientation Measurement of the Cal-Vis-1 is used to correct subsequent sample measurements.
3. Baseline: (Point-by-Point Baseline) This is a procedure to correct minor polarization variations across the image. It behaves like the Baseline function used in AxoScan, except that it is applied Point-by-Point to the Mueller Matrix image. . In general a Basic Mueller Matrix Image (*.bmmi) file is measured of an Empty Sample compartment (In-Air) for each calibrated wavelength and is stored in the software directory. The stored baseline is used to correct subsequent sample measurements.
The Calibration Tab (basic mode) has just three controls.
Baseline: Performs the same function as the Baseline Button described in Section 2.7.2Auto Calibrate: The Auto Calibrate button is described in Section 2.7.1
Show Advanced Calibration Function: Displays the Advanced Calibration Function described in Section 2.7.2
2.7.1 AUTOMATIC CALIBRATION
To perform a user-configured Calibration press the Auto Calibrate button on the toolbar,
Axometrics, Inc.AxoStep Polarimeter, Rev 3.0
17

or the AutoCalibrate Button on the Calibration Tab
To Configure the operation of the Auto Calibrate button, Open the Program Options by selecting Tools>Program Options from the pulldown menus on the AxoStep Viewer main window
The Calibration procedure will be performed in accordance with the Options that are selected in this configuration window.
Clear Full Calibration: Performs the same function as the Clear Calibration Button described in Section 2.7.2
Perform Dark Current Measurement: Performs the same function as the Dark Image Button described in Section 2.7.2
Automatically Move XY when Calibrating: (Only on fixtures with an XY table) When this box is checked, the stage will automatically move to the proper XY position for calibration. That is, the stage will automatically move to the Cal-In-Air position when performing basic calibration, and move to the Cal-Vis-1 Position when performing orientation calibrations.
Perform Calibration only at {wavelength}: Performs the same function as the Single Calibrate Button described in Section 2.7.2.
Axometrics, Inc.AxoStep Polarimeter, Rev 3.0
18

Perform Full Spectrum Calibration from {min wavelength} to {max wavelength}: Performs the same function as the Spectral Calibration Button described in Section 2.7.2.
Perform Orientation Calibration Only at {wavelength}: Performs an Orientation calibration at the wavelength currently set in the Single Measurement Setting2 (Section 2.5.1)
Perform Spectrum Orientation Calibration from {min wavelength} to {max wavelength}: Performs the same function as the Spectral Orientation Button described in Section 2.7.2.
Each of the Options is basically equivalent to Pressing a Button on the Calibration Tab in the main AxoStep Viewer window (Advanced Functions). For Example, if you make the following selections.
Then Pressing the Auto Calibrate button is equivalent to pressing the following sequence buttons on the Calibration Tab:
2.7.2 ADVANCED CALIBRATION FUNCTIONS
Axometrics, Inc.AxoStep Polarimeter, Rev 3.0
Pressed 1st
Pressed 2nd
Pressed 3rd
Pressed 4th
19

Baseline: Allows the user to perform a baseline measurement at the current wavelength. The checkbox allows the user to perform a baseline at measurement tilt and rotation angles. If the checkbox is unchecked, the baseline measurement is performed at the normal incidence.
Clear Calibration: This will completely clear the current calibration in the AxoStep Memory. After pressing this button, you will need to re-calibrate you system before any additional measurements can be performed.
Dark Image: Allows the user to measure a new dark image with the light source shutter closed. Usually this is the first step of calibrating AxoStep.
Single Calibrate: Allows the user to perform a full calibration at current wavelength set on the Measurement Tab. Press Single Calibration to begin the calibration. Once the calibration is complete, a dialog showing the Root Mean Square (RMS) of the calibration will appear allowing the user to accept or reject the calibration. RMS less than 3% is acceptable.
Spectral Calibration: Allows the user to perform a full calibration from 450 nm to 650 nm (default setting). The user can change the wavelength range and increment for calibration from Program Options on the Tools menu. Press Spectral Calibration to begin the calibration. Once the calibration is complete, a dialog showing the RMS of the spectral calibration will appear allowing the user to accept or reject the calibration. RMS less than 3% is acceptable at each wavelength.Axometrics, Inc.AxoStep Polarimeter, Rev 3.0
20

Spectral Orientation: (Requires AxoStep Engine Version 1.9.0): Spectral orientation calibration, replaces the Ret-Zero buttons, and Ret-Zero Image buttons used in previous versions. When the Spectral Orientation button is pressed, the user will be prompted to place the Cal-Vis-1 in the sample holder (or the X-Y stage will move to the Cal-Vis-1 position). Next, and orientation calibration image is acquired at each of the wavelengths that are configured for the Spectral Calibration button.
Light Source Calibration: Allows the user to calibrate wavelength offset for spectral light source. After the Light Source Calibration button is pressed, the Tunable Visible Source Calibration Utility will appear. The Calibration Utility provides a NIST-traceable technique for accurately calibrating the optical wavelength of the source to within +/-0.3 nm at the Holmium Oxide absorption line at 537.4 nm. See AxoStep Tunable Visible Source Calibration Manual for the details.
2.7.3 BEFORE VERSION 1.9.0
The following section describes the buttons on the calibration tab for versions of the AxoStep Viewer earlier than Version 1.9.0.
Dark Image: This is the same function as described in Section 2.7.2
Single Calibrate: This is the same function as described in Section 2.7.2
Spectral Calibration: This is the same function as described in Section 2.7.2
Axometrics, Inc.AxoStep Polarimeter, Rev 3.0
21

Baseline: This is the same function as described in Section 2.7.2
Ret Zero: Allows the user to set Retardance Orientation to 0.00º. To change the AxoStep reference axis, a retarder (CAL-VIS-1) is placed in the sample compartment, and the AxoStep will find the corresponding retardance axis. This axis becomes the new zero angle from which all diattenuation orientations, retardance orientations, and the Poincaré sphere are defined. The Axometrics CAL-VIS-1 Retardance Orientation reference standard is a precision, true zero order quartz retardation plate laminated to a BK7 glass substrate. The CAL-VIS-1 is shipped with a calibration report that gives the angle between the mechanical edge of the mounting cell and the fast axis of the retarder.
Ret Zero Image: Allows the user to perform Ret Zero orientation calibration pixel by pixel.
Diatt Zero: Allows the user to set Diattenuation Orientation to 0.00º. To change the AxoStep reference axis, a polarizer (CAL-VIS-2) is placed in the sample compartment, and the AxoStep will find the corresponding diattenuation axis. This axis becomes the new zero angle from which all diattenuation orientations, retardance orientations, and the Poincaré sphere are defined. The Axometrics CAL-VIS-2 Diattenuation Orientation reference standard is a precision wire-grid polarizer laminated on an isotropic fused silica substrate. The CAL-VIS-2 is shipped with a calibration report that gives the angle between the mechanical edge of the mounting cell and the transmission axis of the polarizer
Light Source Calibration: This is the same function as described in Section 2.7.2
2.8 Polarimeter Coordinate System
It is imperative that the user understands the coordinate system used by all the Axometrics polarimeters. This coordinate system is standard throughout most of the polarization measurement community.
Coordinate system of the instrument with a tip-tilt stage is defined as follows:
The reference edge on the stage defines X axis. The direction X axis is defined as zero degree of rotation angle.
Axometrics, Inc.AxoStep Polarimeter, Rev 3.0
22

The line from PSG head to PSA head defines the Z direction, as shown below.
Axometrics, Inc.AxoStep Polarimeter, Rev 3.0
23

2.9 Toolbars
The tools in the Toolbars are shown below.
2.9.1 BASIC TOOLS
1. New project
Remove all Mueller Matrix images and Date from memory and create a new project.
2. Open file
Open *.bmmi, *.cmmi or *.astp files to view and analyze.
3. Save single measurement
Save current image as *.cmmi file.
4. Save scan measurement
Save current images as *.astp file.
5. Import calculated data
Import calculated data to the viewer.
6. Export calculated data
Export calculated data to *.cvs file that can be open by spreadsheet programs.
7. Show vectors
Show the vectors that indicate the orientations of retardance, diattenuation, polarizance, etc.
2.9.2 MEASUREMENT INFORMATION
Show the measurement information like following figure shown.
Axometrics, Inc.AxoStep Polarimeter, Rev 3.0
24

2.9.3 CROSS SECTION PLOTS
Open a new window that shows a cross section of the data centered on the current cursor location. The user can select between an X cross section (horizontal), a Y Cross Section (vertical), a Z Cross section (through multiple images) or a line cross section. The Cross Section window is shown in the following figure.
Axometrics, Inc.AxoStep Polarimeter, Rev 3.0
25

allows the user to select between an X cross section (horizontal), a Y Cross Section (vertical), a Z Cross Section (through multiple images) and a Line Cross Section.
Calculate Average: Calculate the average for X cross section (horizontal) and a Y Cross Section (vertical). For example, press Calculate Average when X cross section plot is chosen, the average value in the Y direction at every X position will be shown. The average of a selected area through multiple images can also be calculated by choosing Z Cross Section.
Export: Export cross section data in a text file.
Close: close Cross Sections window.
Axometrics, Inc.AxoStep Polarimeter, Rev 3.0
26

2.9.4 POINCARE SPHERE
Show the selected data from Current Image or Scan Through Images on Poincare Sphere, as following figure shown. The user can use Picture Controls to select the area.
Sphere Plot Type: allows the user to select between Current Image and Scan Through Images (through multiple images).
Update: Update Poincare Sphere with new selected data.
Close: close Poincare Sphere window.
2.9.5 3D PLOT
Show current image in a 3D plot as following figure shown
Axometrics, Inc.AxoStep Polarimeter, Rev 3.0
27
Plot Style: allows the user to select the plot style, Surface, Surface Line, Contour Line or Surface Contour.
: allows the user to select the plot in a XY view or 3D view.
Contour List: List the contour line values.
Axometrics, Inc.AxoStep Polarimeter, Rev 3.0
28

2.9.6 STATISTICS
Show the statistic information of current image or selected area in a new window as following figure shown.
Update: Update Statistic Window with a new current image or new selected area.
Basic Parameters Tab: Show the basic statistic values of current image or selected area.
Options Tab :
Show Fit: allows the user to select if the fitting curve is shown or not.
Order: The order of the fitting polynomial.
Number of Bins: The number of pixel binning.
Axometrics, Inc.AxoStep Polarimeter, Rev 3.0
29

Remove Outliers: allow the user to remove the bad data. For example, the bad data results from dusts on the sample.
Close: close Statistics window.
2.9.7 REDUCED PARAMETERS
Show the reduced parameters at the current cursor position in a new window as the following figure shown. See APPENDIX (REDUCED PARAMETERS) for detailed information about these parameters.
2.9.8 EDGE DETECTION
Find an edge in a selected area using Edge Detection Popup as following figure shown. Usually the found edge can be used as a reference position for user defined parameters.
Axometrics, Inc.AxoStep Polarimeter, Rev 3.0
30

2.9.9 OPTICAL GAUGING MEASUREMENT
(Requires Optical gauging system to be installed) Press this button to perform a measurement with the Optical Gauging System. The result of the Optical Gauging measurement is shown on the bottom of the Calibration Tab
The Alignment angle that is measured will be subtracted from the all orientation measurements.
2.9.10 IMAGE MEASUREMENTS
Show the information about current cursor, straight line or selected area in the Measurements Popup as the following figure shown.
2.9.11 USER DEFINED CALCULATION
Allow the user to define a function in a new window as the following figure shown.
Axometrics, Inc.AxoStep Polarimeter, Rev 3.0
31

The new data from User Defined Calculation can be shown in Current Image area by selecting User Defined Calculation on the Parameter To Plot list. For example, the user can define a new retardance orientation with respect to the features in images (default orientation is with respect to the AxoStep coordinate) using User Defined Calculation.
To create a User Defined Calculation simply select “New Calculation” from the dropdown menu on the “Calculations” control then fill in the Name, calculation and variable definitions. This can be continued, allowing the user to create as many calculations as desired. The calculation that will be used by the viewer is the one selected, which has its name and definitions displayed. p
2.9.12 LAUNCH AXOSTEP
Pressing this button will launch the AxoStep Engine. If the AxoStep Engine is already running, pressing this button will establish a TCPIP connection with the AxoStep Engine, and update it’s status in the viewer.
2.9.13 AUTO CALIBRATE
Pressing this button will perform the User Defined Auto-Calibration routine. See Section 2.7.1 for detailed Information.
Axometrics, Inc.AxoStep Polarimeter, Rev 3.0
32

2.9.14 LAUNCH TIP TILT CONTROLLER
Launch the Tip Tile Controller window as the following figure shown.
Note, Tip Tilt Controller program must be linked to AxoStep Viewer and the AxoStep Engine must be running to be able to use Tip Tile Controller.
Move: Move to the orientation of the tilt and rotation angle set by the user.
Save as Load Position: Save current position as load position.
Exit: Exit Tip Tilt Controller window.
Tilt Increment (˚): Set the tilt movement step.
Tilt CCW: Make a tilt movement counterclockwise by one step.
Tilt CW: Make a tilt movement clockwise by one step.
Rotate Increment (˚): Set the rotate movement step.
Rotate CCW: Make a rotate movement counterclockwise by one step.
Axometrics, Inc.AxoStep Polarimeter, Rev 3.0
33

Rotate CW: Make a rotate movement clockwise by one step.
2.9.15 LAUNCH X-Y CONTROLLER
Launch the X-Y Controller window as the following figure shown.
Note, X-Y Controller program must be linked to AxoStep Viewer and the AxoStep Engine must be running to be able to use X-Y Controller.
Axometrics, Inc.AxoStep Polarimeter, Rev 3.0
34

Move to Coordinates: Move to the position set by the user.
Jog: Move table step by step.
Move to Position: Move table to special positions, Scan Center, Load Position, Calibration in Air Position, CAL-VIS-1 Position, CAL-VIS-1 Position and Hole Plate Position.
Current Settings: Show current settings for these special positions.
Save Settings: Save current settings for these special positions.
Axometrics, Inc.AxoStep Polarimeter, Rev 3.0
35

Switch to Compact Mode: Change the X-Y Controller window to compact mode.
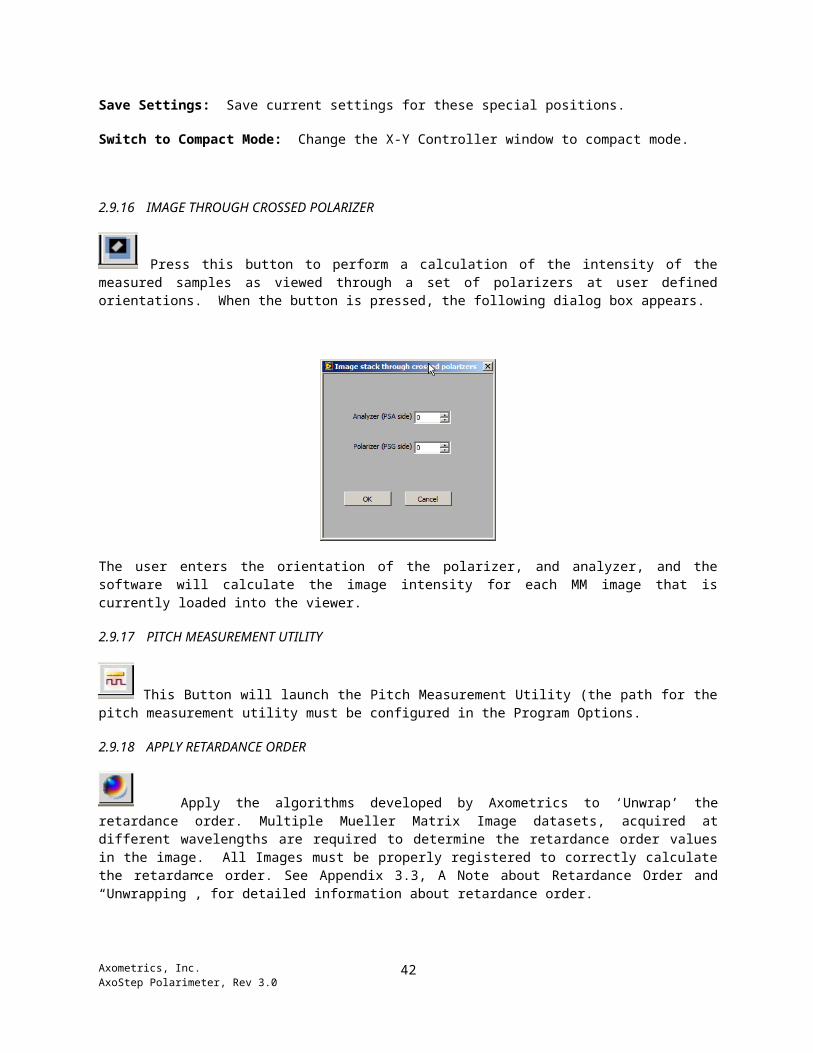
2.9.16 IMAGE THROUGH CROSSED POLARIZER
Press this button to perform a calculation of the intensity of the measured samples as viewed through a set of polarizers at user defined orientations. When the button is pressed, the following dialog box appears.
The user enters the orientation of the polarizer, and analyzer, and the software will calculate the image intensity for each MM image that is currently loaded into the viewer.
2.9.17 PITCH MEASUREMENT UTILITY
This Button will launch the Pitch Measurement Utility (the path for the pitch measurement utility must be configured in the Program Options.
2.9.18 APPLY RETARDANCE ORDER
Apply the algorithms developed by Axometrics to ‘Unwrap’ the retardance order. Multiple Mueller Matrix Image datasets, acquired at different wavelengths are required to determine the retardance order values in the image. All Images must be properly registered to correctly calculate the retardance order. See Appendix 3.3, A Note about Retardance Order and “Unwrapping”, for detailed information about retardance order.
2.9.19 RTH CALCULATION
Perform additional parameter calculations using multiple Mueller Matrix Image data sets that are stored in memory. The user can set the parameters for calculation in Rth Calculation Setup User Interface window as the following figure shown.
Axometrics, Inc.AxoStep Polarimeter, Rev 3.0
36

See Appendix 3.2, Calculated Parameters, for detailed information about Rth calculation.
2.9.20 LCD TOOLS
Open LCDView to perform LCD parameter calculation.
Note, in order to be able to use LCD Tools, the LCDView software must be installed and linked to AxoStep Viewer. See LCDView software manual for the details.
2.9.21 MAPPING SELECTION
Because calculations performed on Mueller matrix image scans can be extremely time consuming, there are several options that can be used to perform the calculation on only a subset of the data.
X Cross Section: performs the calculation only on an X cross section defined by the cursor location
Y Cross Section: performs the calculation only on an Y cross section defined by the cursor location
Selected Area (Map): performs a point by point calculation of the current area selected using the box tool
Axometrics, Inc.AxoStep Polarimeter, Rev 3.0
37

Selected Area (Avg): performs a single point calculation based on the average of the pixels within the area selected by the box tool.
Full Image Map: Performs a complete calculation on the entire image dataset
2.10 Menu Bar
2.10.1 FILE MENU
The AxoStep Viewer File Menu has the following functions:
NEW Clear all measurement information currently in memory
OPEN Open a Mueller Matrix image dataset (*.cmmi, *.bmmi) or a scan dataset (*.astp)
SAVE AS > SCAN FILE (*.astp) SAVE The current set of images as a new scan file (*..astp). All processing that was done on the scan (registration, etc) will be saved with this file.
SAVE AS> PROCESSED IMAGE (*.CMMI) SAVE The current Mueller Matrix Images as a new *.cmmi. All image processing (eg, tilt and rotation correction) will be saved with this file.
Axometrics, Inc.AxoStep Polarimeter, Rev 3.0
38

IMPORT CALCULATED DATA Imports the calculated data on a *.csv spreadsheet file.
EXPORT CALCULATED DATA Exports the calculated data to a *.csv spreadsheet file.
EXPORT GRAPH Exports the data in the graph on the Data Tab to a *.csv spreadsheet file
EXIT Shut down the AxoStep Viewer Program.
2.10.2 EDIT MENU
The AxoStep Viewer Edit Menu has the following functions:
REMOVE IMAGE Remove current image from memory.
PROCESSING>TILT CORRECTION Open a new window as the following figure shown. The user can set a tilt angle to correct and press OK button to perform a tilt mapping at any desired angle.
PROCESSING>ROTATION CORRECTION Open a new window as the following figure shown. The user can set a rotation angle to correct and press OK button to perform a rotation mapping at any desired angle.
Axometrics, Inc.AxoStep Polarimeter, Rev 3.0
39
Tilt and Rotation correction are used to reorient and map the pixels in the image to allow registration with images measured at different tilt and rotation settings. This only changes the location of the pixels in the image it does not change the orientation values of the data in the individual pixels.
Normally tilt and rotation corrections have already been performed on *.cmmi files, however they will not have been performed on a *.bmmi file.
2.10.3 VIEW MENU
The AxoStep Viewer View Menu has the following functions:
REFRESH Refresh current image.
SHOW ORIENTATIONS Functions the same as the Show Vectors Button on the Toolbar.
INFO Functions the same as the Measurement Information Button on the Toolbar.
CROSS SECTIONS Functions the same as the Cross Section Plots Button on the Toolbar.
POINCARE SPHERE Functions the same as the Poincare sphere Button on the Toolbar.
STATISTICS Functions the same as the Statistics Button on the Toolbar.
3D PLOT Functions the same as the 3D Plot Button on the Toolbar.
Axometrics, Inc.AxoStep Polarimeter, Rev 3.0
40

REDUCED PARAMETERS Functions the same as the Reduced Parameters Button on the Toolbar.
2.10.4 TOOLS MENU
The AxoStep Viewer Tools Menu has the following functions:
RECALCULATE>CURRENT IMAGE Recalculate Calculated Parameter for current image.
RECALCULATE>ALL IMAGES Recalculate Calculated Parameter for all images in memory.
APPLY RETARDANCE ORDER Functions the same as the Apply Retardance Order Button on the Toolbar.
EDGE DETECTION Functions the same as the Edge Detection Button on the Toolbar.
GEOMETRIC MEASUREMENT Functions the same as the Image Measurement Button on the Toolbar.
USER DEFINED OUTPUT Functions the same as the User Defined Function Button on the Toolbar.
RTH CALCULATION Functions the same as the Rth Calculation Button on the Toolbar.
LCDVIEW CALCULATION Functions the same as the LCDView Button on the Toolbar.
PROGRAM OPTIONS Open a new window that provides the user options to customize the AxoStep Viewer, as the following figure shown.
Axometrics, Inc.AxoStep Polarimeter, Rev 3.0
41
Display Options have the options as the above figure shown.
Color Table: allows the user to change the color table for images.
Invert Y axix: Invert the image in the Y direction.
Display with correct aspect ratio: Displays the images with correct aspect ratio.
Drawing color: Set the drawing color for Cursor, Box and Circle Tools.
Drawing width: Set the drawing line width for Cursor, Box and Circle Tools.
Show Axostep coordinate: Shows the X and Y axes on images with selected colors.
Show Orientations: Show the vectors of orientations on images with selected density (Number of Lines), color and line width.
Toolbar Options allow the user to show or hide buttons on the Toolbar, and allow the user to choose how the buttons to show (small or large icons).
Poincare Sphere Options allow the user to customize Poincare Sphere.
Cross Section Options allow the user to customize Cross Section Plots.
3D Plots Options allow the user to customize 3D Plots.
Axometrics, Inc.AxoStep Polarimeter, Rev 3.0
42

Analysis Options allow the user to customize image display, user interface and Edge Detection.
Statistics Options allow the user to change some parameters for Statistics.
Retardance Order Options allow the user to change some parameters for Retardance Order calculation.
LCD Analysis Options allow the user to link LCDView program to AxoStep Viewer.
Calibration Options allow the user to set some parameters for Calibration.
AxoStep Engine Options allow the user to set IP address and Port for controlling AxoStep through AxoStep Viewer. Here, the user also can link XY Controller and Tip Tilt Controller programs to AxoStep Viewer.
2.10.5 HARDWARE MENU
LAUNCH TIP TILT CONTROLLER Functions the same as the Launch Tip Tilt Controller Button on the Toolbar.
LAUNCH XY CONTROLLER Functions the same as the Launch XY Controller Button on the Toolbar.
2.10.6 HELP MENU
ABOUT… Displays the version number of the AxoStep Viewer software you are running.
2.11 Special Notes on Testing Polarization Elements
2.11.1 CAL-VIS-1 REFERENCE RETARDER
Each AxoStep ships with a reference retarder labeled CAL-VIS-1. The CAL-VIS-1 is intended to be used to verify the long term calibration of the polarimeter. The axis of retardance to the reference edge is specified at 0.1º but is typically oriented to 0.025º. If you calibrate orientation using the CAL-VIS-1 the accuracy of all retardation orientation measurements (measurements of retardation films etc.) will be limited only by the repeatability of the AxoStep system. However the accuracy of diattenuation orientation measurements can have a higher absolute accuracy error.
Axometrics, Inc.AxoStep Polarimeter, Rev 3.0
43

2.11.2 CAL-VIS-2 REFERENCE POLARIZER
A diattenuation reference labeled CAL-VIS-2 may be shipped with AxoStep. The polarizer has been precisely aligned so that its transmission axis is aligned to the mechanical edge of the mounting cell to within ±0.05°. If you calibrate orientation using the CAL-VIS-2 the accuracy of all diattenuation orientation measurements (measurements of polarizer films) will be limited only by the repeatability of the AxoStep system. However the accuracy of retardance orientation measurements can have a higher absolute accuracy error.
It is recommended that for most measurements, that the CAL-VIS-1 be used as an orientation reference standard. If however high accuracy (<0.1°) measurements of polarizer axes are required, then the CAL-VIS-2 orientation reference standard should be used.
Axometrics, Inc.AxoStep Polarimeter, Rev 3.0
44

3 LCD PRODUCTION
This is how you configure and LCD Production Recipe
3.1 Define a Pixel
Press the Define Pixel Button on the Output Regions Tab.
Axometrics, Inc.AxoStep Polarimeter, Rev 3.0
45

Press the Live Image Button.
Once you have a satisfactory image of the Pixel to analyze, unlatch the Live image button and drag a box around the Pixel you wish to define.
Press Define Pixel, and the selected region will be duplicated in the Pixel Image Indicator
Press Save Pixel button (Pixel definition must be saved)
Axometrics, Inc.AxoStep Polarimeter, Rev 3.0
46

If necessary, press the Test Button. If everything is configured properly, an indicator mark will be centered on the test pixel.
Press OK.
3.2 Perform a Test Measurement
Perform a test measurement in accordance with the instructions given in Section 2.5.
Once the measurement is complete, Register the images in accordance with the instructions given in Section 2.3
3.3 Define your output Regions
After a test measurement has been completed Select Parameter to Plot = Transmittance and select the Current Image to have Polar=0 and Azimuth = 0.
1. Click on the Output Regions Tab,
Axometrics, Inc.AxoStep Polarimeter, Rev 3.0
47

2. If it is not checked, check the box Show Pixel Location.
3. Press the Find Pixel Button.
4. A target should appear in the center of the pixel on-screen.
Axometrics, Inc.AxoStep Polarimeter, Rev 3.0
48

5. Drag out a region of the Pixel to be analyzed. Note: If desired, you can select the entire pixel.
6. On the Output Regions Tab, click “Add Region”
7. Enter a name for the region.
8. Repeat steps 5-7 until all desired regions have been defined.
It is recommended that the user Save the Region Definitions by clicking the “Export Regions” Button
3.3.1 CONFIGURE THE OUTPUT REGIONS
Once the regions have been defined, they must be configured for LCD analysis.
1. Click on the LCD Production Recipe Tab
a. There is a similar Region Table on the LCD Production Tab.
2. Click on the first region to configure.
3. Press the LCDView Button.
Axometrics, Inc.AxoStep Polarimeter, Rev 3.0
49

4. The data from the first region will be imported into LCDView.
5. Fit the data using LCDView (see LCDView User’s Manual for details).
6. Once the data is fit, Close LCDView
Axometrics, Inc.AxoStep Polarimeter, Rev 3.0
50

Notice that the Fitted LCD Parameters are now shown in the table.
Repeat Steps 2-6 for each region.
3.4 Configure the Robots.
Configuring the Robots for an LCD Production Recipe is described below.
1. Press the Configure Robots Button on the LCD Production Tab.
x,y Coordinates: The list of positions on the panel that are measured.
Tilt, Rotation Angles: The tilt and rotation angles that are measured at each point
Wavelengths: The wavelengths used at each measurement
When the Configure Robots Button is pressed on the front panel, the LCD Measurement Recipe Builder window opens, which allows the user to configure the measurement recipe.
Axometrics, Inc.AxoStep Polarimeter, Rev 3.0
51

The following sections describe the steps necessary to properly set up a measurement recipe
3.5 x,y Coordinates Setup
The first tab on the LCD Measurement Recipe Builder allows the user to setup the x,y Coordinates that will be used for the measurement.
The x-y coordinates can be expressed in one of two ways
Axometrics, Inc.AxoStep Polarimeter, Rev 3.0
52

1. Absolute coordinates: The values in the coordinate list are the actual position values of the x-y stage motors.
2. Panel coordinates (only available with Optical Guaging machine vision system): The values in the coordinate list are measured from the lower left alignment mark on the LCD panel being measured, and the x-axis is the line joining the two alignment marks on the panel. The measurement locations illustrated on the x-y coordinates tab shown above are drawn using the last successful panel alignment measurement. The actual motor location are adjusted accordingly each time an alignment measurement is performed. Therefore, even if the panel is repositioned in the panel holder, the same location on the panel is measured.
The relationship between panel coordinates and absolute coordinates is illustrated below.
The user has three options for setting up these coordinates.
Load From File: The user can load a tab delimited file of x and y coordinates that will be imported into the table.
Enter By Hand: If the user presses the Enter By Hand button, the following window appears, allowing the user to manually enter x,y Coordinates.
Axometrics, Inc.AxoStep Polarimeter, Rev 3.0
Panel Coordinates
Absolute (Stage) Coordinatesoffset x
offset yPanel Coordinates
Absolute (Stage) Coordinatesoffset x
offset y
53

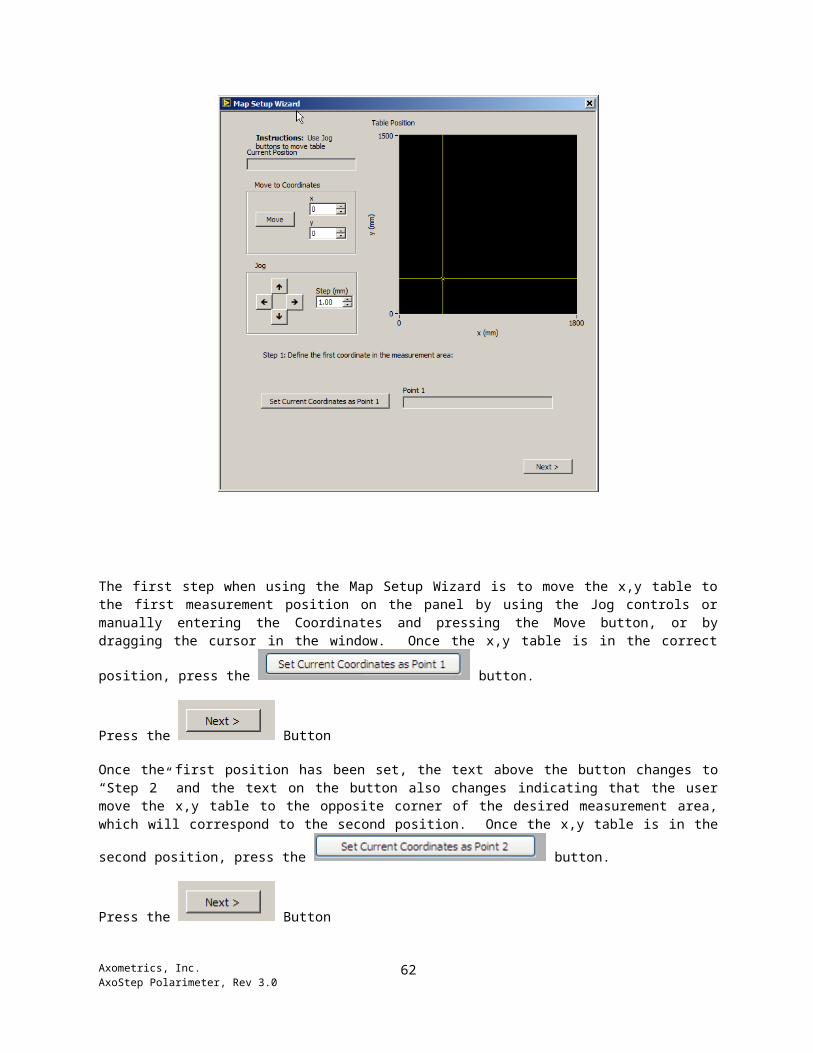
Wizard: If the user presses the Wizard button, the Map Setup Wizard window appears, allowing the user to easily configure the x,y coordinates
The first step when using the Map Setup Wizard is to move the x,y table to the first measurement position on the panel by using the Jog controls or manually entering the Coordinates and pressing the Move
Axometrics, Inc.AxoStep Polarimeter, Rev 3.0
54

button, or by dragging the cursor in the window. Once the x,y table is in the correct position, press the
button.
Press the Button
Once the first position has been set, the text above the button changes to “Step 2” and the text on the button also changes indicating that the user move the x,y table to the opposite corner of the desired measurement area, which will correspond to the second position. Once the x,y table is in the second
position, press the button.
Press the Button
Once both positions have been selected, the following control appears, allowing the user to set the number of points in the measurement. In the example shown below, the user has selected an array of 15 points by 13 points (195 total measurement positions) whose corners are defined by the two points previously selected by the user.
The user can configure the points in Three different ways.
Grid: Defines the set of points as a rectangular grid.
Line: Defines the Points along a line between Point 1 and Point 2
Staggered: Creates a Staggered array of point of the form
Axometrics, Inc.AxoStep Polarimeter, Rev 3.0
55

Once the array of points is defined, the Accept button is enabled. Pressing the Accept button causes the software to calculate the array of measurement points, and puts those values in the table on the LCD Measurement Recipe Builder front panel.
3.5.1 DISCRETE HOLES
Pressing the Discrete Holes button brings up a dialog box showing a regular array of measurement locations. The user can click and drag to select any arrangement of positions desired.
If a Measurement Hole Plate was provided with the sample holder for the APM system, the positions of the Holes in this dialog will directly correspond to the hole centers in the attached Hole Plate.
Note: When the user selects Panel Coordinates, the two alignment marks appear in the window, allowing the user an easy reference for navigating the panel. All the controls on the window are also converted to panel coordinates, except the cursor window, which always shows the absolute position of the motor stages.
3.6 Tilt, Rotation Angles
The second tab on the LCD Measurement Recipe Builder allows the user to setup the tilt and rotation angles that will be used for the measurement.
Axometrics, Inc.AxoStep Polarimeter, Rev 3.0
56

When setting up the rotation angles, the user has three options:
Arbitrary Tilt and Rotation Angles: The user can select this option, to enter an arbitrary array of tilt and rotation angles. The values can either be loaded from a file, or entered by hand.
If the user presses the Wizard Button, the following window appears.
This utility allows the user to enter polar angle scans along arbitrary rotation angles. The rotation angles can be entered manually, or the user can enter equally spaced rotation angles.
Axometrics, Inc.AxoStep Polarimeter, Rev 3.0
57

3.7 Wavelengths.
The third tab on the LCD Measurement Recipe Builder allows the user to setup the wavelengths that will be used for the measurement.
The polarimeter performs measurements at the wavelengths entered by the user. These wavelengths can be loaded from a file or entered by hand, using the following control.
If the user presses the Wizard button, the following control appears, allowing the user to setup the wavelengths automatically.
Axometrics, Inc.AxoStep Polarimeter, Rev 3.0
58

3.8 Perform a Test Measurement
Once the Production Recipe is configured, it is recommended that the user save the Recipe, by pressing the Export Production Recipe button on the LCD Production Recipe Tab.
Finally the recipe can be executed by pressing the Test Production Recipe Button
The following options are available when performing a Production Recipe.
Perform AutoFocus: Checking this box will cause the Production Recipe to perform a complete autofocus before each Mueller Matrix Image is acquired. Note: Checking this box will significantly increase the measurement time required to complete the recipe.
Log Data During Measurement: Checking this box will cause the production recipe to save each data results as it is acquired, rather than waiting until the measurement completes to save the entire dataset.
Center Pixel (recommended): Checking this box will perform an auto-centering before each Mueller Matrix image is acquired.
Axometrics, Inc.AxoStep Polarimeter, Rev 3.0
59

Log Bad crt rms: Checking this box will save the raw data files (*.astp) whenever a pixel centering is not performed properly.
Threshold: is the amount (as a fraction of 1) of the pixel that falls outside the user defined output region. Thus triggering a Log Bad crt rms (if checked).
Log All Astp files: will log all of the raw data for the production measurement. Note: It is recommended that this option only be used as a troubleshooting aid, as the raw data generated when performing a production recipe will fill up the space on the hard disk quickly.
When the production recipe starts, the following window will appear allowing the user to monitor the progress of the measurement
The image in the upper right corner shows a live image from the AxoStep Head.
Once all the measurements at a given X,Y coordinate are complete, and Analysis Monitor will appear showing the results of the Pixel Search Algorithm and the regions being analyzed.
Axometrics, Inc.AxoStep Polarimeter, Rev 3.0
60

Once the production measurement is complete, The user can save the data by clicking File>Save from the pull down menus
Axometrics, Inc.AxoStep Polarimeter, Rev 3.0
61
4 APPENDIX
4.1 Reduced Parameters
The fundamental measurement made by the MMP is the raw Mueller Matrix. The Mueller matrix is a 4 x 4 matrix of real numbers that completely describes the polarization altering properties of a sample for a given light source, location, and incident angle. The Mueller Matrix is a powerful mathematical tool for researchers because it enables them to simulate the effect of a sample on any incident polarization state, and it also allows them to simulate the combined effect of several different samples in sequence.
On the main screen of the MMP software, the raw Mueller matrix can be found on the GENERAL tab.
While the Mueller Matrix is complete in its description of a sample’s polarization altering properties, most people find it extremely difficult to extract useful information from its 16 numbers. As such, the Mueller Matrix Polarimeter calculates a wide varied of reduced parameters and displays these parameters on the various tabs and graphics representations on the front screen. Keep in mind that each of these reduced parameters was ultimately calculated directly from the Mueller matrix. We describe each of these reduced parameters below.
Transmittance/Reflectance This value ranges from 0 to 1 and describes the fraction of light that left the PSG and ultimately reached the detector within the PSA. A value less than 1 indicates that a sample has prevented some light from reaching the PSA, either through absorption, reflection, or scattering. If the MMP is set up to measure a transmitted beam, this value is the transmittance. If the MMP has been set up to measure a beam reflected from a sample, this value is the reflectance. NOTE: Keep in mind that this value is the average transmittance of all possible incident polarization states, or stated another way, is the transmittance of an unpolarized input beam.
Tmax is the transmittance (or reflectance) for the polarization state that has the maximum transmittance through the sample. The corresponding polarization state is frequently called the Diattenuation vector or the Input Transmission Axis. More information about the diattenuation vector can be found below in the description of the Diattenuation Tab.
Tmin is the transmittance of the polarization state that has the minimum transmittance through the sample. This minimum-transmission polarization state will always be orthogonal to the maximum-transmission polarization state (diattenuation vector). As an example, if the maximum-transmission polarization state is horizontal, then the minimum-transmission polarization state is vertical.
Depolarization Index (Dep) is a single parameter that attempts to describe whether light has been depolarized anywhere within the sample. Depolarization Index can be in the range 0 Dep 1, where Dep = 0 implies no depolarization whatsoever, and Dep = 1 implies a perfect depolarizer.
The depolarization index of a Mueller matrix M is defined as1:
Dep(M )=1−√(∑i , j mi , j
2 )−m002
√3 m00
1 “Polarimetry” Chapter 22, in The Handbook of Optics, 2nd Ed., Vol.2, (McGraw Hill, New York, 1995).Axometrics, Inc.AxoStep Polarimeter, Rev 3.0
62

4.1.1 RETARDANCE
Retardance is a polarization-dependent phase change associated with a sample. The phase (optical path length) of the output beam depends on the polarization state of the input beam. The transmitted phase is a maximum for one polarization state, and is a minimum for the orthogonal polarization state.
Retardance is defined by two parameters, the Retardance Magnitude and the Fast Axis. The retardance magnitude varies from 0º to 180º. The retardance order is the additional integer number of half-wavelengths present. The AxoStep measuring at a single wavelength cannot distinguish between orders.
Retarders with Identical Mueller Matrices
Order δ, Retardance θ, Orientation
0 δ θ
1 360º - δ θ + 90º
2 360º + δ θ
3 720º - δ θ + 90º
4 360º + δ θ
and so on…
If the retardance order is known, you can enter it into the Retardance Order control. If the SpectroPolarimeter option is installed, you can also measure the retardance order by pressing the “Measure Retardance Order” button. This function will measure the retardance at five different wavelengths (centered on the current wavelength) and attempt to determine the retardance order based on the spectral variation. NOTE – If the retardance order is known to be higher than 3 rd or 4th order, you should consider making a series of Spectral measurement at different wavelength increments to ensure that the correct order is measured.
The Retardance Magnitude describes the difference in phase between the fastest and slowest polarization states. This phase difference can be expressed as an angle (in radians or degrees), or as a fraction of a wave (since there are 360° of phase in one wave, a quarter-wave retarder has 90° of retardance), or in units of length (typically in nm). Since a light path could be delayed for several half-wave plus a fraction of a half-wave through a sample, and only the delay of the fractional part makes a real difference on the polarization status for a single wavelength light, the retardance magnitude displayed by default is that fractional part, or in other words, the zero order. If the polarization properties are measured in a spectrum (The SpectroPolarimeter option must be installed to perform this measurement), the total retardance magnitude will be displayed by pressing MEASURE RETARDANCE ORDER. The number displayed in the Retardance Order indicates how much half-wave phase delay the total retardance contains. Retardance Order can be reset to zero by pressing RESET button, so that only the zero order retardance is displayed.
The Fast Axis is the polarization state that passes through the sample the fastest. In a birefringent crystal, the Fast Axis is associated with the mode with the lower refractive index. The Fast Axis can be any polarization state: linear, elliptical, or circular. This fast axis is displayed graphically as a green dot on the Poincaré sphere. For most single crystals the fast axis is a linear state on the equator of the Poincaré sphere. For combinations of crystals at arbitrary angles, the fast axis is generally elliptical and changes with wavelength.
Alternately, we can describe the fast axis numerically by describing its Orientation (related to its longitude on the Poincaré sphere) and by the ratio of Linear Retardance and Circular Retardance
Axometrics, Inc.AxoStep Polarimeter, Rev 3.0
63

present. The zero degree direction of Orientation is defined by default by the line scribed into the front window housing of the head and can be redefined as described in Section 4.2.6. The linear and circular components of retardance are related to the total retardance magnitude by:
δmag=√δlinear2 +δcircular2
In our retardance convention, the circular retardance component is negative to represent a fast-axis with a left-handed circular component and positive for right-handed circular components. Do not interpret the negative circular retardance to indicate that the retardance is actually negative.
A common way that retardance can be introduced into a sample is through birefringence, or a difference in refractive index (n1 – n2) for two different polarization states. The retardance is related to the birefringence through the equation:
δ=360 ° (n1−n2 ) t
λ
where t is the thickness of the sample, is the optical wavelength, and the retardance is expressed in degrees.
4.1.2 DIATTENUATION
Diattenuation describes the difference in transmission between different input polarization states, and is defined as:
Diat=Tmax−Tmin
Tmax+Tmin .
Diattenuation can have values between zero and one, with Diat = 0 implying no difference in transmittance between various polarization states, and Diat = 1 imply total attenuation (through absorption or reflection) of one polarization state as in a perfect polarizer.
Similar to retardance, the diattenuation is described by a Diattenuation Magnitude and a Transmission Axis (called the Diattenuation Vector). This axis defines the polarization state that is maximally transmitted, and is displayed graphically on the Poincaré sphere as a blue dot. Note that the minimally transmitted polarization will always be the orthogonal polarization state.
The diattenuation vector is displayed numerically on the Diattenuation Tab by its Orientation, and its Linear and Circular components. As with the retardance fast-axis, we allow negative circular diattenuation to be a description of positive diattenuation with a left-hand-circular component.
Diattenuation is also commonly called the Polarization Dependent Loss or PDL, and is shown this way on the Diattenuation Tab expressed in dB.
Another equivalent description of diattenuation is the extinction ratio. This parameter is not displayed on the Diattenuation Tab in this version of the software, but can be easily calculated as:
E=Tmin
Tmax=1−Diat
1+Diat
Axometrics, Inc.AxoStep Polarimeter, Rev 3.0
64

The Diattenuation Tab also describes the Polarizance of the sample. The Polarizance is defined as the degree of polarization (DOP) of the transmitted light when unpolarized light is incident on the sample.
As with the retardance and diattenuation, polarizance is defined by a Polarizance Magnitude and the Polarizance Vector. The polarizance magnitude is the DOP of transmitted light when unpolarized light is incident. The polarizance vector describes this output polarization state, and is shown graphically on the Poincaré sphere as a red dot. The polarizance vector is described numerically on the Diattenuation Tab by its Orientation, and its Linear and Circular components.
It is interesting to note that the diattenuation magnitude and polarizance magnitude will be exactly the same if there are no depolarization effects whatsoever in the sample. Conversely, if the diattenuation magnitude and polarizance magnitude are different in a sample, it always implies a depolarization effect. As a trivial example, consider a perfect polarizer followed by a perfect depolarizer. This system will have a diattenuation of 1 but a polarizance of 0 (the output DOP is zero due to the depolarizer).
4.2 Calculated Parameters
The above screen shows the results of a two-axis retardance measurements. By default, retardance in nm versus incident angle is plotted. To the right, a table of calculated parameters is given. These parameters are calculated individually for tilt about both axes and the average value is also presented (unless a one-Axis measurement was performed). The definitions of these parameters follows:
R0 Retardance at normal incidence, governed by the formula R0 = (Nx – Ny) d where d is the sample thickness and Nx and Ny are the refractive indices in the plane of the sample. (Z is defined as the direction of light propagation, normal to the surface of the sample).
R0 can either me directly determined from the on-axis measurement, or it can be determined from the curve-fit to the measured angular data. Use the CALCULATE R0 FROM CURVE FIT checkbox to select your preferred calculation mode.
Axometrics generally recommends not using the curve-fit to calculate unless the measurement data is very noisy due to low retardance or fringing from a laser light source.
Rth An industry-standard term used to describe the off-axis retardance variation of a sample. Axometrics lets the user choose the desired Rth equation from the CALCULATIONS tab:
Axometrics, Inc.AxoStep Polarimeter, Rev 3.0
65

(1) Axometrics has seen a wide range of Rth equations in use in the industry. The equation shown above appears to be the most widely used. However it is important for the user to know which equation is typically used in their application.
(2) Another important note about the Rth parameter is that it does not uniquely define the retardance vs. angle characteristic of a sample. Two samples with different thickness but the same Rth values will have different retardance vs. incident angle curves.
(3) Rth must be calculated from a fairly complicated curve fit. In the analysis screen, the results of the curve fit are displayed with the retardance data points whenever retardance (nm) is the parameter being shown on screen. In order to perform this curve fit, the user must enter assumed values of the sample thickness and average in-plane refractive index. These values are entered in the Navg and d (µm) controls at the top of the analysis screen. There may be instances when the curve fit clearly does not accurately follow the measured data. In these cases, you cannot trust the regressed value of Rth.
β Tilt angle of the refractive index ellipsoid with respect to the XY plane of the sample.
The following figure illustrates these values:
The retardance is calculated using the equation:
.
The only approximation required for the calculation in determiningθ'. We do not allow beam separation,
and use Snell’s Law to calculate the refracted angle, using the average refractive index:
Axometrics, Inc.AxoStep Polarimeter, Rev 3.0
66

.
IMPORTANT NOTE: R0 and Rth are calculated using the projected refractive indices Nx, Ny, and Nz as shown in the above equations. However the Nx, Ny and Nz values shown on-screen in the AxoStep Viewer software are actually the Na, Nb, and Nc values of the index ellipsoid.
4.3 A Note about Retardance Order and “Unwrapping”
If you use a retarder at a single wavelength and at normal incidence, there is really no difference between ¼-wave, 1¼ -wave, … 1000¼-wave, etc. You do not care which ‘order’ the retarder is in. And you also cannot measure the difference between these orders by using just one wavelength.
However, the ‘order’ of a retarder becomes important when the retarder will be used at more than one wavelength, or if sensitivity of incident angle is important. This is because a high-order retarder has very strong wavelength-dependence and incident-angle-dependence, while a low-order retarder has a weaker dependence. To measure the ‘order’ of a retarder, we must make measurements at different wavelengths and see how fast the retardance varies with wavelength. This is true for all polarization measurement techniques.
Most people understand that part pretty well. The idea that ¼-wave, 1¼-wave, 2¼-wave (etc.) all look the same makes sense.
It is little more confusing to consider a ¾-wave retarder. Here is the problem: At a single wavelength, a ¼-wave retarder oriented vertically acts exactly the same as a ¾-wave retarder oriented horizontally. This is the same as saying that we cannot distinguish between delaying the phase by ¾-wave or advancing the phase by ¼-wave. As before, the only way to tell the difference is to make measurements at multiple wavelengths and see how fast the retardance varies with wavelength.
As a result of all of this, once the retardance of a sample exceeds half-wave (180°), a measurement at a single wavelength will report the wrong retardance order. A retarder with 181° retardance oriented vertically will be reported as 179° retardance oriented horizontally.
When tilting a sample, seeing these discontinuities in the data is undesirable. If the retardance exceeds 180° at angles above 20°, we would prefer to see the retardance values continue to increase beyond 180° at even higher angles. Similarly, if the retardance decreases below zero at some incident angle, we would prefer to see negative retardance values reported.
Axometrics has developed algorithms that attempt to ‘Unwrap’ the retardance order. These algorithms work well for most samples, however some more-complicated samples may not unwrap properly. Also, if extremely small angular increments are made, the measurement noise may exceed the angle-to-angle difference in the retardance resulting in incorrect unwrapping.
Axometrics, Inc.AxoStep Polarimeter, Rev 3.0
67