· web viewecologists investigated the effect of a herbicide on crop yield and the diversity of...
TRANSCRIPT

Feversham College
Q1.(a) What two measurements are needed to calculate an index of diversity?
1 .....................................................................................................................
2 .....................................................................................................................(2)
(b) A herbicide is a chemical used to kill weeds. Ecologists investigated the effect of a herbicide on crop yield and the diversity of insects. They sprayed different fields with the same volume of different concentrations of the herbicide. At harvest, the ecologists determined the mean crop yield and the mean index of diversity of insects for fields that had received the same concentration of the herbicide.
The figure below shows their results.
Concentration of herbicide sprayed on field / mg dm−3
(i) Some fields acted as controls. They were sprayed with a solution that did not contain the herbicide. Explain the purpose of these control fields.
...............................................................................................................
...............................................................................................................
...............................................................................................................(1)
(ii) Suggest an explanation for the relationship between the concentration of herbicide and the mean crop yield.
...............................................................................................................
...............................................................................................................
...............................................................................................................
...............................................................................................................(2)
Page 1

Feversham College
(iii) Explain the relationship between the concentration of herbicide and the mean index of diversity of insects.
...............................................................................................................
...............................................................................................................
...............................................................................................................
...............................................................................................................
...............................................................................................................
...............................................................................................................
(Extra space) ........................................................................................
...............................................................................................................
...............................................................................................................(3)
(Total 8 marks)
Page 2

Feversham College
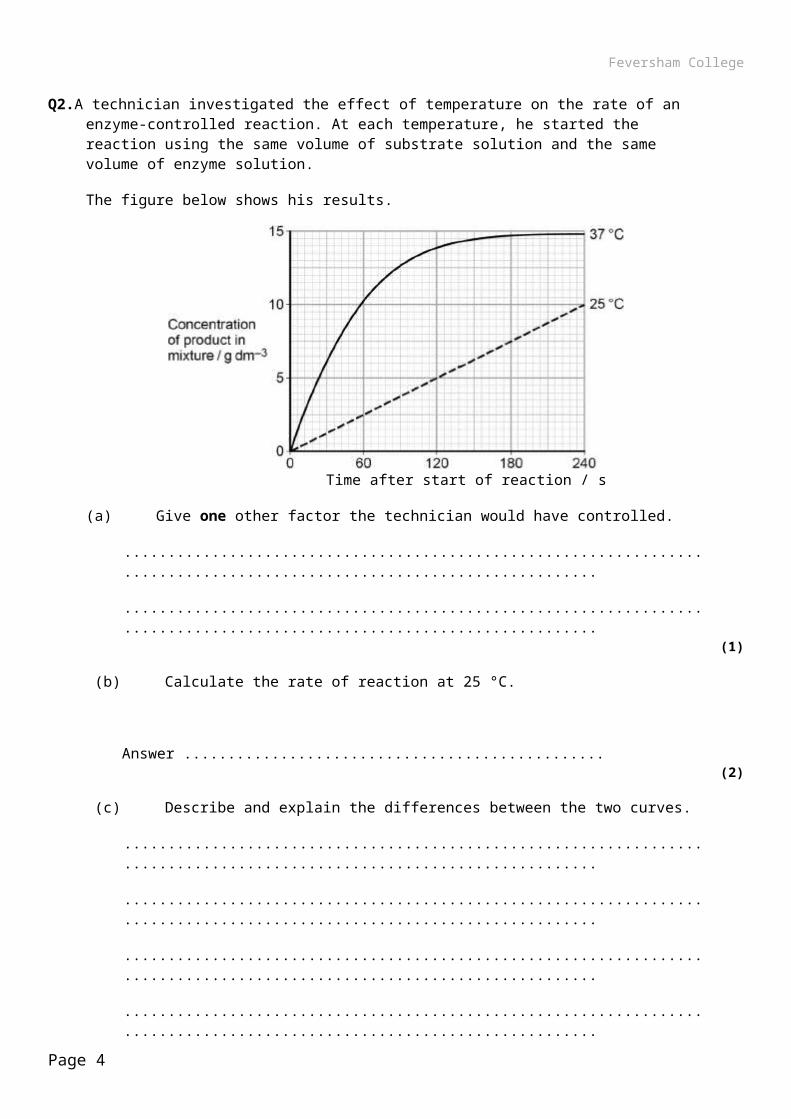
Q2.A technician investigated the effect of temperature on the rate of an enzyme-controlled reaction. At each temperature, he started the reaction using the same volume of substrate solution and the same volume of enzyme solution.
The figure below shows his results.
Time after start of reaction / s
(a) Give one other factor the technician would have controlled.
........................................................................................................................
........................................................................................................................(1)
(b) Calculate the rate of reaction at 25 °C.
Answer ................................................(2)
(c) Describe and explain the differences between the two curves.
........................................................................................................................
........................................................................................................................
........................................................................................................................
........................................................................................................................
........................................................................................................................
........................................................................................................................
........................................................................................................................
........................................................................................................................
........................................................................................................................(5)
(Total 8 marks)
Page 3
Feversham College
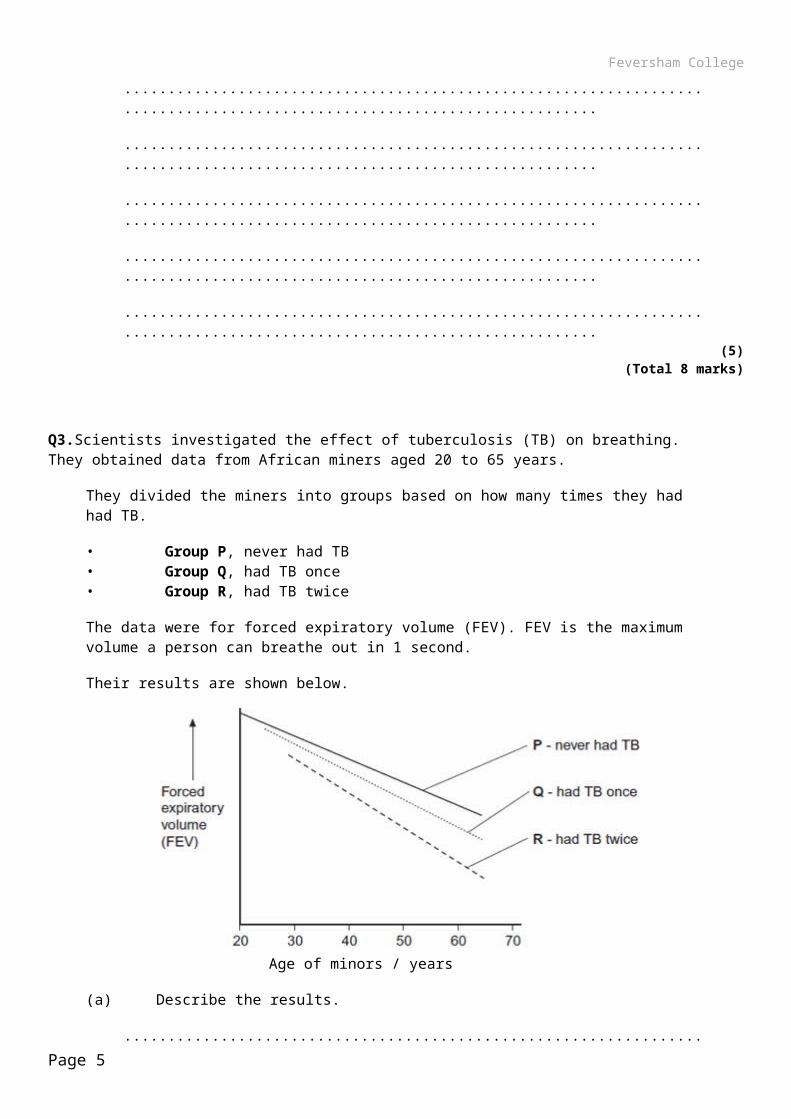
Q3.Scientists investigated the effect of tuberculosis (TB) on breathing. They obtained data from African miners aged 20 to 65 years.
They divided the miners into groups based on how many times they had had TB.
• Group P, never had TB• Group Q, had TB once• Group R, had TB twice
The data were for forced expiratory volume (FEV). FEV is the maximum volume a person can breathe out in 1 second.
Their results are shown below.
Age of minors / years
(a) Describe the results.
........................................................................................................................
........................................................................................................................
........................................................................................................................
........................................................................................................................
........................................................................................................................
........................................................................................................................
(Extra space) .................................................................................................
........................................................................................................................
........................................................................................................................(3)
Page 4
Feversham College
(b) Tuberculosis leads to permanent changes in the gas exchange system.These changes include fibrosis.
Explain how fibrosis caused by tuberculosis could have produced the changes in FEV of the miners.
........................................................................................................................
........................................................................................................................
........................................................................................................................
........................................................................................................................
........................................................................................................................
........................................................................................................................
(Extra space) .................................................................................................
........................................................................................................................
........................................................................................................................(3)
(Total 6 marks)
Page 5

Feversham College
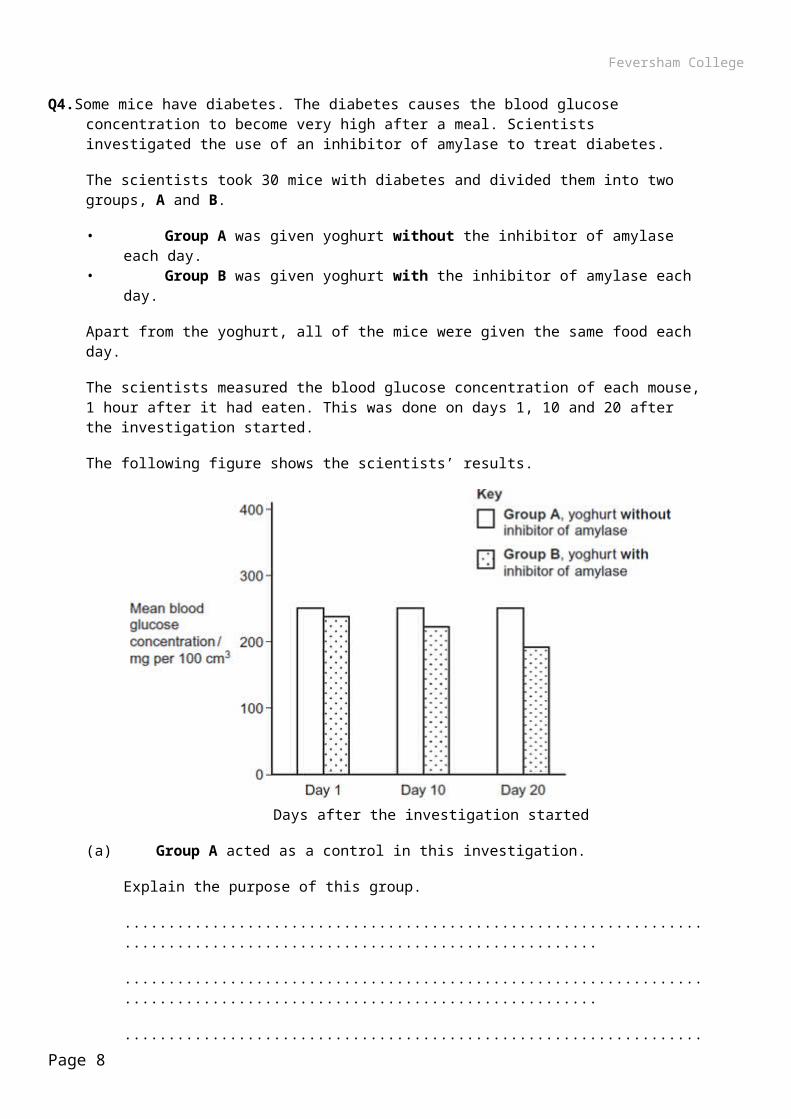
Q4.Some mice have diabetes. The diabetes causes the blood glucose concentration to become very high after a meal. Scientists investigated the use of an inhibitor of amylase to treat diabetes.
The scientists took 30 mice with diabetes and divided them into two groups, A and B.
• Group A was given yoghurt without the inhibitor of amylase each day.• Group B was given yoghurt with the inhibitor of amylase each day.
Apart from the yoghurt, all of the mice were given the same food each day.
The scientists measured the blood glucose concentration of each mouse, 1 hour after it had eaten. This was done on days 1, 10 and 20 after the investigation started.
The following figure shows the scientists’ results.
Days after the investigation started
(a) Group A acted as a control in this investigation.
Explain the purpose of this group.
........................................................................................................................
........................................................................................................................
........................................................................................................................
........................................................................................................................(2)
(b) Apart from the yoghurt, it was important that all of the mice were given the same food each day.
Give two reasons why it was important that all of the mice were given the same food each day.
1 .....................................................................................................................
........................................................................................................................
Page 6

Feversham College
2 .....................................................................................................................
........................................................................................................................(2)
(c) The scientists’ hypothesis was that adding the inhibitor of amylase to the food would lead to a lower blood glucose concentration.
Use your knowledge of digestion to suggest how the addition of the inhibitor could lead to a lower blood glucose concentration.
........................................................................................................................
........................................................................................................................
........................................................................................................................
........................................................................................................................(2)
(d) Give one reason why these results may not support the use of the inhibitor of amylase to treat diabetes in mice.
........................................................................................................................
........................................................................................................................
........................................................................................................................
........................................................................................................................(2)
(Total 8 marks)
Page 7
Feversham College
Q5.A scientist investigated the uptake of sodium ions by animal tissue.To do this, he:
• used two flasks, F and G• put equal masses of animal tissue into each flask• added equal volumes of a solution containing sodium ions to each flask• added to flask F a solution of a substance that prevents the formation of ATP by cells• measured the concentration of sodium ions remaining in the solution in each flask.
The graph below shows his results.
Time / minutes
(a) Calculate the rate of uptake of sodium ions by the tissue in flask G during the first 20 minutes of this investigation.
Answer = ................................... arbitrary units per minute(1)
(b) The scientist concluded that the cells in flask G took up sodium ions by active transport. Explain how the information given supports this conclusion.
........................................................................................................................
........................................................................................................................
........................................................................................................................
........................................................................................................................
........................................................................................................................
........................................................................................................................
........................................................................................................................
........................................................................................................................
(Extra space) ................................................................................................
Page 8

Feversham College
........................................................................................................................
........................................................................................................................
........................................................................................................................(4)
(c) The curve for flask F levelled off after 20 minutes. Explain why.
........................................................................................................................
........................................................................................................................
........................................................................................................................
........................................................................................................................
........................................................................................................................(2)
(Total 7 marks)
Page 9
Feversham College
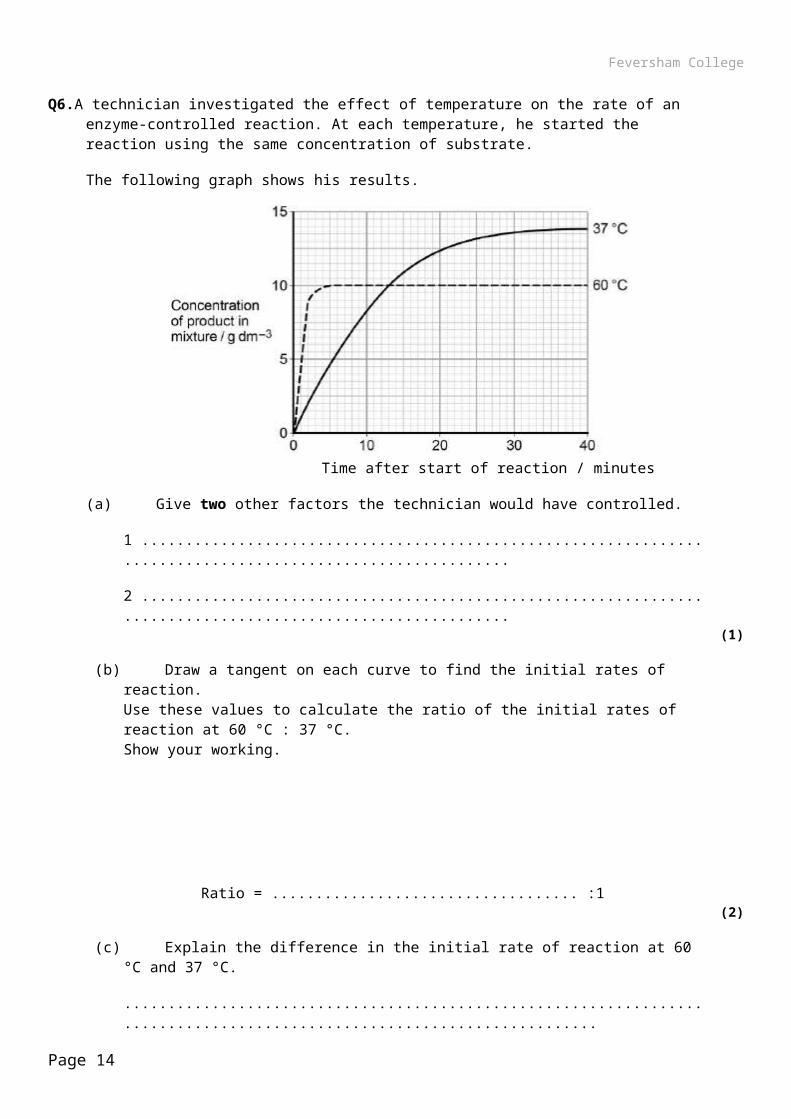
Q6.A technician investigated the effect of temperature on the rate of an enzyme-controlled reaction. At each temperature, he started the reaction using the same concentration of substrate.
The following graph shows his results.
Time after start of reaction / minutes
(a) Give two other factors the technician would have controlled.
1 ............................................................................................................
2 ............................................................................................................(1)
(b) Draw a tangent on each curve to find the initial rates of reaction.Use these values to calculate the ratio of the initial rates of reaction at 60 °C : 37 °C.Show your working.
Ratio = ................................... :1(2)
(c) Explain the difference in the initial rate of reaction at 60 °C and 37 °C.
........................................................................................................................
........................................................................................................................
........................................................................................................................
........................................................................................................................(2)
Page 10

Feversham College
(d) Explain the difference in the rates of reaction at 60 °C and 37 °C between 20 and 40 minutes.
........................................................................................................................
........................................................................................................................
........................................................................................................................
........................................................................................................................
........................................................................................................................
........................................................................................................................
........................................................................................................................
........................................................................................................................
(Extra space) ................................................................................................
........................................................................................................................
........................................................................................................................
........................................................................................................................(4)
(Total 9 marks)
Page 11
Feversham College
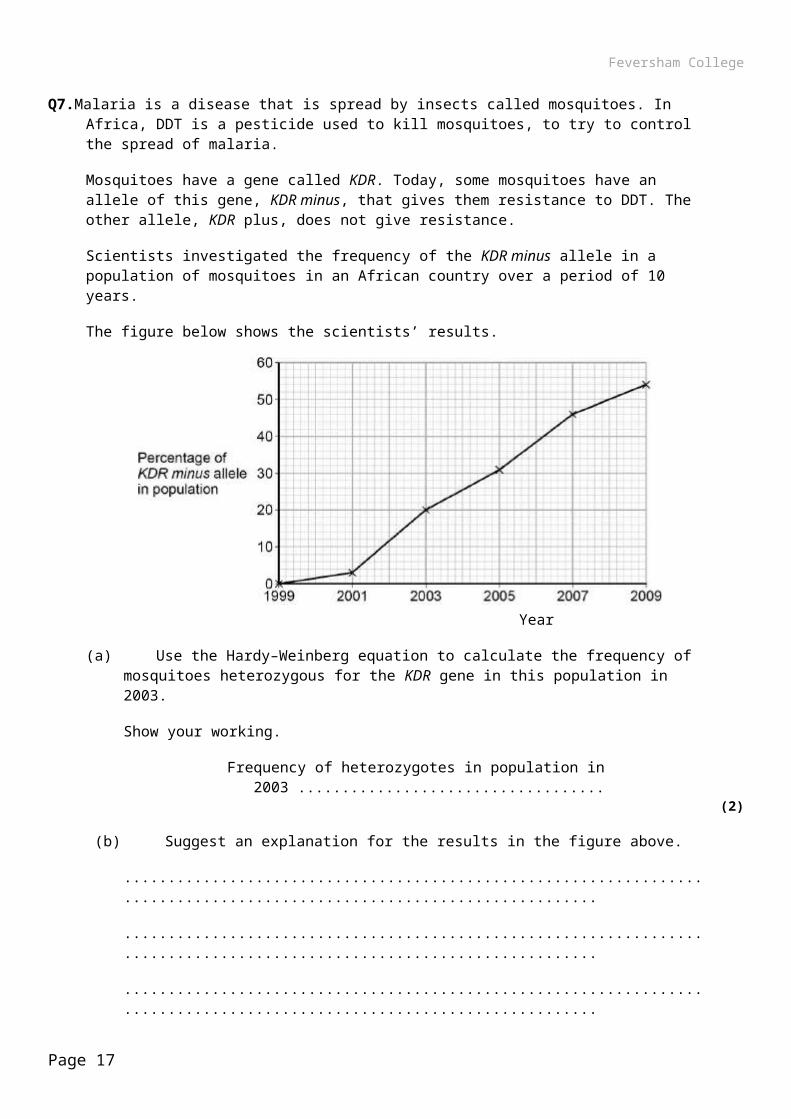
Q7.Malaria is a disease that is spread by insects called mosquitoes. In Africa, DDT is a pesticide used to kill mosquitoes, to try to control the spread of malaria.
Mosquitoes have a gene called KDR. Today, some mosquitoes have an allele of this gene, KDR minus, that gives them resistance to DDT. The other allele, KDR plus, does not give resistance.
Scientists investigated the frequency of the KDR minus allele in a population of mosquitoes in an African country over a period of 10 years.
The figure below shows the scientists’ results.
Year
(a) Use the Hardy–Weinberg equation to calculate the frequency of mosquitoes heterozygous for the KDR gene in this population in 2003.
Show your working.
Frequency of heterozygotes in population in 2003 ...................................(2)
(b) Suggest an explanation for the results in the figure above.
........................................................................................................................
........................................................................................................................
........................................................................................................................
........................................................................................................................
........................................................................................................................
........................................................................................................................
........................................................................................................................
........................................................................................................................
(Extra space) ................................................................................................
........................................................................................................................Page 12

Feversham College
........................................................................................................................
........................................................................................................................
........................................................................................................................
The KDR plus allele codes for the sodium ion channels found in neurones.(4)
(c) When DDT binds to a sodium ion channel, the channel remains open all the time.Use this information to suggest how DDT kills insects.
........................................................................................................................
........................................................................................................................
........................................................................................................................
........................................................................................................................(2)
(d) Suggest how the KDR minus allele gives resistance to DDT.
........................................................................................................................
........................................................................................................................
........................................................................................................................
........................................................................................................................(2)
(Total 10 marks)
Page 13
Feversham College
Q8.Chloroplasts contain chlorophyll a and chlorophyll b. Scientists found tobacco plants with a mutation that caused them to make more chlorophyll b than normal tobacco plants. They investigated the effect of this mutation on the rate of photosynthesis.
The scientists carried out the following investigation.
• They grew normal and mutant tobacco plants. They grew some of each in low light intensity and grew others in high light intensity.
• They isolated samples of chloroplasts from mature plants of both types.• Finally, they measured oxygen production by the chloroplasts they had isolated from the
plants.
The figure below shows the scientists’ results.
Light intensity / μmol photons m-2s-1
(a) Explain why the scientists measured the rate of production of oxygen in this investigation.
........................................................................................................................
........................................................................................................................
........................................................................................................................
........................................................................................................................
In each trial, the scientists collected oxygen for 15 minutes.(2)
(b) Calculate the difference in the oxygen produced by the chloroplasts from mutant plants grown in low and high light intensities at a light intensity of 500 μmol photons m–2 s–1 during these trials.
Show your working.
Difference .................................................................... μmol O2 mg–1
(2)
Page 14

Feversham College
(c) The scientists suggested that mutant plants producing more chlorophyll b would grow faster than normal plants in all light intensities.
Explain how these data support this suggestion.
........................................................................................................................
........................................................................................................................
........................................................................................................................
........................................................................................................................
........................................................................................................................
........................................................................................................................
........................................................................................................................
........................................................................................................................
(Extra space) ................................................................................................
........................................................................................................................
........................................................................................................................
........................................................................................................................(4)
(Total 8 marks)
Page 15
Feversham College
M1.(a) 1. Number of (individuals of) each species;Accept: ‘population’ for ‘number’
2. Total number of individuals / number of species;Accept: ‘species richness’MP2 allows for other types of diversity index
2
(b) (i) (Shows) results are due to the herbicide / are not due to another factor / (to) compare the effect of using and not using the herbicide / shows the effect of adding the herbicide;
Neutral: allows a comparisonNeutral: ensures results are due to the independent variableReject: ‘insecticide’Accept: ‘pesticide’
1
(ii) 1. (More) weeds killed so more crops / plants survive / higher yield / less competition;
2. High concentrations (of herbicide) harm / damage / kill / are toxic to crops / plants;Accept: ‘pesticide’Neutral: ‘insecticide’Accept: use of figures (eg 400+)
2
(iii) 1. Reduced plant diversity / fewer plant species / fewer varieties of plant;Accept: ‘weed’ for ‘plant’Neutral: fewer plantsAccept: only one crop species remains
2. Fewer habitats / niches;Q Neutral: fewer homes / shelters
3. Fewer food sources / varieties of food;Neutral: less food
3[8]
Page 16
Feversham College
M2.(a) Concentration of substrate solution / of enzyme solution / pH;1
(b) 1. 2.5 / 0.04;1 mark for correct value
2. g dm–3 minute–1 / g dm–3 s–1;1 mark for related unit
2
(c) 1. Initial rate of reaction faster at 37 °C;
2. Because more kinetic energy;
3. So more E–S collisions / more E–S complexes formed;
4. Graph reaches plateau at 37 °C;
5. Because all substrate used up;Allow converse for correct descriptions and explanations for curve at 25 °C
5[8]
M3.(a) 1. FEV falls / drops with age (even without TB);
2. FEV falls faster / drops further / is lower (with age) with TB / greater drop in FEV with TB;
“Fall in FEV” insufficient
3. FEV falls fastest / drops furthest / is lowest in those who had TB twice (R);
Worth 2 marks as subsumes point 2The more times they have had TB = twice“The more times they have had TB, the lower their FEV” = 2 marks
4. Results for TB once (Q) start in early twenties and for TB twice (R) in late twenties / from 30;
3 max
(b) (Fibrosis causes / due to),FEV depends on how much can be inhaled – as well as ability to exhale
1. Development of scar tissue / scarring / connective tissue / loss of elasticity / elastic tissue / elastin in lungs;
2. Restricts inhalation;Accept resists expansion / lung capacity drops
3. Breathe out less / reduced FEV due to reduced lung elasticity / scar tissue does not recoil / is not elastic / lung tissue does not recoil;
3[6]
Page 17

Feversham College
M4.(a) 1. To show the effect of the inhibitor / drug;
2. To show the effect of yoghurt (on its own does not affect bloodglucose);
2
(b) 1. Food is a factor affecting blood glucose / different foods contain different amounts of starch / glucose / sugar / carbohydrate;
Accept converse
2. To keep starch / fibre intake the same / similar;Accept something in food which affects the inhibitor
2
(c) 1. Fewer E-S complexes formed;
2. (With inhibitor) less / no starch digested to maltose ;Require knowledge that maltose comes from starch
3. (So) less / no glucose from maltose;Require knowledge that glucose comes from maltoseAccept no glucose
4. (So) less absorption of glucose (from gut);2 max
(d) Suitable reason; with explanation;
Paired responses – do not mix and matchIgnore references to correlation does not prove causation, it could be due to other factors
Examples,
1. Need larger sample / only 30 mice / only 15 mice in each group;Accept small sample size
2. Might not be representative / anomalies might have a bigger or smaller effect;Accept mean not reliable
OR
3. Investigation only lasted 20 days;Experiment was not long enough
4. Can’t see what longer term effects are;
OR
5. Fall in blood glucose is small / numbers from graph;
6. Mice with inhibitor still have a large rise in blood glucose / so don’t know if differences significant;
Accept differences are due to chancePage 18
Feversham College
OR
7. No stats / SDs / SEs;
8. So don’t know if differences significant;
OR
9. Blood glucose could continue to fall;
10. which could be harmful;
OR
11. No group without yoghurt;
12. So cannot compare to other groups;2 max
[8]
Page 19

Feversham College
M5.(a) 0.22;1
(b) 1. Uptake in flask G much greater than in flask F;
2. Showing use of ATP in flask G;
3. Sodium ion concentration in flask G falls to zero;
4. Showing uptake against a concentration gradient;4
(c) 1. (Uptake of sodium ions occurring by) facilitated diffusion;
2. Equilibrium reached / sodium ion concentrations in solution and in cells the same;
2[7]
M6.(a) Any two of the following;
Concentration of enzyme
Volume of substrate solution
pHAllow same concentration of substrate
1
(b) Ratio between 4:1 and 5:1;;Initial rates incorrect but correctly used = 1 mark
2
(c) At 60 °C:
1. More kinetic energy;
2. More E–S complexes formed;Allow converse for 37 °C
2
(d) Different times:
1. Higher temperature / 60 °C causes denaturation of all of enzyme;Accept converse for 37 °C
2. Reaction stops (sooner) because shape of active site changed;Reject if active site on substrate
Different concentrations of product (at 60 °C)
3. Substrate still available (when enzyme denatured);
4. But not converted to product;4
[9]
Page 20
Feversham College
M7.(a) 0.32;Correct answer = 2 marksAccept 32% for 1 mark maxIncorrect answer but identifying 2pq as heterozygous = 1 mark
2
(b) 1. Mutation produced KDR minus / resistance allele;
2. DDT use provides selection pressure;
3. Mosquitoes with KDR minus allele more likely (to survive) to reproduce;
4. Leading to increase in KDR minus allele in population;4
(c) 1. Neurones remain depolarised;
2. So no action potentials / no impulse transmission;2
(d) 1. (Mutation) changes shape of sodium ion channel (protein) / of receptor (protein);
2. DDT no longer complementary / no longer able to bind;2
[10]
M8.(a) 1. Oxygen produced in light-dependent reaction;
2. The faster (oxygen) is produced, the faster the light-dependent reaction;2
(b) 35–36 (μmol O2 mg–1);;Correct difference at 500 μmol photons m–2 s–1 or incorrect difference but division by 4 shown = 1 mark
2
(c) At all light intensities, chloroplasts from mutant plants:
1. Have faster production of ATP and reduced NADP;
2. (So) have faster / more light-independent reaction;
3. (So) produce more sugars that can be used in respiration;
4. (So) have more energy for growth;
5. Have faster / more synthesis of new organic materials;Accept converse points if clear answer relates to non-mutant plants
4 max[8]
Page 21
Feversham College
Page 22

Feversham College
E1.Parts (a), (b)(ii) and (b)(iii) proved to be good discriminators.
(a) 70% of students scored full marks. Those who scored one mark often gave both alternatives of the second mark point. Weaker responses often lacked clarity; for example, ‘number of individuals’ and ‘different species within a population’. Students who failed to score often thought that the ‘size of the area’ and ‘standard deviation values’ are needed to calculate an index of diversity. It should be noted that although the specification requires students to be able to calculate one specific index of diversity, the mark scheme was amended so that other types of index of diversity could be credited.
(b) (i) Most students were aware that the purpose of the control fields was to ensure that the results are due to the herbicide, or not due to another factor. Those who failed to score typically gave stock How Science Works responses, which could apply to any investigation. These usually referred to comparing groups or results, ensuring that the results were due to the independent variable, or simply that these fields acted as controls. Students should be reminded of the need to relate their answers to the specific investigation or context outlined.
(ii) Half of students scored one mark and this was usually for appreciating that the herbicide killed more weeds, which led to less competition. However, the ability to explain the effect of high concentrations of herbicide, in terms of damage to the crop, proved to be a good discriminator. Unfortunately, many students did not read information in the introduction carefully enough. They thought that the herbicide killed insects, which meant that fewer crops were eaten. The weakest responses usually went no further than to describe the graph.
(iii) Just under half of students scored at least two marks. This was usually for ‘fewer habitats’ and ‘fewer food sources’. It was only the best responses that referred to ‘fewer plant species’ being present. Similarly, the ability to express these ideas discriminated well. Weaker responses often referred to ‘less food’ and ‘less plants’, which were not credited. As mentioned in part (i), some students wrongly thought that the herbicide killed insects, which directly led to a decrease in their index of diversity.
E3.(a) There were many good descriptions of the results in this part and three quarters scored all three marks.
(b) This part discriminated far more. About half of the students obtained all three marks. These students were able to link fibrosis to scar tissue, loss of elasticity of the lungs and the effects of this on inhalation and exhalation. Some students wrote about loss of surface area of the lungs and did not address changes in FEV.Quite a large number of students found it very hard to express their ideas clearly. It would be beneficial to students if they did not use the term ‘respiration’ when writing about breathing or ventilation of the lungs.
Page 23
Feversham College
E4.The examiners noted that many students appeared not to have read the main stem of the question carefully.
(a) Quite a large number wrote about amylase in yoghurt, rather than an inhibitor of amylase. About two thirds identified that Group A allowed the effect of the inhibitor to be seen. Very few noted that it also allowed the effect of yoghurt on its own to be seen. Quite a large number simply stated that the group ‘allowed for comparison’.
(b) 60% identified that different foods might affect glucose intake. Very few went on to identify that they could also contain different amounts of starch, the substrate of amylase. Quite a few simply wrote about ‘removing a variable’.
(c) A third of students obtained both marks. These students displayed a clear understanding of the digestion of starch, including the enzymes involved, the products produced and the impact of the inhibitor. About 40% failed to score, with the commonest error being a statement that starch is ‘broken down’ directly into glucose.
(d) The examiners had identified six different reasons why the results might not support the use of the inhibitor, based on the context of this question. Many students resorted to rote How Science Works answers about correlation not causing causation, or bias. Nearly half of students failed to score.
Page 24