viewpoint planning for quantitative coronary angiography · viewpoint planning for quantitative...
TRANSCRIPT

This is a pre-print of an article published in International Journal of Computer Assisted Radiology andSurgery (2018) 13:1159-1167. The final authenticated version is available online at:https://doi.org/10.1007/s11548-018-1763-1
Viewpoint Planning for Quantitative Coronary Angiography
Alexander Preuhs · Martin Berger · Sebastian Bauer · Thomas Redel ·Mathias Unberath · Stephan Achenbach · Andreas Maier
Received: 27 January 2018 / Accepted: 3 April 2018 / Published online: 1 June 2018
Abstract
Purpose: In coronary angiography the condition of
myocardial blood supply is assessed by analyzing 2-D
X-ray projections of contrasted coronary arteries. This
is done using a flexible C-arm system. Due to the X-
ray immanent dimensionality reduction projecting the
3-D scene onto a 2-D image, the viewpoint is critical to
guarantee an appropriate view onto the affected artery
and, thus, enable reliable diagnosis. In this work we in-
troduce an algorithm computing optimal viewpoints for
the assessment of coronary arteries without the need for
3-D models.
Methods: We introduce the concept of optimal view-
point planning solely based on a single angiographic
X-ray image. The subsequent viewpoint is computed
such that it is rotated precisely around a vessel, whileminimizing foreshortening.
Results: Our algorithm reduces foreshortening sub-
stantially compared to the input view and completely
eliminates it for 90◦ rotations. Rotations around iso-
centered foreshortening-free vessels passing the isocen-
ter are exact. The precision, however, decreases when
the vessel is off-centered or foreshortened. We evaluate
worst case boundaries, providing insight in the maximal
inaccuracies to be expected. This can be utilized to de-
sign viewpoints guaranteeing desired requirements, e.g.
a true rotation around the vessel of at minimum 30◦.
Alexander Preuhs · Mathias Unberath · Andreas MaierPattern Recognition Lab, Friedrich-Alexander UniversitatErlangen-Nurnberg, GermanyE-mail: [email protected]
Martin Berger · Sebastian Bauer · Thomas RedelSiemens Healthcare GmbH, Forchheim, Germany
Stephan AchenbachDepartment of Cardiology, Universitatsklinikum Erlangen,Germany
In addition a phantom study is performed investigating
the impact of input views to 3-D quantitative coronary
angiography (QCA).
Conclusion: We introduce an algorithm for optimal
viewpoint planning from a single angiographic X-ray
image. The quality of the second viewpoint — i.e. vessel-
foreshortening and true rotation around vessel — de-
pends on the first viewpoint selected by the physician,
however, our computed viewpoint is guaranteed to re-
duce the initial foreshortening. Our novel approach uses
fluoroscopy images only and, thus, seamlessly integrates
with the current clinical workflow for coronary assess-
ment. In addition it can be implemented in the QCA
workflow without increasing user-interaction, making
vessel-shape reconstruction more stable by standard-
izing viewpoints.
Keywords coronary angiography · C-arm · interven-
tional imaging · QCA · active vision · patient specific
imaging · foreshortening
1 Introduction
Cardiovascular diseases constitute a growing global health
problem. In the USA 31.1 % of all death in 2011 are cat-
egorized as related to cardiovascular disease, whereby
half of the incidents are accountable to Coronary Heart
Disease (CHD) [9]. The diagnosis of CHD is commonly
performed by evaluating the vessel shape of coronary
arteries after contrast agent injection. While many imag-
ing modalities allow for the assessment of vessel shape,
such as CT-Angiography or ultrasound, catheter-based
X-ray angiography using interventional C-arm cone-beam
systems is still considered the work-horse modality, as
it allows for diagnosis and treatment in a single session
and procedure. However, the 3-D vessel structure is to
2 Alexander Preuhs et al.
be assessed on 2-D projection images. This may lead to
false interpretations due to projective simplifications.
Thus, the proper selection of viewpoints is important.
Currently, viewpoints are determined as standard an-
gulations followed by iterations of manual adjustments,
causing unnecessary dose and contrast injection.
An approach to improve the 2-D-based assessment
is described by 3-D quantitative coronary angiography
(QCA), where two projection images — acquired within
the same heart phase — are used to perform a symbolic
3-D reconstruction of a vessel segment. The reconstruc-
tion is based on finding corresponding points on the cen-
terlines of the vessel and using a vessel segmentation to
approximate the lumen while enforcing consistency [3,
5,8,10].
However, the quality of the 3-D QCA is dependent
on the proper selection of the two input projections.
The X-ray projection inherently performs a dimension-
ality reduction, whereas most information is lost in the
depth direction. To preserve most of the relevant in-
formation needed for the assessment of the vessel, the
projection direction must be selected accordingly. Thus,
the second viewpoint should be rotated around the ves-
sel, which should be parallel to the detector in both
viewpoints [11].
The selection of good viewpoints is not trivial and
often a source of inaccuracy as the physician needs to
project the vessel without foreshortening and rotated
around the vessel that is to be assessed. Green et al.
compared the amount of foreshortening in physician se-
lected viewpoints with the viewpoints generated from
available 3-D coronary trees [6]. Summarizing the aver-
age vessel foreshortening was greater than 20% in 18%
of the cases and below 10% in 64% of the cases. The re-
sulting cases showed a foreshortening between 11% and
19%. A second source of error is the amount of rota-
tion around the vessel. Commercially available systems
measure the position of the C-arm using a latitude-
longitude spacing, where the latitude and longitude are
expressed as CRAN/CAUD and RAO/LAO angle (cf.
Fig. 1). The drawback of this equal angle systems is that
the great circle distance does not necessarily equal the
amount of rotation defined by RAO/LAO. For example,
consider a C-arm that is angulated by 45◦ in the CRAN
direction, an additional RAO rotation by 30◦ will result
in an overall rotation of only 21.09◦ measured between
the principal rays of the two views. Generally speak-
ing this effect vanishes for CRAN/CAUD = 0◦ and is
getting more intense for higher initial CRAN/CAUD
angulations.
Viewpoint planning for coronary angiography was
discussed in literature to obtain optimal viewpoints [7,
12] or create view-maps which can be used as a heuris-
tic look-up-table to identify angulations that are prob-
ably best suitable for a particular vessel segment [5,
15]. Fallavollita et al. presented the highly related con-
cept of ’desired view’ in angiographic interventions [4].
Based on a pre-operative CTA the physician only com-
municates the desired view whereas the C-arm position
is automatically provided by the system. This concept
reduces dose, as no unnecessary X-ray projections are
captured during the manual positioning process. This
concept was later applied to aortic interventions [14].
All previous methods rely on a 3-D reconstruction
of the vessel. However, the 3-D reconstruction itself re-
quires proper selection of input views or additional pre-
interventional imaging [13]. A highly related method
was proposed by Chrisriaens et al. [2]. The method does
not require a 3-D reconstruction, instead they deter-
mine optimal viewpoints for the determination of QCA
parameters based on two projection images acquired
with a Bi-plane system. The target vessel from which
the QCA parameters should be calculated is selected
on both projections, then the orientation of the vessel
is calculated and the optimal viewpoint is determined.
To the best of our knowledge, no method addresses the
determination of optimal viewpoints based on a single
2-D projection.
We introduce a viewpoint planning system that only
uses 2-D information from a single angiographic projec-
tion. The main purpose is to find a second optimal view
that can be used — together with the initial projec-
tion — for 3-D QCA. The second view is rotated around
the vessel by a given angle while minimizing vessel fore-
shortening. However, as depth information is missing,
the accuracy is dependent on the positioning of the ves-
sel within the first view, i.e. amount of foreshortening
and offset from the isocenter in view direction. To evalu-
ate the clinical applicability of the 2-D based viewpoint
planning an accuracy evaluation is performed, showing
the restrictions of the presented algorithm. The depen-
dency of the input views on the quality of 3-D QCA is
investigated with a phantom study in an interventional
environment.
2 Materials and Methods
At the beginning of this section, we introduce the con-
ventions used for describing the C-arm geometry. This
includes the description of the C-arm system itself and
the mathematics describing the acquisition of X-ray im-
ages. Thereafter, the proposed viewpoint planning al-
gorithm is described.

Viewpoint Planning for Quantitative Coronary Angiography 3
2.1 Geometry of a C-arm System
During X-ray acquisitions using a C-arm system, an X-
ray source radially emits photons in a cone-like profile
which are then registered at a detector. The geometry
describing the relation between a point x ∈ R3 within
that cone and its corresponding projection on the de-
tector u ∈ R2 can be described mathematically by a
perspective transformation.
A perspective transform can be expressed elegantly
in terms of matrix multiplication in the projective do-
main P. For world points (x, y, z)> ∈ R3 we will use the
homogeneous representation (x, y, z, w)> ∈ P3 where w
describes the homogeneous component being 1. Anal-
ogously, detector points (u, v)> ∈ R2 are described by
their homogeneous representation (u, v, w)> ∈ P2 with
w = 1.
In the projective space, we can assign two interpre-
tations for the same object. The vector (a, b, c, d)> ∈ P3
can either be interpreted as a point or a plane. The Eu-
clidean representation of the plane (a, b, c, d)> ∈ P3 is
defined by all points x, y, z ∈ R3 satisfying ax+by+cz+
d = 0. Analogously the vector (a, b, c)> ∈ P2 can be in-
terpreted as either a point or a line, where the Euclidean
interpretation of the line (a, b, c)> ∈ P2 is defined by all
points x, y ∈ R2 satisfying ax+ by + c = 0.
A special case is the representation of a line in P3.
Opposite to the previous geometric quantities there is
no direct description but we can construct the line as
the connection of two points or the intersection of two
planes. We call the connection of two geometric objects
“join” and the intersection “meet”. For P2 we define
the operations on the vectors a,b ∈ P2 as
meet(a,b) = join(a,b) = [a]×b =
0 −az ayaz 0 −ax−ay ax 0
b .
(1)
In the P3, the meet of two points or the join of two
planes is more challenging. An intuitive derivation can
be found in [1], we will only state the result of this
derivation. Both operations result in a line L defined
by 6 parameters (p, q, r, s, t, u)> that are commonly re-
ferred to as Plucker coefficients. They can be calculated
from a,b ∈ P3 by
meet(a,b) = join(a,b) = L =
p
q
r
s
t
u
=
azbw − awbzaybw − awbyaybz − azbyaxbw − awbxaxbz − azbxaxby − aybx
.
(2)
Again, a,b can either be two points or two planes. Anal-
ogously to P2 we can build up anti-symmetric matrices
(cf. Eq. (1)) to compute the meet between a line L ∈ P3
and a plane a ∈ P3 by
meet(L,a) = LK a =
0 −u −t −su 0 −r −qt r 0 −ps q p 0
a (3)
and the join between a line L ∈ P3 and a point b ∈ P3
by
join(L,b) = b> LL = b>
0 p −q r
−p 0 s −tq −s 0 u
−r t −u 0
. (4)
Note that Eq. (3) will result in a point and Eq. (4) de-
fines a plane. We refer to LK as the dual and LL as the
primal representation of a line. The presented opera-
tions enable the effortless description of a geometrical
scene in the context of a C-arm system, where we want
to switch between P3 and P2 corresponding to the world
coordinate system and the detector coordinate system.
A well known projective transformation describing
the relation between world points and their projection is
given by the 3×4 projection matrix P which originates
from the pinhole camera model. The matrix incorpo-
rates the whole geometry of the C-arm system.
A schematic drawing of a C-arm system is depicted
in Fig. 1. The main characterization is the movable
C-shaped detector-X-ray-source configuration, enabling
2-D X-ray projections with a high flexibility. The C-arm
can be rotated in CRAN/CAUD and RAO/LAO direc-
tion. The rotation can be incorporated into the projec-
tion matrix by right multiplication of rotation matrices.
If P0 corresponds to the C-arm orientation in the ini-
tial position (cf. Fig. 1) then a rotated view is described
by the angles RAO/LAO= α, CRAN/CAUD= β and a
detector rotation γ. The rotated view is calculated by
P(α, β, γ) = P0 Ry(γ) Rx(β) ,Rz(α) , (5)
where Re(·) ∈ R4×4 is the homogeneous representation
of a rotation matrix, describing the rotation around a
coordinate axis taking the angle as an argument. For
the computation of α and β from P we use the property
that the vector (P31, P32, P33)> points in the direction
of the principal ray. Thus, by normalizing that vector
we obtain nx, ny and nz which can be used to calculate
the angulation from P by
α = atan2(nx,−ny)180◦
πβ = arcsin(nz)
180◦
π(6)

4 Alexander Preuhs et al.
Fig. 1 Schematic drawing ofthe C-arm geometry. The co-ordinate axes correspond tothe isocenter of the C-armsystem. The C-arm systemis shown in default positionand can be rotated along thedrawn rotation axes i.e. rightanterior oblique (RAO) andleft anterior oblique (LAO)as well as cranial (CRAN)and caudal (CAUD). In addi-tion a detector rotation γ canbe performed. For coronaryinterventions, the patient islying with the head near theisocenter and the feet point-ing in the negative z direc-tion.
CA
UD
CR
AN y
zx
LAO
RAO
γ
In the remainder of this manuscript we will mostly talk
about projection matrices, however, using Eq. (6) we
can easily transform the projection matrix to angles,
which could be used to steer a C-arm. Further note
that we do not explicitly compute the image rotation
γ, as this is typically not performed in the procedures
and is always kept at γ = 0◦ or γ = 90◦.
2.2 2-D-Based Viewpoint Planning
We introduce a method for viewpoint planning based
on a single 2-D angiographic X-ray image. The second
viewpoint is expected to be rotated around the vessel
by a physician determined angle and with the vessel
being projected without foreshortening.
In the simplest case, the target vessel is in the C-arm isocenter and not foreshortened in the initial X-
ray projection. While this assumption will almost never
be satisfied in clinical practice, it is a good starting
point to grasp on the general idea. First, we estimate
the rotation axis of our transformation. In this very
simple case, assuming a rotation axis that is simply
the backprojection of the vessel to the isocenter, will
produce exact results as we know that the vessel of
interest is a) in the isocenter and b) not foreshortened.
Thus, we can use this axis and rotate the gantry around
it.
However, in clinical practice the target vessel is not
necessarily in the isocenter, nor is it projected without
foreshortening. This makes an exact determination of
the rotation axis infeasible as depth cannot be recovered
from a single image, but we can make some adjustments
to perform substantially better than by just assuming
a centered, foreshortening-free vessel. Fig. 2 depicts the
steps that build up our workflow which are explained
in the following subsections.
2.2.1 Principal Ray Alignment
The starting point of the algorithm is a 2-D projec-
tion image of contrasted vessels, and the corresponding
projection matrix P1. The physician selects the tar-
get vessels by two clicks c1, c2 ∈ P2 defining a line
l = join(c1, c2). Vessels within the isocenter that are
not foreshortened are already well aligned, making the
principal ray alignment dispensable. However, in most
cases, this will not be the case.
Assume that the vessel is off-centered e.g. 5 mm
parallel to the detector. In this case, due to the X-
ray cone, we already observe the vessel from an ori-
entation rotated compared to the principal ray. This
rotation is what we seek to compensate with a prin-
cipal ray alignment. Therefore, we first calculate the
backprojection-plane of the target vessel eL and com-
pare its normal to that of a second plane eR which is
constructed by the backprojection of c1 and c2 as well
as the source position. With pi1 denoting the i−th row
of the projection matrix P1, we can interpret each pi1as a plane, each passing the source position. Therefore,
we can compute the source position s ∈ P3 simply by
s = meet(meet(p11,p
21),p3
1). The two planes are then
calculated by
eL = P+>1 l eR = join(join(P+>
1 c1,P+>1 c2), s) , (7)
note that eL and eR are equal, if the vessel is in the
isocenter, but will differ when the vessel is translated.
The angle α between the planes eL and eR can simply
be calculated from the angle between their normals,
e.g. by exploiting the definition of the scalar product.
In the next step we use the property, that we can right-
multiply rotation matrices R ∈ R4×4 to P1. The result-
ing projection matrix corresponds to a virtual interme-
diate view rotated by R. Therefore, we transform the

Viewpoint Planning for Quantitative Coronary Angiography 5
Line ondetectorandprojectionmatrix
Principalrayalign-ment
Isocenterrotation
Isocenteroffsetcorrec-tion
Second viewpointSecond viewpoint
P1, l
P1,align
r
P2
P2 tP2
P1, l
Fig. 2 Flowchart showing the proposed viewpoint planning algorithm. The input is a line defined on the detector. A principalray alignment is performed, creating a virtual intermediate view. The isocenter rotation is then applied to the virtual inter-mediate view. The algorithm is finished after the calculation of an additional translation compensating for an isocenter offset.If a translation cannot be performed, e.g. due to limitations of the system, the isocenter offset correction can be skipped.
rotation around an axis r by α to a rotation matrix Rr,α
using a homogeneous version of the Rodriguez formula.
The axis r is the orientation of the backprojected vessel,
which will be discussed in more detail in the following
subsection (cf. Eq. (10)). This is then right-multiplied
to P1 in order to obtain the intermediate view
P1,align = P1Rr,α . (8)
As depicted in Fig. 2, the aligned intermediate view
P1,align will be propagated to the ”isocenter rotation”
module.
2.2.2 Isocenter Rotation
The goal is now to rotate around the vessel segment
as exact as possible using the intermediate view. The
rotation axis is the backprojection of the line l defined
on the detector. Note that the backprojection opera-
tion basically solves Px = y with x denoting world
points and y detector points. Since this equation is not
uniquely solvable we use the pseudo-inverse P+ to cal-
culate x. If the principle ray of the system intersects the
coordinate origin, then the space of solutions to P+y
corresponds to a plane parallel to the detector. This
justifies our assumption, that we can use the backpro-
jection of the line l as rotation axis. We can interpret
[l]× as a tensor which is therefore transformed as such.
With the backprojection P+1 being the desired trans-
formation, the backprojection of the line l is computed
by
LK = P+1 [l]×P+>
1 . (9)
The result LK is the dual representation of the line L
that contains the Plucker coordinates in its respective
entries (cf. Eq. (3)), thus we can simply extract L from
LK . The direction of L can be found by the intersection
with the plane at infinity π∞ = (0, 0, 0, 1)>, which will
be a point r ∈ P3 at infinity
r = meet(L, π∞) . (10)
The first three components of r denote the direction
of L, which is the rotation axis we aim to compute.
Finally, we create the second viewpoint P2 by rotating
around r by ξ, again using Rodriguez formula
P2 = P1,align Rr,ξ . (11)
2.2.3 Isocenter Offset Correction
The input of this algorithm is P2 described in the pre-
vious sections. To compute P2 we have rotated around
an isocenter, that did not correspond to the center of
the vessel. In fact, we cannot know the true center of
rotation, i.e. the center of the vessel segment, as 3-D re-
construction of the vessel is impossible from the single
frame only. Yet, we can minimize the difference between
the true isocenter and the isocenter of rotation. Doing
so results in a translation t that can be realized by ei-
ther a table movement or a C-arm translation. The goal
of the offset correction, is that the central ray of P1,align
is coincident with the backprojection-plane of the ves-
sel eL. Therefore, we calculate the distance between eLand the central ray of P1,align. With the plane and line
being parallel by construction, this distance is equal
to the distance between eL and the source position of
P1,align. We denote the source position of P1,align by

6 Alexander Preuhs et al.
Fig. 3 Heatmap showingthe maximal foreshorteningin the second view for vesselshaving an initial foreshorten-ing of ν = 30◦.
5 20 35 50 65 80 95 110 125 140 155 170 185 200
Radial Translation r from Isocenter in mm at ν1 = 30◦
90
75
60
45
30
15
Des
ired
Rot.ξ
0 0 0 0 0 0 0 0 0 0 0 0 0 0 0 0 0 0 0 0 0 0 0 0 0 0 0 0 0 0 0 0 0 0 0 0 0 0 0 0
2 2 2 2 2 2 3 3 3 3 3 3 3 3 3 3 3 3 3 3 3 3 3 3 3 3 3 3 3 3 3 3 3 3 3 3 3 3 3 3
5 5 5 5 5 5 5 5 5 5 5 5 5 5 5 5 5 5 5 5 5 5 5 5 5 5 5 5 5 5 5 5 5 5 5 5 5 5 5 5
7 7 7 7 7 7 7 7 7 7 7 7 7 7 7 7 7 8 8 8 8 8 8 8 8 8 8 8 8 8 8 8 8 8 8 8 8 8 8 8
10 10 10 10 10 10 10 10 10 10 10 10 10 10 10 10 10 10 10 10 10 10 10 10 10 10 10 10 10 10 10 10 10 10 10 10 10 10 10 10
12 12 12 12 12 12 12 12 12 12 12 12 12 12 12 12 12 12 12 12 12 12 12 12 12 12 13 13 13 13 13 13 13 13 13 13 13 13 13 13
14 14 14 14 14 14 15 15 15 15 15 15 15 15 15 15 15 15 15 15 15 15 15 15 15 15 15 15 15 15 15 15 15 15 15 15 15 15 15 15
17 17 17 17 17 17 17 17 17 17 17 17 17 17 17 17 17 17 17 17 17 17 17 17 17 17 17 17 17 17 17 17 17 17 17 18 18 18 18 18
19 19 19 19 19 19 19 19 19 19 19 19 19 19 19 19 19 19 19 19 19 19 19 19 19 19 19 19 19 19 19 20 20 20 20 20 20 20 20 20
21 21 21 21 21 21 21 21 21 21 21 21 21 21 21 21 21 21 21 21 21 21 21 21 21 21 21 21 21 22 22 22 22 22 22 22 22 22 22 22
23 23 23 23 23 23 23 23 23 23 23 23 23 23 23 23 23 23 23 23 23 23 23 23 23 23 23 23 23 23 23 24 24 24 24 24 24 24 24 24
24 24 24 24 24 24 24 24 24 24 24 24 24 24 24 24 24 25 25 25 25 25 25 25 25 25 25 25 25 25 25 25 25 26 26 26 26 26 26 26
26 26 26 26 26 26 26 26 26 26 26 26 26 26 26 26 26 26 26 26 26 26 26 26 26 26 27 27 27 27 27 27 27 27 27 27 27 27 28 28
27 27 27 27 27 27 27 27 27 27 27 27 27 27 27 27 27 27 27 27 28 28 28 28 28 28 28 28 28 28 28 28 28 28 29 29 29 29 29 29
28 28 28 28 28 28 28 28 28 28 28 28 28 28 28 28 28 28 29 29 29 29 29 29 29 29 29 29 29 29 29 29 30 30 30 30 30 30 30 30
29 29 29 29 29 29 29 29 29 29 29 29 29 29 29 29 29 29 29 29 30 30 30 30 30 30 30 30 30 30 30 30 30 31 31 31 31 31 31 31
30 30 30 30 30 30 30 30 30 30 30 30 30 30 30 30 30 30 30 30 30 30 30 30 30 31 31 31 31 31 31 31 31 31 31 31 32 32 32 32
30 30 30 30 30 30 30 30 30 30 30 30 30 30 30 30 30 30 30 30 31 31 31 31 31 31 31 31 31 31 31 31 32 32 32 32 32 32 32 32
0
6
12
18
24
30
Max.
Fore
shor
tenin
gin
2nd
Vie
wν 2
sa = meet(meet(p11,align,p
21,align),p3
1,align) and calculate
the distance d by
d =eTL√
e2L1
+ e2L2
+ e2L3
sa√s2a1 + s2a2 + s3a1
. (12)
Note that Eq. (12) is simply the distance between a
point and a plane. The translation t is then in the nor-
mal direction of eL scaled by −d.
3 Evaluation and Results
Our viewpoint planning algorithm uses a single 2-D an-
giographic image only to optimally integrate with the
current clinical workflow and we evaluate the method
accordingly. We identify the reliability of calculated view-
points based on different inputs to the method, and
state results for both the complete and the rotation-
only method. In addition, we implemented the proposed
algorithm on a C-arm system. Using a phantom of the
left coronary artery tree (LCA) we investigate the im-
pact of input views to the quality of QCA.
3.1 Accuracy of 2-D Viewpoint Planning
The first important quantity on view selection for pro-
viding high quality QCA is the true rotation around the
vessel φ = ξ + ε with the desired rotation ξ and some
unwanted rotation ±ε. Typically an additional rotation
might not always harm the result but especially when a
minimum angulation must be fulfilled, a high precision
is important. The second quantity is the foreshortening
of the vessel within each of the two views ν1 and ν2. The
physician is responsible for ν1, whereas our algorithms
can only influence ν2. In our evaluation we inspect the
angular precision measured in ε and the foreshortening
ν2 based on given desired rotations ξ and different po-
sitions of the vessel segment in the initial frame that
determines ν1.
Covering all possible line configurations seems im-
practical, and we decide to parameterize the vessel seg-
ment position using an offset from the origin r and fore-
shortening ν1. Based on such a line configuration we
perform the proposed algorithm. Since the true scene is
known we can then calculate ε and ν2. However, a line
is not uniquely defined by ν1 and an offset r as the off-
set could e.g. be parallel or orthogonal to the detector.
Therefore, the stated ε and ν2 represent the worst case
foreshortening and angulation inaccuracy over all lines
having a certain offset r and foreshortening ν1.
3.1.1 Foreshortening
The impact of different line configurations on the fore-
shortening in the second view is depicted in Fig. 3. A
very practical aspect is the elimination of foreshorten-
ing when requesting a 90◦ rotation. This elimination is
independent on the positioning of the vessel and can
therefore be guaranteed. In general, low ν2 values are
Viewpoint Planning for Quantitative Coronary Angiography 7
10 20 30 40 50 60 70 80 90
Desired Rot. ξ at r = 25 mm (skipped t)
0
2
4
6
8
10
12
14
Dev
iati
onfr
omξ
(ε)
ν1 at 30 ◦
ν1 at 20 ◦
ν1 at 10 ◦
ν1 at 0 ◦
10 20 30 40 50 60 70 80 90
Desired Rot. ξ at r = 25 mm
0
2
4
6
8
10
12
14
Dev
iati
onfr
omξ
(ε)
ν1 at 30 ◦
ν1 at 20 ◦
ν1 at 10 ◦
ν1 at 0 ◦
10 20 30 40 50 60 70 80 90
Desired Rot. ξ at r = 75 mm (skipped t)
0
2
4
6
8
10
12
14
Dev
iati
onfr
omξ
(ε)
ν1 at 30 ◦
ν1 at 20 ◦
ν1 at 10 ◦
ν1 at 0 ◦
10 20 30 40 50 60 70 80 90
Desired Rot. ξ at r = 75 mm
0
2
4
6
8
10
12
14
Dev
iati
onfr
omξ
(ε)
ν1 at 30 ◦
ν1 at 20 ◦
ν1 at 10 ◦
ν1 at 0 ◦
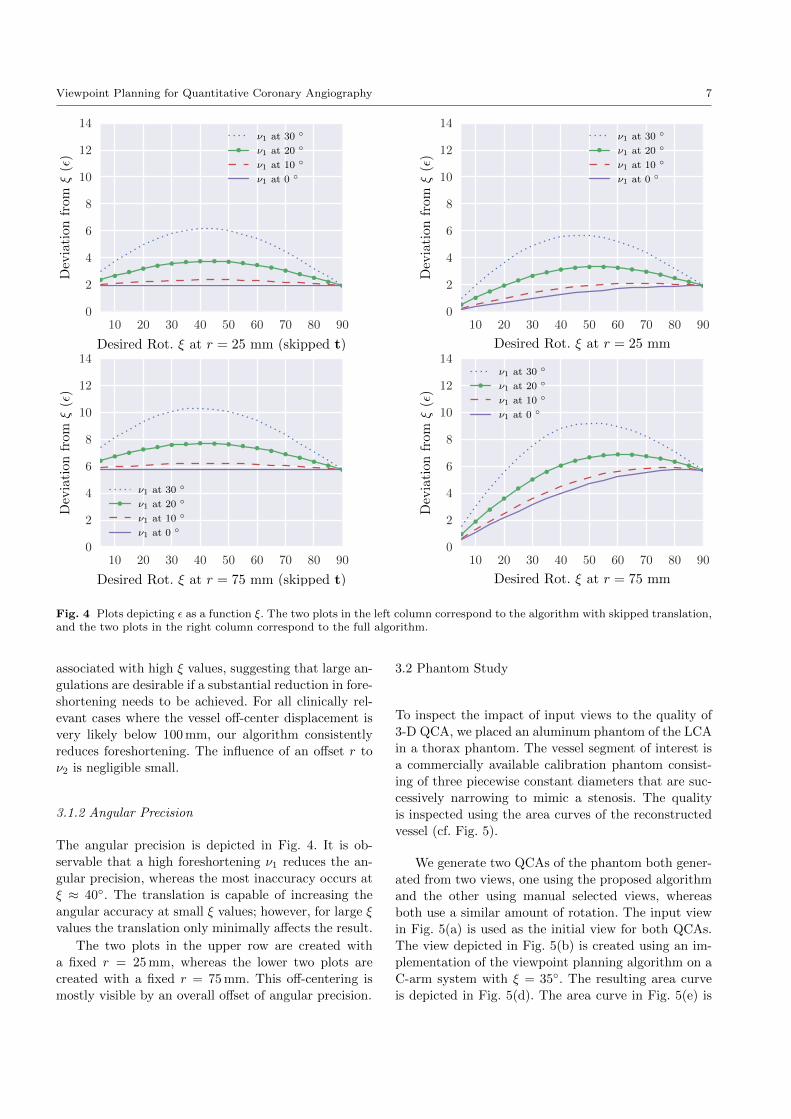
Fig. 4 Plots depicting ε as a function ξ. The two plots in the left column correspond to the algorithm with skipped translation,and the two plots in the right column correspond to the full algorithm.
associated with high ξ values, suggesting that large an-
gulations are desirable if a substantial reduction in fore-
shortening needs to be achieved. For all clinically rel-
evant cases where the vessel off-center displacement is
very likely below 100 mm, our algorithm consistently
reduces foreshortening. The influence of an offset r to
ν2 is negligible small.
3.1.2 Angular Precision
The angular precision is depicted in Fig. 4. It is ob-
servable that a high foreshortening ν1 reduces the an-
gular precision, whereas the most inaccuracy occurs at
ξ ≈ 40◦. The translation is capable of increasing the
angular accuracy at small ξ values; however, for large ξ
values the translation only minimally affects the result.
The two plots in the upper row are created with
a fixed r = 25 mm, whereas the lower two plots are
created with a fixed r = 75 mm. This off-centering is
mostly visible by an overall offset of angular precision.
3.2 Phantom Study
To inspect the impact of input views to the quality of
3-D QCA, we placed an aluminum phantom of the LCA
in a thorax phantom. The vessel segment of interest is
a commercially available calibration phantom consist-
ing of three piecewise constant diameters that are suc-
cessively narrowing to mimic a stenosis. The quality
is inspected using the area curves of the reconstructed
vessel (cf. Fig. 5).
We generate two QCAs of the phantom both gener-
ated from two views, one using the proposed algorithm
and the other using manual selected views, whereas
both use a similar amount of rotation. The input view
in Fig. 5(a) is used as the initial view for both QCAs.
The view depicted in Fig. 5(b) is created using an im-
plementation of the viewpoint planning algorithm on a
C-arm system with ξ = 35◦. The resulting area curve
is depicted in Fig. 5(d). The area curve in Fig. 5(e) is

8 Alexander Preuhs et al.
(a) RAO: 27, CAUD: 11. (b) LAO: 6, CAUD: 30. (c) RAO: 15, CRAN: 13.
(d) QCA using 5(a) and 5(b) as inputs. (e) QCA using 5(a) and 5(c) as inputs.
Fig. 5 Top row: Input views for QCA generation. The initial view (a), a second view generated using the proposed viewpointplanning with ξ = 35◦ (b), and a manual selected second view (c). Bottom: Area curves deduced from a 3-D QCA usingtwo input views. The curves are exported from the clinical report generated with the 3-D QCA tool syngo IZ3D (SiemensHealthcare GmbH, Forchheim).
generated using the manually selected view depicted in
Fig. 5(c).
As the wire phantom is piecewise constant and ra-
dial symmetric, it is not to be expected that constant
regions are strongly view dependent, however, in the
transitions to narrower or brighter diameters a view de-
pendence is observable. Using the viewpoint planning
the transitions (cf. Fig. 5(d) at 9.1, 20 and 31.3 mm) are
much sharper and well defined, whereas the manually
selected views produce a smearing of the transitions (cf.
Fig. 5(d) at 11.2, 23 and 33 mm).
4 Outlook and Discussion
Our accuracy evaluation states the worst possible out-
come when our planning algorithm is used. The largest
errors typically occur if the vessel is translated in the
viewing direction as a displacement that cannot eas-
ily be recovered from a single projection image. Rota-
tions around vessels that are translated parallel to the
detector are achieved with much higher precision and,
in the best case, even exact. However, using the worst
case experiments, we can ensure certain minimum re-
quirements. For instance, consider a required minimum
rotation around the segment of ξ = 30◦, e.g. to ensure
3-D reconstruction of acceptable quality: if the physi-
cian can ensure that the target vessel is foreshortened
by less then 20◦ and that it is located within a 25 mm
radius around the isocenter, then we can accurately cal-
culate the required transformation. An angulation of
33◦ is sufficient to ensure a 30◦ rotation. When transla-
tion is not possible, the 30◦ angulation is ensured with
a 34◦ rotation. These minimum requirements are often
important in clinical practice, as the C-arm can be re-
stricted in its movements either due to the patient or
the anatomy, making a simple 90◦ rotation infeasible.
Our phantom study showed that changes in the di-
ameter are smeared if the view selection is not taken
carefully. This comes in favor to the results presented
by Sato et al. [11]. Particularly, in a real clinical setup
these inaccuracies can limit the reliability of QCA es-
pecially for small stenosis.
A problem not yet addressed by the algorithm is the
overlapping of vessels as well as vessels leaving the field-
of-view. Possible improvements for overcoming these
drawbacks could be the extension of the method with
prior knowledge, e.g. by favoring viewpoints that are
empirically known to produce good results (see for ex-
ample [5,15]).
To conclude, we introduced a method for viewpoint
planning in coronary angiography based on a single
2-D image. If two or more images have been acquired,
making a 3-D centerline reconstruction possible, exact
methods — e.g. [2,5,7] — will outperform the proposed

Viewpoint Planning for Quantitative Coronary Angiography 9
planning system. The proposed method is therefore of
advantage if no 3-D information is available, or can-
not be utilized due to a missing system-patient reg-
istration. Our algorithms allow personalized planning
of standardized views in conventional angiography that
could translate to reduced dose to the patient and oper-
ating team while promoting improved quality for QCA.
Disclaimer The concepts and information presented
in this paper are based on research and are not com-
mercially available.
Conflict of interest S. Achenbach, M. Unberath and
A. Maier have no conflict of interest. A. Preuhs is funded
by Siemens Healthcare GmbH, Forchheim Germany. M.
Berger, S. Bauer and T. Redel are employees of Siemens
Healthcare GmbH, Forchheim Germany.
Informed consent This article does not contain pa-
tient data.
References
1. J. Blinn. A Homogeneous Formulation for Lines in 3Space. In Siggraph 1977, pages 237–241. Association forComputing Machinery, Inc., 1977.
2. J. Chrisriaens, R. Walle, and I. Lemahieu. A Simple De-termination System For Optimal Angiographic Viewing.In Conf. on Image Processing, volume 2, pages 327–330,2001.
3. D. Delaere, C. Smets, P. Suetens, G. Marchal, andF. Van de Werf. Knowledge-based system for the three-dimensional reconstruction of blood vessels from two an-giographic projections. MBEC, 29(6):NS27–NS36, 1991.
4. P. Fallavollita, A. Winkler, S. Habert, P. Wucherer,P. Stefan, R. Mansour, R. Ghotbi, and N. Navab.Desired-view controlled positioning of angiographic c-arms. In MICCAI, pages 659–666. Springer, 2014.
5. J. Garcia, B. Movassaghi, I. Casserly, A. Klein, S. Chen,J. Messenger, A. Hansgen, O. Wink, B. Groves, andJ. Carroll. Determination of optimal viewing regions forX-ray coronary angiography based on a quantitative anal-ysis of 3D reconstructed models. Cardiovascular Imag-ing, 25(5):455–462, 2009.
6. N. Green, S. Chen, A. Hansgen, J. Messenger, B. Groves,and J. Carroll. Angiographic views used for per-cutaneous coronary interventions: A three-dimensionalanalysis of physician-determined vs. computer-generatedviews. Catheterization and Cardiovascular Interven-tions, 64(4):451–459, 2005.
7. S. Chen and J. Carroll. 3-D reconstruction of coronary ar-terial tree to optimize angiographic visualization. Tans-actions on Medical Imaging, 19(4):318–336, 2000.
8. I. Liu and Y. Sun. Fully automated reconstructionof three-dimensional vascular tree structures from twoorthogonal views using computational algorithms andproductionrules. Optical Engineering, 31(10):2197–2208,1992.
9. D. Mozaffarian, E. Benjamin, A. Go, D. Arnett, M.Blaha, M. Cushman, ... and V. Howard Executive Sum-mary: Heart Disease and Stroke Statistics 2015 Update.Circulation, 131(4):434–441, 2015.
10. C. Pellot, M. Sigelle, P. Horain, and P. Peronneau. A3D Reconstruction of Vascular Structures from Two X-Ray Angiograms Using an Adapted Simulated AnnealingAlgorithm. TMI, 13(1):48–60, 1994.
11. Y. Sato, T. Araki, M. Hanayama, H. Naito, andS. Tamura. A viewpoint determination system for steno-sis diagnosis and quantification in coronary angiographicimage acquisition. TMI, 17(1):121–37, 1998.
12. S. Tu, G. Koning, W. Jukema, and J. H. Reiber. As-sessment of obstruction length and optimal viewing an-gle from biplane x-ray angiograms. The int. journal ofcardiovascular imaging, 26(1):5–17, 2010.
13. M. Unberath, O. Taubmann, M. Hell, S. Achenbach, andA. Maier. Symmetry, Outliers, and Geodesics in Coro-nary Artery Centerline Reconstruction from RotationalAngiography. Medical Physics, 44(11):5672–85, 2017.
14. S. Virga, V. Dogeanu, P. Fallavollita, R. Ghotbi,N. Navab, and S. Demirci. Optimal c-arm positioningfor aortic interventions. In BVM 2015, pages 53–58.Springer, 2015.
15. O. Wink, R. Kemkers, S. Chen, and J. D. Carroll. Coro-nary intervention planning using hybrid 3d reconstruc-tion. In MICCAI, pages 604–611. Springer, 2002.