vii. d emographic data students and ......vii. demographic data – students and educational...
TRANSCRIPT

VII. DEMOGRAPHIC DATA – STUDENTS AND EDUCATIONAL PERSONNEL
75
BACKGROUND
For the past three decades a primary focus of the state and many local governments has been the impact of Nevada’s explosive growth. The effect of this growth upon government services has been significant, and the impact of student growth upon public schools is an important part of that overall picture. From 1970 to 2002, Nevada’s school age population has grown by 244 percent, leading the western states and the nation. For the past 15 years, growth in student enrollment in Nevada public schools has averaged about 5 percent a year, nearly four times the national average. Of the Western states, only Arizona has experienced similar growth. Most of this increase is fueled by the two largest school districts, Clark and Washoe, with Clark outpacing most of the districts nationwide. Part of that growth involves an increase in ethnic minority student populations. The number of students classified as English Language Learners has increased over 325 percent in the last ten years. Over 95 percent of Nevada’s limited English proficient students speak Spanish as their first language. The National Center for Education Statistics (NCES) has issued projections for the next decade that show Nevada continuing to lead the nation in enrollment growth, with a significant increase in the number of high school students – a projected increase of approximately 38 percent, the highest in the country. Such growth will have a profound impact upon both district staffing and infrastructure, especially in Clark County. At the same time, many rural districts have seen declining enrollments that, in some cases, have had a negative impact on staffing and programs. It is likely this that pattern will continue into the near future in many of the rural districts. In addition, there are several areas of concern with regard to Nevada’s student population. The state’s dropout rate is one of the highest in the country. It also has a 73.5 percent high school completion rate; only Arizona is lower among the western states.

DEMOGRAPHIC DATA – STUDENTS AND EDUCATIONAL PERSONNEL
76
STUDENTS—ENROLLMENT GROWTH
Enrollment Growth in Nevada School Years 1990-91 Through 2004-05
25,000
75,000
125,000
175,000
225,000
275,000
1990
-91
1991
-92
1992
-93
1993
-94
1994
-95
1995
-96
1996
-97
1997
-98
1998
-99
1999
-00
2000
-01
2001
-02
2002
-03
2003
-04
2004
-05Ye a r
CLARKWASHOEALL OTHER
CLARK WASHOE ALL OTHER TOTAL
1990-91 121,984 38,466 40,866 201,316
1991-92 129,233 40,028 42,549 211,810
1992-93 136,188 42,061 44,597 222,846
1993-94 145,327 43,715 46,758 235,800
1994-95 156,348 45,752 48,647 250,747
1995-96 166,788 47,572 50,681 265,041
1996-97 179,106 49,671 53,354 282,131
1997-98 190,822 51,205 54,594 296,621
1998-99 203,777 52,813 54,473 311,063
1999-00 217,526 54,508 53,576 325,610
2000-01 231,655 56,268 52,783 340,706
2001-02 245,659 58,532 52,623 356,814
2002-03 256,574 60,384 52,540 369,498
2003-04 270,529 62,103 52,782 385,414
2004-05 283,233 63,698 54,280 401,211
Source: Research Bulletin, 2004, Nevada Department of Education.

DEMOGRAPHIC DATA – STUDENTS AND EDUCATIONAL PERSONNEL
77
STUDENTS—ENROLLMENT
ESTIMATED ENROLLMENT IN PUBLIC SCHOOLS
WESTERN STATES COMPARISON 2003 Above Nevada
Below Nevada
Source: U.S. Department of Education, National Center for Education Statistics, Common Core of Data Database 2002-2003.
WashingtonEnrollment: 1,014,798
Montana Enrollment:
149,995 Oregon
Enrollment: 554,071
Idaho Enrollment:
248,515 Wyoming Enrollment:
88,116
California Enrollment: 6,356,348
Nevada Enrollment:
369,478 Utah Enrollment:
489,072 Colorado Enrollment:
751,862
Arizona Enrollment:
937,755 New Mexico Enrollment:
320,234

DEMOGRAPHIC DATA – STUDENTS AND EDUCATIONAL PERSONNEL
78
STUDENTS—ENROLLMENT GROWTH
1%
0%
27%
58%
18%
18%
224%
-17%
35%
41%
38%
117%
-50% 0% 50% 100% 150% 200% 250%
Arizona
California
Colorado
Idaho
Montana
Nevada
New Mexico
Oregon
Utah
Washington
Wyoming
United States
Percent Change in School Age Population Nevada and Western States
1970 to 2002
Source: U.S. Department of Commerce, Bureau of the Census, Current Population Reports, 2003 Digest of Education Statistics, Table 17.
DEMOGRAPHIC DATA – STUDENTS AND EDUCATIONAL PERSONNEL
79
STUDENTS—ENROLLMENT PROJECTIONS
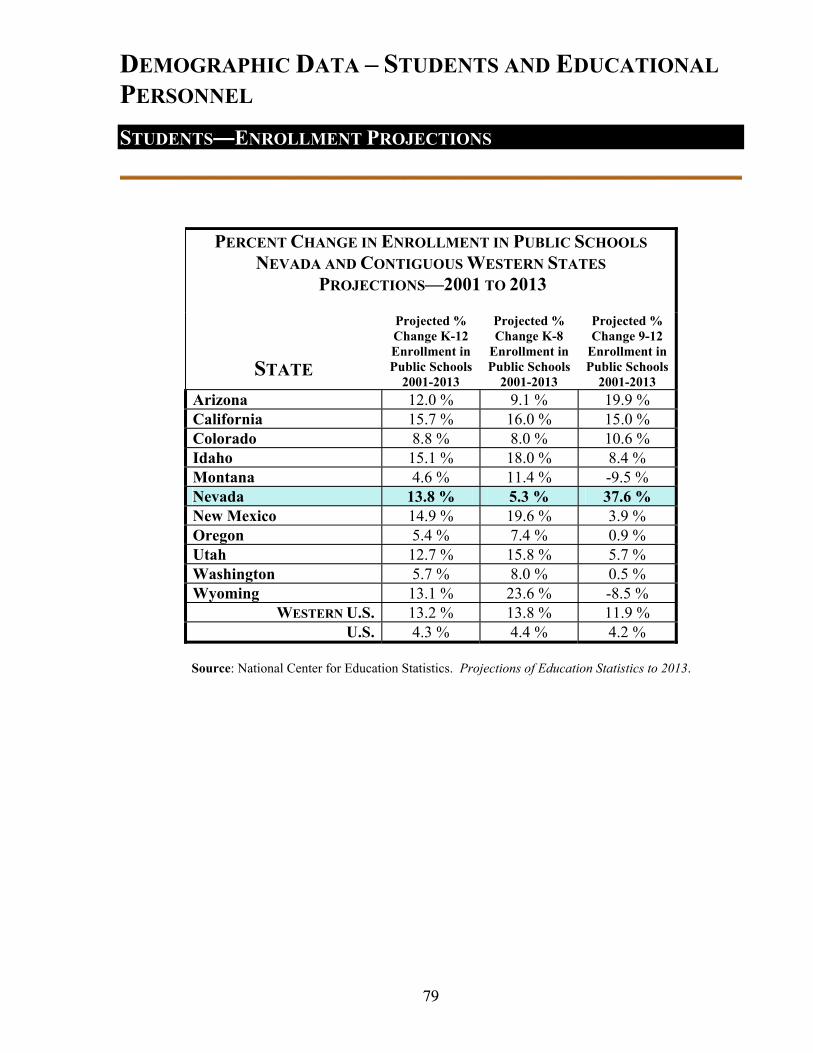
Source: National Center for Education Statistics. Projections of Education Statistics to 2013.
PERCENT CHANGE IN ENROLLMENT IN PUBLIC SCHOOLS NEVADA AND CONTIGUOUS WESTERN STATES
PROJECTIONS—2001 TO 2013
STATE
Projected % Change K-12 Enrollment in Public Schools
2001-2013
Projected % Change K-8
Enrollment in Public Schools
2001-2013
Projected % Change 9-12
Enrollment in Public Schools
2001-2013 Arizona 12.0 % 9.1 % 19.9 % California 15.7 % 16.0 % 15.0 % Colorado 8.8 % 8.0 % 10.6 % Idaho 15.1 % 18.0 % 8.4 % Montana 4.6 % 11.4 % -9.5 % Nevada 13.8 % 5.3 % 37.6 % New Mexico 14.9 % 19.6 % 3.9 % Oregon 5.4 % 7.4 % 0.9 % Utah 12.7 % 15.8 % 5.7 % Washington 5.7 % 8.0 % 0.5 % Wyoming 13.1 % 23.6 % -8.5 %
WESTERN U.S. 13.2 % 13.8 % 11.9 % U.S. 4.3 % 4.4 % 4.2 %
DEMOGRAPHIC DATA – STUDENTS AND EDUCATIONAL PERSONNEL
80
STUDENTS—PUBLIC SCHOOL ENROLLMENT
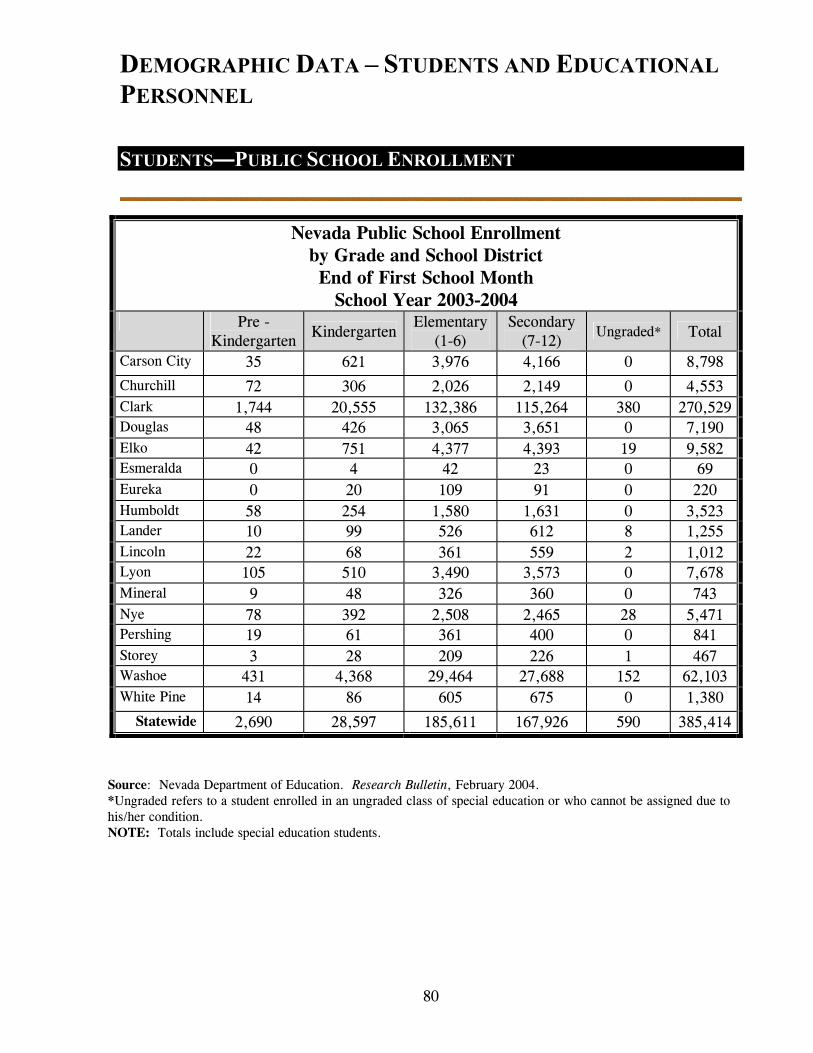
Source: Nevada Department of Education. Research Bulletin, February 2004. *Ungraded refers to a student enrolled in an ungraded class of special education or who cannot be assigned due to his/her condition. NOTE: Totals include special education students.
Nevada Public School Enrollment by Grade and School District End of First School Month
School Year 2003-2004 Pre -
Kindergarten Kindergarten Elementary
(1-6) Secondary
(7-12) Ungraded* Total
Carson City 35 621 3,976 4,166 0 8,798
Churchill 72 306 2,026 2,149 0 4,553 Clark 1,744 20,555 132,386 115,264 380 270,529 Douglas 48 426 3,065 3,651 0 7,190 Elko 42 751 4,377 4,393 19 9,582 Esmeralda 0 4 42 23 0 69 Eureka 0 20 109 91 0 220 Humboldt 58 254 1,580 1,631 0 3,523 Lander 10 99 526 612 8 1,255 Lincoln 22 68 361 559 2 1,012 Lyon 105 510 3,490 3,573 0 7,678 Mineral 9 48 326 360 0 743 Nye 78 392 2,508 2,465 28 5,471 Pershing 19 61 361 400 0 841 Storey 3 28 209 226 1 467 Washoe 431 4,368 29,464 27,688 152 62,103 White Pine 14 86 605 675 0 1,380
Statewide 2,690 28,597 185,611 167,926 590 385,414

DEMOGRAPHIC DATA – STUDENTS AND EDUCATIONAL PERSONNEL
81
STUDENTS—PRIVATE SCHOOL ENROLLMENT
Source: Nevada Department of Education Research Bulletin, February 2004. *Ungraded refers to a student enrolled in an ungraded class of special education or who cannot be assigned to his/her condition. NOTE: Totals include special education students.
Nevada Private School Enrollment By Grade and School District End of First School Month
School Year 2003-2004
Kindergarten Elementary
(1-6) Secondary
(7-9) Secondary
(10-12) Ungraded* Total
Carson City 83 308 85 11 0 487 Churchill 23 75 8 2 0 108 Clark 2,474 6,949 2,410 1,523 0 13,356 Douglas 33 53 12 33 0 131 Elko 7 44 26 17 0 94 Esmeralda 0 0 0 0 0 0 Eureka 0 0 0 0 0 0 Humboldt 0 0 0 0 0 0 Lander 0 0 0 0 0 0 Lincoln 0 0 0 0 0 0 Lyon 5 20 14 27 0 66 Mineral 0 0 0 0 0 0 Nye 19 99 38 10 0 166 Pershing 0 0 0 0 0 0 Storey 0 0 0 0 0 0 Washoe 707 1,161 614 455 549 3,486 White Pine 0 0 0 0 0 0
Statewide 3,351 8,709 3,207 2,078 549 17,894

DEMOGRAPHIC DATA – STUDENTS AND EDUCATIONAL PERSONNEL
82
STUDENT ENROLLMENT
0
50,000
100,000
150,000
200,000
250,000
300,000
350,000
400,000
1990-91 1991-92 1992-93 1993-94 1994-95 1995-96 1996-97 1997-98 1998-99 1999-00 2000-01 2001-02 2002-03 2003-04
School Year
NEVADA PUBLIC SCHOOL ENROLLMENTS: SCHOOL YEARS 1990-91 THROUGH 2003-04
CLARK WASHOE ALL OTHER
PERCENT CHANGE IN STATEWIDE ENROLLMENT OVER PRIOR YEAR 90-91 91-92 92-93 93-94 94-95 95-96 96-97 97-98 98-99 99-00 00-01 01-02 02-03 03-04
7.7% 5.2% 5.2% 5.8% 6.3% 5.7% 6.4% 5.1% 4.9% 4.7% 4.6% 4.7% 3.6% 4.3% Source: Nevada Department of Education, Research Bulletin, February 2004. NOTE: The data reflected in the chart and table contain total (full) enrollment figures. Enrollment used for apportionment purposes (paid enrollment) weights each kindergartener as a 0.6 pupil and is, therefore, a slightly lower number.

DEMOGRAPHIC DATA – STUDENTS AND EDUCATIONAL PERSONNEL
83
2.45
3.35
4.01
4.45 4.59
6.14
6.87 7.33
7.53
7.61
9.49
0 2 4 6 8 10
Percent
California
Oregon
Washington
Colorado
New Mexico
Montana
Arizona
Nevada
Idaho
Utah
Wyoming
Percent Private School Enrollment to Public School Enrollment - Nevada and Western States -
SY 2001-2002
STUDENTS—PRIVATE SCHOOL ENROLLMENT
Source: U.S. Department of Education, National Center for Education Statistics, Common Core of Data, Private School Universe Survey 2001-2002 and Public Elementary/Secondary School Universe Survey 2001-2002.
Private Public Private as Enrollment Enrollment % Public Arizona 44,360 922,180 4.59 California 655,502 6,248,610 9.49 Colorado 54,450 752,145 7.33 Idaho 10,291 246,521 4.01 Montana 9,941 151,947 6.14 Nevada 16,623 356,814 4.45 New Mexico 26,637 320,260 6.87 Oregon 45,448 551,480 7.61 Utah 16,814 484,677 3.35 Washington 82,189 1,009,200 7.53 Wyoming 2,209 88,128 2.45

DEMOGRAPHIC DATA – STUDENTS AND EDUCATIONAL PERSONNEL
84
STUDENTS—SCHOOL DISTRICT ENROLLMENT
Enrollment as a Percentage of Statewide Total by District 2003-2004 School Year
Storey0.1%
White Pine0.4%
Carson City2.3%
Churchill1.2%
Pershing0.2%
Douglas1.9%
Elko2.5% Humboldt
0.9%
Lyon2.0%
Eureka0.1%
Lander0.3% Lincoln
0.3%
Nye1.4%
Mineral0.2%
Esmeralda0.02%
Clark70.2%
Washoe 16.1%
District Enrollment 2003-2004 School Year
Carson City 8,798 Mineral 743
Churchill 4,553 Nye 5,471
Clark 270,529 Pershing 841
Douglas 7,190 Storey 467
Elko 9,582 Washoe 62,103
Esmeralda 69 White Pine 1,380
Eureka 220
Humboldt 3,523 Statewide 385,414
Lander 1,255
Lincoln 1,012
Lyon 7,678
Source: Nevada Department of Education, Research Bulletin, February 2004.

DEMOGRAPHIC DATA – STUDENTS AND EDUCATIONAL PERSONNEL
85
STUDENTS—ETHNICITY
Nevada Public School Membership By Ethnicity for School Year 2003-2004
White, Non-Hispanic,
50.7%
Asian/Pacific
Islander, 6.7%
Black, Non-Hispanic,
10.7%
Hispanic, 30.2%
American Indian/Alaska Native, 1.7%
Source: Nevada Department of Education. Research Bulletin, February 2004.

DEMOGRAPHIC DATA – STUDENTS AND EDUCATIONAL PERSONNEL
86
STUDENTS—LIMITED ENGLISH PROFICIENT – ENROLLMENT
Source: National Clearinghouse for English Language Acquisition. State Limited English Proficient Growth 2002-2003, August 2004.
15.3%
25.6%
11.5%
7.9%
4.7%
14.5%
20.4%
9.5%
10.3%
6.5%
3.7%
10.2%
0.0% 5.0% 10.0% 15.0% 20.0% 25.0% 30.0%
National Average
Wyoming
Washington
Utah
Oregon
New Mexico
Nevada
Montana
Idaho
Colorado
California
Arizona
Limited English Proficient Enrollment in Pre-K Through Grade 12, SY 2002-2003, Nevada and Western States

DEMOGRAPHIC DATA – STUDENTS AND EDUCATIONAL PERSONNEL
87
STUDENTS—LIMITED ENGLISH PROFICIENT – CHARACTERISTICS
Source: National Clearinghouse for English Language Acquisition. Survey of the States' Limited English Proficient Students and Available Programs and Services 2000-2001, October 2002.
Rate of Growth in Enrollment Total and Limited English Proficient 1993-94 to
2003-04*
-50%
0%
50%
100%
150%
200%
250%
300%
350%
Arizon
a
Califo
rnia
Color
ado
Idah
o
Mon
tana
Nev
ada
New
Mex
ico
Ore
gon
Uta
h
Was
hing
ton
Wyo
ming
Grow th in total enrollment Grow th in LEP
Source: National Clearinghouse for English Language Acquisition. United States Department of Education, 2004. * Data for Washington and Utah are from 2002-03.
Top Five Lanuages Spoken By Nevada LEP Students, SY 2000-01
Korean0.5%
Vietnamese0.6%Tagalog
2.0%
Chinese1.0%
Spanish95.8%
SpanishTagalogChineseVietnameseKorean

DEMOGRAPHIC DATA – STUDENTS AND EDUCATIONAL PERSONNEL
88
STUDENT ENROLLMENT – DISTRICT ENROLLMENTS
PUBLIC SCHOOL ENROLLMENT IN NEVADA, BY DISTRICT, SCHOOL YEARS 1999-2000 THROUGH 2003-2004
SCHOOL ENROLLMENT PERCENT CHANGE IN ENROLLMENT
DISTRICT 1999-00 2000-01 2001-02 2002-03 2003-04 1999-00 2000-01 2001-02 2002-03 2003-04 STATE 325,610 340,706 356,814 369,498 385,414 4.7 4.6 4.7 3.6 4.3 CARSON CITY 8,365 8,431 8,763 8,834 8,798 0.1 0.8 3.9 0.8 -0.4 CHURCHILL 4,860 4,808 4,724 4,610 4,553 0.5 -1.1 -1.7 -2.4 -1.2 CLARK 217,526 231,655 245,659 256,574 270,529 6.7 6.5 6.0 4.4 5.4 DOUGLAS 7,158 7,033 6,989 7,180 7,190 -2.2 -1.7 -0.6 2.7 0.1 ELKO 10,161 10,100 9,847 9,694 9,582 -2.7 -0.6 -2.5 -1.6 -1.2 ESMERALDA* 105 107 89 74 69 -7.9 1.9 -16.8 -16.9 -6.8 EUREKA 347 305 285 239 220 -3.1 -12.1 -6.6 -16.1 -7.9 HUMBOLDT 4,034 3,805 3,616 3,504 3,523 -5.9 -5.7 -5.0 -3.1 0.5 LANDER 1,534 1,449 1,355 1,276 1,255 -9.9 -5.5 -6.5 -5.8 -1.6 LINCOLN 1,017 1,018 1,014 992 1,012 -3.3 0.1 -0.4 -2.2 2.0 LYON 6,539 6,666 7,046 7,268 7,678 3.0 1.9 5.7 3.2 5.6 MINERAL 907 872 774 787 743 12.7 -3.9 -11.2 1.7 -5.6 NYE 5,444 5,290 5,279 5,322 5,471 3.4 -2.8 -0.2 0.8 2.8 PERSHING 963 900 898 875 841 -2.2 -6.5 -0.2 -2.6 -3.9 STOREY 458 445 480 450 467 -9.7 -2.8 7.9 -6.3 3.8 WASHOE 54,508 56,268 58,532 60,384 62,103 3.2 3.2 4.0 3.2 2.8 WHITE PINE 1,684 1,554 1,464 1,435 1,380 -9.2 -7.7 -5.8 -2.0 -3.8 Source: Research Bulletin, Volumes 41, 42, and 43. Nevada Department of Education.

DEMOGRAPHIC DATA – STUDENTS AND EDUCATIONAL PERSONNEL
89
STUDENTS—DISTRICT ENROLLMENTS
Clark County Enrollment FYs 1998-2003
256527
270352
283187
203777
217382
231495245530
190796
170000
190000
210000
230000
250000
270000
290000
FY1998 FY1999 FY2000 FY2001 FY2002 FY2003 FY2004 FY2005
Washoe County Enrollment FYs 1998-2003
60368
62121
63859
58502
56245
54439
5117152961
48000
53000
58000
63000
68000
FY1998 FY1999 FY2000 FY2001 FY2002 FY2003 FY2004 FY2005
Source: Nevada Department of Education. School District Enrollment Forecast Model 2005.

DEMOGRAPHIC DATA – STUDENTS AND EDUCATIONAL PERSONNEL
90
STUDENTS—DISTRICT ENROLLMENTS
School District Enrollment - Carson, Churchill, Douglas, Elko, Humboldt, Lyon & Nye School Years 1998-2005
CarsonCity, 8,286
CarsonCity, 8,878
DouglasCounty, 7,302
ElkoCounty, 10,622
ElkoCounty, 9,742
NyeCounty, 5887
8,8018,8278,761
8,4258,3638,358
ChurchillCounty, 4,766
ChurchillCounty, 4,5654,834 4,830 4,790 4,713
4,611 4,567
DouglasCounty, 7,294
7,3227,158
7,033 6,9897,180 7,192
9,5829,694
9,847
10,100
10,443
10,161
HumboldtCounty, 3,463
HumboldtCounty, 4,257
3,5233,5003,616
3,8034,032
4,288
LyonCounty, 6154
LyonCounty, 8240
63546557
6682
70577267
7684
NyeCounty, 5272
5470531252795288
54245265
3,000
4,000
5,000
6,000
7,000
8,000
9,000
10,000
11,000
FY1998 FY1999 FY2000 FY2001 FY2002 FY2003 FY 2004 FY2005
Stu
dent
s
CarsonCity
ChurchillCounty
DouglasCounty
ElkoCounty
HumboldtCounty
LyonCounty
NyeCounty
Source: Nevada Department of Education. School District Enrollment Forecast Model 2005.

DEMOGRAPHIC DATA – STUDENTS AND EDUCATIONAL PERSONNEL
91
STUDENTS—DISTRICT ENROLLMENTS
School District Enrollment - Esmeralda, Eureka, Mineral, Pershing, Storey, White Pine
School Year 1998-2005
114 104 96 89 74 69
EsmeraldaCounty, 114
EsmeraldaCounty, 66
EurekaCounty, 236
EurekaCounty, 378 358 347
305 285239 220
StoreyCounty, 481
507458 447
479450 467
StoreyCounty, 532
907
1039
872
774 780743
M ineralCounty, 1075
M ineralCounty, 749
963985
900 898870
841
PershingCounty, 999
PershingCounty, 797
LincolnCounty, 10061016
10521016 1014 992 1012
LincolnCounty, 1081
1,703
1,534
1,449
1,355
1,2551,276
LanderCounty, 1,857
LanderCounty, 1,227
1464
1562
1635
1853
14351380
White PineCounty, 1874
White PineCounty, 1446
0
200
400
600
800
1,000
1,200
1,400
1,600
1,800
2,000
FY1998 FY1999 FY2000 FY2001 FY2002 FY2003 FY 2004 FY2005EsmeraldaCounty
EurekaCounty
StoreyCounty
M ineralCounty
PershingCounty
LincolnCounty
LanderCounty
White PineCounty
Source: Nevada Department of Education. School District Enrollment Forecast Model 2005.

DEMOGRAPHIC DATA – STUDENTS AND EDUCATIONAL PERSONNEL
92
STUDENTS—ENROLLMENT – HOME SCHOOL
Nevada Home Schoolers as a Percent of Total of Enrollment (Schools Years 1988-1989 to 2004-2005)
0.38% 0.37% 0.39% 0.41%0.46%
0.97%
1.16%1.22%
1.33% 1.32%
1.19%
1.07% 1.06%1.07%
0.84%
1.07%1.07%
0.00%
0.20%
0.40%
0.60%
0.80%
1.00%
1.20%
1.40%
1.60%
88-8989-90
90-9191-92
92-9393-94
94-9595-96
96-9797-98
98-9999-00
00-01*
01-0202-03
03-0404-05
Number of Students in Home School Arrangements Compared with Public School Enrollment SY 1988-89 to 2002-03
670 682792 861
1028
2438
3077 3032
3620
41514052
3826 3909
4136
1988
43064278
176474186834
201316211810
235800250747
265041282131
296536311213
325310340508
356652369402
385279
222846
401123
0
500
1000
1500
2000
2500
3000
3500
4000
4500
Hom
e nu
mbe
r
0
50000
100000
150000
200000
250000
300000
350000
400000
450000
Publ
ic n
umbe
r
Home Schooled Public School
Home S c hoole d 670 682 792 861 1028 1988 2438 3077 3032 3620 4151 4278 4052 3826 3909 4136 4306
P ublic S c hool 176474 186834 201316 211810 222846235800 250747 265041282131 296536 311213 325310 340508356652369402385279 401123
88- 89 89- 90 90- 91 91- 92 92- 93 93- 94 94- 95 95- 96 96- 97 97- 98 98- 99 99- 00 00- 01* 01- 02 02- 03 03- 04 04- 05
Source: Nevada Department of Education, 2005. Note: Home school data for SY 2000-2001 was not collected. The number is an estimate based upon previous year and subsequent year average.

DEMOGRAPHIC DATA – STUDENTS AND EDUCATIONAL PERSONNEL
93
STUDENT ATTENDANCE
Nevada Pupil Attendance Rates By School District & Statewide 2003-2004 School Year
9 1.7 %
9 3 .5 %
9 4 .9 %
9 2 .3 %
9 3 .4 %
9 2 .3 %
9 3 .7 %
9 3 .7 %
9 2 .5 %
9 3 .6 %
9 5 .3 %
9 3 .5 %
9 4 .0 %
9 4 .3 %
9 4 .3 %
9 4 .2 %
9 4 .1%
60.00% 65.00% 70.00% 75.00% 80.00% 85.00% 90.00% 95.00% 100.00%
Statewide
Carson
Churchill
Clark
Douglas
Esmeralda
Eureka
Humboldt
Lander
Lincoln
Lyon
Mineral
Nye
Pershing
Storey
Washoe
White Pine
AYP Target
Statewide Pupil Attendance Rates By Subgroup 2003-2004 School Year
94.1%
92.3%
95.7%
94.0%
93.0%
94.2%
92.5%
94.1%
94.7%
90.00%
91.00%
92.00%
93.00%
94.00%
95.00%
96.00%
Source: Nevada Report Card Database: State Profile. Nevada Department of Education, March 2005.

DEMOGRAPHIC DATA – STUDENTS AND EDUCATIONAL PERSONNEL
94
STUDENTS RETAINED
Percent of Pupils Retained in School Year 2003-2004 Selected Grades, District and Statewide
2.7
0.5
3.9
2.7
2.1
6.2
3.1
1.4
2
2.1
4.2
7
8.7
2.7
3.2
2
2.4
1.2
3
0.8
4.1
2
1.7
8.3
2.6
0.7
2.7
0.3
2.9
2.9
1.7
1.8
8.3
3.7
3.7
7.5
1.5
1.5
1.9
5.5
2.6
1.6
0 1 2 3 4 5 6 7 8 9 10
Nevada
Carson
Churchill
Clark
Douglas
Elko
Esmeralda
Eureka
Humboldt
Lander
Lincoln
Lyon
Mineral
Nye
Pershing
Storey
Washoe
White Pine
Percentage Retained
8th
7th
1st
Retention Rates Grades K-8 SY 1998-99 to 2003-2004
0.00%0.50%1.00%1.50%2.00%2.50%3.00%3.50%
1998-99 1999-00 2000-01 2003-04
K1st2 nd3 rd4 th5 th6 th7 th8 th
Statewide Percentage of Pupils Retained School Year 2003-2004
1.5%
2.7%
1.4%
0.9%0.5%
1.9% 2.0%
2.7%
0.3%
0.0%
1.0%
2.0%
3.0%
Kind. 1st 2nd 3rd 4th 5th 6th 7th 8th Source: Nevada Report Card Database: State Profile. Nevada Department of Education, March 2005.

DEMOGRAPHIC DATA – STUDENTS AND EDUCATIONAL PERSONNEL
95
STUDENTS ELIGIBLE FOR FREE OR REDUCED-PRICED MEALS
Percent of Elementary and Secondary School Students Eligible for Free and Reduced-Price Meals: 2003
11.9%
28.5%
29.5%
30.6%
31.9%
34.0%
34.2%
36.4%
36.4%
38.2%
47.2%
57.0%
0.0% 10.0% 20.0% 30.0% 40.0% 50.0% 60.0% 70.0%
Arizona
Colorado
Wyoming
Utah
Montana
Nevada
Washington
Idaho
National Average
Oregon
California
New Mexico
Source: U.S. Department of Education, NCES, Common Core of Data (CCD) Database; Preliminary data for 2002-2003 school year, in Education State Rankings 2004-2005.
DEMOGRAPHIC DATA – STUDENTS AND EDUCATIONAL PERSONNEL
96
STUDENTS—DROPOUT RATE
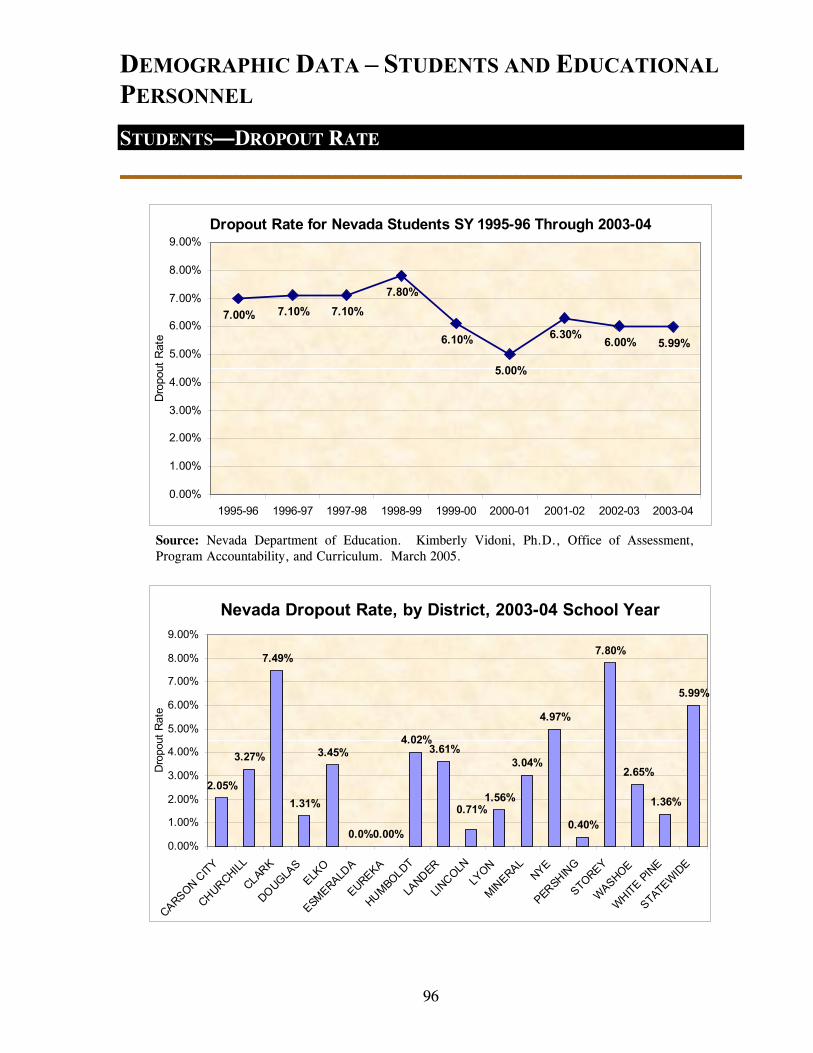
Dropout Rate for Nevada Students SY 1995-96 Through 2003-04
7.00% 7.10% 7.10%7.80%
6.10%
5.00%
6.30% 6.00% 5.99%
0.00%
1.00%
2.00%
3.00%
4.00%
5.00%
6.00%
7.00%
8.00%
9.00%
1995-96 1996-97 1997-98 1998-99 1999-00 2000-01 2001-02 2002-03 2003-04
Dro
pout
Rat
e
Source: Nevada Department of Education. Kimberly Vidoni, Ph.D., Office of Assessment, Program Accountability, and Curriculum. March 2005.
Nevada Dropout Rate, by District, 2003-04 School Year
2.05%
3.27%
7.49%
1.31%
3.45%
0.0%0.00%
4.02%3.61%
1.56%
3.04%
4.97%
0.40%
7.80%
2.65%
1.36%
5.99%
0.71%
0.00%
1.00%
2.00%
3.00%
4.00%
5.00%
6.00%
7.00%
8.00%
9.00%
CARSON CITY
CHURCHILL
CLARK
DOUGLAS
ELKO
ESMERALDA
EUREKA
HUMBOLDT
LANDER
LINCOLN
LYON
MINERAL
NYE
PERSHING
STOREY
WASHOE
WHITE PINE
STATEWIDE
Dro
pout
Rat
e

DEMOGRAPHIC DATA – STUDENTS AND EDUCATIONAL PERSONNEL
97
STUDENTS—HIGH SCHOOL COMPLETION RATES
High School Completion RatesFour Year Average, 1998-2001
Percentage of 18 to 24 Year-Olds Completing High School Nevada and Western States
73.5%
74.4%
76.5%
82.1%
82.6%
76.9%
76.4%
68.3%
0.0% 10.0% 20.0% 30.0% 40.0% 50.0% 60.0% 70.0% 80.0% 90.0%
Arizona
Nevada
New Mexico
Oregon
Wyoming
Idaho
Montana
Utah
Source: Phillip Kaufman. Dropout Rates in the United States: 2001. NCES. November 2004. Data are reported by states to the U.S. Department of Education, National Center for Education Statistics, Common Core of Data (CCD), “Local Education Agency Universe Dropout and Completion Data File: School Year 2000–01.” Note: Figures not available from some states. The 4-year completion rate is calculated by dividing the number of high school completers in a given year by the number of high school completers in that year and dropouts over the preceding 4-year period. The term “high school completer” includes both diploma recipients and other high school completers. Thus, the 4–year high school completion rate includes both diploma recipients and other high school completers. This rate includes other high school completers but does not reflect those receiving a GED-based equivalency credential.

DEMOGRAPHIC DATA – STUDENTS AND EDUCATIONAL PERSONNEL
98
STUDENTS—HIGH SCHOOL DIPLOMAS
NUMBER OF HIGH SCHOOL DIPLOMAS ISSUED STATEWIDE FOR 1996-2003
Number of Diplomas
1996
1997
1998
1999
2000
2001
2002
2003
Adult Diplomas
620 787 535 633 728 815 935** 815
Adjusted Diplomas
367 339 443 573 745 669 926 1029
Standard Diplomas
10,374 11,299 11,975 12,633 13,265 13,463 14,282 14,337
Totals
11,361
12,425
12,953
13,839
14,738
14,947
16,143
16,181
** Number includes adult diplomas issued from institutions, correctional centers, prisons, etc. Source: Nevada Report Card Database: State Profile. Nevada Department of Education, March 2005.
Distribution of Nevada Diplomas-School Year 2002-2003 Adult
Diplomas5%
Adjusted Diplomas
6%
Standard Diplomas
89%
PERCENTAGE OF TYPES OF HIGH SCHOOL DIPLOMAS STATEWIDE FOR 1996-2003 Percent of
Total Diplomas
1996
1997
1998
1999
2000
2001
2002
2003
Adult Diplomas
6% 6% 4% 5% 5% 5% 6% 5%
Adjusted Diplomas
3% 3% 3% 4% 5% 5% 6% 6%
Standard Diplomas
91% 91% 92% 91% 90% 90% 88% 89%
Source: Nevada Report Card Database: State Profile. Nevada Department of Education, March 2005.

DEMOGRAPHIC DATA – STUDENTS AND EDUCATIONAL PERSONNEL
99
STUDENTS—HIGH SCHOOL DIPLOMAS
Nevada High School Diplomas by Type SY 1996 to SY 2003
0
200
400
600
800
1000
1200
1996 1997 1998 1999 2000 2001 2002 2003
Num
ber A
dult
& A
djus
ted
(Bro
ken
Line
s)
0
2,000
4,000
6,000
8,000
10,000
12,000
14,000
16,000
Num
ber S
tand
ard
Dip
lom
as (S
olid
Lin
e)
Adult Diplomas
Adjusted Diplomas
Standard Diplomas
Source: 2002-2003 data from Nevada Report Card Database: State Profile. Nevada Department of Education, March 2005.

DEMOGRAPHIC DATA – STUDENTS AND EDUCATIONAL PERSONNEL
100
STUDENTS—HIGH SCHOOL DIPLOMAS - ETHNICITY
Public School Diploma Recipients: School Year 2002-2003Nevada and Western States
0% 20% 40% 60% 80% 100%
Arizona
California
Colorado
Idaho
Montana
Nevada
Oregon
Utah
Washington
Wyoming
AMERICANINDIAN
ASIAN
BLACK,NON-HISP.
HISPANIC
WHITE, NON-HISP.
Public School Diploma Recipients for School Year 2002-2003*
American
Indian Asian Black,
Non-Hispanic Hispanic White, Non-
Hispanic Arizona 2,762 1,286 2,008 12,479 28,640
California 3,036 48,206 23,451 109,038 140,421
Colorado 314 1,442 1,798 5,700 31,506
Idaho 191 248 76 1,063 14,296
Montana 713 112 34 158 9,537
Nevada 255 1,123 1,285 2,728 10,879
Oregon 490 1,283 594 1,990 26,464
Utah 313 817 172 1,574 27,307
Washington 1,120 5,030 2,306 3,937 45,918
Wyoming 102 51 60 324 5,569
Source: NCES. Build a Table, on-line information extracted from the Common Core of Data, March 2005. Note: 2002-2003 data are considered preliminary.

DEMOGRAPHIC DATA – STUDENTS AND EDUCATIONAL PERSONNEL
101
Public High School Diploma Recipients in Nevada: School Year 2002-2003, by Ethnic Group
ASIAN 7%
BLACK, NON-HISP. 8%
WHITE, NON-HISP. 66%
HISPANIC 17%
AMERICAN INDIAN
2%
STUDENTS—HIGH SCHOOL DIPLOMAS – ETHNICITY
Source: NCES. Common Core of Data for 2002-2003 School Year, Build a Table 2005.
DISTRICT
AMERICAN INDIAN/
ALASKAN ASIAN/PACIFIC
ISLAND
BLACK, NON-
HISPANIC HISPANIC
WHITE, NON-
HISPANIC
Carson City School District 13 13 8 68 441
Churchill County School District 9 14 4 18 195
Clark County School District 82 871 1,178 2,005 6,079
Douglas County School District 4 5 2 21 394
Elko County School District 28 10 2 100 424
Esmeralda County School District* 0 0 0 0 0
Eureka County School District 2 1 0 1 15
Humboldt County School District 4 2 0 37 182
Lander County School District 1 1 0 14 64
Lincoln County School District 2 1 0 2 73
Lyon County School District 18 5 0 39 293
Mineral County School District 4 1 4 1 44
Nye County School District 5 9 4 30 245
Pershing County School District 3 0 0 10 37
Storey County School District 3 0 0 4 26
Washoe County School District 56 183 73 348 2,191
White Pine County School District 9 1 1 10 75
Statewide 243 1,117 1,276 2,708 10,778* Esmeralda has not high school; the students attend high school in neighboring Nye County. Source: NCES. Common Core of Data for 2002-2003 School Year, Build a Table 2005. Note: The counts of graduates are for students receiving a standard diploma.

DEMOGRAPHIC DATA – STUDENTS AND EDUCATIONAL PERSONNEL
102
GRADUATION RATES & COMPLETION INDICATORS
NEVADA PUBLIC SCHOOL GRADUATION RATES & COMPLETION INDICATORS SCHOOL YEAR 2002-2003
DROPOUT RATES – INDIVIDUAL GRADES 9 – 12 (SCHOOL YEAR 2002-2003)
GRADUATES
District Total 9th Grade 10th Grade 11th Grade 12th Grade Number 2002-03 Rate
STANDARD
DIPLOMA ADULT
DIPLOMA ADJUSTED DIPLOMA
CERTIFICATE OF
ATTENDANCE
NEVADA 5957 1552 1444 1145 1816 15152 74.8 % 14337 815 1029 871
Carson 45 13 7 14 11 508 84.4 % 471 37 34 6
Churchill 35 0 9 7 19 285 89.3 % 267 18 9 3
Clark 5046 1260 1227 975 1584 9900 71.7 % 9259 641 636 708
Douglas 17 0 2 2 13 432 90.9 % 425 7 26 0
Elko 80 25 22 18 16 402 78.7 % 371 31 22 18
Eureka 0 0 0 0 0 15 93.8 % 15 0 1 0
Humboldt 58 10 20 17 11 186 81.2 % 186 0 18 5
Lander 4 2 1 1 0 69 74.2 % 69 0 11 7
Lincoln 2 0 1 0 1 74 81.3 % 67 7 3 7
Lyon 53 14 9 19 11 369 83.1 % 325 44 32 8
Mineral 0 0 0 0 0 38 76.0 % 38 0 5 0
Nye 82 29 18 22 13 241 72.8 % 241 0 29 5
Pershing 0 0 0 0 0 43 95.6 % 38 5 2 0
Storey 12 4 1 5 1 17 70.8 % 17 0 7 0
Washoe 467 179 112 48 128 2470 80.3 % 2445 25 190 99
White Pine 5 0 1 2 2 96 81.4 % 96 0 3 1
Source: Nevada Report Card Database: State Profile. Nevada Department of Education, March 2005. NOTE: Nevada’s high school graduates receive one of the following diploma types: Standard, Adjusted, and Adult. Students who earn the required units of credit for high school graduation, but fail to pass one or more portions of the High School Proficiency Examination, are eligible to receive a certificate of attendance and are considered high school completers, but not high school graduates. These counts do not include GED credential recipients.

DEMOGRAPHIC DATA – STUDENTS AND EDUCATIONAL PERSONNEL
103
STUDENTS—SCHOOL SAFETY – SIZE OF SCHOOL FACILITIES
Average Size of Primary, Middle, and High Schools in 2003, Nevada & Western States
0
200
400
600
800
1000
1200
Arizon
a
Califor
nia
Colorad
oIda
ho
Montan
a
Nevad
a
New M
exico
Oregon
Utah
Was
hingto
n
Wyo
ming
Nation
al Ave
rage
Stu
dent
s PrimaryMiddleHigh School
Source: U.S. Bureau of the Census, Education State Rankings 2004-2005.
DEMOGRAPHIC DATA – STUDENTS AND EDUCATIONAL PERSONNEL
104
STUDENTS—SCHOOL SAFETY
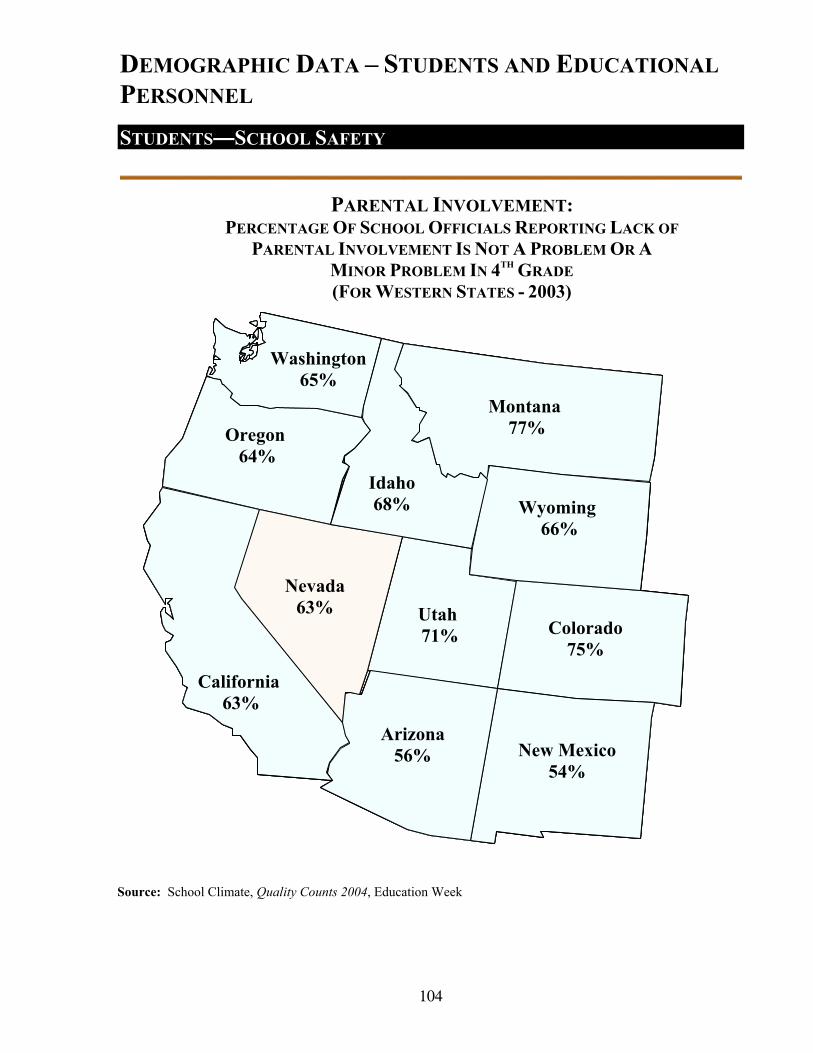
California 63%
Nevada63%
Oregon 64%
Idaho68%
Arizona56%
Utah71%
PARENTAL INVOLVEMENT: PERCENTAGE OF SCHOOL OFFICIALS REPORTING LACK OF
PARENTAL INVOLVEMENT IS NOT A PROBLEM OR A MINOR PROBLEM IN 4TH GRADE (FOR WESTERN STATES - 2003)
Source: School Climate, Quality Counts 2004, Education Week
Washington 65%
Montana 77%
Wyoming 66%
Colorado 75%
New Mexico 54%

DEMOGRAPHIC DATA – STUDENTS AND EDUCATIONAL PERSONNEL
105
STUDENTS—SCHOOL SAFETY
California 65%
Nevada 55%
Oregon 58%
Idaho 62%
Arizona45%
Utah70%
PARENTAL INVOLVEMENT: PERCENTAGE OF SCHOOL OFFICIALS REPORTING LACK OF
PARENTAL INVOLVEMENT IS NOT A PROBLEM OR A MINOR PROBLEM IN 8TH GRADE (FOR WESTERN STATES - 2003)
Source: School Climate, Quality Counts 2004, Education Week
Washington 46%
Montana 64%
Wyoming 57%
Colorado 69%
New Mexico 34%

DEMOGRAPHIC DATA – STUDENTS AND EDUCATIONAL PERSONNEL
106
STUDENTS—SCHOOL SAFETY
Note: Omitted Western states not reporting. Source: U.S. Department of Health and Human Services, CDC, “Youth Risk Behavior Surveillance – U.S. 2003” in Education State Rankings 2004-2005.
Percentage of High School Students Who Felt Too Unsafe to Go to School: 2003
8.70%
5.40%
5.40%
5.30%
5.00%
4.10%
3.40%
0.00% 2.00% 4.00% 6.00% 8.00% 10.00%
Nevada
National Average
Wyoming
Utah
Arizona
Idaho
Montana

DEMOGRAPHIC DATA – STUDENTS AND EDUCATIONAL PERSONNEL
107
STUDENTS—SCHOOL SAFETY
Percentage of Nevada High School Students Who Feel Safe at School All or Most of the Time - 2003
72.2 75.9 77.4 75.1 79.874.4 78.2
0
20
40
60
80
100
Total Female Male 9th 10th 11th 12th
Percentage of Nevada Middle School Students Who Feel Safe at School All or Most of the Time - 2003
73.1 74.8 71.1 73.3 76.270.8
0
20
40
60
80
100
Total Female Male 6th 7th 8th
Source: Nevada Department of Education, Nevada Youth Risk Behavior Survey Report 2003

DEMOGRAPHIC DATA – STUDENTS AND EDUCATIONAL PERSONNEL
108
STUDENTS—SCHOOL SAFETY
Percentage of Nevada High School Students Who Did Not Go to School in Last 30 Days Because They Felt Unsafe at School or
To/From School - 2003
8.7 9.3 8.1 6.4 8.9 10.1 9.3
0
20
40
60
80
100
Total Female Male 9th 10th 11th 12th
Percentage of Nevada Middle School Students Who Did Not Go to School in Last 30 Days Because They Felt Unsafe at School or
To/From School - 2003
10.9 10.2 11.6 13.3 9.8 10.1
0
20
40
60
80
100
Total Female Male 6th 7th 8th
Source: Nevada Department of Education, Nevada Youth Risk Behavior Survey Report 2003
DEMOGRAPHIC DATA – STUDENTS AND EDUCATIONAL PERSONNEL
109
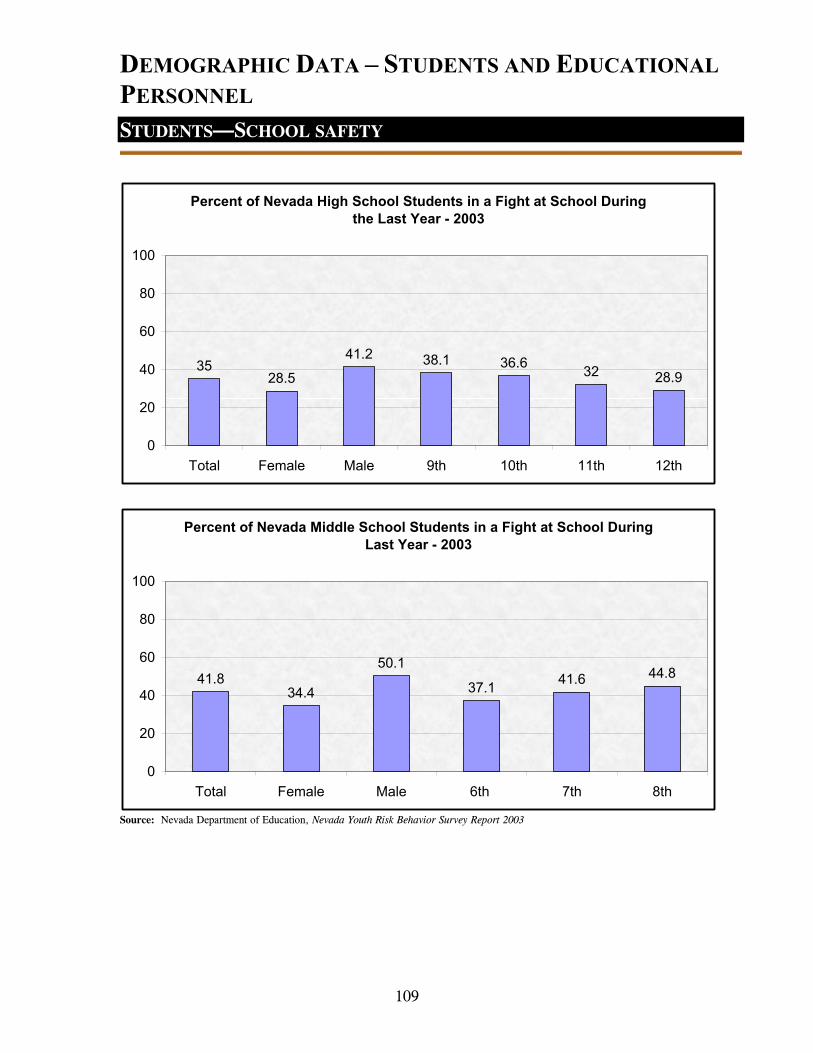
STUDENTS—SCHOOL SAFETY
Percent of Nevada High School Students in a Fight at School During the Last Year - 2003
3528.5
41.2 38.1 36.6 32 28.9
0
20
40
60
80
100
Total Female Male 9th 10th 11th 12th
Percent of Nevada Middle School Students in a Fight at School During Last Year - 2003
41.834.4
50.1
37.1 41.6 44.8
0
20
40
60
80
100
Total Female Male 6th 7th 8th
Source: Nevada Department of Education, Nevada Youth Risk Behavior Survey Report 2003
DEMOGRAPHIC DATA – STUDENTS AND EDUCATIONAL PERSONNEL
110
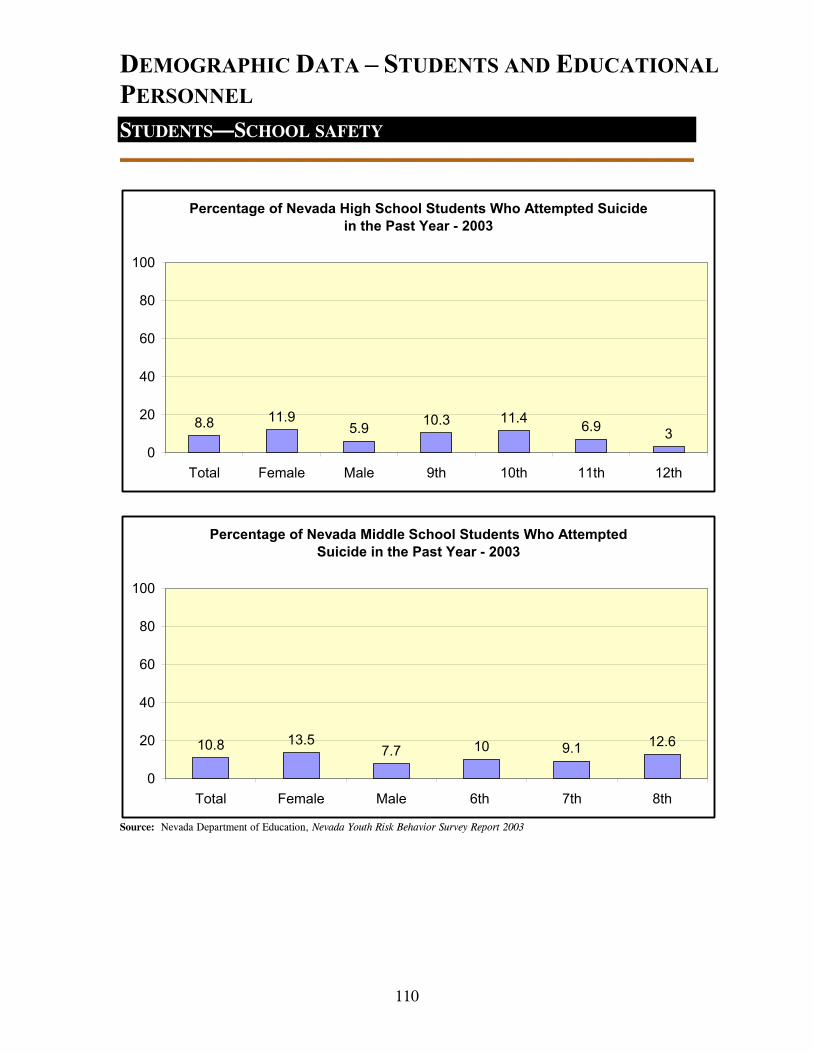
STUDENTS—SCHOOL SAFETY
Percentage of Nevada High School Students Who Attempted Suicide in the Past Year - 2003
8.8 11.95.9 10.3 11.4 6.9 3
0
20
40
60
80
100
Total Female Male 9th 10th 11th 12th
Percentage of Nevada Middle School Students Who Attempted Suicide in the Past Year - 2003
10.8 13.57.7 10 9.1 12.6
0
20
40
60
80
100
Total Female Male 6th 7th 8th
Source: Nevada Department of Education, Nevada Youth Risk Behavior Survey Report 2003
DEMOGRAPHIC DATA – STUDENTS AND EDUCATIONAL PERSONNEL
111
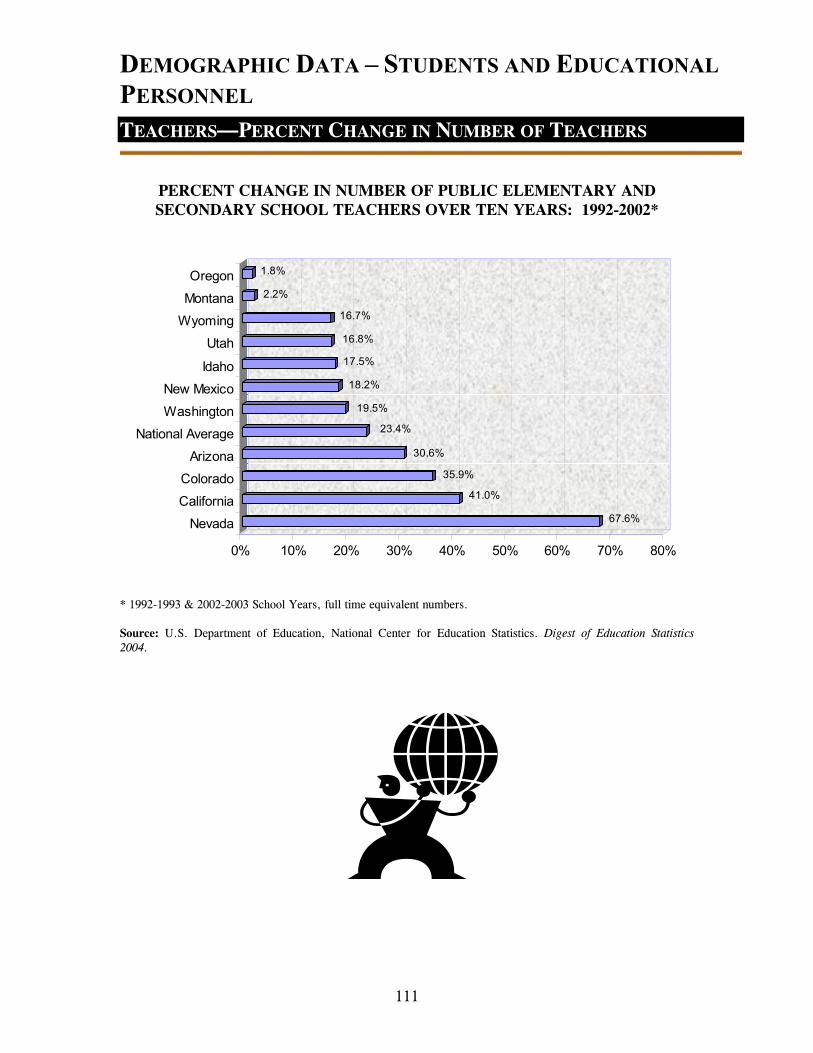
TEACHERS—PERCENT CHANGE IN NUMBER OF TEACHERS
PERCENT CHANGE IN NUMBER OF PUBLIC ELEMENTARY AND SECONDARY SCHOOL TEACHERS OVER TEN YEARS: 1992-2002*
67.6%
41.0%
35.9%
30.6%
23.4%
19.5%
18.2%
17.5%
16.8%
16.7%
2.2%
1.8%
0% 10% 20% 30% 40% 50% 60% 70% 80%
Nevada
California
Colorado
Arizona
National Average
Washington
New Mexico
Idaho
Utah
Wyoming
Montana
Oregon
* 1992-1993 & 2002-2003 School Years, full time equivalent numbers. Source: U.S. Department of Education, National Center for Education Statistics. Digest of Education Statistics 2004.

DEMOGRAPHIC DATA – STUDENTS AND EDUCATIONAL PERSONNEL
112
TEACHERS—PERSONNEL – EMPLOYMENT GROWTH
PERCENT GROWTH IN NUMBER OF FTE PUBLIC ELEMENTARY AND SECONDARY SCHOOL STAFF OVER TEN YEARS: 1992-2002*
* 1992-1993 & 2002-2003 School Years, full time equivalent numbers. Source: U.S. Department of Education, National Center for Education Statistics. Digest of Education Statistics 2004.
55.9%
44.0% 38.5%
36.1%
35.0% 27.2%
26.7%
25.9%
20.3%
19.3% 6.5%
1.3%
0% 10% 20% 30% 40% 50% 60% 70% 80%
Nevada
Colorado
Washington
California
Arizona
Idaho
National Average
New Mexico
Wyoming
Utah
Oregon
Montana

DEMOGRAPHIC DATA – STUDENTS AND EDUCATIONAL PERSONNEL
113
TEACHERS—PERSONNEL
PERCENT OF EDUCATIONAL STAFF FOR SELECTED CATEGORIES WESTERN STATES 2002-2003 SCHOOL YEAR
Percentages rounded to the nearest whole number. Support Staff includes: library support staff, student support services staff, and all other support staff.
Sources: U.S. Department of Education, National Center for Education Statistics Digest of Education Statistics 2004, and Common Core of Data in Education State Rankings 2004-2005. Morgan Quinto, 2004.
State Teachers School Administrators
District Administrators
Support Staff*
Instructional Aides Counselors Librarians
Arizona 49 2.3 0.2 24.2 14.1 1.3 0.9 California 53 2.3 0.5 19.7 12.4 1.1 0.2 Colorado 50 2.6 1.1 23.0 12.2 1.5 0.9 Idaho 56 2.9 0.5 20.6 10.6 2.4 0.7 Montana 54 2.6 0.8 19.5 12.2 2.2 1.8 Nevada 60 3.1 0.8 16.7 9.6 2.1 1.0 New Mexico 48 2.3 1.9 24.1 11.8 1.8 0.7 Oregon 49 2.9 1.3 19.1 15.1 2.1 0.9 Utah 54 2.4 0.4 19.2 13.5 1.6 0.7 Washington 47 2.4 0.9 29.8 9.0 1.7 1.2 Wyoming 49 2.5 2.0 21.7 13.0 2.8 1.0 National 51 2.8 1.1 23.8 11.2 1.7 0.9

DEMOGRAPHIC DATA – STUDENTS AND EDUCATIONAL PERSONNEL
114
PERSONNEL – SCHOOL ADMINISTRATORS
California 2.3%
Nevada3.1%
Oregon 2.9%
Idaho2.9%
Arizona2.3%
Utah2.4%
PERCENT OF SCHOOL STAFF WHO ARE ADMINISTRATORS IN ELEMENTARY/SECONDARY SCHOOL FOR WESTERN STATES (SY 2002-2003)
Source: U.S. Department of Education, National Center for Education Statistics. Digest of Education Statistics 2004, and Common Core of Data in Education State Rankings 2004-2005. Morgan Quinto, 2004.
Washington 2.4%
Montana2.6%
Wyoming 2.5%
Colorado 2.6%
New Mexico 2.3%
National Average: 2.8%

DEMOGRAPHIC DATA – STUDENTS AND EDUCATIONAL PERSONNEL
115
PERSONNEL—GUIDANCE COUNSELORS
California 1.1%
Nevada 2.1%
Oregon 2.1% Idaho
2.4%
Arizona 1.3%
Utah 1.6%
PERCENT OF SCHOOL STAFF WHO ARE GUIDANCE COUNSELORS IN ELEMENTARY/SECONDARY SCHOOL FOR WESTERN STATES (SY 2002-2003)
Source: U.S. Department of Education, National Center for Education Statistics. Digest of Education Statistics 2004, and Common Core of Data in Education State Rankings 2004-2005. Morgan Quinto, 2004.
Washington 1.7%
Montana 2.2%
Wyoming 2.8%
Colorado 1.5%
New Mexico 1.8%
National Average: 1.7%

DEMOGRAPHIC DATA – STUDENTS AND EDUCATIONAL PERSONNEL
116
PERSONNEL—INSTRUCTIONAL AIDES
California 12.4%
Nevada9.6%
Oregon 15.1%
Idaho10.6%
Arizona14.1%
Utah13.5%
PERCENT OF SCHOOL STAFF WHO ARE INSTRUCTIONAL AIDES IN ELEMENTARY/SECONDARY SCHOOLS FOR WESTERN STATES (SY 2002-2003)
Source: U.S. Department of Education, National Center for Education Statistics. Digest of Education Statistics 2004, and Common Core of Data in Education State Rankings 2004-2005. Morgan Quinto, 2004.
Washington 9.1%
Montana 12.2%
Wyoming 13.0%
Colorado 12.2%
New Mexico 11.8%
National Average: 11.2%

DEMOGRAPHIC DATA – STUDENTS AND EDUCATIONAL PERSONNEL
117
TEACHERS—PERSONNEL – SUPPORT STAFF
PERCENT OF PUBLIC ELEMENTARY AND SECONDARY SCHOOL STAFF WHO ARE SUPPORT STAFF
2002-2003 SCHOOL YEAR
16.7%
19.1%
19.2%
19.5%
19.7%
20.6%
21.7%
23.0%
23.8%24.1%24.2%
29.8%
0% 5% 10% 15% 20% 25% 30% 35%
Washington
Arizona
New Mexico
National Average
Colorado
Wyoming
Idaho
California
Montana
Utah
Oregon
Nevada
Nevada is the third lowest in the
United States
* Support Staff includes library support staff, student support services staff, and all other support staff. Source: U.S. Department of Education, National Center for Education Statistics in Education State Rankings 2004-2005. Morgan Quinto, 2004.

DEMOGRAPHIC DATA – STUDENTS AND EDUCATIONAL PERSONNEL
118
TEACHERS—PERSONNEL
PERCENT OF NEVADA EDUCATIONAL STAFF FOR SELECTED CATEGORIES
2002-2003 SCHOOL YEAR
59.9%
13.6%9.6%
4.5% 3.1% 2.4% 2.2% 2.1% 1.0% 0.8% 0.8%
0%
10%
20%
30%
40%
50%
60%
70%
Teachers
Other Support
Service
s Staff
Instructi
onal Aides
School &
Library S
upport Staf
f
School A
dministra
tors
Student Support
Staff
Distric
t Administ
rative S
upport Staf
f
Guidance C
ounselors
Librarians
Distric
t Administ
rators
Instructi
on Coord
inators
Nevada: Percent of Educational Staff for Selected Categories 2002-2003 SY
Source: U.S. Department of Education, National Center for Education Statistics. Digest of Education Statistics 2002.

DEMOGRAPHIC DATA – STUDENTS AND EDUCATIONAL PERSONNEL
119
PARAPROFESSIONALS
PERCENT OF PARAPROFESSIONALS NOT NCLB QUALIFIED 2003-2004*
90.0 89.7 87.8
75.0 71.8 70.659.1 56.3
44.3 40.8 39.3 38.7
20.0 17.4
4.1
0%10%20%30%40%50%60%70%80%90%
100%
Storey
Douglas
Clark
Eureka
Nevad
a
White Pine
Washoe
NyeLyo
n
Carson C
ity Elko
Humboldt
Persh
ing
Mineral
Church
ill
PARAPROFESSIONALS WORKING IN NEVADA SCHOOLS 2003-2004*
Total Number Employed Number NOT NCLB Qualified Percent Not NCLB Qualified
Nevada 3,282 2,356 71.8%
Carson City 147 60 40.8%
Churchill 73 3 4.1%
Clark 1,834 1,610 87.8%
Douglas 97 87 89.7%
Elko 56 22 39.3%
Esmeralda 2 N/A N/A
Eureka 4 3 75.0%
Humboldt 62 24 38.7%
Lander 17 N/A N/A
Lincoln 13 N/A N/A
Lyon 70 31 44.3%
Mineral 23 4 17.4%
Nye 87 49 56.3%
Pershing 20 4 20.0%
Storey 10 9 90.0%
Washoe 721 426 59.1%
White Pine 17 12 70.6%
* Paraprofessionals are aides who work directly with children in classrooms, labs, and libraries. In order to satisfy the requirements of the federal No Child Left Behind (NCLB) Act, paraprofessionals must have a high school diploma or its equivalent, plus one of the following: 1. completed at least two years at an accredited institution of higher education, 2. obtained an associate's (or higher) degree, or 3. successfully completed a formal state or local academic assessment. Only those paraprofessionals employed at Title I schools are required to satisfy NCLB requirements. Percentages not available for Esmeralda, Lander, and Lincoln Counties. Source: Nevada Department of Education 2003-2004 State Accountability Report.

DEMOGRAPHIC DATA – STUDENTS AND EDUCATIONAL PERSONNEL
120
PERSONNEL/ADMINISTRATOR RATIOS IN NEVADA
379 378
318 314 300 299288 284271 251
212186
168 156127110
69
0
50
100
150
200
250
300
350
400C
hurc
hill
Cla
rk
Was
hoe
Car
son
City
Dou
glas
Elko Nye
Lyon
Hum
bold
t
Land
er
Whi
te P
ine
Min
eral
Pers
hing
Stor
ey
Linc
oln
Eure
ka
Esm
eral
da
Administrator-Student Ratio in Nevada School Districts 2003*
* Administrator includes: Principals & Assistant Principals, Directors and Supervisory Personnel, Associate and Assistant Superintendents, and Superintendents.
142 141131 131 126 126 124 122
115110 108
84 83 78
62 55
35
0
20
40
60
80
100
120
140
160
Chu
rchi
ll
Hum
bold
t
Car
son
City
Whi
te P
ine
Land
er
Was
hoe
Nye
Dou
glas
Cla
rk
Lyon
Elko
Pers
hing
Min
eral
Linc
oln
Stor
ey
Eure
ka
Esm
eral
da
Non-Teaching Personnel-Student Ratio in Nevada School Districts 2003*
* Non-Teaching Personnel includes: Principals, Vice Principals, Pupil and School Service Personnel, Directors and Supervisory Personnel, Superintendents, and Assistant/Associate Superintendents Source: Nevada Department of Education, 2004 Research Bulletin.

DEMOGRAPHIC DATA – STUDENTS AND EDUCATIONAL PERSONNEL
121
TEACHERS—NATIONAL BOARD CERTIFICATION
TOTAL NUMBER OF NATIONAL BOARD CERTIFIED TEACHERS IN NEVADA AND WESTERN STATES, 2003-2004
Source: National Board for Professional Teaching Standards: http/www.nbpts.org
WA 580
ID 317
WY 52
CA 3,087
NV 183
CO 203
UT 77
AZ 239 NM
145
OR 147
MT 40

DEMOGRAPHIC DATA – STUDENTS AND EDUCATIONAL PERSONNEL
122
TEACHER ATTENDANCE
NEVADA TEACHER ATTENDANCE RATE STATEWIDE AND BY DISTRICT
1997-1998 THROUGH 2003-2004 SCHOOL YEARS*
School District 1997-1998 1998-1999 1999-2000 2000-2001 2003-2004
Carson City 93 95 94 95 95.9 Churchill 92.6 92.9 94.2 98.4 93.5 Clark 94 95 95 94.8 94.8 Douglas 94 96 96 96 95.8 Elko 94.3 94.9 94.8 92 95.7 Esmeralda N/A 97.2 96 97 96.9 Eureka 93 96 95 95 94.8 Humboldt 94.8 6 95 92 94.2 Lander 92.8 4.6 93.9 93.9 94.2 Lincoln 95.3 5 95 96 97.7 Lyon 95 4.3 95.7 95.6 95.2 Mineral 93 4 92.8 94 96.7 Nye 92 4 94 94 96.9 Pershing 94.7 5.5 92.7 91.6 91.7 Storey N/A 1 88 95 93.4 Washoe 94.4 5.3 N/R 95.4 97.3 White Pine 93.3 4.4 93 91.1 94.5 State 93.7 5 94.9 94.8 95.5
*The Nevada Department of Education did not collect this information for 2001-2002 and 2002-2003 School Years.
Source: Nevada Department of Education, 2003-2004 State Accountability Report. www.nevadareportcard.com.

DEMOGRAPHIC DATA – STUDENTS AND EDUCATIONAL PERSONNEL
123
TEACHERS TEACHING WITHIN LICENSE
PERCENT OF NEVADA CLASSROOM TEACHERS TEACHING WITHIN LICENSE
STATEWIDE AND BY DISTRICT 1997-2004
School District
1997-1998
1998-1999
1999-2000
2000-2001
2001-2002
2002-2003
2003-2004
Carson City 98 99.6 99 100 99.2 99.8 99.42 Churchill 100 100 99 97 100 99.28 100 Clark 99 98.2 98.1 97.9 99.62 99.66 99.66 Douglas 96 96 99 100 98.52 99.05 97.91 Elko 100 99.3 99.2 N/R 99.51 99.67 99.32 Esmeralda 100 90 100 89 100 100 100 Eureka 92 94 94 100 96.43 83.33 86.96 Humboldt 99.5 96.9 97 97 97.66 97.2 96.71 Lander 94 95 91 96 97.59 98.72 98.53 Lincoln 96 97 97 96 97.47 96.34 98.73 Lyon 100 100 100 100 99.75 100 99.56 Mineral 93 92 100 100 96.67 96.61 96.55 Nye 97 93 93 96 96.31 97.85 96.54 Pershing 100 100 96.6 98.3 100 100 100 Storey 82 100 97 100 97.22 100 100 Washoe 99 96 96 99 99.46 99.44 99.6 White Pine 88 100 100 100 93 90 90 State 98.7 97.7 97.7 N/A 99.42 99.47 99.45
Source: Nevada Department of Education, Teacher Licensing Office, December 2005.

DEMOGRAPHIC DATA – STUDENTS AND EDUCATIONAL PERSONNEL
124
TEACHERS—LICENSED PERSONNEL IN NEVADA SCHOOL DISTRICTS
AGES OF ALL LICENSED PERSONNEL IN NEVADA SCHOOL DISTRICTS 2003-2004 SCHOOL YEAR
Under 252%
25-2912%
60 & Older6%
50-5927%
40-4925%
30-3928%
Source: Nevada Department of Education 2004 Research Bulletin.
DEMOGRAPHIC DATA – STUDENTS AND EDUCATIONAL PERSONNEL
125
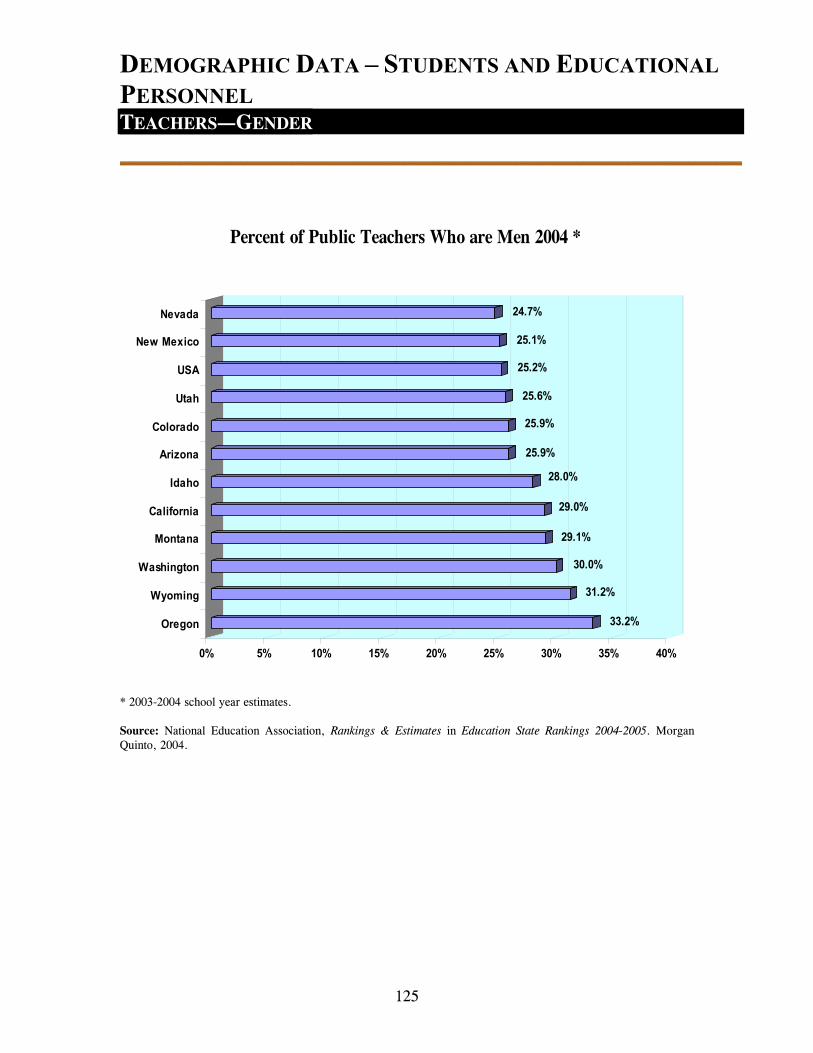
TEACHERS—GENDER
33.2%
31.2%
30.0%
29.1%
29.0%
28.0%
25.9%
25.9%
25.6%
25.2%
25.1%
24.7%
0% 5% 10% 15% 20% 25% 30% 35% 40%
Oregon
Wyoming
Washington
Montana
California
Idaho
Arizona
Colorado
Utah
USA
New Mexico
Nevada
Percent of Public Teachers Who are Men 2004 *
* 2003-2004 school year estimates. Source: National Education Association, Rankings & Estimates in Education State Rankings 2004-2005. Morgan Quinto, 2004.
