v.i.p. industries (vip in) -...
TRANSCRIPT

Rating: BUY | CMP: Rs444 | TP: Rs579
V.I.P. Industries (VIP IN)
Bag it for a sky ride
Jinesh Joshi [email protected] | 91-22-66322238
V.I.P. Industries
March 25, 2019 2
Contents
Page No.
Story in charts ........................................................................................................ 4
Company Overview ............................................................................................... 5
VIP is a formidable play on luggage market in India .......................................... 5
Investment Argument ............................................................................................. 7
Organized luggage industry on cusp of higher growth ....................................... 7
VIP all set to ride the growth phase in luggage industry ................................... 10
Creating twin levers of growth .......................................................................... 15
Channel checks indicate brand pull for Skybags is high; Carlton is a sturdy product ............................................................................................................. 16
Competitive landscape of the luggage industry ................................................ 17
Financial projections ............................................................................................ 21
VIP’s sales to grow at a CAGR of 23.7% over FY18-21E ................................ 21
Calibrated price hikes & better product mix to offset gross margin headwinds 22
Product premiumisation to aid in EBITDA margin expansion ........................... 24
Improvement in cash conversion cycle to drive OCF at a CAGR of 21.0% over FY18-21E ......................................................................................................... 25
Valuations ............................................................................................................ 26
Premium valuations justified; past history redundant ....................................... 26
Key tables & charts .............................................................................................. 28
Annexure ............................................................................................................. 29

March 25, 2019 3
Rating: BUY| CMP: Rs444 | TP: Rs579
Bag it for a sky ride
We initiate coverage on VIP Industries Ltd (VIP) with a BUY rating given
market leadership (~50% revenue share) in the organized luggage industry,
well-diversified product portfolio (six brands and multiple SKUs exceeding
1,500) and solid brand salience (brand-ex is ~5-7% of sales). Strong
distribution network (~11,000 touch points), GST implementation (narrowed
pricing gap with unorganized players resulting in up-trading) and entry into
the under penetrated ladies hand bags and backpack market is likely to drive
sales/PAT at a CAGR of 23.7%/25.1% over FY18-21E. While headwinds from
currency & crude volatility prevail, product premiumisation (rising share of
Caprese and Carlton) and increase in production from captive facilities at
Bangladesh will aid in 40bps EBITDA margin expansion over FY18-21E. We
expect premium valuations (32.7x FY20E and 25.3x FY21E) to sustain given
strong growth prospects, debt free BS, high return ratios (RoE/RoCE of
25.6%/36.9% in FY18; to expand by 230bps/310bps over FY18-21E), and
healthy dividend pay-out (average 41% over last 5 years). Initiate with a BUY
and TP of Rs579.
GST has proved to be a boon for the industry: Luggage/backpack/handbags
market is dominated by unorganized players with a share of ~67%/<67%/~90-92%
respectively. GST implementation has brought unorganized players within the tax
net and reduced the pricing gap making organized players more competitive.
However, our channel checks reveal that transition is still a work in progress and
the market is highly fragmented making full compliance a long drawn process.
Handbags & backpacks are key growth levers: Given changes made in price
point and revamping done in the distribution channel, we expect Caprese’s
revenues to increase at a CAGR of 35.0% over FY18-21E. Further share of
backpacks is likely to improve from ~15-20% of sales in FY18 to 22.1% in FY21E
as two additional brands have been launched, merchandize has seen improvement
and penetration is low.
Bangladesh expansion to improve profitability profile: As Bangladesh
operations gain scale dependency on China is expected to come down and improve
the profitability of VIP due to 1) better control over sourcing 2) accrual of
manufacturing profit within the company 3) labour cost arbitrage and 4) import duty
advantage.
Channel checks indicate brand pull for Skybags is high: Our channel checks
indicate that brand pull for Skybags is high, Carlton is extremely sturdy product, and
trade margins are highest for unbranded products. Further, Safari has strong
presence in hyper markets while quality issue on Samsonite’s products is fairly low.
Outlook & valuation: Valuations at 32.7x FY20E and 25.3x FY21E reflect the
brand premium and size of opportunity pie (transition towards organized market)
VIP has at its disposal post GST. We value the stock at 33x FY21E EPS in light of
strong growth prospects (sales/PAT to grow at a CAGR of 23.7%/25.1% over FY18-
21E), ensuing product premiumisation and rising share of Bangladesh operations
which will be margin accretive. Initiate with a BUY and TP of Rs579.
V.I.P. Industries (VIP IN)
March 25, 2019
Company Initiation
Key Financials (Consolidated)
FY18 FY19E FY20E FY21E
Sales (Rs. m) 14,096 17,917 21,897 26,695
EBITDA (Rs. m) 1,934 2,249 2,934 3,764
Margin (%) 13.7 12.6 13.4 14.1
PAT (Rs. m) 1,268 1,453 1,920 2,481
EPS (Rs.) 9.0 10.3 13.6 17.6
Gr. (%) 48.8 14.7 32.1 29.2
DPS (Rs.) 3.0 3.4 4.2 5.5
Yield (%) 0.7 0.8 0.9 1.2
RoE (%) 25.6 25.0 26.6 27.8
RoCE (%) 36.9 35.4 38.2 40.0
EV/Sales (x) 4.4 3.5 2.8 2.3
EV/EBITDA (x) 32.0 27.5 21.0 16.2
PE (x) 49.5 43.2 32.7 25.3
P/BV (x) 12.8 10.7 8.7 7.0
Key Data VIPI.BO | VIP IN
52-W High / Low Rs. 647 / Rs. 300
Sensex / Nifty 38,165 / 11,457
Market Cap Rs. 63 bn/ $ 910 m
Shares Outstanding 141m
3M Avg. Daily Value Rs. 425.67m
Shareholding Pattern (%)
Promoter’s 53.46
Foreign 10.54
Domestic Institution 8.06
Public & Others 27.94
Promoter Pledge (Rs bn) -
Stock Performance (%)
1M 6M 12M
Absolute 3.2 (12.7) 43.7
Relative (3.0) (15.7) 24.8
Jinesh Joshi
[email protected] | 91-22-66322238
V.I.P. Industries
March 25, 2019 4
Story in charts
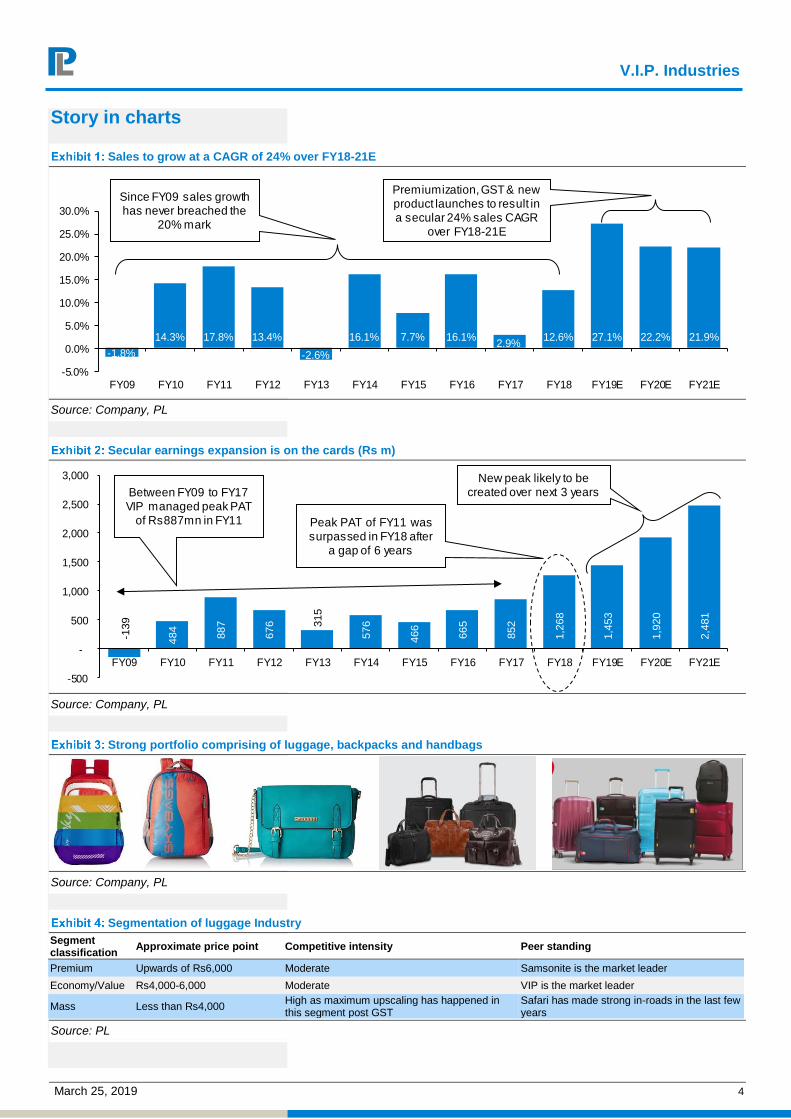
Sales to grow at a CAGR of 24% over FY18-21E
-1.8%
14.3% 17.8% 13.4%
-2.6%
16.1% 7.7% 16.1%2.9%
12.6% 27.1% 22.2% 21.9%
-5.0%
0.0%
5.0%
10.0%
15.0%
20.0%
25.0%
30.0%
FY09 FY10 FY11 FY12 FY13 FY14 FY15 FY16 FY17 FY18 FY19E FY20E FY21E
Since FY09 sales growth has never breached the
20% mark
Premiumization, GST & new product launches to result in a secular 24% sales CAGR
over FY18-21E
Source: Company, PL
Secular earnings expansion is on the cards (Rs m)
-139
484
887
676
315
576
466
665
852
1,2
68
1,4
53
1,9
20
2,4
81
-500
-
500
1,000
1,500
2,000
2,500
3,000
FY09 FY10 FY11 FY12 FY13 FY14 FY15 FY16 FY17 FY18 FY19E FY20E FY21E
Between FY09 to FY17 VIP managed peak PAT
of Rs887mn in FY11 Peak PAT of FY11 was surpassed in FY18 after
a gap of 6 years
New peak likely to be created over next 3 years
Source: Company, PL
Strong portfolio comprising of luggage, backpacks and handbags
Source: Company, PL
Segmentation of luggage Industry
Segment classification
Approximate price point Competitive intensity Peer standing
Premium Upwards of Rs6,000 Moderate Samsonite is the market leader
Economy/Value Rs4,000-6,000 Moderate VIP is the market leader
Mass Less than Rs4,000 High as maximum upscaling has happened in this segment post GST
Safari has made strong in-roads in the last few years
Source: PL
V.I.P. Industries
March 25, 2019 5
Company Overview
VIP is a formidable play on luggage market in India
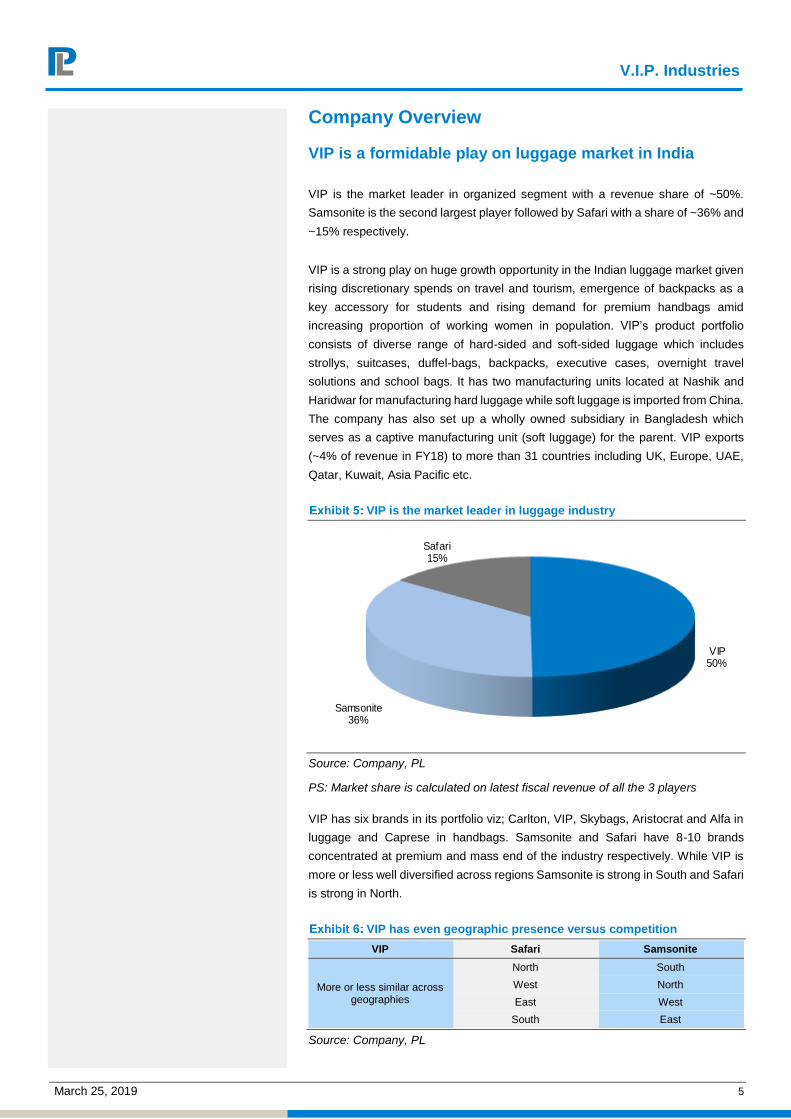
VIP is the market leader in organized segment with a revenue share of ~50%.
Samsonite is the second largest player followed by Safari with a share of ~36% and
~15% respectively.
VIP is a strong play on huge growth opportunity in the Indian luggage market given
rising discretionary spends on travel and tourism, emergence of backpacks as a
key accessory for students and rising demand for premium handbags amid
increasing proportion of working women in population. VIP’s product portfolio
consists of diverse range of hard-sided and soft-sided luggage which includes
strollys, suitcases, duffel-bags, backpacks, executive cases, overnight travel
solutions and school bags. It has two manufacturing units located at Nashik and
Haridwar for manufacturing hard luggage while soft luggage is imported from China.
The company has also set up a wholly owned subsidiary in Bangladesh which
serves as a captive manufacturing unit (soft luggage) for the parent. VIP exports
(~4% of revenue in FY18) to more than 31 countries including UK, Europe, UAE,
Qatar, Kuwait, Asia Pacific etc.
VIP is the market leader in luggage industry
VIP 50%
Samsonite 36%
Safari 15%
Source: Company, PL
PS: Market share is calculated on latest fiscal revenue of all the 3 players
VIP has six brands in its portfolio viz; Carlton, VIP, Skybags, Aristocrat and Alfa in
luggage and Caprese in handbags. Samsonite and Safari have 8-10 brands
concentrated at premium and mass end of the industry respectively. While VIP is
more or less well diversified across regions Samsonite is strong in South and Safari
is strong in North.
VIP has even geographic presence versus competition
VIP Safari Samsonite
More or less similar across geographies
North South
West North
East West
South East
Source: Company, PL
V.I.P. Industries
March 25, 2019 6
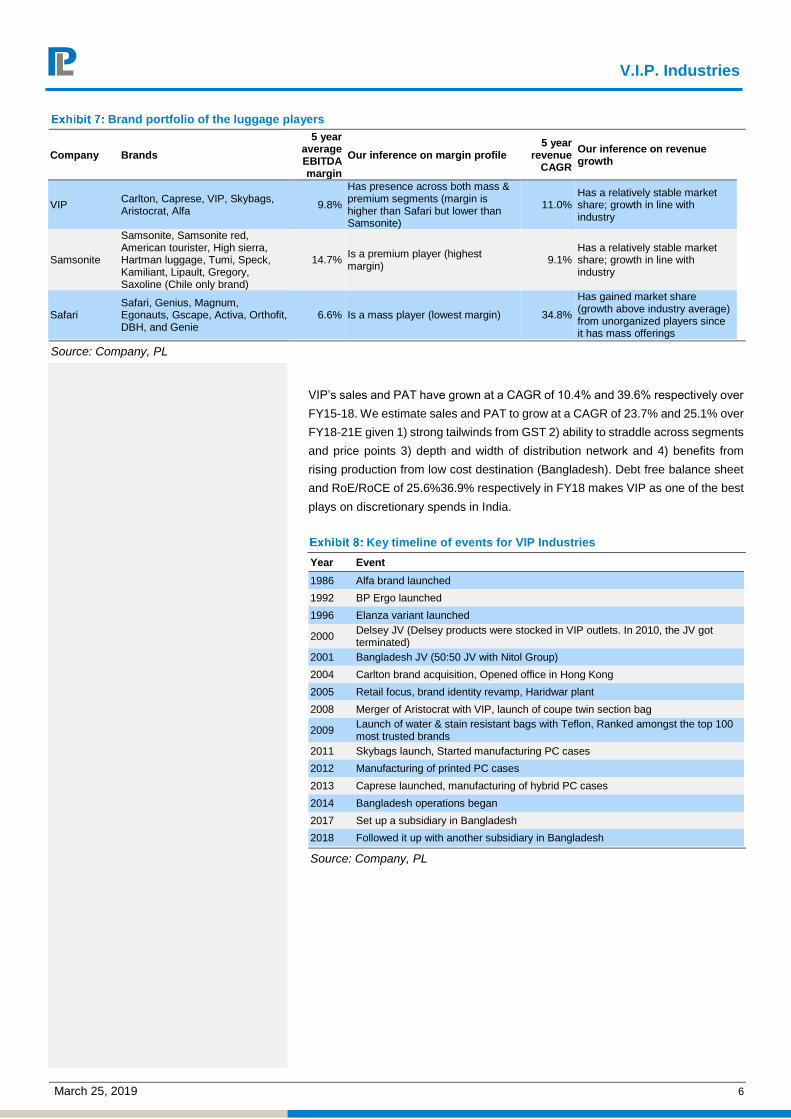
Brand portfolio of the luggage players
Company Brands
5 year average EBITDA margin
Our inference on margin profile 5 year
revenue CAGR
Our inference on revenue growth
VIP Carlton, Caprese, VIP, Skybags, Aristocrat, Alfa
9.8%
Has presence across both mass & premium segments (margin is higher than Safari but lower than Samsonite)
11.0% Has a relatively stable market share; growth in line with industry
Samsonite
Samsonite, Samsonite red, American tourister, High sierra, Hartman luggage, Tumi, Speck, Kamiliant, Lipault, Gregory, Saxoline (Chile only brand)
14.7% Is a premium player (highest margin)
9.1% Has a relatively stable market share; growth in line with industry
Safari Safari, Genius, Magnum, Egonauts, Gscape, Activa, Orthofit, DBH, and Genie
6.6% Is a mass player (lowest margin) 34.8%
Has gained market share (growth above industry average) from unorganized players since it has mass offerings
Source: Company, PL
VIP’s sales and PAT have grown at a CAGR of 10.4% and 39.6% respectively over
FY15-18. We estimate sales and PAT to grow at a CAGR of 23.7% and 25.1% over
FY18-21E given 1) strong tailwinds from GST 2) ability to straddle across segments
and price points 3) depth and width of distribution network and 4) benefits from
rising production from low cost destination (Bangladesh). Debt free balance sheet
and RoE/RoCE of 25.6%36.9% respectively in FY18 makes VIP as one of the best
plays on discretionary spends in India.
Key timeline of events for VIP Industries
Year Event
1986 Alfa brand launched
1992 BP Ergo launched
1996 Elanza variant launched
2000 Delsey JV (Delsey products were stocked in VIP outlets. In 2010, the JV got terminated)
2001 Bangladesh JV (50:50 JV with Nitol Group)
2004 Carlton brand acquisition, Opened office in Hong Kong
2005 Retail focus, brand identity revamp, Haridwar plant
2008 Merger of Aristocrat with VIP, launch of coupe twin section bag
2009 Launch of water & stain resistant bags with Teflon, Ranked amongst the top 100 most trusted brands
2011 Skybags launch, Started manufacturing PC cases
2012 Manufacturing of printed PC cases
2013 Caprese launched, manufacturing of hybrid PC cases
2014 Bangladesh operations began
2017 Set up a subsidiary in Bangladesh
2018 Followed it up with another subsidiary in Bangladesh
Source: Company, PL
V.I.P. Industries
March 25, 2019 7
Investment Argument
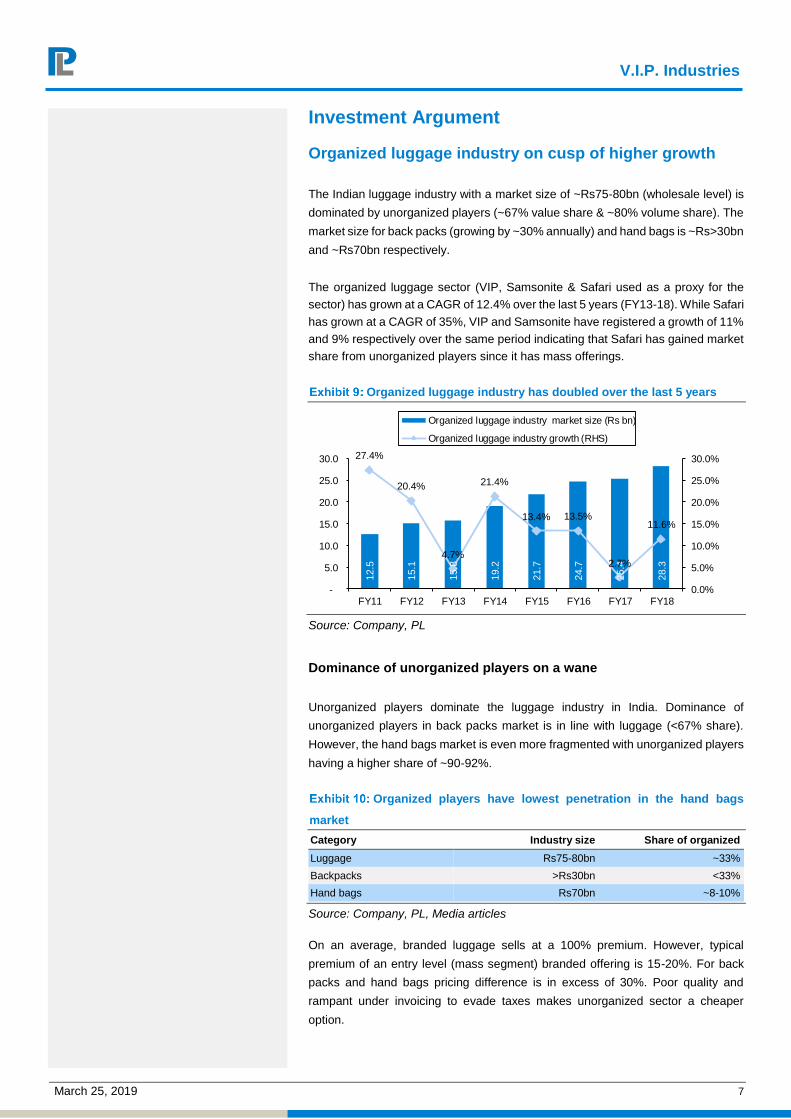
Organized luggage industry on cusp of higher growth
The Indian luggage industry with a market size of ~Rs75-80bn (wholesale level) is
dominated by unorganized players (~67% value share & ~80% volume share). The
market size for back packs (growing by ~30% annually) and hand bags is ~Rs>30bn
and ~Rs70bn respectively.
The organized luggage sector (VIP, Samsonite & Safari used as a proxy for the
sector) has grown at a CAGR of 12.4% over the last 5 years (FY13-18). While Safari
has grown at a CAGR of 35%, VIP and Samsonite have registered a growth of 11%
and 9% respectively over the same period indicating that Safari has gained market
share from unorganized players since it has mass offerings.
Organized luggage industry has doubled over the last 5 years
12.5
15.1
15.8
19.2
21.7
24.7
25.4
28.3
27.4%
20.4%
4.7%
21.4%
13.4% 13.5%
2.7%
11.6%
0.0%
5.0%
10.0%
15.0%
20.0%
25.0%
30.0%
-
5.0
10.0
15.0
20.0
25.0
30.0
FY11 FY12 FY13 FY14 FY15 FY16 FY17 FY18
Organized luggage industry market size (Rs bn)
Organized luggage industry growth (RHS)
Source: Company, PL
Dominance of unorganized players on a wane
Unorganized players dominate the luggage industry in India. Dominance of
unorganized players in back packs market is in line with luggage (<67% share).
However, the hand bags market is even more fragmented with unorganized players
having a higher share of ~90-92%.
Organized players have lowest penetration in the hand bags
market
Category Industry size Share of organized
Luggage Rs75-80bn ~33%
Backpacks >Rs30bn <33%
Hand bags Rs70bn ~8-10%
Source: Company, PL, Media articles
On an average, branded luggage sells at a 100% premium. However, typical
premium of an entry level (mass segment) branded offering is 15-20%. For back
packs and hand bags pricing difference is in excess of 30%. Poor quality and
rampant under invoicing to evade taxes makes unorganized sector a cheaper
option.
V.I.P. Industries
March 25, 2019 8
Unbranded sells cheap due to poor quality & under invoicing
Category Average discount to an organized player
Luggage 40-50%
Back packs ~50%
Hand bags >30-40%
Source: Company, PL
Over the last 1-2 years, penetration of organized players in all the 3 categories has
improved amid improving lifestyle, rising brand consciousness, better quality and
attractive price points. We expect organized players to further increase their
penetration and market share led by: -
Ability to innovate and launch variants: Organized players have significantly
increased innovations and new variant launches in recent past. We have seen
more innovations flowing in the polycarbonate segment which has seen launch
of vibrant colors and new designs specifically targeting female and children.
Soft luggage has seen a lot more variety in fabric and accessories which
unorganized players would find hard to match.
Lifetime replacement warranties: Further, the fact that organized players
offer warranties (typically 5 years in case of luggage and 1 year in case of
backpacks) makes them a preferred choice for buyers. More importantly,
domestic players have started highlighting the importance of warranties as it
would be very difficult to get any product repaired/warranty enforced in case of
unorganized brands.
We note that Safari has started offering replacement warranties rather than
repair warranties which has added to the attractiveness as an entry level
luggage at just 15-20% premium. VIP has also started offering lifetime
warranties for Carlton edge in the premium segment. We believe lifetime
warranties will go a long way in increasing the sales of organized players.
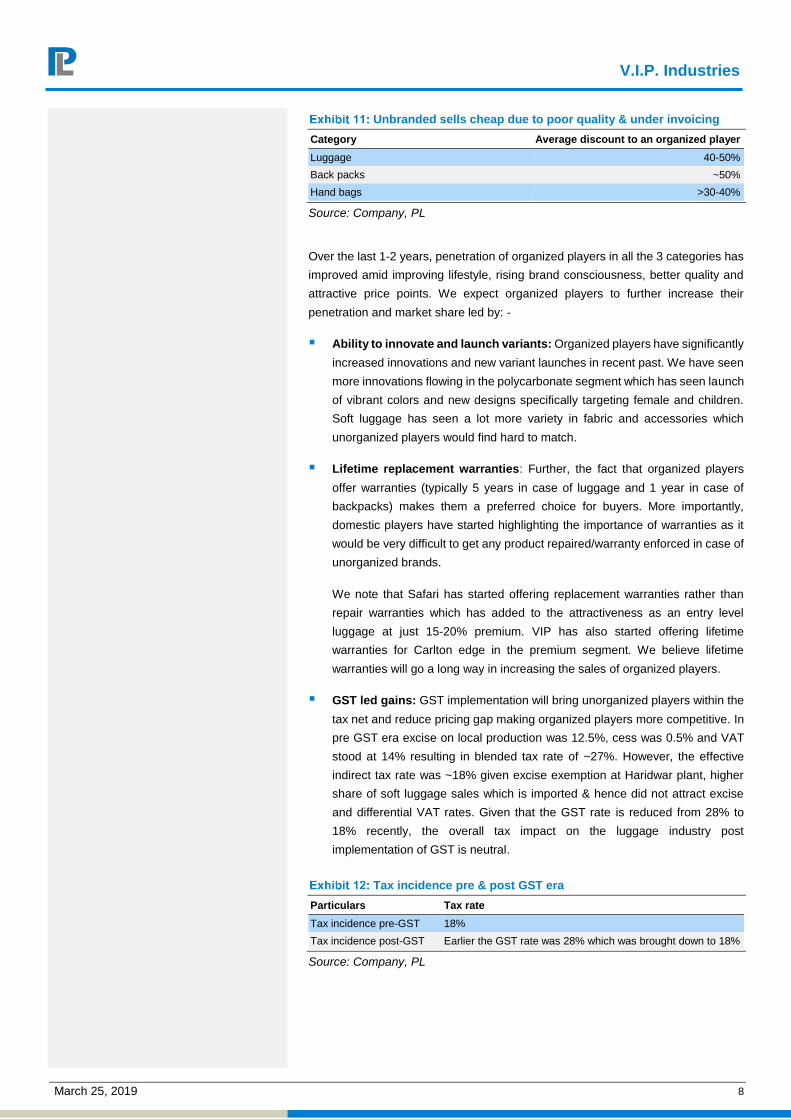
GST led gains: GST implementation will bring unorganized players within the
tax net and reduce pricing gap making organized players more competitive. In
pre GST era excise on local production was 12.5%, cess was 0.5% and VAT
stood at 14% resulting in blended tax rate of ~27%. However, the effective
indirect tax rate was ~18% given excise exemption at Haridwar plant, higher
share of soft luggage sales which is imported & hence did not attract excise
and differential VAT rates. Given that the GST rate is reduced from 28% to
18% recently, the overall tax impact on the luggage industry post
implementation of GST is neutral.
Tax incidence pre & post GST era
Particulars Tax rate
Tax incidence pre-GST 18%
Tax incidence post-GST Earlier the GST rate was 28% which was brought down to 18%
Source: Company, PL

V.I.P. Industries
March 25, 2019 9
Strong macro tailwinds to support industry growth
Growth in the luggage/backpack/handbag industry is linked to factors like 1)
employee work force/student growth (linked to backpack demand), 2) increasing
ratio of working women which induces discretionary spend (linked to handbag
demand) and 3) air traffic which is a function of growth in tourism & business travel
(linked to luggage demand).
Student enrolment in higher education rises at
4% CAGR over FY13-18
30.132.3 33.3 34.6 35.7 36.6
0
5
10
15
20
25
30
35
40
FY13 FY14 FY15 FY16 FY17 FY18
(mn
)
Source: AISHE, PL
Female labour force participation is on a steady
rise
26.8%
27.0%
27.1%
27.3%
27.5%
27.2%
26.4%
26.6%
26.8%
27.0%
27.2%
27.4%
27.6%
2012 2013 2014 2015 2016 2017
Source: World Bank, PL
Air traffic in India has grown at a CAGR of 9.9% over the last 10 years. Further,
domestic expenditure on tourism and number of domestic tourist visits have grown
at a CAGR of 7.2% and 9.6% respectively over the last 5 years.
Air traffic rises at a CAGR of 9.9% over FY08-FY18
72
68
77
89
99
98
104
116
135
158
184
-
50
100
150
200Air traffic (In mn)
Source: DGCA
PS: The traffic data includes inbound/outbound traffic of domestic
& international carriers
Rising discretionary spends aiding tourism
9%
12%12%
13%
2%6%7%
10% 9%
4%
0%
2%
4%
6%
8%
10%
12%
14%
2013 2014 2015 2016 2017
Domestic tourist visit growth rate
Domestic expenditure on tourism
Source: IBEF & Ministry of tourism
Despite growth of its air travel market over the past decade, India still has one of
the lowest air travel penetration rates in the world, as defined by annual domestic
carrier seats per capita.
V.I.P. Industries
March 25, 2019 10
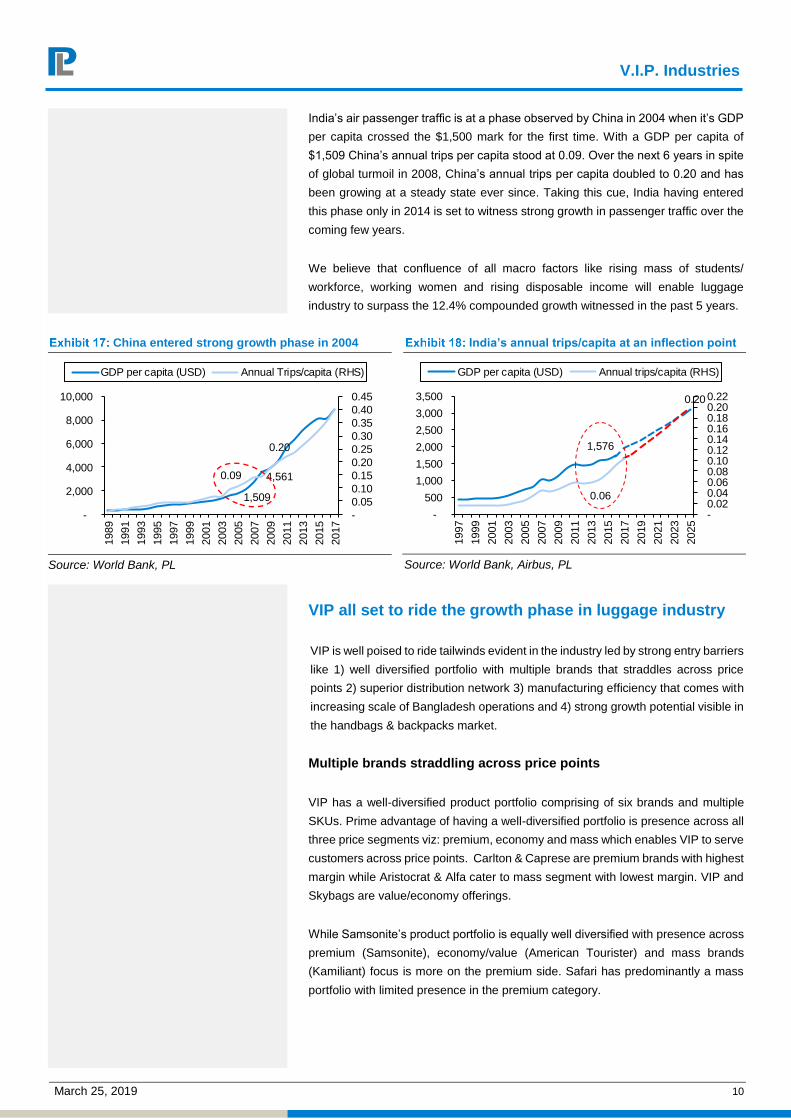
India’s air passenger traffic is at a phase observed by China in 2004 when it’s GDP
per capita crossed the $1,500 mark for the first time. With a GDP per capita of
$1,509 China’s annual trips per capita stood at 0.09. Over the next 6 years in spite
of global turmoil in 2008, China’s annual trips per capita doubled to 0.20 and has
been growing at a steady state ever since. Taking this cue, India having entered
this phase only in 2014 is set to witness strong growth in passenger traffic over the
coming few years.
We believe that confluence of all macro factors like rising mass of students/
workforce, working women and rising disposable income will enable luggage
industry to surpass the 12.4% compounded growth witnessed in the past 5 years.
China entered strong growth phase in 2004
1,509
4,561 0.09
0.20
-
0.05
0.10
0.15
0.20
0.25
0.30
0.35
0.40
0.45
-
2,000
4,000
6,000
8,000
10,000
1989
1991
1993
1995
1997
1999
2001
2003
2005
2007
2009
2011
2013
2015
2017
GDP per capita (USD) Annual Trips/capita (RHS)
Source: World Bank, PL
India’s annual trips/capita at an inflection point
Source: World Bank, Airbus, PL
VIP all set to ride the growth phase in luggage industry
VIP is well poised to ride tailwinds evident in the industry led by strong entry barriers
like 1) well diversified portfolio with multiple brands that straddles across price
points 2) superior distribution network 3) manufacturing efficiency that comes with
increasing scale of Bangladesh operations and 4) strong growth potential visible in
the handbags & backpacks market.
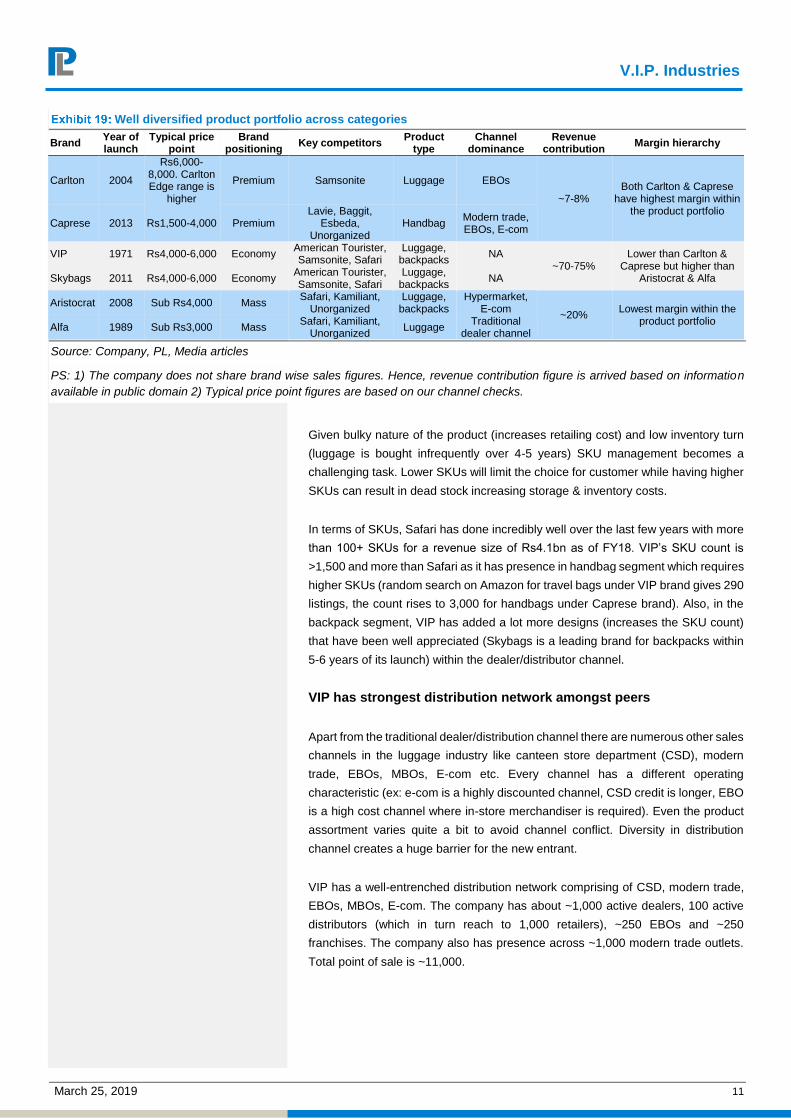
Multiple brands straddling across price points
VIP has a well-diversified product portfolio comprising of six brands and multiple
SKUs. Prime advantage of having a well-diversified portfolio is presence across all
three price segments viz: premium, economy and mass which enables VIP to serve
customers across price points. Carlton & Caprese are premium brands with highest
margin while Aristocrat & Alfa cater to mass segment with lowest margin. VIP and
Skybags are value/economy offerings.
While Samsonite’s product portfolio is equally well diversified with presence across
premium (Samsonite), economy/value (American Tourister) and mass brands
(Kamiliant) focus is more on the premium side. Safari has predominantly a mass
portfolio with limited presence in the premium category.
1,576
0.06
0.20
- 0.02 0.04 0.06 0.08 0.10 0.12 0.14 0.16 0.18 0.20 0.22
-
500
1,000
1,500
2,000
2,500
3,000
3,500
1997
1999
2001
2003
2005
2007
2009
2011
2013
2015
2017
2019
2021
2023
2025
GDP per capita (USD) Annual trips/capita (RHS)
V.I.P. Industries
March 25, 2019 11
Well diversified product portfolio across categories
Brand Year of launch
Typical price point
Brand positioning
Key competitors Product
type Channel
dominance Revenue
contribution Margin hierarchy
Carlton 2004
Rs6,000-8,000. Carlton Edge range is
higher
Premium Samsonite Luggage EBOs
~7-8% Both Carlton & Caprese
have highest margin within the product portfolio
Caprese 2013 Rs1,500-4,000 Premium Lavie, Baggit,
Esbeda, Unorganized
Handbag Modern trade, EBOs, E-com
VIP 1971 Rs4,000-6,000 Economy American Tourister, Samsonite, Safari
Luggage, backpacks
NA ~70-75%
Lower than Carlton & Caprese but higher than
Aristocrat & Alfa Skybags 2011 Rs4,000-6,000 Economy American Tourister, Samsonite, Safari
Luggage, backpacks
NA
Aristocrat 2008 Sub Rs4,000 Mass Safari, Kamiliant,
Unorganized Luggage,
backpacks Hypermarket,
E-com ~20%
Lowest margin within the product portfolio
Alfa 1989 Sub Rs3,000 Mass Safari, Kamiliant,
Unorganized Luggage
Traditional dealer channel
Source: Company, PL, Media articles
PS: 1) The company does not share brand wise sales figures. Hence, revenue contribution figure is arrived based on information
available in public domain 2) Typical price point figures are based on our channel checks.
Given bulky nature of the product (increases retailing cost) and low inventory turn
(luggage is bought infrequently over 4-5 years) SKU management becomes a
challenging task. Lower SKUs will limit the choice for customer while having higher
SKUs can result in dead stock increasing storage & inventory costs.
In terms of SKUs, Safari has done incredibly well over the last few years with more
than 100+ SKUs for a revenue size of Rs4.1bn as of FY18. VIP’s SKU count is
>1,500 and more than Safari as it has presence in handbag segment which requires
higher SKUs (random search on Amazon for travel bags under VIP brand gives 290
listings, the count rises to 3,000 for handbags under Caprese brand). Also, in the
backpack segment, VIP has added a lot more designs (increases the SKU count)
that have been well appreciated (Skybags is a leading brand for backpacks within
5-6 years of its launch) within the dealer/distributor channel.
VIP has strongest distribution network amongst peers
Apart from the traditional dealer/distribution channel there are numerous other sales
channels in the luggage industry like canteen store department (CSD), modern
trade, EBOs, MBOs, E-com etc. Every channel has a different operating
characteristic (ex: e-com is a highly discounted channel, CSD credit is longer, EBO
is a high cost channel where in-store merchandiser is required). Even the product
assortment varies quite a bit to avoid channel conflict. Diversity in distribution
channel creates a huge barrier for the new entrant.
VIP has a well-entrenched distribution network comprising of CSD, modern trade,
EBOs, MBOs, E-com. The company has about ~1,000 active dealers, 100 active
distributors (which in turn reach to 1,000 retailers), ~250 EBOs and ~250
franchises. The company also has presence across ~1,000 modern trade outlets.
Total point of sale is ~11,000.

V.I.P. Industries
March 25, 2019 12
Modern & retail trade dominates the distribution network for VIP
Distribution channel
Revenue contribution for VIP
Revenue contribution for
Safari
Revenue contribution for
Samsonite
Modern & general trade
Data not available but the category has highest share in revenues. Both modern trade & general
trade are at par.
~50% (Modern trade & general trade
account 25% each) NA
CSD ~20% ~25% NA
Institutional Data not available but has the third highest share in revenues
Both e-com & institutional contribute
~25%
NA
E-com ~6% ~14%
Source: Company, PL, Media articles
In comparison to VIP, Safari’s penetration in dealer/distribution network is low.
However, the CSD share is higher. Safari has 40-50 EBOs (lower than VIP) but is
planning to expand the stores in high footfall areas. In all, Safari has >3,500
customer touch points. On the other hand, Samsonite has more than 350 stores
across India.
Both Samsonite and Safari have a higher share of E-com as they do not have a
vast dealer network like VIP. Since E-com is a highly discounted channel unless
the manufacturer has a different product assortment, it can create a channel conflict
with traditional channel partners. (Dealers can refuse to stock inventory as the same
product is sold on other channel at a discounted price).
Despite having strongest distribution network amongst peer’s VIP is facing a
structural challenge as consumers are moving away from traditional
dealer/distribution channel (where VIP is stronger than peers) to other channels like
modern trade, e-com, EBOs etc which offers a better environment to shop.
However, in line with evolving shopping trends, VIP has improved its presence
meaningfully in other channels (E-com revenue share has increased from 3% to
6%; focus on expanding via EBOs/franchise is also rising) to ensure that it does not
lose market share to competitors. Typically margins across channels are similar,
however, EBO’s have highest margins while E-com has lowest margins.
Share of CSD going down with rising penetration in other channels
CSD is a Government of India enterprise which provides access to quality products
(household requisites, watches & stationery, general use items etc) of daily use at
below market rates to the armed forces. The department has 34 depots and 3,000
odd canteens located all over India.
Since there is no trade margin, prices in CSD are lower (there is a tax advantage
too which further helps in price reduction). However, establishing presence in the
channel is difficult as it takes about 9 months to get the design approved and listed.
Also, taking a price hike in the channel takes a bit longer than other channels as
there is a process which needs to be followed to get the approvals. Pricing & product
assortment for CSD happens at HO and there is no need to negotiate with each
CSD individually. As seen in exhibit 20, Safari’s revenue share in CSD is higher
than VIP Industries given Mr Sudhir Jatia (CMD and an ex-MD of VIP Industries)
has strong relationship with CSD officials (CSD business is dependent on
relationship).

V.I.P. Industries
March 25, 2019 13
CSD remains as one of the key distribution channels although its share in industry
sales has started declining in past 3-4 years. This follows quantitative restriction on
consumer purchases, lower CSD allocations by ministry and working capital issues.
In addition, better shopping experience, higher discounts and convenience is taking
consumers towards emerging channels like e-com, modern trade etc.
Efficiencies in manufacturing & procurement provides competitive
advantage
Increasing share of captive manufacturing from Bangladesh will increase
efficiencies in production while scale advantage that comes from bulk China
sourcing provides huge competitive advantage to VIP.
Bangladesh expansion to improve profitability profile
In order to reduce dependency on China as it is witnessing wage inflation, VIP has
set up a captive soft luggage (SL) manufacturing facility in Bangladesh. VIP has 3
subsidiaries in Bangladesh viz; VIP Bangladesh Ltd (established in 2012), VIP
Industries BD Manufacturing Pvt Ltd (established in Sep 2017; has a 7-year tax
holiday) and VIP Luggage BD Pvt Ltd (established in 2018) with a capacity of 2.1mn
units. The plan is to increase the capacity to 3.5mn units by end of FY19.
Currently, China is the largest SL sourcing destination for VIP. However, as
Bangladesh operations gain scale dependency on China is expected to come down
and improve the profitability of VIP due to 1) labour cost arbitrage 2) better control
over sourcing and 3) import duty advantage.
China dominates the sales mix for VIP
Country Contribution to sales Comments
China >50% of sales Mostly SL. Fully outsourced
India ~25-30% of sales Mix of HL & SL. HL is manufactured in-house while SL is sourced from vendors
Bangladesh ~4-5% of sales Mostly SL. Own manufacturing
Source: Company, PL
Labour cost arbitrage: Rising wage inflation in China is the primary reason for
setting up manufacturing operations in Bangladesh. Roughly, labour cost in China
is 4x of Bangladesh. SL is highly labour intensive (in order to manufacture the
current quantum/value of SL internally VIP would need additional 10,000-12,000
employees; (current strength as of FY18 including contractual labour is 5,069
employees) and thus there is a huge labour arbitrage in shifting Bangladesh.
With Bangladesh operations, in addition to distribution margin, manufacturing
margin would also accrue within the company.
V.I.P. Industries
March 25, 2019 14
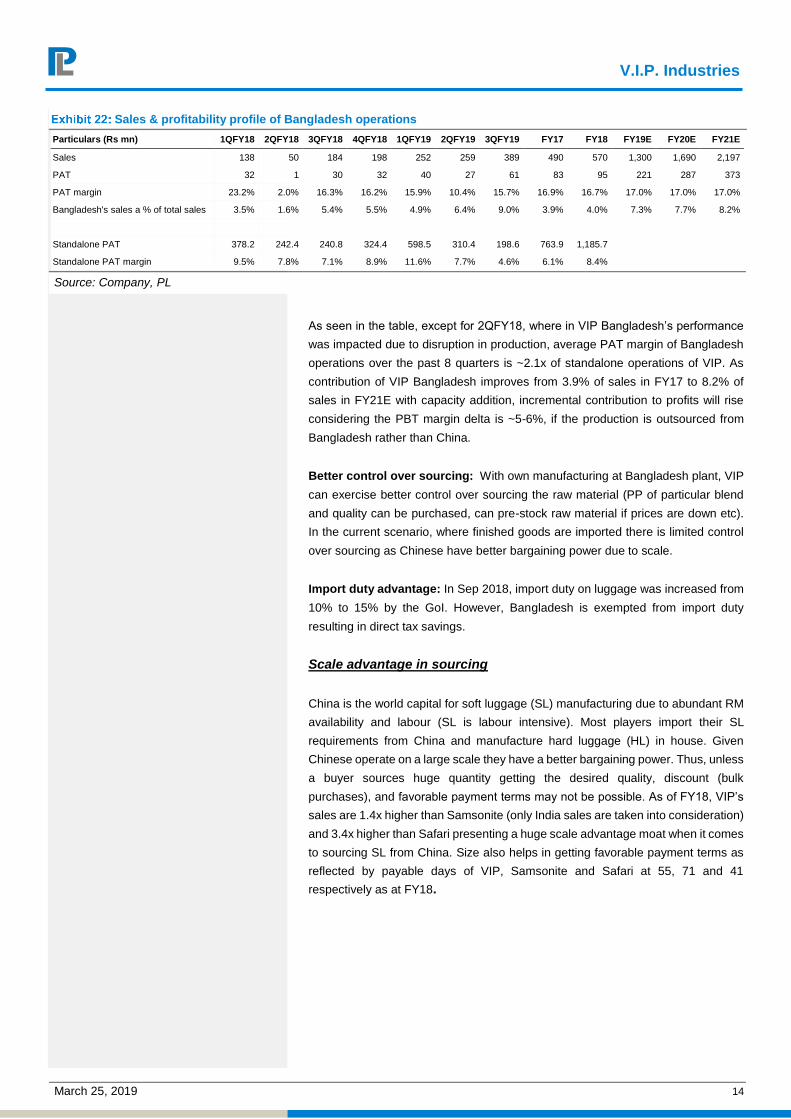
Sales & profitability profile of Bangladesh operations
Particulars (Rs mn) 1QFY18 2QFY18 3QFY18 4QFY18 1QFY19 2QFY19 3QFY19 FY17 FY18 FY19E FY20E FY21E
Sales 138 50 184 198 252 259 389 490 570 1,300 1,690 2,197
PAT 32 1 30 32 40 27 61 83 95 221 287 373
PAT margin 23.2% 2.0% 16.3% 16.2% 15.9% 10.4% 15.7% 16.9% 16.7% 17.0% 17.0% 17.0%
Bangladesh's sales a % of total sales 3.5% 1.6% 5.4% 5.5% 4.9% 6.4% 9.0% 3.9% 4.0% 7.3% 7.7% 8.2%
Standalone PAT 378.2 242.4 240.8 324.4 598.5 310.4 198.6 763.9 1,185.7
Standalone PAT margin 9.5% 7.8% 7.1% 8.9% 11.6% 7.7% 4.6% 6.1% 8.4%
Source: Company, PL
As seen in the table, except for 2QFY18, where in VIP Bangladesh’s performance
was impacted due to disruption in production, average PAT margin of Bangladesh
operations over the past 8 quarters is ~2.1x of standalone operations of VIP. As
contribution of VIP Bangladesh improves from 3.9% of sales in FY17 to 8.2% of
sales in FY21E with capacity addition, incremental contribution to profits will rise
considering the PBT margin delta is ~5-6%, if the production is outsourced from
Bangladesh rather than China.
Better control over sourcing: With own manufacturing at Bangladesh plant, VIP
can exercise better control over sourcing the raw material (PP of particular blend
and quality can be purchased, can pre-stock raw material if prices are down etc).
In the current scenario, where finished goods are imported there is limited control
over sourcing as Chinese have better bargaining power due to scale.
Import duty advantage: In Sep 2018, import duty on luggage was increased from
10% to 15% by the GoI. However, Bangladesh is exempted from import duty
resulting in direct tax savings.
Scale advantage in sourcing
China is the world capital for soft luggage (SL) manufacturing due to abundant RM
availability and labour (SL is labour intensive). Most players import their SL
requirements from China and manufacture hard luggage (HL) in house. Given
Chinese operate on a large scale they have a better bargaining power. Thus, unless
a buyer sources huge quantity getting the desired quality, discount (bulk
purchases), and favorable payment terms may not be possible. As of FY18, VIP’s
sales are 1.4x higher than Samsonite (only India sales are taken into consideration)
and 3.4x higher than Safari presenting a huge scale advantage moat when it comes
to sourcing SL from China. Size also helps in getting favorable payment terms as
reflected by payable days of VIP, Samsonite and Safari at 55, 71 and 41
respectively as at FY18.

V.I.P. Industries
March 25, 2019 15
Creating twin levers of growth
VIP has been synonymous with suitcase and luggage in India. However, over the
last few years it has laid lot of focus on emerging segments like backpacks and
ladies handbags to accelerate the growth. Backpacks currently contribute ~15-20%
of sales while Caprese has achieved sales in excess of Rs1bn.
Backpacks – huge potential given low penetration
Having entered the market only about 4-5 years ago, Skybags today is the leading
backpack brand for VIP. Aggressive pricing to begin with, good product assortment
and attractive price points in the range of Rs1,000-2,000 has enabled Skybags to
gain market share. Back pack as a category has grown at a CAGR of more than
30% for the last 3-4 years and is expected to sustain the growth momentum as:
Backpacks are more light weight and in demand as they are stylish,
comfortable and hassle-free. Further, their demand is linked to 2W, organized
workforce and student strength which has seen a rise over the last few years.
We see the trend continuing, till a new substitute emerges.
Penetration is less than luggage and it is a repeat item (new backpack is bought
once every 2-3 years as compared to luggage which is bought every 4-5 years)
Backpack market is led by local and unorganized segment, as the product has
gained wide acceptance in past 5-7 years only. Branded segment has huge
scope led by increased distribution and consumer up-gradation.
Backpacks: A brief overview
Brands Skybag, Aristocrat, VIP
Price point Rs1,000-2,000
Margin profile GM is in line with luggage but less than hand bags
Is the brand being advertised?
Yes
Brand Ambassador Varun Dhawan for Skybags
Key competing brands American Tourister, High Sierra, Safari, Wildcraft, Fast track
Seasonality Yes, majority of the sales happen in 4Q
Category growth >30%
Revenue contribution ~15-20% of sales
Source: Company, PL
Share of backpack in overall revenues has increased from 12% in FY16 to ~15-
20% in FY18 and is expected to rise further to 22.1% in FY21E as two additional
brands viz; Aristocrat (value pricing) & VIP backpacks (premium pricing) have been
launched, the merchandize has seen improvement and penetration is low.
Caprese to grow at a CAGR of 35% over FY18-21E
VIP Industries entered the ladies hand bags market with the launch of Caprese in
2013. Caprese is positioned in the synthetic leather segment to compete with the
likes of Lavie, Baggit and Esbeda and is a premium brand targeting the core age
group of 20-45 years. Despite initial challenges in establishing the brand, setting
the right price point and revamping the distribution, Caprese has achieved sales of
Rs1bn (47% CAGR since inception) in FY18 and it is amongst the top 5 handbag
brands in India.

V.I.P. Industries
March 25, 2019 16
Product and price positioning
Initially the hand bag was priced in the range of Rs4,000-5,000 but it did not get the
desired response (margins in unbranded are higher) and thus the price was lowered
(average price now is in the range of Rs2,000-3,000) which increased affordability.
Given branding plays a big role in the ladies’ handbags market, VIP has hired Alia
Bhatt to endorse its brand. Further, entry into the mass premium segment ruled by
unorganized players will further open the playing field for VIP.
Modern trade, EBO’s & E-com hold key
Caprese has presence in ~200 modern trade outlets and ~300 EBOs. It also has
presence in department stores and e-com. However, it has negligible presence in
the traditional dealer/distribution channel where VIP is strong. If VIP is able to milk
this channel to its advantage (convince dealers to sell Caprese as against
unbranded/private label products), we believe Caprese could be a far bigger brand
like VIP and Skybags. However, high margins in the unbranded category (little
incentive to stock Caprese) and fundamental shift towards hyper markets & modern
trade for shopping (puts pressure on dealer channel as footfalls come down) are
key challenges to expand in the traditional channel. We believe as penetration in
EBOs, modern trade and e-com rises the brand will gain further credence.
Caprese: A brief overview
Brand name Caprese
Launch date 2013
Product type Hobo, clutch, satchel, laptop satchel, sling, tote, wallet, handbag, crossbody, sleeve
Price point Rs 1,500-4,000
Brand size Over Rs1bn
Margin profile EBITDA positive, GM is better than luggage & backpacks
Is the brand being advertised? Yes
Brand Ambassador Alia Bhatt
Distribution model Modern trade, EBOs, E-com. Little presence in traditional dealer/distribution channel
Key competing brands Lavie, Baggit, Esbeda. Hidesign and DaMilano are in genuine leather segment and hence not direct competitors.
Touch points More than 1,000; >40% of sales is from E-com
Source: Company, PL
Given changes made in price point and revamping done in the distribution channel
we expect Caprese’s share in revenues to rise from ~7.1% in FY18 to ~9.2% in
FY21E (35% revenue CAGR over the next 3 years). Rising share of Caprese will
uplift the EBITDA (high margin product than luggage) profile of VIP.
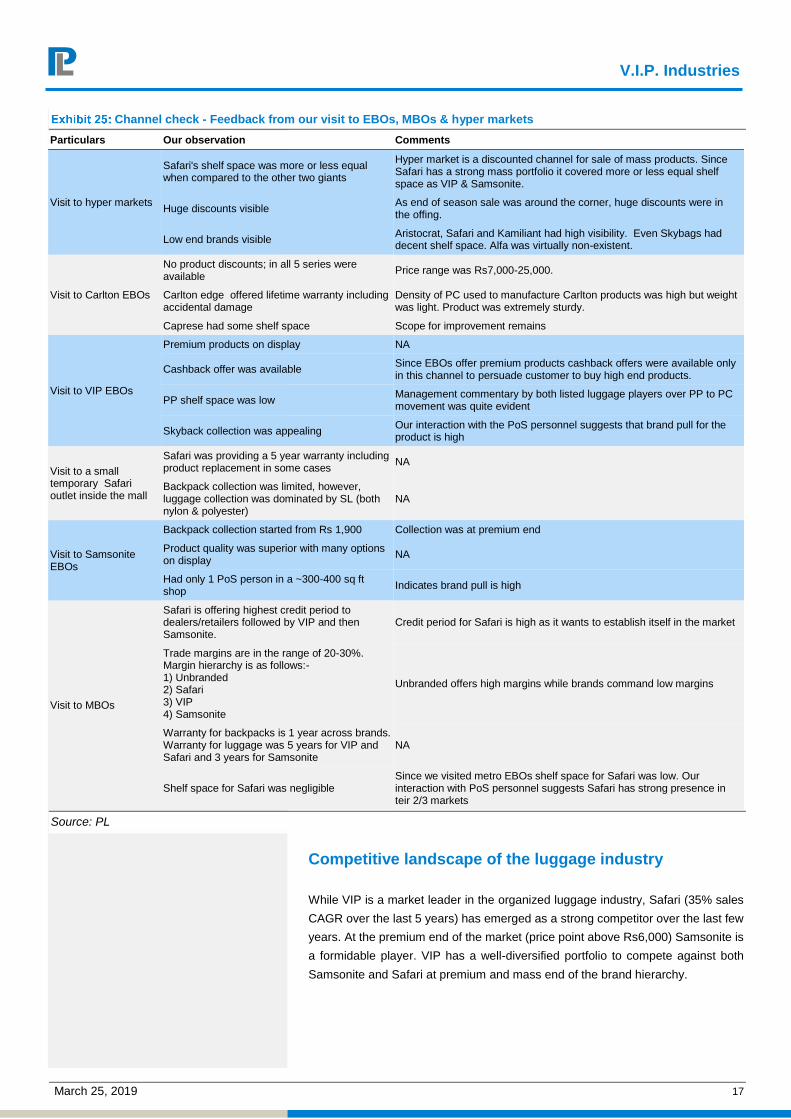
Channel checks indicate brand pull for Skybags is high; Carlton is a sturdy product
Key findings from our visits to MBOs, EBOs, hypermarkets of VIP, Safari and
Samsonite indicate that 1) trade margins are in the region of 20-30% with
unbranded having the highest margin 2) brand pull for Skybag is high and collection
is well accepted by the market 3) Carlton is extremely sturdy product (limited
possibility of lifetime warranty to be invoked) with no discounts being offered 4)
Caprese had limited shelf space in Carlton EBOs. In hypermarkets, collection of
Lavie and Baggit was at par/sometimes even better than Caprese 5) VIP EBOs
were offering cash back (not present in other channels) 6) Quality issue on
Samsonite product was low (limited customer complaints) 7) Safari is offering
highest credit period to dealers/retailers.
V.I.P. Industries
March 25, 2019 17
Channel check - Feedback from our visit to EBOs, MBOs & hyper markets
Particulars Our observation Comments
Visit to hyper markets
Safari's shelf space was more or less equal when compared to the other two giants
Hyper market is a discounted channel for sale of mass products. Since Safari has a strong mass portfolio it covered more or less equal shelf space as VIP & Samsonite.
Huge discounts visible As end of season sale was around the corner, huge discounts were in the offing.
Low end brands visible Aristocrat, Safari and Kamiliant had high visibility. Even Skybags had decent shelf space. Alfa was virtually non-existent.
Visit to Carlton EBOs
No product discounts; in all 5 series were available
Price range was Rs7,000-25,000.
Carlton edge offered lifetime warranty including accidental damage
Density of PC used to manufacture Carlton products was high but weight was light. Product was extremely sturdy.
Caprese had some shelf space Scope for improvement remains
Visit to VIP EBOs
Premium products on display NA
Cashback offer was available Since EBOs offer premium products cashback offers were available only in this channel to persuade customer to buy high end products.
PP shelf space was low Management commentary by both listed luggage players over PP to PC movement was quite evident
Skyback collection was appealing Our interaction with the PoS personnel suggests that brand pull for the product is high
Visit to a small temporary Safari outlet inside the mall
Safari was providing a 5 year warranty including product replacement in some cases
NA
Backpack collection was limited, however, luggage collection was dominated by SL (both nylon & polyester)
NA
Visit to Samsonite EBOs
Backpack collection started from Rs 1,900 Collection was at premium end
Product quality was superior with many options on display
NA
Had only 1 PoS person in a ~300-400 sq ft shop
Indicates brand pull is high
Visit to MBOs
Safari is offering highest credit period to dealers/retailers followed by VIP and then Samsonite.
Credit period for Safari is high as it wants to establish itself in the market
Trade margins are in the range of 20-30%. Margin hierarchy is as follows:- 1) Unbranded 2) Safari 3) VIP 4) Samsonite
Unbranded offers high margins while brands command low margins
Warranty for backpacks is 1 year across brands. Warranty for luggage was 5 years for VIP and Safari and 3 years for Samsonite
NA
Shelf space for Safari was negligible Since we visited metro EBOs shelf space for Safari was low. Our interaction with PoS personnel suggests Safari has strong presence in teir 2/3 markets
Source: PL
Competitive landscape of the luggage industry
While VIP is a market leader in the organized luggage industry, Safari (35% sales
CAGR over the last 5 years) has emerged as a strong competitor over the last few
years. At the premium end of the market (price point above Rs6,000) Samsonite is
a formidable player. VIP has a well-diversified portfolio to compete against both
Samsonite and Safari at premium and mass end of the brand hierarchy.
V.I.P. Industries
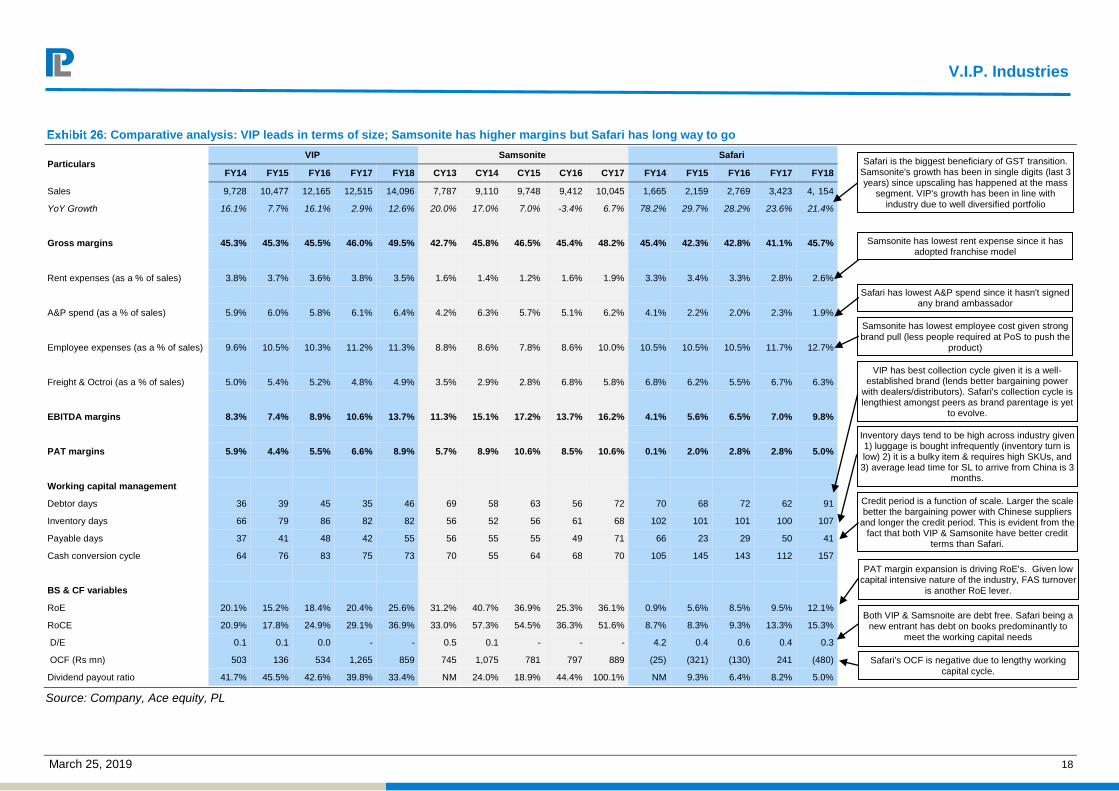
March 25, 2019 18
Comparative analysis: VIP leads in terms of size; Samsonite has higher margins but Safari has long way to go
Particulars VIP Samsonite Safari
FY14 FY15 FY16 FY17 FY18 CY13 CY14 CY15 CY16 CY17 FY14 FY15 FY16 FY17 FY18
Sales 9,728 10,477 12,165 12,515 14,096 7,787 9,110 9,748 9,412 10,045 1,665 2,159 2,769 3,423 4, 154
YoY Growth 16.1% 7.7% 16.1% 2.9% 12.6% 20.0% 17.0% 7.0% -3.4% 6.7% 78.2% 29.7% 28.2% 23.6% 21.4%
Gross margins 45.3% 45.3% 45.5% 46.0% 49.5% 42.7% 45.8% 46.5% 45.4% 48.2% 45.4% 42.3% 42.8% 41.1% 45.7%
Rent expenses (as a % of sales) 3.8% 3.7% 3.6% 3.8% 3.5% 1.6% 1.4% 1.2% 1.6% 1.9% 3.3% 3.4% 3.3% 2.8% 2.6%
A&P spend (as a % of sales) 5.9% 6.0% 5.8% 6.1% 6.4% 4.2% 6.3% 5.7% 5.1% 6.2% 4.1% 2.2% 2.0% 2.3% 1.9%
Employee expenses (as a % of sales) 9.6% 10.5% 10.3% 11.2% 11.3% 8.8% 8.6% 7.8% 8.6% 10.0% 10.5% 10.5% 10.5% 11.7% 12.7%
Freight & Octroi (as a % of sales) 5.0% 5.4% 5.2% 4.8% 4.9% 3.5% 2.9% 2.8% 6.8% 5.8% 6.8% 6.2% 5.5% 6.7% 6.3%
EBITDA margins 8.3% 7.4% 8.9% 10.6% 13.7% 11.3% 15.1% 17.2% 13.7% 16.2% 4.1% 5.6% 6.5% 7.0% 9.8%
PAT margins 5.9% 4.4% 5.5% 6.6% 8.9% 5.7% 8.9% 10.6% 8.5% 10.6% 0.1% 2.0% 2.8% 2.8% 5.0%
Working capital management
Debtor days 36 39 45 35 46 69 58 63 56 72 70 68 72 62 91
Inventory days 66 79 86 82 82 56 52 56 61 68 102 101 101 100 107
Payable days 37 41 48 42 55 56 55 55 49 71 66 23 29 50 41
Cash conversion cycle 64 76 83 75 73 70 55 64 68 70 105 145 143 112 157
BS & CF variables
RoE 20.1% 15.2% 18.4% 20.4% 25.6% 31.2% 40.7% 36.9% 25.3% 36.1% 0.9% 5.6% 8.5% 9.5% 12.1%
RoCE 20.9% 17.8% 24.9% 29.1% 36.9% 33.0% 57.3% 54.5% 36.3% 51.6% 8.7% 8.3% 9.3% 13.3% 15.3%
D/E 0.1 0.1 0.0 - - 0.5 0.1 - - - 4.2 0.4 0.6 0.4 0.3
OCF (Rs mn) 503 136 534 1,265 859 745 1,075 781 797 889 (25) (321) (130) 241 (480)
Dividend payout ratio 41.7% 45.5% 42.6% 39.8% 33.4% NM 24.0% 18.9% 44.4% 100.1% NM 9.3% 6.4% 8.2% 5.0%
Source: Company, Ace equity, PL
Safari is the biggest beneficiary of GST transition. Samsonite's growth has been in single digits (last 3 years) since upscaling has happened at the mass
segment. VIP's growth has been in line with industry due to well diversified portfolio
Samsonite has lowest rent expense since it has adopted franchise model
Safari has lowest A&P spend since it hasn't signed any brand ambassador
Samsonite has lowest employee cost given strong brand pull (less people required at PoS to push the
product)
VIP has best collection cycle given it is a well-established brand (lends better bargaining power
with dealers/distributors). Safari's collection cycle is lengthiest amongst peers as brand parentage is yet
to evolve.
Inventory days tend to be high across industry given 1) luggage is bought infrequently (inventory turn is low) 2) it is a bulky item & requires high SKUs, and 3) average lead time for SL to arrive from China is 3
months.
Credit period is a function of scale. Larger the scale better the bargaining power with Chinese suppliers
and longer the credit period. This is evident from the fact that both VIP & Samsonite have better credit
terms than Safari.
PAT margin expansion is driving RoE's. Given low capital intensive nature of the industry, FAS turnover
is another RoE lever.
Both VIP & Samsnoite are debt free. Safari being a new entrant has debt on books predominantly to
meet the working capital needs
Safari's OCF is negative due to lengthy working
capital cycle.
V.I.P. Industries
March 25, 2019 19
As seen in the table, VIP’s 5-year average EBITDA margin is higher by 320 bps
than Safari but lower by 490 bps than Samsonite. Factors that result in margin
diversity amongst peers include differences in 1) rent expenses 2) A&P spend 3)
employee expenses.
Samsonite has lowest rent expenses due to franchise model
Rent expense is a function of EBOs. VIP has ~250, Safari has ~40-50, while
Samsonite has more than 350 stores (exact EBO count not available). Samsonite
has lowest rent expense amongst peers since most of its stores are on franchise
model. VIPs rent expense is marginally higher than Safari as it has higher number
of EBOs in tier 1 markets where the rent expense is higher.
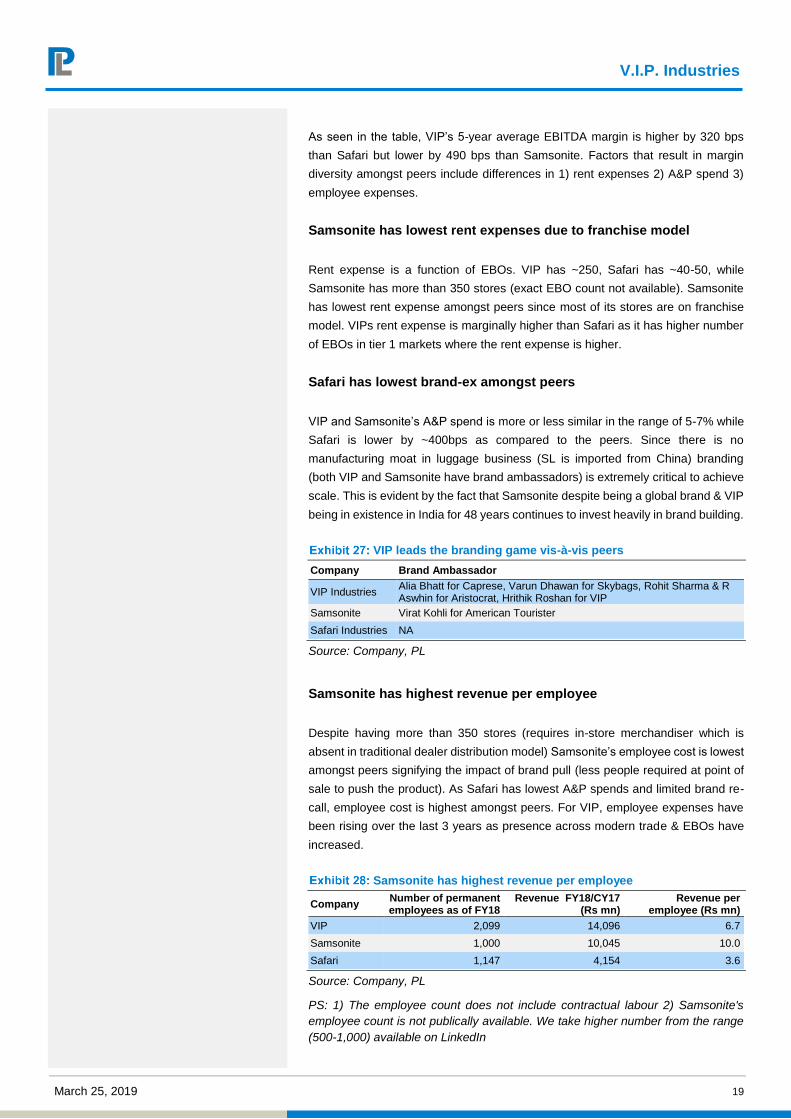
Safari has lowest brand-ex amongst peers
VIP and Samsonite’s A&P spend is more or less similar in the range of 5-7% while
Safari is lower by ~400bps as compared to the peers. Since there is no
manufacturing moat in luggage business (SL is imported from China) branding
(both VIP and Samsonite have brand ambassadors) is extremely critical to achieve
scale. This is evident by the fact that Samsonite despite being a global brand & VIP
being in existence in India for 48 years continues to invest heavily in brand building.
VIP leads the branding game vis-à-vis peers
Company Brand Ambassador
VIP Industries Alia Bhatt for Caprese, Varun Dhawan for Skybags, Rohit Sharma & R Aswhin for Aristocrat, Hrithik Roshan for VIP
Samsonite Virat Kohli for American Tourister
Safari Industries NA
Source: Company, PL
Samsonite has highest revenue per employee
Despite having more than 350 stores (requires in-store merchandiser which is
absent in traditional dealer distribution model) Samsonite’s employee cost is lowest
amongst peers signifying the impact of brand pull (less people required at point of
sale to push the product). As Safari has lowest A&P spends and limited brand re-
call, employee cost is highest amongst peers. For VIP, employee expenses have
been rising over the last 3 years as presence across modern trade & EBOs have
increased.
Samsonite has highest revenue per employee
Company Number of permanent employees as of FY18
Revenue FY18/CY17 (Rs mn)
Revenue per employee (Rs mn)
VIP 2,099 14,096 6.7
Samsonite 1,000 10,045 10.0
Safari 1,147 4,154 3.6
Source: Company, PL
PS: 1) The employee count does not include contractual labour 2) Samsonite's
employee count is not publically available. We take higher number from the range
(500-1,000) available on LinkedIn
V.I.P. Industries
March 25, 2019 20
As seen in the above table, VIP is 3.4x the size of Safari Industries in terms of
revenues has 2x the number of employees. The revenue per employee for VIP is
1.9x Safari. However, while VIP is 1.4x the size of Samsonite, the revenue per
employee is lower than Samsonite given that the latter has a strong brand pull.
Safari has longest cash conversion cycle
VIP had cash conversion cycle of 73 days in FY18 as compared to 70 days for
Samsonite and 157 days for Safari. Strong brand parentage (improves bargaining
power with dealers/distributors) and scale/size advantage (lends bargaining power
against Chinese vendors) enables VIP and Samsonite to have a better cash
conversion cycle than Safari.

V.I.P. Industries
March 25, 2019 21
Financial projections
Brand salience (brand-ex is ~5-7% of sales), strong distribution network (~11,000
touch points), GST implementation (narrowed pricing gap with unorganized players
and resulted in up-trading), entry into the under penetrated ladies hand bags &
backpack market, product premiumisation and rising share of Bangladesh
operations is likely to drive sales/PAT at a CAGR of 23.7%/25.1% over FY18-21E.
VIP’s sales to grow at a CAGR of 23.7% over FY18-21E
Since FY08, VIP’s sales growth has never breached the 20% benchmark. In fact,
since FY04, there have been only two instances, one in FY07 (34.9% YoY growth)
and another one in FY08 (30.0% YoY growth), where sales growth has breached
the 20% benchmark.
Sales to grow at a CAGR of 23.7% over FY18-21E driven by
backpacks & handbags
Particulars (Rs mn) FY18 FY19E FY20E FY21E
Luggage 10,629 13,286 15,678 18,343
YoY growth NA 25.0% 18.0% 17.0%
As a % of sales 75.4% 74.2% 71.6% 68.7%
Backpacks 2,467 3,281 4,396 5,891
YoY growth NA 33.0% 34.0% 34.0%
As a % of sales 17.5% 18.3% 20.1% 22.1%
Handbags 1,000 1,350 1,823 2,460
YoY growth NA 35.0% 35.0% 35.0%
As a % of sales 7.1% 7.5% 8.3% 9.2%
Total sales 14,096 17,917 21,897 26,695
YoY growth 12.6% 27.1% 22.2% 21.9%
Source: Company, PL
PS: The company does not share exact range/category wise revenue numbers.
Backpacks/handbags contribution is ~15-20% and ~7% of sales respectively in
FY18. We use our judgment in arriving at the approximate figures.
We expect sales to grow at a CAGR of 23.7% over FY18-21E as 1) GST
implementation has led to reduction in price differential between organized &
unorganized players resulting in up-trading by consumers especially at the mass
end 2) backpack as a category is expected to grow at CAGR of 33.7% over FY18-
21E given low penetration and lower replacement cycle 3) given the changes made
in price point and revamping done in the distribution channel; handbag category is
expected to grow at a CAGR of 35.0% over FY18-21E.

V.I.P. Industries
March 25, 2019 22
Impact of GST on mass segment of the luggage industry
Particulars Comments
VIP Industries Aristocrat brand (mass offering of VIP) has grown by ~79% in FY18 and is expected to grow by at least 70% in FY19. During 3QFY19 call, management stated that Aristocrat has grown at a healthy pace.
Samsonite Kamiliant brand (mass offering of Samsonite) was launched in late 2016 but crossed the Rs1bn mark in first year itself. In 2018, Kamiliant was the highest focused brand & the plan is to double sales for next few years.
Safari Industries Entire portfolio is considered mass. 9MFY19 revenue of Safari was up 44.3% YoY.
Source: Media Articles, Company, PL
Low penetration driving backpack sales
Particulars Comments
VIP Industries Backpack contributes ~15-20% of sales, category growing at 30%+
Samsonite NA
Safari Industries Backpack contributes ~<=10% of sales, category growing in the range of 40-50%
Source: Media Articles, Company, PL
Increasing ratio of working women & rising fashion quotient aiding handbag market
Particulars Brand Ambassador Comments
Caprese Alia Bhatt Crossed Rs 1bn mark, has grown at a CAGR of ~47% since launch
Hidesign Kalki Koechlin Target is to achieve Rs2bn in sales in FY19.
Baggit Shraddha Kapoor Touched Rs1.6bn in sales in FY18 and aiming 25% growth in FY19. PAT growth is expected to be in double digits in FY19. Produces 1.5 lac pieces a month, and has plans to increase the production by 50%.
Source: Media Articles, Company, PL
Calibrated price hikes & better product mix to offset gross margin headwinds
VIP’s gross margin is higher than Safari Industries given the latter’s focus on mass
products but more or less at par with Samsonite which has premium offerings. In
fact, in FY17 & FY18, VIP’s gross margin was better than Samsonite by 60 bps and
130 bps respectively. Better product mix and a 10% hike taken in FY18 has enabled
VIP to surpass Samsonite.
Since FY08, VIP achieved peak gross margin of 55.9% in FY10 (crude was down
18% while dollar was up by 3.5% during the year). Key factors that influence gross
margin include 1) raw materials 2) rupee/dollar exchange rate & wage inflation in
China 3) ability to take price hike.
Key raw materials used to manufacture luggage include PP, PC, aluminum sections
and components & other materials. Price of RMs is influenced by crude derivatives
to a large extent. Since SL is imported from China, rupee/dollar exchange rate and
wage inflation in the dragon nation are two additional factors that weigh on margins.
Since ability to take price hike is limited considering stiff competition crude and
rupee/dollar exchange rate are the most critical factors that influence margins.

V.I.P. Industries
March 25, 2019 23
Gross margins are inversely correlated with crude prices; product
mix& price hike results in exceptions
-18%
24%32%
-3% -3%
-20%
-45%
3%
18%
22%4%-2% -2%
-5%-2% 0% 0% 0% 4%
-1%
-50%
-40%
-30%
-20%
-10%
0%
10%
20%
30%
40%
FY10 FY11 FY12 FY13 FY14 FY15 FY16 FY17 FY18 YTDFY19
Brent crude movement Gross margin movement
Source: Bloomberg, PL, Company
Gross margins are inversely correlated with rupee/dollar
exchange rate; product mix & price hike results in exceptions
4%
-4%
5%
14%
11%
1%
7%
3%
-4%
9%
4%
-2% -2%
-5%
-2%0% 0% 0%
4%
-1%
-10%
-5%
0%
5%
10%
15%
FY10 FY11 FY12 FY13 FY14 FY15 FY16 FY17 FY18 YTDFY19
Dollar movement Gross margin movement
Source: Bloomberg, PL, Company
As seen in the above chart, crude is up 22% YTD while USD has appreciated by
9% YTD in FY19. Increasing share of SL in the portfolio will further dent margins as
wage inflation in China is rising. However, calibrated price hikes (10% hike taken in
FY18 and 7% YTD in FY19) and better product mix (increasing share of high margin
products like Carlton & Caprese) should partially offset the impact of crude and
rupee volatility. While the gross margin is expected to decline by 110bps to 48.4%
in FY19E amid RM cost inflation, high cost inventory and increase in import duty
we expect an expansion of 40bps each year to 48.8%/49.2% in FY20E/FY21E
respectively.
V.I.P. Industries
March 25, 2019 24
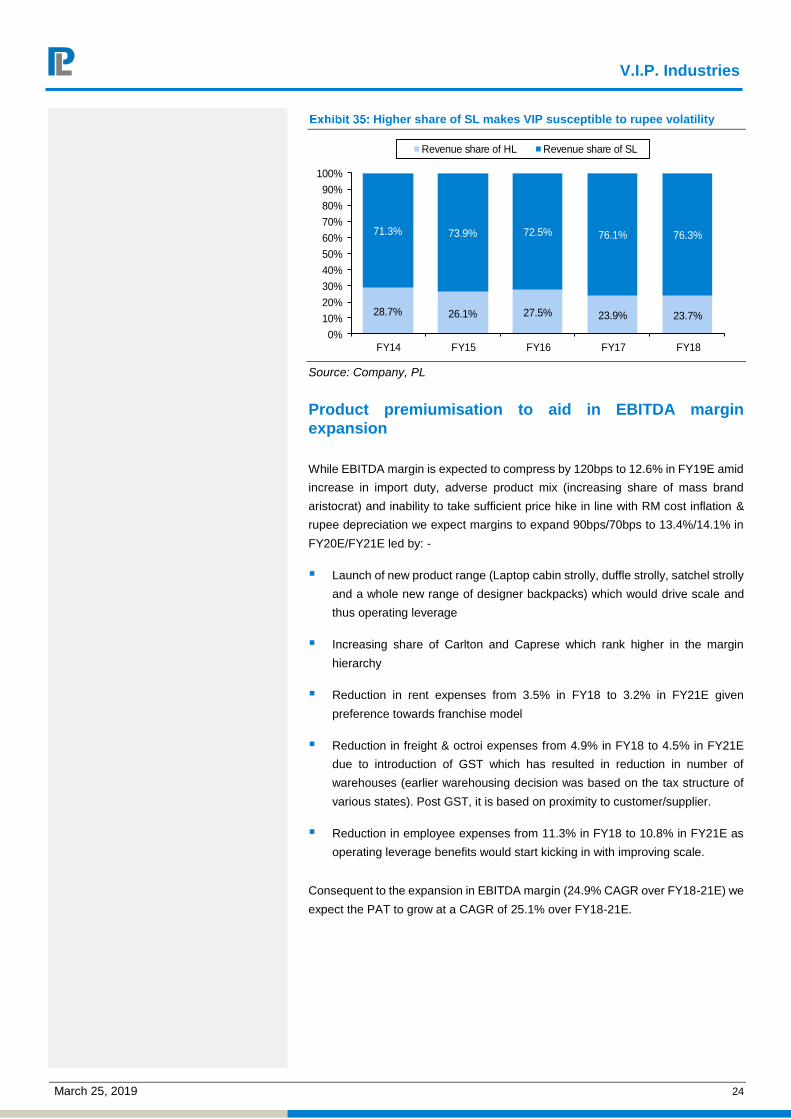
Higher share of SL makes VIP susceptible to rupee volatility
28.7% 26.1% 27.5% 23.9% 23.7%
71.3% 73.9% 72.5% 76.1% 76.3%
0%
10%
20%
30%
40%
50%
60%
70%
80%
90%
100%
FY14 FY15 FY16 FY17 FY18
Revenue share of HL Revenue share of SL
Source: Company, PL
Product premiumisation to aid in EBITDA margin
expansion
While EBITDA margin is expected to compress by 120bps to 12.6% in FY19E amid
increase in import duty, adverse product mix (increasing share of mass brand
aristocrat) and inability to take sufficient price hike in line with RM cost inflation &
rupee depreciation we expect margins to expand 90bps/70bps to 13.4%/14.1% in
FY20E/FY21E led by: -
Launch of new product range (Laptop cabin strolly, duffle strolly, satchel strolly
and a whole new range of designer backpacks) which would drive scale and
thus operating leverage
Increasing share of Carlton and Caprese which rank higher in the margin
hierarchy
Reduction in rent expenses from 3.5% in FY18 to 3.2% in FY21E given
preference towards franchise model
Reduction in freight & octroi expenses from 4.9% in FY18 to 4.5% in FY21E
due to introduction of GST which has resulted in reduction in number of
warehouses (earlier warehousing decision was based on the tax structure of
various states). Post GST, it is based on proximity to customer/supplier.
Reduction in employee expenses from 11.3% in FY18 to 10.8% in FY21E as
operating leverage benefits would start kicking in with improving scale.
Consequent to the expansion in EBITDA margin (24.9% CAGR over FY18-21E) we
expect the PAT to grow at a CAGR of 25.1% over FY18-21E.

V.I.P. Industries
March 25, 2019 25
Caprese share in sales to rise to 9.2% in FY21E
7.1%7.5%
8.3%
9.2%
0.0%
1.0%
2.0%
3.0%
4.0%
5.0%
6.0%
7.0%
8.0%
9.0%
10.0%
FY18 FY19E FY20E FY21E
Source: Company, PL
Rent, freight & employee expenses to decline
30bps, 40bps,50 bps over FY18-21E
3.8% 3.7% 3.6% 3.8% 3.5% 3.4% 3.3% 3.2%
5.0% 5.4% 5.2% 4.8% 4.9% 4.8% 4.7% 4.5%
9.6%10.5% 10.3%
11.2% 11.3% 11.1% 10.8% 10.8%
0.0%
2.0%
4.0%
6.0%
8.0%
10.0%
12.0%
FY
14
FY
15
FY
16
FY
17
FY
18
FY
19E
FY
20E
FY
21E
Rent expenses Freight expenses
Employee expenses
Source: Company, PL
Improvement in cash conversion cycle to drive OCF at a CAGR of 21.0% over FY18-21E
VIP’s cash conversion cycle is expected to improve from 73 days in FY18 to 70
days in FY21E as we expect payable days to increase from 55 in FY18 to 59 in
FY21E once scale of the business increases (revenue CAGR of 23.7% over FY18-
21E). Debtor days are likely to improve marginally from 46 in FY18 to 44 in FY21E
as share of CSD sales has been declining which has longer credit period. However,
we expect the average collection period for next 3 years to be higher than the past
5-year average of 40 days as competition has intensified in the luggage industry
over last 2-3 years due to emergence of Safari. Inventory days are likely to increase
from 82 in FY18 to 85 in FY21E with increasing share of handbags and backpacks
which require higher SKUs.
VIP’s cash conversion cycle to improve to 70 days in FY21E
36 39 45 35 46 45 44 4466 79 86 82 82 83 84 8537 41 48 42 55 56 57 59
64
7683
75 73 72 71 70
0
10
20
30
40
50
60
70
80
90
0
10
20
30
40
50
60
70
80
90
100
FY14 FY15 FY16 FY17 FY18 FY19E FY20E FY21E
Debtor days Inventory days
Payable days Cash conversion cycle (RHS)
Source: Company, PL
Improvement in cash conversion cycle is likely to drive OCF at a CAGR of 21.0%
over FY18-21E. With minimal capex needs (SL expansion would require Rs200-
250mn), FCFF generation is likely to be at Rs421mn/Rs932mn/Rs1,252mn in
FY19E/FY20E/FY21E resulting in higher dividend pay-outs. We expect average
pay-out ratio to be closer to ~32% over the FY19-21E.

V.I.P. Industries
March 25, 2019 26
Valuations
Premium valuations justified; past history redundant
There have been two sharp rallies 1) one between 2010-2012 and 2) post 2017;
over the last 10 years resulting in a 52% CAGR in VIP’s stock price. While the first
rally was more cyclical in nature (driven by crude & exchange rate) the second one
is more structural as it is driven by GST (shift from unorganized to organized),
improvement in scale of Bangladesh operations and better brand visibility of
Caprese though the role of crude and exchange rate cannot be undermined.
VIP’s stock price has delivered a CAGR of 52% over the last 10 years
0.00
100.00
200.00
300.00
400.00
500.00
600.00
700.00
Jan-0
7
Apr-
07
Aug-0
7
Nov-
07
Mar-
08
Jun-0
8
Sep-0
8
Jan-0
9
Apr-
09
Jul-09
Nov-
09
Feb
-10
Jun-1
0
Sep-1
0
Dec-
10
Apr-
11
Jul-11
Nov-
11
Feb
-12
May-
12
Sep-1
2
Dec-
12
Mar-
13
Jul-13
Oct-13
Feb
-14
May-
14
Aug-1
4
Dec-
14
Mar-
15
Jul-15
Oct-15
Jan-1
6
May-
16
Aug-1
6
Nov-
16
Mar-
17
Jun-1
7
Oct-17
Jan-1
8
Apr-
18
Aug-1
8
Nov-
18
Mar-
19
Dollar w as pretty stable in the range of 46-48 from FY10-FY12
Brent crude w as down 18% in FY10
Safari had negligible presence
Introduction of GST
Dollar depreciated 3.9% in FY18
EBITDA margin expansion of ~400-500bps since FY16
Improving scale of Bangladesh operations
Improving brand visibility of Caprese
Source: Company, PL
As seen below, the stock peaked out 50x one year forward earnings during the rally
of 2010-2012 as well as the one witnessed post 2017 (both the rallies were driven
by earnings expansion). From a loss of Rs139mn in FY09, VIP achieved peak profit
of Rs887mn in FY11, which was regained only in FY17 (stock price was more or
less flat in the interim). The peak of FY11 (regained in FY17) was finally breached
in FY18 with a profit of Rs1.25bn (second leg of the rally began).
One year forward PE band
10.0x
20.0x
30.0x
40.0x
50.0x
0
100
200
300
400
500
600
700
Ma
r-0
9O
ct-0
9M
ay-
10
De
c-1
0Ju
l-1
1F
eb-1
2S
ep-1
2A
pr-
13
No
v-1
3Ju
n-1
4Ja
n-1
5A
ug
-15
Ma
r-1
6O
ct-1
6M
ay-
17
De
c-1
7Ju
l-1
8F
eb-1
9
Source: Company, Bloomberg, PL
One year forward PE band chart
31.12.2
52.6
28.3
25.3
0.0
10.0
20.0
30.0
40.0
50.0
60.0
Ma
r-0
9
Oct
-09
Ma
y-1
0
De
c-1
0
Jul-
11
Feb
-12
Sep
-12
Ap
r-1
3
No
v-1
3
Jun
-14
Jan
-15
Au
g-1
5
Ma
r-1
6
Oct
-16
Ma
y-1
7
De
c-1
7
Jul-
18
Feb
-19
P/E (x) Peak(x) Avg(x)
Median(x) Min(x)
Source: Company, Bloomberg, PL

V.I.P. Industries
March 25, 2019 27
We value the stock 33x FY21E earnings as we expect PAT to grow at a CAGR of
25.1% over FY18-21E driven by shift towards organized market, premiumisation of
product portfolio (rising share of Carlton & Caprese) and increasing share of
Bangladesh operations which will improve the profitability profile. We believe the
past trading history is immaterial and our multiple of 33x is justified as -
Unorganized players command ~67% of the market share and have been at a
huge structural disadvantage post GST which is not captured in the past
regime. Since the implementation of GST from 01 July 2017, VIP has traded
at an average TTM multiple of 46x.
Though Bangladesh operations began in 2014, initially management
bandwidth was consumed in managing raw material cycle and getting
infrastructure in place (VIP does not have presence in Dhaka/Chittagong which
are big export promotion zones). Thus, it took long before Bangladesh
operations turned into profit. As a result, past history does not reflect true
potential of a shift from China to Bangladesh. With profitability (FY18 PAT of
Rs95mn; 9MFY19 PAT of Rs128mn) of Bangladesh operations increasing and
scale advantage (plans to increase the capacity to 3.5mn units by FY19)
expected to come in, we believe re-rating is on the cards.
Product portfolio is witnessing premiumisation as share of Carlton and Caprese
(highest margin amongst all six brands) is expected to rise (current contribution
is ~7-8%) given changes made in distribution channel and rise in number of
EBOs (premium products typically sell in this channel). Full reflection of
premiumisation is not reflected in the past history as revenue share was
miniscule. Rising share of high margin brands is likely to result in re-rating from
these levels.
Though one may argue that most of the global listed global peers (except Hermes
International), trade at ~50% discount to VIP on a 1 year forward basis and hence
the current valuation is unjustified we believe difference in valuation is a reflection
of increase in brand premium and opportunity pie (transition towards organized
market) that VIP has its disposal post introduction of GST.
Global luggage/luxury goods companies financial profile
Particulars Revenue EBITDA margin
PAT margin
RoE P/E Brief profile
Samsonite International (CY17-US$ mn) 3,490.9 16.6% 7.5% 14.2% 18.9 Largest luggage company in the world by market share
Kering SA (CY18- US$mn) 16,140.0 32.5% 20.2% 34.0% 23.9 Owns brands like Gucci, Bottega Veneta, Saint Laurent
Hermes International (CY17 - US$ mn) 6,269.0 39.0% 22.5% 25.9% 45.9 Known for handmade luggage & handbags
VF Corp (CY17 - US$mn) 11,811.2 15.8% 10.5% 14.2% 21.9 Controls 55% of the US backpack market
Source: Company, Bloomberg, PL
At our target multiple of 33x, we arrive at a TP of Rs579 per share (FY21E EPS of
Rs17.6). Initiate with a BUY.

V.I.P. Industries
March 25, 2019 28
Key tables & charts
Absence of manufacturing moat makes brand
spends critical for success
4.7
%
4.5
%
4.9
%
5.2
%
5.3
%
5.9
%
6.0
%
5.8
%
6.1
%
6.4
%
6.7
%
6.8
%
6.9
%
2.3
%
1.7
% 2.5
%
2.4
%
2.0
%
2.1
%
1.0
%
0.8
%
0.7
%
2.3
%
2.2
%
1.2
%
1.0
%
0.0%
1.0%
2.0%
3.0%
4.0%
5.0%
6.0%
7.0%
8.0%
A&P spend (as % of sales) Capital intensity (as a % of sales)
Source: Company, PL
Average payout since FY10 is ~38%; we expect
pay out to be at ~32% over FY19-21E
29%32%
33%
45%
42%
45%
43%40%
33% 33%31% 31%
20%
25%
30%
35%
40%
45%
50%
Source: Company, PL
RoE & RoCE to expand by 230bps & 310bps
respectively over FY18-21E
33%
44%
28%
12%
20%15%
18% 20%26% 25% 27% 28%
32%
35%
31%
16%21%
18%
25%29%
37% 35%38% 40%
0%
10%
20%
30%
40%
50%
RoE RoCE
Source: Company, PL
Average OCF/EBITDA multiple is 0.8x over FY08-
FY18
0.4
2.8
0.9
0.1
0.7
1.1
0.6
0.2
0.5
1.0
0.4 0.4 0.4 0.4
-
0.5
1.0
1.5
2.0
2.5
3.0
Source: Company, PL
Export contribution has fallen to 4.3% of sales in
FY18 indicating that VIP has been losing share overseas
20% 20%
13% 12%10%
9%11%
9%7%
5%4%
0%
5%
10%
15%
20%
25%
Source: Company, PL
PS: *FY16 figure is a rough approximation as exact share is not
available
Industry is dominated by soft luggage
Source: Company, PL
Soft luggage
75%
Hard luggage
25%

V.I.P. Industries
March 25, 2019 29
Annexure
HL Vs SL – Key differences explained: While hard luggage (HL) still offers best
protection, soft luggage (SL) has become preferred choice for consumers over the
years as it offers high flexibility (expandable external pockets) and is light in weight.
In West, typical breakdown between HL and SL usage is 50:50 while in India it is
25:75. For VIP and Safari, the share of HL was 24% (42% in FY11) and 23% (69%
in FY11) respectively in FY18.
SL is typically made out of 3 fabrics namely ballistic nylon, cordura nylon and
polyester. While ballistic nylon is durable and easy to clean it is hard to dye and
hence it comes in dark colors. Cordura nylon weighs less than ballistic nylon and is
easy to dye and hence there are more color options. Polyester is the cheapest and
thus luggage with low price range is made from polyester fabric.
HL is typically made out of aluminum, polypropylene (PP), polycarbonate (PC) and
Acrylonitrile-butadiene styrene (ABS). Since aluminum is expensive and heavier to
carry it is gradually being replaced by PP, PC and ABS (latter 3 are thermoplastic
polymers). PC is impact resistant, durable and resilient to rough handling. PP is
lighter than PC but not as resilient as latter. Within HL there has been a shift from
PP to PC as latter is not only resilient but also has looks and convenience of SL.
ABS is cheapest form of HL and is frequently added to other materials like PP or
PC so as to manage weight and durability of the combined material.
SL vs HL: Key differences
Durability (Most) Weight (Lightest) Price (Lowest)
Soft Luggage
Ballistic Nylon 1 2 3
Cordura Nylon 2 1 2
Polyester 3 3 1
Hard Luggage
Aluminum 1 4 4
PC 2 3 3
PP 3 1 2
ABS 4 2 1
Source: bforbag.com, PL
Typically, SL is imported from China due to abundant raw material availability, scale
advantage and availability of labour while HL is manufactured in India.
Key Management Personnel
Name Designation Experience & Qualification
Dilip Piramal CMD BCom. Experienced industrialist with experience of more than 45 years.
Radhika Piramal Vice-Chairperson & ED Graduate from Oxford. MBA from Harvard business school. Looks after innovations & technology development.
Sudip Ghose CEO. To be MD (From 01st April 2019) Management Graduate from NMIMS, Mumbai. Over 2 decades of experience.
Jogendra Sethi CFO CA & ICWA. Over 2 decades of experience.
Source: Company, PL
V.I.P. Industries
March 25, 2019 30
Financials Income Statement (Rs m)
Y/e Mar FY18 FY19E FY20E FY21E
Net Revenues 14,096 17,917 21,897 26,695
YoY gr. (%) 12.6 27.1 22.2 21.9
Cost of Goods Sold 7,117 9,245 11,211 13,561
Gross Profit 6,979 8,672 10,686 13,134
Margin (%) 49.5 48.4 48.8 49.2
Employee Cost 1,594 1,989 2,365 2,883
Other Expenses 3,452 4,435 5,387 6,487
EBITDA 1,934 2,249 2,934 3,764
YoY gr. (%) 46.1 16.3 30.5 28.3
Margin (%) 13.7 12.6 13.4 14.1
Depreciation and Amortization 129 166 182 200
EBIT 1,805 2,083 2,752 3,564
Margin (%) 12.8 11.6 12.6 13.4
Net Interest 3 9 2 3
Other Income 93 95 116 141
Profit Before Tax 1,895 2,169 2,866 3,703
Margin (%) 13.4 12.1 13.1 13.9
Total Tax 628 716 946 1,222
Effective tax rate (%) 33.1 33.0 33.0 33.0
Profit after tax 1,268 1,453 1,920 2,481
Minority interest - - - -
Share Profit from Associate - - - -
Adjusted PAT 1,268 1,453 1,920 2,481
YoY gr. (%) 48.8 14.7 32.1 29.2
Margin (%) 9.0 8.1 8.8 9.3
Extra Ord. Income / (Exp) - - - -
Reported PAT 1,268 1,453 1,920 2,481
YoY gr. (%) 48.8 14.7 32.1 29.2
Margin (%) 9.0 8.1 8.8 9.3
Other Comprehensive Income (17) 20 - -
Total Comprehensive Income 1,251 1,473 1,920 2,481
Equity Shares O/s (m) 141 141 141 141
EPS (Rs) 9.0 10.3 13.6 17.6
Source: Company Data, PL Research
Balance Sheet Abstract (Rs m)
Y/e Mar FY18 FY19E FY20E FY21E
Non-Current Assets
Gross Block 1,028 1,432 1,703 1,979
Tangibles 1,004 1,398 1,660 1,927
Intangibles 25 35 43 52
Acc: Dep / Amortization 258 423 605 805
Tangibles 244 403 577 769
Intangibles 14 21 28 36
Net fixed assets 770 1,009 1,098 1,174
Tangibles 760 995 1,083 1,158
Intangibles 11 14 14 15
Capital Work In Progress 32 48 40 27
Goodwill - - - -
Non-Current Investments 182 240 314 461
Net Deferred tax assets 54 61 72 93
Other Non-Current Assets 77 90 109 160
Current Assets
Investments 714 773 773 773
Inventories 3,165 4,074 5,039 6,217
Trade receivables 1,766 2,209 2,640 3,218
Cash & Bank Balance 238 72 400 840
Other Current Assets 666 842 1,117 1,388
Total Assets 7,727 9,493 11,690 14,455
Equity
Equity Share Capital 283 283 283 283
Other Equity 4,608 5,601 6,928 8,632
Total Networth 4,891 5,884 7,211 8,914
Non-Current Liabilities
Long Term borrowings - - - -
Provisions 93 131 160 195
Other non current liabilities 1 2 2 3
Current Liabilities
ST Debt / Current of LT Debt - - - -
Trade payables 2,125 2,749 3,419 4,315
Other current liabilities 611 722 891 1,020
Total Equity & Liabilities 7,727 9,493 11,690 14,455
Source: Company Data, PL Research

V.I.P. Industries
March 25, 2019 31
Cash Flow (Rs m)
Y/e Mar FY18 FY19E FY20E FY21E Year
PBT 1,895 2,169 2,866 3,703
Add. Depreciation 129 166 182 200
Add. Interest 2 9 2 3
Less Financial Other Income 93 95 116 141
Add. Other (42) - - -
Op. profit before WC changes 1,985 2,344 3,050 3,905
Net Changes-WC (486) (826) (899) (1,143)
Direct tax (640) (702) (957) (1,243)
Net cash from Op. activities 859 815 1,195 1,519
Capital expenditures (309) (394) (263) (267)
Interest / Dividend Income 53 - - -
Others (35) (97) (8) (33)
Net Cash from Invt. activities (291) (491) (271) (300)
Issue of share cap. / premium - - - -
Debt changes - - - -
Dividend paid (437) (480) (594) (777)
Interest paid (2) (9) (2) (3)
Others - - - -
Net cash from Fin. activities (439) (489) (596) (780)
Net change in cash 129 (166) 328 440
Free Cash Flow 540 421 932 1,252
Source: Company Data, PL Research
Quarterly Financials (Rs m)
Y/e Mar Q4FY18 Q1FY19 Q2FY19 Q3FY19
Net Revenue 3,626 5,178 4,018 4,301
YoY gr. (%) 19.6 29.5 29.9 27.2
Raw Material Expenses 1,679 2,571 2,020 2,294
Gross Profit 1,947 2,607 1,998 2,007
Margin (%) 53.7 50.3 49.7 46.7
EBITDA 543 962 511 378
YoY gr. (%) 83.2 56.9 39.6 (8.2)
Margin (%) 15.0 18.6 12.7 8.8
Depreciation / Depletion 35 37 39 44
EBIT 508 925 472 334
Margin (%) 14.0 17.9 11.7 7.8
Net Interest 1 - - 7
Other Income 24 16 20 27
Profit before Tax 531 942 492 354
Margin (%) 14.6 18.2 12.2 8.2
Total Tax 180 308 164 116
Effective tax rate (%) 33.9 32.7 33.3 32.7
Profit after Tax 351 634 328 238
Minority interest - - - -
Share Profit from Associates - - - -
Adjusted PAT 351 634 328 238
YoY gr. (%) 83.3 54.6 37.7 (11.4)
Margin (%) 9.7 12.2 8.2 5.5
Extra Ord. Income / (Exp) - - - -
Reported PAT 351 634 328 238
YoY gr. (%) 83.3 54.6 37.7 (11.4)
Margin (%) 9.7 12.2 8.2 5.5
Other Comprehensive Income (6) 16 39 (35)
Total Comprehensive Income 344 650 367 203
Avg. Shares O/s (m) 141 141 141 141
EPS (Rs) 2.5 4.5 2.3 1.7
Source: Company Data, PL Research
Key Financial Metrics
Y/e Mar FY18 FY19E FY20E FY21E
Per Share(Rs)
EPS 9.0 10.3 13.6 17.6
CEPS 9.9 11.5 14.9 19.0
BVPS 34.6 41.6 51.0 63.1
FCF 3.8 3.0 6.6 8.9
DPS 3.0 3.4 4.2 5.5
Return Ratio(%)
RoCE 36.9 35.4 38.2 40.0
ROIC 25.0 23.7 25.1 26.0
RoE 25.6 25.0 26.6 27.8
Balance Sheet
Net Debt : Equity (x) (0.2) (0.1) (0.2) (0.2)
Net Working Capital (Days) 73 72 71 70
Valuation(x)
PER 49.5 43.2 32.7 25.3
P/B 12.8 10.7 8.7 7.0
P/CEPS 44.9 38.8 29.8 23.4
EV/EBITDA 32.0 27.5 21.0 16.2
EV/Sales 4.4 3.5 2.8 2.3
Dividend Yield (%) 0.7 0.8 0.9 1.2
Source: Company Data, PL Research
V.I.P. Industries
March 25, 2019 32
Notes

V.I.P. Industries
March 25, 2019 33
Notes

V.I.P. Industries
March 25, 2019 34
Notes
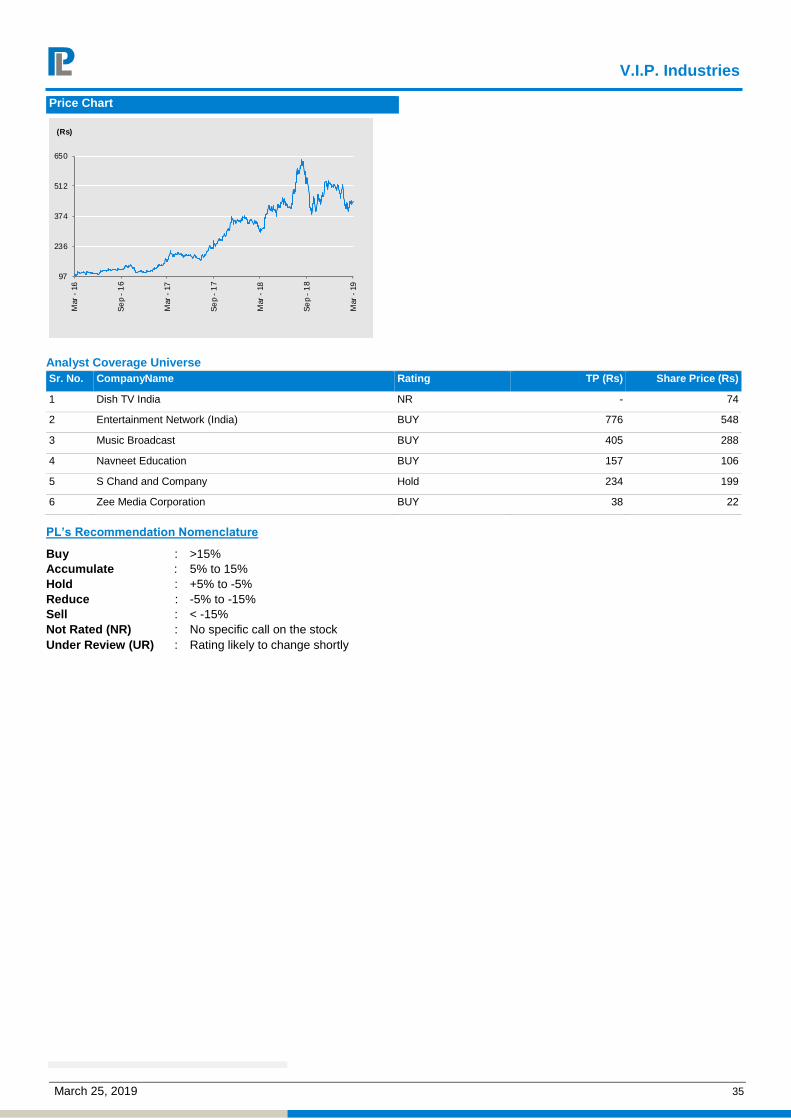
V.I.P. Industries
March 25, 2019 35
Price Chart
Analyst Coverage Universe
Sr. No. CompanyName Rating TP (Rs) Share Price (Rs)
1 Dish TV India NR - 74
2 Entertainment Network (India) BUY 776 548
3 Music Broadcast BUY 405 288
4 Navneet Education BUY 157 106
5 S Chand and Company Hold 234 199
6 Zee Media Corporation BUY 38 22
PL’s Recommendation Nomenclature
Buy : >15%
Accumulate : 5% to 15%
Hold : +5% to -5%
Reduce : -5% to -15%
Sell : < -15%
Not Rated (NR) : No specific call on the stock
Under Review (UR) : Rating likely to change shortly
97
236
374
512
650
Mar
- 16
Se
p -
16
Mar
- 17
Se
p -
17
Mar
- 18
Se
p -
18
Mar
- 19
(Rs)

V.I.P. Industries
March 25, 2019 36
ANALYST CERTIFICATION
(Indian Clients)
We/I, Mr. Jinesh Joshi- MS(Finance) and CFA Research Analysts, authors and the names subscribed to this report, hereby certify that all of the views expressed in this research report accurately reflect our views about the subject issuer(s) or securities. We also certify that no part of our compensation was, is, or will be directly or indirectly related to the specific recommendation(s) or view(s) in this report.
(US Clients)
The research analysts, with respect to each issuer and its securities covered by them in this research report, certify that: All of the views expressed in this research report accurately reflect his or her or their personal views about all of the issuers and their securities; and No part of his or her or their compensation was, is or will be directly related to the specific recommendation or views expressed in this research report.
DISCLAIMER
Indian Clients
Prabhudas Lilladher Pvt. Ltd, Mumbai, India (hereinafter referred to as “PL”) is engaged in the business of Stock Broking, Portfolio Manager, Depository Participant and distribution for third party financial products. PL is a subsidiary of Prabhudas Lilladher Advisory Services Pvt Ltd. which has its various subsidiaries engaged in business of commodity broking, investment banking, financial services (margin funding) and distribution of third party financial/other products, details in respect of which are available at www.plindia.com.
This document has been prepared by the Research Division of PL and is meant for use by the recipient only as information and is not for circulation. This document is not to be reported or copied or made available to others without prior permission of PL. It should not be considered or taken as an offer to sell or a solicitation to buy or sell any security.
The information contained in this report has been obtained from sources that are considered to be reliable. However, PL has not independently verified the accuracy or completeness of the same. Neither PL nor any of its affiliates, its directors or its employees accepts any responsibility of whatsoever nature for the information, statements and opinion given, made available or expressed herein or for any omission therein.
Recipients of this report should be aware that past performance is not necessarily a guide to future performance and value of investments can go down as well. The suitability or otherwise of any investments will depend upon the recipient's particular circumstances and, in case of doubt, advice should be sought from an independent expert/advisor.
Either PL or its affiliates or its directors or its employees or its representatives or its clients or their relatives may have position(s), make market, act as principal or engage in transactions of securities of companies referred to in this report and they may have used the research material prior to publication.
PL may from time to time solicit or perform investment banking or other services for any company mentioned in this document.
PL is in the process of applying for certificate of registration as Research Analyst under Securities and Exchange Board of India (Research Analysts) Regulations, 2014
PL submits that no material disciplinary action has been taken on us by any Regulatory Authority impacting Equity Research Analysis activities.
PL or its research analysts or its associates or his relatives do not have any financial interest in the subject company.
PL or its research analysts or its associates or his relatives do not have actual/beneficial ownership of one per cent or more securities of the subject company at the end of the month immediately preceding the date of publication of the research report.
PL or its research analysts or its associates or his relatives do not have any material conflict of interest at the time of publication of the research report.
PL or its associates might have received compensation from the subject company in the past twelve months.
PL or its associates might have managed or co-managed public offering of securities for the subject company in the past twelve months or mandated by the subject company for any other assignment in the past twelve months.
PL or its associates might have received any compensation for investment banking or merchant banking or brokerage services from the subject company in the past twelve months.
PL or its associates might have received any compensation for products or services other than investment banking or merchant banking or brokerage services from the subject company in the past twelve months
PL or its associates might have received any compensation or other benefits from the subject company or third party in connection with the research report.
PL encourages independence in research report preparation and strives to minimize conflict in preparation of research report. PL or its analysts did not receive any compensation or other benefits from the subject Company or third party in connection with the preparation of the research report. PL or its Research Analysts do not have any material conflict of interest at the time of publication of this report.
It is confirmed that Mr. Jinesh Joshi- MS(Finance) and CFA Research Analysts of this report have not received any compensation from the companies mentioned in the report in the preceding twelve months
Compensation of our Research Analysts is not based on any specific merchant banking, investment banking or brokerage service transactions.
The Research analysts for this report certifies that all of the views expressed in this report accurately reflect his or her personal views about the subject company or companies and its or their securities, and no part of his or her compensation was, is or will be, directly or indirectly related to specific recommendations or views expressed in this report.
The research analysts for this report has not served as an officer, director or employee of the subject company PL or its research analysts have not engaged in market making activity for the subject company
Our sales people, traders, and other professionals or affiliates may provide oral or written market commentary or trading strategies to our clients that reflect opinions that are contrary to the opinions expressed herein, and our proprietary trading and investing businesses may make investment decisions that are inconsistent with the recommendations expressed herein. In reviewing these materials, you should be aware that any or all o the foregoing, among other things, may give rise to real or potential conflicts of interest.
PL and its associates, their directors and employees may (a) from time to time, have a long or short position in, and buy or sell the securities of the subject company or (b) be engaged in any other transaction involving such securities and earn brokerage or other compensation or act as a market maker in the financial instruments of the subject company or act as an advisor or lender/borrower to the subject company or may have any other potential conflict of interests with respect to any recommendation and other related information and opinions.
US Clients
This research report is a product of Prabhudas Lilladher Pvt. Ltd., which is the employer of the research analyst(s) who has prepared the research report. The research analyst(s) preparing the research report is/are resident outside the United States (U.S.) and are not associated persons of any U.S. regulated broker-dealer and therefore the analyst(s) is/are not subject to supervision by a U.S. broker-dealer, and is/are not required to satisfy the regulatory licensing requirements of FINRA or required to otherwise comply with U.S. rules or regulations regarding, among other things, communications with a subject company, public appearances and trading securities held by a research analyst account.
This report is intended for distribution by Prabhudas Lilladher Pvt. Ltd. only to "Major Institutional Investors" as defined by Rule 15a-6(b)(4) of the U.S. Securities and Exchange Act, 1934 (the Exchange Act) and interpretations thereof by U.S. Securities and Exchange Commission (SEC) in reliance on Rule 15a 6(a)(2). If the recipient of this report is not a Major Institutional Investor as specified above, then it should not act upon this report and return the same to the sender. Further, this report may not be copied, duplicated and/or transmitted onward to any U.S. person, which is not the Major Institutional Investor.
In reliance on the exemption from registration provided by Rule 15a-6 of the Exchange Act and interpretations thereof by the SEC in order to conduct certain business with Major Institutional Investors, Prabhudas Lilladher Pvt. Ltd. has entered into an agreement with a U.S. registered broker-dealer, Marco Polo Securities Inc. ("Marco Polo").
Transactions in securities discussed in this research report should be effected through Marco Polo or another U.S. registered broker dealer.
Prabhudas Lilladher Pvt. Ltd. 3rd Floor, Sadhana House, 570, P. B. Marg, Worli, Mumbai-400 018, India | Tel: (91 22) 6632 2222 Fax: (91 22) 6632 2209
www.plindia.com | Bloomberg Research Page: PRLD <GO>