visa stock analysis report
TRANSCRIPT
Stock Analysis Report Birkey Investment Group By: John Conner, Trè Cotton, and Jon Blumberg


2
Table of Contents
I. Executive Summary 3
II. Industry Analysis 3
A. The Payment Card Industry 3
B. Industry Macro-Environment 10
C. Five Forces Analysis 11
D. Driving Forces 16
III. Financial Analysis 17
A. Price Trends 17
B. Revenue Trends 18
C. Earnings Trends 19
D. Return on Assets 20
E. Return on Equity 21
IV. Visa Europe 23
V. Recent News 23
VI. Recommendation 24
VII. References 27
VIII. Appendix: Visa’s Financial Statements - 2012-2014 29

3
I. Executive Summary
Visa operates in the payment card industry. Visa is the largest with a market cap of
$190B. The other three major players are MasterCard, Discover, and American
Express. The payment card industry continues to grow as consumers look to replace
cash and check transactions. The ease of debit and credit card use as well as reward
programs has led to growing consumer use. There is very little threat to new entrants
due to the scale of the corporations. Visa’s $23.4 billion acquisition of their European
counterpart Visa Europe will help grow the company in the European market. Visa
Europe controls 52% of the payment transactions in Europe. Europe is second to the
United States in credit/debit transactions. Visa is listed in the Top 10 relating to brand
equity on Forbes.com, with an estimated value of $90 billion.
Visa’s strong financial (See Appendix) position the company well in the payment
card industry and help support reasons for purchasing the stock. Strong trends in
revenue, earnings, profit margin help distinguish Visa from competitors. Visa has
advantageous buyback programs and continued dividend payouts that make it attractive
to investors. Visa’s earnings are projected to increase more than 10% in the next two
years, supporting the need for growth in a stock to make it a solid investment.
II. Industry Analysis
a. The Payment Card Industry
The Payment Card Industry (PCI) consists of all organizations that store, process
and transmits cardholder data, and is mostly known for debit cards and credit cards
(Payment Card Industry (PCI), n.d.). The PCI is guided by the Payment Card Industry
Security Standards Council (PCI SSC) which is a trade association that was created by

4
companies in the industry including; American Express, Discover Financial Services,
JCB International, MasterCard, and Visa Inc. All five payment brands share equally in
the Council’s governance, have equal input into the PCI Security Standards Council,
and share responsibility for carrying out the work of the organization (PCI Security
Standards Council, n.d.).
The credit card industry is a big business with many components. Business
Insider estimates that the credit card industry processed $4 trillion in the U.S. in 2014.
Seven of the largest card issuers – American Express, JP Morgan, Capital One, Bank of
America, Citigroup, Discover and U.S. Bancorp – reported more than $490 billion in
total credit card payments made in the fourth quarter of 2014 alone (Holmes, n.d.). The
percent of cards in circulation held by Visa, Inc. and each of its competitors in the
United States at the end of 2014 are as follows (Papadimitriou, n.d.):
● Visa: 48.9% with 304 million cards in circulation
● MasterCard: 30.7% with 191 million cards in circulation.
● American Express: 10.1% with 63 million cards in circulation
● Discover Financial: 10.1% with 64 million cards in circulation

5
However, based on the number of purchase transactions made with commercial and
consumer credit, debit, and prepaid cards worldwide in 2014, Visa owned more than
half of the market with 58% and $112.9 billion in transactions. Percentage of
transactions and the value of these transactions for Visa’s main competitors can be
seen in Figure1.
Essentially, Visa is the largest payment brand. Starting with a value of $16.36 billion
U.S. dollars in 2009, Visa reached the value of $91.96 billion in 2015 (See Figure 2). In
2014, Visa’s U.S. credit purchase volume was $1.2 trillion, up from $1.1 trillion in 2013.
Figure 1: Purchase Transactions Worldwide

6
There were 304 million Visa credit cards in circulation in the U.S. and 545 million Visa
credit cards in circulation outside of the United States in September 2014 (Holmes,
n.d.). Compared to 2013, there were 285 million Visa credit cards in circulation in the
United States and 526 million cards in the rest of the world.
Visa, Inc. and MasterCard run on an “Open-Loop Payment” System (see Figure 3
and 4). The open-loop payment system usually involves two banks and a payment
brand, apart from the merchant. A typical open-loop payment transaction works as
follows:
Figure 2: Visa's global brand value from 2009 to 2015 (in billion U.S. dollars)

7
● A cardholder uses the payment card at a merchant establishment or place of
business.
● The merchant sends the card details to an acquiring bank that the merchant has
signed up with.
● The acquiring bank requests authorization through a payment brand (Like Visa or
MasterCard) to an issuing bank which is the bank that has issued the
cardholder's payment card.
● The payment brand sends the information to an issuing bank who authorizes or
denies the transaction.
● Then the issuing bank sends the information back through the payment brand to
complete the processing cycle.
Figure 3: "Open-look Payment System"

8
Payment brands like Visa and MasterCard make money by facilitating transactions
made with their products. Due to so many transactions between payment brands,
financial institutions, and merchants, the following fees are generated (see figure 5 for
example):
Merchant discount fee: This is the fee charged to merchants by the acquiring
bank which is the bank that processes the card sales and credits the funds to the
merchant’s account and is generally 1 percent to 3 percent. The discount fee is
divided among the parties involved in the processing of the transaction. The
biggest division is the interchange fee, or the money collected by the issuer for its
part in the transaction. Essentially, the rates are set by Visa and MasterCard.
Processor and acquirer fee: This a flat transaction fee that is charged on all
authorized transactions which kept by the payment brand.
Credit card network fees: This when the card networks charge certain non-
negotiable fees that are passed through to the merchant.
Figure 4: Visa Payment Network

9
Interchange Reimbursement Fees and Assessments: These are the fees that
card-issuing banks and the payment brand charge for each transaction which is
the largest expense merchants pay per sale and per month.
o Interchange fees consist of a percentage of each transaction
accompanied by a flat fee per transaction.
o Assessment fees are based on a percentage of the total transaction
volume for the month.
Figure 5: Example of fees in the Payment Card Industry
10
In addition to Visa’s, high volume of purchase transactions, It is has recently
acquired its counterpart Visa Europe. Visa and Visa Europe’s boards are in agreement
on the terms of the deal which is expected to close in the second quarter of 2016.
Essentially, the merger will bring all of Visa’s global operations under one company. The
merger will give Visa a base of more than 14,000 financial institutions and 2.2 billion
accounts worldwide.
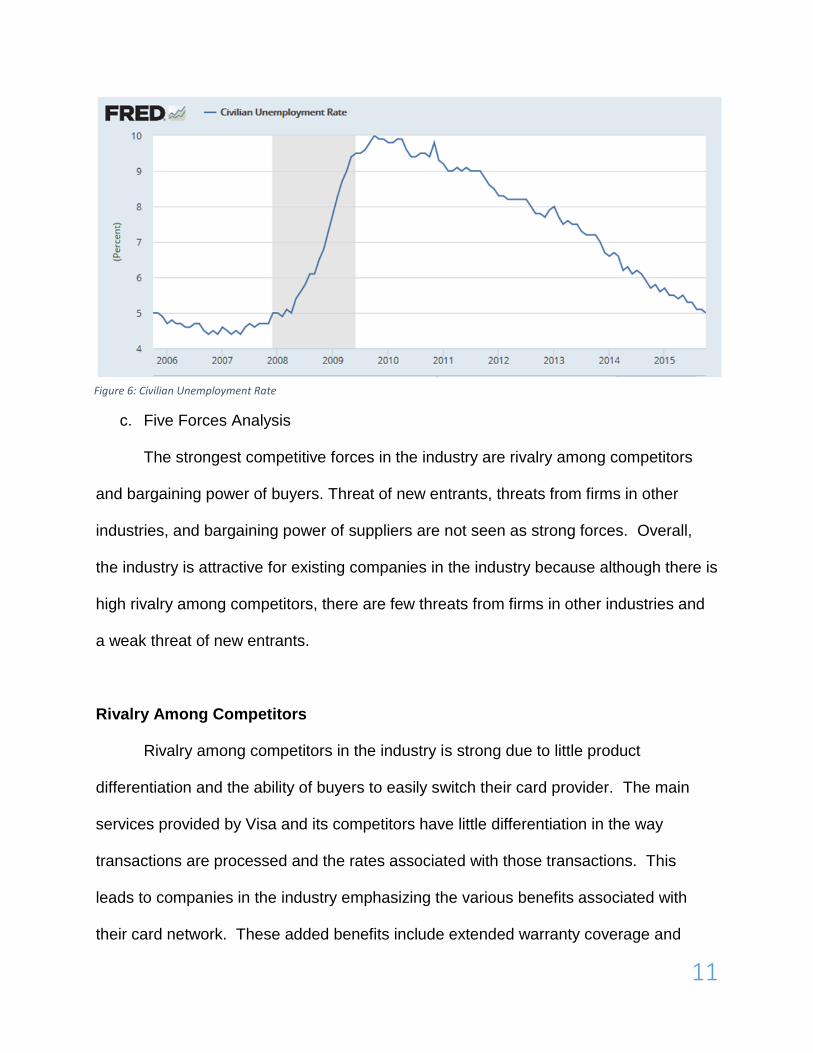
b. Industry Macro-Environment
An aspect of the macroeconomic environment that affects the payment card
industry is unemployment. Companies in the industry generate a majority of their
revenue through the fees they receive each time a card is swiped. As unemployment
decreases, there are more people with an income who are willing to spend that money
in the economy. With an increased number of consumers’ spending money, there are
more transactions to be processed in the industry. This increase in transactions leads to
increased profits for companies in the industry. According to projections by the Federal
Reserve, the unemployment rate is expected to decrease below 5 percent through
2018, which means more people with disposable income to spend on goods beyond
their basic necessities.
11
c. Five Forces Analysis
The strongest competitive forces in the industry are rivalry among competitors
and bargaining power of buyers. Threat of new entrants, threats from firms in other
industries, and bargaining power of suppliers are not seen as strong forces. Overall,
the industry is attractive for existing companies in the industry because although there is
high rivalry among competitors, there are few threats from firms in other industries and
a weak threat of new entrants.
Rivalry Among Competitors
Rivalry among competitors in the industry is strong due to little product
differentiation and the ability of buyers to easily switch their card provider. The main
services provided by Visa and its competitors have little differentiation in the way
transactions are processed and the rates associated with those transactions. This
leads to companies in the industry emphasizing the various benefits associated with
their card network. These added benefits include extended warranty coverage and
Figure 6: Civilian Unemployment Rate

12
price protection. Marketing plays a big role in the competitive nature of the credit
services industry.
Companies have to appeal to three different customer bases: financial
institutions, merchants, and consumers. By targeting cardholders, companies in the
industry are able to establish their brand in a way that consumers develop a superior
image of one company over others in the industry. If consumers have a consensus
favorite among the companies in the industry, then financial institutions and merchants
will be inclined to offer cards from the preferred company in order to improve their own
customer base. In an industry with four members, branding is likely an important part of
why some companies are more successful than others.
Bargaining Power of Buyers
Three groups of buyers can be identified in the industry. (See Figure
7) Companies in the industry market their products to financial institutions, merchants
and consumers.
Buyers in the Payment Industry
Financial Institutions Merchants Consumers
Banks agree to long-term agreements with Visa or MasterCard to issue credit and debit cards to their customers.
Many merchants choose to offer a credit card with their brand on it to benefit from interest payments and attempt to increase consumers’ overall spending by offering discounts and rewards when consumers use their card.
Consumers can choose to apply for a credit card from any of the companies in the industry. Their decisions are often based on rewards offered by the card or interest rates.
Figure 7: Buyers in the Payment Industry

13
Financial institutions have moderate bargaining power in the industry. They are
the buyers that have the most power over companies in the industry because the
agreements they make with credit processing companies result in the most lucrative
transactions for the companies. In order to compete for deals with financial institutions,
companies in the industry must be aware of what financial institutions are looking for,
and attempt to meet their expectations to gain their business and increased revenue.
Once the agreements expire, there are limited factors preventing companies to switch
between credit card providers. This ability and willingness of financial institutions to
switch credit providers has been exhibited recently by institutions switching between
companies in the industry. USAA made the switch from MasterCard to Visa, citing the
ability to provide end-users with more benefits and eliminating foreign transaction fees
as the main reasons for making the switch.
Merchants, such as Target, have weak to moderate bargaining power in the
industry because credit card companies compete to be the company merchants choose
to issue their cards through. These agreements normally are not as large in volume of
transactions as the agreements with banks to issue cards but still provide credit card
companies with an additional revenue stream. An example of a merchant that issues its
own credit card is Costco, which in the past has not only issued American Express
credit cards, but it only accepted American Express, until it recently made an agreement
to switch to Visa.
Consumers have weak bargaining power in the industry because the decisions of
one consumer have no effect on how companies in the industry operate. Companies
market toward consumers by highlighting the rewards offered by certain cards or

14
favorable interest rates. The reasoning for consumers to choose one card over another
varies based on the consumer’s use of the card. If consumers pay their bills off as soon
as they accrue any charges, it is likely they will base their decision on the rewards and
benefits they receive from using a particular card. Consumers who usually have a
balance on their card and make monthly payments may look for a card that offers the
lowest interest rates.
Threats of Substitute Products
There is a weak threat of substitute products in the payment card industry. With
e-commerce sales growing by almost 48% since 2013, there are multiple electronic
payment methods that have been introduced to the marketplace. Some of these forms
of payment, such as PayPal, have become familiar to many consumers while other
forms, such as Bitcoin, are still foreign to many people and therefore not as easily
understood.
PayPal, introduced in 2002, is integrated into most e-commerce shopping carts
and allows customers to make purchases without having to type in a card number. It
does this by connecting consumers’ bank accounts with online shopping carts. PayPal
is a substitute to both the debit and credit aspects of companies within the industry by
acting as both an online wallet linked to a bank account and by directly issuing credit to
consumers. PayPal also offers a credit card through MasterCard, which offers rewards
and extends the scope of PayPal’s involvement of overall transactions.
Bitcoin, introduced in 2008, is a newer method of payment that acts as a whole
new type of currency. The Bitcoin process involves consumers using electronic wallets
15
that enable the transfer of funds between consumers. Bitcoin is not as easy for
consumers to understand as concepts like PayPal, along with its recent decline in
popularity makes Bitcoin a less imposing threat to the credit services
industry. However, as transactions move from the traditional market place to more
online transactions there will likely be more electronic solutions introduced that could
hurt conventional credit providers in the future.
Even though there is potential for companies like PayPal to have an impact on
the payment card industry, e commerce transactions currently make up only about 6.5%
of all retail transactions worldwide. E-commerce is projected to make up about 8.8% by
2018, so even though e-commerce transactions are likely to make up a greater share of
all retail sales they are not increasing at a rate that poses a threat to the industry in the
near future.
Threat of New Entrants
The threat of new entrants has a weak effect on competition in the industry
because of the barriers to entry. These barriers include the size of the companies in the
industry, the extensive networks they have in place, and high start-up costs. Companies
in the industry have established strong brand recognition among consumers, making it
hard for a new company to come in and steal their market share. In order for a
company to come in and have an impact on the industry, it would need to overcome the
high startup costs, and execute a marketing plan that leads to buyers wanting its
product over the industry leaders.

16
Bargaining Power of Suppliers
The bargaining power of suppliers is another factor that has a weak effect on
competition in the industry. Companies in the payment card industry rely very little on
other companies to supply them with products or services needed to be
successful. The most significant supplier companies may have is one that sets up and
maintains their servers, but these companies have little power over the credit
companies.
d. Driving Forces
The revenue of the industry is driven by not only processing fees, but swipe fees
as well. Using any major credit, or debit card has become a part of many people’s lives
and businesses which can affect profitability and be seen as a driving force. The
Payment Card Industry is a growing industry due to the technological components
which is why increasing globalization and technology is another factor. Having
Consistent innovation and new technological processes to make things easier for
consumers to make payments and purchases around the world is essential. Most
importantly, changes in regulations can be a driving force. The current litigation that
some of the major card services are involved in can could possibly lead to a different
business model or redefine processing fees. All of these driving forces have a major
effect on the industry and can easily change the way things are done in the future.

17
III. Financial Analysis
a. Price Trends
Displayed in Figure 8 is the growth in price from November of 2010 until
November 23, 2015. Visa and MasterCard have experienced similar growth in market
price over the past five years with Visa being the outright leader. Visa’s stock price
growth is 313 percent to MasterCard’s stock price growth of 299 percent. Visa’s growth
has been steady over the five year period including a 65 percent growth since the
beginning of the current year. Discover’s stock kept pace until early 2015, has
experienced 203 percent growth. American Express’ stock price has increased 61%
since 2011, much slower than the other three companies but still more than Dow Jones’
Industrial Average 57% growth during the same time period. Visa and MasterCard have
continued to outperform the overall market recently.
Figure 8: Growth in Price from November 2010 – November 2015

18
b. Revenue Trends
Figures 9 and 10 show that Visa has had consistent revenue growth over the
past five years. Visa has experienced the highest percentage growth of its competitors
at a 47% increase since 2011. The potential addition of Visa Europe, which is
dominating the European market, and constant development of Visa aims to continue
this revenue growth in future years. Europe is the second only to the United States in
credit/debit transactions worldwide.
V MA DFS AXP
2011 9,188 6,714 7,066 29,962
2012 10,421 7,391 7,653 31,582
2013 11,778 8,346 8,224 32,974
2014 12,702 9,473 8,477 34,292
TTM 13,538 9,553 8,573 33,722
Figure 9: Annual Revenue 2011 - 2014 (in millions)
Figure 10: Revenue Trends since 2011

19
c. Earnings Trends
Figure 11 and 12 show the earnings trends since 2011. Visa’s earnings
increased each of the past two years, totaling a 61% increase in earnings over the past
five years. In 2012 Visa had a 41% decrease in earnings due to a $2.59 billion net
litigation settlement of an antitrust suit pertaining to excessive swipe-fees charged to
merchants.
Although MasterCard’s earnings increased 97% over the same time period, Visa
recorded $2 billion more in earnings than MasterCard during the latest 12-month period.
Visa’s profit margin is 43%, compared to MasterCard’s 39%, Discover’s 25%, and
American Express’s 18% in the past 12 months. According to Zacks Investment
Research, Visa’s forecasted earnings growth is 10.20% and 16.42% for fiscal years
ending in September of 2016 and 2017, respectively. Earnings growth is a key financial
statistic used by investors to determine the financial state of a company.
V MA DFS AXP
2011 3,650 1,906 2,202 4,935
2012 2,144 2,759 2,340 4,482
2013 4,980 3,116 2,414 5,359
2014 5,438 3,617 2,270 5,885
TTM 5,889 3,757 2,181 5,904
Figure 11: Earnings Trends since 2011

20
Figure 12: Earnings Trends since 2011
d. Return on Assets
Visa had the second highest return on assets of its main competitors with a
15.28% return (See Figure 13). Only MasterCard had a higher return at 25.34% while
Discover and American Express were below 4%. Return on Assets gives an idea as to
how efficient management is at using its assets to generate earnings. Visa has
increased ROA 43% since 2011 while MasterCard has increased ROA 30% during that
time. Visa is improving an already strong ROA faster than its competitors.

21
V MA DFS AXP
2011 10.71 19.52 3.40 3.29
2012 5.73 23.83 3.22 2.92
2013 13.11 23.34 3.04 3.50
2014 14.59 24.46 2.79 3.77
TTM 15.28 25.34 2.66 3.81
Figure 13
e. Return on Equity
Visa is third (TTM) regarding ROE when compared with competitors. Shown in
Figure 14 is the ROE for all companies since 2011. Visa had the second highest
increase in ROE during the five-year time period. Discover’s ROE has been decreasing
since 2011 while American Express has stayed relatively even during that span. Visa
has been improving ROE steadily, generating profits from the investments of its
shareholders at a faster rate than Discover and American Express.
V MA DFS AXP
2011 14.19 34.43 29.96 28.18
2012 7.93 43.16 26.55 23.79
2013 18.28 43.27 23.55 27.92
2014 20.04 50.68 21.80 29.30
TTM 21.06 59.31 20.27 28.05
Figure 14

22
Analysis
Visa’s (V) financials are favorable when compared with other industry leaders
MasterCard (MA), Discover Financial (DFS), and American Express (AXP). Data is
shown below (See Figure 15). Visa is the leader or close second in multiple financial
categories shown in figure15 below. Visa is the only company with a Beta below 1,
meaning that volatility in the overall market is not going to affect Visa’s price as
significantly compared to the other three competitors. Visa’s P/E and PEG ratios are
higher than the industry averages of 14.29 and .98, respectively. The high P/E ratio is
primarily due to sustained success resulting in Visa reporting income in 19 consecutive
quarters. According to yahoo finance the forward P/E ratio estimate is 27.19, which
means investors will be paying less for each dollar of earnings in the future than the
current P/E ratio of 32.36.
V MA DFS AXP
Market Cap (Billions) 190.20 112.79 24.40 73.08
P/E 32.36 30.56 11.72 13.39
PEG 1.69 1.82 1.27 1.77
Beta 0.93 1.26 1.29 1.08
ROA (%) 14.25 21.51 2.65 3.71
ROE (%) 21.07 58.93 19.47 27.71
Long-term D/E 0.00 23.23 210.56 247.62
Trailing Dividend $0.60 $0.60 $1.80 $1.50
Figure 15

23
IV. Visa Europe
Visa has agreed to a merger with Visa Europe worth $23.4 billion that would
likely steepen the growth trajectory for Visa. Visa Europe was spun off of Visa prior to
Visa’s initial public offering. Visa Europe currently controls 52% of the European market,
while MasterCard currently controls around 26%. The deal will expand Visa into Europe
and making it a single global company that will add more than 3,000 financial
institutions to Visa’s partner list and 500 million European cards to its clientele which is
responsible for about 18 billion transactions that is worth more than 1.5 trillion
euros. Visa Europe already utilizes some of the technologies that Visa is developing to
help deal with digital theft and credit card fraud, including the use of chips in their cards.
Visa is placing a lot of emphasis on developing new technologies that make
transactions more secure for consumers that use their product, and security is one of
the biggest issues in today’s market. By leading the industry in security developments,
Visa looks to secure its position as the world’s largest money card processor, and a
merger with Visa Europe will only make the company that much stronger.
V. Recent News
According to the balance sheet there is an increase in “Restricted cash—litigation
escrow” which is due to a class action lawsuit that was initiated by over 8,000
merchants like Wal-Mart, Target, and Amazon. The ligation has been pending since
2005 and the lawsuits accused Visa and MasterCard of fixing the fees that merchants
are charged each time that a consumer uses their credit or debit cards. The current
value of the settlement is approximately $5.7 billion. In order to be prepared for the
future of the settlement, which will be divided between Visa and MasterCard, Visa has

24
set aside a portion of its monetary assets to cover the costs and expenses of the
settlement.
Additionally, there is a decrease in “accounts payable” and increase in “client
incentives” which show that Visa is paying more of its accounts off and investing more
money into client incentives. Investing into client incentives helps sustain current long-
term contracts with financial institution clients and other business partners for various
programs designed to build payments volume, increase Visa-branded card and product
acceptance and win merchant routing transactions.
VI. Recommendation
We believe Visa to be a wise investment for the Birkey Investment Fund based of
the following reasons:
Visa’s value can been seen in its powerful network. Visa is poised to
answer questions as to why consumers should pay with Visa cards over
competitors and why merchants should choose Visa cards over
alternatives. As of December 2014, Visa cards are accepted in 36 million
merchant locations and had 2.9 billion issued cards. The large card base
along with great number of merchants who accept such cards is vital in
the payment card industry; Visa is well positioned in these areas.
Visa’s largest competitor, MasterCard, holds a strong position in
acceptance points, being accepted in 36 million merchant locations.
However, the advantage for Visa is its card count, which is 38% greater
than MasterCard resulted in Visa cards being used for 45% greater total
volume. Total volume is the dollar value of payments and cash accessed.

25
American Express falls significantly behind Visa in both aspects with 112
million issued cards and only 16 million merchant locations.
The acquisition of Visa Europe estimates to add 500 million cards to
Visa’s network which are members of 3000 financial institutions. Europe
is the second to the United States in the number of payment card
transactions.
Visa is the leading market share in the industry, being responsible for
51% or purchase transactions worldwide. Visa is the largest company in
the payment card industry and with the addition of Visa Europe this trend
will likely hold for years to come.
According to Zacks Investment Research forecasted earnings growth is
10.20% and 16.42% for fiscal years ending in September of 2016 and
2017, respectively.
Visa has zero Long-term debt meaning as a company they are extremely
liquid. Visa is able to pay their obligations as they come due immediately.
Visa has a leading profit margin at 43%, meaning that Visa is the most
efficient in terms of the money they make from their revenues than their
competitors.
The Visa global brand is valued at $91 billion. MasterCard’s global brand
is valued at $40 billion. Brand equity is the positive and negative affects a
company's brand has on consumers and business partners. Brand equity
can be defined as a brand’s power derived from the goodwill and name
recognition that it has earned over time, which translates into higher sales
26
volume and higher profit margins against competing brands.
Visa stock has a high price to earnings ratio of 30.88 at close on Monday,
November 23, 2015. This may raise some concerns about purchasing the
stock. We feel strongly that Visa’s high price to earnings ratio does not
signify that Visa is a poor investment going forward based upon past
stock price growth. Following this ratio back to July 2012 identifies a price
to earnings ratio hovering around 65. The price to earnings ratio has not
dropped below 23 since prior to July 2012. Visa’s stock on July 1, 2012,
closed at a price of $31.32. On November 10, 2015, Visa closed at
$79.48. This is a roughly 250% price increase over that time period. A
high price to earnings ratio generally signifies investors believe a
company has strong future growth potential and are willing to pay a larger
amount per dollar of earnings. A value investor is typically searching for a
price to earnings ratio that is improperly valued. Visa investors over the
past three years noticing a high price to earnings ratio have continually
invested.
27
VII. References
A simple explanation of fees in the payment card industry. (2014, August 9). Retrieved November 24, 2015, from http://gendal.me/2014/08/09/a-simple-explanation-of-fees-in-the-payment-card-industry/
Allison, I. (2015, June 25). Visa, MasterCard and Amex: Payments dinosaurs face off Bitcoin
technology threat. Retrieved from International Business Times: http://www.ibtimes.co.uk/visa-mastercard-amex-payments-dinosaurs-face-off-bitcoin-technology-threat-1507973
Alpha, Seeking. (2015, May 18). Visa: Market Power, Stable Growth And High Profitability
Doesn't Come Cheap. Retrieved from Nasdaq: http://www.nasdaq.com/article/visa-market-power-stable-growth-and-high-profitability-doesnt-come-cheap-cm478051
Charts & Graphs Archive. (2015). Retrieved from Nilslon Report:
http://www.nilsonreport.com/publication_chart_and_graphs_archive.php Citi, Visa Win Costco Credit Card Business. (2015, March 2). Retrieved from Forbes:
http://www.forbes.com/sites/laurengensler/2015/03/02/citi-visa-win-costco-credit-card-business/
Holmes, T. E. (n.d.). Credit card market share statistics. Retrieved from Credit Cards:
http://www.creditcards.com/credit-card-news/credit-card-market-share-statistics-1264.php
How does Bitcoin work? (n.d.). Retrieved from bitcoin: https://bitcoin.org/en/how-it-works How Visa, MasterCard Earn Cash (and Why You Should Care). (n.d.). Retrieved November 24,
2015, from http://www.dailyfinance.com/2014/07/29/how-visa-mastercard-make-money/ Investor's Business Daily. (2015, September 29). Visa Aims For A 'Token' Of Customers' Appreciation. Retrieved from Nasdaq: http://www.nasdaq.com/article/visa-aims-for-a-token-of-customers-appreciation-cm525489 Isidore, C. (2015, March 3). Costco teams with Citi and Visa. Retrieved from CNN Money:
http://money.cnn.com/2015/03/02/news/companies/costco-citi-visa/ Millward Brown. (n.d.). Visa's global brand value from 2009 to 2015 (in billion U.S. dollars).
InStatista - The Statistics Portal. Retrieved November 24, 2015, from http://www.statista.com/statistics/326068/visa-global-brand-value/
Papadimitriou, Odysseas;. (n.d.). Market Share by Credit Card Network. Retrieved 2015, from
CardHub: http://www.cardhub.com/edu/market-share-by-credit-card-network/ PayPal Extras MasterCard. (n.d.). Retrieved November 24, 2015, from
https://www.paypal.com/webapps/mpp/credit-card Payment Card Industry (PCI). (n.d.). Retrieved from Techopedia:
https://www.techopedia.com/definition/1557/payment-card-industry-pci

28
PCI Security Standards Council. (n.d.). About Us. Retrieved from PCI Security Standards
Council: https://www.pcisecuritystandards.org/organization_info/index.php Sidel, R. (2015, October 25). USAA Switching Credit, Debit Cards to Visa From Longtime
Partner MasterCard. Retrieved from The Wall Street Journal: http://www.wsj.com/articles/usaa-switching-credit-debit-cards-to-visa-from-mastercard-1445723841
The Complete Guide to Credit Card Processing Fees & Rates. (2013, January 9). Retrieved
November 24, 2015, from http://www.merchantmaverick.com/the-complete-guide-to-credit-card-processing-rates-and-fees/
US court hears challenge to US$5.7 billion Visa, MasterCard settlement. (2015, September 29). Retrieved from Channel NewsAsia: http://www.channelnewsasia.com/news/business/us-court-hears-challenge/2157070.html Visa Acquirer Processing Fee (APF). (n.d.). Retrieved November 24, 2015, from http://www.cardfellow.com/acquirer-processing-fee/

29
VIII. Appendix
Income Statement
30
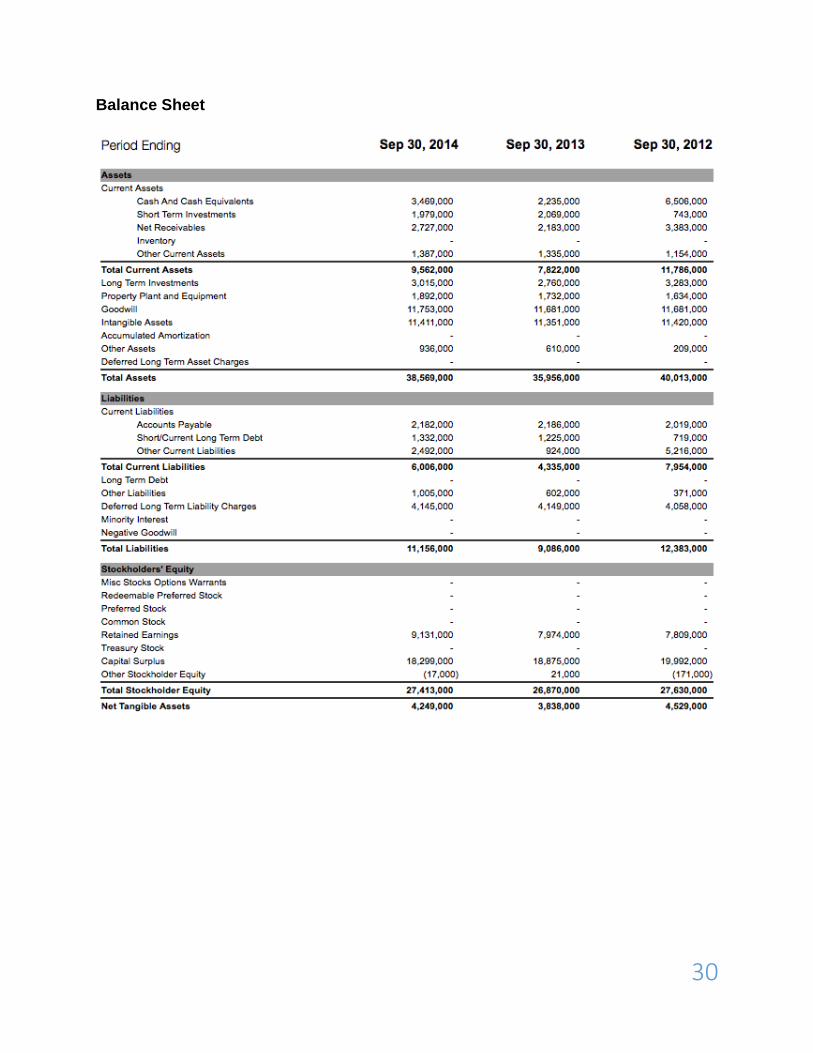
Balance Sheet

31
Cash Flow