visible led-based photo-redox properties of sulfur and
TRANSCRIPT

© 2022 The Author(s). Published by the Royal Society of Chemistry Mater. Adv., 2022, 3, 355–361 | 355
Cite this: Mater. Adv., 2022,
3, 355
Visible LED-based photo-redox properties ofsulfur and nitrogen-doped carbon dots designedby solid-state synthesis†
Neha Kaushal,ab Amit L. Sharmaab and Avishek Saha*ab
Nitrogen-doped and sulfur, nitrogen co-doped carbon dots (CDs) were synthesized using a solid-state,
solvent-free, microwave synthesis technique at 250 1C. CDs were synthesized using citric acid as the
carbon precursor and urea or thiourea as the nitrogen and sulfur precursor. The solid-state synthesis
produced crystalline nitrogen-doped CDs (N-CDs) and nitrogen/sulfur co-doped CDs (S,N-CDs) with a
broad absorption band in the visible region. The photoredox catalytic properties of the as-prepared CDs
were demonstrated by investigating the model photoreduction of methyl viologen using 410 nm and
455 nm light-emitting diodes (LEDs). The highest concentration of the methyl viologen radical cation
was monitored in the presence of N-CDs in comparison with S,N-CDs. The results indicate that
nitrogen-doped graphitic CDs feature higher charge extraction for photoredox catalysis in comparison
to nitrogen, sulfur co-doped CDs.
Introduction
Carbon dots (CDs) have attracted significant research interestsince their discovery in 2004.1 Due to their unique propertiessuch as high stability, tunable photoluminescence, chemicalinertness, and biocompatibility, CDs have been investigated fora wide range of applications, including photocatalysis,2–4 sensing,5–8
electrocatalysis,9–11 biomedical applications,12–15 etc. In general, CDsconsist of organic functional groups covalently attached to the coresemiconducting graphitic domain featuring photoluminescenceproperties from the UV to near IR region of the solar spectrum. Inthis context, recent studies have suggested that the conventionalbottom-up synthesis of carbon nanodots is likely to producemolecular side-products including citrazinic acid and 4-hydroxy-1H-pyrrolo[3,4-c]pyridine-1,3,6(2H,5H)-trione (HPPT).16–18 Althoughthe presence of a complex variety of photoluminescent molecules inCDs is attractive for sensing applications, these fluorescent mole-cules are not desirable for the photoredox catalytic process.
Thermal solid-phase synthesis could prevent the formationof these complex molecular by-products and facilitate theconstruction of a graphitic domain of CDs.19,20 For example,Reisner et al. demonstrated that increasing the synthesistemperature will increase the graphitized carbon core.4
They have further reported that graphitized carbon dots exhibitbetter photocatalytic activity than amorphous carbon dots. Inparticular, the microwave-assisted solvent-free synthesismethod has several advantages, including short reaction time,reproducibility, and scalability.20 Apart from solid-state synth-esis, doping of carbon nanodots with heteroatoms like nitro-gen, sulfur, etc. could be another strategy to improve thephotoredox properties of CDs. Nitrogen is the most frequentlyused element due to its easy doping process and comparativeatomic size. Core nitrogen doping can have a consequentialimpact on photocatalysis by tuning the absorption towards thevisible spectrum and by facilitating the light induced chargetransfer process. Also, doping of carbon dots with sulphuratoms can result in the enhancement of electron donatingefficiency of CDs and thus elevate the efficiency of the photo-catalytic process. To this end, N and/or S doped CDs havedemonstrated enhanced photocatalytic and photoredoxproperties.21,22
To this end, very few studies are there on the photoredoxproperties of doped and graphitized carbon dots synthesized bysolid-phase, bottom-up synthesis. Cailotto et al. performedcomparative studies on photoinduced electron transfer fromdifferent amorphous and graphitized carbon nanodots, withoutintroducing any heteroatoms.22 On the other hand, Prato et al.investigated the photocatalytic properties of nitrogen-dopedcarbon dots produced by liquid phase microwave synthesis.Still, the crystalline/amorphous nature of the core of carbondots has not been studied.23 To enhance the photocatalyticproperties of carbon dots, it is crucial to investigate the electron
a Central Scientific Instruments Organisation (CSIR-CSIO), Sector 30-C,
Chandigarh-160030, India. E-mail: [email protected] Academy of Scientific and Innovative Research (AcSIR-CSIO),
Ghaziabad-201002, India
† Electronic supplementary information (ESI) available. See DOI: 10.1039/d1ma00860a
Received 17th September 2021,Accepted 9th October 2021
DOI: 10.1039/d1ma00860a
rsc.li/materials-advances
MaterialsAdvances
PAPER
Ope
n A
cces
s A
rtic
le. P
ublis
hed
on 1
8 O
ctob
er 2
021.
Dow
nloa
ded
on 2
/22/
2022
11:
28:0
4 PM
. T
his
artic
le is
lice
nsed
und
er a
Cre
ativ
e C
omm
ons
Attr
ibut
ion-
Non
Com
mer
cial
3.0
Unp
orte
d L
icen
ce.
View Article OnlineView Journal | View Issue

356 | Mater. Adv., 2022, 3, 355–361 © 2022 The Author(s). Published by the Royal Society of Chemistry
transfer properties of different heteroatoms doped, crystallinecarbon dots.
In this work, we have synthesized graphitized N-doped andS,N-doped carbon dots at 250 1C following the solid-phasemicrowave synthesis route. Furthermore, investigation of thephotoinduced electron transfer properties has been carried outby performing the photoreduction of methyl viologen with 410and 455 nm LED sources. This study could provide insight intothe role of morphology, structure, and optical properties for thepotential application of carbon dots in visible light-assistedphotocatalytic applications.
Results and discussion
The nature of functional groups present in the as-synthesizedN-CDs and S,N-CDs determines their optical properties that areevaluated by UV-Vis and photoluminescence spectroscopy.Fig. 1(a) shows the UV-Visible absorption spectra of theN-doped and S,N-doped carbon dots with different precursorweight ratios (citric acid : urea (C/U) and citric acid : thiourea(C/T)) synthesized at 250 1C. N-CD-1 features a prominent peakat ca. 260 nm, which can be assigned to the p- p* transition ofCQC of the sp2 domain. The higher urea/thiourea contentresults in a small peak around 330 nm due to the n - p*transition. Also, a broadened shoulder at 410 nm has beenobserved with its tail extending in the entire visible region,which might be due to the presence of surface molecularcenters. This becomes more evident with the decrease in theweight ratio of precursors.
To assess the emission induced by p - p* and n - p*absorption transitions, the photoluminescence spectra wereanalysed by varying the excitation wavelength from 280 to
600 nm. Photoluminescence emission follows Stokes’ typeemission; basically the photoluminescence emission wave-length is longer then the excitation wavelength. Also, thephotoluminescence emission profile of different CDs in D.I.water shows the typical excitation wavelength-dependent behav-iour by shifting the emission wavelength from 430 to 570 nm(Fig. S1, ESI†). For S,N-CDs, the emission peak maximaoccurred at 370 and 430 nm corresponding to the excitationwavelengths of 340 nm for S,N-CD-1 and S,N-CD-2, respectively,which is due to the introduction of sulphur atoms. The excita-tion dependent emission characteristics are consistent withthose of previously reported S,N-CDs (Fig. S1(c) and (d),ESI†).24,25 Interestingly, the 3D photoluminescence spectra ofthe N-CD-1 and N-CD-2 have shown a red-shifted emissionmaxima at 530 nm along with 360 nm, (Fig. 1(b) and Fig. S2(b),ESI†). This red-shifted emission in the case of N-CDs is prob-ably due to the interband transitions (p*–p type) as observed inprevious reports based on solid-state synthesis.20,26 With theincrease in the nitrogen content in CDs at higher temperatures,a low-lying intermediate state occurs in between the band. Thisresults in narrowing the energy gap and leads to red-shiftedinterstate transition at 530 nm. Another possible reason for thegreen emission is likely due to the presence of molecularfluorophores (HPPT) attached to carbon cores.18,27
HR-TEM analysis was carried out to identify the morphology,crystallinity, and size distribution. The TEM images indicate that thesamples prepared with SPMA via the microwave method are welldispersed (Fig. 1(d) and Fig. S3, S4, ESI†) and the corresponding sizedistribution analysis in the histogram is shown in Fig. S3 and S4,ESI.† The value of the average nanoparticle size and polydispersitymeasurement was performed by Gaussian fitting of size distribution(see Table S1, ESI†).
The crystalline phase of the prepared CD samples wascharacterized using the powder XRD technique. All the samplesshow a characteristic peak at around 271 (2y), corresponding tothe d(002) reflection arising due to the interlayer stackingreflection.4,18 Apart from this, the broad peak at around 131(2y) represents the d(001) reflection, indicating the amorphouscharacteristics which decreases with the increase in the urea/thiourea precursor ratio. Moreover, relatively higher intensityand sharper d(002) peaks have been observed for a higheramount of urea/thiourea precursor enriched carbon dots(N-CD-2, and S,N-CD-2) as compared to N-CD-1 and S,N-CD-1,respectively (Fig. 2).
Raman characterization is helpful in detecting the intrinsicproperties of sp2 carbon materials. The Raman spectra of all thecarbon dots, as shown in Fig. S5 (ESI†), reveal the two usualpeaks at around 1359 (D peak) and 1580 cm�1 (G peak). Thepeaks were observed with varying intensity values. Typically, theG band at 1580 cm�1 is a characteristic of crystallised graphiticcarbon which illustrates the E2g mode for graphite that signifiesthe vibration of sp2 bonded C-atoms present in the lattice.28,29
However, the presence of the D band at around 1360 cm�1 isevidence of amorphous characteristics, which corresponds tothe vibration of C-atoms associated with dangling bonds in thetermination plane of graphite with a disordered nature.30
Fig. 1 (a) UV-visible absorption spectra of N-CD-1, N-CD-2, S,N-CD-1,and S,N-CD-2 in aqueous dispersion. 3-D photoluminescence spectra of(b) N-CD-2 and (c) S,N-CD-2. (d) HR-TEM images (scale bar = 200 nm) ofN-CD-2.
Paper Materials Advances
Ope
n A
cces
s A
rtic
le. P
ublis
hed
on 1
8 O
ctob
er 2
021.
Dow
nloa
ded
on 2
/22/
2022
11:
28:0
4 PM
. T
his
artic
le is
lice
nsed
und
er a
Cre
ativ
e C
omm
ons
Attr
ibut
ion-
Non
Com
mer
cial
3.0
Unp
orte
d L
icen
ce.
View Article Online

© 2022 The Author(s). Published by the Royal Society of Chemistry Mater. Adv., 2022, 3, 355–361 | 357
The FTIR Spectra of carbon dot samples were recorded toobtain the structural information (Fig. 3). The bands in therange of 3400 to 2900 cm�1 signify the presence of stretchingvibrational modes of (O–H) and (N–H) functional groups. Thepeaks at B1710 and 1638 cm�1 are associated with the carbo-nyl and amide functional groups.31 These peaks are stronger inN-CDs as compared to S,N-CDs signifying the presence of moreamino functional groups. The signal at 1384 cm�1 is assignedto the stretching mode of C–N.18,31 In S,N-CDs, the additionalabsorption features at 1080 and 735 cm�1 are ascribed to thestretching vibrations of CQS and C–S, respectively.21
Next, we turned to X-ray photoelectron spectroscopy (XPS) toinvestigate the elemental composition of carbon dots. In thefull scan XPS spectrum of N-CD-2, as shown in Fig. 4(a), threecharacteristic peaks were found at 286.4, 400.6, and 532.4 eV,which correspond to C (1s), N (1s), and O (1s), respectively. Onthe other hand, two additional peaks, S (2s) – 229.7 eV andS (2p) – 164.7 eV, were observed for the S,N-CD sample,confirming the presence of sulfur atoms.21 For N-CDs, thedeconvoluted high-resolution spectrum of C (1s), Fig. 4(b),exhibits three characteristic peaks at 284.6 eV (sp2 carbon,CQC), 285.7 eV (C–S or C–N), and 287.8 eV (CQO).20,32 Therelatively high intensity of the 284.6 eV peak indicatesthe presence of sp2 enriched carbon atoms.18 The peaks fromthe high-resolution spectra of O (1s) were observed at 531.1 eVand 532.2 eV confirming the formation of CQO and C–OH/C–O–C bonds, respectively. This might be due to the presence
of atmospheric oxygen and from the solvent as well,33,34 asshown in Fig. 4(c). The two peaks in the deconvoluted N (1s)high resolution spectra at 398.5 and 399.9 eV, as shown inFig. 4(d), can be assigned to pyridinic and pyrrolic nitrogen,respectively.35 Apart from this, for the S,N-CD sample, thedeconvoluted spectra of S (2p) show five peaks at 161.6 eV for(S–H) bonds, 163.6 eV for (C–Sn–C, where, n = 1 or 2), represent-ing a thiophene like structure, 164.9 eV for (–CQS– bonds),168.0 eV for (–C–SO3) bonds, and 169.2 eV representing the(–C–SO4) bond formation in the prepared samples (see Fig. S6,ESI†).36 The elemental composition analysis from the XPSspectra reveals that N-CD contains (33.8, 36.8, and 29.4)%carbon, oxygen, and nitrogen, respectively, while forthe S,N-CD sample, the carbon, oxygen, and nitrogencontents are (29.4, 36.8, and 29.4)% respectively along with30.9% sulfur.
Time-resolved photoluminescence of N-CDs and S,N-CDswas monitored using time-correlated single photon counting(TCSPC) to understand the excited state properties. The photo-luminescence decay was monitored with pulsed excitation at377 nm and the emission at 450 nm (see Fig. S7, ESI†).Photoluminescence decays of all the CDs demonstrate a biex-ponential decay (time constants are reported in the ESI,†Table S2). To this end, nitrogen doped carbon dots (N-CD-2)reveal the most extended lifetime with time constants of2.94 and 10.06 ns. Interestingly, sulphur doped carbon dots(S,N-CDs) feature a slightly shorter lifetime.
Fig. 2 XRD spectra of N-CD-1, N-CD-2, S,N-CD-1, and S,N-CD-2.Fig. 3 FTIR spectra of N-CD-1, N-CD-2, S,N-CD-1, and S,N-CD-2.
Materials Advances Paper
Ope
n A
cces
s A
rtic
le. P
ublis
hed
on 1
8 O
ctob
er 2
021.
Dow
nloa
ded
on 2
/22/
2022
11:
28:0
4 PM
. T
his
artic
le is
lice
nsed
und
er a
Cre
ativ
e C
omm
ons
Attr
ibut
ion-
Non
Com
mer
cial
3.0
Unp
orte
d L
icen
ce.
View Article Online

358 | Mater. Adv., 2022, 3, 355–361 © 2022 The Author(s). Published by the Royal Society of Chemistry
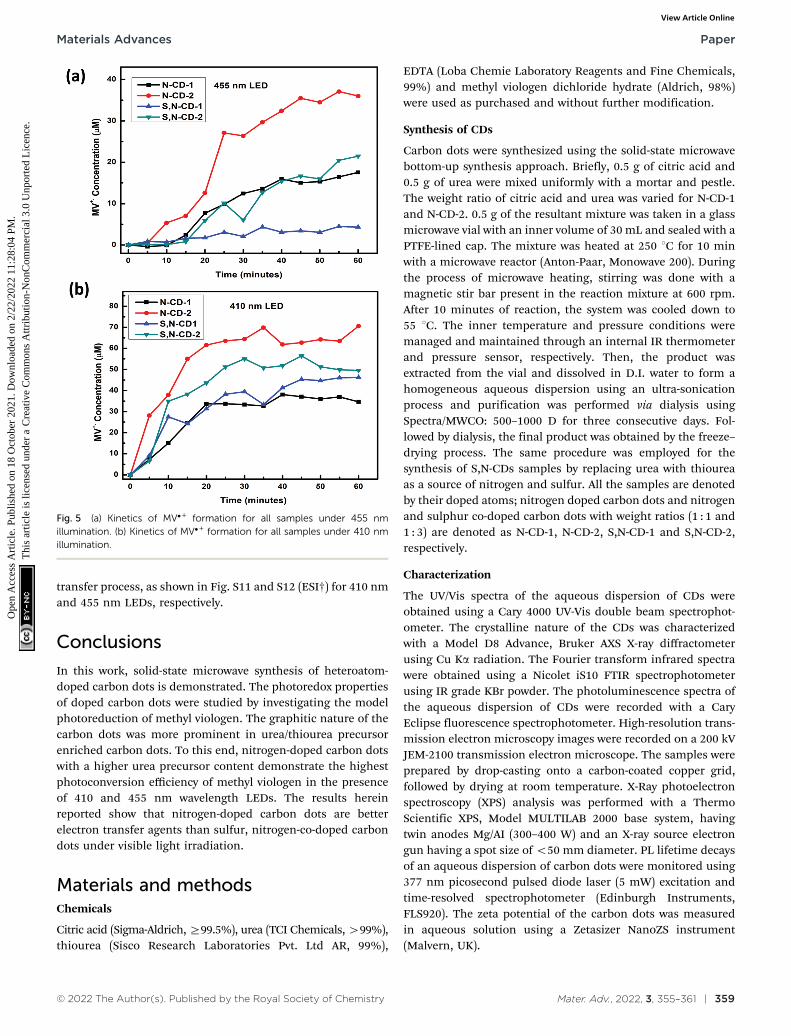
To understand the photoredox catalytic properties of N-CDs,and S,N-CDs, 410 and 455 nm wavelength LEDs were employedto study the conversion efficiency for the photoreduction ofmethyl viologen cations (MV2+, �0.45 V vs. NHE) in thepresence of EDTA as a sacrificial hole scavenger (see Fig. S8and S9, ESI†). The photoreduction of methyl viologen to form ablue color radical cation has been extensively studied to under-stand the electron transfer properties of different nanomater-ials, including carbon dots.23,37–39 Positively charged MV2+ arelikely to be attached onto the surface of negatively chargedcarbon dots through electrostatic interaction, which facilitatesthe electron transfer from CDs to MV2+ under photo-excitation.40 Conversion of MV2+ to MV�+ is a reversible processindicated by the colour change from colorless to blue, which ismonitored by the presence of a 605 nm peak in the UV-Visabsorption spectra. In this case, the zeta potential values of allthe samples are in the range of �34.3 to �17.96 mV (see TableS3 and Fig. S10, ESI†). Among all the CDs, N-CD-2 demonstratesthe highest conversion (B3.5%) and (B7.0%) efficiency onillumination with 455 nm and 410 nm LEDs, respectively, asshown in Fig. 5(a) and (b), respectively. It should be noted thatalthough previous reports on carbon dot-based photoreductionof methyl viologen have shown higher efficiency, they haveemployed high-intensity UV-LEDs (365 nm) or solar simulators
as light sources.22,23 The overall trends for the conversionefficiency was observed as (N-CD-2 4 S,N-CD-2 4 S,N-CD-14 N-CD-1) for the 410 nm LED and (N-CD-2 4 S,N-CD-2 4N-CD-1 4 S,N-CD-1) for the 455 nm LED. This illustrates thatthe presence of nitrogen plays a more important role thansulfur for the photoinduced electron properties of carbon dots.Also, a higher conversion efficiency was observed in the case ofa 410 nm LED as compared to the illumination with a 455 nmLED because of the higher absorption of all the prepared CDsin the near visible region as observed from the UV-Vis absorp-tion spectra, – Fig. 1(a). The higher conversion efficiency can beexplained by the long photoluminescence lifetime of N-CD-2.Furthermore, recent ultrafast spectroscopic studies havedemonstrated that back electron transfer between the photo-excited holes in carbon dots and methyl viologen radicalcations is slower in N-doped carbon dots in comparison withother heteroatom doped carbon dots.41
The photoredox catalytic nature of N-CD-2 was furtherinvestigated by monitoring the kinetics of MV�+ formationthrough sequential photoinduced electron transfers.22 After1 h of illumination for each set of photoreduction, the resultantblue solution was allowed to become colorless overnight. Asimilar rate of formation of MV�+ was observed for subsequentruns (runs 2 and 3), indicating the reversibility of the electron
Fig. 4 (a) Survey-scan XPS spectra of N-CD and S,N-CD samples. High-resolution XPS spectra of the N-CD-2 sample: (b) C 1s, (c) O 1s, and (d) N 1s.
Paper Materials Advances
Ope
n A
cces
s A
rtic
le. P
ublis
hed
on 1
8 O
ctob
er 2
021.
Dow
nloa
ded
on 2
/22/
2022
11:
28:0
4 PM
. T
his
artic
le is
lice
nsed
und
er a
Cre
ativ
e C
omm
ons
Attr
ibut
ion-
Non
Com
mer
cial
3.0
Unp
orte
d L
icen
ce.
View Article Online
© 2022 The Author(s). Published by the Royal Society of Chemistry Mater. Adv., 2022, 3, 355–361 | 359
transfer process, as shown in Fig. S11 and S12 (ESI†) for 410 nmand 455 nm LEDs, respectively.
Conclusions
In this work, solid-state microwave synthesis of heteroatom-doped carbon dots is demonstrated. The photoredox propertiesof doped carbon dots were studied by investigating the modelphotoreduction of methyl viologen. The graphitic nature of thecarbon dots was more prominent in urea/thiourea precursorenriched carbon dots. To this end, nitrogen-doped carbon dotswith a higher urea precursor content demonstrate the highestphotoconversion efficiency of methyl viologen in the presenceof 410 and 455 nm wavelength LEDs. The results hereinreported show that nitrogen-doped carbon dots are betterelectron transfer agents than sulfur, nitrogen-co-doped carbondots under visible light irradiation.
Materials and methodsChemicals
Citric acid (Sigma-Aldrich, Z99.5%), urea (TCI Chemicals, 499%),thiourea (Sisco Research Laboratories Pvt. Ltd AR, 99%),
EDTA (Loba Chemie Laboratory Reagents and Fine Chemicals,99%) and methyl viologen dichloride hydrate (Aldrich, 98%)were used as purchased and without further modification.
Synthesis of CDs
Carbon dots were synthesized using the solid-state microwavebottom-up synthesis approach. Briefly, 0.5 g of citric acid and0.5 g of urea were mixed uniformly with a mortar and pestle.The weight ratio of citric acid and urea was varied for N-CD-1and N-CD-2. 0.5 g of the resultant mixture was taken in a glassmicrowave vial with an inner volume of 30 mL and sealed with aPTFE-lined cap. The mixture was heated at 250 1C for 10 minwith a microwave reactor (Anton-Paar, Monowave 200). Duringthe process of microwave heating, stirring was done with amagnetic stir bar present in the reaction mixture at 600 rpm.After 10 minutes of reaction, the system was cooled down to55 1C. The inner temperature and pressure conditions weremanaged and maintained through an internal IR thermometerand pressure sensor, respectively. Then, the product wasextracted from the vial and dissolved in D.I. water to form ahomogeneous aqueous dispersion using an ultra-sonicationprocess and purification was performed via dialysis usingSpectra/MWCO: 500–1000 D for three consecutive days. Fol-lowed by dialysis, the final product was obtained by the freeze–drying process. The same procedure was employed for thesynthesis of S,N-CDs samples by replacing urea with thioureaas a source of nitrogen and sulfur. All the samples are denotedby their doped atoms; nitrogen doped carbon dots and nitrogenand sulphur co-doped carbon dots with weight ratios (1 : 1 and1 : 3) are denoted as N-CD-1, N-CD-2, S,N-CD-1 and S,N-CD-2,respectively.
Characterization
The UV/Vis spectra of the aqueous dispersion of CDs wereobtained using a Cary 4000 UV-Vis double beam spectrophot-ometer. The crystalline nature of the CDs was characterizedwith a Model D8 Advance, Bruker AXS X-ray diffractometerusing Cu Ka radiation. The Fourier transform infrared spectrawere obtained using a Nicolet iS10 FTIR spectrophotometerusing IR grade KBr powder. The photoluminescence spectra ofthe aqueous dispersion of CDs were recorded with a CaryEclipse fluorescence spectrophotometer. High-resolution trans-mission electron microscopy images were recorded on a 200 kVJEM-2100 transmission electron microscope. The samples wereprepared by drop-casting onto a carbon-coated copper grid,followed by drying at room temperature. X-Ray photoelectronspectroscopy (XPS) analysis was performed with a ThermoScientific XPS, Model MULTILAB 2000 base system, havingtwin anodes Mg/AI (300–400 W) and an X-ray source electrongun having a spot size of o50 mm diameter. PL lifetime decaysof an aqueous dispersion of carbon dots were monitored using377 nm picosecond pulsed diode laser (5 mW) excitation andtime-resolved spectrophotometer (Edinburgh Instruments,FLS920). The zeta potential of the carbon dots was measuredin aqueous solution using a Zetasizer NanoZS instrument(Malvern, UK).
Fig. 5 (a) Kinetics of MV�+ formation for all samples under 455 nmillumination. (b) Kinetics of MV�+ formation for all samples under 410 nmillumination.
Materials Advances Paper
Ope
n A
cces
s A
rtic
le. P
ublis
hed
on 1
8 O
ctob
er 2
021.
Dow
nloa
ded
on 2
/22/
2022
11:
28:0
4 PM
. T
his
artic
le is
lice
nsed
und
er a
Cre
ativ
e C
omm
ons
Attr
ibut
ion-
Non
Com
mer
cial
3.0
Unp
orte
d L
icen
ce.
View Article Online

360 | Mater. Adv., 2022, 3, 355–361 © 2022 The Author(s). Published by the Royal Society of Chemistry
Photo-redox catalytic studies
The photo-redox properties of carbon dots were studied byperforming photo-reduction experiments of methyl viologen toMV�+ radicals, using 410 nm and 455 nm LEDs (Holmarc Opto-Mechatronics Pvt. Ltd, Model-HO-HBL-3M). Briefly, 50 mg mL�1
of an aqueous solution of CDs were prepared in ethylenediamine tetracetic acid (EDTA, 0.1 M, pH 6) with the additionof MV2+ (1 mM). Then, B3 mL of the solution was irradiatedwith a visible light-emitting diode lamp (LED, wavelength =455 nm, irradiance of 33 mW cm�2 and wavelength = 410 nm,irradiance of 26 mW cm�2), after purging with argon gas for10 minutes. Furthermore, the generation of MV�+ radicalcations was monitored (for 60 min) by the emergence of anew peak around 605 nm (e = 13 700 M�1 cm�1) using aUV-visible spectrophotometer. The monochromatic nature ofLED light sources was supported by absorption spectra takenvia an absorption spectrometer (Avantes Starline, Avaspec-3648)(Fig. S13 and S14) (ESI†).
Author contributions
The manuscript was written through the contributions from allauthors. All authors have approved the final version of themanuscript.
Conflicts of interest
There are no conflicts to declare.
Acknowledgements
This work was supported by the SERB Start-up Grant (SRG/2019/001018) and CSIR-4M(FBR) grant. In addition, N. K.acknowledges the support from the DST-Inspire fellowship(DST/Inspire/03/2019/001918). Support from Dr KamleshKumar (CSIR-CSIO) is further acknowledged for providing the455 nm wavelength LED. We are also thankful to Dr SudiptaSarkar Pal (CSIR-CSIO) for recording the absorption spectraof LEDs.
Notes and references
1 X. Xu, R. Ray, Y. Gu, H. J. Ploehn, L. Gearheart, K. Raker andW. A. Scrivens, J. Am. Chem. Soc., 2004, 126, 12736–12737.
2 J. Jiang, G. Ye, Z. Wang, Y. Lu, J. Chen and K. Matyjaszewski,Angew. Chem., Int. Ed., 2018, 57, 12037–12042.
3 S. Cailotto, M. Negrato, S. Daniele, R. Luque, M. Selva,E. Amadio and A. Perosa, Green Chem., 2020, 22, 1145–1149.
4 B. C. M. Martindale, G. A. M. Hutton, C. A. Caputo, S. Prantl,R. Godin, J. R. Durrant and E. Reisner, Angew. Chem., Int.Ed., 2017, 56, 6459–6463.
5 X. Qie, M. Zan, P. Miao, L. Li, Z. Chang, M. Ge, P. Gui,Y. Tang and W.-F. Dong, J. Mater. Chem. B, 2018, 6,3549–3554.
6 Q. Zhu, L. Zhang, K. Van Vliet, A. Miserez and N. Holten-Andersen, ACS Appl. Mater. Interfaces, 2018, 10, 10409–10418.
7 F. F. Du, Z. H. Guo, Z. Cheng, M. Kremer, S. M. Shuang,Y. Liu and C. Dong, Nanoscale, 2020, 12, 20482–20490.
8 T. Guerrero-Esteban, C. Gutierrez-Sanchez, E. Martınez-Perinan, M. Revenga-Parra, F. Pariente and E. Lorenzo,Sens. Actuators, B, 2021, 330, 129389.
9 L. J. Zhang, Y. M. Yang, M. A. Ziaee, K. L. Lu and R. H. Wang,ACS Appl. Mater. Interfaces, 2018, 10, 9460–9467.
10 Z. T. Zhang, G. Y. Yi, P. Li, X. X. Zhang, H. Y. Fan,Y. L. Zhang, X. D. Wang and C. X. Zhang, Nanoscale, 2020,12, 13899–13906.
11 T.-N. Pham-Truong, C. Ranjan, H. Randriamahazaka andJ. Ghilane, Catal. Today, 2019, 335, 381–387.
12 D. H. Hasenohrl, A. Saha, V. Strauss, L. Wibmer, S. Klein,D. M. Guldi and A. Hirsch, J. Mater. Chem. B, 2017, 5,8591–8599.
13 F. H. Horst, C. V. D. Rodrigues, P. Carvalho, A. M. Leite,R. B. Azevedo, B. A. D. Neto, J. R. Correa, M. P. Garcia,S. Alotaibi, M. Henini, S. B. Chaves and M. O. Rodrigues,RSC Adv., 2021, 11, 6346–6352.
14 B. B. Karakocak, A. Laradji, T. Primeau, M. Y. Berezin,S. Q. Li and N. Ravi, ACS Appl. Mater. Interfaces, 2021, 13,277–286.
15 Y.-Y. Chen, W.-P. Jiang, H.-L. Chen, H.-C. Huang,G.-J. Huang, H.-M. Chiang, C.-C. Chang, C.-L. Huang andT.-Y. Juang, RSC Adv., 2021, 11, 16661–16674.
16 J. Schneider, C. J. Reckmeier, Y. Xiong, M. von Seckendorff,A. S. Susha, P. Kasak and A. L. Rogach, J. Phys. Chem. C,2017, 121, 2014–2022.
17 W. Kasprzyk, T. Swiergosz, S. Bednarz, K. Walas,N. V. Bashmakova and D. Bogdał, Nanoscale, 2018, 10,13889–13894.
18 V. Strauss, H. Wang, S. Delacroix, M. Ledendecker andP. Wessig, Chem. Sci., 2020, 11, 8256–8266.
19 N. M. Zholobak, A. L. Popov, A. B. Shcherbakov, N. R. Popova,M. M. Guzyk, V. P. Antonovich, A. V. Yegorova, Y. V. Scrypynets,I. I. Leonenko, A. Y. Baranchikov and V. K. Ivanov, BeilsteinJ. Nanotechnol., 2016, 7, 1905–1917.
20 S. Gu, C.-T. Hsieh, Y. Ashraf Gandomi, J.-K. Chang, J. Li,J. Li, H. Zhang, Q. Guo, K. C. Lau and R. Pandey, J. Mater.Chem. C, 2019, 7, 5468–5476.
21 D. Qu, M. Zheng, P. Du, Y. Zhou, L. Zhang, D. Li, H.Tan, Z. Zhao, Z. Xie and Z. Sun, Nanoscale, 2013, 5,12272–12277.
22 S. Cailotto, R. Mazzaro, F. Enrichi, A. Vomiero, M. Selva,E. Cattaruzza, D. Cristofori, E. Amadio and A. Perosa, ACSAppl. Mater. Interfaces, 2018, 10, 40560–40567.
23 F. Rigodanza, L. Ðord-evic, F. Arcudi and M. Prato, Angew.Chem., Int. Ed., 2018, 57, 5062–5067.
24 Y. Dong, H. Pang, H. B. Yang, C. Guo, J. Shao, Y. Chi,C. M. Li and T. Yu, Angew. Chem., 2013, 52, 7800–7804.
25 T. Liu, Z.-W. Cui, J. Zhou, Y. Wang and Z.-G. Zou, NanoscaleRes. Lett., 2017, 12, 375.
26 S. Gu, C.-T. Hsieh, Y. Ashraf Gandomi, J. Li, X. X. Yue andJ.-K. Chang, Nanoscale, 2019, 11, 16553–16561.
Paper Materials Advances
Ope
n A
cces
s A
rtic
le. P
ublis
hed
on 1
8 O
ctob
er 2
021.
Dow
nloa
ded
on 2
/22/
2022
11:
28:0
4 PM
. T
his
artic
le is
lice
nsed
und
er a
Cre
ativ
e C
omm
ons
Attr
ibut
ion-
Non
Com
mer
cial
3.0
Unp
orte
d L
icen
ce.
View Article Online
© 2022 The Author(s). Published by the Royal Society of Chemistry Mater. Adv., 2022, 3, 355–361 | 361
27 J. D. Stachowska, A. Murphy, C. Mellor, D. Fernandes,E. N. Gibbons, M. J. Krysmann, A. Kelarakis, E. Burgaz,J. Moore and S. G. Yeates, Sci. Rep., 2021, 11, 10554.
28 M. Righetto, A. Privitera, I. Fortunati, D. Mosconi,M. Zerbetto, M. L. Curri, M. Corricelli, A. Moretto,S. Agnoli, L. Franco, R. Bozio and C. Ferrante, J. Phys. Chem.Lett., 2017, 8, 2236–2242.
29 K. J. Mintz, Y. Zhou and R. M. Leblanc, Nanoscale, 2019, 11,4634–4652.
30 H. Li, X. He, Z. Kang, H. Huang, Y. Liu, J. Liu, S. Lian, C. H. A.Tsang, X. Yang and S.-T. Lee, Angew. Chem., 2010, 49, 4430–4434.
31 Z. S. Schroer, Y. Wu, Y. Xing, X. Wu, X. Liu, X. Wang,O. G. Pino, C. Zhou, C. Combs, Q. Pu, M. Wu, J. X. Zhao andJ. Chen, ACS Appl. Nano Mater., 2019, 2, 6858–6865.
32 M. Meng, H. Yan, Y. Jiao, A. Wu, X. Zhang, R. Wang andC. Tian, RSC Adv., 2016, 6, 29303–29307.
33 Y.-C. Lu, J. Chen, A.-J. Wang, N. Bao, J.-J. Feng, W. Wang andL. Shao, J. Mater. Chem. C, 2015, 3, 73–78.
34 Z. Qian, J. Ma, X. Shan, H. Feng, L. Shao and J. Chen, Chem.– Eur. J., 2014, 20, 2254–2263.
35 T. Kondo, S. Casolo, T. Suzuki, T. Shikano, M. Sakurai,Y. Harada, M. Saito, M. Oshima, M. I. Trioni,G. F. Tantardini and J. Nakamura, Phys. Rev. B: Condens.Matter Mater. Phys., 2012, 86, 035436.
36 C. Shen, S. Ge, Y. Pang, F. Xi, J. Liu, X. Dong and P. Chen,J. Mater. Chem. B, 2017, 5, 6593–6600.
37 F. Zhao, Q. Li, K. Han and T. Lian, J. Phys. Chem. C, 2018,122, 17136–17142.
38 A. Saha, A. Moya, A. Kahnt, D. Iglesias, S. Marchesan,R. Wannemacher, M. Prato, J. J. Vilatela and D. M. Guldi,Nanoscale, 2017, 9, 7911–7921.
39 G. T. Brown and J. R. Darwent, J. Chem. Soc., Faraday Trans.,1984, 80, 1631–1643.
40 V. Strauss, J. T. Margraf, C. Dolle, B. Butz, T. J.Nacken, J. Walter, W. Bauer, W. Peukert, E. Spiecker,T. Clark and D. M. Guldi, J. Am. Chem. Soc., 2014, 136,17308–17316.
41 S. Mondal, A. Yucknovsky, K. Akulov, N. Ghorai,T. Schwartz, H. N. Ghosh and N. Amdursky, J. Am. Chem.Soc., 2019, 141, 15413–15422.
Materials Advances Paper
Ope
n A
cces
s A
rtic
le. P
ublis
hed
on 1
8 O
ctob
er 2
021.
Dow
nloa
ded
on 2
/22/
2022
11:
28:0
4 PM
. T
his
artic
le is
lice
nsed
und
er a
Cre
ativ
e C
omm
ons
Attr
ibut
ion-
Non
Com
mer
cial
3.0
Unp
orte
d L
icen
ce.
View Article Online