vision and visual perception chapter 10 · vision and visual perception chapter 10 ... 14. color...
TRANSCRIPT

Vision and Visual PerceptionChapter 10Light and the Visual ApparatusColor VisionForm VisionThe Perception of Objects, Color, and Movement
*G
arre
tt: B
rain
& B
ehav
ior 4
e
1

Light and the Visual ApparatusThe Visible SpectrumFigure 10.1: The Electromagnetic Spectrum
• Electromagnetic Spectrum• Includes a variety of energy forms.
• Visible light (adequate stimulus for vision) only 1/70th of spectrum• Light is described by its wavelength, which we associate with color
• Visible light ranges from about 300 nm to 800 nm.
*
2

Focusing begins at the Cornea, and is completed by the Lens.
Light and the Visual ApparatusThe Eye and Its ReceptorsFigure 10.2: The Human Eye
*G
arre
tt: B
rain
& B
ehav
ior 4
e
3
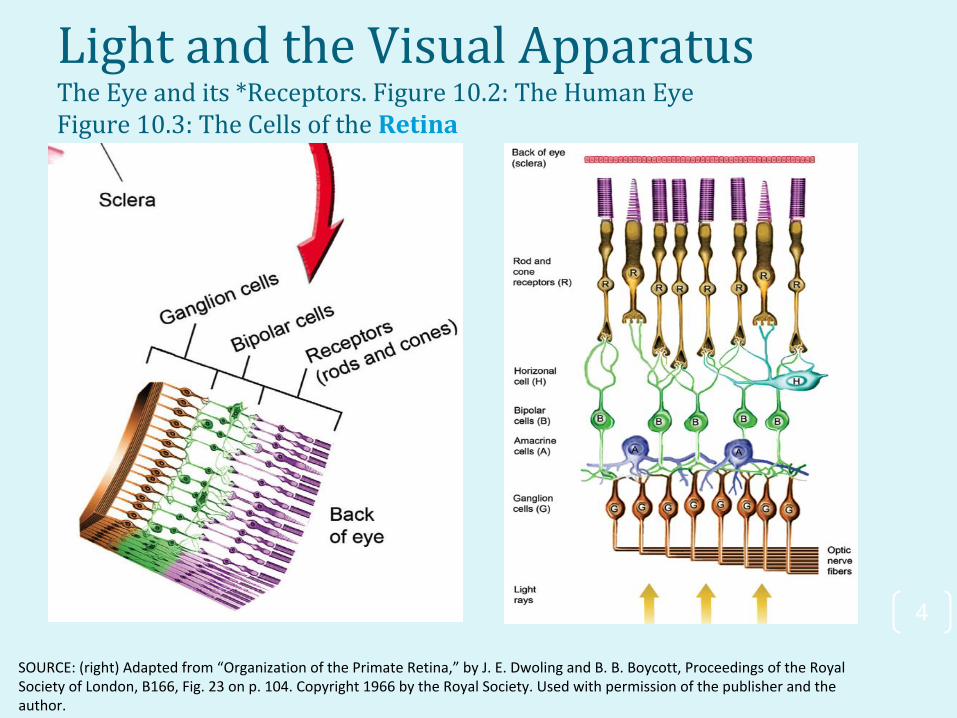
Light and the Visual ApparatusThe Eye and its *Receptors. Figure 10.2: The Human EyeFigure 10.3: The Cells of the Retina
SOURCE: (right) Adapted from “Organization of the Primate Retina,” by J. E. Dwoling and B. B. Boycott, Proceedings of the Royal Society of London, B166, Fig. 23 on p. 104. Copyright 1966 by the Royal Society. Used with permission of the publisher and the author.
*G
arre
tt: B
rain
& B
ehav
ior 4
e
4

Light and the Visual ApparatusThe Eye and its *Receptors. Table 10.1: Summary of the Characteristics of the Rod and Cone Systems.
Rod System Cone System
Photopigment • Rhodopsin • Iodopsin
Function
• Functions best in dim light, poorly or not at all in bright light.
• Detail vision is poor.• Does not distinguish colors.
• Functions best in bright light, poorly or not at all in dim light.
• Detail vision is good.• Can distinguish among colors
thanks to 3 different types, each with one type of photopigment.
Location• Mostly in periphery of retina • Mostly in *fovea and
surrounding area
Receptive Field
• Large, due to convergence on ganglion cells;
• contributes to light sensitivity.
• Small, with one or a few cones converging on a single ganglion cell;
• contributes to detail vision.
*G
arre
tt: B
rain
& B
ehav
ior 4
e
5
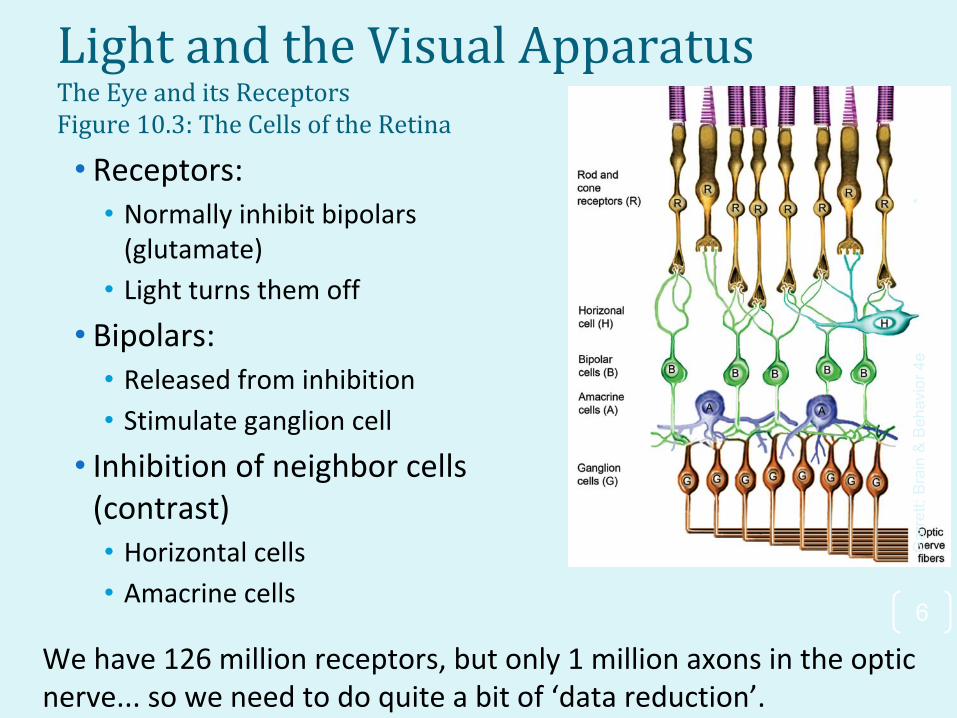
Light and the Visual ApparatusThe Eye and its ReceptorsFigure 10.3: The Cells of the Retina
*G
arre
tt: B
rain
& B
ehav
ior 4
e
6
We have 126 million receptors, but only 1 million axons in the optic nerve... so we need to do quite a bit of ‘data reduction’.
• Receptors:• Normally inhibit bipolars
(glutamate)
• Light turns them off
• Bipolars:• Released from inhibition
• Stimulate ganglion cell
• Inhibition of neighbor cells (contrast)• Horizontal cells
• Amacrine cells
Light and the Visual ApparatusThe Eye and its Receptors
• The area of the retina from which a ganglion cell (or any other cell in the visual system) receives its input is the cell’s receptive field.
• Receptive fields of cones are small.• Few cones are attached to each ganglion cell; in fovea, each
cone has its own ganglion cell.
• As a result, visual acuity—the ability to distinguish details—is greatest in the fovea, and decrease toward the periphery.
• Receptive fields of rods are larger.• Many rods share each ganglion cell, enhancing sensitivity to
light but reduced visual acuity
• More numerous in the periphery, absent in the fovea.
*G
arre
tt: B
rain
& B
ehav
ior 4
e
7
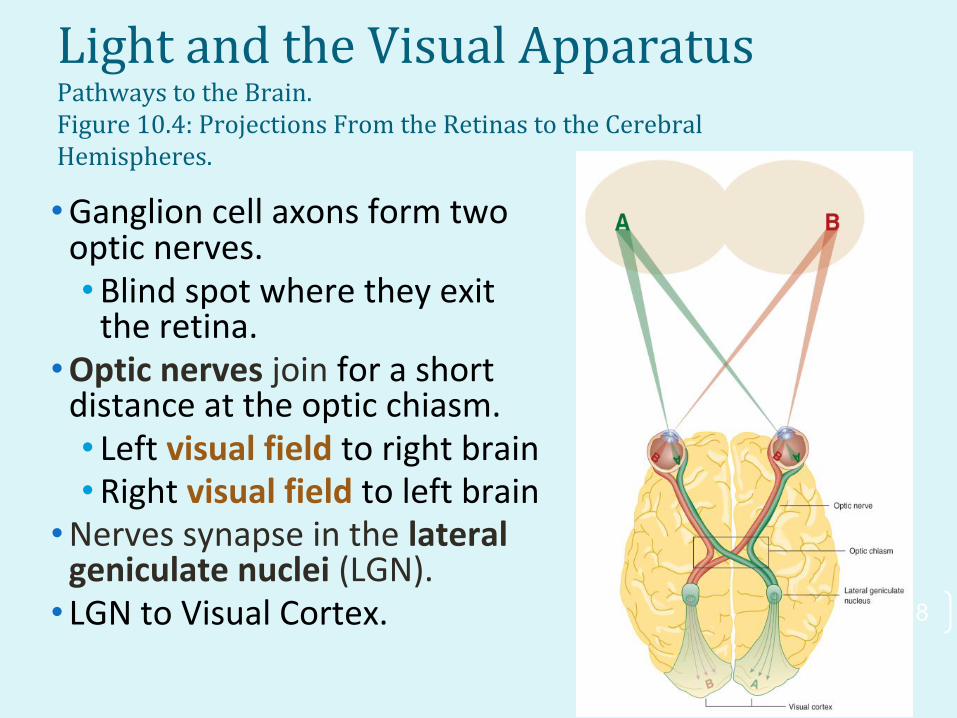
Light and the Visual ApparatusPathways to the Brain. Figure 10.4: Projections From the Retinas to the Cerebral Hemispheres.
• Ganglion cell axons form two optic nerves.• Blind spot where they exit
the retina.• Optic nerves join for a short
distance at the optic chiasm.• Left visual field to right brain• Right visual field to left brain
• Nerves synapse in the lateral geniculate nuclei (LGN).
• LGN to Visual Cortex.
*G
arre
tt: B
rain
& B
ehav
ior 4
e
8

Light and the Visual ApparatusPathways to the BrainFigure 10.5: Retinal Disparity
• The separation between eyes produces retinal disparity.• Distant objects toward
the nasal side (B).• Closer objects toward
the temporal retina (C).• Provides information on
object’s distance
• Anterior Parietal: shape, location, and distance > 3D location of objects
*G
arre
tt: B
rain
& B
ehav
ior 4
e
9

Light and the Visual ApparatusApplication: Restoring Lost Vision
• Blindness• Often due to visual
receptor deterioration, but neural structures remain intact.
• Sight could be restored by replacing the receptors with an artificial retina.
• Alpha IMS (right)
*G
arre
tt: B
rain
& B
ehav
ior 4
e
10
SOURCE: This figure was adapted from two images at the manufacturer’s (Second Sight) website: http://2-sight.eu/en/system-overview-en

Color VisionTrichromatic Theory. Figure 10.6 Independence of Wavelength and Color
• Trichromatic Theory (Young-Helmholtz)• The primary colors in this theory are red, green, and blue.
• Observers cannot resolve these colors into separate components.
• TV and computer screens use this “RGB” processing
*G
arre
tt: B
rain
& B
ehav
ior 4
e
11
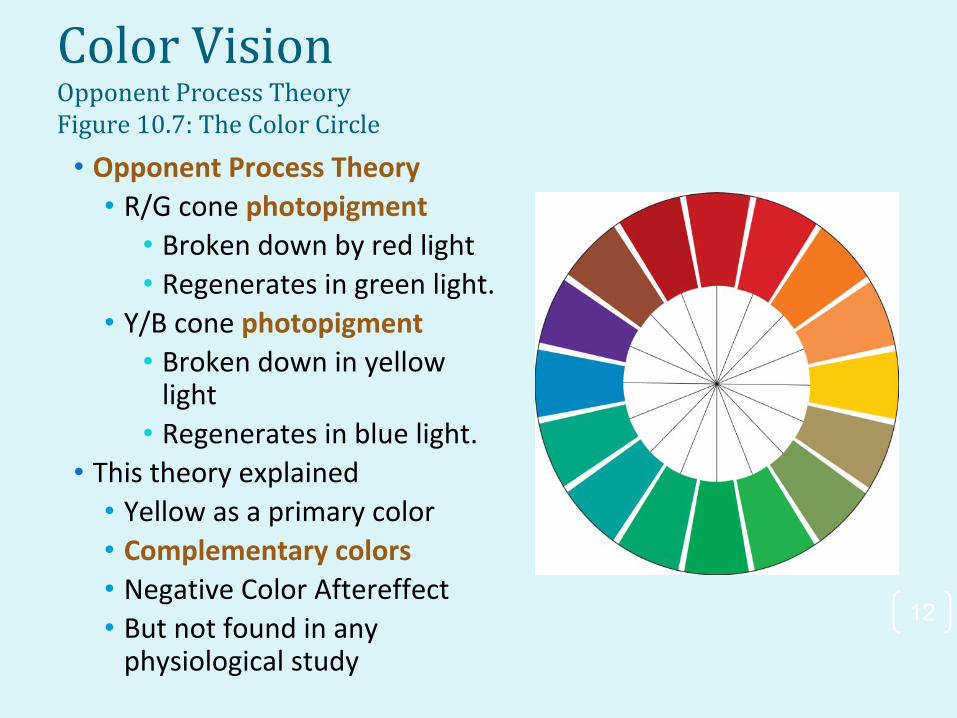
Color VisionOpponent Process TheoryFigure 10.7: The Color Circle
• Opponent Process Theory• R/G cone photopigment
• Broken down by red light • Regenerates in green light.
• Y/B cone photopigment• Broken down in yellow
light• Regenerates in blue light.
• This theory explained • Yellow as a primary color• Complementary colors• Negative Color Aftereffect• But not found in any
physiological study
*G
arre
tt: B
rain
& B
ehav
ior 4
e
12

Color VisionOpponent Process TheoryFigure 10.8: Complementary Colors and Negative Color Aftereffect
*G
arre
tt: B
rain
& B
ehav
ior 4
e
13
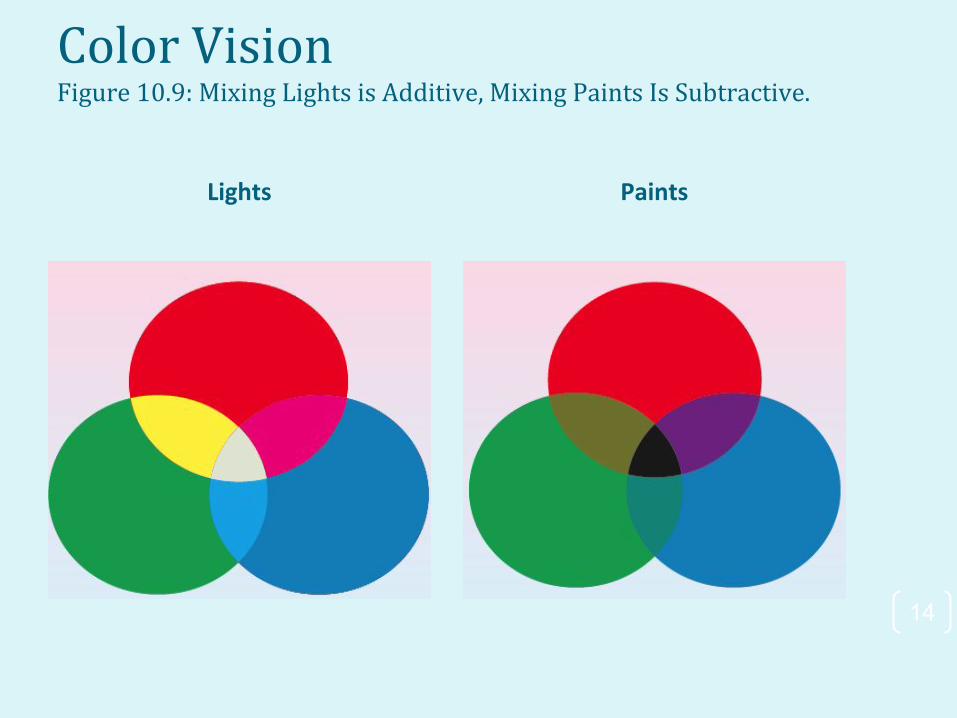
Color VisionFigure 10.9: Mixing Lights is Additive, Mixing Paints Is Subtractive.
Lights Paints *G
arre
tt: B
rain
& B
ehav
ior 4
e
14

Color VisionFigure 10.10: Hurvich & Jameson’s Proposed Interconnections of Cones Provide Four Color Responses & Complimentary Colors
• Combined trichromatic theory and opponent process theory:
• Three receptors (Tri in Trichromatic) like pixels in TVs.• Red• Green• Blue
• Three ganglion types explains why we see yellow as a primary.• Yellow/Blue• Red/Green• Black/White (not shown)
*G
arre
tt: B
rain
& B
ehav
ior 4
e
15

Color VisionA Combined Theory
16
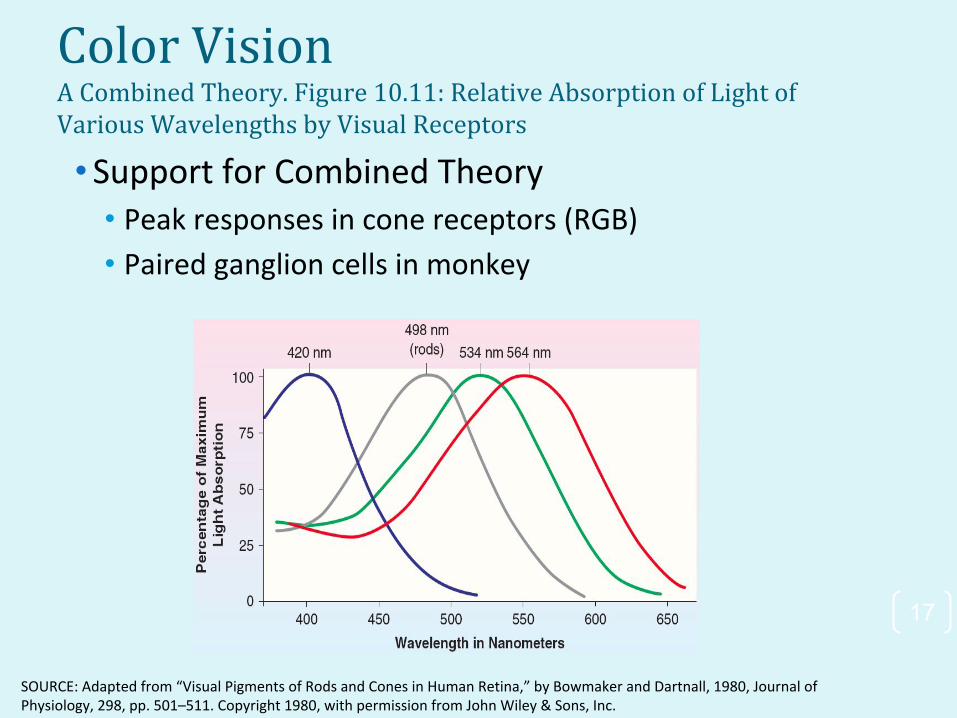
Color VisionA Combined Theory. Figure 10.11: Relative Absorption of Light of Various Wavelengths by Visual Receptors
• Support for Combined Theory• Peak responses in cone receptors (RGB)
• Paired ganglion cells in monkey
*G
arre
tt: B
rain
& B
ehav
ior 4
e
17
SOURCE: Adapted from “Visual Pigments of Rods and Cones in Human Retina,” by Bowmaker and Dartnall, 1980, Journal of Physiology, 298, pp. 501–511. Copyright 1980, with permission from John Wiley & Sons, Inc.
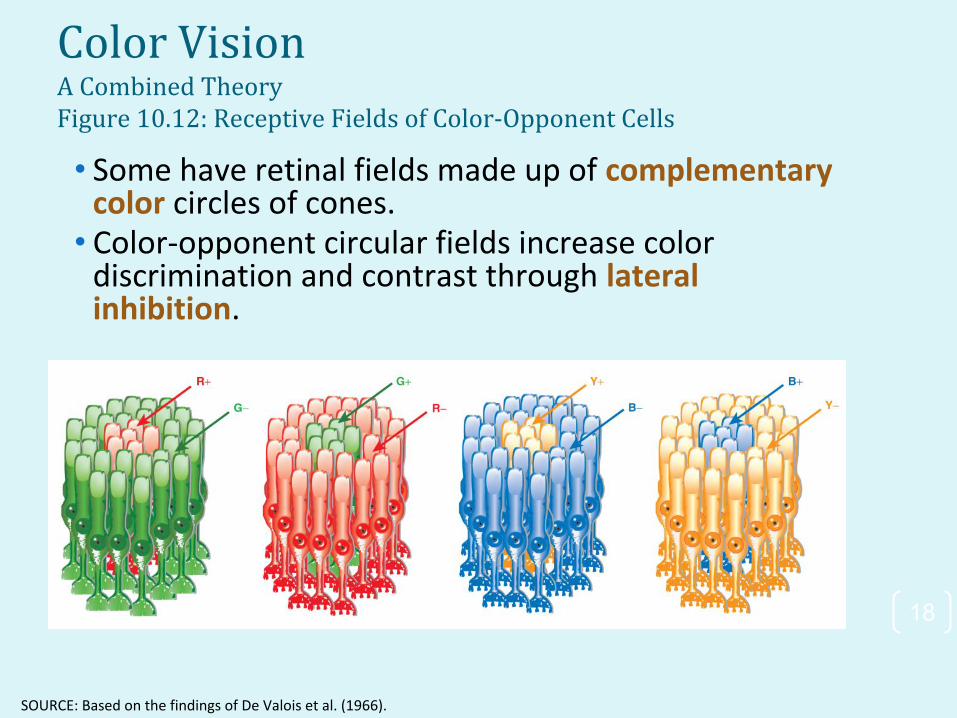
Color VisionA Combined TheoryFigure 10.12: Receptive Fields of Color-Opponent Cells
• Some have retinal fields made up of complementary color circles of cones.
• Color-opponent circular fields increase color discrimination and contrast through lateral inhibition.
*G
arre
tt: B
rain
& B
ehav
ior 4
e
18
SOURCE: Based on the findings of De Valois et al. (1966).
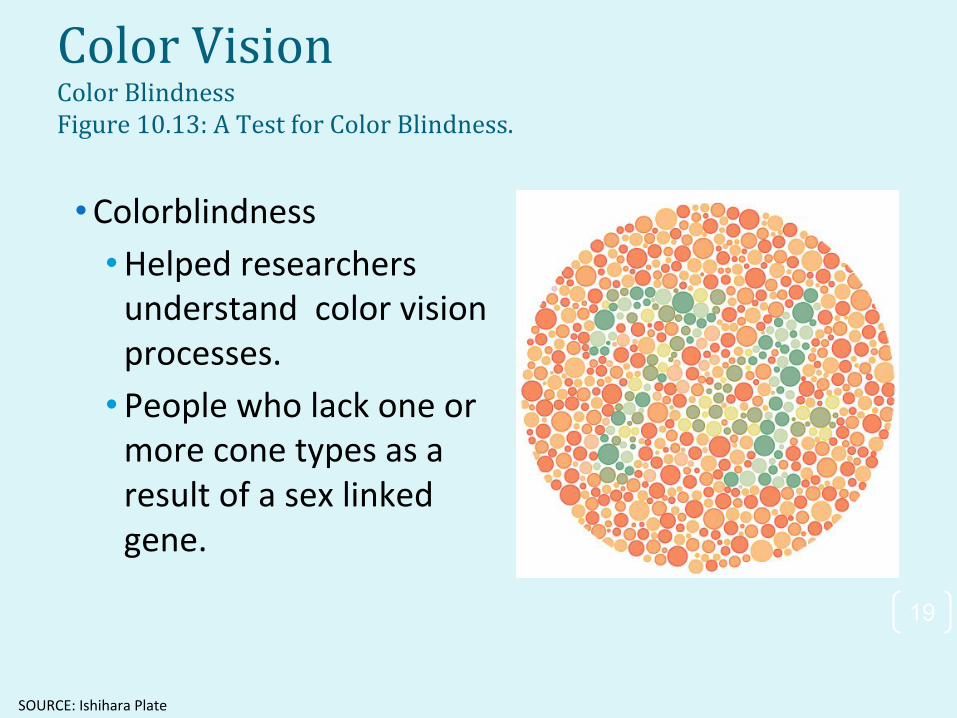
Color VisionColor BlindnessFigure 10.13: A Test for Color Blindness.
• Colorblindness
• Helped researchers understand color vision processes.
• People who lack one or more cone types as a result of a sex linked gene.
*G
arre
tt: B
rain
& B
ehav
ior 4
e
19
SOURCE: Ishihara Plate
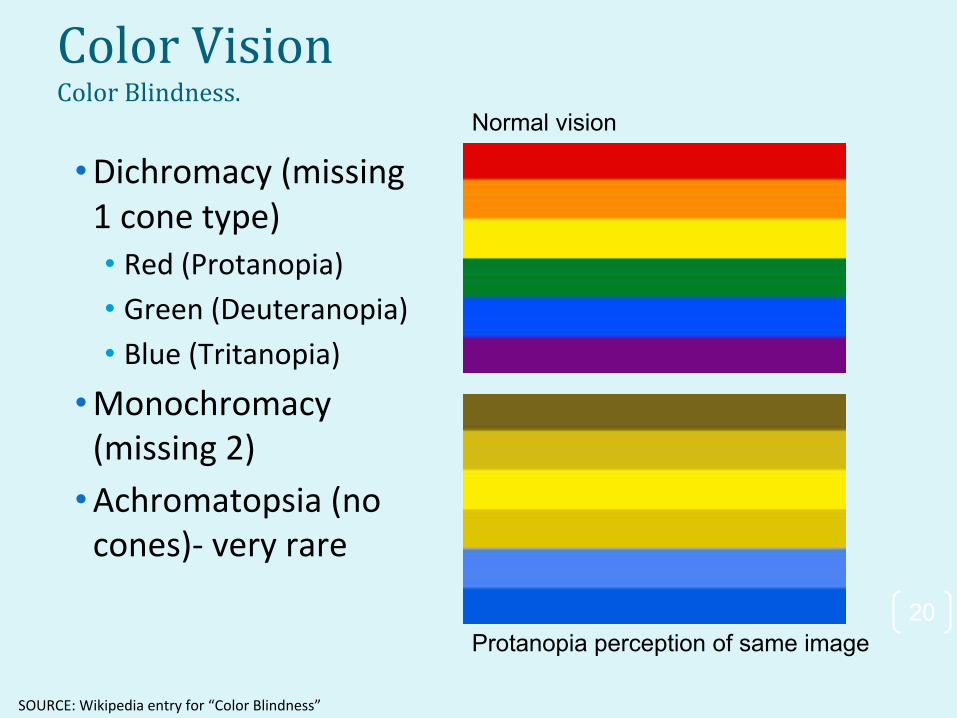
Color VisionColor Blindness.
• Dichromacy (missing 1 cone type)• Red (Protanopia)
• Green (Deuteranopia)
• Blue (Tritanopia)
• Monochromacy (missing 2)
• Achromatopsia (no cones)- very rare
*G
arre
tt: B
rain
& B
ehav
ior 4
e
20
SOURCE: Wikipedia entry for “Color Blindness”
Normal vision
Protanopia perception of same image
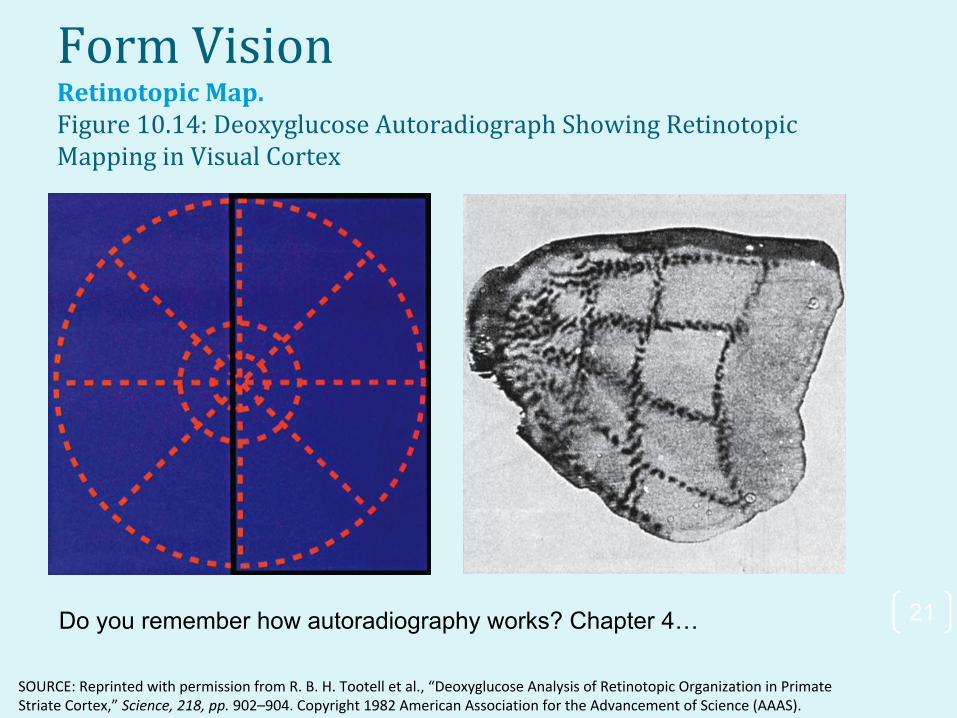
Form VisionRetinotopic Map. Figure 10.14: Deoxyglucose Autoradiograph Showing Retinotopic Mapping in Visual Cortex
Gar
rett:
Bra
in &
Beh
avio
r 4e
21
SOURCE: Reprinted with permission from R. B. H. Tootell et al., “Deoxyglucose Analysis of Retinotopic Organization in Primate Striate Cortex,” Science, 218, pp. 902–904. Copyright 1982 American Association for the Advancement of Science (AAAS).
Do you remember how autoradiography works? Chapter 4…
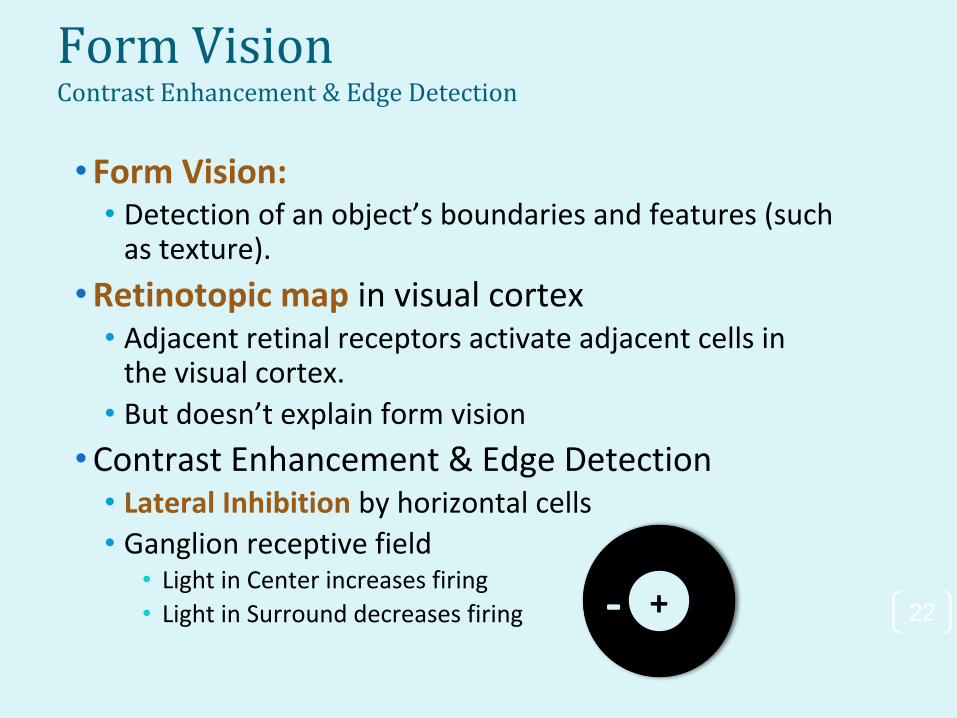
Form VisionContrast Enhancement & Edge Detection
• Form Vision:• Detection of an object’s boundaries and features (such
as texture).
• Retinotopic map in visual cortex• Adjacent retinal receptors activate adjacent cells in
the visual cortex. • But doesn’t explain form vision
• Contrast Enhancement & Edge Detection• Lateral Inhibition by horizontal cells• Ganglion receptive field
• Light in Center increases firing• Light in Surround decreases firing
*G
arre
tt: B
rain
& B
ehav
ior 4
e
22- +
23
Gar
rett:
Bra
in &
Beh
avio
r 4e
*
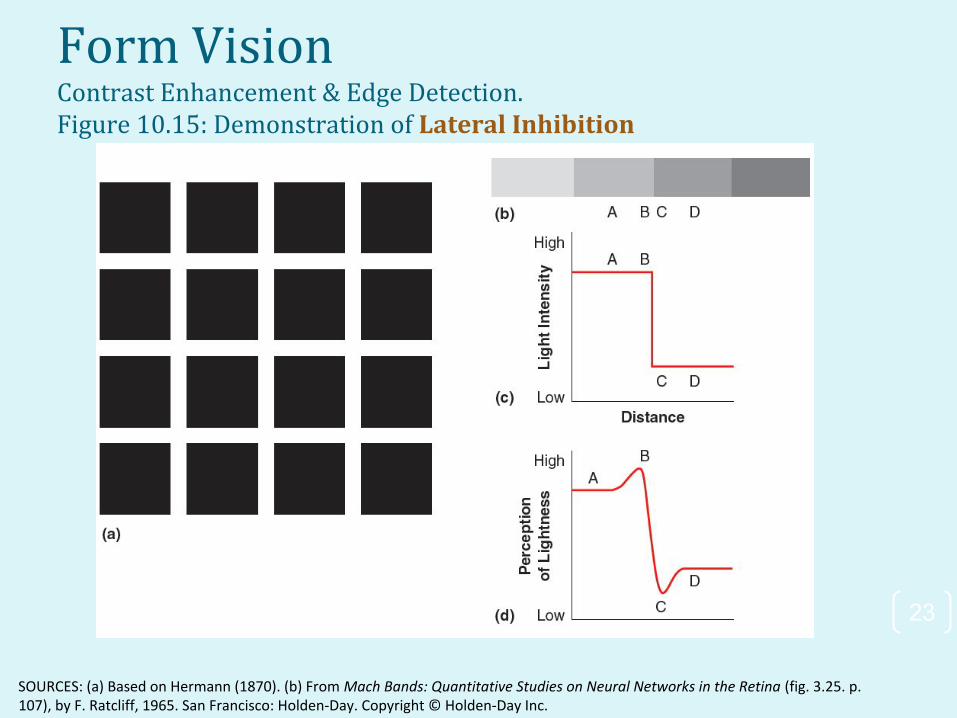
SOURCES: (a) Based on Hermann (1870). (b) From Mach Bands: Quantitative Studies on Neural Networks in the Retina (fig. 3.25. p. 107), by F. Ratcliff, 1965. San Francisco: Holden-Day. Copyright © Holden-Day Inc.
Form VisionContrast Enhancement & Edge Detection. Figure 10.15: Demonstration of Lateral Inhibition
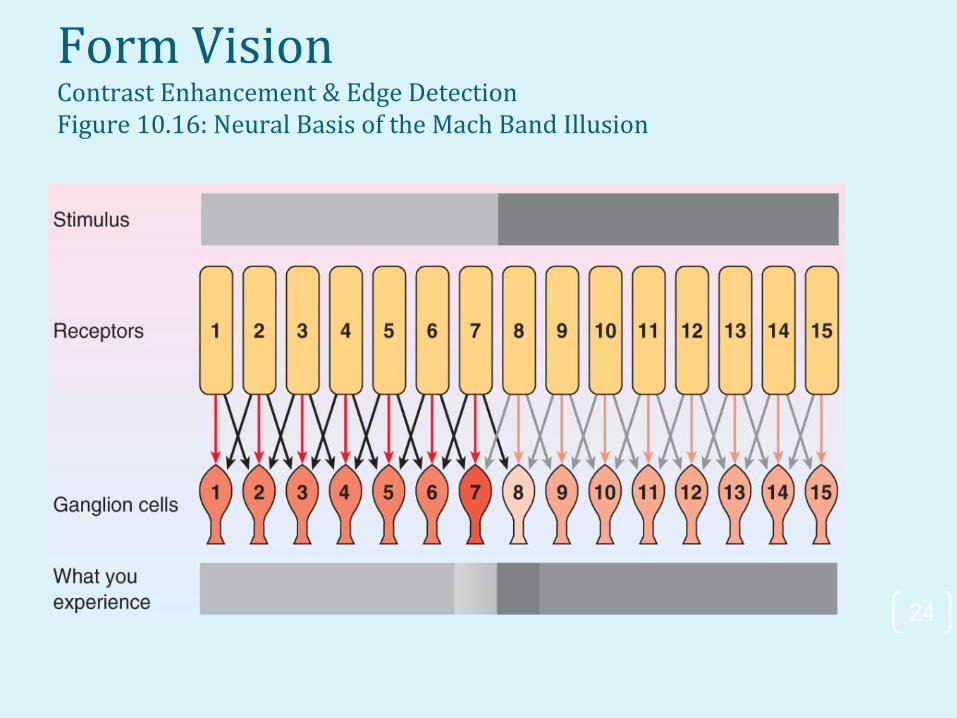
Form VisionContrast Enhancement & Edge DetectionFigure 10.16: Neural Basis of the Mach Band Illusion
*G
arre
tt: B
rain
& B
ehav
ior 4
e
24
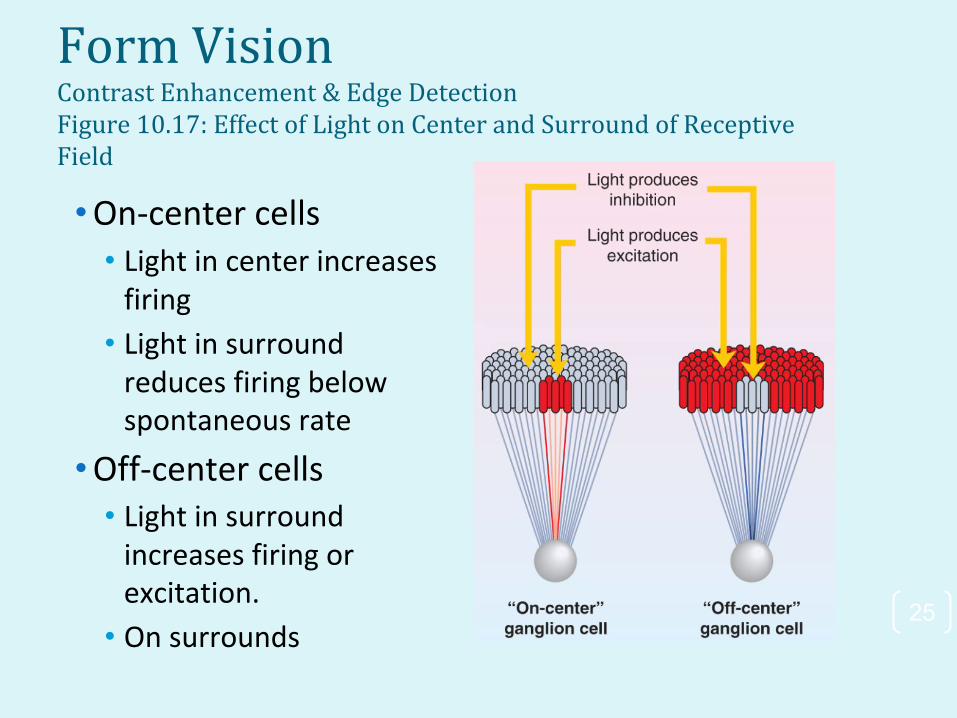
Form VisionContrast Enhancement & Edge DetectionFigure 10.17: Effect of Light on Center and Surround of Receptive Field
• On-center cells• Light in center increases
firing
• Light in surround reduces firing below spontaneous rate
• Off-center cells • Light in surround
increases firing or excitation.
• On surrounds
*G
arre
tt: B
rain
& B
ehav
ior 4
e
25
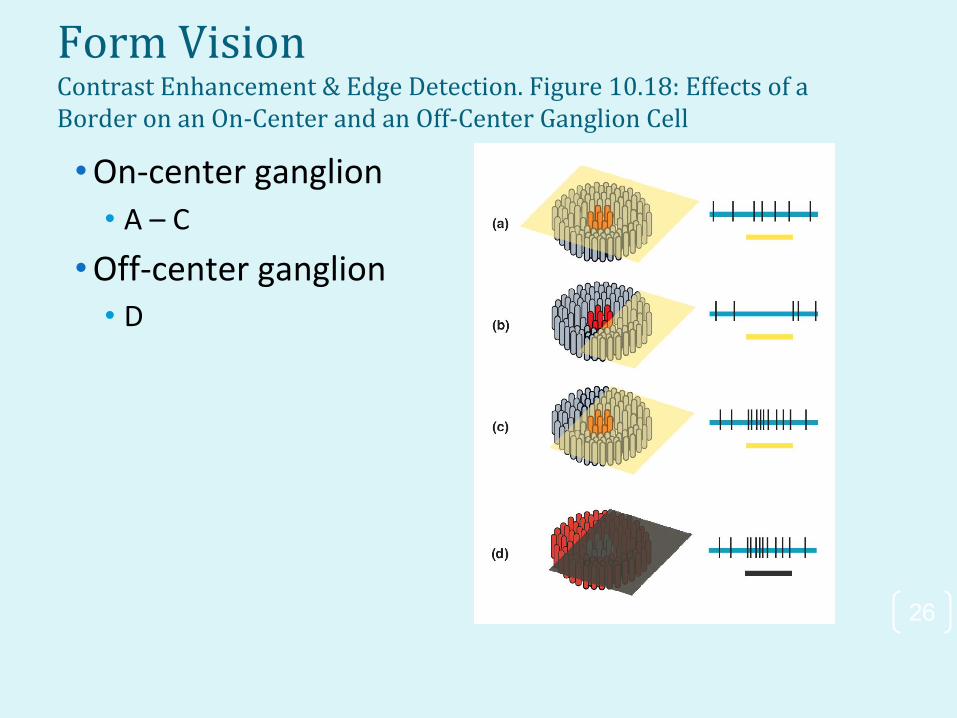
Form VisionContrast Enhancement & Edge Detection. Figure 10.18: Effects of a Border on an On-Center and an Off-Center Ganglion Cell
Gar
rett:
Bra
in &
Beh
avio
r 4e
26
• On-center ganglion• A – C
• Off-center ganglion• D

Form VisionFIGURE 10.19 Responses to Lines at Different Orientations in a *Simple Cell Specialized for Vertical Lines.
Gar
rett:
Bra
in &
Beh
avio
r 4e
27
SOURCE: From “Receptive Fields of Single Neurons in the Cat’s Striate Cortex,” by D. H. Hubel and T. N. Wiesel, 1959, Journal of Physiology, 148, pp. 574–591, Fig 3. © 1959 by The Physiology Society. Reprinted by permission.
• Response greatest when line closest to preferred vertical orientation (middle and bottom)

Form VisionHubel and Wiesel’s TheoryFigure 10.20: Hubel and Wiesel’s Explanation for Responses of Simple Cells
• Simple cells of Visual Cortex
• Input: ganglion cells with linear overlap of receptive fields
• Respond to line or edge at a specific
• Orientation
• Place on the retina.
*G
arre
tt: B
rain
& B
ehav
ior 4
e
28
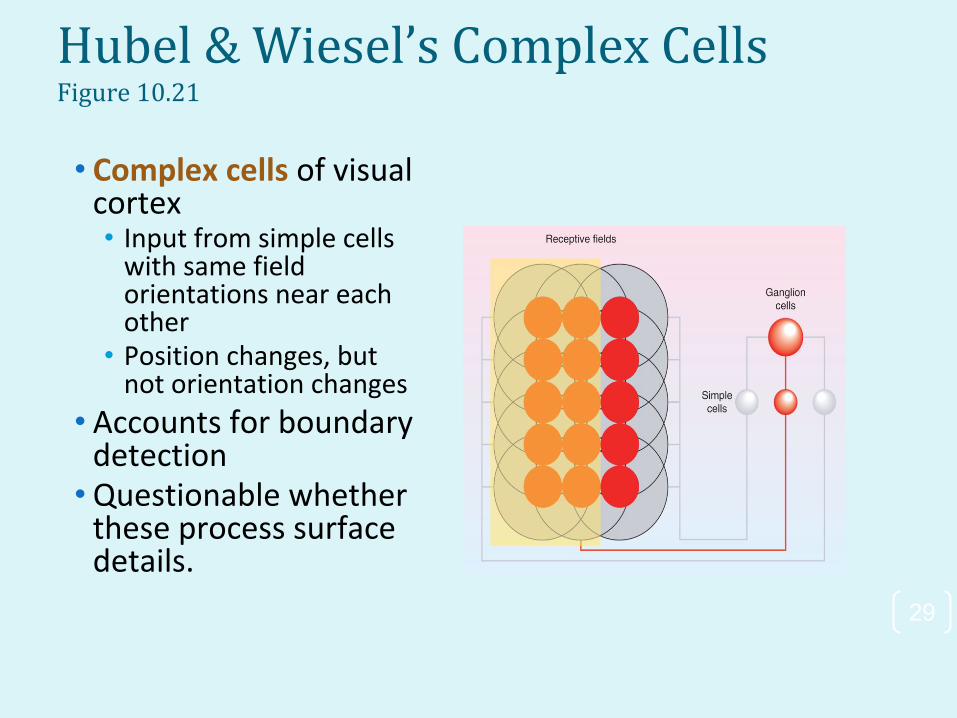
Hubel & Wiesel’s Complex CellsFigure 10.21
• Complex cells of visual cortex• Input from simple cells
with same field orientations near each other
• Position changes, but not orientation changes
• Accounts for boundary detection
• Questionable whether these process surface details.
*G
arre
tt: B
rain
& B
ehav
ior 4
e
29

Form Vision See Figure 10.22: Illustration of High and Low Frequencies in a
Visual Scene
• Spatial Frequency Theory
• Cortical cells perform Fourier analysis on luminosity
• Different cells have a variety of sensitivities
• Can detect edges AND gradations of change.
*G
arre
tt: B
rain
& B
ehav
ior 4
e
30
SOURCES: (a and b) Reprinted with permission from L. D. Harmon and B. Julesz, “Masking in Visual Recognition: Effects of Two-Dimensional Filtered Noise,” Science, 180, pp. 1194–1197. Copyright 1973 American Association for the Advancement of Science (AAAS). (c) Gala Contemplating the Mediterranean Sea Which at Twenty Meters Becomes the Portrait of Abraham Lincoln-Homage to Rothko (Second version). 1976. Oil on canvas. 75.5 x 99.25 inches. © 2010 Salvador Dalí, Gala-Salvador Dalí Foundation/Artists Rights Society (ARS), New York.

Form VisionFigure 10.23: The Role of High and Low Frequencies in Vision
• High frequency transitions are not very meaningful. • Gradual transitions (low frequencies) are more
recognizable.• Researchers have found cortical cells that respond to light-dark
“gratings” containing a specific combination of frequencies.
*G
arre
tt: B
rain
& B
ehav
ior 4
e
31
Original Low Frequencies High FrequenciesPicture Removed Removed
Perception of Objects, Color, & Movement• Modular processing
• segregation of the brain functions into separate locations (area specific specialization)
• Hierarchical processing
• information is processed by ascending through increasingly complex levels of the nervous system
• Distributed processing
• Processing occurs across a wide area of the brain.
• Another view is that, like language, vision is a mix of modular and distributed processing.
*G
arre
tt: B
rain
& B
ehav
ior 4
e
32

Perception of Objects, Color, & MovementTwo Pathways of Visual Analysis
• Parvocellular system
• Parvocellular ganglion cells located in the fovea.
• Small, color-opponent circular receptive fields
• Discrimination of fine detail and color (Visual Acuity)
• Magnocellular system• Ganglion cells in the periphery
• Large, brightness-opponent receptive fields
• Fast on, fast off
• Brightness contrast and movement
*G
arre
tt: B
rain
& B
ehav
ior 4
e
33
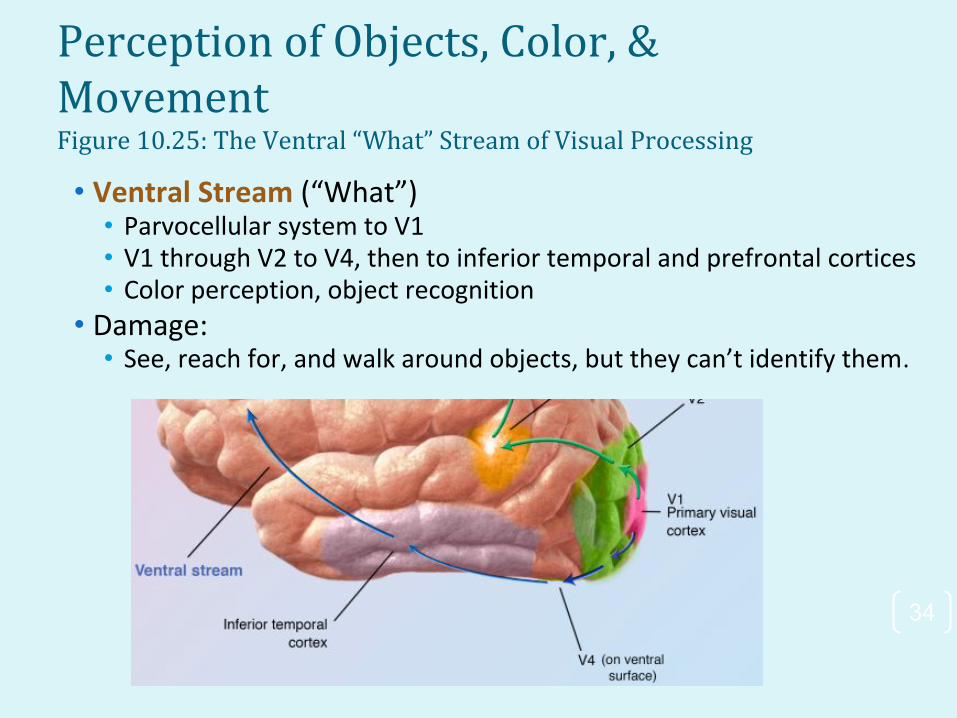
Perception of Objects, Color, & MovementFigure 10.25: The Ventral “What” Stream of Visual Processing
• Ventral Stream (“What”)• Parvocellular system to V1• V1 through V2 to V4, then to inferior temporal and prefrontal cortices• Color perception, object recognition
• Damage:• See, reach for, and walk around objects, but they can’t identify them.
*G
arre
tt: B
rain
& B
ehav
ior 4
e
34

Perception of Objects, Color, & MovementFigure 10.25: The Dorsal “Where” Stream of Visual Processing
• Dorsal stream (“Where”)• Magnocellular system to V1• V1 to V5/MT and MST, then to posterior parietal and prefrontal
cortices• Movement and location of objects in space
• Damage• Identify, but trouble looking at, reaching for, grasping objects using
vision
*G
arre
tt: B
rain
& B
ehav
ior 4
e
35
Perception of Objects, Color, & Movement
• Both systems then meet in the prefrontal cortex.• Manages information in memory while it is being used.
• For example, it integrates information about the body and about objects while planning movements.
*G
arre
tt: B
rain
& B
ehav
ior 4
e
36

Disorders of Visual PerceptionFigure 10.25: The Ventral “What” and Dorsal “Where” Streams of Visual Processing
• Inferior Temporal Area• Cells specific for geometric figures, houses, faces, hands,
words…• Likely receives input from cells with narrower sensitivities.
• Capabilities may be “hardwired,” but learning is required
*G
arre
tt: B
rain
& B
ehav
ior 4
e
37

Disorders of Visual PerceptionFigure 10.26: Stimuli Used to Produce Responses in “Hand-” and “Face-” Sensitive Cells in Monkeys.
• Cells in IT cortex of macaque• Hand-like shapes better than other shapes (top)
• Also have face-sensitive cells (bottom)
*G
arre
tt: B
rain
& B
ehav
ior 4
e
38
SOURCES: (a) From “Visual Properties of Neurons in Inferotemporal Cortex of the Macaque,” by C. G. Gross et al., 1972, Journal of Neurophysiology, 35. Reprinted with permission. (b) From “Stimulus-Selective Properties of Inferior Temporal Neurons in the Macaque,” by R. Desimone et al., Journal of Neuroscience, 4, pp. 2057 Copyright © 1984 Society for Neuroscience. Reprinted with permission.

Disorders of Visual PerceptionFigure 10.26b: Stimuli Used to Produce Responses in “Hand-” and “Face-” Sensitive Cells in Monkeys.
• Object Agnosia• IT Cortex damage
• Cannot identify objects
*G
arre
tt: B
rain
& B
ehav
ior 4
e
39
SOURCE: (b) From “Stimulus-Selective Properties of Inferior Temporal Neurons in the Macaque,” by R. Desimone et al., Journal of Neuroscience, 4, pp. 2057 Copyright © 1984 Society for Neuroscience. Reprinted with permission.

Disorders of Visual PerceptionFigure 10.27: Location of Brain Damage in Patients With Prosopagnosia
• Prosopagnosia- inability to recognize familiar faces.• Fusiform Face Area (FFA, of
IT cortex), R side• Genetic link to deficits in
frontal & temporal lobes in small number of cases
• Greeble Study• FFA responsible for non-
human face recognition
*G
arre
tt: B
rain
& B
ehav
ior 4
e
40
SOURCE: From “Behavioral Deficits and Cortical Damage Loci in Cerebral Achromatopsia,” by S. E. Bouvier and S. A. Engel, 2006, Cerebral Cortex, 16, pp. 183–191.
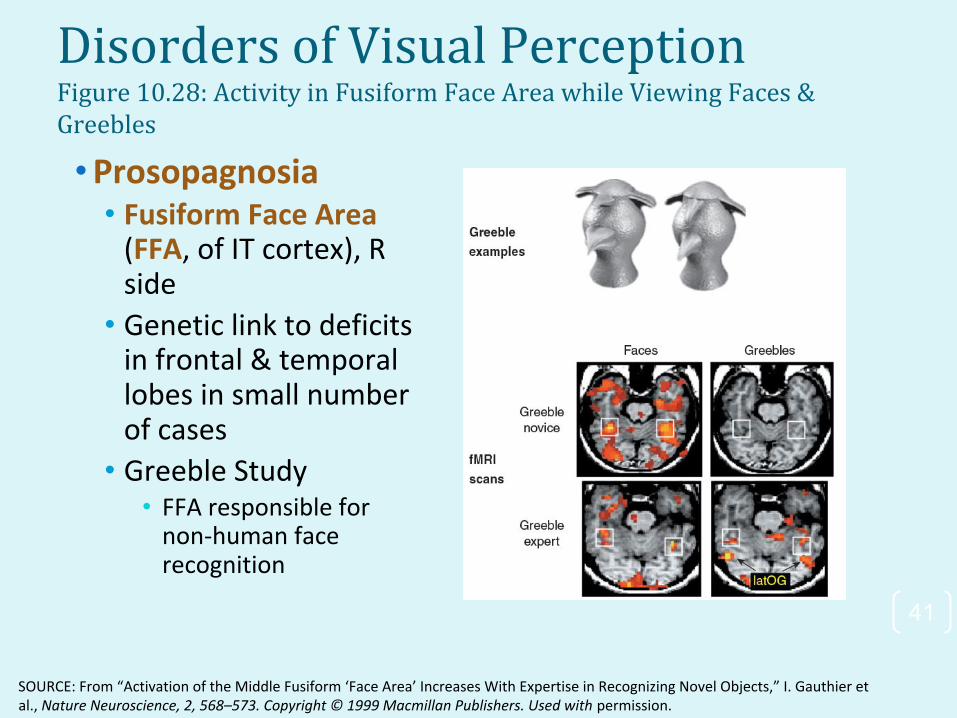
Disorders of Visual PerceptionFigure 10.28: Activity in Fusiform Face Area while Viewing Faces & Greebles
• Prosopagnosia• Fusiform Face Area
(FFA, of IT cortex), R side
• Genetic link to deficits in frontal & temporal lobes in small number of cases
• Greeble Study• FFA responsible for
non-human face recognition
*G
arre
tt: B
rain
& B
ehav
ior 4
e
41
SOURCE: From “Activation of the Middle Fusiform ‘Face Area’ Increases With Expertise in Recognizing Novel Objects,” I. Gauthier et al., Nature Neuroscience, 2, 568–573. Copyright © 1999 Macmillan Publishers. Used with permission.
Disorders of Visual PerceptionFace Blindness and Blindsight
• Blindsight• Damage to V1 causes cortical blindness, BUT
• Superior colliculus also connects to striate cortex independently
• Therefore, individuals can react unconsciously to stimuli without “seeing” them
• Visual word form area (VWFA)• Responds to written words
*G
arre
tt: B
rain
& B
ehav
ior 4
e
42

Disorders of Visual PerceptionColor and Movement Agnosias
• Color agnosia is the loss of the ability to perceive colors• V1 is wavelength coded
• V4 is color coded and provides color constancy
*G
arre
tt: B
rain
& B
ehav
ior 4
e
43
SOURCE: http://blogs.scientificamerican.com/streams-of-consciousness/2011/12/13/an-artist-reveals-how-he-tricks-the-eyesSOURCE: http://blogs.scientificamerican.com/streams-of-consciousness/2011/12/13/an-artist-reveals-how-he-tricks-the-eyes/
Image© James Curney

Disorders of Visual PerceptionColor and Movement Agnosias
• Movement agnosia is the inability to perceive movement.
• Information about movement is integrated in area MT.
• Patient LM had difficulty:• Guiding eye and finger movements
• Telling if something (or someone) was moving
• Objects moving toward or away from him
*G
arre
tt: B
rain
& B
ehav
ior 4
e
44
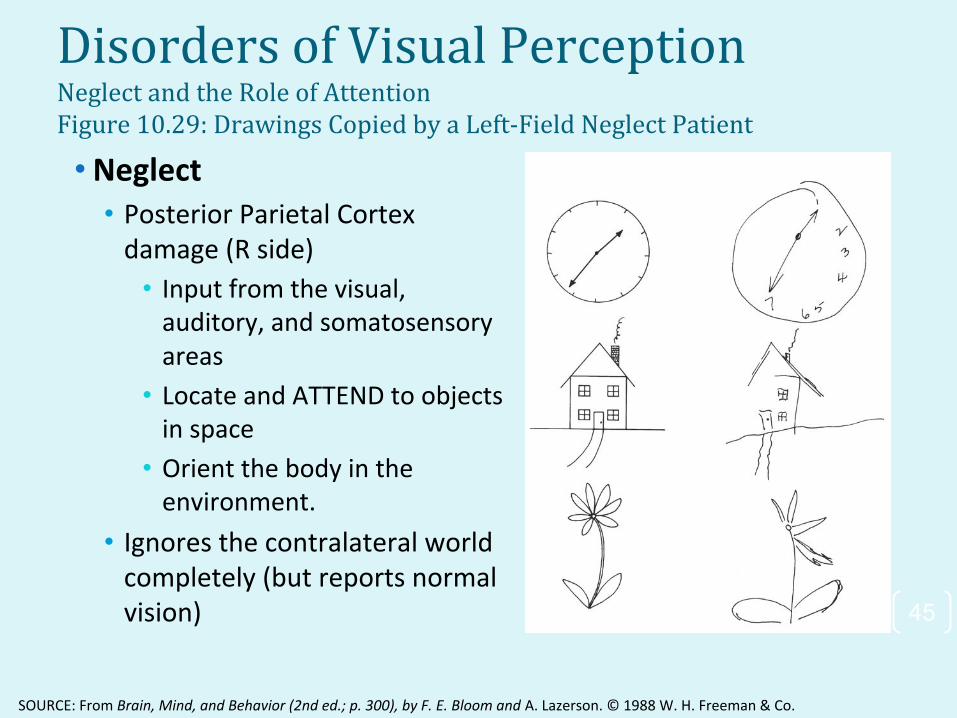
Disorders of Visual PerceptionNeglect and the Role of AttentionFigure 10.29: Drawings Copied by a Left-Field Neglect Patient
• Neglect• Posterior Parietal Cortex
damage (R side)
• Input from the visual, auditory, and somatosensory areas
• Locate and ATTEND to objects in space
• Orient the body in the environment.
• Ignores the contralateral world completely (but reports normal vision)
Gar
rett:
Bra
in &
Beh
avio
r 4e
45
SOURCE: From Brain, Mind, and Behavior (2nd ed.; p. 300), by F. E. Bloom and A. Lazerson. © 1988 W. H. Freeman & Co.

The Problem of Final IntegrationThe Binding Problem
• Binding:• How the brain combines information from different areas
into an integrated experience
• Areas it might occur:• Superior Temporal Gyrus
• receives input from both dorsal and ventral streams.
• Parietal cortex
• damage causes neglect.
• Prefrontal areas
• Where both streams finally merge and decisions are made
*G
arre
tt: B
rain
& B
ehav
ior 4
e
46
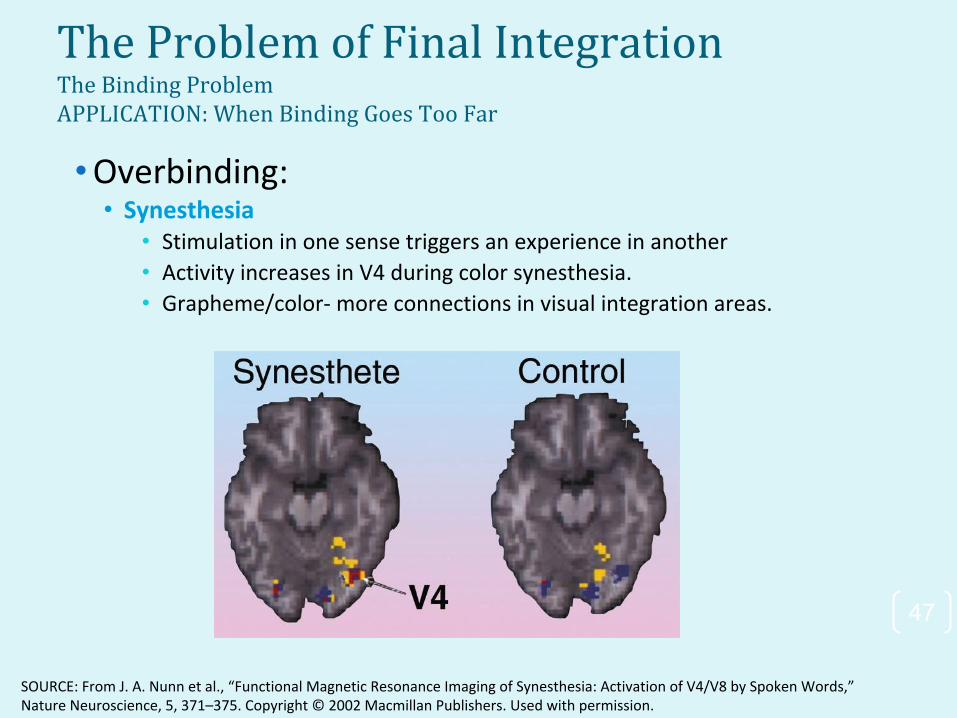
The Problem of Final IntegrationThe Binding ProblemAPPLICATION: When Binding Goes Too Far
• Overbinding:• Synesthesia
• Stimulation in one sense triggers an experience in another• Activity increases in V4 during color synesthesia.• Grapheme/color- more connections in visual integration areas.
*G
arre
tt: B
rain
& B
ehav
ior 4
e
47
SOURCE: From J. A. Nunn et al., “Functional Magnetic Resonance Imaging of Synesthesia: Activation of V4/V8 by Spoken Words,” Nature Neuroscience, 5, 371–375. Copyright © 2002 Macmillan Publishers. Used with permission.