vision illawarra: beyond trend analysis for urban planning
TRANSCRIPT

Vision Illawarra Beyond trend analysis for urban planning
Rohan Wickramasuriya
November 2014

Illawarra Region
• 4 LGAs
• Total Population (2011): 368,814
• Wollongong LGA: 52% of the population
• Total Jobs (2011): 138,950

From SID to Vision Illawarra
SMART Infrastructure Dashboard • Electricity (2007-2013)
• Water (2007-2013)*
• Sewage (2007-2013)*
• Solid Waste (2007-2013)**
*: SCC excluded ; **: KMC & SCC excluded
Vision Illawarra • Land Use Changes
• Economic Changes
• Traffic Patterns
• Consumption Patterns
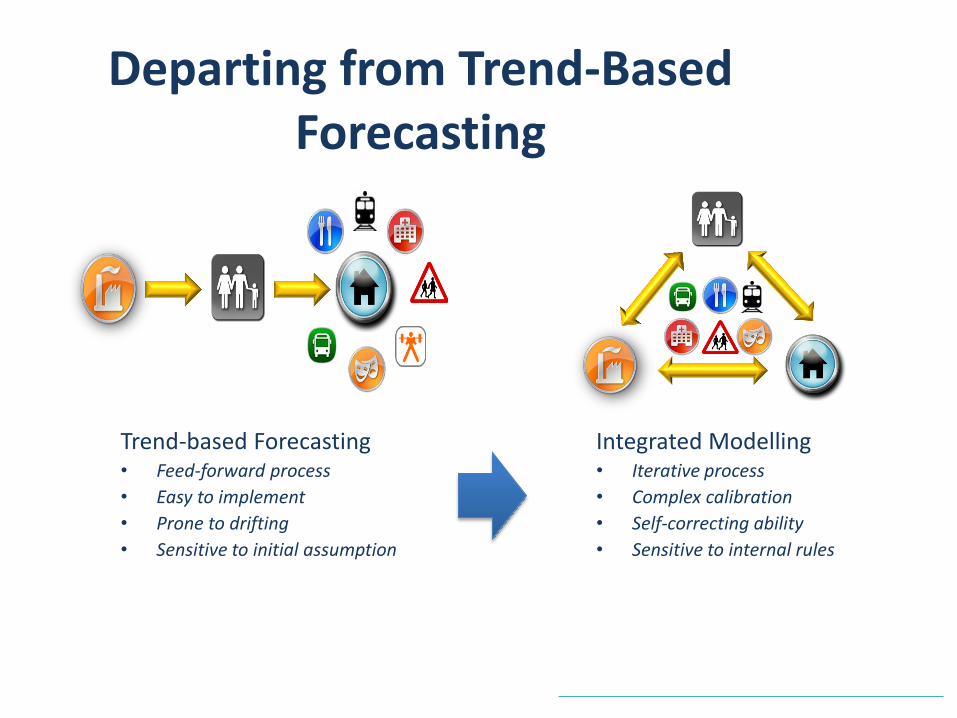
Departing from Trend-Based Forecasting
Trend-based Forecasting • Feed-forward process
• Easy to implement
• Prone to drifting
• Sensitive to initial assumption
Integrated Modelling • Iterative process
• Complex calibration
• Self-correcting ability
• Sensitive to internal rules

Addressing Complex Planning Issues
Unanderra
Albion Park
Dapto
Too many interactions and feedback loops for a trend-based analysis

LAND USE (CA)
TRANSPORT (ABM)
DEMOGRAPHIC (SYNT POP)
MACRO-ECONOMIC (IO-EC)
GEONAMICA Modular Framework
UTILITY (Geometric Networks)

Preliminary Scenario Exploration (land use & transportation only)

Baseline Scenario (2012 – 2022)

Calibration & Validation Results
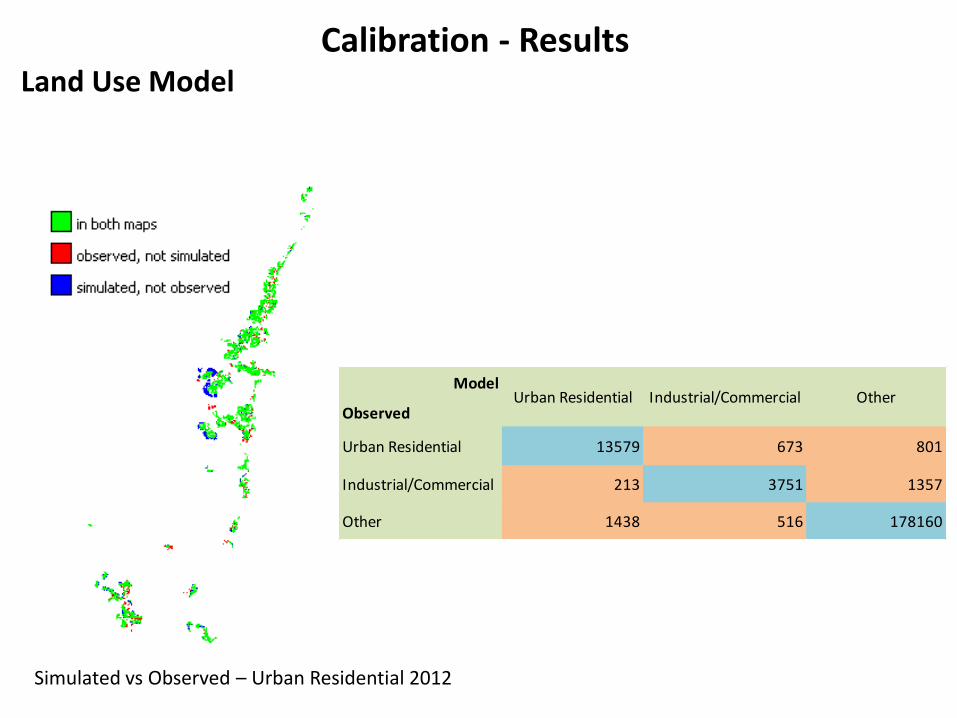
Calibration - Results Land Use Model
Simulated vs Observed – Urban Residential 2012
Model
Observed
Urban Residential 13579 673 801
Industrial/Commercial 213 3751 1357
Other 1438 516 178160
Urban Residential Industrial/Commercial Other
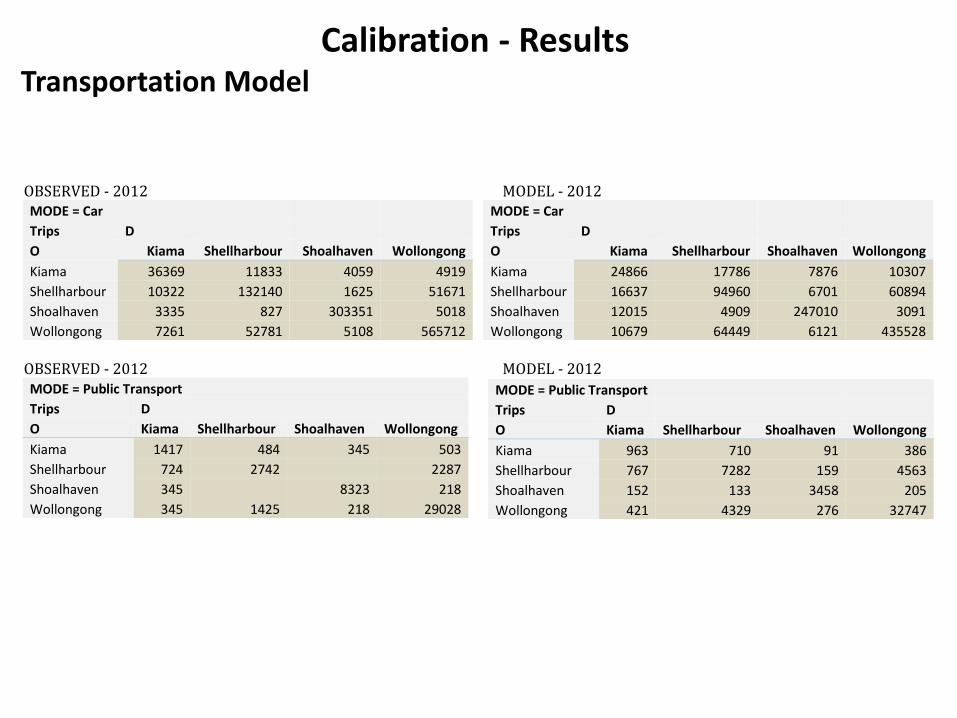
Calibration - Results Transportation Model
OBSERVED - 2012 MODEL - 2012 MODE = Car
Trips D
O Kiama Shellharbour Shoalhaven Wollongong
Kiama 36369 11833 4059 4919
Shellharbour 10322 132140 1625 51671
Shoalhaven 3335 827 303351 5018
Wollongong 7261 52781 5108 565712
OBSERVED - 2012 MODEL - 2012 MODE = Public Transport
Trips D
O Kiama Shellharbour Shoalhaven Wollongong
Kiama 1417 484 345 503
Shellharbour 724 2742 2287
Shoalhaven 345 8323 218
Wollongong 345 1425 218 29028
MODE = Car
Trips D
O Kiama Shellharbour Shoalhaven Wollongong
Kiama 24866 17786 7876 10307
Shellharbour 16637 94960 6701 60894
Shoalhaven 12015 4909 247010 3091
Wollongong 10679 64449 6121 435528
MODE = Public Transport
Trips D
O Kiama Shellharbour Shoalhaven Wollongong
Kiama 963 710 91 386
Shellharbour 767 7282 159 4563
Shoalhaven 152 133 3458 205
Wollongong 421 4329 276 32747

Face Validation - Results Transportation Model
Observed weekday morning peak traffic speeds Simulated traffic speeds
Weekday morning peak traffic - Google Weekday morning peak traffic - Model
Network speed

Current limitations and ongoing work

Current Limitations
Data – more being collected Sufficient details – high, medium, low density residential - separate industrial, commercial classes Zoning data & expert interpretation HTS data for same time points – OD down to TZ (SA1 ideally) Disaggregation of PT into buses and trains More time for calibration (and validation)

Ongoing work
Fitting the land use and transportation models with detailed data
Detailed calibration and validation
Integrating econometric I/O model and SP model
Coding up and integrating utility model

Rohan Wickramasuriya Research Fellow SMART Infrastructure Facility +61 2 4239 2344 [email protected]