visit note spicejet -...
TRANSCRIPT

Edelweiss Research is also available on www.edelresearch.com, Bloomberg EDEL <GO>, Thomson First Call, Reuters and Factset. Edelweiss Securities Limited
Our meeting with Mr. Koteshwar, CFO, SpiceJet (SJ), left us enthused about the company’s growth prospects. From a near collapse, SJ has managed to clock profits in past 10 consecutive quarters and continues to prune debt. Following the turnaround, the company has now renewed focus on profitable growth reflected in a mega aircraft order to capitalise on promising industry dynamics (structural: demand growth to exceed capacity in underpenetrated market; cyclical: benign ATF prices). Hence, we raise FY19E EV/EBITDAR to 8.5x (from 8.0x) and revise TP to INR150 (INR138 earlier) as we assume lower warrants dilution (50% probability versus 100% assumed earlier). Refurbished strategy aids rebound SJ has recovered, from a near collapse, bolstered by the new chairman’s refurbished strategy: 1) focus on maximising revenue through high aircraft utilisation; 2) fleet rationalisation; 3) cost efficiencies (restructured legacy contracts with lessors); 4) enhancing employee productivity (aligning incentive structures); and 5) sharpening focus on balance sheet/cash flows. Favourable dynamics: Traffic growth to outstrip capacity 1) Structural demand factors: Airline under-penetration (0.09 annual trips/capita, 1/4th of China) is expected to improve with better airport connectivity under UDAN; 2) Cyclical benefits: Pent up demand amidst 40% fall in ATF price since 2014. SJ sees limited risks to demand if oil remains at ~USD60-65/bbl; 3) Capacity to lag: India needs 60 new aircraft p.a. to support demand, well above capacity projections; 4) Slot-constraints at major airports a bottleneck. However, Mumbai’s new airport & Delhi’s new terminal will ease constraints. Bengaluru and Hyderabad airports are scalable. Growing profitably: Mega aircraft order to address higher cost Mega order for 205 737 MAX will bolster growth. While operating cost will fall with 15% fuel savings and lower maintenance, ownership cost will dip as deliveries in the initial 3 years will be under sale and lease (as SJ is targeting to stay asset light). Outlook and valuation: Robust growth, improving B/S; retain ‘BUY’ Cumulative INR11bn PAT in past 10 quarters has enhanced liquidity. We estimate 18% RPKM and 49% EPS CAGR over FY17-19. We envisage reduced risk of warrants dilution (16% dilution versus 32% assumed earlier) and revise our TP to INR150 (8.5x FY19E EV/EBITDAR). At CMP, the stock trades at 9x FY19E EPS. Maintain ‘BUY’.
VISIT NOTE
SPICEJET Ample wind beneath its wings
EDELWEISS RATINGS
Absolute Rating BUY
Investment Characteristics Growth
MARKET DATA (R: SPJT.BO, B: SJET IN)
CMP : INR 128
Target Price : INR 150
52-week range (INR) : 136 / 55
Share in issue (mn) : 599.5
M cap (INR bn/USD mn) : 76 / 1,193
Avg. Daily Vol. BSE/NSE (‘000) : 0.0
SHARE HOLDING PATTERN (%)
Current Q4FY17 Q3FY17
Promoters * 60.3 60.3 60.3
MF's, FI's & BKs 4.9 3.6 1.2
FII's 5.5 4.4 2.2
Others 29.3 31.7 36.3 * Promoters pledged shares (% of share in issue)
: NIL
PRICE PERFORMANCE (%)
BSE Midcap Index
Stock Stock over
Index
1 month 1.7 (0.5) (2.2)3 months 6.6 20.2 13.6
12 months 16.6 126.4 109.9
Jal Irani +91 22 6620 3087 [email protected] Yusufi Kapadia +91 22 4063 5407 [email protected]
Financials (INR mn)
Year to March FY16 FY17 FY18E FY19ENet revenue 50,881 61,913 76,022 91,831EBITDAR 13,486 15,039 17,081 23,287Adjusted Profit 3,861 3,922 5,093 9,617EV/EBIDTAR 10.6 10.1 9.5 7.2Diluted P/E (x) 19.8 19.5 17.4 9.2
Indi
a M
idca
ps
India Equity Research| Aviation
September 6, 2017

Aviation
2 Edelweiss Securities Limited
Chart 1: SJ’s PLF at significant premium to Indigo Chart 2: Enjoys premium RASK than Indigo
Chart 3: ASKM (capacity) almost doubled since lows in Q4FY15 Chart 4: Maintenance cost rationalizing from highs in FY15
Chart 5: ATF price crashed ~40% since 2014 Chart 6: Consecutive 10 quarters of profits
Source: Company, Edelweiss research
75.0
80.0
85.0
90.0
95.0
100.0 Ja
n-15
Apr-
15
Jul-1
5
Oct
-15
Jan-
16
Apr-
16
Jul-1
6
Oct
-16
Jan-
17
Apr-
17
Jul-1
7
(%)
SpiceJet IndiGo
0.0
20.0
40.0
60.0
80.0
100.0
1.0
2.0
3.0
4.0
5.0
6.0
Q2F
Y14
Q4F
Y14
Q2F
Y15
Q4F
Y15
Q2F
Y16
Q4F
Y16
Q2F
Y17
Q4F
Y17
(%)
(bn)
ASKM RPK PLF (RHS)
40
52
64
76
88
100
Jan-14 Jan-15 Jan-16 Jan-17
(inde
x)
(7,000)
(4,800)
(2,600)
(400)
1,800
4,000
Q2F
Y14
Q3F
Y14
Q4F
Y14
Q1F
Y15
Q2F
Y15
Q3F
Y15
Q4F
Y15
Q1F
Y16
Q2F
Y16
Q3F
Y16
Q4F
Y16
Q1F
Y17
Q2F
Y17
Q3F
Y17
Q4F
Y17
Q1F
Y18
(INR
mn)
PAT
600
760
920
1,080
1,240
1,400
FY11
FY12
FY13
FY14
FY15
FY16
Q1F
Y17
Q2F
Y17
Q3F
Y17
Q4F
Y17
Q1F
Y18
(USD
/Blo
ck H
r)
(20.0)
(12.0)
(4.0)
4.0
12.0
20.0
Q3F
Y15
Q4F
Y15
Q1F
Y16
Q2F
Y16
Q3F
Y16
Q4F
Y16
Q1F
Y17
Q2F
Y17
Q3F
Y17
Q4F
Y17
Q1F
Y18
(%)
RASK: SpiceJet premium vs. Indigo

SpiceJet
3 Edelweiss Securities Limited
Near collapse in FY15... Winter (seasonally peak quarter for airline industry) 2014 ironically turned out to be one of the most challenging quarters in SpiceJet’s (SJ) history. Owing to the difficulty in meeting some of its financial obligations due to liquidity constraints, the airline had to cancel considerable number of scheduled flights thereby severely eroding the brand and customer confidence in the airline, which had a cascading impact on future bookings. Consequent to flight cancellations, the airline lost significant market share—plummeted from 18-20% to 9-10%—to competition in subsequent months. Chart 7: Market share plummeted from 18-20% to 9-10%
Source: DGCA, Edelweiss research
SJ, under financial duress, delayed its dues to statutory authorities and payments to various parties, including vendors and aircraft lessors. To rationalise fleet size, it terminated certain aircraft leases ahead of schedule even as it continued to explore options to raise fresh capital to meet its short and long-term obligations. Fleet rationalisation also led to provisioning for costs related to early terminations, which took a further toll on the airline’s profitability during the year. Chart 8: Aircraft leases terminated to rationalise fleet size in FY15
Source: Company, Edelweiss research
19% 21% 20% 19% 18% 15% 11% 9% 9% 10% 11% 12%
0%
20%
40%
60%
80%
100%
Jun-
14
Jul-1
4
Aug-
14
Sep-
14
Oct
-14
Nov-
14
Dec-
14
Jan-
15
Feb-
15
Mar
-15
Apr-
15
May
-15
Air India GoAir Indigo Jet + JetLite Spicejet Others
0.0
12.0
24.0
36.0
48.0
60.0
FY12 FY13 FY14 FY15
(No.
s)
Boeing Bombardier
Mr. Kiran Koteshwar CFO

Aviation
4 Edelweiss Securities Limited
…battles back from the brink In Q4FY15, under the reconstruction and revival scheme, Mr. Ajay Singh (a founder member) through a share purchase agreement took over ownership and control of the company from erstwhile promoters—Mr. Kalanithi Maran and Kal Airways, who held 58.46% in the company. Unlike previous promoters, Mr. Singh, with deep understanding and experience in the airline sector, is known for his hands-on approach and gets involved in the day-to-day operations.
Chart 9: Promoter holding prior to take over Chart 10: Promoter holding after take over
Source: Company, Edelweiss research
SJ has successfully revived from a near grounding experience, led by a refurbished strategy by the new Chairman, notably: 1) focusing on revenue maximisation through high aircraft utilisation; 2) timely fleet addition; 3) achieving cost efficiencies (restructured legacy contracts with lessors); 4) enhancing employee productivity (aligning incentive structures); and 5) sharpening focus on balance sheet/cash flow improvement. These measures helped SJ restore operational reliability and regain customer confidence. This was amply evident in the return to normalcy of flight cancellations rate, gradual uptick in available capacity and recovery of lost passenger volumes in ensuing months, thereby gaining market share. Revenue maximisation: Tactical pricing to stimulate PLFs, RASK
SJ focused on maximising revenue by adopting dynamic revenue management through higher airline load factor than industry. Management’s philosophy - flying empty seats, which are ultimately a perishable commodity/lost forever once the flight has taken off, is a crime, and the best way to address that was to sell well in advance at highly attractive rates to passengers willing to plan and book early in exchange for competitive prices.
Kalanithi Maran
25%
Kal Airways Pvt Ltd
34%
Institutions0%
Others41%
Ajay Singh & family
60%
Institutions1%
Others39%

SpiceJet
5 Edelweiss Securities Limited
Chart 11: Discounted pricing - PLF recouped to >90% from ~80% levels in Q4FY15…
Source: DGCA
While fare discounting props PLF, yields (pax revenue/RPKM) tend to falter. However, high occupancy ensures that the discount narrows down significantly on revenue earned/ASKM (RASK). Adjusting for PLF, average passenger revenue earned/ASKM by SJ which was at 16% discount to Indigo in Q4FY15 (due to lower fleet and cancellations), went up to 9% premium to IndiGo in Q2FY16 and has been at a premium since then (Q1FY18: 10%). Chart 12: …SJ now enjoying premium RASK than Indigo (10% premium in Q1FY18)
Source: DGCA, Companies, Edelweiss research
Higher PLFs coupled with innovative pricing through “unbundling fares” led to higher share of ancillary revenue which entails better margins.
75.0
80.0
85.0
90.0
95.0
100.0
Jan-
15
Mar
-15
May
-15
Jul-1
5
Sep-
15
Nov-
15
Jan-
16
Mar
-16
May
-16
Jul-1
6
Sep-
16
Nov-
16
Jan-
17
Mar
-17
May
-17
Jul-1
7
(%)
Jet Go Air SpiceJet IndiGo
(20.0)
(12.0)
(4.0)
4.0
12.0
20.0
Q3F
Y15
Q4F
Y15
Q1F
Y16
Q2F
Y16
Q3F
Y16
Q4F
Y16
Q1F
Y17
Q2F
Y17
Q3F
Y17
Q4F
Y17
Q1F
Y18
(%)
SpiceJet premium vs. Indigo

Aviation
6 Edelweiss Securities Limited
Chart 13: Ancillary revenue, as a percentage of passenger revenue
Source: Company, Edelweiss research
Subsequent fleet addition, High PLFs driving market share
From peak fleet of 58 aircraft in Q3FY15, fleet size declined to 31 in Q4FY15. However, given better liquidity and favourable markets, SJ reintroduced new aircraft (on operating lease) and re-inducted few of the earlier surrendered aircraft, to end Q1FY18 with fleet size of 55, almost its highest level. Chart 14: Favourable market driving fleet addition since Q4FY15
Source: Company
Due to higher PLFs and increased capacity, SJ regained lost customer volumes and confidence, which resulted in market share recovering from the Q3FY15 lows.
6.0
8.0
10.0
12.0
14.0
16.0
0
14,000
28,000
42,000
56,000
70,000
FY12
FY13
FY14
FY15
Q1F
Y16
Q2F
Y16
Q3F
Y16
Q4F
Y16
Q1F
Y17
Q2F
Y17
Q3F
Y17
Q4F
Y17
Q1F
Y18
(%)
(INR
mn)
Pax Revenues Ancillary Revenue Anc Rev. as % of total
43
17 20 22 27 29 28 31 32 33 35
15
14 14 1414 14 14 14 17 18 20
0.0
14.0
28.0
42.0
56.0
70.0
Q3F
Y15
Q4F
Y15
Q1F
Y16
Q2F
Y16
Q3F
Y16
Q4F
Y16
Q1F
Y17
Q2F
Y17
Q3F
Y17
Q4F
Y17
Q1F
Y18
(Nos
.)
Boeing/Airbus Bombardier
SpiceJet
7 Edelweiss Securities Limited
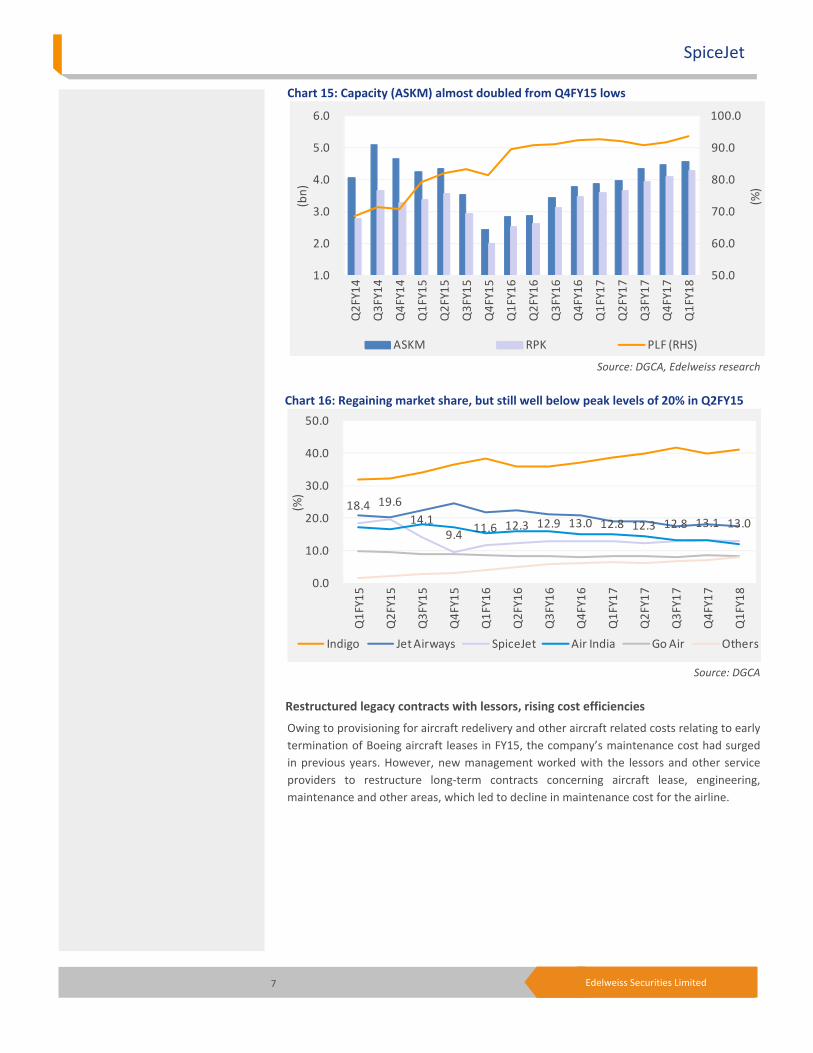
Chart 15: Capacity (ASKM) almost doubled from Q4FY15 lows
Source: DGCA, Edelweiss research
Chart 16: Regaining market share, but still well below peak levels of 20% in Q2FY15
Source: DGCA
Restructured legacy contracts with lessors, rising cost efficiencies
Owing to provisioning for aircraft redelivery and other aircraft related costs relating to early termination of Boeing aircraft leases in FY15, the company’s maintenance cost had surged in previous years. However, new management worked with the lessors and other service providers to restructure long-term contracts concerning aircraft lease, engineering, maintenance and other areas, which led to decline in maintenance cost for the airline.
50.0
60.0
70.0
80.0
90.0
100.0
1.0
2.0
3.0
4.0
5.0
6.0
Q2F
Y14
Q3F
Y14
Q4F
Y14
Q1F
Y15
Q2F
Y15
Q3F
Y15
Q4F
Y15
Q1F
Y16
Q2F
Y16
Q3F
Y16
Q4F
Y16
Q1F
Y17
Q2F
Y17
Q3F
Y17
Q4F
Y17
Q1F
Y18
(%)
(bn)
ASKM RPK PLF (RHS)
18.4 19.614.1
9.4 11.6 12.3 12.9 13.0 12.8 12.3 12.8 13.1 13.0
0.0
10.0
20.0
30.0
40.0
50.0
Q1F
Y15
Q2F
Y15
Q3F
Y15
Q4F
Y15
Q1F
Y16
Q2F
Y16
Q3F
Y16
Q4F
Y16
Q1F
Y17
Q2F
Y17
Q3F
Y17
Q4F
Y17
Q1F
Y18
(%)
Indigo Jet Airways SpiceJet Air India Go Air Others

Aviation
8 Edelweiss Securities Limited
Chart 17: Maintenance cost rationalised from highs in FY15
Source: Company, Edelweiss research
Favourable industry dynamics: Traffic growth to outstrip capacity SJ expects robust demand growth (10.7% CAGR over next 10 years) to exceed capacity addition. While the recent robust demand growth is driven by cyclically lower oil price driving pent-up demand, structural fundamental growth drivers are yet to play out, which will drive airline demand in long term. Chart 18: ATF prices (40-50% of total cost) down almost 40% since 2014
Source: IOCL, Edelweiss research
Fundamental demand drivers that are yet to play out
1. Strong economic growth and continued population growth
2. Growing affluent middle class: India’s middle class households will exceed 90mn by 2025, retaining its current rank as the world’s second largest middle class. Moreover, by 2025, share of elite, affluent and aspirer households will increase from 23% to 36% of the total, while the share of strugglers will drop from 31% to 18%.
600
760
920
1,080
1,240
1,400
FY11
FY12
FY13
FY14
FY15
FY16
Q1F
Y17
Q2F
Y17
Q3F
Y17
Q4F
Y17
Q1F
Y18
(USD
/Blo
ck H
r)
40
52
64
76
88
100
Jan-
14M
ar-1
4M
ay-1
4Ju
l-14
Sep-
14No
v-14
Jan-
15M
ar-1
5M
ay-1
5Ju
l-15
Sep-
15No
v-15
Jan-
16M
ar-1
6M
ay-1
6Ju
l-16
Sep-
16No
v-16
Jan-
17M
ar-1
7M
ay-1
7Ju
l-17
(inde
x)
SpiceJet
9 Edelweiss Securities Limited
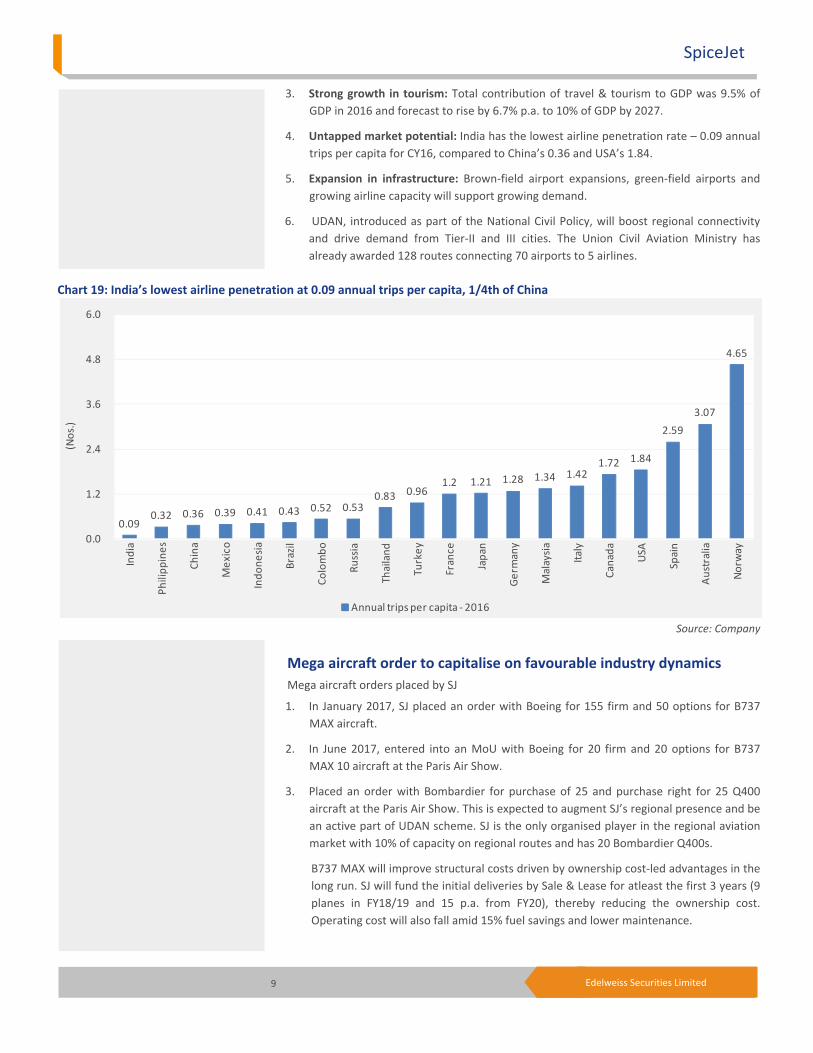
3. Strong growth in tourism: Total contribution of travel & tourism to GDP was 9.5% of GDP in 2016 and forecast to rise by 6.7% p.a. to 10% of GDP by 2027.
4. Untapped market potential: India has the lowest airline penetration rate – 0.09 annual trips per capita for CY16, compared to China’s 0.36 and USA’s 1.84.
5. Expansion in infrastructure: Brown-field airport expansions, green-field airports and growing airline capacity will support growing demand.
6. UDAN, introduced as part of the National Civil Policy, will boost regional connectivity and drive demand from Tier-II and III cities. The Union Civil Aviation Ministry has already awarded 128 routes connecting 70 airports to 5 airlines.
Chart 19: India’s lowest airline penetration at 0.09 annual trips per capita, 1/4th of China
Source: Company
Mega aircraft order to capitalise on favourable industry dynamics Mega aircraft orders placed by SJ
1. In January 2017, SJ placed an order with Boeing for 155 firm and 50 options for B737 MAX aircraft.
2. In June 2017, entered into an MoU with Boeing for 20 firm and 20 options for B737 MAX 10 aircraft at the Paris Air Show.
3. Placed an order with Bombardier for purchase of 25 and purchase right for 25 Q400 aircraft at the Paris Air Show. This is expected to augment SJ’s regional presence and be an active part of UDAN scheme. SJ is the only organised player in the regional aviation market with 10% of capacity on regional routes and has 20 Bombardier Q400s.
B737 MAX will improve structural costs driven by ownership cost-led advantages in the long run. SJ will fund the initial deliveries by Sale & Lease for atleast the first 3 years (9 planes in FY18/19 and 15 p.a. from FY20), thereby reducing the ownership cost. Operating cost will also fall amid 15% fuel savings and lower maintenance.
0.090.32 0.36 0.39 0.41 0.43 0.52 0.53
0.83 0.961.2 1.21 1.28 1.34 1.42
1.72 1.84
2.593.07
4.65
0.0
1.2
2.4
3.6
4.8
6.0
Indi
a
Phili
ppin
es
Chin
a
Mex
ico
Indo
nesia
Braz
il
Colo
mbo
Russ
ia
Thai
land
Turk
ey
Fran
ce
Japa
n
Germ
any
Mal
aysia
Italy
Cana
da
USA
Spai
n
Aust
ralia
Norw
ay
(Nos
.)
Annual trips per capita - 2016

Aviation
10 Edelweiss Securities Limited
Outlook and Valuations: Strong growth, improving B/S; maintain ‘BUY’ SJ has managed to dislodge significant portion of its overdue obligations to statutory authorities in the past few quarters. The company has entered into settlement agreements with certain lessors and vendors with respect to past overdue payments and also negotiated deferred payment plans with certain vendors for overdue amounts. The corrective measures, in an extremely conducive macroeconomic environment, has helped the new promoter turn-around the airline—reported 10 consecutive quarters of profits: cumulative INR11bn. With sharpening focus on improving balance sheet, the company has pruned debt by INR2bn in the past 2 years, reduced liability by INR3bn in FY17 and surplus gross cash balance at INR2bn in FY17. Chart 20: SJ consistently recording profits since past 10 quarters
Source: Company
The airline will enhance fleet size in ensuing years to improve scale and depth of operations across strategic markets and capitalise on the growing aviation market in India. With the airline now returning to normalcy, management is clearly shifting focus to growth. Over FY17-19, we estimate 18% RPKM CAGR, driving 49% EPS CAGR. Subsequently, we have revised our target price to INR150, driven by:
1) Higher EV/EBITDAR multiple: With the company’s renewed focus on profitable growth and visible improvement in balance sheet/cash flow quality, we have raised FY19E EV/EBITDAR multiple to 8.5x (8.0x earlier). We believe Indian airline companies deserve premium valuations versus global peers (5.0x 1-year forward EV/EBITDAR), on expected superior growth (almost 5% higher than global airlines traffic growth).
2) Lower risks of warrant dilution: While the warrant case with ex promoters is under arbitration, we now assume 50% probability of dilution at INR16.3/share, purely based on information available in the public domain. This implies 16% dilution versus 32% assumed earlier. Assuming NIL warrants dilution (best-case scenario), our implied target price works out to INR167 (31% upside from current levels), while if there is 100% dilution (worst-case scenario), our target price is pegged at INR136 (implying 7% upside).
(7,000)
(4,800)
(2,600)
(400)
1,800
4,000
Q2F
Y14
Q3F
Y14
Q4F
Y14
Q1F
Y15
Q2F
Y15
Q3F
Y15
Q4F
Y15
Q1F
Y16
Q2F
Y16
Q3F
Y16
Q4F
Y16
Q1F
Y17
Q2F
Y17
Q3F
Y17
Q4F
Y17
Q1F
Y18
(INR
mn)
PAT

SpiceJet
11 Edelweiss Securities Limited
Table 1: SoTP valuation
Chart 21: Shareholding pattern: Different dilution scenarios
Table 2: Valuation (INR/share) scenarios - 31%/17%/7% upside at 100%/50%/0% dilution
Source: Edelweiss research
INR mn INR/shareStandalone FY19E EBITDAR 23,287 34EV/EBITDAR (x) 8.5EV 197,939 285Less: Aircraft lease rentals capitalised at 7x 89,536 129Less: Net debt (cash) 374 1 Less: Pref capital from ex promoters* 4,250 6Equity value 103,779 150Market Cap / CMP 88,554 128% upside 17 17
0%
20%
40%
60%
80%
100%
50% 100% 0%
Previous Current Probability of Warrants dilution
Ajay Singh & family Kalanithi Maran & Kal Airways Others
Bull case(nil dilution)
Base case(50% dilution)
Bear case(100% dilution)
Standalone FY19E EBITDAR 39 34 30EV/EBITDAR (x) 8.5 8.5 8.5EV 330 285 251Less: Lease rentals capitalised at 7x 149 129 114Less: Net debt 4 1 (2) Less: Pref capital from ex promoters* 10 6 3Equity value 167 150 136Market Cap / CMP 128 128 128% upside 31 17 7
Aviation
12 Edelweiss Securities Limited
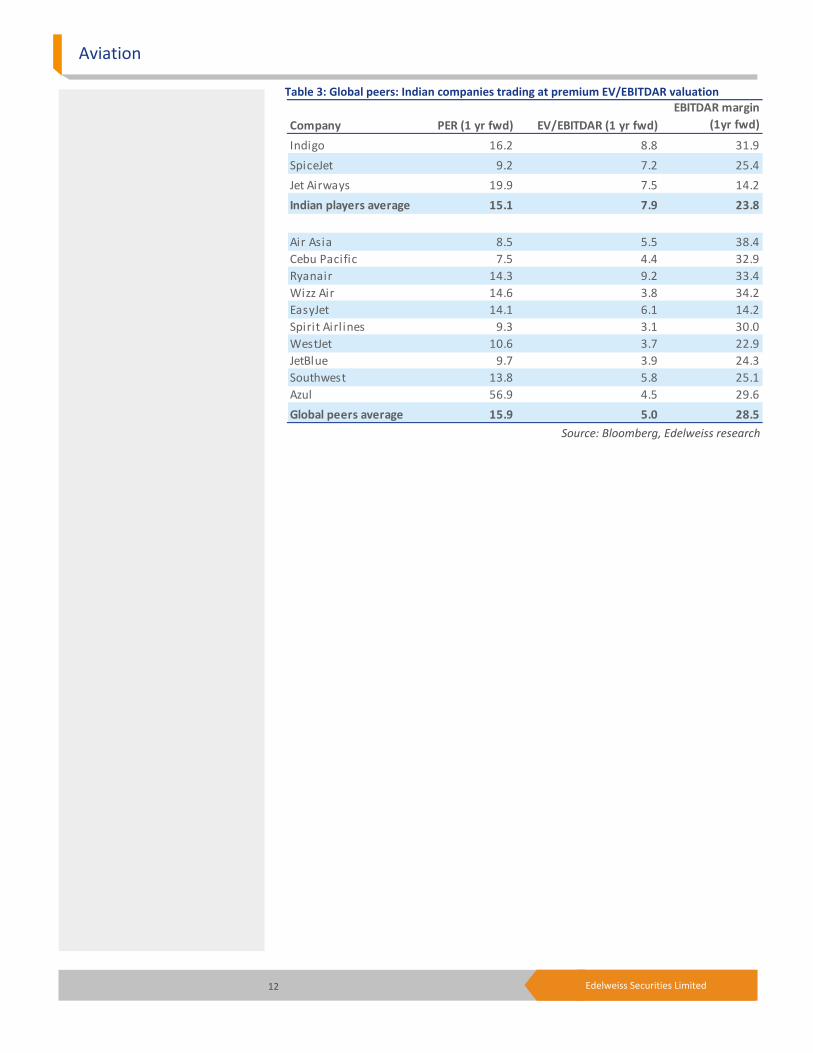
Table 3: Global peers: Indian companies trading at premium EV/EBITDAR valuation
Source: Bloomberg, Edelweiss research
Company PER (1 yr fwd) EV/EBITDAR (1 yr fwd)EBITDAR margin
(1yr fwd)
Indigo 16.2 8.8 31.9SpiceJet 9.2 7.2 25.4Jet Airways 19.9 7.5 14.2Indian players average 15.1 7.9 23.8
Air Asia 8.5 5.5 38.4Cebu Pacific 7.5 4.4 32.9Ryanair 14.3 9.2 33.4Wizz Air 14.6 3.8 34.2EasyJet 14.1 6.1 14.2Spirit Airl ines 9.3 3.1 30.0WestJet 10.6 3.7 22.9JetBlue 9.7 3.9 24.3Southwest 13.8 5.8 25.1Azul 56.9 4.5 29.6Global peers average 15.9 5.0 28.5

SpiceJet
13 Edelweiss Securities Limited
Annexure
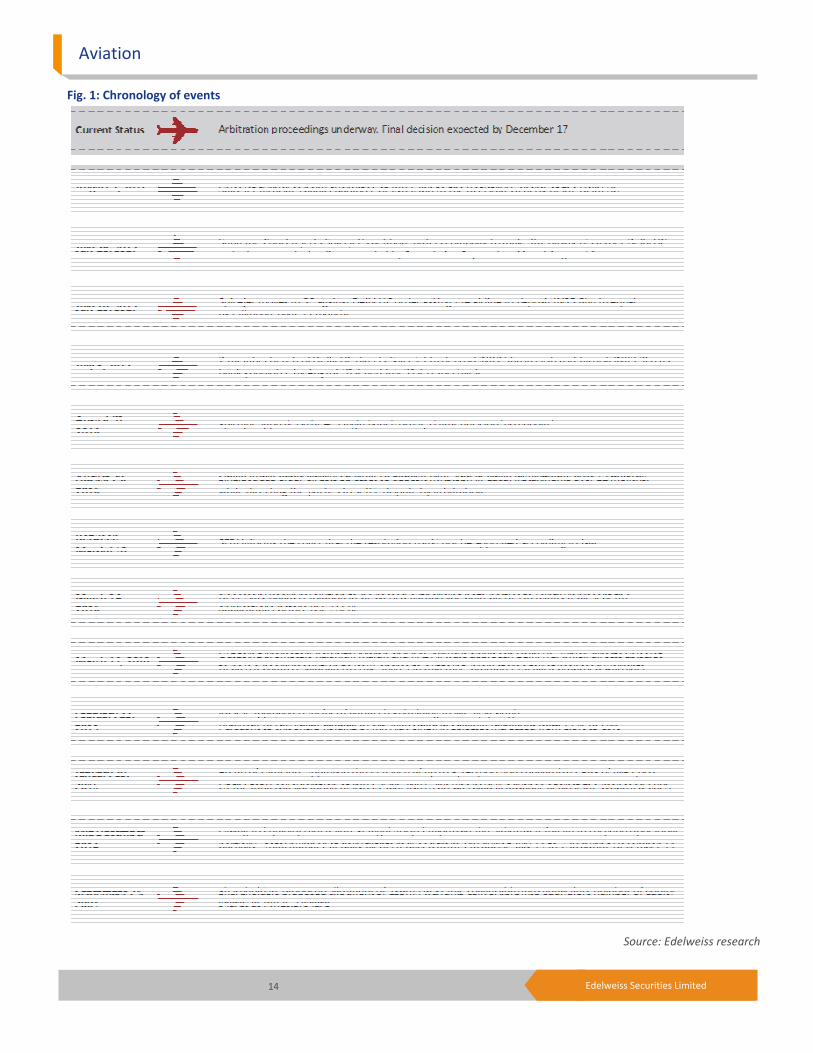
Allotment of warrants pending regulatory clearances Based on information available in the public domain, we have prepared a summary of the warrants issue between SJ and ex promoters (Mr. Kalanithi Maran and Kal airways). Background: Under FY14 sale purchase agreement, Mr. Maran had transferred 58.46% stake in the airline for a total sum of INR2. In return for the transfer, Mr. Maran and KAL Airways were to receive stock warrants and convertible redeemable preference shares from the budget carrier. After SJ failed to issue warrants or allot tranches of the preference shares, Mr. Maran and his airline filed a civil suit before a single-judge of the HC to enforce the terms of the agreement. On the directions of the single judge, SJ’s shareholders in the 30th AGM held in September 2014 had approved allotment of ~189mn warrants convertible into equivalent number of equity shares at a price of INR16.3/share (total consideration of INR3.08bn) to the outgoing promoters. SJ received an amount aggregating INR2.3bn (75% of total consideration) against such proposed warrants. However, the company has not allotted warrants till date citing non-receipt of regulatory approvals. Further, the board in January 2015 also approved issuance of 3.75mn non-convertible CRPS of INR1,000 each to outgoing promoters on preferential basis and had received INR1.2bn as advance. However, market regulator SEBI informed the court that the resolution to allot the shares cannot be approved according to law. This lead to the July 2017 order directing the payment of INR5.8bn, while directing the parties to settle the dispute through arbitration. The case is currently under arbitration and the final decision is awaited. The case timelines are presented below.
Aviation
14 Edelweiss Securities Limited
Source: Edelweiss research
Fig. 1: Chronology of events

SpiceJet
15 Edelweiss Securities Limited
Company Description Spice Jet is one of India's leading domestic low-cost carriers. Whilst the company is amongst the most efficient operators in the domestic airspace, Spice Jet has undergone financial restructuring. It currently operates 35 leased B737-800 in the domestic airspace commanding ~13% market share
Investment Theme Revenue maximization, an appropriate strategy at current scale
SJ’s revenue maximisation strategy has been backed by tactical pricing and dynamic revenue management which has successfully propped occupancy (industry best PLF of 90% plus). The company’s yield is at 6% discount to competition, but superior asset utilisation ensures that it earns 9% higher revenue per seat flown (as of Q2FY16). Unlike competition, SJ’s current scale (smaller fleet) prevents cannibalisation, thereby maximising revenue. This, coupled with obsessive focus on ancillary revenue generation, has paid rich dividends — high margin ancillary income share jumped to 13% in FY17 from 9% in FY15. Next big focus on industry leading cost structure
Shirking legacy issues and to ensure structural cost advantages, management is restructuring its long-term contracts. Towards this, it is working with lessors and other service providers to rationalise its cost base. Moreover, SJ has sealed a 155-aircraft order to lower ownership costs and avail structural advantages.
Key Risks Sharp uptick in ATF prices (accounted for 50% of revenue in past) and INR depreciation (bulk of cost is USD denominated) will impact profitability given high price sensitivity of the Indian consumer leaving limited ability to pass on costs. Economic slowdown exerting pressure on demand for corporate / leisure travel will impact load factor and hence profitability given the high operating leverage structure of the airline business. Failure to maintain occupancy levels at 90% plus any demand weakness will pressurise RASK and hence pose a risk to earnings/valuations. Uncertainty and unpredictability in policy/regulatory framework remains a concern. Adverse taxation structure will drive up cost of doing business, hurting profitability. Existing airports at Indian metros like Mumbai, Chennai and Kolkata running at peak capacity could prove to be bottlenecks for growth.

Aviation
16 Edelweiss Securities Limited
Financial Statements
Income statement (INR mn)
Year to March FY16 FY17 FY18E FY19E
Net revenue 50,881 61,913 76,022 91,831Aircraft fuel expenses 13,920 18,552 23,337 28,005Employees Costs 4,925 6,735 8,747 10,694Operating expenses 18,551 21,586 26,858 29,845Total operating expenses 37,395 46,874 58,942 68,544EBITDAR 13,486 15,039 17,081 23,287Aircraft Lease Rentals 8,111 9,606 10,546 12,791Depreciation 1,798 1,986 2,325 2,450EBIT 3,577 3,447 4,210 8,046Add: Other income 1,520.56 1,125.38 1,557.52 3,118.96Less: Interest Expense 1,237 650 675 480Profit Before Tax 4,498 4,307 5,093 10,686Less: Provision for Tax - - - 1,069Extraordinary item 637 386 - -Reported Profit 4,498 4,307 5,093 9,617Exceptional Items 637 386 - -Adjusted Profit 3,861 3,922 5,093 9,617Shares o /s (mn) 599 599 694 694Diluted shares o/s (mn) 599 599 694 694Adj. Diluted EPS (INR) 6.4 6.5 7.3 13.9Adjusted Cash EPS 10.5 10.5 10.7 17.4
Common size metrics
Year to March FY16 FY17 FY18E FY19E
Aircraft fuel expenses 27 30 31 30Non-fuel expenses 46.1 45.7 46.8 44.1EBITDAR margins 26.5 24.3 22.5 25.4EBIT margins 7.0 5.6 5.5 8.8Net Profit margins 7.6 6.3 6.7 10.5
Growth ratios (%)
Year to March FY16 FY17 FY18E FY19E
Revenues (2.2) 21.7 22.8 20.8EBITDAR Growth 554 12 14 36Adjusted Profit - 1.6 29.9 88.8EPS - 1.6 12.2 88.8
Key Assumptions
Year to March FY16 FY17 FY18E FY19E
Macro
GDP(Y-o-Y %) 7.2 6.5 7.1 7.7 Inflation (Avg) 4.9 4.8 5.0 5.2 Repo rate (exit rate) 6.8 6.3 6.3 6.3 USD/INR (Avg) 65.0 67.5 66.0 66.0Sector
Domestic pax growth(%) 20.0 21.0 20.0 17.0 Domestic ASKM growth(%) 15.0 20.0 18.0 16.0 Domestic oil price(INR/Ltr) 47.9 49.7 52.7 54.0Company
Average fleet size(No) 37.0 45.8 56.8 65.0 Avg. flying hours (Hrs) 9.9 9.8 9.6 9.9 Employee Exp. Growth(%) (8.4) 36.8 29.9 22.3 S&D Exp/pax (INR) 250 250 250 250 Airport chg/dep (INR) 43,871 48,027 43,116 41,000 Maint. Cost/B Hr (USD) 946 791 784 731 Lease rent/Aircrart (USDmn) 5.3 4.3 3.8 3.5 Pax growth (%) 1.7 25.2 19.6 18.0 Pax yield/RPKM 3.8 3.6 3.7 3.7 Cargo rev as % of pax 12.6 12.0 11.5 13.0 Tax rate (%) - - - 10.0
SpiceJet
17 Edelweiss Securities Limited
Peer comparison valuation
Market cap Diluted P/E (X) EV/EBIDTAR ROAE (%)
Name (USD mn) FY18E FY19E FY18E FY19E FY18E FY19E
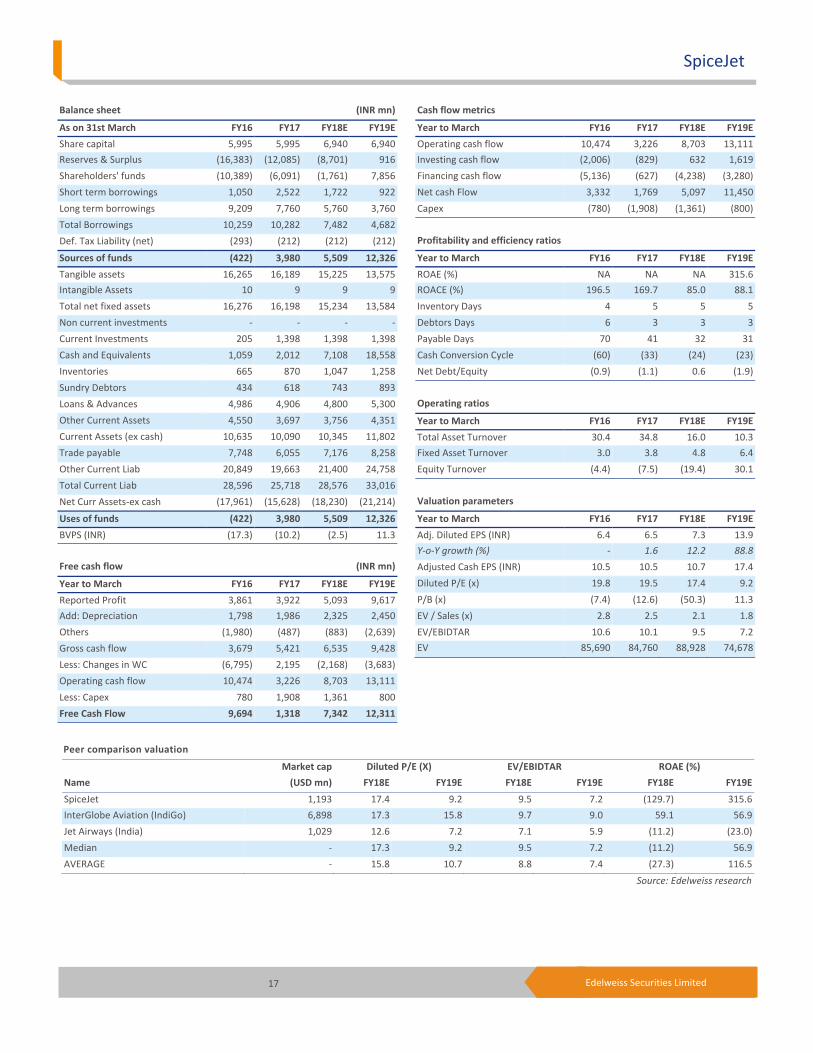
SpiceJet 1,193 17.4 9.2 9.5 7.2 (129.7) 315.6InterGlobe Aviation (IndiGo) 6,898 17.3 15.8 9.7 9.0 59.1 56.9Jet Airways (India) 1,029 12.6 7.2 7.1 5.9 (11.2) (23.0)Median - 17.3 9.2 9.5 7.2 (11.2) 56.9AVERAGE - 15.8 10.7 8.8 7.4 (27.3) 116.5
Source: Edelweiss research
Cash flow metrics
Year to March FY16 FY17 FY18E FY19E
Operating cash flow 10,474 3,226 8,703 13,111Investing cash flow (2,006) (829) 632 1,619Financing cash flow (5,136) (627) (4,238) (3,280)Net cash Flow 3,332 1,769 5,097 11,450Capex (780) (1,908) (1,361) (800)
Profitability and efficiency ratios
Year to March FY16 FY17 FY18E FY19E
ROAE (%) NA NA NA 315.6ROACE (%) 196.5 169.7 85.0 88.1Inventory Days 4 5 5 5Debtors Days 6 3 3 3Payable Days 70 41 32 31Cash Conversion Cycle (60) (33) (24) (23)Net Debt/Equity (0.9) (1.1) 0.6 (1.9)
Operating ratios
Year to March FY16 FY17 FY18E FY19E
Total Asset Turnover 30.4 34.8 16.0 10.3Fixed Asset Turnover 3.0 3.8 4.8 6.4Equity Turnover (4.4) (7.5) (19.4) 30.1
Valuation parameters
Year to March FY16 FY17 FY18E FY19E
Adj. Diluted EPS (INR) 6.4 6.5 7.3 13.9Y-o-Y growth (%) - 1.6 12.2 88.8
Adjusted Cash EPS (INR) 10.5 10.5 10.7 17.4Diluted P/E (x) 19.8 19.5 17.4 9.2P/B (x) (7.4) (12.6) (50.3) 11.3EV / Sales (x) 2.8 2.5 2.1 1.8EV/EBIDTAR 10.6 10.1 9.5 7.2EV 85,690 84,760 88,928 74,678
Balance sheet (INR mn)
As on 31st March FY16 FY17 FY18E FY19E
Share capital 5,995 5,995 6,940 6,940Reserves & Surplus (16,383) (12,085) (8,701) 916Shareholders' funds (10,389) (6,091) (1,761) 7,856Short term borrowings 1,050 2,522 1,722 922Long term borrowings 9,209 7,760 5,760 3,760Total Borrowings 10,259 10,282 7,482 4,682Def. Tax Liability (net) (293) (212) (212) (212)
Sources of funds (422) 3,980 5,509 12,326
Tangible assets 16,265 16,189 15,225 13,575Intangible Assets 10 9 9 9Total net fixed assets 16,276 16,198 15,234 13,584Non current investments - - - -Current Investments 205 1,398 1,398 1,398Cash and Equivalents 1,059 2,012 7,108 18,558Inventories 665 870 1,047 1,258Sundry Debtors 434 618 743 893Loans & Advances 4,986 4,906 4,800 5,300Other Current Assets 4,550 3,697 3,756 4,351Current Assets (ex cash) 10,635 10,090 10,345 11,802Trade payable 7,748 6,055 7,176 8,258Other Current Liab 20,849 19,663 21,400 24,758Total Current Liab 28,596 25,718 28,576 33,016Net Curr Assets-ex cash (17,961) (15,628) (18,230) (21,214)
Uses of funds (422) 3,980 5,509 12,326
BVPS (INR) (17.3) (10.2) (2.5) 11.3
Free cash flow (INR mn)
Year to March FY16 FY17 FY18E FY19E
Reported Profit 3,861 3,922 5,093 9,617Add: Depreciation 1,798 1,986 2,325 2,450Others (1,980) (487) (883) (2,639)Gross cash flow 3,679 5,421 6,535 9,428Less: Changes in WC (6,795) 2,195 (2,168) (3,683)Operating cash flow 10,474 3,226 8,703 13,111Less: Capex 780 1,908 1,361 800Free Cash Flow 9,694 1,318 7,342 12,311

Aviation
18 Edelweiss Securities Limited
Holding - Top 10Perc. Holding Perc. Holding
Birla Sun Life Asset Management 2.15 Jupiter Inv Mgmt Group Ltd 1.97 Icici Prudential Asset Mgmt Co 1.91 Reliance Capital Trustee Co Ltd 1.04 Companies S K Modi Group 0.99 L&T Investment Management Ltd 0.64 Kotak Mahindra Old Mutual Life 0.29 Van Eck Associates Corporation 0.29 Sbi Funds Management 0.28 Wisdomtree Investments Inc 0.19
Insider Trades Reporting Data Acquired / Seller B/S Qty Traded No Data Available
*as per last available data
Bulk Deals Data Acquired / Seller B/S Qty Traded Price
No Data Available
*as per last available data
Additional Data
Directors Data Mr. Ajay Singh Chairman and Managing Director Mr. R Sasiprabhu Independent & Non-Executive directorMrs. Shiwani Singh Promoter Director (Non-Executive) Mr. Anurag Bhargava Independent director Dr. Harsha Vardhana Singh Independent director
Auditors - M/s S. R. Batliboi & Associates LLP
* l l bl d

SpiceJet
19 Edelweiss Securities Limited
`
Edelweiss Securities Limited, Edelweiss House, off C.S.T. Road, Kalina, Mumbai – 400 098. Board: (91-22) 4009 4400, Email: [email protected]
Aditya Narain
Head of Research
Coverage group(s) of stocks by primary analyst(s): Aviation InterGlobe Aviation (IndiGo), Jet Airways (India), SpiceJet
Distribution of Ratings / Market Cap
Edelweiss Research Coverage Universe
Rating Distribution* 161 67 11 240* 1stocks under review
Market Cap (INR) 156 62 11
> 50bn Between 10bn and 50 bn < 10bn
Date Company Title Price (INR) Recos
Buy Hold Reduce Total
Recent Research
11-Aug-17 SpiceJet Buoyant quarter: Yield recovery augments strong PAX growth; Result Update
115 Buy
31-Jul-17 Interglobe Aviation (Indigo)
Strong operational show on yield recovery ; Result Update
1,291 Hold
19-Jun-17 Jet Airways Skids on fuel cost spike; debt 545 Buy
Rating Interpretation
Buy appreciate more than 15% over a 12-month period
Hold appreciate up to 15% over a 12-month period
Reduce depreciate more than 5% over a 12-month period
Rating Expected to
One year price chart
50
70
90
110
130
150
Aug-
16
Sep-
16
Oct
-16
Nov-
16
Dec-
16
Jan-
17
Feb-
17
Mar
-17
Apr-
17
May
-17
Jun-
17
Jul-1
7
Aug-
17
(INR)
SpiceJet

Aviation
20 Edelweiss Securities Limited
DISCLAIMER
Edelweiss Securities Limited (“ESL” or “Research Entity”) is regulated by the Securities and Exchange Board of India (“SEBI”) and is licensed to carry on the business of broking, depository services and related activities. The business of ESL and its Associates (list available on www.edelweissfin.com) are organized around five broad business groups – Credit including Housing and SME Finance, Commodities, Financial Markets, Asset Management and Life Insurance.
This Report has been prepared by Edelweiss Securities Limited in the capacity of a Research Analyst having SEBI Registration No.INH200000121 and distributed as per SEBI (Research Analysts) Regulations 2014. This report does not constitute an offer or solicitation for the purchase or sale of any financial instrument or as an official confirmation of any transaction. Securities as defined in clause (h) of section 2 of the Securities Contracts (Regulation) Act, 1956 includes Financial Instruments and Currency Derivatives. The information contained herein is from publicly available data or other sources believed to be reliable. This report is provided for assistance only and is not intended to be and must not alone be taken as the basis for an investment decision. The user assumes the entire risk of any use made of this information. Each recipient of this report should make such investigation as it deems necessary to arrive at an independent evaluation of an investment in Securities referred to in this document (including the merits and risks involved), and should consult his own advisors to determine the merits and risks of such investment. The investment discussed or views expressed may not be suitable for all investors.
This information is strictly confidential and is being furnished to you solely for your information. This information should not be reproduced or redistributed or passed on directly or indirectly in any form to any other person or published, copied, in whole or in part, for any purpose. This report is not directed or intended for distribution to, or use by, any person or entity who is a citizen or resident of or located in any locality, state, country or other jurisdiction, where such distribution, publication, availability or use would be contrary to law, regulation or which would subject ESL and associates / group companies to any registration or licensing requirements within such jurisdiction. The distribution of this report in certain jurisdictions may be restricted by law, and persons in whose possession this report comes, should observe, any such restrictions. The information given in this report is as of the date of this report and there can be no assurance that future results or events will be consistent with this information. This information is subject to change without any prior notice. ESL reserves the right to make modifications and alterations to this statement as may be required from time to time. ESL or any of its associates / group companies shall not be in any way responsible for any loss or damage that may arise to any person from any inadvertent error in the information contained in this report. ESL is committed to providing independent and transparent recommendation to its clients. Neither ESL nor any of its associates, group companies, directors, employees, agents or representatives shall be liable for any damages whether direct, indirect, special or consequential including loss of revenue or lost profits that may arise from or in connection with the use of the information. Our proprietary trading and investment businesses may make investment decisions that are inconsistent with the recommendations expressed herein. Past performance is not necessarily a guide to future performance .The disclosures of interest statements incorporated in this report are provided solely to enhance the transparency and should not be treated as endorsement of the views expressed in the report. The information provided in these reports remains, unless otherwise stated, the copyright of ESL. All layout, design, original artwork, concepts and other Intellectual Properties, remains the property and copyright of ESL and may not be used in any form or for any purpose whatsoever by any party without the express written permission of the copyright holders.
ESL shall not be liable for any delay or any other interruption which may occur in presenting the data due to any reason including network (Internet) reasons or snags in the system, break down of the system or any other equipment, server breakdown, maintenance shutdown, breakdown of communication services or inability of the ESL to present the data. In no event shall ESL be liable for any damages, including without limitation direct or indirect, special, incidental, or consequential damages, losses or expenses arising in connection with the data presented by the ESL through this report.
We offer our research services to clients as well as our prospects. Though this report is disseminated to all the customers simultaneously, not all customers may receive this report at the same time. We will not treat recipients as customers by virtue of their receiving this report.
ESL and its associates, officer, directors, and employees, research analyst (including relatives) worldwide may: (a) from time to time, have long or short positions in, and buy or sell the Securities, mentioned herein or (b) be engaged in any other transaction involving such Securities and earn brokerage or other compensation or act as a market maker in the financial instruments of the subject company/company(ies) discussed herein or act as advisor or lender/borrower to such company(ies) or have other potential/material conflict of interest with respect to any recommendation and related information and opinions at the time of publication of research report or at the time of public appearance. ESL may have proprietary long/short position in the above mentioned scrip(s) and therefore should be considered as interested. The views provided herein are general in nature and do not consider risk appetite or investment objective of any particular investor; readers are requested to take independent professional advice before investing. This should not be construed as invitation or solicitation to do business with ESL.

SpiceJet
21 Edelweiss Securities Limited
ESL or its associates may have received compensation from the subject company in the past 12 months. ESL or its associates may have managed or co-managed public offering of securities for the subject company in the past 12 months. ESL or its associates may have received compensation for investment banking or merchant banking or brokerage services from the subject company in the past 12 months. ESL or its associates may have received any compensation for products or services other than investment banking or merchant banking or brokerage services from the subject company in the past 12 months. ESL or its associates have not received any compensation or other benefits from the Subject Company or third party in connection with the research report. Research analyst or his/her relative or ESL’s associates may have financial interest in the subject company. ESL and/or its Group Companies, their Directors, affiliates and/or employees may have interests/ positions, financial or otherwise in the Securities/Currencies and other investment products mentioned in this report. ESL, its associates, research analyst and his/her relative may have other potential/material conflict of interest with respect to any recommendation and related information and opinions at the time of publication of research report or at the time of public appearance.
Participants in foreign exchange transactions may incur risks arising from several factors, including the following: ( i) exchange rates can be volatile and are subject to large fluctuations; ( ii) the value of currencies may be affected by numerous market factors, including world and national economic, political and regulatory events, events in equity and debt markets and changes in interest rates; and (iii) currencies may be subject to devaluation or government imposed exchange controls which could affect the value of the currency. Investors in securities such as ADRs and Currency Derivatives, whose values are affected by the currency of an underlying security, effectively assume currency risk.
Research analyst has served as an officer, director or employee of subject Company: No
ESL has financial interest in the subject companies: No
ESL’s Associates may have actual / beneficial ownership of 1% or more securities of the subject company at the end of the month immediately preceding the date of publication of research report.
Research analyst or his/her relative has actual/beneficial ownership of 1% or more securities of the subject company at the end of the month immediately preceding the date of publication of research report: No
ESL has actual/beneficial ownership of 1% or more securities of the subject company at the end of the month immediately preceding the date of publication of research report: No
Subject company may have been client during twelve months preceding the date of distribution of the research report.
There were no instances of non-compliance by ESL on any matter related to the capital markets, resulting in significant and material disciplinary action during the last three years except that ESL had submitted an offer of settlement with Securities and Exchange commission, USA (SEC) and the same has been accepted by SEC without admitting or denying the findings in relation to their charges of non registration as a broker dealer.
A graph of daily closing prices of the securities is also available at www.nseindia.com
Analyst Certification:
The analyst for this report certifies that all of the views expressed in this report accurately reflect his or her personal views about the subject company or companies and its or their securities, and no part of his or her compensation was, is or will be, directly or indirectly related to specific recommendations or views expressed in this report.
Additional Disclaimers
Disclaimer for U.S. Persons This research report is a product of Edelweiss Securities Limited, which is the employer of the research analyst(s) who has prepared the research report. The research analyst(s) preparing the research report is/are resident outside the United States (U.S.) and are not associated persons of any U.S. regulated broker-dealer and therefore the analyst(s) is/are not subject to supervision by a U.S. broker-dealer, and is/are not required to satisfy the regulatory licensing requirements of FINRA or required to otherwise comply with U.S. rules or regulations regarding, among other things, communications with a subject company, public appearances and trading securities held by a research analyst account.
This report is intended for distribution by Edelweiss Securities Limited only to "Major Institutional Investors" as defined by Rule 15a-6(b)(4) of the U.S. Securities and Exchange Act, 1934 (the Exchange Act) and interpretations thereof by U.S. Securities and Exchange Commission (SEC) in reliance on Rule 15a 6(a)(2). If the recipient of this report is not a Major Institutional Investor as specified above, then it should not act upon this report and return the same to the sender. Further, this report may not be copied, duplicated and/or transmitted onward to any U.S. person, which is not the Major Institutional Investor.
Aviation
22 Edelweiss Securities Limited
Access the entire repository of Edelweiss Research on www.edelresearch.com
In reliance on the exemption from registration provided by Rule 15a-6 of the Exchange Act and interpretations thereof by the SEC in order to conduct certain business with Major Institutional Investors, Edelweiss Securities Limited has entered into an agreement with a U.S. registered broker-dealer, Edelweiss Financial Services Inc. ("EFSI"). Transactions in securities discussed in this research report should be effected through Edelweiss Financial Services Inc. Disclaimer for U.K. Persons
The contents of this research report have not been approved by an authorised person within the meaning of the Financial Services and Markets Act 2000 ("FSMA"). In the United Kingdom, this research report is being distributed only to and is directed only at (a) persons who have professional experience in matters relating to investments falling within Article 19(5) of the FSMA (Financial Promotion) Order 2005 (the “Order”); (b) persons falling within Article 49(2)(a) to (d) of the Order (including high net worth companies and unincorporated associations); and (c) any other persons to whom it may otherwise lawfully be communicated (all such persons together being referred to as “relevant persons”). This research report must not be acted on or relied on by persons who are not relevant persons. Any investment or investment activity to which this research report relates is available only to relevant persons and will be engaged in only with relevant persons. Any person who is not a relevant person should not act or rely on this research report or any of its contents. This research report must not be distributed, published, reproduced or disclosed (in whole or in part) by recipients to any other person. Disclaimer for Canadian Persons
This research report is a product of Edelweiss Securities Limited ("ESL"), which is the employer of the research analysts who have prepared the research report. The research analysts preparing the research report are resident outside the Canada and are not associated persons of any Canadian registered adviser and/or dealer and, therefore, the analysts are not subject to supervision by a Canadian registered adviser and/or dealer, and are not required to satisfy the regulatory licensing requirements of the Ontario Securities Commission, other Canadian provincial securities regulators, the Investment Industry Regulatory Organization of Canada and are not required to otherwise comply with Canadian rules or regulations regarding, among other things, the research analysts' business or relationship with a subject company or trading of securities by a research analyst. This report is intended for distribution by ESL only to "Permitted Clients" (as defined in National Instrument 31-103 ("NI 31-103")) who are resident in the Province of Ontario, Canada (an "Ontario Permitted Client"). If the recipient of this report is not an Ontario Permitted Client, as specified above, then the recipient should not act upon this report and should return the report to the sender. Further, this report may not be copied, duplicated and/or transmitted onward to any Canadian person. ESL is relying on an exemption from the adviser and/or dealer registration requirements under NI 31-103 available to certain international advisers and/or dealers. Please be advised that (i) ESL is not registered in the Province of Ontario to trade in securities nor is it registered in the Province of Ontario to provide advice with respect to securities; (ii) ESL's head office or principal place of business is located in India; (iii) all or substantially all of ESL's assets may be situated outside of Canada; (iv) there may be difficulty enforcing legal rights against ESL because of the above; and (v) the name and address of the ESL's agent for service of process in the Province of Ontario is: Bamac Services Inc., 181 Bay Street, Suite 2100, Toronto, Ontario M5J 2T3 Canada. Disclaimer for Singapore Persons
In Singapore, this report is being distributed by Edelweiss Investment Advisors Private Limited ("EIAPL") (Co. Reg. No. 201016306H) which is a holder of a capital markets services license and an exempt financial adviser in Singapore and (ii) solely to persons who qualify as "institutional investors" or "accredited investors" as defined in section 4A(1) of the Securities and Futures Act, Chapter 289 of Singapore ("the SFA"). Pursuant to regulations 33, 34, 35 and 36 of the Financial Advisers Regulations ("FAR"), sections 25, 27 and 36 of the Financial Advisers Act, Chapter 110 of Singapore shall not apply to EIAPL when providing any financial advisory services to an accredited investor (as defined in regulation 36 of the FAR. Persons in Singapore should contact EIAPL in respect of any matter arising from, or in connection with this publication/communication. This report is not suitable for private investors.
Copyright 2009 Edelweiss Research (Edelweiss Securities Ltd). All rights reserved