visual analysis of malware behavior using treemaps and ...cavazos/cisc850-spring2017/papers/... ·...
TRANSCRIPT

Visual Analysis of Malware Behavior Using Treemaps and Thread GraphsPhilipp Trinius∗ Thorsten Holz† Jan Gobel‡ Felix C. Freiling§
Laboratory for Dependable Distributed Systems, University of Mannheim, Germany
ABSTRACT
We study techniques to visualize the behavior of malicious software(malware). Our aim is to help human analysts to quickly assess andclassify the nature of a new malware sample. Our techniques arebased on a parametrized abstraction of detailed behavioral reportsautomatically generated by sandbox environments. We then exploretwo visualization techniques: treemaps and thread graphs. We ar-gue that both techniques can effectively support a human analyst(a) in detecting maliciousness of software, and (b) in classifyingmalicious behavior.
Keywords: Invasive Software, Information Visualization, Behav-ior Analysis
1 INTRODUCTION
The field of malicious software (malware), to which worms, botsand other unpleasant artifacts belong, is one of the most active andalso one of the most threatening areas of computer security. In re-cent years, we are observing a huge increase in the number of mal-ware samples collected by anti-virus vendors [10]. Therefore, itis mandatory that we develop tools and techniques to analyze newmalware samples with no (or only limited) human interaction.
Analyzing malware is a non-trivial task since attackers use codeobfuscation techniques like binary packers, encryption, or self-modifying code to evade analysis. The approaches that have beendeveloped to analyze a given sample can typically be classified toperform either static or dynamic analysis. In static analysis the codeof the sample is examined, for example by disassembling or decom-piling the binary file. The main advantage of this approach is thatwe can obtain a complete overview of what a given software does.However, static analysis is usually cumbersome and time consum-ing since many techniques to evade static analysis have been de-veloped. For example, an attacker can use self-modifying code,obfuscate the code [3], or use different techniques to prohibit staticdisassembly [7]. In general, static analysis has therefore many lim-itations [5]. Furthermore, static analysis does not allow a high de-gree of automation during analysis.
An alternative to static analysis is dynamic analysis. In dynamicmalware analysis, the behavior of malware is analyzed, for exam-ple, by executing it within a debugger. One of the most promisingapproaches to the dynamic analysis of malware consists of sand-box solutions of which several ones have been developed in re-cent years [1, 6, 11]. A sandbox executes a malware sample in acontrolled environment and records all system-level behavior suchas modifications of the filesystem or the registry. As a result, thesandbox generates an analysis report summarizing the observed be-havior of the sample. In contrast to static analysis, sandbox-baseddynamic analysis can be automated to a high degree.
∗contact author, e-mail: [email protected]†e-mail: [email protected]‡e-mail: [email protected]§e-mail: [email protected]
Sandbox reports, often consisting of several hundred entries,usually offer a level of detail that allows careful analysis but over-whelm a human analysts who is interested only in a quick assess-ment of a particular sample. Given the fact that many samples arejust small variants of a well-known malware family, there is a clearneed to make the behavior of malware samples more and easier ac-cessible to a human analyst. In this paper, we explore a combinationof abstraction and visualization to do exactly this.
Contributions. We first present a parametrized method to ab-stract sandbox reports into increasingly simple summaries. Thenwe use classical techniques to visualize the resulting reports andmake them accessible to the human reader. We argue that the com-bination of both techniques offers unique insights into the mainfeatures of malware such that humans are effectively supported indetection malicious behavior when it occurs. Furthermore, we ar-gue that the visual representation allows an analyst to rapidly clas-sify the behavior of new malware samples if it belongs to one ofthe large and well-known families of malware families currentlyspreading in the wild.
We use two visualization techniques: treemapping and threadgraphs. Treemapping [8, 9] displays the distribution of the indi-vidual operations performed by a sample. The resulting treemappresents this information as a set of nested rectangles and providesa quick overview of the main overall behavior of the sample, e.g.,whether the main task of the sample lies in the area of network in-teraction, changes to the file system, or interaction with other pro-cesses. Since tree maps display nothing about the sequence of oper-ations, we use thread graphs to visualize the temporal behavior ofthe individual threads of a sample. A thread graph can be regardedas a behavioral fingerprint of the sample. An analyst can then studythis behavior graph to quickly learn more about the actions of eachindividual thread.
We demonstrate the practical feasibility of our approach by per-forming several case studies. First, by analyzing four different mal-ware classes, we show that our methods can actually be used tofind samples belonging to the same family of malware. Second, weshow how our techniques can also be used to detect malicious ac-tivity by analyzing several malicious data files as for example PDFfiles that exploit a vulnerability in Acrobat Reader.
Related Work. The work by Xia et al. [12] on visual analysisof program flow data shares with our work the goal to visualizethe behavior of a given malware sample. While Xia et al. focuson data propagation and taint tracking, we use a simple abstractiontechnique to visually summarize the observed behavior for a humananalyst. Our thread graphs are similar to the visualization of Xia etal., but contain more information on the actual behavior of eachthread. We are not aware of any work which has used treemappingto visualize the behavioral information.
Different techniques to support reverse engineering of binary anddata files with visualization were introduced by Conti et al. [2].Similar to our system, the goal is to support a human analyst, how-ever Conti et al. use static analysis techniques. Since malware iscommonly packed using an executable packer, the distribution ofthe individual bytes is very similar and structural information islost. When dealing with malware, the techniques of byteview andbyte presence visualization of Conti et al. cannot be easily applied.
33
6th International Workshop on Visualization for Cyber Security 200911 October, Atlantic City, New Jersey, USA978-1-4244-5415-0/09/$25.00 ©2009 IEEE

Roadmap. This paper is structured as follows: Section 2 pro-vides an overview of system. Section 3 describes our approach tovisualize the behavior of a malicious sample based on parametrizedabstractions. We discuss a detailed malware visualization examplein Section 4, present the technique of visual malware clustering inSection 5 and show how non-executable files can be visualized inSection 6. We conclude the paper in Section 7 with a summary andideas for future work.
2 SYSTEM DESIGN
Figure 1 provides a schematic overview of our system. We use alarge database of malware samples collected using honeypots. Toanalyze these samples, we first execute them in a controlled, instru-mented environment (sandbox) and observe their behavior duringruntime. In the second step, we visualize the collected informationusing different techniques. As an output, our technique generatesdifferent visualizations of the sample’s behavior, which enable ahuman analyst to get a quick overview of what a given malwaresample does.
Figure 1: Overview of malware behavior visualization system
The advantage of dynamic analysis is it partly circumvents theproblems of code obfuscation techniques like packers or crypters.Since the software knows how to unpack itself, we can simplyexecute it, let the sample unpack/decrypt, and then we can studyits behavior. Furthermore, this approach can be automated to ahigh degree. In our case, we opted for sandbox solutions to per-form dynamic analysis. During execution, the sandbox observesthe system-level changes at runtime, e.g., changes to the filesystemor the Windows registry, or network packets sent and received. Theresulting output of a sandbox is a behavior report which summa-rizes the observed activity.
In our system we use behavior-based malware analysis based onCWSandbox [11]. We execute the sample we want to analyze fortwo minutes in the CWSandbox environment and let the tool recordall system-level activity. The result of the analysis phase is a re-port in XML format containing information about the observed be-havior for each thread: it includes for example information aboutall loaded system libraries, outgoing and incoming network con-nections, accessed or manipulated registry keys, and many moreevents. With our CWSandbox installation we generate between2,500 and 4,000 such reports on a typical day. We thus obtain alarge number of fine-granular reports detailing the actions of eachthread executed by the sample.
Note that behavior-based analysis enables us to analyze both ex-ecutable and data files. Data files (like word processor documents)can be “indirectly” analyzed by opening them in its associated ap-plication and then observing the behavior of the application. Forexample, we can analyze a given PDF file by opening it with Ac-robat Reader and then analyzing the behavior of this program. Weshow later that this can be used to detect data files behaving in ananomalous way.
3 ABSTRACTION-BASED VISUALIZATION
Each sandbox report is usually rather long (i.e., typically severalthousand bytes in XML format) since CWSandbox analyzes many
API functions and logs all associated activity. For an effective vi-sualization it is necessary to condense or abstract information inthese reports. Therefore we transform a given XML report gener-ated by CWSandbox to a shorter and better display format: we mapeach API call to a specific section that groups API calls with simi-lar functionality together. For example, all API calls related to filesystem activity belong to one section. Furthermore, we order thearguments of each API call according to their relevance, i.e., moresignificant arguments are placed first and less significant argumentsare completely omitted.
3.1 Abstraction Levels
Using this idea, there are four different and novel abstraction levelsat which sandbox reports can be generated:
• To obtain a coarse overview of what a process is doing, wejust display the individual sections of a process, e.g., the merefact whether a sample accessed the registry or not. This istermed level 1 abstraction.
• Level 2 abstraction extends level 1 by also showing the namesof the API calls executed in each section.
• Level 3 abstraction extends level 2 by adding also informationabout the most significant argument of each API call.
• Level 4 abstraction takes even more arguments into the displayformat, adding further details.
We show below that especially level 2 and 3 abstraction are use-ful when visualizing malware behavior.
3.2 Visualization
We implemented two different approaches for visualizing the be-havior reports which both help a human analyst to quickly under-stand which actions a given sample performs: a treemap provides asummarized overview of the actions performed by a malware sam-ple and their frequency, while a thread graph visualizes the behav-ior of the individual threads of a process.
3.2.1 Treemap
In the first visualization approach, we use the technique of treemap-ping to transform the behavior report into a standardized format. Atreemap displays information as a set of nested rectangles and weneed to define a tiling algorithm to specify the construction of thetreemap: The width of each rectangle is proportional to the percent-age of API calls from the behavior report belonging to this section,i.e., if more API calls belong to a specific section, then the accord-ing rectangle is wider. We also split each rectangle according tothe operation of this API call to obtain another dimension withinthe treemap. Overall we observe over 120 distinct API calls out of20 sections. Within the treemaps the individual sections are plottedin a fix order and color. The leftmost red colored section for in-stance is the so called com section which consists of three APIcalls. Next is the dll handling section which is plotted inblue color tones. Since some reports do not posses API calls ofall sections, the corresponding treemaps do not show all sectionsas well. To interpret the information that is encoded within thetreemaps, both the position and the color has to be considered. Anexample treemap of a malware labeled as Adultbrowser is shown inFigure 2. We can see that two sections are significantly wider thanthe remaining sections, indicating that this sample performs somespecific operations rather frequently. The height of the rectanglesfor a given section also visualizes the frequency of an operationwithin this section.
34

Figure 2: Graphical representation of Adultbrowser malware using atreemap
3.2.2 Thread Graph
Our second approach is the visualization of the actual chronologi-cal behavior of a given sample. We generate a graph representingthe temporal order of executed system commands and the differ-ent threads spawned by a binary. The x-axis represents the time(sequence of performed actions), while the y-axis indicates the op-eration/section of the performed action. Based on this construction,we called this visualization a thread graph.
Since a thread may consist of thousands of operations, a thresh-old is necessary to achieve a clear representation and to have a con-sistent visualization. Therefore, a thread graph only shows a certainmaximum number of operations per thread. In our experiments athreshold of 550 operations has proven to be a good tradeoff be-tween accuracy and clarity.
Figure 3 shows the same Adultbrowser malware sample as dis-played previously, this time using the thread graph representation.We see that one thread is responsible for the majority of opera-tions for this sample. This thread performs many registry operationsand initially performs many network- and system-related operations(operations 90-140). Additionally, two more threads are spawned,but they perform only a limited amount of operations during theanalysis phase.
These thread graphs, depending on the duration of the executiontime of the malware sample in a sandbox, represent the unique be-havior for a certain family of malware. This means that any othersample that generates the exact same (or at least a very closely re-lated) graphical representation of its behavior can be considered tobe related to the previously determined type of malware. We showexamples for this relationship in the next section based on severalcase studies.
4 EXAMPLE VISUALIZATION OF HOOKSHELL
We now discuss a single selected malware-sample andits visualization in detail. The file with the MD5 hasha9f6aa1649e6a0f1bfad8a576f0193a0 was analyzed April 29,2009 and was classified as Hookshell malware by severalanti-virus engines, e.g., Antivir, SecureWeb-Gateway and Sunbelt.The CWSandbox report is quite small and consists of only 379lines describing the malware’s behavior.
Figure 3: Graphical representation of Adultbrowser malware using athread graph
Figure 4 shows the treemap generated from the CWSandbox re-port. The image clearly shows that the malware executes API callsfrom six different sections. From left to right these are the dllhandling section, the filesystem section, the inifile section, the registry section, the processsection, and the system info section. The horizontalsubdivision of all sections show that at least two different opera-tions per section were executed.
Figure 4: Treemap of one Hookshell malware sample
For a detailed analysis of the malware behavior we have to con-sider the thread graphs displayed in Figures 5 and 6. The level 1thread graph shows that the malware executes operations from sixsections. Each thread can be identified together with the operationsit performs. From the thread graph it is possible to determine fourdistinct threads running different API calls. Two threads executeexactly the same sequence of API calls, therefore their representa-tion color turned black 1. To circumvent this overlay of two or morethreads, the graph could be split up into one graph per thread.
By taking a closer look at the single threads (level 2, displayed inFigure 6), we can still extract detailed information about the mal-ware’s operations. All threads initially load a set of libraries, ex-plained by the straight black line at the beginning. The red colored
1The different colors sum up to black.
35
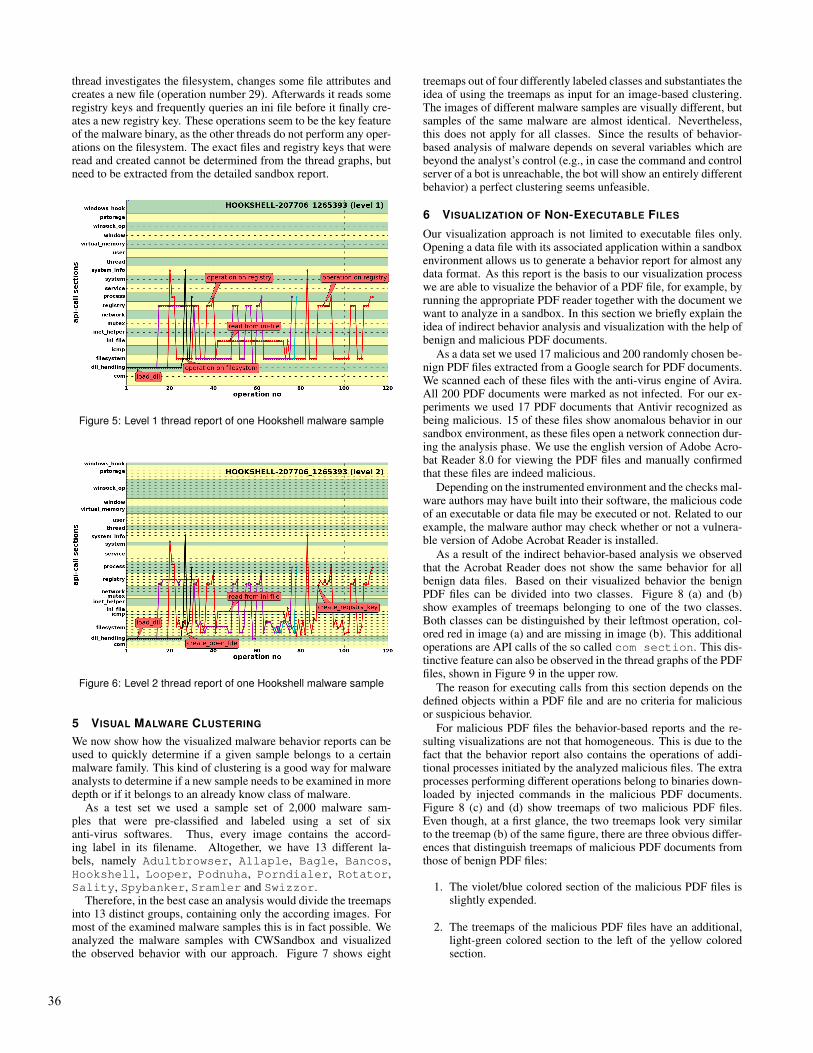
thread investigates the filesystem, changes some file attributes andcreates a new file (operation number 29). Afterwards it reads someregistry keys and frequently queries an ini file before it finally cre-ates a new registry key. These operations seem to be the key featureof the malware binary, as the other threads do not perform any oper-ations on the filesystem. The exact files and registry keys that wereread and created cannot be determined from the thread graphs, butneed to be extracted from the detailed sandbox report.
Figure 5: Level 1 thread report of one Hookshell malware sample
Figure 6: Level 2 thread report of one Hookshell malware sample
5 VISUAL MALWARE CLUSTERING
We now show how the visualized malware behavior reports can beused to quickly determine if a given sample belongs to a certainmalware family. This kind of clustering is a good way for malwareanalysts to determine if a new sample needs to be examined in moredepth or if it belongs to an already know class of malware.
As a test set we used a sample set of 2,000 malware sam-ples that were pre-classified and labeled using a set of sixanti-virus softwares. Thus, every image contains the accord-ing label in its filename. Altogether, we have 13 different la-bels, namely Adultbrowser, Allaple, Bagle, Bancos,Hookshell, Looper, Podnuha, Porndialer, Rotator,Sality, Spybanker, Sramler and Swizzor.
Therefore, in the best case an analysis would divide the treemapsinto 13 distinct groups, containing only the according images. Formost of the examined malware samples this is in fact possible. Weanalyzed the malware samples with CWSandbox and visualizedthe observed behavior with our approach. Figure 7 shows eight
treemaps out of four differently labeled classes and substantiates theidea of using the treemaps as input for an image-based clustering.The images of different malware samples are visually different, butsamples of the same malware are almost identical. Nevertheless,this does not apply for all classes. Since the results of behavior-based analysis of malware depends on several variables which arebeyond the analyst’s control (e.g., in case the command and controlserver of a bot is unreachable, the bot will show an entirely differentbehavior) a perfect clustering seems unfeasible.
6 VISUALIZATION OF NON-EXECUTABLE FILES
Our visualization approach is not limited to executable files only.Opening a data file with its associated application within a sandboxenvironment allows us to generate a behavior report for almost anydata format. As this report is the basis to our visualization processwe are able to visualize the behavior of a PDF file, for example, byrunning the appropriate PDF reader together with the document wewant to analyze in a sandbox. In this section we briefly explain theidea of indirect behavior analysis and visualization with the help ofbenign and malicious PDF documents.
As a data set we used 17 malicious and 200 randomly chosen be-nign PDF files extracted from a Google search for PDF documents.We scanned each of these files with the anti-virus engine of Avira.All 200 PDF documents were marked as not infected. For our ex-periments we used 17 PDF documents that Antivir recognized asbeing malicious. 15 of these files show anomalous behavior in oursandbox environment, as these files open a network connection dur-ing the analysis phase. We use the english version of Adobe Acro-bat Reader 8.0 for viewing the PDF files and manually confirmedthat these files are indeed malicious.
Depending on the instrumented environment and the checks mal-ware authors may have built into their software, the malicious codeof an executable or data file may be executed or not. Related to ourexample, the malware author may check whether or not a vulnera-ble version of Adobe Acrobat Reader is installed.
As a result of the indirect behavior-based analysis we observedthat the Acrobat Reader does not show the same behavior for allbenign data files. Based on their visualized behavior the benignPDF files can be divided into two classes. Figure 8 (a) and (b)show examples of treemaps belonging to one of the two classes.Both classes can be distinguished by their leftmost operation, col-ored red in image (a) and are missing in image (b). This additionaloperations are API calls of the so called com section. This dis-tinctive feature can also be observed in the thread graphs of the PDFfiles, shown in Figure 9 in the upper row.
The reason for executing calls from this section depends on thedefined objects within a PDF file and are no criteria for maliciousor suspicious behavior.
For malicious PDF files the behavior-based reports and the re-sulting visualizations are not that homogeneous. This is due to thefact that the behavior report also contains the operations of addi-tional processes initiated by the analyzed malicious files. The extraprocesses performing different operations belong to binaries down-loaded by injected commands in the malicious PDF documents.Figure 8 (c) and (d) show treemaps of two malicious PDF files.Even though, at a first glance, the two treemaps look very similarto the treemap (b) of the same figure, there are three obvious differ-ences that distinguish treemaps of malicious PDF documents fromthose of benign PDF files:
1. The violet/blue colored section of the malicious PDF files isslightly expended.
2. The treemaps of the malicious PDF files have an additional,light-green colored section to the left of the yellow coloredsection.
36

Figure 7: Selection of treemaps out of four different malware classes
Figure 8: (a)-(b) treemaps of benign PDF files. (c)-(d) treemaps of malicious PDF files.
3. Only the treemaps of the malicious PDF documents have amentionable wide section on the right of the yellow coloredsection.
As a result we are able to distinguish between benign andmalicious PDF documents just by comparing the correspondingtreemaps. In the following we will describe the API calls whichare responsible for these differences and show why it is possible touse them as a basis for decision-making.
The violet/blue colored section in the treemaps corresponds tothe dll handling section. This section contains the threeAPI calls load image load dll and get proc address.Dynamic Link Libraries (DLLs) are files that provide helpful func-tions to a calling program. As every Microsoft Windows basedsoftware loads a few of those libraries at every startup, this sectionis shown in every treemap. The size of this section is determinedby the number of DLLs loaded. This behavior is also visible inthe thread graphs, as shown in Figure 9. With benign PDF threadgraphs there is a single red colored line indicating the loading ofDLL files. The thread graph of the malicious files shows a secondgreen colored line – another thread – loading significantly more li-braries. The loading of several more libraries can be used as a basis
for decision-making, as the number of needed DLLs depends on theapplication only and not on the document that is opened.
Next we take a look at the light-green colored section to the leftof the yellow section. This section corresponds to the so calledvirtual memory section of a CWSandbox report whichcontains all API calls needed to allocate, read and write to virtualmemory. The malicious PDF documents need this additional mem-ory to save variables and code, generally exploit-related code. Asbenign PDF files run within the Acrobat Reader, they do not needthis kind of memory allocation.
The third discriminative feature is the additional section to theright of the yellow colored section. Although this part is hardto spot, this additional section is the most important in distin-guishing a benign PDF from a malicious one. It is the so calledwinsock operation section that contains all network re-lated API calls. Considering the thread graphs of Figure 9 (c) and(d) there are two additional threads – the violet and the yellow col-ored ones – which execute operations belonging to this section.These are the operations to download malware to the exploited sys-tem. A PDF document that initiates network connections to down-load additional software can truly be identified as being malicious.
37

Figure 9: Upper row (a)-(b): Level1 thread graphs of two benign pdf. Lower row (c)-(d): Level1 thread graphs of two malicious pdf.
7 CONCLUSION AND FUTURE WORK
In this paper, we presented two abstraction-based visualizations ofmalware behavior. In our work on malware analysis we have foundthese visualizations very helpful. We are interested in getting feed-back of other analysts to enhance the representation. Although weextensively use CWSandbox, our visualization approach is inde-pendent of a particular sandbox solution.
The problem with the behavior-based approach is that we onlysee one execution path of a binary and thus may miss importantfunctionality during the analysis process. With multipath executionanalysis [4], this limitation can be overcome to a certain extend.Nevertheless, this drawback of dynamic analysis has to be consid-ered. Another drawback of behavior-based analysis is the fact thatthe analyzed binary can detect the presence of the analysis environ-ment and then behave differently.
Possible extensions of our work could be some kind of zoom-functionality, which allows an analyst to zoom in and out of atreemap. Starting with global treemaps, like the ones we presentin this paper, the information could be enriched with every zoomfactor. Thus an analyst could investigate unusually looking parts ofthe analysis report in detail.
An interesting line of future work is to study existing image clus-tering and classification algorithms and compare the results of thesealgorithms on our database with the labeling of anti virus vendorsor clusterings which are based on the full behavior reports. Further-more, since the visual classification is much faster than a classifica-tion based on the detailed reports visual classification could be usedas preprocessing or even prediction for a precise classification.
Acknowledgments. This work has been supported by the Bundesamtfur Sicherheit in der Informationstechnik (BSI).
REFERENCES
[1] U. Bayer. Anubis: Analyzing Unknown Binaries. http://
analysis.seclab.tuwien.ac.at/.[2] Gregory Conti, Erik Dean, Matthew Sinda, and Benjamin Sangster.
Visual Reverse Engineering of Binary and Data Files. In Workshop onVisualization for Cyber Security (VizSec), 2008.
[3] Cullen Linn and Saumya Debray. Obfuscation of Executable Codeto Improve Resistance to Static Disassembly. In ACM Conference onComputer and Communications Security (CCS), 2003.
[4] Andreas Moser, Christopher Kruegel, and Engin Kirda. ExploringMultiple Execution Paths for Malware Analysis. In IEEE Symposiumon Security and Privacy, 2007.
[5] Andreas Moser, Christopher Kruegel, and Engin Kirda. Limits ofStatic Analysis for Malware Detection. In Annual Computer SecurityApplications Conference (ACSAC), 2007.
[6] Norman ASA. Norman SandBox. http://sandbox.norman.no/.[7] Igor V. Popov, Saumya K. Debray, and Gregory R. Andrews. Binary
obfuscation using signals. In USENIX Security Symposium, 2007.[8] Ben Shneiderman. Treemaps for space-constrained visualiza-
tion of hierarchies. Internet: http://www.cs.umd.edu/hcil/
treemap-history/.[9] Ben Shneiderman. Tree Visualization With Tree-Maps: 2-D Space-
Filling Approach. ACM Trans. Graph., 11(1), 1992.[10] Symantec. Internet Security Threat Report Volume XIV. Internet:
http://www.symantec.com/business/theme.jsp?themeid=
threatreport, April 2009.[11] Carsten Willems, Thorsten Holz, and Felix Freiling. CWSandbox:
Towards automated dynamic binary analysis. IEEE Security and Pri-vacy, 5(2), March 2007.
[12] Ying Xia, Kevin Fairbanks, and Henry Owen. Visual Analysis of Pro-gram Flow Data with Data Propagation. In Workshop on Visualizationfor Cyber Security (VizSec), 2008.
38