visual and cognitive demands of carplay, android auto, and
TRANSCRIPT

Objective: The present research compared and contrasted the workload associated with using in-vehicle information systems commonly available in five different automotive original equipment manufacturers (OEMs) with that of CarPlay and Android Auto when used in the same vehicles.
Background: A growing trend is to provide access to portable smartphone-based systems (e.g., CarPlay and Android Auto) that support an expansion of various in-vehicle infotainment system features and functions.
Method/Results: The study involved on-road test-ing of 24 participants in each configuration of five vehicles crossed with the three different infotainment systems: the embedded portion of the native OEM systems, CarPlay, and Android Auto. Our analysis found that workload was significantly greater for the embedded portion of the native OEM systems than for CarPlay and Android Auto. The strengths and weaknesses of each CarPlay and Android Auto traded off in such a way that the overall demand associated with using the two systems did not differ.
Conclusion: CarPlay and Android Auto provided more functionality and resulted in lower levels of work-load than the embedded portion of the native OEM info-tainment systems.
Application: Potential applications of this research include refinements to CarPlay and Android Auto to address variations in workload as a function of task type, the modality of interaction, and OEM implementation of the system.
Keywords: driver distraction, workload, in-vehicle info-tainment systems, android auto, carplay
Driver distraction arises from a combination of sources (Ranney, Garrott, & Goodman, 2000; Strayer, Watson, & Drews, 2011). Impairments to driving can be caused by competition for visual information processing, such as when drivers take their eyes off the road to perform a task. Impairments can also come from manual interference, as in cases where drivers take their hands off the steering wheel to perform an operation. Finally, cognitive sources of distrac-tion occur when attention is withdrawn from the processing of information necessary for the safe operation of a motor vehicle. These sources of distraction can operate independently, but they are not mutually exclusive, and therefore, different tasks can result in impairments from one or more of these sources. Moreover, few if any tasks are “process pure” (Jacoby, 1991) and instead often place demands on multiple resources (Wickens, 2008).
Many In-Vehicle Information Systems (IVIS), also known as infotainment systems, involve complex and multimodal interactions to perform a task. For example, to select a particular music track, a driver might push a button on the steer-ing wheel, issue a voice-based command, view options presented on a display located in the center stack, and then manually select the desired track by using the touch screen. Com-plex multimodal IVIS interactions such as this may distract motorists from the primary task of driving by diverting the eyes, hands, and/or mind from the roadway (Regan, Hallett, & Gor-don, 2011; Regan & Strayer, 2014).
Prior research has shown that workload expe-rienced by drivers systematically varies as a function of the different tasks, modes of interac-tion, and system (vehicles; see also Angell et al.,
836575 HFSXXX10.1177/0018720819836575Human FactorsVisual and Cognitive Demandsresearch-article2019
Address correspondence to David L. Strayer, Department of Psychology, The University of Utah, 380 S. 1530 E. RM 502, Salt Lake City, UT 84112, USA; e-mail: [email protected].
Visual and Cognitive Demands of CarPlay, Android Auto, and Five Native Infotainment Systems
David L. Strayer, Joel M. Cooper, Madeleine M. McCarty, The University of Utah, Salt Lake City, USA, Douglas J. Getty, University of Pittsburgh, Pennsylvania, USA, Camille L. Wheatley, Conner J. Motzkus, The University of Utah, Salt Lake City, USA, Rachel M. Goethe, American Automobile Association, Inc., Washington, DC, USA, Francesco Biondi, University of Windsor, Ontario, Canada, and William J. Horrey, AAA Foundation for Traffic Safety, Washington, DC, USA
HUMAN FACTORSVol. XX, No. X, Month XXXX, pp. 1 –16DOI: 10.1177/0018720819836575Article reuse guidelines: sagepub.com/journals-permissionsCopyright © 2019, Human Factors and Ergonomics Society.
2 Month XXXX - Human Factors
2006; Engström, Johansson, & Östlund, 2005; Kidd, Dobres, Reagan, Mehler, & Reimer, 2017; Mehler et al., 2016; Zhang, Angell, Pala, & Shi-monomoto, 2015). In general, many of these IVIS features have been shown to be distracting to drivers and should not be enabled while the vehicle is in motion (cf. National Highway Traf-fic Safety Administration [NHTSA], 2013, p. 24832). However, a growing trend is to provide access to portable systems that support an expan-sion of various IVIS features and functions. For example, both Apple’s CarPlay® and Google’s Android Auto® are software platforms on the iPhone and Android smartphones, respectively, that allow the driver to pair their phone with a vehicle to perform many of the tasks offered by the original equipment manufacturers (OEMs) embedded infotainment systems. These systems (Apple CarPlay and Android Auto) are increas-ingly being offered by OEMs as an integrated part of their onboard infotainment systems. It is unknown how these integrated systems perform relative to the IVIS systems developed by the OEMs. The Android Auto and Apple CarPlay apps work in the following way. A smartphone running the Android Auto or Apple CarPlay app is connected to the vehicle (e.g., often by Blue-tooth). The app acts as a “master” to the infotain-ment system’s “head unit” that is located in the vehicle’s center stack—and that infotainment system “head unit” serves as an external display for the smartphone, while acting as a controller for the supported Android Auto or Apple CarPlay software in a car-specific user interface.
ExpErimEntal OvErviEwThe present study evaluated the cognitive
and visual demands, subjective workload, and task completion time for a variety of tasks using Apple CarPlay, Android Auto, and five differ-ent OEM systems. In addition, the impact of different modes of interaction (auditory vocal, center screen display) was also assessed. For all tasks and systems, the measured demand was also benchmarked against three different control conditions: a single-task baseline (driving only), a high demand N-back (representing a bench-mark for high cognitive load), and a demanding variant of the Surrogate Reference Task (SuRT; a benchmark for high visual demand). From this
design, it was possible to determine the effects of cognitive and visual demand associated with different interface systems (CarPlay, Android Auto, and the embedded portion of the native OEM systems), task types (calling and dialing, audio entertainment, navigation, and text mes-saging), and modes of interactions (auditory/vocal vs. center stack).
mEthOdparticipants
Sixty-four participants (32 female; 21–36 years, M = 25) were recruited via flyers and social media posts. All participants were native English speakers, had normal or corrected-to-normal color vision, held a valid driver’s license and proof of car insurance, and had not been the at-fault driver in an accident within the past two years. Participants were initially naïve to the specific IVIS tasks and systems but were trained until they felt comfortable performing each of the requested interactions. Following University of Utah policy, participants were required to take and pass a 20-min online defensive driving course and certification test. Compensation was prorated at $20 per hour. This research com-plied with the American Psychological Associa-tion Code of Ethics and was approved by the Institutional Review Board at the University of Utah (IRB 00052567). Informed consent was obtained from each participant.
Stimuli and apparatusVehicles and systems. Vehicles were selected
for inclusion in the study based on whether the native portion of the OEM infotainment system supported both CarPlay and Android Auto, as well as the availability of vehicles for testing. The vehicles and systems are described in Table 1.
Each vehicle was equipped with two Garmin Virb XE action cameras, one mounted under the rearview mirror to provide recordings of partici-pants’ faces, and another mounted near the pas-senger seat shoulder to provide a view of the dashboard area for infotainment interaction. Video was recorded at 30 frames per second, at 720p resolution. An iPad Mini 4 was used for the SuRT task and to administer the self-reported measures of workload.

Visual and CognitiVe demands 3
Driving route. A suburban residential street with a 25-mph speed limit was used for the on-road driving study. Testing was done during normal daylight hours. The route consisted of a straight road with four stop signs and two speed bumps. Participants were required to follow all traffic laws and adhere to the speed limit at all times. The driving route was approximately two miles long one-way with an average drive time of 6 min. A research assistant was present in the passenger seat of each vehicle for safety moni-toring and data collection. The research assis-tant monitored the roadway for any potential hazards and alerted the participant if any eva-sive actions were required. The research assis-tant also ensured adherence to the posted speed limit, made sure that participants stopped at the stop signs, and followed the rules of the road.
Tasks and modes of interaction. During the study, participants interacted with the CarPlay, Android Auto, or the native portion of the OEM system to perform tasks involving audio enter-tainment, calling and/or dialing, navigation, and text messaging, shown in Table 2. For each task type, a list of task trials was created, which the driver completed in sequence. Task lists were standardized across systems as much as possi-ble, given the variability in system interactions.
Modes of interaction for a particular vehicle were selected based on system capabilities as well as compatibility with the to-be-performed tasks. Tasks could either be performed using a center stack display or through auditory vocal (voice) commands. Center stack interfaces were located in the middle of the dash to the right of the driver and allowed a variety of different
inputs, such as touchscreen or physical buttons. Voice-based interactions with the auditory vocal commands were initiated by a button press or through a voice command (e.g., “Hey Siri” or “OK Google”). While all vehicles had center screens and supported voice commands, not all task combinations were supported by these modes of interaction (see Table 3). Moreover, different systems varied in the sequencing and syntax to accomplish the tasks. Tasks were developed in consideration of these differences to test the various combinations of features and functions available in each system.
Detection Response Task (DRT). A variant of the standard DRT was used to maximize sen-sitivity to both cognitive and visual attention. Participants responded to both a vibrotactile stimulus and a remote visual stimulus (cf. Inter-national Organization for Standardization [ISO] 17488; ISO, 2015). A vibrotactile device was positioned under the participant’s left collar-bone and, following ISO guidelines, the vibro-tactile device emitted a small vibration stimulus intermittently, similar to a vibrating cell phone. A remote LED light was also placed along a strip of fabric fastener on the dashboard, such that the participants only saw the reflection of the light, directly in their line of sight (see Fig-ure 1). The remote light stimulus consisted of a change in color from orange to red, a variant from the ISO standard, developed and evalu-ated by Castro, Cooper, and Strayer (2016; see also Cooper, Castro, & Strayer, 2016).
When participants felt a vibration or saw the light change colors, they were instructed to respond as quickly as possibly using a
TABLe 1: Vehicle Make/Model, Smartphones, and Operating Systems
Make/Model Native SystemaCarPlay
(iPhone 7)b Android Auto (Google Pixel 2)b
2017 Honda Ridgeline RTL-E HondaLink iOS 10.3.3 OS 7.1.2 (app v2.6.573463)2017 Ford Mustang GT SYNC 3 iOS 10.3.3 OS 7.1.2 (app v2.6.573463)2018 Chevrolet Silverado LT MyLink iOS 11.0.3 OS 8.0.0 (app v2.7.573954)2018 Kia Optima UVO iOS 11.0.3 OS 8.0.0 (app v2.8.5754514)2018 Ram 1500 Laramie Uconnect iOS 11.0.3 OS 8.0.0 (app v2.7.573954)
Note. Smartphones were all on T-Mobile network.aA Bluetooth paired LG K7 Android smartphone was used for the evaluation of each of the native systems.bPhone was connected via USB.

4 Month XXXX - Human Factors
microswitch attached to their left index or middle finger. The tactor and light were equally probable and programmed to occur
every 3 to 5 s (with a rectangular distribution of interstimulus intervals within that range) and lasted for 1 s or until the participant
TABLe 2: Description and Examples of the Four Task Types Evaluated in the Study
Task Types Description Examples
Audio entertainment
Participants changed the current music selection to different songs, artists, music sources (e.g., radio, phone), or genres.
Listen to the song “99 Red Balloons”
Play a song by the artist EminemCalling and
dialingParticipants were instructed to make a call to
the personal or work number of a designated contact (from a list of 91 contacts). When supported by the system, participants were also instructed to manually dial a phone number.
Jack Olsen would like you to call him on his cell phone
Try Helen Harold on her mobile number
Text messaging Participants were provided with hypothetical scenarios in which they were instructed to respond appropriately via text.
Let Hugo Grant’s office know you’re going to be late
Text Kevin Malcome to ask for directions
Navigation entry
Participants started and canceled route guidance to different locations based on hypothetical situations they were given that differed slightly according to the options available in each system.
Grab yourself a cup of coffee from Cafe on 1st
Fill up at the closest gas station
TABLe 3: Tasks and Modes of Interaction Supported in Each Vehicle
Vehicle/System
Condition
Audio Entertainment Calling and Dialing Text Messaging Navigation Entry
CS AV CS AV CS AV CS AV
Third-party systems Android Auto ✓ ✓ ✓ ✓ ✗ ✓ ✓ ✓
Apple CarPlay ✓ ✓ ✓ ✓ ✓ ✓ ✓ ✓
Native systems Chevrolet
Silverado LT✓ ✓ ✓ ✓ ✓ ✗ ✗ ✗
Ford Mustang GT ✓ ✓ ✓ ✓ ✓ ✓ ✓ ✓
Honda Ridgeline RTL-E
✓ ✓ ✓ ✓ ✓ ✗ ✓ ✓
Kia Optima LX ✓ ✓ ✓ ✓ ✗ ✗ ✗ ✗
Ram 1500 Laramie ✓ ✓ ✓ ✓ ✗ ✓ ✗ ✗
Note. Checkmarks indicated that the task/mode combination was tested. Xs denote task/mode combinations that were not supported or were locked out by the original equipment manufacturer (OEM) when the vehicle was in motion. CS = Center Stack; AV = Auditory Vocal.

Visual and CognitiVe demands 5
pressed the microswitch. Each press of the switch was counted and recorded, but only the first response was used to determine response time to the stimuli.
The processing requirements of the DRT are minimal; however, it is possible that its inclu-sion could increase the subjective workload of the driver compared with conditions without the DRT test. In our earlier work, we compared the subjective workload of one group of drivers who were using the DRT with that of another group who performed the same tasks without the DRT (see Strayer et al., 2015) and found that the DRT did not increase the workload of the driver. Like-wise, Stojmenova and Sodnik (2018) found that the pupil diameter on trials with and without the DRT did not differ, indicating that the DRT did not impose additional cognitive load. Using a within-subjects design, Castro, Strayer, Matzke, and Heathcote (in press) compared pursuit-tracking performance with and without the DRT and found minimal changes in tracking perfor-mance. In driving simulation, Stojmenova and Sodnik (2018) found that the addition of the DRT did not alter mean driving speed or accel-eration; however, the variability of these mea-sures was increased by the DRT. A similar analy-sis using the DRT to assess workload in a com-plex multitasking study, Palada, Strayer, Neal, Ballard, and Heathcote (2017) also found that
the DRT had minimal (and nonsignificant) effects on primary task performance (i.e., <10 ms). On the whole, the processing requirements of the DRT are such that it seems to have mini-mal impact on the driving task.
procedureFollowing the informed consent and study
onboarding, participants were provided the time to become accustomed to the vehicle, the route, and the DRT. For the CarPlay and Android Auto systems, participants also completed the voice training to improve voice activation and accu-racy. Participants were trained to interact with and complete the tasks using the assigned mode of interaction before each condition began. Par-ticipants were required to complete three task tri-als without error prior to starting the driving task for each of the system interactions. Once partici-pants demonstrated competence in their ability to interact with the system, the experiment began.
Experimental blocks. Participants com-pleted specific steps involving interactions with CarPlay, Android Auto, or native potion of the OEM system to complete a task (i.e., using the touch screen to tune the radio to a particular sta-tion, using voice recognition to find a particular navigation destination, etc.) while driving the vehicle based on the instruction of the in-vehi-cle investigator. Driving the vehicle was con-sidered the primary task, interacting with the infotainment system was considered the sec-ondary task, and responding to the DRT was considered the tertiary task. During each block, drivers repeated one type of task, which varied slightly on each iteration. The order of condi-tions for each vehicle (see Table 3) was counter-balanced across participants.
At each end of the route (block), participants were asked to pull over on the side of the road. The next block, which included a new task and mode of interaction, began in the opposite direc-tion of the same route and concluded in the same manner. This was repeated until all conditions were completed, resulting in alternating travel directions for each experimental block.
Participants also performed three control tasks while driving one length of the desig-nated route per task. The control tasks were as follows:
Figure 1. A research participant driving the 2017 Honda Ridgeline. Note the orange DRT light projected onto the windshield in the driver’s forward field of view and the DRT microswitch attached to the participant’s left index finger. The vibrotactile device attached to the participant’s collarbone is not shown in the photo. DRT = Detection Response Task.

6 Month XXXX - Human Factors
• Single-task baseline: Participants performed a single-task baseline drive on the designated route, performing only the DRT without interacting with the infotainment system.
• Auditory N-back task (high cognitive demand ref-erent): A prerecorded, randomized set of numbers ranging from zero to nine were presented to driv-ers (e.g., Mehler, Reimer, & Dusek, 2011). In each sequence, numbers were spoken aloud at a rate of one digit every 2.25 s. Participants were instructed to verbally repeat the number that was presented two trials earlier (i.e., a two-back task) as they concurrently listened for the next number in the sequence. During the N-back task, participants also responded to the DRT stimuli.
• SuRT task (high visual demand referent): The SuRT was performed on an iPad Mini 4 mounted in a similar position in all the vehicles (close to the center stack display). The target stimulus was an open circle 1.5 cm in diameter presented among 21 to 27 distractor circles 1.2 cm in diameter. The circles did not overlap and were printed in black on a white background. For each trial, participants were instructed to touch the location of the target (the variant of the SuRT task used in the present research matched as closely as possible the visual display characteristics described in ISO/TS 14198 (ISO, 2012); however, participants responded to the target by pressing the touch-screen location rather than using a directional keypad. Pilot test-ing of the SuRT task found a visual search slope of approximately 20 ms/item, a value above the upper threshold associated with automatic visual search (e.g., Schneider & Shiffrin, 1977; Shiffrin & Schneider, 1977). This task places visual/man-ual demands on drivers that are more similar in nature to interactions using the center stack LCD touch screen). Immediately thereafter, a new dis-play was presented with a different configuration of targets and distractors. The location of targets and distractors was randomized across the trials in the SuRT task. During the SuRT task, participants also responded to the DRT stimuli.
After the completion of each condition, par-ticipants completed the six-item NASA Task Load Index (NASA-TLX; Hart & Staveland, 1988) to assess the subjective workload of the system, along with two additional scales that gauged perceived intuitiveness and complexity of the IVIS interactions.
dependent measuresDRT data were processed following pro-
cedures outlined in ISO 17488 (ISO, 2015). All response times faster than 100 ms or slower than 2,500 ms were eliminated from the overall calculation for reaction time. Non-responses or responses that were made after 2.5 s from the stimulus onset were coded as misses. Incomplete, interrupted, or otherwise invalid tasks were flagged and excluded from the analysis. The DRT-related dependent mea-sures used in the study are described in the following:
• DRT—Reaction Time: Defined as the sum of all valid reaction times to the DRT task divided by the number of valid reaction times.
• DRT—Hit Rate: Defined as the number of valid responses divided by the total number of valid stimuli presented during each condition.
Task interaction time was derived from the time stamp on the DRT data file and defined as the time participants first initiated an action to the time when the final action for a task was completed and the participant said, “Done.” Tasks with irregular occurrences and errors in administration or performance that may have affected task interaction time were marked as abnormal during data collection and were not included in subsequent analyses.
data analysis and modelingFollowing the procedures described by Strayer
et al. (2017), the raw dependent measures were used to derive cognitive, visual, and subjective demand scores. Each demand score was based on a different underlying measure (see Table 4) and standardized using performance in the single-task baseline condition and one (or both) of the high demand referent conditions.
Following the equations in Table 4, the demand equivalent to the single-task baseline received a rating of 0.0, and the demand equiva-lent to the high demand referent task (e.g., N-back) received a score of 1.0. It follows that IVIS tasks tested in the vehicle were similarly scaled such that values below 1.0 would repre-sent a demand lower than the high-demand referent, and values greater than 1.0 would

Visual and CognitiVe demands 7
denote conditions with a higher demand than the referent.
Applications of these formulae provide stable workload ratings with useful performance crite-ria that are grounded in industry standard tasks (e.g., NHTSA, 2013, p. 24832; Society of Auto-motive Engineers, 2015). On occasion, however, the approach can result in extreme values when either the numerator is unusually small or the task time unusually long. To mitigate the poten-tial for such scores to skew the overall rating, scores greater than 3.5 standard deviations from the mean (<1% of the data) were excluded from analysis.
Experimental designFrom the master set of 64 participants, 24
were tested in each configuration of five vehicles
crossed with the three different infotainment systems: the native portion of the OEM system, CarPlay, and Android Auto (i.e., each cell in the 5 × 3 factorial design had 24 participants). The experiment was a 5 (Vehicle) × 3 (System: OEM native system, CarPlay, Android Auto) × 4 (Task Type: audio entertainment, calling and dialing, text messaging, navigation) × 2 (Mode of Inter-action: auditory/vocal, center stack) factorial design with 24 participants (from the master set of 64) evaluated in each of the Vehicle × Interaction cells of the factorial. However, not all systems and vehicles offered the full facto-rial design (see Table 3). Moreover, participants were tested in a varying number of systems. Consequently, a planned missing data design was used (e.g., Graham, Taylor, Olchowski, & Cumsille, 2006; Little & Rhemtulla, 2013) as
TABLe 4: Underlying Measures, Referent, and Derivation of the Various Demand Scores Used in the Analysis
Demand TypeUnderlying Measure
High Demand Referent Equation
Cognitive demand
RT (vibrotactile DRT)
N-Back IVISTask SingleTaskNbackTask SingleTask
−−
(Equation 1)
Visual demand
Hit rate (remote DRT)
SuRT SingleTask IVISTaskSingleTask SuRTTask
−−
(Equation 2)
Subjective demand
6 NASA-TLX subscales (avg.)
N-Back and SuRT (avg.)
IVISTask SingleTaskNbackTask SuRTTask
SingleT
−+
−2
aask
(Equation 3)
Task interaction time
Time (s) 24-s threshold IVISTaskseconds24
(Equation 4)
Overall demand
Combination of cognitive, visual, subjective demand, and task interaction time
N-Back and SuRT (avg.)
Cog Vis SubjInteractionTime
+ +( )×
3
(Equation 5)
Note. Using the National Highway Traffic Safety Administration (2013) reference limit of 12 s on Total Shutter Open Time under visual occlusion testing, we reasoned that a corresponding task interaction time referent might reasonably be set at 24 s (derived by taking 12 s shutter open time, and adding 12 s of shutter closed time—to account for the time elapsing during shutter-closures between open periods, plus one additional period of closure at the end). The general principle here is that these multimodal IVIS interactions should be able to be performed in 24 s or less when paired with the task of operating a moving motor vehicle. DRT = Detection Response Task; IVIS = in-vehicle information systems; NASA-TLX = NASA Task Load Index.
8 Month XXXX - Human Factors
each participant was tested in an average of two vehicles with CarPlay and two vehicles with Android Auto. It was necessary to use this approach because it was not practical or feasible for all participants to drive all cars—especially as different vehicles were available at different points in time during the study.
rESultSA bootstrapping procedure was used to esti-
mate the 95% confidence intervals (CI) around each point estimate in the analyses reported later. The bootstrapping procedure, needed because the standardized scores are ratios derived from other measures, used random sampling with replacement to provide a nonparametric esti-mate of the sampling distribution. The boot-strapping procedure involved generating 10,000 bootstrapping samples, each of which were cre-ated by sampling with replacement N samples from the original “real” data. From each of the bootstrap samples, the mean was computed, and the distribution of these means across the 10,000 samples was used to provide an estimate of the standard error around the observed point estimate (Prior to bootstrapping, all scores were baseline corrected, minimizing the potential for violations of homogeneity of variance in resampling procedures; for example, Davison, Hinkley, & Young, 2003). The baseline correc-tion eliminated any effects of participant in the analyses reported in the following. The obtained 95% CIs were used to determine statistical sig-nificance across the different conditions.
Linear mixed effects analyses were per-formed using R 3.3.1 (R Core Team, 2016), lme4 (Bates, Maechler, Bolker, & Walker, 2015), and multcomp (Hothorn, Bretz, & Westfall, 2008). This approach is particularly well suited for unbalanced designs with different numbers of observations for different participants. In the analyses reported in the following, Task Type, Mode of Interaction, Task Type × Mode of Inter-action, and Vehicle were entered independently. The number of vehicles driven by each partici-pant was entered as a fixed effect whereas Participant, Vehicle, Mode of Interaction, and Task Type were entered as random effects. In each case, p values were obtained by likelihood ratio tests comparing the full linear mixed effects
model with a partial linear mixed effects model without the effect in question. This linear mixed modeling analysis has the advantage of analyz-ing all available data while adjusting fixed effect, random effect, and likelihood ratio test estimates for missing data (Melo, Vasconcellos, & Lemonte, 2009). This statistical approach also controls for any effects of learning across testing sessions.
Empirical data and inferential StatisticsThe empirical data are presented in Figures
2 to 5. The figures illustrate the major trends from the factorial analysis for the dependent measures of cognitive demand (Equation 1), visual demand (Equation 2), subjective demand (Equaion 3), and task interaction time (Equa-tion 4), and the integrated overall demand score (Equation 5). A description of the major trends obtained in the linear mixed effects analysis follows the presentation of each dependent measure. In each figure, the solid black line rep-resents single-task performance and the dashed red line represents the performance on the ref-erent task/criterion (from Table 4). Error bars represent 95% CIs. The statistical comparison of linear mixed effects models with and without the independent variable or interaction of inter-est is also indicated for each dependent measure.
As shown in Figure 2, the system used deter-mined the profiles for visual, χ2(2) = 9.99, p < .01; subjective, χ2(2) = 6.94, p < .05; and over-all, χ2(2) = 6.04, p < .05; but not for cognitive, χ2(2) = 4.23, p > .05; or temporal, χ2(2) = 3.62, p > .05, demand. First, cognitive demand across each of the systems was relatively constant and was higher than the N-back reference task. Con-versely, both the CarPlay and Android Auto plat-forms resulted in less visual demand than the native portion of the OEM systems, and both systems were significantly below the SuRT ref-erence task. The overall demand of CarPlay and Android Auto systems did not significantly dif-fer from one another; however, both resulted in significantly lower levels of workload than the embedded portion of the native OEM systems and both significantly below the red line (refer-ent tasks).
As shown in Figure 3, the modality of inter-action with each system determined the profiles

Visual and CognitiVe demands 9
for cognitive, χ2(2) = 15.97, p < .01; visual, χ2(2) = 35.86, p < .01; subjective, χ2(2) = 39.44, p < .01; temporal, χ2(2) = 26.07, p < .01; and overall, χ2(2) = 44.33, p < .01, demand. Cogni-tive demand was lower for the auditory/vocal interface than for the center stack interface. This trend was apparent with the CarPlay system and even more pronounced with Android Auto. Visual was lower for both the auditory vocal and center stack interactions when compared with the embedded portion of the native OEM sys-tems. Overall demand, for both modes of inter-action, was highest with the native portion of the OEM systems, followed by CarPlay, and Android Auto. Interestingly, overall demand with Car-Play was lower for center stack interactions than auditory/vocal interactions. By contrast, overall
demand for Android Auto was lower for audi-tory/vocal interactions than for center stack interactions.
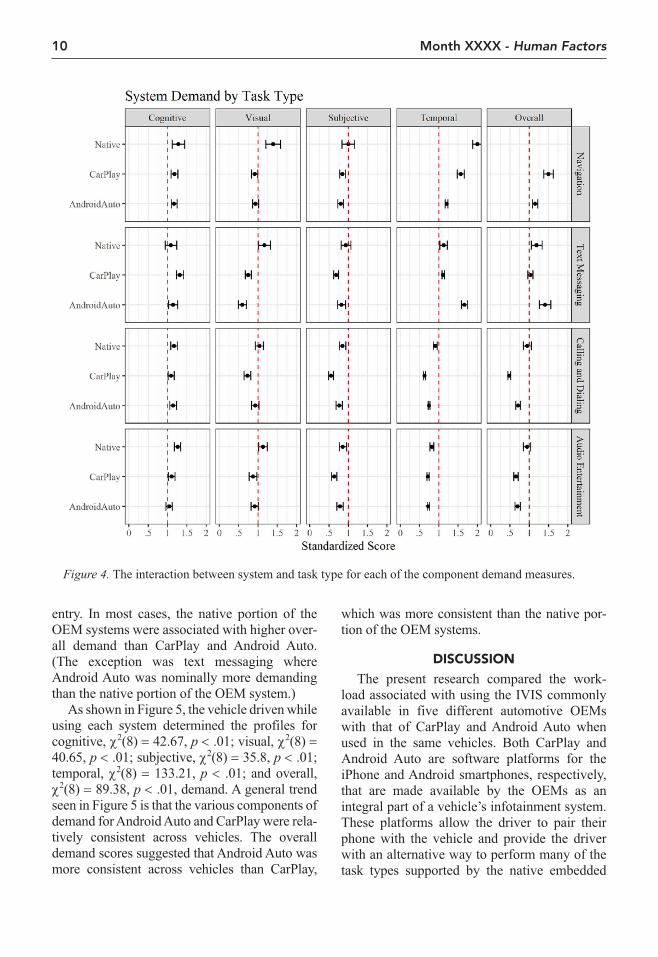
As shown in Figure 4, the type of task being performed with each system determined the pro-files for cognitive, χ2(6) = 24.28, p < .01; visual, χ2(6) = 14.24, p < .05; subjective, χ2(6) = 31.13, p < .01; temporal, χ2(6) = 415.12, p < .01; and overall, χ2(6) = 168.98, p < .01, demand. Nota-bly, the time demands required by each task were quite variable across the three interface types. Moreover, the overall demand across task clearly illustrates performance trade-offs. For example, overall demand when sending text messages was lower with CarPlay than it was for Android Auto, but Android Auto had lower overall demand than CarPlay for navigation
Figure 2. The effect of system type on each of the component demand measures.
Figure 3. The interaction between system and mode of interaction for each of the component demand measures.
10 Month XXXX - Human Factors
entry. In most cases, the native portion of the OEM systems were associated with higher over-all demand than CarPlay and Android Auto. (The exception was text messaging where Android Auto was nominally more demanding than the native portion of the OEM system.)
As shown in Figure 5, the vehicle driven while using each system determined the profiles for cognitive, χ2(8) = 42.67, p < .01; visual, χ2(8) = 40.65, p < .01; subjective, χ2(8) = 35.8, p < .01; temporal, χ2(8) = 133.21, p < .01; and overall, χ2(8) = 89.38, p < .01, demand. A general trend seen in Figure 5 is that the various components of demand for Android Auto and CarPlay were rela-tively consistent across vehicles. The overall demand scores suggested that Android Auto was more consistent across vehicles than CarPlay,
which was more consistent than the native por-tion of the OEM systems.
diScuSSiOnThe present research compared the work-
load associated with using the IVIS commonly available in five different automotive OEMs with that of CarPlay and Android Auto when used in the same vehicles. Both CarPlay and Android Auto are software platforms for the iPhone and Android smartphones, respectively, that are made available by the OEMs as an integral part of a vehicle’s infotainment system. These platforms allow the driver to pair their phone with the vehicle and provide the driver with an alternative way to perform many of the task types supported by the native embedded
Figure 4. The interaction between system and task type for each of the component demand measures.

Visual and CognitiVe demands 11
infotainment system offered by the OEMs. These systems are often marketed as being easier to use than the native portion of the OEM
systems. We examined how the systems com-pared with the demand of the systems designed by the OEMs (and/or their system suppliers) and
Figure 5. The vehicle by system interaction for each of the component demand scores.
12 Month XXXX - Human Factors
how different implementations of these systems varied in different vehicle types.
The present study involved on-road testing of 24 participants in each configuration of five vehicles crossed with the three different info-tainment systems: the native portion of the OEM system, CarPlay, and Android Auto (i.e., each cell in the 5 × 3 factorial design had 24 partici-pants). Replicating Strayer et al. (2017), we found that the task types differed in overall demand, with audio entertainment tasks and calling and dialing tasks both leading to lower demands than the high demand referent (i.e., N-back and SuRT). In contrast, text messaging and navigation tasks were much more demand-ing than the referent tasks, although text mes-saging was significantly less demanding than navigation.
A slightly different pattern to that reported in our earlier evaluation of IVIS interactions (e.g., Strayer et al., 2017) emerged when comparing the mode of interaction. Namely, our prior research found that auditory/vocal interactions were numerically (but not significantly) more demanding than center stack interactions. By contrast, in the present research, the overall demand associated with auditory/vocal interac-tions was significantly lower than for center stack interactions. Comparison between the two studies found that the overall demand of center stack interactions did not differ, whereas the overall demand of auditory/vocal interactions was lower in the present study. In part, the reduced demand may be attributable to the supe-rior auditory/vocal interface of Android Auto (as well as that of CarPlay, though to a lesser extent), when compared with the native portion of the OEM systems.
The analysis of present results found that the overall demand was significantly greater for the native portion of the OEM systems (which, on average, was higher than the high demand refer-ent) than for CarPlay and Android Auto. In addi-tion, the overall demand associated with using CarPlay and Android Auto did not differ, and both systems were significantly below the high demand referent. Thus, the CarPlay and Android Auto systems were significantly less demanding than the native portion of the infotainment sys-tems in the current set of vehicles. Although the
overall demand did not differ between CarPlay and Android Auto, the systems have different strengths and weaknesses.
For example, the mode of interaction influ-enced the overall workload for these systems. For CarPlay, the overall demand was nominally lower with center stack interactions than for auditory/vocal interactions. In contrast, for Android Auto, the overall demand was lower with auditory/vocal interactions than for center stack interactions. The strengths and weaknesses of each system traded off relative to each other in such a way that, when collapsed over mode of interaction, the overall demand of the interac-tions, as shown in Figure 2, did not differ. The native portion of the OEM systems were higher (significantly above the high demand referent) and more variable in demand for both modes of interaction.
The overall demand also varied by task for CarPlay and Android Auto systems. For the audio entertainment task, overall demand was the same for the two systems, and both were sig-nificantly less demanding than the native por-tion of the OEM systems. For the calling and dialing task, CarPlay was significantly less demanding than Android Auto, which was less demanding than using the native portion of the OEM systems. For the text-messaging task, the overall demand was lower for CarPlay than for Android Auto with the native portion of the OEM systems falling in between (and not sig-nificantly different from) CarPlay and Android Auto. For the navigation task, the overall demand of destination entry was significantly lower for Android Auto than for CarPlay, which was significantly less demanding than using the native portion of the OEM systems. As noted earlier, the strengths and weaknesses of each system traded off relative to each other in such a way that, when collapsed over task type, the overall demand of the interactions for CarPlay and Android Auto did not differ. With regard to our research question, this analysis shows that some task types are less demanding with one system than they are with another.
The present findings also revealed how the overall demand varied for different vehicles. Across the five vehicles included in this study, there was a tight clustering of demand scores for
Visual and CognitiVe demands 13
the Android Auto system, a more variable set of ratings for CarPlay, and much more variability for the native portion of the OEM systems. This pattern is seen both within a vehicle (e.g., smaller error bars for Android Auto) and across the different vehicles (i.e., both within and between, participant variability was lower with both systems than with the native portion of the OEM systems). It is important to underscore that the differences between ratings are not due to hardware issues given that the same vehicle was used for testing of the systems. The differences also cannot be attributed to variability in the cel-lular network or the driving route, as these were held constant in our testing. Thus, Android Auto and CarPlay vary in demand when they are deployed in different vehicles. These differences are all the more striking given the greater func-tionality provided by CarPlay and Android Auto compared with the native portion of the OEM systems.
Android Auto and Apple CarPlay represent the latest technological approach to merging core mobile phone functionality with driving. The underlying design philosophy and architec-ture of each approach is largely similar. Both systems provide a vehicle–phone pairing that increases the capabilities of the infotainment systems using local and remote computing resources. Both systems provide access to a reconfigurable set of driver-selected applica-tions that are stored on the mobile phone. Both systems adapt the user experience to better fit the driving context. The present research sug-gests that this general approach may lead to reductions in driver workload even while pro-viding expanded capabilities to drivers.
limitations and caveatsThe present study had participants perform
tasks in a counterbalanced order per the experi-menter’s instructions, allowing for some causal statements regarding the workload associated with different systems. However, in real-world settings, drivers are free to perform the tasks if, when, and where they choose. This compli-cates the relationship between driver workload as measured in experimental studies and crash risk. For example, motorists may attempt to self-regulate their nondriving activities, limiting
them to periods where they perceive the risks to be lower. Naturalistic methods may be more appropriate for assessing motorist’s willingness to engage with these systems. However, self-regulation depends on drivers being aware of their performance and adjusting their behavior accordingly, an ability that is often limited by the same factors that caused them to be distracted in the first place (e.g., Horrey, Lesch, Mitsopoulos-Rubens, & Lee, 2015; Sanbonmatsu, Strayer, Biondi, Behrends, & Moore, 2016).
This research was designed with the assump-tion that drivers will use technology that is available to them. No efforts were made to weigh results based on likelihood of use, and all conditions were treated as equally important for the analysis. This research design leads to several important caveats that should be con-sidered when interpreting the results. Principal among these is that the same set of tasks was not evaluated in each vehicle. Given the com-plexity of these real-world systems, a compari-son of equal tasks with equivalent modes of interactions was not possible, given the result-ing and limited subset of the data. That said, the tested set of tasks should have favored the native interfaces as they supported fewer com-plex activities (e.g., navigation and texting were supported by two and three vehicles, respectively). The finding that Android Auto and Apple CarPlay generally outperformed the embedded portion of the native systems is, therefore, more notable.
The equal weighting of tested tasks also car-ries the implicit assumption that drivers will be equally likely to use each of the features and functions available in the vehicle. Given the unique ways in which these functions are being delivered by each of the systems, we saw no jus-tifiable approach to determine whether certain tasks should be treated differently in the analy-ses than others. As technology improves, it is very likely that users will change the way they interact with the systems. Usage patterns will likely evolve as better interfaces are developed and new functionality is introduced into vehi-cles. Thus, results presented in this report pro-vide a snapshot of the overall demand profile of potential interactions that drivers may have with the vehicle and interface but not necessarily the

14 Month XXXX - Human Factors
actual demand that may be experienced by users of these systems on the roadway.
Some OEMs provide lockouts to prevent the use of tasks that have been tested and judged to be excessively demanding under “task accep-tance testing,” or which do not meet “per se” criteria under the NHTSA guidelines. Although these are intended to be safety-positive actions (e.g., under prevailing “voluntary” guidelines), there is no reflection of these safety-adhering actions in the scoring system, and these systems do not receive any credit under the scoring method used in the research reported here for having taken protective steps to safeguard users. Rather, the locked-out tasks are instead treated as “missing functionality.”
With respect to the benchmarks, we selected as high-demand referent tasks the N-back task (e.g., Mehler et al., 2011) and SuRT (e.g., Engström & Markkula, 2007; Mattes, Föhl, & Schindhelm, 2007) and adopted a 24-s rule for dynamic task interaction time. The 24-s task interaction referent was derived based on the project team’s interpretation of the NHTSA visual/manual guidelines (NHTSA, 2013). One may question whether these referents are rea-sonable. For example, if the referent tasks were too easy (or hard), then the absolute ratings would be an overestimate (or underestimate) of the true demand. However, it is important to note that the relative ratings will be insensitive to the absolute demand of the referent tasks, so long as they are performed in a consistent fashion in a counterbalanced order across participants.
SummaryCarPlay and Android Auto provided more
functionality and resulted in lower levels of workload than the native portion of the OEM infotainment systems. That said, both incurred moderately high levels of demand, in relation to the referent tasks, thus providing opportuni-ties to improve the user experience. Moreover, variation in demand across task type and mode of interaction also suggest areas for further improvement. For example, CarPlay had lower overall demand than Android Auto for sending text messages, and Android Auto had lower overall demand than CarPlay for destination
entry to support navigation. In light of the present results, both systems can be improved toward more optimal user experiences.
acknOwlEdgmEntSThis work was funded by a grant from the AAA
Foundation for Traffic Safety, Washington, D.C. We wish to thank the anonymous reviewers for their comments on earlier versions of this paper. The data-set used and analyzed in the present study is available from the corresponding author.
kEy pOintS • CarPlay and Android Auto provided more func-
tionality and resulted in lower levels of workload than the native portion of the OEM infotainment systems.
• The overall demand associated with using Car-Play and Android Auto did not differ.
• CarPlay and Android Auto have different strengths and weaknesses, providing opportunities for both to improve the user experience.
rEfErEncESAngell, L. S., Auflick, J., Austria, P. A., Kochhar, D. S., Tijerina,
L., Biever, W., . . . Kiger, S. (2006). Driver workload met-rics task 2 final report (Rep. HS-810 635). Washington, DC: National Highway Traffic Safety Administration.
Bates, D., Maechler, M., Bolker, B., & Walker, S. (2015). Fitting linear mixed-effects models using lme4. Journal of Statistical Software, 67(1), 1–48. doi:10.18637/jss.v067.i01
Castro, S., Cooper, J., & Strayer, D. (2016). Validating two assess-ment strategies for visual and cognitive load in a simulated driving task. Proceedings of the Human Factors and Ergonom-ics Society Annual Meeting, 60, 1899–1903.
Castro, S. C., Strayer, D. L., Matzke, D., & Heathcote, A. (in press). Cognitive workload measurement and modeling under divided attention. Journal of Experimental Psychology: Human Per-ception and Performance.
Cooper, J. M., Castro, S. C., & Strayer, D. L. (2016). Extend-ing the Detection Response Task to simultaneously mea-sure cognitive and visual task demands. Proceedings of the Human Factors and Ergonomics Society Annual Meeting, 60, 1962–1966.
Davison, A. C., Hinkley, D. V., & Young, G. A. (2003). Recent developments in bootstrap methodology. Statistical Science, 18, 141–157.
Engström, J., Johansson, E., & Östlund, J. (2005). Effects of visual and cognitive load in real and simulated motorway driv-ing. Transportation Research Part F: Traffic Psychology and Behaviour, 8, 97–120.
Engström, J., & Markkula, G. (2007, July). Effects of visual and cognitive distraction on lane change test performance. Pro-ceedings of the Fourth International Symposium on Human Factors in Driver Assessment, Training, and Vehicle Design, The University of Iowa, Iowa City.

Visual and CognitiVe demands 15
Graham, J. W., Taylor, B. J., Olchowski, A. E., & Cumsille, P. E. (2006). Planned missing data designs in psychological research. Psychological Methods, 11, 323–343.
Hart, S. G., & Staveland, L. E. (1988). Development of NASA-TLX (Task Load Index): Results of empirical and theoretical research. Advances in Psychology, 52, 139–183.
Horrey, W. J., Lesch, M. F., Mitsopoulos-Rubens, E., & Lee, J. D. (2015). Calibration of skill and judgment in driving: Develop-ment of a conceptual framework and the implications for road safety. Accident Analysis & Prevention, 76, 25–33.
Hothorn, T., Bretz, F., & Westfall, P. (2008). Simultaneous inference in general parametric models. Biometrical Journal, 50, 346–363.
International Organization for Standardization. (2012). Road vehicles—Ergonomic aspects of transport information and control systems—Calibration tasks for methods which assess driver demand due to the use of in-vehicle systems (Rep. ISO TS 14198). Geneva, Switzerland: Author.
International Organization for Standardization. (2015). Road vehi-cles—Transport information and control systems— Detection Response Task (DRT) for assessing attentional effects of cog-nitive load in driving (Rep. ISO 17488). Geneva, Switzerland: Author.
Jacoby, L. L. (1991). A process dissociation framework: Separating automatic from intentional uses of memory. Journal of Mem-ory and Language, 30, 513–541.
Kidd, D. G., Dobres, J., Reagan, I., Mehler, B., & Reimer, B. (2017). Considering visual-manual tasks performed during highway driving in the context of two different sets of guide-lines for embedded in-vehicle electronic systems. Transporta-tion Research Part F: Traffic Psychology and Behaviour, 47, 23–33. doi:10.1016/j.trf.2017.04.002
Little, T. D., & Rhemtulla, M. (2013). Planned missing data designs for developmental researchers. Child Development Perspectives, 7, 199–204.
Mattes, S., Föhl, U., & Schindhelm, R. (2007). Empirical com-parison of methods for off-line workload measurement (AIDE Deliverable 2.2.7, EU Project IST-1-507674-IP). Gothenburg, Sweden: Adaptive Integrated Driver-Vehicle Interface.
Mehler, B., Kidd, D., Reimer, B., Reagan, I., Dobres, J., & McCartt, A. (2016). Multi-modal assessment of on-road demand of voice and manual phone calling and voice navigation entry across two embedded vehicle systems. Ergonomics, 59, 344–367. doi: 10.1080/00140139.2015.1081412
Mehler, B., Reimer, B., & Dusek, J. (2011). MIT AgeLab delayed digit recall task (n-back) (White paper). Cambridge, MA: MIT AgeLab.
Melo, T. F., Vasconcellos, K. L., & Lemonte, A. J. (2009). Some restriction tests in a new class of regression models for propor-tions. Computational Statistics & Data Analysis, 53, 3972–3979.
National Highway Traffic Safety Administration. (2013). Visual-manual NHTSA driver distraction guidelines for in-vehicle electronic devices (Federal Register Vol. 78, No. 81). Wash-ington, DC: Author.
Palada, H., Strayer, D. L., Neal, A., Ballard, X., & Heathcote, A. (2017, November). A comparison of multitasking performance with and without inclusion of the Detection Response Task (DRT). Paper presented at the Society for Psychonomics Sci-ence, Vancouver, British Columbia, Canada.
Ranney, T. A., Garrott, R. W., & Goodman, M. J. (2000). NHTSA driver distraction research: Past, present, and future. Driver Distraction Internet Forum. Retrieved from https://
www.researchgate.net/profile/Elizabeth_Mazzae/public ation/255669554_NHTSA_Driver_Distraction_Research_Past_Present_and_Future/links/0a85e53ab86eb9ea74000000/NHTSA-Driver-Distraction-Research-Past-Present-and-Future.pdf
R Core Team. (2016). R: A language and environment for statistical computing. Vienna, Austria: R Foundation for Statistical Com-puting. Available from https://www.R-project.org/
Regan, M. A., Hallett, C., & Gordon, C. P. (2011). Driver distrac-tion and driver inattention: Definition, relationship and taxon-omy. Accident Analysis & Prevention, 43, 1771–1781.
Regan, M. A., & Strayer, D. L. (2014). Towards an understand-ing of driver inattention: Taxonomy and theory. Annals of Advances in Automotive Medicine, 58, 5–13.
Sanbonmatsu, D. M., Strayer, D. L., Biondi, F., Behrends, A. A., & Moore, S. M. (2016). Cell-phone use diminishes self-aware-ness of impaired driving. Psychonomic Bulletin & Review, 23, 617–623.
Schneider, W., & Shiffrin, R. M. (1977). Controlled and automatic human information processing: I. Detection, search, and atten-tion. Psychological Review, 84, 1–66.
Shiffrin, R. M., & Schneider, W. (1977). Controlled and automatic human information processing: II. Perceptual learning, auto-matic attending, and a general theory. Psychological Review, 84, 127–190.
Society of Automotive Engineers. (2015). Operational definitions of driving performance measures and statistics (No. J2944). Warrendale, PA: Author.
Stojmenova, K., & Sodnik, J. (2018). Detection-response task-uses and limitations. Sensors, 18(2), Article 594. doi:10.3390/s18020594
Strayer, D. L., Cooper, J. M., Goethe, R. M., McCarty, M. M., Getty, D., & Biondi, F. (2017). Visual and cognitive demands of using in-vehicle information systems. Washington, DC: AAA Foundation for Traffic Safety.
Strayer, D. L., Turrill, J., Cooper, J. M., Coleman, J., Medeiros-Ward, N., & Biondi, F. (2015). Assessing cognitive distraction in the automobile. Human Factors, 53, 1300–1324.
Strayer, D. L., Watson, J. M., & Drews, F. A. (2011). Cognitive distraction while multitasking in the automobile. In B. Ross (Ed.), The psychology of learning and motivation: Advances in research and theory (Vol. 54, pp. 29–58). San Diego, CA: Elsevier Academic Press.
Wickens, C. (2008). Multiple resources and mental work-load. Human Factors, 50, 449–455. doi:10.1518/001872008X288394
Zhang, Y., Angell, L., Pala, S., & Shimonomoto, I. (2015). Bench-marking drivers’ visual and cognitive demands: A fea-sibility study. SAE International Journal of Passenger Cars– Mechanical Systems, 8, 584–593. doi:10.4271/2015-01
David L. Strayer, University of Utah, received his PhD in experimental psychology from the Univer-sity of Illinois at Urbana–Champaign in 1989.
Joel M. Cooper, University of Utah, received his PhD in psychology from the University of Utah in 2010.
16 Month XXXX - Human Factors
Madeleine M. McCarty, University of Utah, received her BS in psychology from the University of Utah in 2016.
Douglas J. Getty, University of Pittsburgh, received his BS in psychology from Westminster College in 2016.
Camille L. Wheatley, University of Utah, received her BS in psychology from Southern Utah Univer-sity in 2016.
Conner J. Motzkus, University of Utah, received his BS in psychology from Southern Utah University in 2016.
Rachel M. Goethe, AAA, received her BS in psy-chology from the University of Utah in 2016.
Francesco Biondi, University of Windsor, received his PhD in applied cognitive psychology from the University of Padova in 2014.
William J. Horrey, AAA Foundation for Traffic Safety, received his PhD in engineering psychology from the University of Illionis at Urbana–Champaign in 2005.
Date received: November 6, 2018Date accepted: February 15, 2019