visual techniques for exploring databases - lmu munichdaniel/kdd97.pdf · visual techniques for...
TRANSCRIPT

Visual Techniques
for Exploring Databases
Daniel A. Keim
Institute for Computer Science, University of Halle-Wittenberg
Overview
Daniel A. Keim Page T6 - 1 Visual Techniques for Exploring Databases
1. Introduction .........................................................................2
2. Data Preprocessing Techniques ...........................................9
3. Visual Data Exploration Techniques .................................11• Geometric Techniques ..............................................................11• Icon-based Techniques ..............................................................21• Pixel-Oriented Techniques ........................................................31• Hierarchical Techniques ...........................................................51• Graph-based Techniques ...........................................................60• Hybrid Techniques.....................................................................72
4. Distortion Techniques .......................................................73
5. Dynamic / Interaction Techniques .....................................81
6. Comparison of the Techniques ..........................................96
7. Database Exploration and Visualization Systems .............98
8. Summary and Conclusion ...............................................103
Introduction
Daniel A. Keim Page T6 - 2 Visual Techniques for Exploring Databases
Goals of Visualization Techniques
❑ Explorative Analysis• starting point: data without hypotheses about the data• process: interactive, usually undirected search for structures, trends, etc.• result: visualization of the data, which provides hypotheses about the data
❑ Confirmative Analysis• starting point: hypotheses about the data• process: goal-oriented examination of the hypotheses• result: visualization of the data, which allows the confirmation
or rejection of the hypotheses
❑ Presentation• starting point: facts to be presented are fixed a priori• process: choice of an appropriate presentation technique• result: high-quality visualization of the data presenting the facts
Introduction
Daniel A. Keim Page T6 - 3 Visual Techniques for Exploring Databases
Database Exploration
Definition
Database Exploration is the process of searching and analyzing
databases to find implicit but potentially useful information.
more formally:
Database Exploration is the process of finding a
• subset D’ of the database D and
• hypotheses HU(D’, C)
that auser U considersuseful in anapplication context C.

Introduction
Daniel A. Keim Page T6 - 4 Visual Techniques for Exploring Databases
Comparison of the Abilities of Humans and Computers
abilities ofthe computer
General KnowledgeCreativity
Logic
Data Storage
Numerical Computation
Planning
PredictionDiagnosis
Searching
Perception
human abilities
Introduction
Daniel A. Keim Page T6 - 5 Visual Techniques for Exploring Databases
Historical Overview of ExploratoryData Visualization Techniques(cf. [WB 95])
❑ pioneering work of Tufte [Tuf 83, Tuf 90] and Bertin [Ber 81] focuses on
➪ visualization of data with inherent 2D-/3D-semantics➪ general rules for layout, color composition, attribute mapping, etc.
❑ development of visualization techniques for different typesof data with an underlying physical model
➪ geographic data, CAD data, flow data, image data, voxel data, etc.
❑ development of visualization techniques for arbitrary multidimensionaldata (without an underlying physical model)
➪ applicable to databases and other information resources

Introduction
Daniel A. Keim Page T6 - 6 Visual Techniques for Exploring Databases
Dimensions of Exploratory Data Visualizations
Geometric
Icon-based
Pixel-oriented
Hierarchical
Graph-based
Mapping Projection Filtering Link & Brush Zooming
Simple
Complex
Data Visualization Techniques
Distortion Techniques
Interaction Techniques
Introduction
Daniel A. Keim Page T6 - 7 Visual Techniques for Exploring Databases
Classification of Data Visualization Techniques
❑ Geometric Techniques: Scatterplots, Landscapes, Projection Pursuit, Prosec-tion Views, Hyperslice,Parallel Coordinates, ...
❑ Icon-based Techniques: Chernoff Faces,Stick Figures, Shape-Coding,
Color Icons, TileBars, ...
❑ Pixel-oriented Techniques:Recursive Pattern Technique, Circle Segments
Technique, Spiral- & Axes-Techniques,...
❑ Hierarchical Techniques:Dimensional Stacking, Worlds-within-Worlds,
Treemap, Cone Trees, InfoCube, ...
❑ Graph-Based Techniques:Basic Graphs (Straight-Line, Polyline, Curved-Line, ..)
Specific Graphs (e.g., DAG, Symmetric, Cluster, ...)
Systems (e.g., Tom Sawyer, Hy+, SeeNet, Narcissus, ...)
❑ Hybrid Techniques: arbitrary combinations from above

Introduction
Daniel A. Keim Page T6 - 8 Visual Techniques for Exploring Databases
Distortion and Dynamic / Interaction Techniques
❑ Distortion Techniques• Simple Distortion (e.g.,Perspective Wall, Bifocal Lenses,TableLens,
Graphical Fisheye Views, ...)
• Complex Distortion (e.g., Hyperbolic Repr.,Hyperbox, ...)
❑ Dynamic / Interaction Techniques
• Data-to-Visualization Mapping(e.g., AutoVisual, S Plus,XGobi, IVEE , ...)
• Projections (e.g., GrandTour, S Plus,XGobi, ...)
• Filtering (Selection, Querying)(e.g.,MagicLens, Filter/Flow Queries,
InfoCrystal, ...)
• Linking & Brushing (e.g.,Xmdv-Tool, XGobi, DataDesk, ...)
• Zooming (e.g., PAD++,IVEE , DataSpace, ...)
• Detail on Demand (e.g.,IVEE , TableLens,MagicLens, VisDB, ...)
Data Preprocessing Techniques
Daniel A. Keim Page T6 - 9 Visual Techniques for Exploring Databases
❑ Techniques for Dimension Reduction(Set of d-dim Data Items -> Set of k-dim. Data Items; k << d)
• Principal Component Analysis [DE 82]Determines a minimal set of principal components (linear combinations of the originaldimensions) which explain the main variations of the data.
• Factor Analysis [Har 67]Determines a set of unobservable common factors which explain the main variationsof the data. The original dimensions are linear combinations of the common factors.
• Multidimensional Scaling [SRN 72]Uses the similarity (or dissimilarity) matrix of the data as defining coordinate axes inmultidimensional space. The Euclidean distance in that space is a measure of the sim-ilarity of the data items.
• Fastmap [FL 95]Fastmap also operates on a given similarity matrix and iteratively reduces the numberof dimensions while preserving the distances as much as possible.

Data Preprocessing Techniques
Daniel A. Keim Page T6 - 10 Visual Techniques for Exploring Databases
❑ Subsetting Techniques(Set of Data Items -> Subset of Data Items)
• Sampling (determines a representative subset of the database)• Querying (determines a certain, usually a-priori fixed subset of the database)
❑ Segmentation Techniques(Set of Data Items -> Set of (Set of Data Items))
• Segmentation based upon attribute values or attribute ranges
❑ Aggregation Techniques(Set of Data Items -> Set of Aggregate Values)
• Aggregation (sum, count, min, max, ...) based upon- attribute values- topological properties, etc.
• Visualizations of Aggregations:- Histograms- Pie Charts, Bar Charts, Line Graphs, etc.
Daniel A. Keim Page T6 - 11 Visual Techniques for Exploring Databases
Geometric Techniques
Basic Idea: Visualization of geometric transformationsand projections of the data.
Overview
❑ Scatterplot-Matrices [And 72, Cle 93]
❑ Landscapes [Wri 95]
❑ Projection Pursuit Techniques [Hub 85](➪ techniques for finding meaningful projections of multidimensional data)
❑ Prosection Views [FB 94, STDS 95]
❑ Hyperslice [WL 93]
❑ Parallel Coordinates [Ins 85, ID 90]

Daniel A. Keim Page T6 - 12 Visual Techniques for Exploring Databases
Geometric Techniques
Scatterplot-Matrices [Cle 93]
➪ matrix of scatterplots (x-y-diagrams) of the k-dim. data [total of (k2/2 - k) scatterplots]used by permission of M. Ward, Worcester Polytechnic Institute
Daniel A. Keim Page T6 - 13 Visual Techniques for Exploring Databases
Geometric Techniques
Landscapes [Wri 95]
➪ visualization of the data as perspective landscape
➪ the data needs to be transformed into a (possibly artificial) 2D spatial
representation which preserves the characteristics of the data
news articlesvisualized asa landscape
used
by
perm
issi
on o
f B. W
right
, Vis
ible
Dec
isio
ns In
c.

Daniel A. Keim Page T6 - 14 Visual Techniques for Exploring Databases
Geometric Techniques
Prosection Views [FB 94, STDS 95]
➪ matrix of all orthogonal projections where the result of the selected multidimen-
sional range is colored differently (combination of selections and projections)
schematic representation example
used by permission of R. Spence, Imperial College Londonused by permission of R. Spence, Imperial College London
Daniel A. Keim Page T6 - 15 Visual Techniques for Exploring Databases
Geometric Techniques
Hyperslice [WL 93]
➪ matrix of k2 slices through the k-dim. data (the slices are determined interactively)
used
by
perm
issi
on o
f J. J
. van
Wijk

Daniel A. Keim Page T6 - 16 Visual Techniques for Exploring Databases
Geometric Techniques
Parallel Coordinates[Ins 85, ID 90]
➪ n equidistant axes which are parallel to one of the screen axesand correspond to the attributes
➪ the axes are scaled to the [minimum, maximum] - range of thecorresponding attribute
➪ every data item corresponds to a polygonal line which intersects each ofthe axes at the point which corresponds to the value for the attribute
Attr. 1 Attr. 2 Attr. kAttr. 3
• • •
Daniel A. Keim Page T6 - 17 Visual Techniques for Exploring Databases
Geometric Techniques
Parallel Coordinates (cont’d)

Daniel A. Keim Page T6 - 18 Visual Techniques for Exploring Databases
Geometric Techniques
Parallel Coordinates (cont’d)
points on a line in 10-dim. space points on a circle in 2-dim. space
used by permission of A. Inselberg, Tel Aviv University, Israel used by permission of A. Inselberg
Daniel A. Keim Page T6 - 19 Visual Techniques for Exploring Databases
Geometric Techniques
Parallel Coordinates (cont’d)
15.000 data items with noise 5% of the data (750 data items)

Daniel A. Keim Page T6 - 20 Visual Techniques for Exploring Databases
Geometric Techniques
Parallel Coordinates (cont’d)
15.000 data items with a query-dependent coloring
Daniel A. Keim Page T6 - 21 Visual Techniques for Exploring Databases
Icon-based Techniques
Basic Idea: Visualization of the data values as features of icons.
Overview❑ Chernoff-Faces [Che 73, Tuf 83]
❑ Stick Figures [Pic 70, PG 88]
❑ Shape Coding [Bed 90]
❑ Color Icons [Lev 91, KK 94]
❑ TileBars [Hea 95](➪ use of small icons representing the relevance feature
vectors in document retrieval)
Daniel A. Keim Page T6 - 22 Visual Techniques for Exploring Databases
Icon-based Techniques
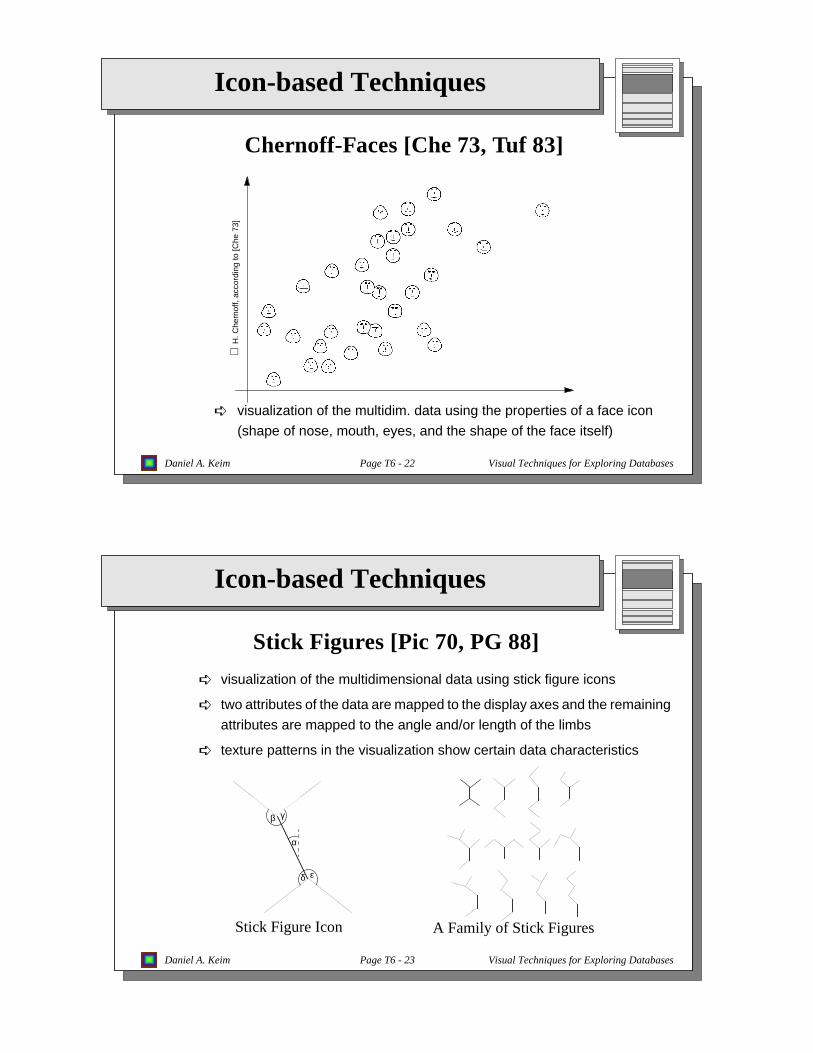
Chernoff-Faces [Che 73, Tuf 83]
➪ visualization of the multidim. data using the properties of a face icon
(shape of nose, mouth, eyes, and the shape of the face itself)
H
. Che
rnof
f, ac
cord
ing
to [C
he73
]
Daniel A. Keim Page T6 - 23 Visual Techniques for Exploring Databases
Icon-based Techniques
Stick Figures [Pic 70, PG 88]
➪ visualization of the multidimensional data using stick figure icons
➪ two attributes of the data are mapped to the display axes and the remaining
attributes are mapped to the angle and/or length of the limbs
➪ texture patterns in the visualization show certain data characteristics
A Family of Stick FiguresStick Figure Icon
α
β
δ ε
γ

Daniel A. Keim Page T6 - 24 Visual Techniques for Exploring Databases
Icon-based Techniques
Stick Figures (cont’d)
5-dim. imagedata from thegreat lake region
used
by
perm
issi
on o
f G. G
rinst
ein,
Uni
vers
ity o
f Mas
sach
uset
ts a
t Low
ell
Daniel A. Keim Page T6 - 25 Visual Techniques for Exploring Databases
Icon-based Techniques
Stick Figures (cont’d)
census data showingage, income, sex,education, etc.
used by permission of G
. Grinstein, U
niversity of Massachusetts at Low
ell

Daniel A. Keim Page T6 - 26 Visual Techniques for Exploring Databases
Icon-based Techniques
Stick Figures (cont’d)
properties of the triangulation of molecule data
Daniel A. Keim Page T6 - 27 Visual Techniques for Exploring Databases
Icon-based Techniques
Shape Coding [Bed 90]
➪ the data are visualized using small arrays of fields
➪ each field represents one attribute value
➪ arrangement of attribute fields (e.g., 12-dimensional data):
➪ arrays are arranged line-by-line according to a given sorting
(e.g., the time attribute for time-series data)
attr. 1attr. 2
attr. 4attr. 3
attr. 9attr. 10
attr. 12attr. 11
attr. 8
attr. 7
attr. 5
attr. 6

Daniel A. Keim Page T6 - 28 Visual Techniques for Exploring Databases
Icon-based Techniques
Shape Coding (cont’d)
time series ofNASA earthobservation data
used by permission of J. B
eddow
Daniel A. Keim Page T6 - 29 Visual Techniques for Exploring Databases
Icon-based Techniques
Color Icons [Lev 91, KK 94]
➪ visualization of the data using color icons
➪ color icons are arrays of color fields representing the attribute values
➪ arrangement is query-dependent (e.g., spiral)
attr. 2 attr. 3
attr. 4 attr. 5 attr. 6
attr. 1representationof 6-dim. data
schematic

Daniel A. Keim Page T6 - 30 Visual Techniques for Exploring Databases
Icon-based Techniques
Color Icons (cont’d)
random data containingseveral clusters
Daniel A. Keim Page T6 - 31 Visual Techniques for Exploring Databases
Pixel-oriented Techniques
Basic Idea
• each attribute value is represented by one colored pixel(➪ the value ranges of the attributes are mapped to a fixed colormap)
• the attribute values for each attribute are presented in separate subwindows
• example:attribute 1 attribute 2 attribute 3
attribute 4 attribute 5 attribute 6
visualization of attribute valuesof a data itemsix-dim. data
• ••
• • •

Daniel A. Keim Page T6 - 32 Visual Techniques for Exploring Databases
Pixel-oriented Techniques
Query-Independent
Query-Dependent
Simple Techniques
Space-Filling Curves
Recursive Pattern Technique
Spiral Technique
Axes Technique
Techniques
Techniques
Overview
Circle Segments
Daniel A. Keim Page T6 - 33 Visual Techniques for Exploring Databases
Pixel-oriented Techniques
Query-Independent Techniques:Space-Filling Curve Arrangements
Peano-Hilbert Morton (Z-Curve)

Daniel A. Keim Page T6 - 34 Visual Techniques for Exploring Databases
Pixel-oriented Techniques
Space-Filling Curve Arrangements
DOW JONES GOLD.US$
IBM DOLLAR
DOW JONES GOLD.US$
IBM DOLLAR
Peano-Hilbert Morton (Z-Curve)
Daniel A. Keim Page T6 - 35 Visual Techniques for Exploring Databases
Pixel-oriented Techniques
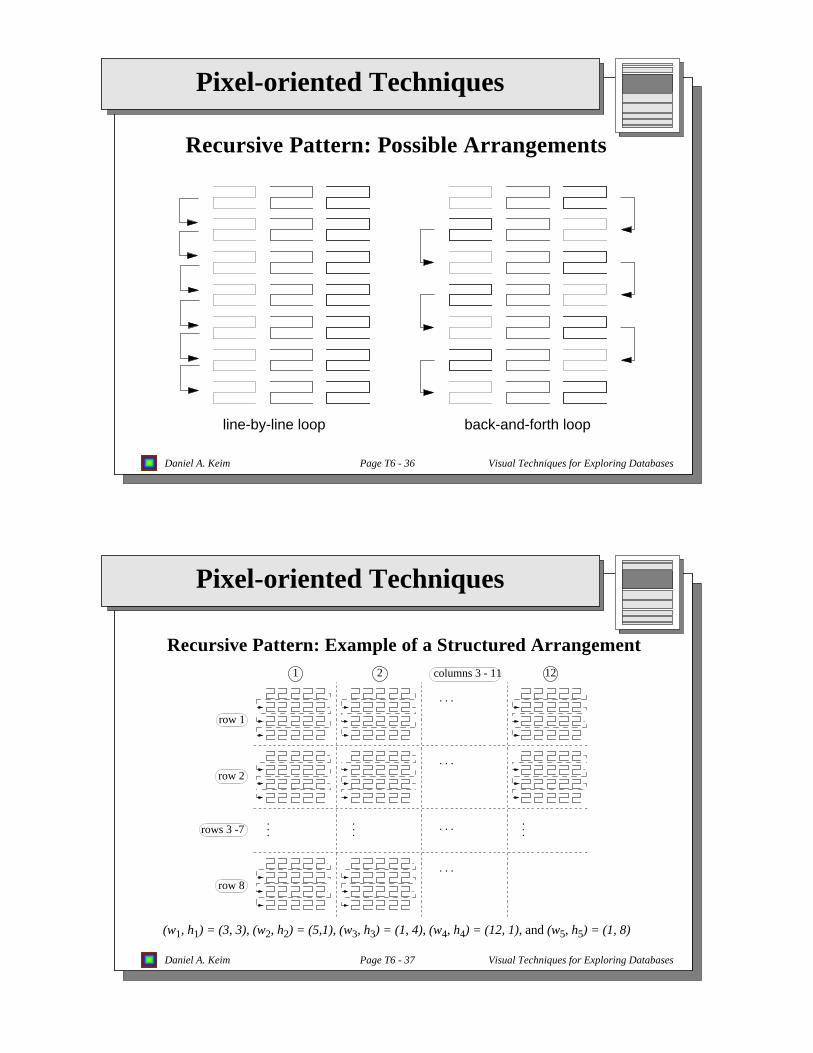
Query-Independent Techniques:Recursive Pattern Technique [KKA 95]
• recursive generalization of iterated line- and column-based arrangements
• the user may specify the heighthi and widthwi for each recursion level
• on recursion leveli, wi patterns of recursion level(i-1) are drawn in left-
right direction and this is repeatedhi times in top-down direction
=> the pattern on recursion level i consists of wi x hi patterns of recur-
sion level (i-1)
Daniel A. Keim Page T6 - 36 Visual Techniques for Exploring Databases
Pixel-oriented Techniques
Recursive Pattern: Possible Arrangements
line-by-line loop back-and-forth loop
Daniel A. Keim Page T6 - 37 Visual Techniques for Exploring Databases
Pixel-oriented Techniques
Recursive Pattern: Example of a Structured Arrangement
. . .
. . .
. . .
. . .
...
...
...
rows 3 -7
columns 3 - 111 2 12
row 1
row 2
row 8
(w1, h1) = (3, 3), (w2, h2) = (5,1), (w3, h3) = (1, 4), (w4, h4) = (12, 1),and (w5, h5) = (1, 8)

Daniel A. Keim Page T6 - 38 Visual Techniques for Exploring Databases
Pixel-oriented Techniques
Recursive Pattern: Example of Financial Data
DOW JONES GOLD (US$)
DOLLARIBM
time series of
financial data
Daniel A. Keim Page T6 - 39 Visual Techniques for Exploring Databases
Pixel-oriented Techniques
Recursive Pattern: FAZ-Index (Jan. ‘74 - Apr. ‘95)
time series of
of the 100 stocks
in the Frankfurt
Stock Index

Daniel A. Keim Page T6 - 40 Visual Techniques for Exploring Databases
Pixel-oriented Techniques
Query-Dependent Techniques:Basic Idea
• data items(a1, a2, ..., am) & query (q1, q2, ..., qm)
=> distances(d1, d2, ... dm)
• extend distances by overall distance (dm+1)
• determine data items with lowest overall distances
• map distances to color (for each attribute)
• visualize each distance value di by one colored pixel
Daniel A. Keim Page T6 - 41 Visual Techniques for Exploring Databases
Pixel-oriented Techniques
Calculating the Visualizations
Visualization
Determine the Desired Percentage of Data Items with Lowest Combined Distances: ➞ α-quantile
Read Data into Main Memory
Calculate Distances: Datatype ➞ Real
Combine Distances: Real n ➞ Real
Normalize Value Ranges: [dmin, dmax] ➞ [0, 255]
Visualize Relevance Factors and Distances
Normalize Distances: [dmin, dmax] ➞ [0, 255]
Sort the Data Items: ➞ bucket sort
1
2
3
4
5
6
7
0
Data
DA FE DY TE SF
12 12 14 54 26
37 42 30 27 42
38 95 37 26 46
19 36 15 36 54
32 13 68 98 46
36 48 36 54 74
DA FE DY TE SF
12 12 14 54 26
37 42 30 27 42
38 95 37 26 46
19 36 15 36 54
32 13 68 98 46
36 48 36 54 74
DA FE DY TE SF
12 12 14 54 26
37 42 30 27 42
38 95 37 26 46
19 36 15 36 54
32 13 68 98 46
36 48 36 54 74

Daniel A. Keim Page T6 - 42 Visual Techniques for Exploring Databases
Pixel-oriented Techniques
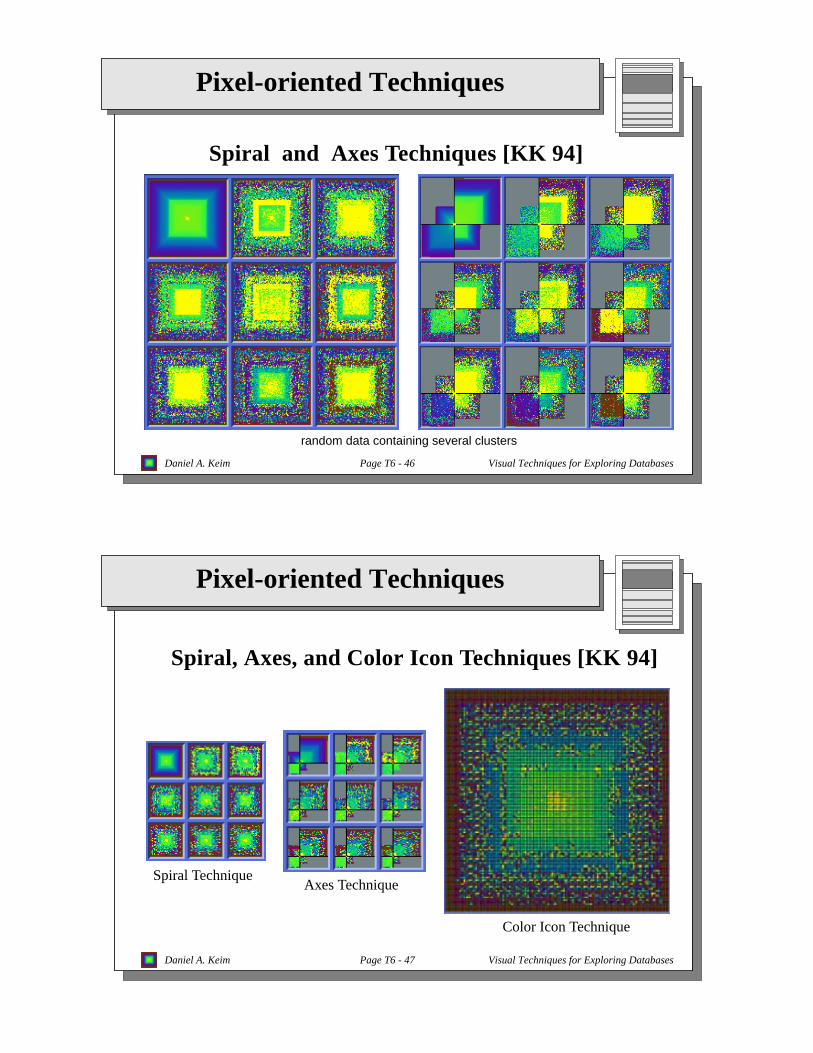
Query-Dependent Techniques:Spiral Technique [KK 94]
according to the overall distance
arrangement in spiral form example of the
overall distance
Daniel A. Keim Page T6 - 43 Visual Techniques for Exploring Databases
Pixel-oriented Techniques
Spiral Technique (cont’d)
• the values for each of the attributes are presented in a separate subwindows
• the arrangement inside the subwindows is according to the overall distance
• example:
attribute 1 attribute 2 attribute 3
attribute 4 attribute 5 attribute 6
visualization of attribute valuesof a data itemsix-dim. data
• ••
• • •

Daniel A. Keim Page T6 - 44 Visual Techniques for Exploring Databases
Pixel-oriented Techniques
Spiral Technique (cont’d)
result of acomplex query
Daniel A. Keim Page T6 - 45 Visual Techniques for Exploring Databases
Pixel-oriented Techniques
Axes Technique [KK 94]
Attribute j
pos
neg
posneg
Attribute i
in each quadrantarrangement in partial spirals example of the
overall distance
Daniel A. Keim Page T6 - 46 Visual Techniques for Exploring Databases
Pixel-oriented Techniques
Spiral and Axes Techniques [KK 94]
random data containing several clusters
Daniel A. Keim Page T6 - 47 Visual Techniques for Exploring Databases
Pixel-oriented Techniques
Spiral, Axes, and Color Icon Techniques [KK 94]
Spiral TechniqueAxes Technique
Color Icon Technique

Daniel A. Keim Page T6 - 48 Visual Techniques for Exploring Databases
Pixel-oriented Techniques
Generalized Spiral Technique [Kei 95]Combination of Spiral Technique and Space-Filling Curves
Spiral Technique Snake-Spiral Technique
Daniel A. Keim Page T6 - 49 Visual Techniques for Exploring Databases
Pixel-oriented Techniques
Dim 1
Dim 2
Dim 3
Dim 4Dim 5
Dim 6
Dim 7
Dim 8
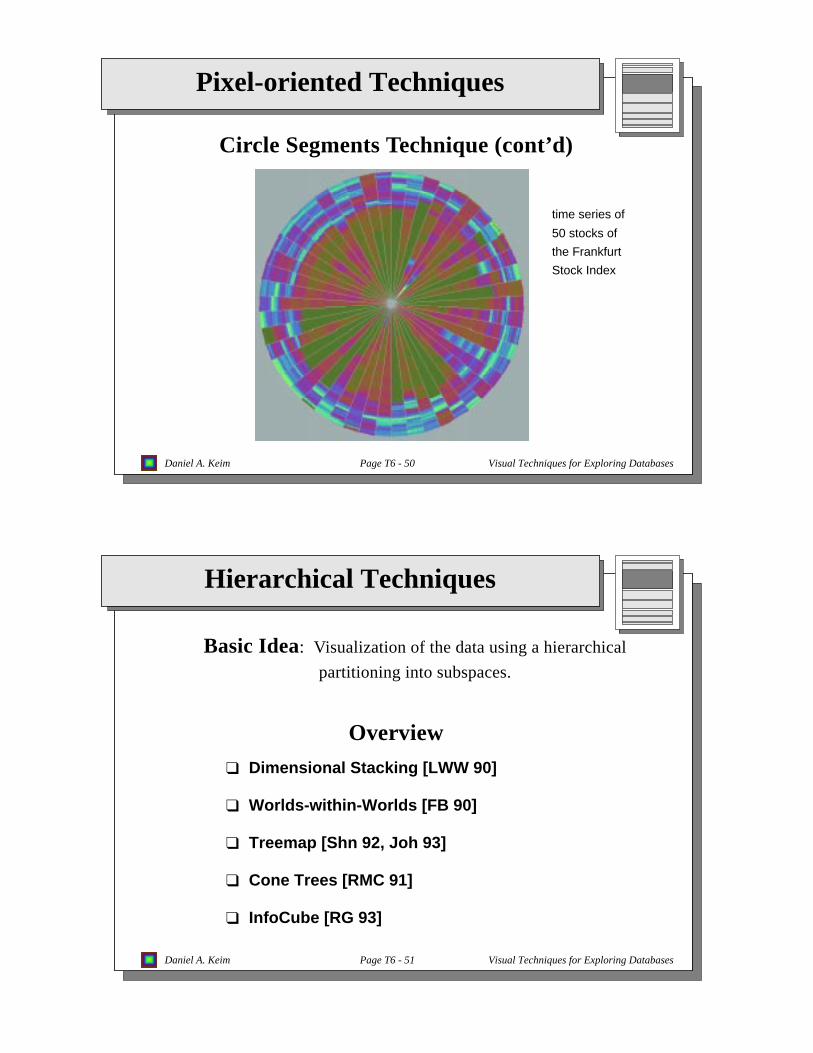
Circle Segments Technique [AKK 96]Arrangement of Attributes on the Segments of a Circle
Dim 15
Dim 7
Dim 6
Dim 5
Dim 4
Dim 3
Dim 1
Dim 2
Dim 8
Dim 14
Dim 13
Dim 12
Dim 11
Dim 10
Dim 9
Arrangement of 8-dim. Data Arrangement of 15-dim. Data
Daniel A. Keim Page T6 - 50 Visual Techniques for Exploring Databases
Pixel-oriented Techniques
Circle Segments Technique (cont’d)
time series of
50 stocks of
the Frankfurt
Stock Index
Daniel A. Keim Page T6 - 51 Visual Techniques for Exploring Databases
Hierarchical Techniques
Basic Idea: Visualization of the data using a hierarchical
partitioning into subspaces.
Overview
❑ Dimensional Stacking [LWW 90]
❑ Worlds-within-Worlds [FB 90]
❑ Treemap [Shn 92, Joh 93]
❑ Cone Trees [RMC 91]
❑ InfoCube [RG 93]

Daniel A. Keim Page T6 - 52 Visual Techniques for Exploring Databases
Hierarchical Techniques
Dimensional Stacking [LWW 90]
➪ partitioning of the n-dimensional attribute space in 2-dimensional
subspaces which are ‘stacked’ into each other
➪ partitioning of the attribute value ranges into classes
➪ the important attributes should be used on the outer levels
➪ adequate especially for data with ordinal attributes of low cardinality
attribute 1
attribute 2
attribute 3
attribute 4
Daniel A. Keim Page T6 - 53 Visual Techniques for Exploring Databases
Hierarchical Techniques
Dimensional Stacking (cont’d)
used by permission of M. Ward, Worcester Polytechnic Institute
visualization ofoil mining datawith longitudeand latitudemapped to theouter x-, y- axesand ore gradeand depthmapped to theinner x-, y- axes

Daniel A. Keim Page T6 - 54 Visual Techniques for Exploring Databases
Hierarchical Techniques
Worlds-within-Worlds [FB 90]
➪ partitioning of the n-dim. space into 3-dim. subspaces(e.g., a six-dim. object is displayed by having a new coordinate system forthe last three dimensions sit inside the coordinate system for the first three)
visualization of asix-dim. function
used by permission of C. Beshers, S. Feiner, Columbia University
Daniel A. Keim Page T6 - 55 Visual Techniques for Exploring Databases
Hierarchical Techniques
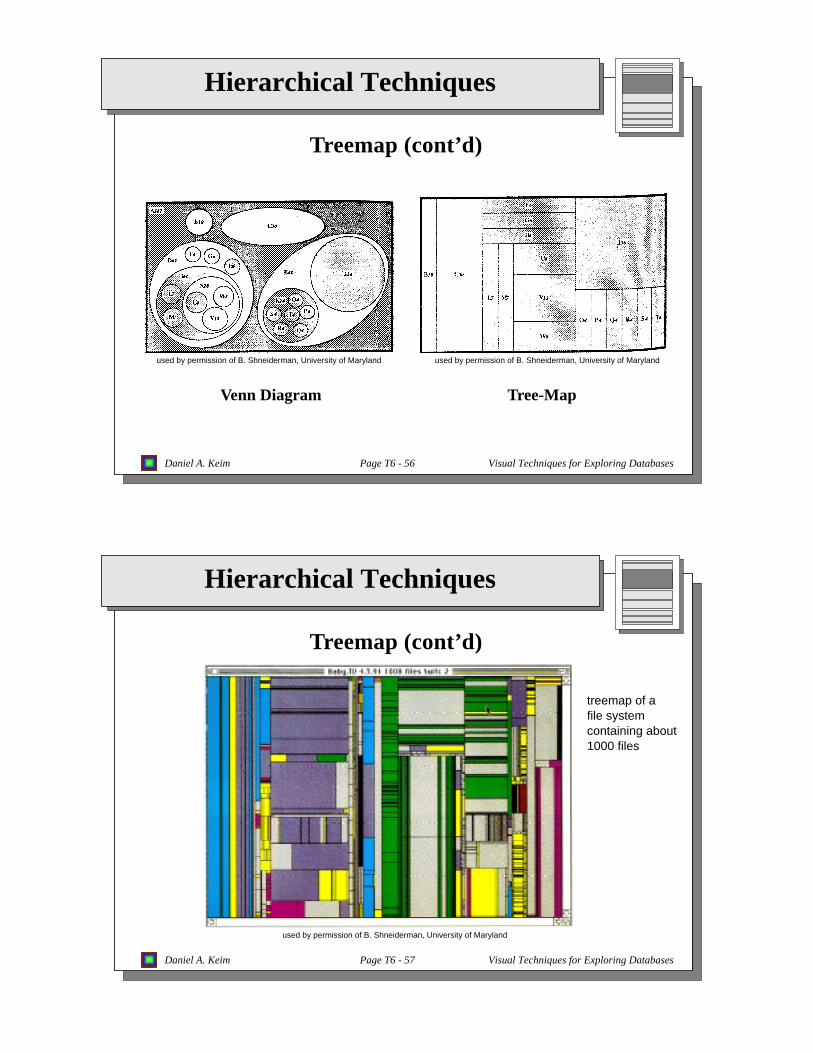
Treemap [Shn 92, Joh 93]
➪ screen-filling method which uses a hierarchical partitioning of the
screen into regions depending on the attribute values
➪ the x- and y-dimension of the screen are partitioned alternately
according to the attribute values (the attribute value ranges have
to be partitioned into classes)
➪ the attributes used for the partitioning and their ordering
are user-defined (the most important attributes should be used first)
➪ the color of the regions may correspond to an additional attribute
➪ suitable to get an overview over large amounts of hierarchical data
(e.g., file system) and for data with multiple ordinal attributes
(e.g., census data)
Daniel A. Keim Page T6 - 56 Visual Techniques for Exploring Databases
Hierarchical Techniques
Treemap (cont’d)
Venn Diagram Tree-Map
used by permission of B. Shneiderman, University of Maryland used by permission of B. Shneiderman, University of Maryland
Daniel A. Keim Page T6 - 57 Visual Techniques for Exploring Databases
Hierarchical Techniques
Treemap (cont’d)
treemap of afile systemcontaining about1000 files
used by permission of B. Shneiderman, University of Maryland

Daniel A. Keim Page T6 - 58 Visual Techniques for Exploring Databases
Hierarchical Techniques
Cone Trees [RMC 91]➪ animated 3D visualizations of hierarchical data
file system structure
visualized as a
cone tree
used
by
perm
issi
on o
f S. C
ard,
Xer
ox P
AR
C
Daniel A. Keim Page T6 - 59 Visual Techniques for Exploring Databases
Hierarchical Techniques
InfoCube [RG 93]
➪ 3D visualization of hierarchical data using transparent boxes
visualization of
a file system
structure
used
by
perm
issi
on o
f J. R
ekim
oto,
Son
y C
S L
ab In
c.

Daniel A. Keim Page T6 - 60 Visual Techniques for Exploring Databases
Graph-based Techniques
Basic Idea: Visualization of large graphs using techniques toconvey the meaning of the graph clearly and quickly.
Overview
❑ Basic Graphs (e.g., Straight-Line, Polyline, Curved-Line,
Orthogonal Graphs, ...)
❑ Specific Graphs (e.g., Directed Acyclic, Cluster-Optimized, Sym-
metry-Optimized Graphs, Hygraphs, ...)
❑ Systems (e.g., Tom Sawyer, Hy+ [CM 93, Con 94], SeeNet
[EW 93, BEW 95], Narcissus [HDWB 95], ...)
Daniel A. Keim Page T6 - 61 Visual Techniques for Exploring Databases
Graph-based Techniques
2D-Graph Drawings
Polyline Drawing Straight-Line Drawing Curved-Line Drawing

Daniel A. Keim Page T6 - 62 Visual Techniques for Exploring Databases
Graph-based Techniques
Properties of 2D-Graph Drawings❑ planarity (no line crossings)
❑ orthogonality (only orthogonal lines)
❑ grid property (coordinates of vertices are integers)
Aesthetics Properties (Optimization Goals)❑ minimal number of line crossings
❑ optimal display of symmetries
❑ optimal display of clusters
❑ minimal number of bends in polyline graphs
❑ uniform distribution of vertices
❑ uniform edge lengths
Daniel A. Keim Page T6 - 63 Visual Techniques for Exploring Databases
Graph-based Techniques
2D-Graph Drawings (Examples)
Orthogonal Graph Symmetry-Optimized Graph
T
om S
awer
Inc.
, CA
T
om S
awer
Inc.
, CA

Daniel A. Keim Page T6 - 64 Visual Techniques for Exploring Databases
Graph-based Techniques
2D-Graph Drawings (Examples)
Cluster-Optimized Graph
DirectedAcyclicGraph
T
om S
awer
Inc.
, CA
T
om S
awer
Inc.
, CA
Daniel A. Keim Page T6 - 65 Visual Techniques for Exploring Databases
Graph-based Techniques
2D-Graph Drawings: Open Problems [BETT 94]
❑ Performance Bounds (e.g. for planarization, ...)
❑ Dynamic Algorithms
❑ Parallel Algorithms
❑ Complexity of Bend Minimization
❑ Angular Resolution Constraints
❑ Three-dimensional Graph Drawings
Daniel A. Keim Page T6 - 66 Visual Techniques for Exploring Databases
Graph-based Techniques
3D-Graph Drawings
Ball-like Graph Torrus-like Graph
used
by
perm
issi
on o
f A. F
rick,
Uni
vers
ity o
f Kar
lsru
he
used
by
perm
issi
on o
f A. F
rick,
Uni
vers
ity o
f Kar
lsru
he
Daniel A. Keim Page T6 - 67 Visual Techniques for Exploring Databases
Graph-based Techniques
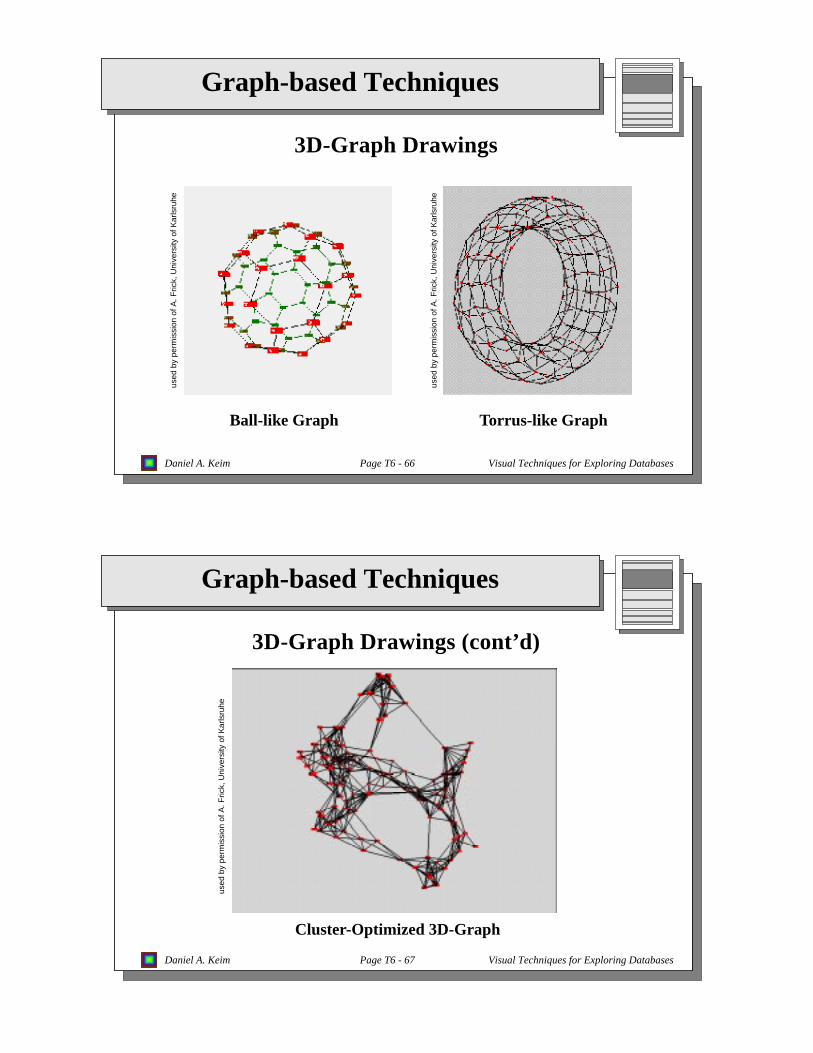
3D-Graph Drawings (cont’d)
Cluster-Optimized 3D-Graph
used
by
perm
issi
on o
f A. F
rick,
Uni
vers
ity o
f Kar
lsru
he

Daniel A. Keim Page T6 - 68 Visual Techniques for Exploring Databases
Graph-based Techniques
Hygraphs (cont’d)
➪ multi-resolution visualization of hygraphs allowingan interactive manipulation using Graphlog
visualization of a
web browsing sessionus
ed b
y pe
rmis
sion
of A
. Men
delz
on, U
nive
rsity
of T
oron
to
Daniel A. Keim Page T6 - 69 Visual Techniques for Exploring Databases
Graph-based Techniques
SeeNet [EW 93, BEW 95]➪ visualization of hierarchical networks with weighted links
➪ special features of SeeNet:
• semantic node placement
(minimizing the distance of nodes with high-weighted links)
• attributes are mapped to size and color of nodes and links
• interactivity for - changing the mappings
- expanding or collapsing nodes within the hierarchy
- getting additional information, etc.
➪ mappings in the example:
• size of nodes: number of e-mail messages of a person
• color of nodes: function of staff members
• size of links: number of e-mail messages of the link
• color of links: blue for few through green and yellow to red for many messages

Daniel A. Keim Page T6 - 70 Visual Techniques for Exploring Databases
Graph-based Techniques
SeeNet (cont’d)
visualization of all
e-mail connections
in a department
over a period of time
used
by
perm
issi
on o
f S. E
ick,
Bel
l Lab
s
Daniel A. Keim Page T6 - 71 Visual Techniques for Exploring Databases
Graph-based Techniques
Narcissus[HDWB 95]
➪ visualization of complex highly interconnected data (e.g., graphs such as the web)
visualization of
a large number
of web pages
used
by
perm
issi
on o
f B. H
endl
ey, U
nive
rsity
of B
irmin
gham

Daniel A. Keim Page T6 - 72 Visual Techniques for Exploring Databases
Hybrid Techniques
Basic Idea: Integrated use of multiple techniques in one ormultiple windows to enhance the expressivenessof the visualizations.
➪ linking diverse visualization techniques mayprovide additional information
➪ virtually all visualization techniques arecombined with dynamics & interactivity
Examples: IVEE [AW 95] usesStarfield Displays [AS 94] which arescatterplotsof icons with dynamic zooming and mapping(combination of geometric, icon-based, and dynamic techniques)
XmDv [War 94] allows to dynamically link and brush scatterplotmatrices, star icons, parallel coordinates, and dimensional stacking(combination of geometric, icon-based, hierarchical and dynamic techniques)
Daniel A. Keim Page T6 - 73 Visual Techniques for Exploring Databases
Distortion Techniques
Basic Idea: Distortion of the image to allow a visualizationof larger amounts of data
Overview❑ Simple: • Perspective Wall [MRC 91]
• Bifocal Displays [SA 82]
• TableLens [RC 94]
• Graph. Fisheye Views [Fur 86, SB 94]
• Hyperbolic Repr. [LR 94, LRP 95]
❑ Complex: • Hyperbolic Repr. [LR 94, LRP 95]
• 3D-Hyperbolic Repr. [MB 95]
• Hyperbox [AC 91]

Daniel A. Keim Page T6 - 74 Visual Techniques for Exploring Databases
Distortion Techniques
Perspective Wall [MRC 91]
➪ presentation of the data on a perspective wall
➪ the data outside the focal area are perspectively
reduced in size
➪ the perspective wall is a variant of the bifocal lens
display [SA 82] which horizontally compresses the
sides of the workspace by direct scaling
Daniel A. Keim Page T6 - 75 Visual Techniques for Exploring Databases
Distortion Techniques
Perspective Wall (cont’d)
documentsarranged on aperspective wall
used
by
perm
issi
on o
f S. C
ard,
Xer
ox P
AR
C

Daniel A. Keim Page T6 - 76 Visual Techniques for Exploring Databases
Distortion Techniques
Table Lens [RC 94]
➪ compact visualization of a table (spreadsheet / database) with the
possibility of viewing portions of the table in more detail
visualization of a
baseball database
with a few rows
being selected
in full detail
used
by
perm
issi
on o
f R. R
ao, X
erox
PA
RC
Daniel A. Keim Page T6 - 77 Visual Techniques for Exploring Databases
Distortion Techniques
Fisheye View [Fur 86, SB 94]
➪ graph visualization using a fisheye perspective
➪ shows an area of interest quite large and with detail and
the other areas successively smaller and in less detail
fisheye view of the graphoriginal graph
used
by
perm
issi
on o
f G. F
urna
s, U
nive
rsity
of M
ichi
gan

Daniel A. Keim Page T6 - 78 Visual Techniques for Exploring Databases
Distortion Techniques
Hyperbolic Trees [LR 94, LRP 95]
➪ visualization of a tree structure in hyperbolic space with different foci
visualizationof a largeorganizationalhierarchy
used by permission of R. Rao, Xerox PARCused by permission of R. Rao, Xerox PARC
Daniel A. Keim Page T6 - 79 Visual Techniques for Exploring Databases
Distortion Techniques
3D-Hyperbolic Representation[MB 95, MHCF 96]
➪ visualization of a graph in 3D hyperbolic conetree-like representation
visualization
of a large number
of connected
web-pages
used
by
perm
issi
on o
f T. M
unzn
er, S
tanf
ord
Uni
vers
ity

Daniel A. Keim Page T6 - 80 Visual Techniques for Exploring Databases
Distortion Techniques
Hyperbox [AC 91]
➪ mapping of scatterplots onto a hyperbox
parallel processing
visualized as a hyperbox
performance data
used
by
perm
issi
on o
f B. A
lper
n, IB
M W
atso
n R
esea
rch
Cen
ter
Daniel A. Keim Page T6 - 81 Visual Techniques for Exploring Databases
Dynamic / Interaction Techniques
Basic Idea: Dynamic generation of the visualizations orinteraction with the visualization for a moreeffective exploration of the data.
Overview
❑ Data-to-Visualization Mapping
❑ Projections
❑ Filtering (Selection, Querying)
❑ Linking & Brushing
❑ Zooming
❑ Detail on Demand

Daniel A. Keim Page T6 - 82 Visual Techniques for Exploring Databases
Dynamic / Interaction Techniques
❑ Dynamic / Interactive Data-to-Visualization Mapping
➪ dynamic or interactive mapping of the data attributes
to the parameters of the visualization
➪ parameters of the visualization are
• x-, y-, and z-axes
• color and size of icons, links, etc.
➪ examples: • AutoVisual [BF 93]
• S Plus [BCW 88]
• XGobi [SCB 92, BCS 96]
• IVEE / Spotfire [AW 95]
• ...
Daniel A. Keim Page T6 - 83 Visual Techniques for Exploring Databases
Dynamic / Interaction Techniques
❑ Dynamic / Interactive Projections
➪ dynamic or interactive variation of the projections
➪ visualization of the remaining parameters in 2D or 3D
➪ automatic variation results in an animation of the data
➪ examples: • GrandTour [Asi 85]
• S Plus [BCW 88]
• XGobi [SCB 92, BCS 96]
• Influence & Attribute Explorer [STDS 95, SDTS 95]
• ...
Daniel A. Keim Page T6 - 84 Visual Techniques for Exploring Databases
Dynamic / Interaction Techniques
❑ Dynamic / Interactive Filtering
➪ dynamic or interactive determination of subsets of the database
➪ distinction between• selection: direct selection of the desired subset• querying: specification of properties of the desired subset
➪ specific problem: specification of complex booleanconditions
➪ examples: • Magic Lenses [Bie 93] / Moveable Filter [FS 95]• Filter-Flow Model [YS 93]• InfoCrystal [Spo 93]• DEVise [Liv 97]• Dynamic Queries [AS 94, Eic 94, GR 94]• ...
Daniel A. Keim Page T6 - 85 Visual Techniques for Exploring Databases
Dynamic / Interaction Techniques
Magic Lenses / Moveable Filter [Bie 93, SFB 94, FS 95]
➪ interactive selection using lens-like tools which selectively
filter the data in the considered areas
➪ multiple lenses / moveable filters can be used for a
multi-level filtering (allowing complex conditions)
X
erox
PA
RC

Daniel A. Keim Page T6 - 86 Visual Techniques for Exploring Databases
Dynamic / Interaction Techniques
Filter-Flow Model [YS 93]
➪ selection based on a dataflow-oriented model:
the data flows through filter-units which reduce the flow
➪ especially useful for an intuitive specification of
complex boolean queries:
• AND-connected query portions may be specified using
multiple filter units in a pipeline fashion
• OR-connected query portions may be specified using multiple
independent flows which reunite into a single bigger flow
Daniel A. Keim Page T6 - 87 Visual Techniques for Exploring Databases
Dynamic / Interaction Techniques
Filter-Flow Model (cont’d)
complex boolean query:
Find the accountantsor engineers fromGeorgia who aremanaged by Elizabeth,or the clerks fromGeorgia who makemore than 30.000!
used
by
perm
issi
on o
f B. S
hnei
derm
an, U
nive
rsity
of M
aryl
and

Daniel A. Keim Page T6 - 88 Visual Techniques for Exploring Databases
Dynamic / Interaction Techniques
InfoCrystal [Spo 93]
➪ specification of complex boolean queries using an intuitive
model for specifying complex subsets
➪ basic idea:
1
23
4
5 6 7
A
BC
A
BC
Daniel A. Keim Page T6 - 89 Visual Techniques for Exploring Databases
Dynamic / Interaction Techniques
DEVise [Liv 97]
➪ tool set for the construction of interactive visualizations
interactive selection
of data items in the
upper two subwindows
used
by
perm
issi
on o
f R. R
amak
rishn
an, U
nive
rsity
of W
isco
nsin
Daniel A. Keim Page T6 - 90 Visual Techniques for Exploring Databases
Dynamic / Interaction Techniques
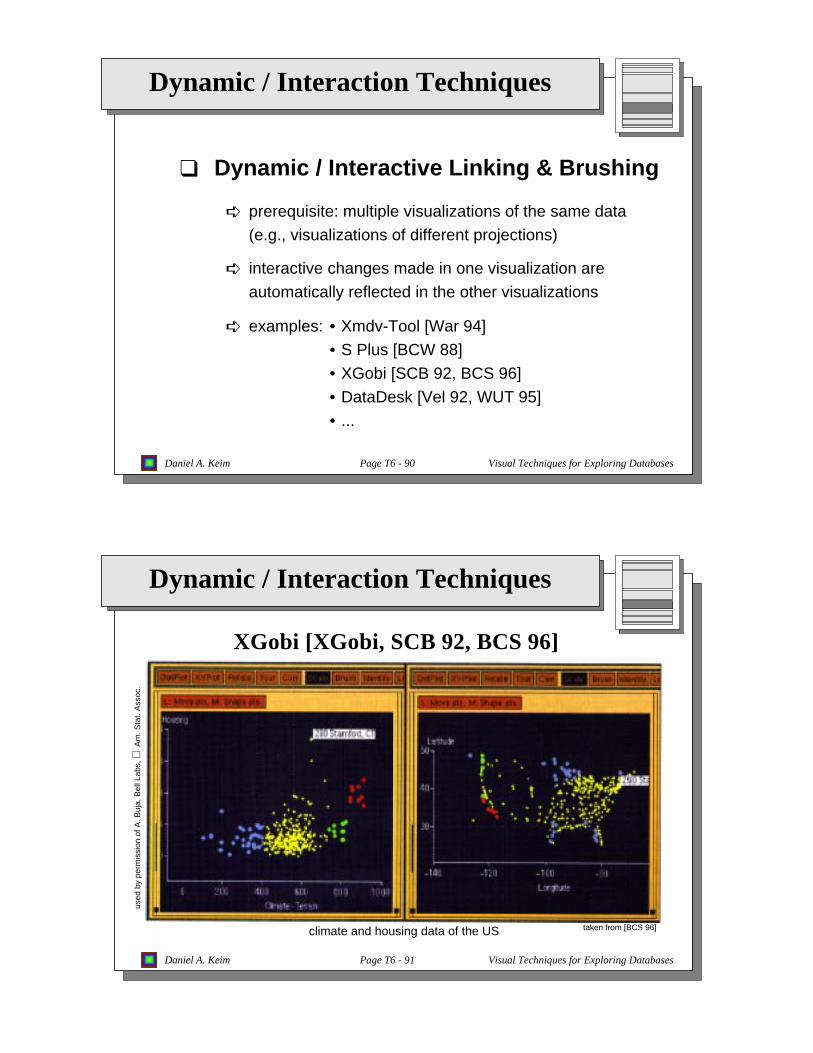
❑ Dynamic / Interactive Linking & Brushing
➪ prerequisite: multiple visualizations of the same data
(e.g., visualizations of different projections)
➪ interactive changes made in one visualization are
automatically reflected in the other visualizations
➪ examples: • Xmdv-Tool [War 94]
• S Plus [BCW 88]
• XGobi [SCB 92, BCS 96]
• DataDesk [Vel 92, WUT 95]
• ...
Daniel A. Keim Page T6 - 91 Visual Techniques for Exploring Databases
Dynamic / Interaction Techniques
XGobi [XGobi, SCB 92, BCS 96]
climate and housing data of the US
used
by
perm
issi
on o
f A. B
uja,
Bel
l Lab
s,
Am
. Sta
t. A
ssoc
.
taken from [BCS 96]
Daniel A. Keim Page T6 - 92 Visual Techniques for Exploring Databases
Dynamic / Interaction Techniques
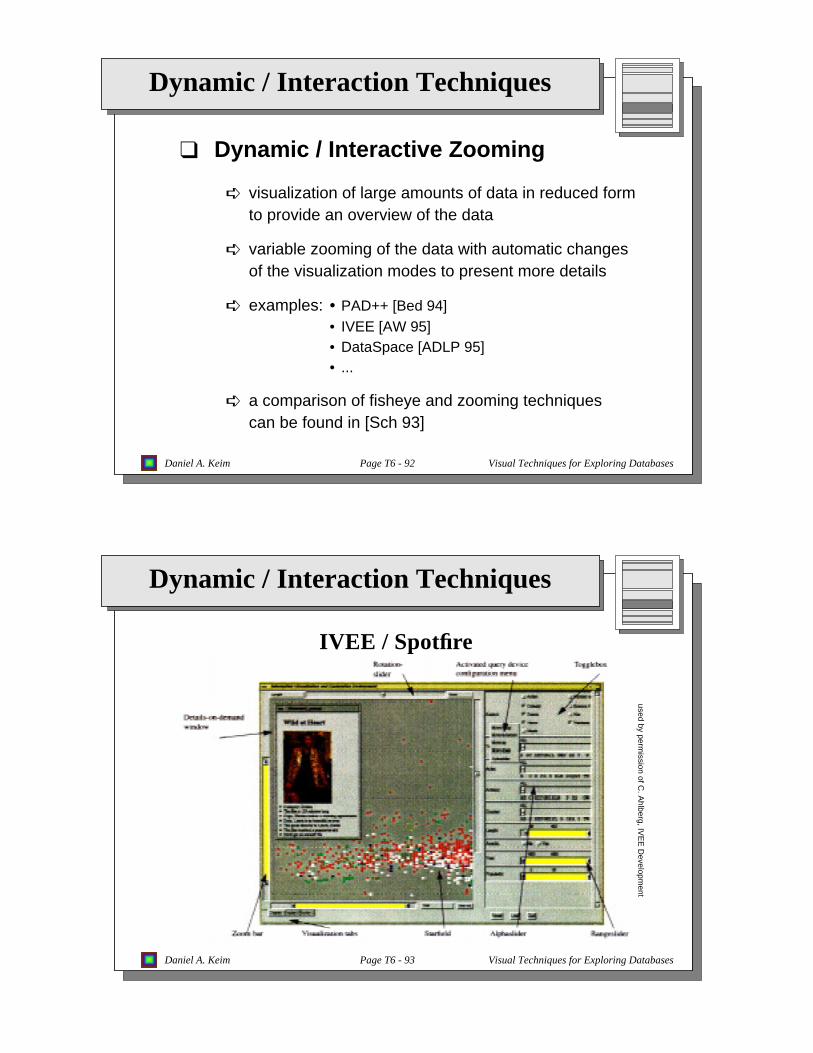
❑ Dynamic / Interactive Zooming
➪ visualization of large amounts of data in reduced formto provide an overview of the data
➪ variable zooming of the data with automatic changesof the visualization modes to present more details
➪ examples: • PAD++ [Bed 94]• IVEE [AW 95]• DataSpace [ADLP 95]• ...
➪ a comparison of fisheye and zooming techniquescan be found in [Sch 93]
Daniel A. Keim Page T6 - 93 Visual Techniques for Exploring Databases
Dynamic / Interaction Techniques
IVEE / Spotfire
used by permission of C
. Ahlberg, IV
EE
Developm
ent

Daniel A. Keim Page T6 - 94 Visual Techniques for Exploring Databases
Dynamic / Interaction Techniques
❑ Interactive Details on Demand
➪ the possibility to interactively obtain more details
of the visualized data
➪ details are, for example, the attribute values corresponding
to an icon or additional attribute values of a data item
➪ examples: • IVEE / Spotfire [AW 95]
• Table Lens [RC 94]
• Magic Lens [Bie 93]
• VisDB [KK 94, KK 95]
• ...
Daniel A. Keim Page T6 - 95 Visual Techniques for Exploring Databases
Dynamic / Interaction Techniques
VisDB

Daniel A. Keim Page T6 - 96 Visual Techniques for Exploring Databases
Comparison of the Techniques
Criteria for Comparison [KK 96]
comparison of the described information visualizationtechniques based on their suitability for certain
➪ data characteristics(e.g., no. of variates, no. of data items, categorical data, ...)
➪ task characteristics(e.g., clustering, multi variate hot spots, ...)
➪ visualization characteristics(e.g., visual overlap, learning curve, ...)
Disclaimer: The following comparison table expresses my personal opinion obtained fromreading the literature and experimenting with several of the described techniques.Many of the ratings are arguable and largely depend on the considered data, theexploration task, experience of the user, etc. In addition, implementations of thetechniques in real systems usually avoid the drawbacks of a single technique bycombining it with other techniques, which is also not reflected in the ratings.
Daniel A. Keim Page T6 - 97 Visual Techniques for Exploring Databases
Comparison of the Techniques
Comparison: An Attemptcluster-
ingmulti-variatehot spot
no. ofvariates
no. ofdataitems
cate-goricaldata
visualoverlap
learningcurve
GeometricTechniques
Scatterplot Matrices ++ ++ + + - o ++Landscapes + + - o o + +Prosection Views ++ ++ + + - o +Hyperslice + + + + - o oParallel Coordinates o ++ ++ - o -- o
Icon-basedTechniques
Stick Figure o o + - - - oShape Coding o - ++ + - + -Color Icon o - ++ + - + -
Pixel-orientedTechniques
Query-Independent + + ++ ++ - ++ +Query-Dependent + + ++ ++ - ++ -
HierarchicalTechniques
Dimensional Stacking + + o o ++ o oWorlds-within-Worlds o o o + o o oTreemap + o + o ++ + oCone Trees + + o + o + +InfoCube o o - - o o +
Graph-basedTechniques
Basic Graphs o o - + o o +Specific Graphs ++ + - + o + +

Daniel A. Keim Page T6 - 98 Visual Techniques for Exploring Databases
Database Visualization Systems
Overview
❑ Statistics-oriented Systems
❑ Visualization-oriented Systems
❑ Database-oriented Systems
❑ Special Purpose Visualization Systems
Daniel A. Keim Page T6 - 99 Visual Techniques for Exploring Databases
Database Visualization Systems
❑ Statistics-oriented Systems➪ S Plus [BCW 88] / Trellis [BCS 96]
(-> generic system for statistical analysis and visualization)
➪ XGobi [XGobi, SCB 92, BCS 96](-> extensible lisp-based system for statistical analysis and visualization)
➪ Data Desk [Vel 92, WUT 95](-> commercial system for statistical analysis and visualization;
features: dyn. linking & brushing of scatterplots and histograms)
➪ Diamond (SPSS)(-> commercial system for statistical analysis and visualization;
features: dyn. linking & brushing of scatterplots, parallel coordinates, etc.)
➪ DataSpace [ADLP 95](-> 3D-arrangement of a large number of arbitrary visualizations)
Daniel A. Keim Page T6 - 100 Visual Techniques for Exploring Databases
Database Visualization Systems
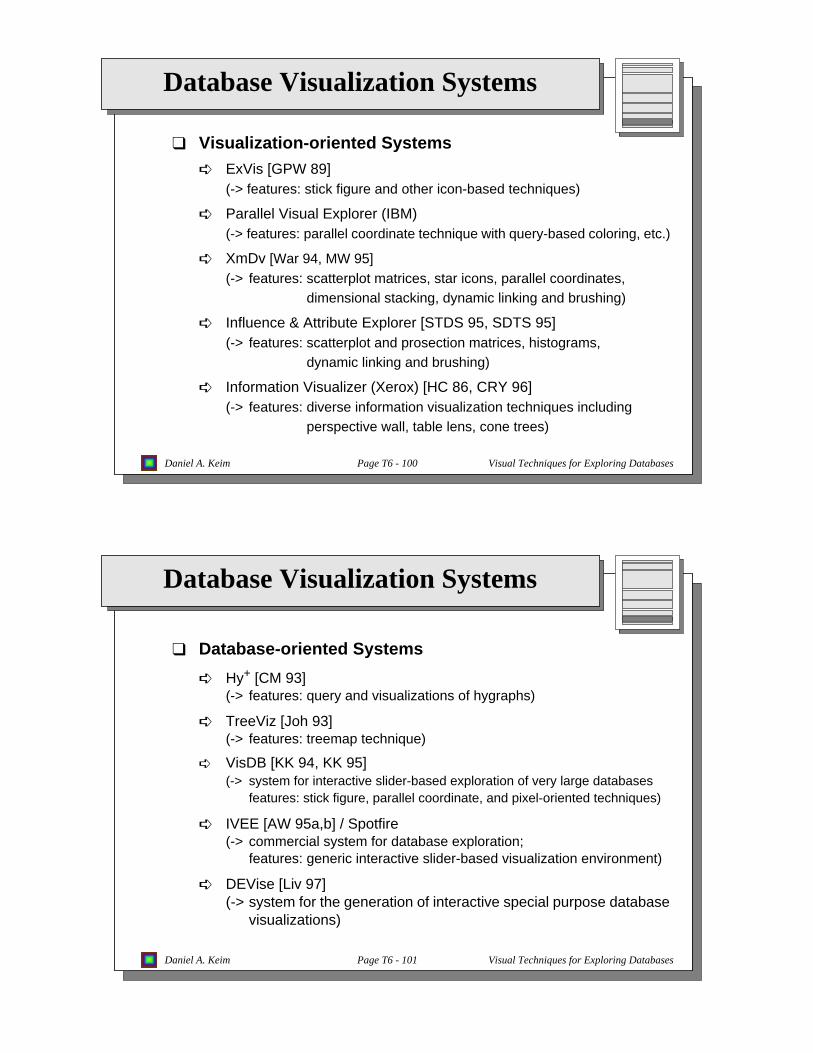
❑ Visualization-oriented Systems➪ ExVis [GPW 89]
(-> features: stick figure and other icon-based techniques)
➪ Parallel Visual Explorer (IBM)(-> features: parallel coordinate technique with query-based coloring, etc.)
➪ XmDv [War 94, MW 95](-> features: scatterplot matrices, star icons, parallel coordinates,
dimensional stacking, dynamic linking and brushing)
➪ Influence & Attribute Explorer [STDS 95, SDTS 95](-> features: scatterplot and prosection matrices, histograms,
dynamic linking and brushing)
➪ Information Visualizer (Xerox) [HC 86, CRY 96](-> features: diverse information visualization techniques including
perspective wall, table lens, cone trees)
Daniel A. Keim Page T6 - 101 Visual Techniques for Exploring Databases
Database Visualization Systems
❑ Database-oriented Systems
➪ Hy+ [CM 93](-> features: query and visualizations of hygraphs)
➪ TreeViz [Joh 93](-> features: treemap technique)
➪ VisDB [KK 94, KK 95](-> system for interactive slider-based exploration of very large databases
features: stick figure, parallel coordinate, and pixel-oriented techniques)
➪ IVEE [AW 95a,b] / Spotfire(-> commercial system for database exploration;
features: generic interactive slider-based visualization environment)
➪ DEVise [Liv 97](-> system for the generation of interactive special purpose database
visualizations)

Daniel A. Keim Page T6 - 102 Visual Techniques for Exploring Databases
Database Visualization Systems
❑ Special Purpose Visualization Systems
➪ Software & Algorithm Visualization(e.g., SeeSoft [ESS 92] - a listing of Information Retrieval Interfaces can be
found under “http://wwwendres.informatik.tu-muenchen.de/leute/trilk/sv.html”
for an overview paper see [SP 92])
➪ Web Visualization(e.g., Narcissus [HDWB 95], WebBook and WebForager [CRY 96]
- a listing of Information Retrieval Interfaces can be found under
“http://www.geog.ucl.ac.uk/casa/martin/geography_of_cyberspace.html”)
➪ Visualization in Information Retrieval(e.g., Vibe [Ols 93] - a listing of Information Retrieval Interfaces can be found
under “http://www-cui.darmstadt.gmd.de/visit/Activities/Viri/visual.html”)
Daniel A. Keim Page T6 - 103 Visual Techniques for Exploring Databases
Summary and Conclusions
Summary
❑ there are a number of recently developed visualizationtechniques which are applicable to database exploration
❑ there are different techniques for different types ofdata (relational tables, hierarchies, graphs, etc.)
❑ many of the techniques are applicable to traditionalrelational information sources
❑ there are a number of research prototypes andcommercial systems available

Daniel A. Keim Page T6 - 104 Visual Techniques for Exploring Databases
Summary and Conclusions
Research Issues
❑ development of integrated information visualization andexploration systems(integration with techniques from statistics, machinelearning, databases, ...)
❑ in-depth evaluation and comparison of visualization techniquesfor database exploration (-> possibilities for improvement)
❑ using more dynamics & interaction to steer the mining process
❑ case studies in a variety of application areas
Daniel A. Keim Page T6 - 105 Visual Techniques for Exploring Databases
Bibliography
[AC 91] Alpern B., Carter L.:‘Hyperbox’, Proc. Visualization ‘91, San Diego, CA, 1991, pp. 133-139.
[ADLP 95] Anupam V., Dar S., Leibfried T., Petajan E.:‘DataSpace: 3-D Visualization of Large Databases’, Proc. Int. Symp.on Information Visualization, Atlanta, GA, 1995, pp. 82-88.
[And 72] Andrews D. F.:‘Plots of High-Dimensional Data’, in: Biometrics, Vol. 29, 1972, pp. 125-136.
[And 95] Andrews K.:‘Visualizing Cyberspace: Information Visualization in the Harmony Internet Browser’, Proc. Int.Symp. on Information Visualization, Atlanta, GA, 1995, pp. 97-104.
[AS 82] Apperley M., Spence I. T.:‘A Bifocal Display Technique for Data Presentation’, Proc. Eurographics, 1982,pp. 27-43.
[AS 94] Ahlberg C., Shneiderman B.: ‘Visual Information Seeking: Tight Coupling of Dynamic Query Filters with StarfieldDisplays’, Proc. Human Factors in Computing Systems CHI ’94 Conf., Boston, MA, 1994, pp. 313-317.
[AS 95] Ayers E. Z., Stasko J. T.: ‘Using Graphic History in Browsing the World Wide Web’, Proc. 4th Int. World Wide WebConf., Boston, MA, 1995.
[Asi 85] Asimov D.: ‘The Grand Tour: A Tool For Viewing Multidimensional Data’,SIAM Journal of Science & Stat.Comp., Vol. 6, 1985, pp. 128-143.
[AW 95a] Ahlberg C., Wistrand E.:‘IVEE: An Environment for Automatic Creation of Dynamic Queries Applications’, Proc.Human Factors in Computing Systems CHI ’95 Conf., Demo Program, Denver, CO, 1995.
[AW 95b] Ahlberg C., Wistrand E.:‘IVEE: An Information Visualization and Exploration Environment’, Proc. Int. Symp. onInformation Visualization, Atlanta, GA, 1995, pp. 66-73.

Daniel A. Keim Page T6 - 106 Visual Techniques for Exploring Databases
Bibliography
[BCS 96] Becker R. A., Cleveland W. S., Shyu M.-J.:‘The Visual Design and Control of Trellis Display’, Journal ofComputational and Graphical Statistics, Vol. 5, No. 2, 1996, pp. 123-155.
[BCS 96] Buja A., Swayne D. F., Cook D.:‘Interactive High-Dimensional Data Visualization’,Journal of Computationaland Graphical Statistics, Vol. 5, No. 1, 1996, pp. 78-99.
[BCW 88] Becker R., Chambers J. M., Wilks A. R.:‘The New S Language’, Wadsworth & Brooks/Cole Advanced Books andSoftware, Pacific Grove, CA, 1988.
[BE 96] Ball T., Eick S.:‘Software Visualization in the Large’, Computer, Vol. 29, No. 4, 1996, pp. 33-43.
[Bed 90] Beddow J.:‘Shape Coding of Multidimensional Data on a Mircocomputer Display’, Visualization ‘90, SanFrancisco, CA, 1990, pp. 238-246.
[Bed 94] Bederson B.: ‘Pad++: Advances in Multiscale Interfaces’, Proc. Human Factors in Computing Systems CHI ’94Conf., Boston, MA, 1994, p. 315.
[BEMW 90] Becker R. A., Eick S. G., Miller E. O., Wilks A. R.:‘Dynamic Graphics for Network Visualization’, Proc.Visualization ’90, San Francisco, CA, 1990, pp. 93-95.
[Ben 95] Benford S., Snowdon D., Greenhaigh C., Ingram R., Knox I., Brown C.:‘Vr-vibe: A Virtual Environment for Co-operative Information Retrieval’, Proc. Eurographics ’95, Maastricht, The Netherlands, 1995, pp. 349-360.
[Ber 81] Bertin J.:‘Graphics and Graphic Information Processing’, Berlin, 1981.
Daniel A. Keim Page T6 - 107 Visual Techniques for Exploring Databases
Bibliography
[BETT 94] Battista G. D., Eades P., Tamassia R., Tollis I.:‘Annotated Bibliography on Graph Drawing Algorithms’,Computational Geometry: Theory and Applications, Vol. 4, 1994, pp. 235-282.
[BEW 95] Becker R. A., Eick S. G., Wilks A. R.:‘Visualizing Network Data’, Transactions on Visualization and ComputerGraphics, Vol. 1, No. 1, 1995, pp. 16-28.
[BEW 95] Becker R. A., Eick S. G., Wilks A. R.:‘Visualizing Network Data’, Transactions on Visualization and ComputerGraphics, Vol. 1, No. 1, 1995.
[BF 93] Beshers C., Feiner S.:‘AutoVisual: Rule-Based Design of Interactive Multivariate Visualizations’,IEEEComputer Graphics and Applications, Vol. 13, No. 4, 1993, pp. 41-49.
[BFN 86] Boecker H.-D., Fischer G., Nieper H.:‘The Enhancement of Unterstanding through Visual Representations’, Proc.Human Factors in Computing Systems CHI ’86 Conf., Boston, MA, 1986, pp. 44-58.
[BH 86] Bryce D., Hull R.: ‘SNAP: A Graphics Based Schema Manager’, Proc. 2nd Int. Conf. on Data Engineering, LosAngeles, CA, 1986, pp. 151-164.
[BH 91] Brown M. H., Hershberger J.:‘Color and Sound in Algorithm Animation’, Proc. IEEE Symp. on VisualLanguages, 1991, pp. 10-17.
[BH 94] Bederson B. B., Hollan J. D.:‘Pad++: A Zooming Graphical Interface for Exploring Alternate Interface Physics’,Proc. UIST, 1994, pp. 17-26.
[Bie 93] Bier E. A., Stone M. C., Pier K., Buxton W., DeRose T.:‘Toolglass and Magic Lenses: The see-through Interface’,Proc. SIGGRAPH ’93, Anaheim, CA, 1993, pp. 73-80.

Daniel A. Keim Page T6 - 108 Visual Techniques for Exploring Databases
Bibliography
[BMMS 91] Buja A., McDonald J. A., Michalak J., Stuetzle W.: ‘Interactive Data Visualization Using Focusing and Linking’,Visualization ‘91, San Diego, CA, 1991, pp. 156-163.
[BN 93] Brown M. H., Najork M. A.: ‘Algorithm Animation Using 3D Interactive Graphics’, Proc. UIST, 1993,pp. 93-100.
[Bro 91] Brown M. H.:‘Zeus: A System for Algorithm Animation and Multi-View Editing’, Proc. IEEE Symp. on VisualLanguages, 1991, pp. 4-9.
[Bro 93] Brown M. H.:‘The 1992 SRC Algorithm Animation Festival’, Proc. IEEE Symp. on Visual Languages, 1993,pp. 116-123.
[Car 96] Card S. K.:‘Visualizing Retrieved Information: A Survey’, IEEE CG&A, 1996, pp. 63-67.
[CE 95] Cox K. C., Eick S. G.:‘3D Displays of Internet Traffic’,Proc. Symp. on Information Visualization, Atlanta, GA,1995, pp. 129-131.
[CELR 94] Cohen R. F., Eades P., Lin T., Ruskey F.:‘Three-dimensional Graph Drawing’,Proc. Graph Drawing, 1994, in:Lecture Notes in Computer Science, Vol. 894, Springer, 1994, pp. 1-11.
[Che 73] Chernoff H.:'The Use of Faces to Represent Points in k-Dimensional Space Graphically’,Journal Amer. StatisticalAssociation, Vol. 68, pp. 361-368.
[CK 95] Carrière J., Kazman R.:‘Interacting with Huge Hierarchies: Beyond Cone Trees’, Proc. Symp. on InformationVisualization, Atlanta, GA, 1995, pp. 90-96.
Daniel A. Keim Page T6 - 109 Visual Techniques for Exploring Databases
Bibliography
[Cle 93] Cleveland W. S.:‘Visualizing Data’,AT&T Bell Laboratories, Murray Hill, NJ, Hobart Press, Summit NJ, 1993.
[Cle 94] Cleveland W. S.:‘The Elements of Graphing Data’,Hobart Press, Summit, NJ, revised edition.
[CM 93] Consens M. P., Mendelzon A. O.: ‘Hy+: A Hygraph-based Query and Visualization System’, Proc. ACMSIGMOD Int. Conf. on Management of Data, Washington, DC, 1993, pp. 511-516.
[Con 94] Consens M. P., Eigler F. Ch., Hasan M. Z., Mendelzon A. O., Noik E. G., Ryman A. G., Vista D.: ‘Architecture andApplications of the Hy+ Visualization System’, IBM Systems Journal, Vol. 33, No. 3, 1994, pp. 458-476.
[CPS 95] Chan M. C., Pacifici G., Stadler R.:‘Managing Real-Time Services in Multimedia Networks Using DynamicVisualization and high-level Controls’, Proc. Multimedia ’95, San Francisco, CA, 1995.
[CR 92] Cox K. C., Roman G.-C.:‘Abstraction in Algorithm Animation’,Proc. Symp. on Visual Languages, 1992,pp. 18-23.
[CRMK 95] Chuah M. C., Roth S. F., Mattis J., Kolojejchick J.:‘SDM: Malleable Information Graphics’, Proc. Symp. onInformation Visualization ’95, Atlanta, GA, 1995, pp. 36-42.
[CRY 96] Card S. K., Robertson G. G., York W.: ‘The WebBook and the WebForager: An Information Workspace for theWorld Wide Web’, Proc. Human Factors in Computing Systems CHI ’96 Conf., 1996.
[CT 94] Cruz I. F., Tamassia R.:‘How to Visualize a Graph: Specification and Algorithms’, 1994.
[DH 95] Drew N. S., Hendley R. J.:‘Visualizing Complex Interacting Systems’,Proc. Human Factors in ComputingSystems CHI’95 Conf., Denver, CO, 1995, pp. 204-205.

Daniel A. Keim Page T6 - 110 Visual Techniques for Exploring Databases
Bibliography
[Doe 94] Doemel P.:‘Webmap - A Graphical Hypertext Navigation Tool’,Proc. 2nd Int. World Wide Web Conf., Chicago,IL, 1994.
[Eic 94] Eick S. G.:‘Data Visualization Sliders’, Proc. ACM UIST, 1994, pp. 119-120.
[Eic 96] Eick S. G.:‘Aspects of Network Visualization’, Proc. IEEE CG&A, 1996, pp. 69-72.
[ES 92] Eick S. G., Steffen J. L.:‘Visualizing Code Profiling Line Oriented Statistics’, Proc. Visualization ’92, Boston,MA, 1992, pp. 210-217.
[ESS 92] Eick S. G., Steffen J. L., Sumner E. E.: ‘SeeSoft - A Tool for Visualizing Software’, IEEE Transactions on SoftwareEngineering, Vol. 18, No. 11, 1992, pp. 957-968.
[EW 93] Eick S. G., Wills G. J.:‘Navigating Large Networks with Hierarchies’, Visualization ‘93, San Jose, CA, 1993,pp. 204-210.
[FB 90] Feiner S., Beshers C.:‘Visualizing n-Dimensional Virtual Worlds with n-Vision’, Computer Graphics, Vol. 24, No.2, 1990, pp. 37-38.
[FB 90] Feiner S., Beshers C.:‘World within World: Metaphors for Exploring n-dimensional Virtual Worlds’, Proc. UIST,1990, pp. 76-83.
[FB 94] Furnas G. W., Buja A.:‘Prosections Views: Dimensional Inference through Sections and Projections’, Journal ofComputational and Graphical Statistics, Vol. 3, No. 4, 1994, pp. 323-353.
[FB 90] Feiner S., Beshers C.:‘Visualizing n-Dimensional Virtual Worlds with n-Vision’, Computer Graphics, Vol. 24,No. 2, 1990, pp. 37-38.
Daniel A. Keim Page T6 - 111 Visual Techniques for Exploring Databases
Bibliography
[FB 95] Furnas G. W., Bederson B. B.: ‘Space-Scale Diagrams: Unterstanding Multiscale Interfaces’, Proc. HumanFactors in Computing Systems CHI ’95 Conf., Denver, CO, 1995.
[FPF 88] Fairchild K., Poltrok S., Furnas G.:‘SemNet: Three Dimensional Graphic Representations of Large KnowledgeBases’, Lawrence Erlbaum (ed.), 1988, pp. 201-233.
[FS 95] Fishkin K., Stone M. C.:‘Enhanced Dynamic Queries via Movable Filters’, Proc. Human Factors in ComputingSystems CHI ’95 Conf., Denver, CO, 1995, pp. 415-420.
[Fur 86] Furnas G.: ‘Generalized Fisheye Views’, Proc. Human Factors in Computing Systems CHI‘86 Conf., Boston, MA,1986, pp. 18-23.
[FW 94] Frolich M., Werner M.:‘Demonstration of the Interactive Graph Visualization System da vinci’, Proc. GraphDrawing, 1994, in: Lecture Notes in Computer Science, Vol. 894, Springer, 1994, pp. 266-269.
[FZ 94] Furnas G. W., Zacks J.:‘Multitrees: Enriching and Reusing Hierarchical Structures’, Proc. Human Factors inComputing Systems CHI ’94 Conf., Boston, MA, 1994, pp. 330-336.
[Ger 95] Gershon N., LeVasseur J., Winstead J., Croall J., Pernick A., Ruh W.:‘Visualizing Internet Resources’, Proc. Sympon Information Visualization ’95, Atlanta, GA, 1995, pp. 122-128.
[Ger 96] Gershon N.:‘Moving Happily Through the World Wide Web’, Proc. IEEE CG&A, 1996, pp. 72-74.
[GKNV 93] Gansner E. R., Koutsofois E., North S. C., Vo K.-P.:‘A Technique for Drawing Directed Graphs’, IEEETransactions on Software Engineering, Vol. 19, No. 3, 1993, pp. 214-229.

Daniel A. Keim Page T6 - 112 Visual Techniques for Exploring Databases
Bibliography
[GPW 89] Grinstein G, Pickett R., Williams M. G.:‘EXVIS: An Exploratory Visualization Environment’, Proc. GraphicsInterface ‘89, London, Ontario, Canada, 1989.
[GR 94] Goldstein J., Roth S. F.:‘Using Aggregation and Dynamic Queries for Exploring Large Data Sets’, Proc. HumanFactors in Computing Systems CHI ’94 Conf., Boston, MA, 1994, pp. 23-29.
[GT 96] Garg A., Tamassia R.:‘Giotto3d: A System for Visualizing Hierarchical Structures in 3d’, Proc. GraphDrawing, ’96, in: Lecture Notes in Computer Science, Springer, 1996.
[Har 67] Harman H. H.:‘Modern Factor Analysis’,University of Chicago Press, 1967.
[HC 86] J.D.A. Henderson and S.K. Card:‘Rooms: The Use of Multiple Virtual Workspaces to Reduce Space Contentionin Window-based Graphical User Interfaces’, ACM Trans. on Graphics, Vol. 5, No. 3, July 1986, pp. 211-241.
[HDWB 95] Hendley R. J., Drew N. S., Wood A. M., Beale R.:‘Narcissus: Visualizing Information’, Proc. Int. Symp. onInformation Visualization, Atlanta, GA, 1995, pp. 90-94.
[Him 94] Himsolt M.: ‘Graphed: A Graphical Platform for the Implementation of Graph Algorithms’, Proc. GraphDrawing ’94, in: Lecture Notes in Computer Science, Vol. 894, Springer, pp. 182-193.
[Hub 85] Huber P. J.:‘Projection Pursuit’, The Annals of Statistics, Vol. 13, No. 2, 1985, pp. 435-474.
[Ins 85] Inselberg A.:‘The Plane with Parallel Coordinates, Special Issue on Computational Geometry’,The VisualComputer, Vol. 1, 1985, pp. 69-97.
Daniel A. Keim Page T6 - 113 Visual Techniques for Exploring Databases
Bibliography
[ID 90] Inselberg A., Dimsdale B.:‘Parallel Coordinates: A Tool for Visualizing Multi-Dimensional Geometry’,Visualization ‘90, San Francisco, CA, 1990, pp. 361-370.
[JJ 94] Jeron T., Jard C.:‘3D Layout of Reachability Graphics of Communicating Processes’, Proc. Graph Drawing ’94,in: Lecture Notes in Computer Science, Vol. 894, 1994, pp. 25-32.
[Joh 93] Johnson B.:‘Visualizing Hierarchical and Categorical Data’, Ph.D. Thesis, Department of Computer Science,University of Maryland, 1993.
[JS 91] Johnson B., Shneiderman B.:‘Treemaps: A Space-filling Approach to the Visualization of HierarchicalInformation’, Proc. Visualization ’91 Conf., 1991, pp. 284-291.
[JS 95] Jerding D. F., Stasko J. T.:‘The Information Mural: A Technique for Displaying and Navigating Large InformationSpaces’, Proc. Symp. on Information Visualization ’95, Atlanta, GA, 1995, pp. 43-50.
[Kei 96] Keim D. A.: ‘Pixel-oriented Visualization Techniques for Exploring Very Large Databases’,Journal ofComputational and Graphical Statistics, Vol. 5, No. 1, 1996, pp. 58-77.
[Kei 96] Keim D. A.: ‘Databases and Visualization’,Tutorial, ACM SIGMOD Int. Conf. on Management of Data,Montreal, Canada, 1996, p. 543.
[KK 94] Keim D. A., Kriegel H.-P.:‘VisDB: Database Exploration using Multidimensional Visualization’,ComputerGraphics & Applications, Sept. 1994, pp. 40-49.
[KK 95] Keim D. A., Kriegel H.-P.:‘VisDB: A System for Visualizing Large Databases’,System Demonstration, Proc.ACM SIGMOD Int. Conf. on Management of Data, San Jose, CA, 1995, p. 482.

Daniel A. Keim Page T6 - 114 Visual Techniques for Exploring Databases
Bibliography
[KKA 95] Keim D. A., Kriegel H.-P., Ankerst M.:‘Recursive Pattern: A Technique for Visualizing Very Large Amounts ofData’, Proc. Visualization ‘95, Atlanta, GA, 1995, pp. 279-286.
[KKS 94] Keim D. A., Kriegel H.-P., Seidl T.:‘Supporting Data Mining of Large Databases by Visual Feedback Queries’,Proc. 10th Int. Conf. on Data Engineering, Houston, TX, 1994, pp. 302-313.
[KK 96] Keim D. A., Kriegel H.-P.: ‘Visualization Techniques for Mining Large Databases: A Comparison’, Transactionson Knowledge and Data Engineering, Vol. 8, No. 6, Dec. 1996, pp. 923-938.
[KL 93] Keim D. A., Lum V.: ‘GRADI: A Graphical Database Interface for a Multimedia DBMS’,Proc. Int. Workshop onInterfaces to Databases, Glasgow, England, 1992, in: Workshops in Computing, Springer, 1993, pp. 95-112.
[KRB 94] Kaugars K., Reinfelds J., Brazma A.:‘A Simple Algorithm for Drawing Large Graphs on Small Screens’, Proc.Graph Drawing ’94, in: Lecture Notes in Computer Science, Vol. 894, Springer, 1994, pp. 278-281.
[LA 94] Leung Y., Apperley M.:‘A Review and Taxonomy of Distortion-oriented Presentation Techniques’,Proc. HumanFactors in Computing Systems CHI ’94 Conf., Boston, MA, 1994, pp. 126-160.
[Lev 91] Levkowitz H.: ‘Color icons: Merging color and texture perception for integrated visualization of multipleparameters’,In Visualization ‘91, San Diego, CA, October 22-25 1991.
[Liv 97] Miron Livny, Raghu Ramakrishnan, Kevin Beyer, Guangshun Chen, Donko Donjerkovic, Shilpa Lawande, JussiMyllymaki, and Kent Wenger:‘DEVise: Integrated Querying and Visual Exploration of Large Datasets’, Proc. ofACM SIGMOD, May, 1997.
Daniel A. Keim Page T6 - 115 Visual Techniques for Exploring Databases
Bibliography
[LR 94] Lamping J., Rao R.:‘Laying out and Visualizing Large Trees Using a Hyperbolic Space’,Proc. UIST, 1994,pp. 13-14.
[LRP 95] Lamping J., Rao R., Pirolli P.:‘A Focus + Context Technique Based on Hyperbolic Geometry for Visualizing LargeHierarchies’,Proc. Human Factors in Computing Systems CHI ’95 Conf., Denver, CO, 1995, pp. 401-408.
[LSR 96] Lamm S. E., Scullin W. H., Reed D. A.:‘Real-time Geographic Visualization of World Wide Web Traffic’,Proc.WWW, 1996.
[LWW 90] LeBlanc J., Ward M. O., Wittels N.:‘Exploring N-Dimensional Databases’,Visualization ‘90, San Francisco, CA,1990, pp. 230-239.
[MB 95] Munzner T., Burchard P.:‘Visualizing the Structure of the World Wide Web in 3D Hyperbolic Space’,Proc. VRML’95 Symp, San Diego, CA, 1995, pp. 33-38.
[MF 95] Mukherjea S., Foley J. D.:‘Showing the Context of Nodes in the World-Wide Web’,Proc. ACM SIGCHI, Denver,CO, 1995.
[MF 95] Mukherjea S., Foley J. D.:‘Visualizing Complex Hypermedia Networks through Multiple Hierarchical Views’,Proc. ACM SIGCHI, Denver, CO, 1995.
[MF 95] Mukherjea S., Foley J. D.:‘Visualizing the World-Wide Web with the Navigational View Builder’,Proc. 3rd Int.World Wide Web Conf., Darmstadt, Germany, 1995.
[MGTS 90] Mihalisin T., Gawlinski E., Timlin J., Schwendler J.:‘Visualizing A Scalar Field on an N-dimensional Lattice’,Visualization ‘90, San Francisco, CA, 1990, pp. 255-262.

Daniel A. Keim Page T6 - 116 Visual Techniques for Exploring Databases
Bibliography
[MHCF 96] Munzner T., Hoffman E., Claffy K., Fenner B.:‘Visualizing the Global Topology of the mbone’,Proc. Symp. onInformation Visualization, 1996.
[MMIK 95] Masui T., Minakuchi M., IV G. R., Kashiwagi K.:‘Multiple-View Approach for Smooth Information Retrieval’,Proc. UIST, 1995, pp. 199-206.
[MRC 91] Mackinlay J. D., Robertson G. G., Card S. K.:‘The Perspective Wall: Detail and Context Smoothly Integrated’,Proc. Human Factors in Computing Systems CHI ’91 Conf., New Orleans, LA, 1991, pp. 173-179.
[MSG 94] McCreary C., Shieh F.-S., Gill H.:‘Cg: A Graph Drawing System Using Graph-Grammar Parsing’,Proc. GraphDrawing ’94, in: Lecture Notes in Computer Science, Vol. 894, Springer, 1994, pp. 270-273.
[MW 95] Martin A. R., Ward M. O.:‘High Dimensional Brushing for Interactive Exploration of Multivariate Data’,Visualization ’95, Atlanta, GA, 1995, pp. 271-278.
[Mye 94] Myers B. A.:‘Visual Programming, Programming by Example and Program Visualization: A Taxonomy’,Proc.Human Factors in Computing Systems CHI ’94 Conf., Boston, MA, 1994, pp. 59-66.
[NK 94] North S. C., Koutsofois E.:‘Applications of Graph Visualization’,Proc. Graphics Interface, 1994, pp. 235-245.
[Noi 93] Noik E. G.: ‘Layout-independent Fisheye Views of Nested Graphs’,Proc. Symp. on Visual Languages, 1993,pp. 336-341.
[Noi 94] Noik E. G.: ‘Encoding Presentation Emphasis Algorithms for Graphs’,Proc. Graph Drawing ’94, in: LectureNotes in Computer Science, Vol. 894, Springer, 1994, pp. 428-235.
Daniel A. Keim Page T6 - 117 Visual Techniques for Exploring Databases
Bibliography
[Noi 94] Noik E. G.: ‘A Space of Presentation Emphasis Techniques for Visualizing Graphs’,Proc. Graphics Interface,1994, pp. 225-233.
[Ols 93] Olsen K.A. et al.:‘Visualization of a Document Collection: The VIBE System’,Information Processing andManagement, Vol. 29, No. 1, 1993, pp. 69-81.
[OW 93] Ozoyoglu G., Wang H.:‘Example-Based Graphical Database Query Languages’, Computer, Vol. 26, No. 5,1993, pp. 25-38.
[PB 94] Pitkow J., Bharat K.:‘Webviz: A Tool for World-Wide Web Access Log Visualization’,Proc. 1st Int. World WideWeb Conf., Geneva, Switzerland, 1994.
[PF 93] Perlin K., Fox D.:‘Pad: An Alternative Approach to the Computer Interface’,Proc. SIGGRAPH, Anaheim, CA,1993, pp. 57-64.
[PG 88] Pickett R. M., Grinstein G. G.:‘Iconographic Displays for Visualizing Multidimensional Data’,Proc. IEEE Conf.on Systems, Man and Cybernetics, IEEE Press, Piscataway, NJ, 1988, pp. 514-519.
[Pic 70] Pickett R. M.:‘Visual Analyses of Texture in the Detection and Recognition of Objects’,in: Picture Processing andPsycho-Pictorics, Lipkin B. S., Rosenfeld A. (eds.), Academic Press, New York, 1970.
[Rao 92] Rao R., Card S. K., Jellinek H. D., Mackinlay J. D., Robertson G. G.:‘The Information Grid: A Framework forInformation Retrieval and Retrieval-centered Applications’,Proc. UIST, 1992, pp. 23-32.

Daniel A. Keim Page T6 - 118 Visual Techniques for Exploring Databases
Bibliography
[RC 94] Rao R., Card S. K.:‘The Table Lens: Merging Graphical and Symbolic Representation in an InteractiveFocus+Context Visualization for Tabular Information’, Proc. Human Factors in Computing Systems CHI ‘94Conf., Boston, MA, 1994, pp. 318-322.
[RCM 93] Robertson G. G., Card S. K., Mackinlay J. D.:‘Information Visualization Using 3D Interactive Animation’,Communications of the ACM, Vol. 36, No. 4, 1993, pp. 57-71.
[Reg 93] Regan B.:‘Two Algorithms for Drawing Trees in Three Dimensions’,Proc. Graph Drawing, 1993.
[Rei 93] Reiss S. P.:‘A Framework for Abstract 3D Visualization’,Proc. Symp. on Visual Languages, 1993, pp. 108-115.
[Rei 94] Reiss S. P.:‘3-D Visualization of Program Information’,Proc. Graph Drawing, 1994, in: Lecture Notes inComputer Science, Vol. 894, Springer, 1994, pp. 12-24.
[Ren 94] Rennison E.:‘Galaxy of News: An Approach to Visualizing and Understanding Expansive News Landscapes’,Proc. UIST, 1994, pp. 3-12.
[RG 93] Rekimoto J., Green M.:‘The Information Cube: Using Transparency in 3d Information Visualization’,Proc. 3rdAnnual Workshop on Information Technologies & Systems (WITS ’93), 1993, pp. 125-132.
[RM 93] Robertson G. G., Mackinlay J. D.:‘The Document Lens’, Proc. UIST, 1993, pp. 101-108.
[RMC 91] Robertson G. G., Mackinlay J. D., Card S. K.:‘Cone Trees: Animated 3D Visualizations of HierarchicalInformation’, Proc. Human Factors in Computing Systems CHI ‘91 Conf., New Orleans, LA, 1991, pp. 189-194.
Daniel A. Keim Page T6 - 119 Visual Techniques for Exploring Databases
Bibliography
[SA 82] Spence R., Apperley M.:‘Data Base Navigation: An Office Environment for the Professional’, Behaviour andInformation Technology, Vol. 1, No. 1, pp. 43-54.
[San 94] Sander G.:‘Graph Layout through the VCG Tool’, Proc. Graph Drawing, 1994, in: Lecture Notes in ComputerScience, Springer, Vol. 894, Springer, 1994, pp. 194-205.
[SB 94] Sarkar M., Brown M.:‘Graphical Fisheye Views’, Communications of the ACM, Vol. 37, No. 12, 1994, pp. 73-84.
[SCB 92] Swayne D. F., Cook D., Buja A.:‘User’s Manual for XGobi: A Dynamic Graphics Program for Data Analysis’,Bellcore Technical Memorandum, 1992.
[Sch 93] Schaffer, Doug, Zuo, Zhengping, Bartram, Lyn, Dill, John, Dubs, Shelli, Greenberg, Saul, Roseman, Mark:‘Comparing Fisheye and Full-Zoom Techniques for Navigation of Hierarchically Clustered Networks’, Proc.Graphics Interface (GI ’93), Toronto, Ontario, 1993, in: Canadian Information Processing Soc., Toronto, Ontario,Graphics Press, Cheshire, CT, 1993, pp. 87-96.
[SDTS 95] Su H., Dawkes H., Tweedie L., Spence R.:‘An Interactive Visualization Tool for Tolerance Design’,TechnicalReport, Imperial College, London, 1995.
[SFB 94] Stone M. C., Fishkin K., Bier E. A.:‘The Movable Filter as a User Interface Tool’, Proc. Human Factors inComputing Systems CHI ‘94 Conf., Boston, MA, 1994, pp. 306-312.
[Shn 92] Shneiderman B.:‘Tree Visualization with Treemaps: A 2D Space-Filling Approach’,ACM Transactions onGraphics, Vol. 11, No. 1, pp. 92-99, 1992.

Daniel A. Keim Page T6 - 120 Visual Techniques for Exploring Databases
Bibliography
[SM 94] Sugiyama K., Misue K.:‘A Simple and Unified Method for Drawing Graphs: Magnetic-spring Algorithm’, Proc.Graph Drawing, 1994, in: Lecture Notes in Computer Science, Vol. 894, Springer, 1994, pp. 364-375.
[SP 92] Stasko, John T. and Patterson, Charles, "Understanding and Characterizing Software Visualization Systems",Proc. of the 1992 IEEE Workshop on Visual Languages, Seattle, WA, September 1992, pp. 3-10.
[Spo 93] Spoerri A.:‘InfoCrystal: A Visual Tool for Information Retrieval’,Visualization ‘93, San Jose, CA, 1993,pp. 150-157.
[STDS 95] Spence R., Tweedie L., Dawkes H., Su H.:‘Visualization for Functional Design’,Proc. Int. Symp. on InformationVisualization (InfoVis ‘95), Atlanta, GA, 1995, pp.4-10.
[SRN 72] Shepard R. N., Romney A. K., Nerlove S. B.:‘Multidimensional Scaling’,Seminar Press, New York, 1972.
[SW 93] Stasko J. T., Wehrli J. F.:‘Three-dimensional Computation Visualization’, Proc. Symp. on Visual Languages,Bergen, Norway, 1993, pp. 100-107.
[TD 95] Tal A., Dobkin D.: ‘Visualization of Geometric Algorithms’, Transactions on Visualization and ComputerGraphics, Vol. 1, No. 2, 1995, pp. 194-204.
[Tuf 83] Tufte E. R.:‘The Visual Display of Quantitative Information’, Graphics Press, Cheshire, CT, 1983.
[Tuf 90] Tufte E. R.:‘Envisioning Information’, Graphics Press, Cheshire, CT, 1990.
[Vas 94] Vasudevan V.:‘Supporting High Bandwidth Navigation in Object-Bases’,Proc. 10th Int. Conf. on DataEngineering, Houston, TX, 1994, pp. 294-301.
Daniel A. Keim Page T6 - 121 Visual Techniques for Exploring Databases
Bibliography
[Vel 92] Velleman P. F:‘Data Desk 4.2: Data Description’, Ithaca, NY, 1992.
[War 94] Ward M. O.:‘XmdvTool: Integrating Multiple Methods for Visualizing Multivariate Data’,Visualization’94,Washington, DC, 1994, pp. 326-336.
[Wis 95] Wise J. A., Thomas J. J., Pennock K., Lantrip D., Pottier M., Schur A., Crow V.:‘Visualizing the Non-Visual:Spatial Analysis and Interaction with Information from Text Documents’, Proc. Symp. on InformationVisualization, Atlanta, GA, 1995, pp. 51-58.
[WB 95] Wong P.C., Bergeron R. D.:‘30 Years of Multidimensional Multivariate Visualization’,Proc. Workshop onScientific Visualization, IEEE Computer Society Press, 1995.
[WDBH 95] Wood A., Drew N., Beale R., Hendley B.:‘Hyperspace: Web Browsing with Visualisation’, Proc. 3rd Int. World-Wide Web Conf., Poster, 1995, Darmstadt, Germany.
[WL 93] van Wijk J. J., van Liere R.. D.:‘Hyperslice’,Proc. Visualization ‘93, San Jose, CA, 1993, pp. 119-125.
[Wri 95] Wright W.: ‘Information Animation Applications in the Capital Markets’, Proc. Int. Symp. on InformationVisualization, Atlanta, GA, 1995, pp. 19-25.
[WUT 95] Wilhelm A., Unwin A.R., Theus M.:‘Software for Interactive Statistical Graphics - A Review’, Proc. Int.Softstat ‘95 Conf., Heidelberg, Germany, 1995.
[XGobi] XGobi Web-Page including pointers to publications and the most recent release of the XGobi software:“http://www.research.att.com/~andreas/xgobi/”.
[Zlo 77] Zloof M. M.: ‘Query-By-Example: A Data Base Language’, IBM Systems Journal, Vol. 4, 1977, pp. 324-343.