visualizing data for enterprise oems with jreport
TRANSCRIPT

Visualizing Data for Enterprise OEMs with JReport
Craig Harmon Product Marketing Greg Harris Systems Engineer

High Performance and Scalable Intelligent push-down In-memory cubes Clustered servers Self-Serviceable So easy anyone can use Interactive charts, controls, widgets Flexible and Embeddable Any data source: from RDB to Big Data and Cloud Deliver anywhere: from PC to mobile Customizable and embeddable
Advanced BI Visualization:
JReport Highlight
2
Simplify the Complexity
of Reporting and Visualization
JReport’s Mission
3
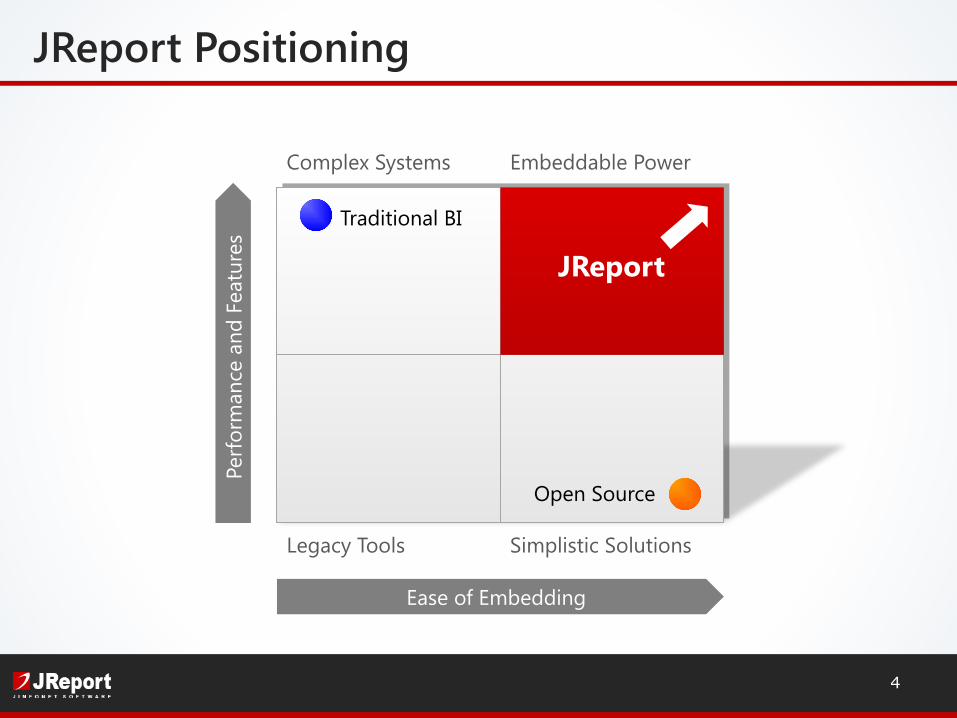
Ease of Embedding
Complex Systems
Simplistic Solutions
Embeddable Power
Legacy Tools
Perf
orm
ance
and
Fea
ture
s Traditional BI
Open Source
JReport
JReport Positioning
4

5
OEMCustomers that embed JReport into their products Typically hosted “on-premise” Multiple instances of JReport Software as a Service (SaaS)Typically hosted in the cloudBrowser-based access for internal or external users Variety of licensing models for subscribers
JReport works with all deployment types.
OEM vs. SaaS Delivery
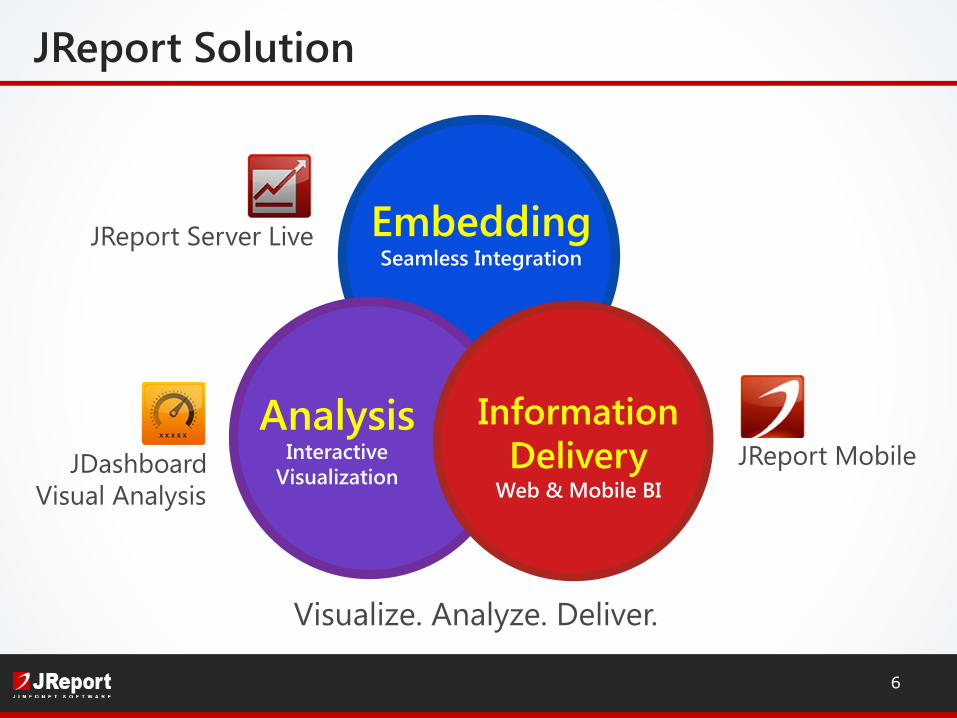
JReport Solution
6
Analysis Interactive
Visualization
Embedding Seamless Integration
JReport Server Live
JDashboard Visual Analysis
JReport Mobile
Visualize. Analyze. Deliver.
Information Delivery
Web & Mobile BI
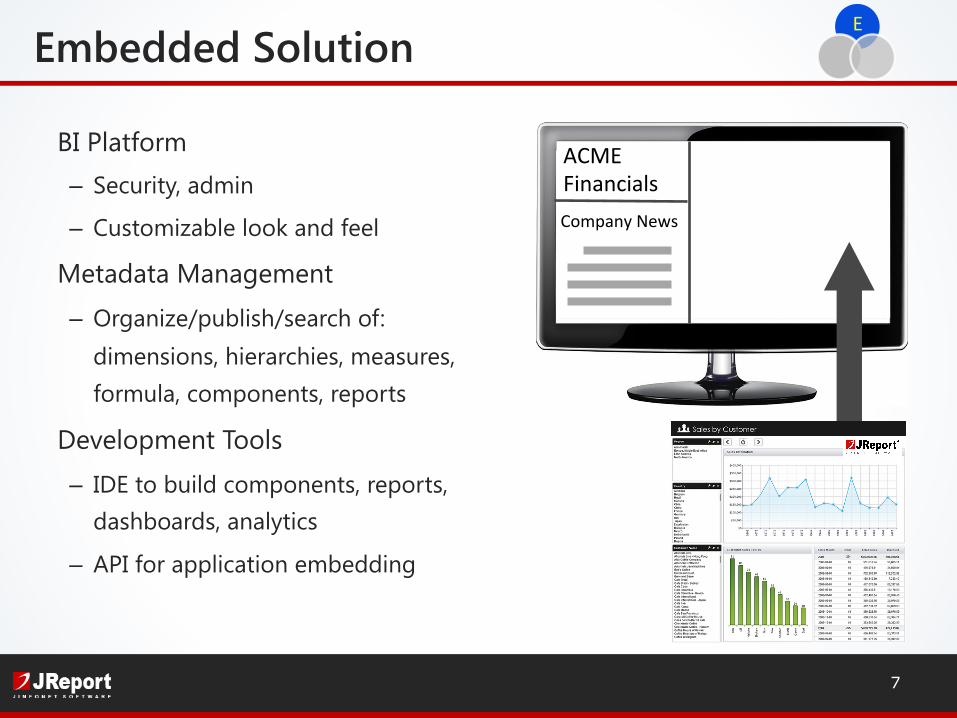
ACME Financials Company News
BI Platform – Security, admin
– Customizable look and feel
Metadata Management
– Organize/publish/search of: dimensions, hierarchies, measures, formula, components, reports
Development Tools
– IDE to build components, reports, dashboards, analytics
– API for application embedding
7
E Embedded Solution
8
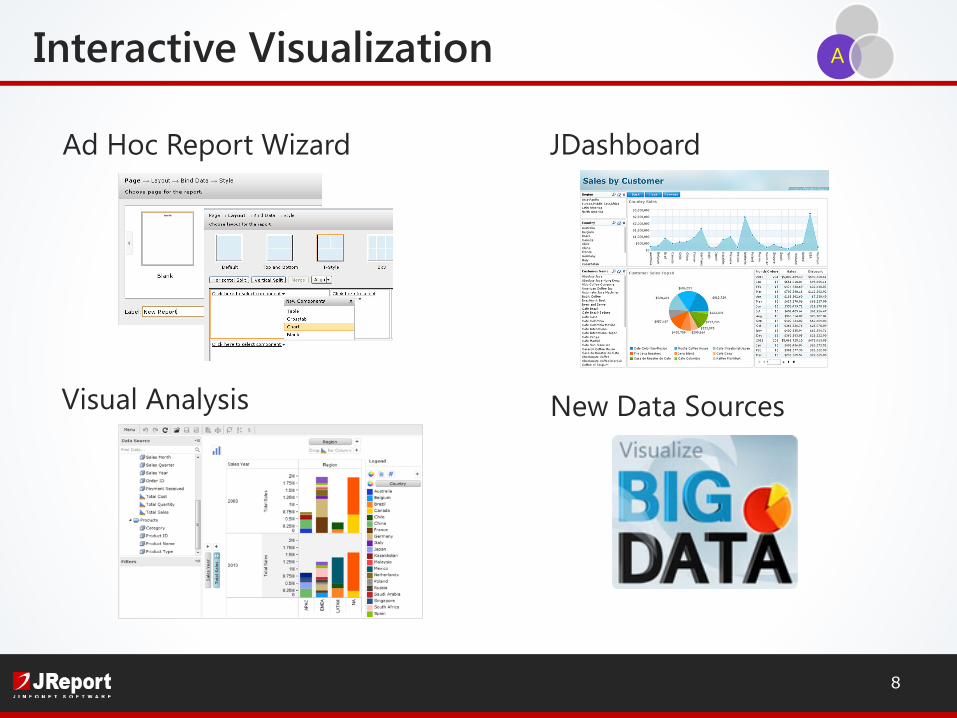
A Interactive Visualization
Visual Analysis
Ad Hoc Report Wizard JDashboard
New Data Sources
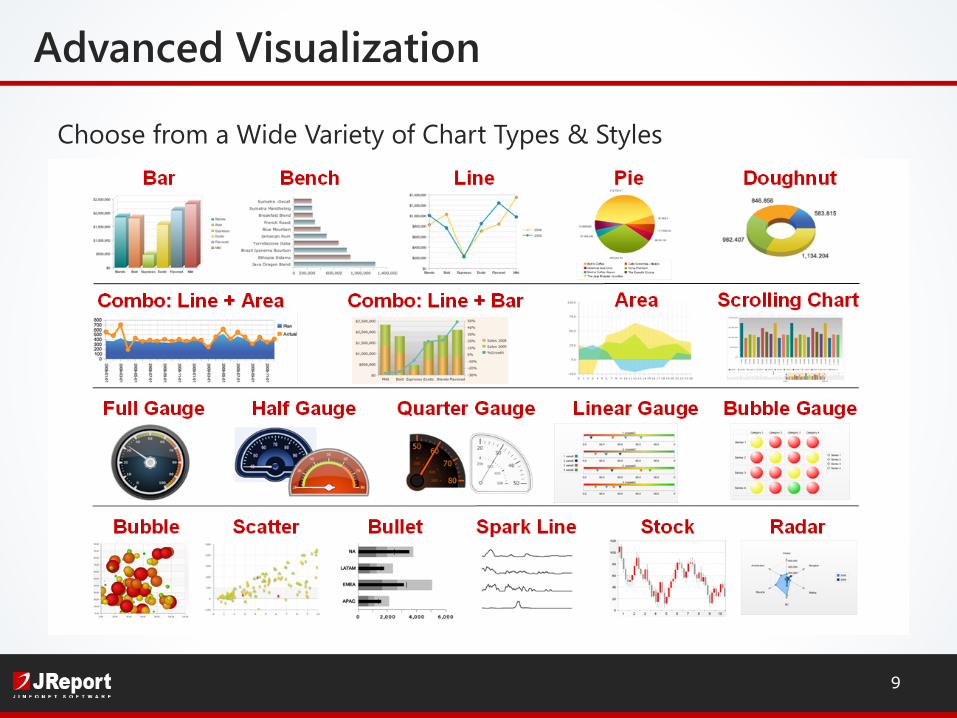
Choose from a Wide Variety of Chart Types & Styles
9
Advanced Visualization
10
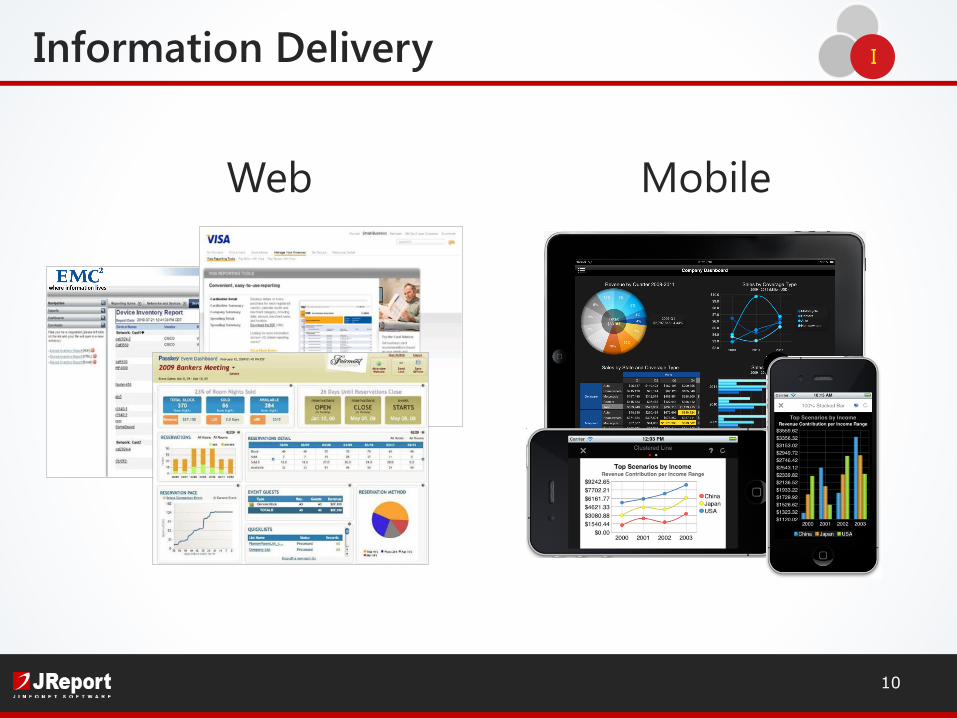
Information Delivery I
Web Mobile
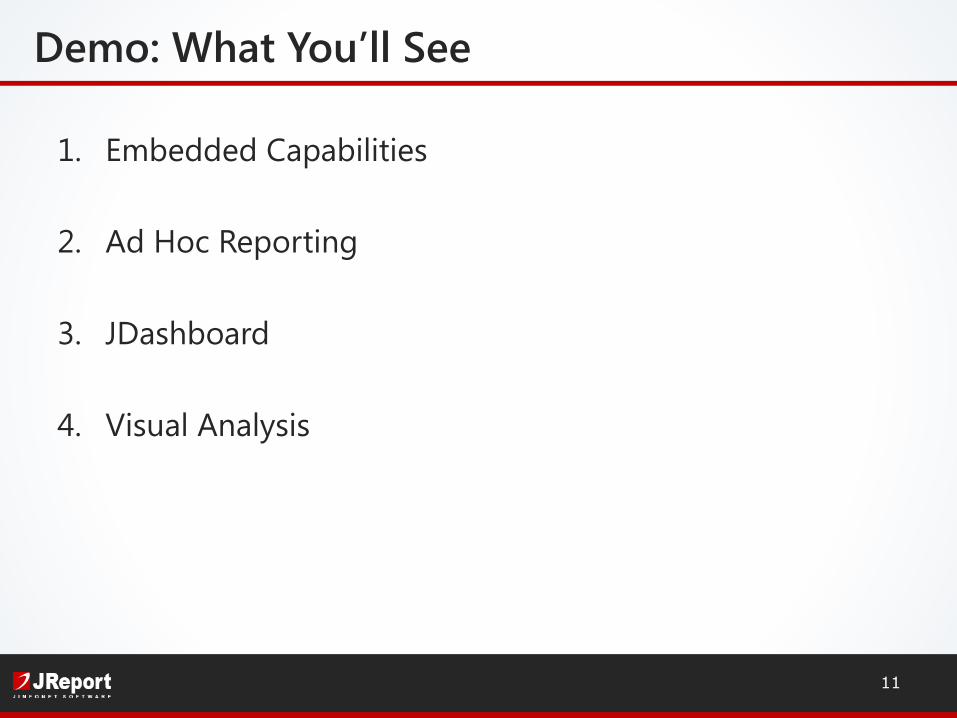
Demo: What You’ll See
11
1. Embedded Capabilities
2. Ad Hoc Reporting
3. JDashboard
4. Visual Analysis
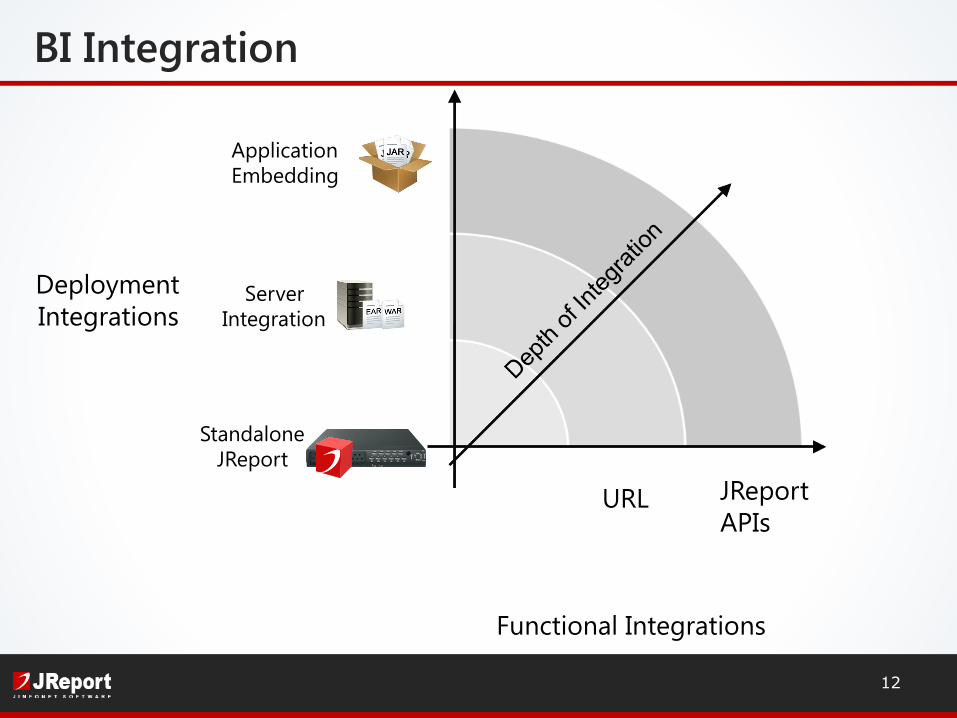
Functional Integrations
Standalone JReport
URL JReport APIs
Server Integration
Application Embedding
BI Integration
Deployment Integrations
12
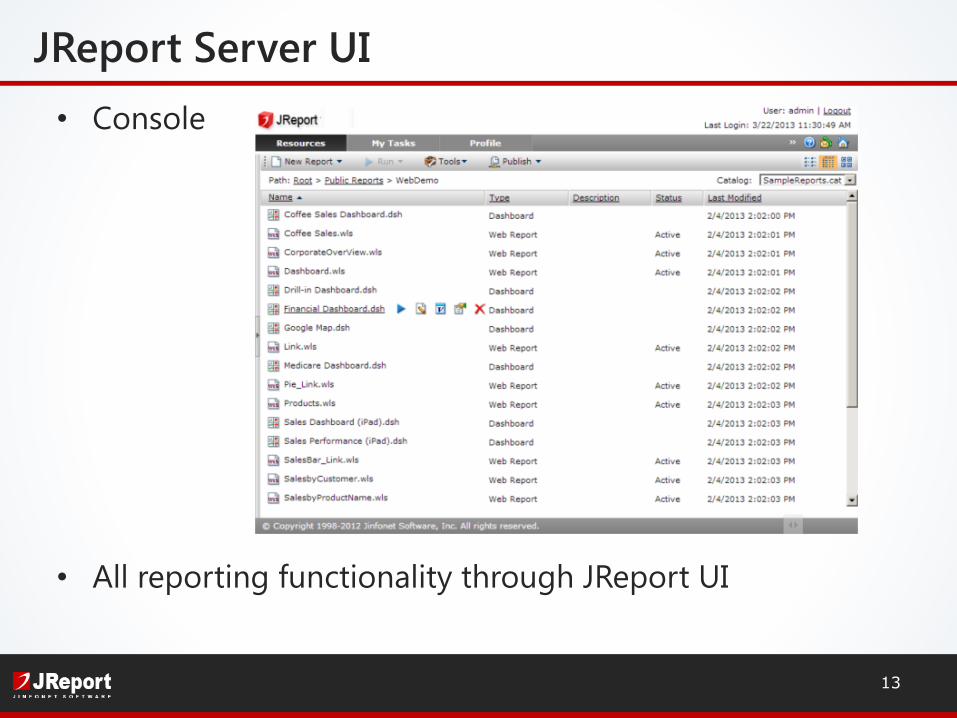
JReport Server UI • Console
• All reporting functionality through JReport UI
13
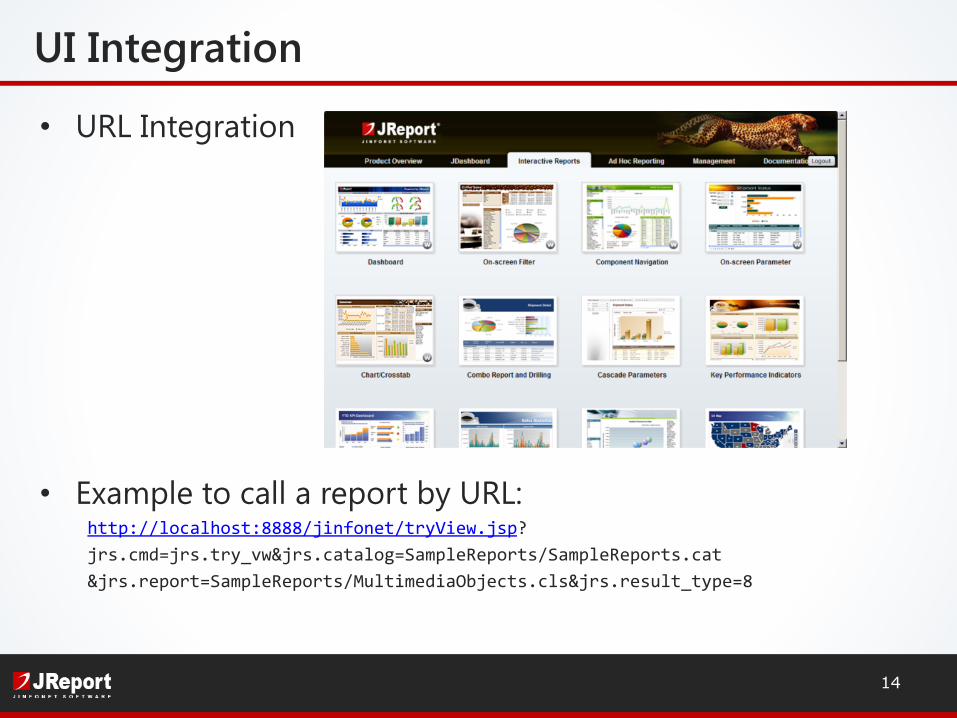
UI Integration
• URL Integration
• Example to call a report by URL: http://localhost:8888/jinfonet/tryView.jsp? jrs.cmd=jrs.try_vw&jrs.catalog=SampleReports/SampleReports.cat &jrs.report=SampleReports/MultimediaObjects.cls&jrs.result_type=8
14

API
• Your application can control all functions of JReport Server programmatically
• Typical uses: – Listing and linking resources for users – Scheduling tasks – Exporting reports (PDF, HTML, Excel, etc.)
• //set report home for logging and location of rmi.auth file for security System.getProperties().put("reporthome", "C:\\JReport\\Server"); System.getProperties().put("jrs.rmi.auth_file", "C:\\JReport\\Server\\bin\\rmi.auth");
• //search the running server using default host and port String host = "localhost"; String port = "1129"; RptServer server = RemoteReportServerToolkit.getRemoteWrappedRptServer(host, port);
15
Security Integration
• Standard Standalone Configuration – Users managed through JReport Admin console – Authentication and permissions through JReport Admin console – Login directly to JReport
• LDAP – Import users and groups from your system – Configured through JReport Admin console – Permissions set through JReport – No need for duplicate users or groups
• Single Sign on
16
Customization / White Labeling
• JReport Console – JSP Pages and image for modification – Full customization capabilities
• Reports – Custom Styles
• Created in JReport Designer and uploaded to JReport Server Live – Templates
• Reports saved as templates for re-use
17

Over 1,000 current customers
Embedding reports since 1998
94% Customer Retention rate
86% Embedded Customers 62% OEM Customers
JReport – Installed Base
18

Government ISV/OEM Healthcare / Healthcare Insurance
Telecom Consumer / Manufacturing
Financial Services
JReport’s Global Customer Base
19

Customer Successes
− Visa Small Business has more than 15,000 companies running JReport
− Reports run on more than 1200 commercial card holder accounts (CCHA) − Each CCHA has ~1M card
holders, each getting numerous personalized reports/year
− Fail-safe, clustered technology serves massive mission-critical IRS reports
20
Customer Successes
− Infosphere Information Server
− Tivoli Security Operations Manager
− Tivoli Security Information and Event Manager
− Netcool Configuration Manager
− Lotus Learning Management
21
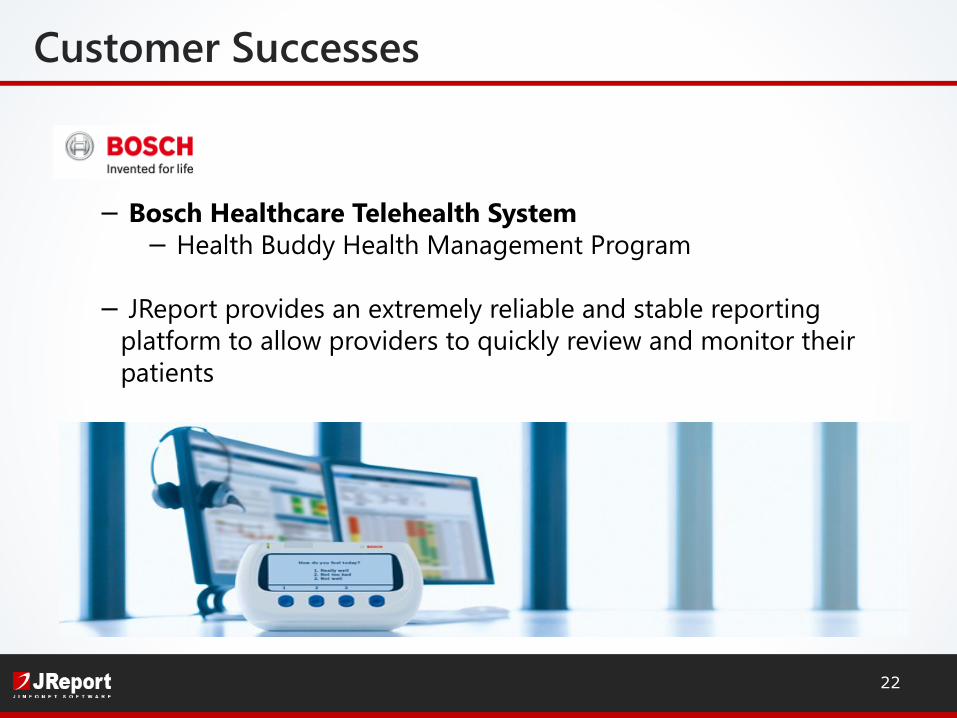
Customer Successes
− Bosch Healthcare Telehealth System − Health Buddy Health Management Program
− JReport provides an extremely reliable and stable reporting platform to allow providers to quickly review and monitor their patients
22
23
• Try JReport 12 Download from www.jinfonet.com
• Daily Live Demos Every weekday at 2 PM EDT
• For more info, visit: www.jinfonet.com
E-mail: [email protected], [email protected] Sales: [email protected] Phone: (240) 477-1000
Next Steps
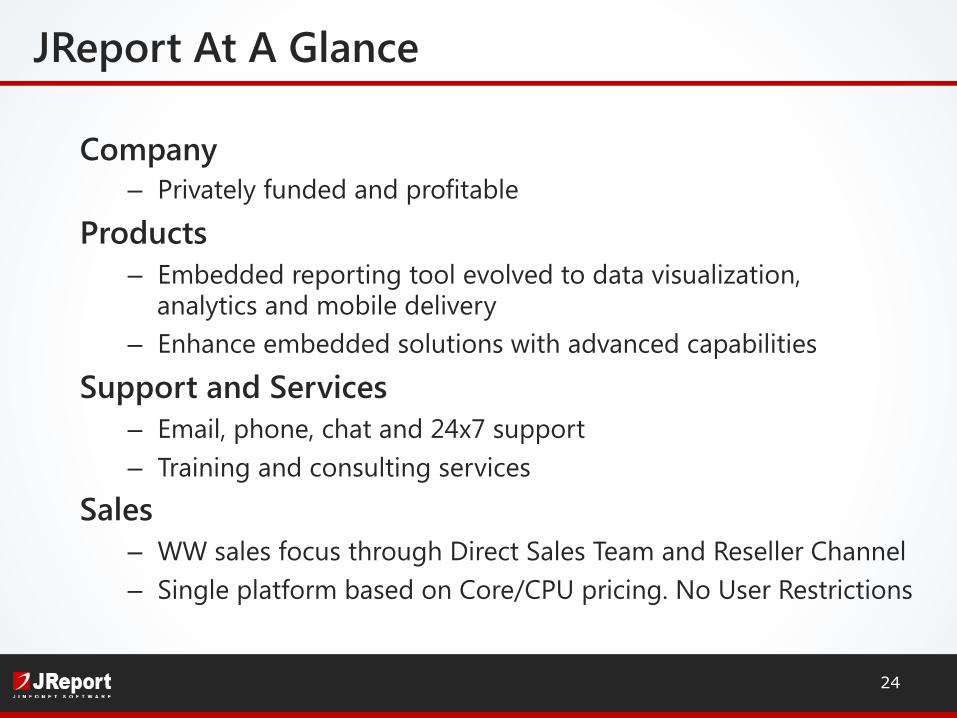
Company – Privately funded and profitable
Products – Embedded reporting tool evolved to data visualization,
analytics and mobile delivery – Enhance embedded solutions with advanced capabilities
Support and Services – Email, phone, chat and 24x7 support – Training and consulting services
Sales – WW sales focus through Direct Sales Team and Reseller Channel – Single platform based on Core/CPU pricing. No User Restrictions
JReport At A Glance
24

• Big Data – large, complex set of data – Genomics data, traffic data, social media data
• NoSQL databases – non-relational, distributed, open-source and horizontally scalable – MapReduce – parallel processing using Master-Worker nodes – MongoDB by 10gen – Apache Hive
• Visualization of Big Data
A Big Data Visualization
25
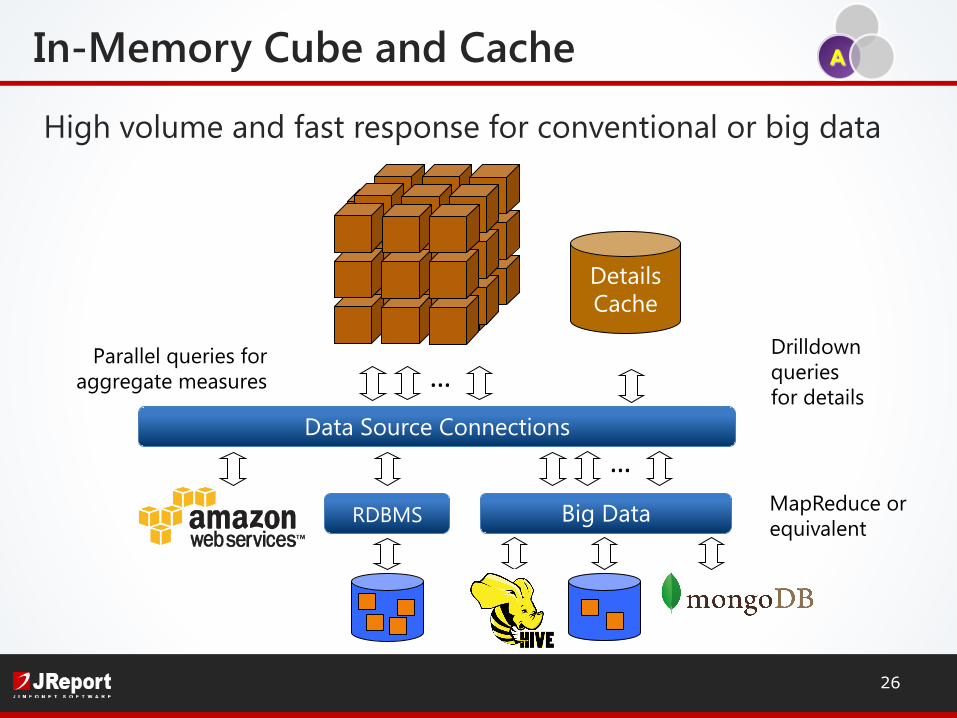
High volume and fast response for conventional or big data
Details Cache
MapReduce or equivalent
Drilldown queries for details
…
… Parallel queries for
aggregate measures
Data Source Connections
RDBMS Big Data
A In-Memory Cube and Cache
26
Range of Deployment Integrations D
epth
of I
nteg
ratio
ns
27
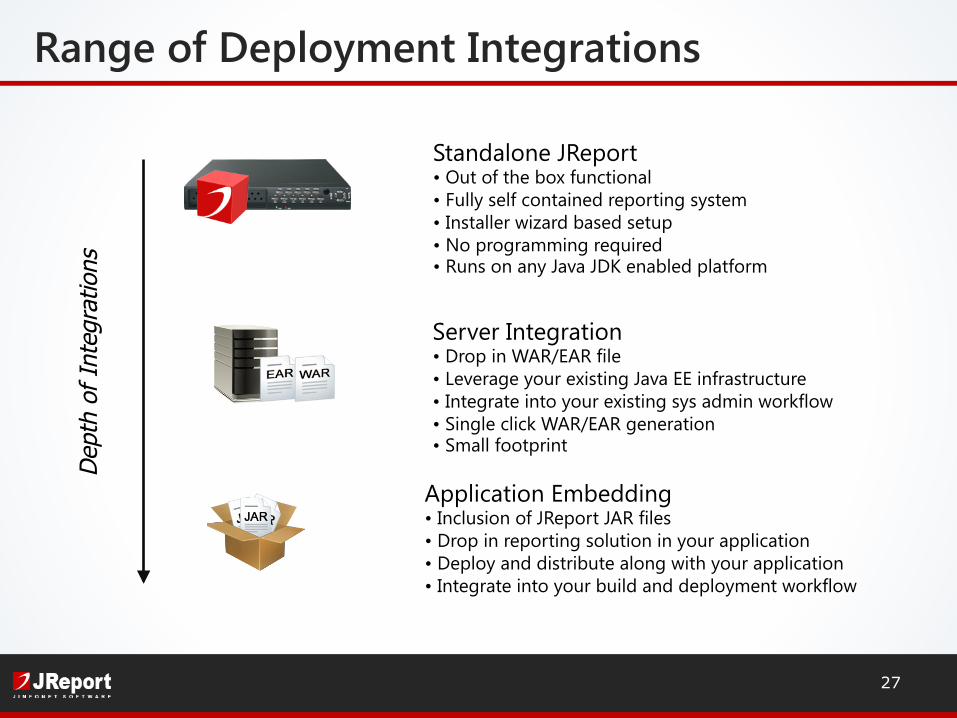
Standalone JReport • Out of the box functional • Fully self contained reporting system • Installer wizard based setup • No programming required • Runs on any Java JDK enabled platform
Server Integration • Drop in WAR/EAR file • Leverage your existing Java EE infrastructure • Integrate into your existing sys admin workflow • Single click WAR/EAR generation • Small footprint
Application Embedding • Inclusion of JReport JAR files • Drop in reporting solution in your application • Deploy and distribute along with your application • Integrate into your build and deployment workflow

Range of Functional Integrations D
epth
of I
nteg
ratio
ns
Web Layer (JSP, HTML, ...)
Customer Application
Business layer
Business layer (Java objects)
Customer Application
Web layer
JReport Server
JReport Server
28
Standalone JReport • Out of the box functional • Fully self contained reporting system • Installer wizard based setup • Minimal sys admin involvement • Includes web based user interface console • Includes web based admin console
URL • Integrate into your app at the presentation layer • Create and control reporting with your own UI • Seamless transition from app to report • Integrate into any web layer technology • Only require web layer skill set
Java APIs • Full integration into your Java application • Control all aspect of reporting workflow • Integrated into your own security • Free up Java Developer resources • Utilize your existing Java EE skill set
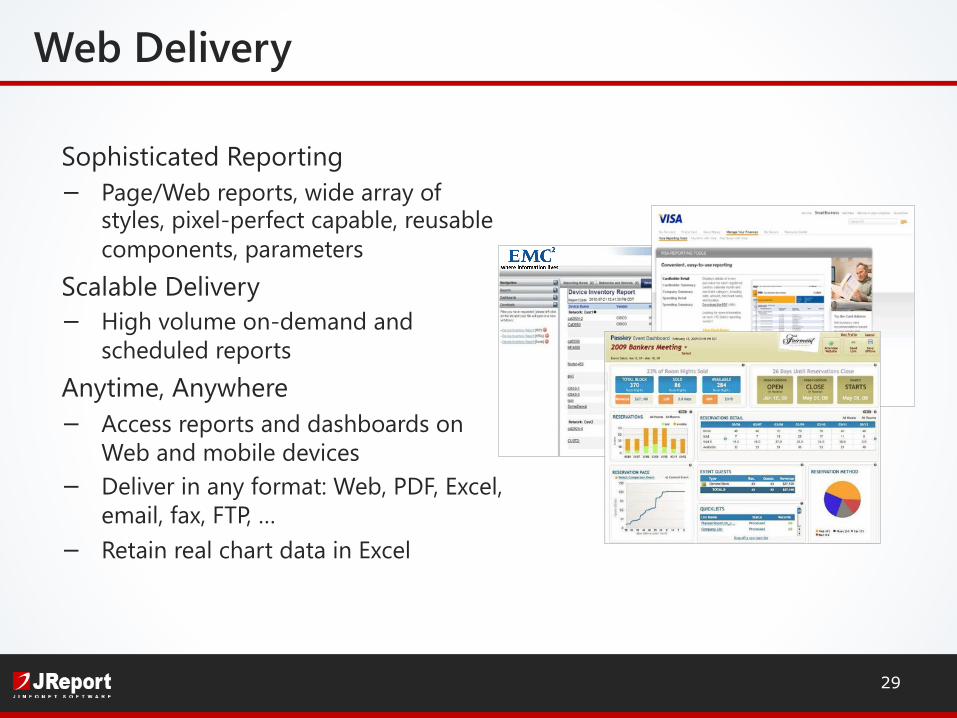
Sophisticated Reporting − Page/Web reports, wide array of
styles, pixel-perfect capable, reusable components, parameters
Scalable Delivery − High volume on-demand and
scheduled reports Anytime, Anywhere − Access reports and dashboards on
Web and mobile devices − Deliver in any format: Web, PDF, Excel,
email, fax, FTP, … − Retain real chart data in Excel
29
Web Delivery

Visualization, Anywhere − Browser and native iOS implementation − Support mobile device gestures − Scrollable component navigation − Convertible chart types − Rich interactions: filter, sort, drill, pivot − Free from the Apple App Store
30
JReport Mobile