visualizing success to achieve business objectives
TRANSCRIPT
SuccessVisualizing
Using ‘Positive Risk’ Diagrams to Achieve Business Objectives
©20
15 P
J M
oar
(p
ete
r.m
oar
@g
mai
l.co
m)
vers
ion
4.6
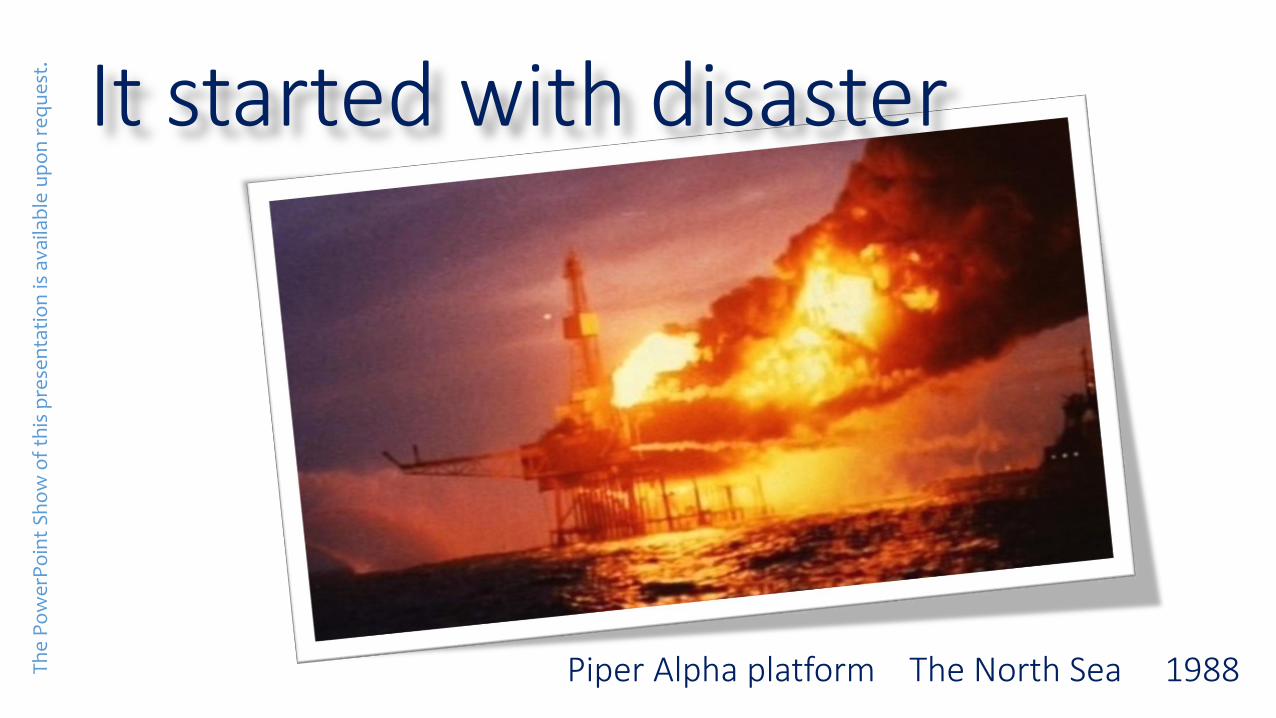
It started with disaster
Piper Alpha platform The North Sea 1988Th
e P
ow
erP
oin
t S
ho
w o
f th
is p
rese
nta
tio
n is
ava
ilab
le u
po
n r
eq
ue
st.

©2015 PJ Moar ([email protected]) version 4.6
RPQ phase 2 delivery
Business Leader for T&E
T&E product development and
marketing
Director of T&E
Full View Zoom 300%Satellite View
The PowerPoint Show of this presentation is available upon request.
…and ended in success

with a revolutionary method for
to analyse and achieve all business objectives
managers
consultants
entrepreneurs
©2015 PJ Moar ([email protected]) version 4.6The PowerPoint Show of this presentation is available upon request.
and

…by overcoming uncertainty with simplicity
©2015 PJ Moar ([email protected]) version 4.6The PowerPoint Show of this presentation is available upon request.
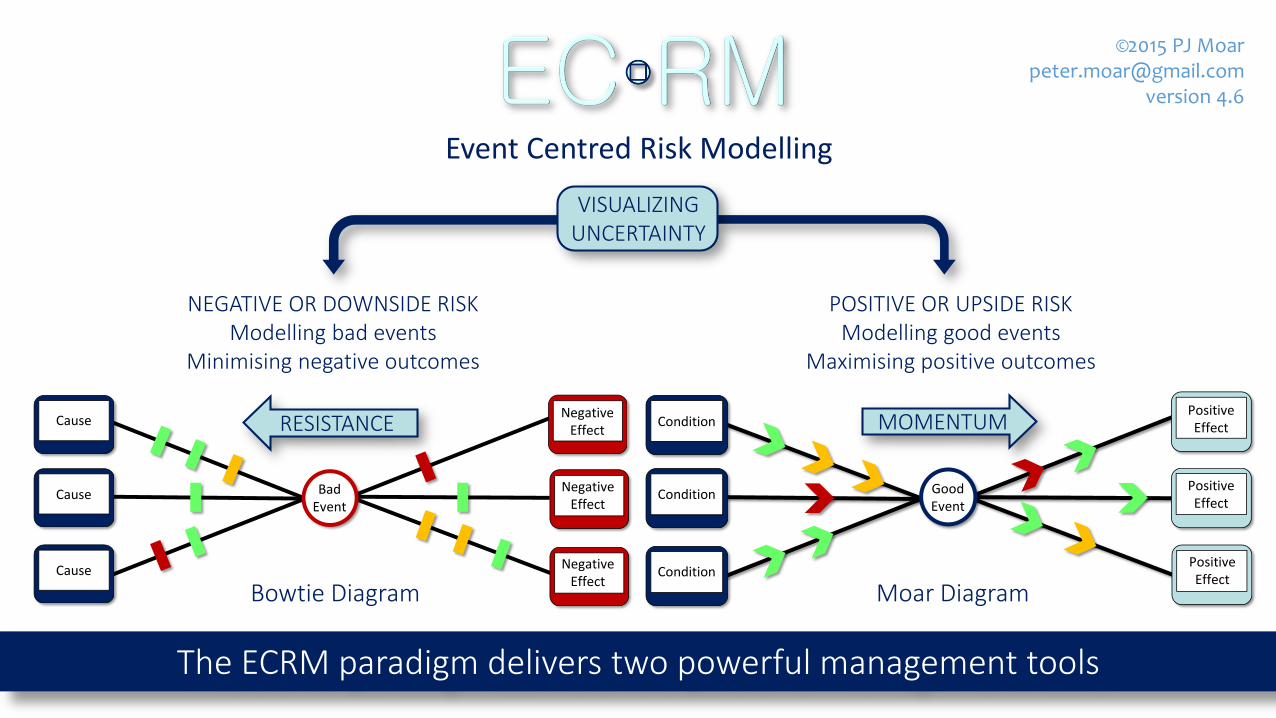
VISUALIZINGUNCERTAINTY
The theory and origins of these diagrams will be explained in the following pages
POSITIVE OR UPSIDE RISKModelling good events
Maximising positive outcomes
Moar Diagram
NEGATIVE OR DOWNSIDE RISKModelling bad events
Minimising negative outcomes
Bowtie Diagram
RESISTANCE MOMENTUMCondition
Condition
Condition Good Event
NegativeEffect
BadEvent
Positive EffectCause
Cause
Cause NegativeEffect
NegativeEffect
Positive Effect
Positive Effect
©2015 PJ Moar ([email protected]) version 4.6
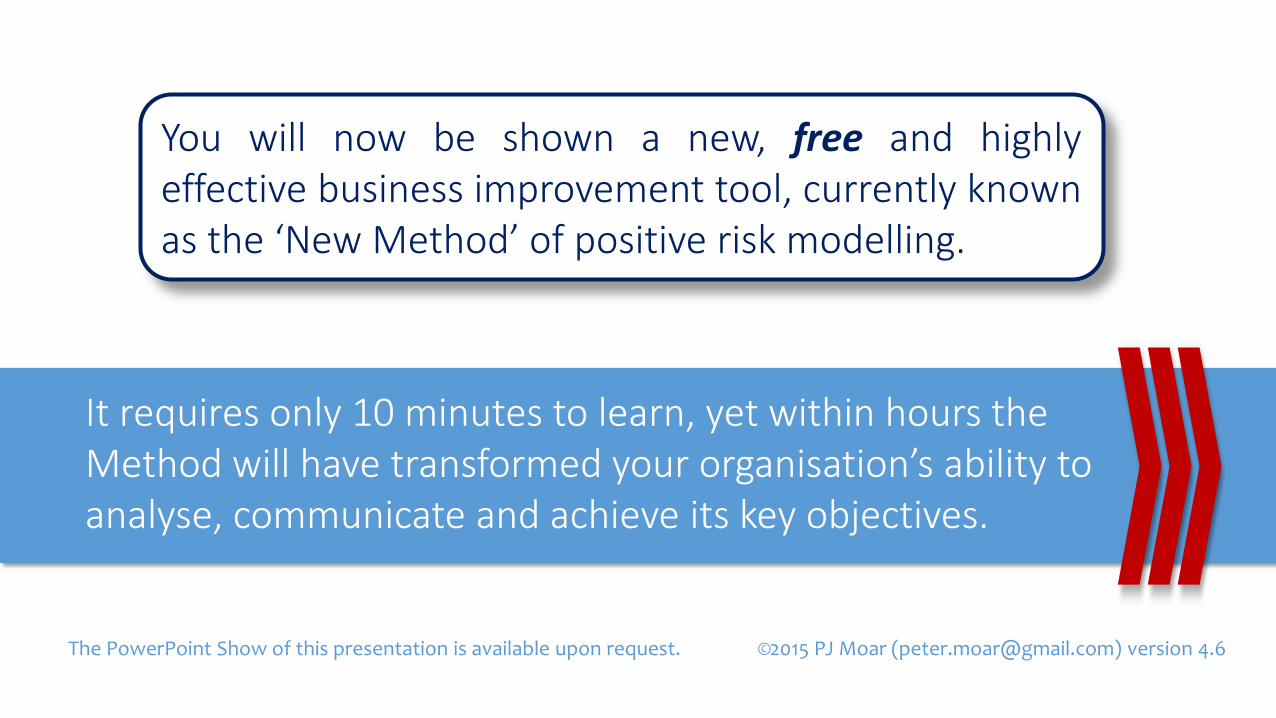
It requires only 10 minutes to learn, yet within hours the Method will have transformed your organisation’s ability to analyse, communicate and achieve its key objectives.
You will now be shown a new, free and highlyeffective business improvement tool, currently knownas the ‘New Method’ of positive risk modelling.
The PowerPoint Show of this presentation is available upon request.
©20
15 PJ M
oar (p
ete
r.mo
ar@g
mail.co
m) ve
rsion
4.6
Th
e P
ow
erP
oin
t S
ho
w o
f th
is p
rese
nta
tio
n is
ava
ilab
le u
po
n r
eq
ue
st.
RPQ phase 2 delivery
Business Leader for T&E
T&E product development and
marketing
Director of T&E
Condition for delivery
Condition for delivery
Condition for delivery
Benefit
Disbenefit
Benefit
ProjectDelivery
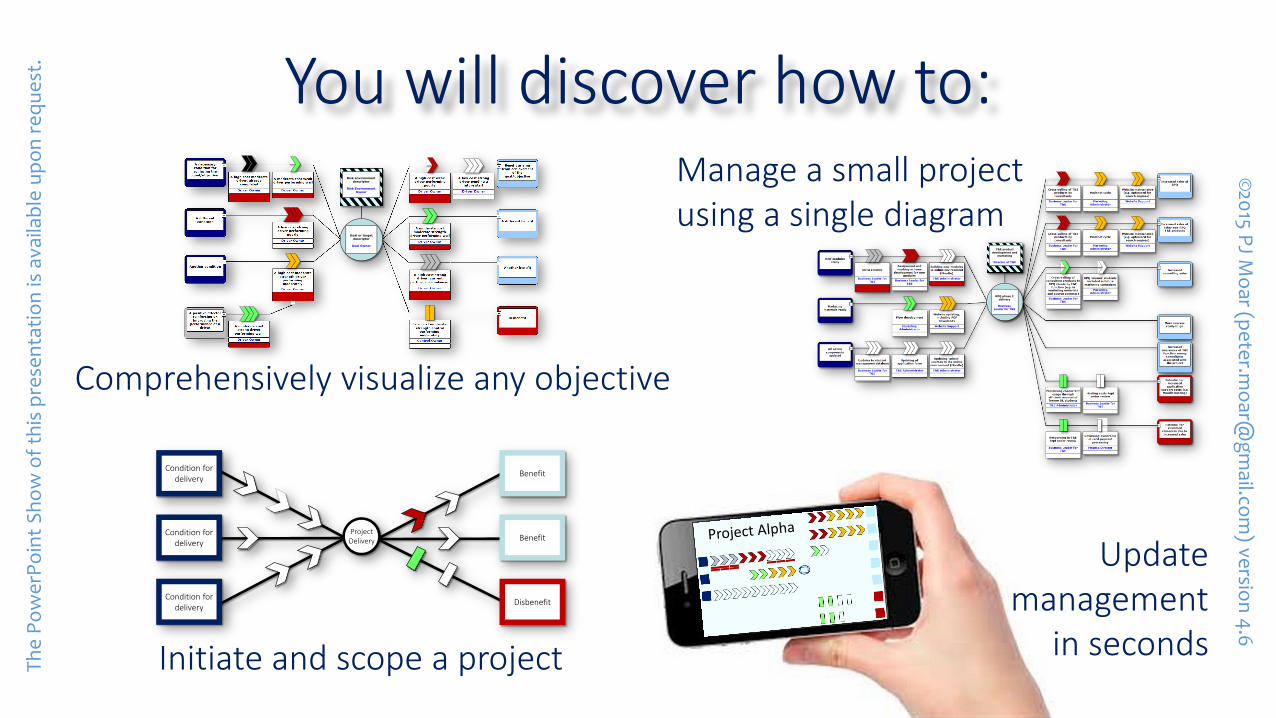
You will discover how to:
Comprehensively visualize any objective
Initiate and scope a project
Risk environment descriptor
Risk Environment Owner
Goal or target descriptor
Goal Owner
Manage a small project using a single diagram
Update management
in seconds
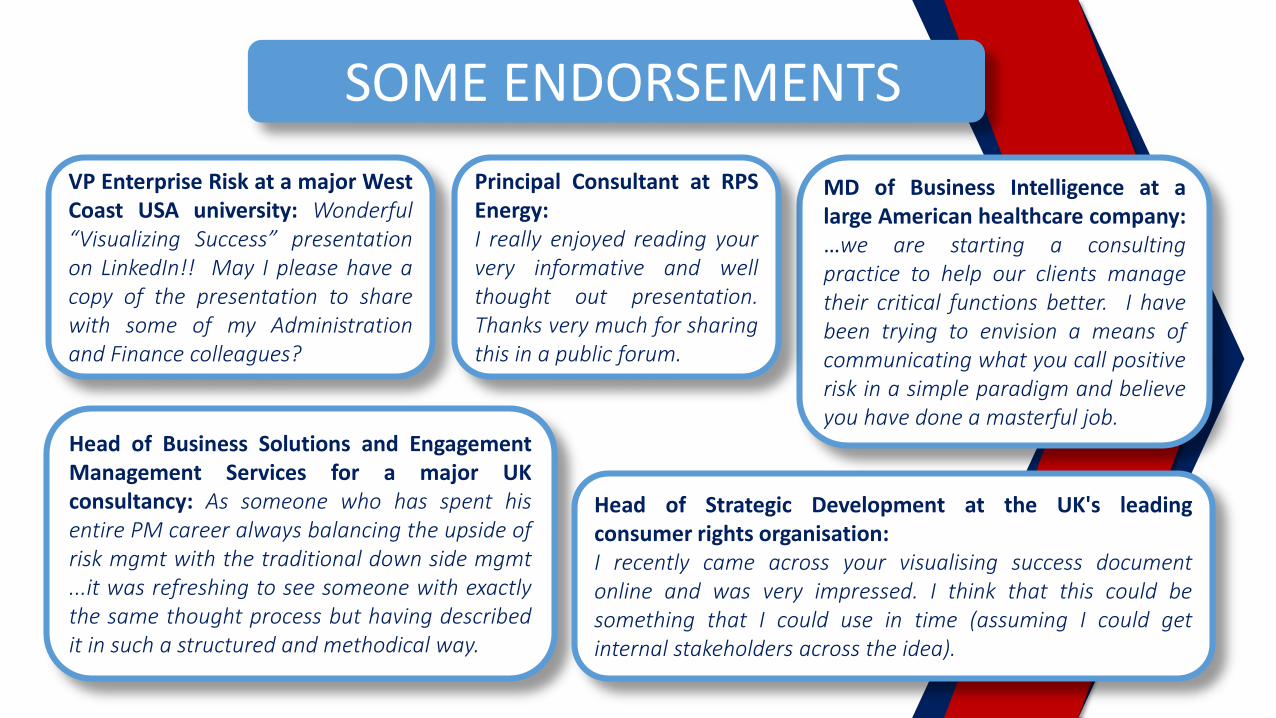
SOME ENDORSEMENTS
Head of Business Solutions and EngagementManagement Services for a major UKconsultancy: As someone who has spent hisentire PM career always balancing the upside ofrisk mgmt with the traditional down side mgmt...it was refreshing to see someone with exactlythe same thought process but having describedit in such a structured and methodical way.
Head of Strategic Development at the UK's leadingconsumer rights organisation:I recently came across your visualising success documentonline and was very impressed. I think that this could besomething that I could use in time (assuming I could getinternal stakeholders across the idea).
MD of Business Intelligence at alarge American healthcare company:…we are starting a consultingpractice to help our clients managetheir critical functions better. I havebeen trying to envision a means ofcommunicating what you call positiverisk in a simple paradigm and believeyou have done a masterful job.
VP Enterprise Risk at a major WestCoast USA university: Wonderful“Visualizing Success” presentationon LinkedIn!! May I please have acopy of the presentation to sharewith some of my Administrationand Finance colleagues?
Principal Consultant at RPSEnergy:I really enjoyed reading yourvery informative and wellthought out presentation.Thanks very much for sharingthis in a public forum.
©2015 PJ Moar ([email protected]) version 4.6
The PowerPoint Show of this presentation is available upon request.
WARNING!words ahead
You are about to view a presentation containing intuitivediagrams and graphics. It also contains just enough wordsto present a basic theory with supporting evidence.
If you dislike wordy presentations this could be a good timeto , although your patience may be rewarded.
©2015 PJ Moar ([email protected]) version 4.6
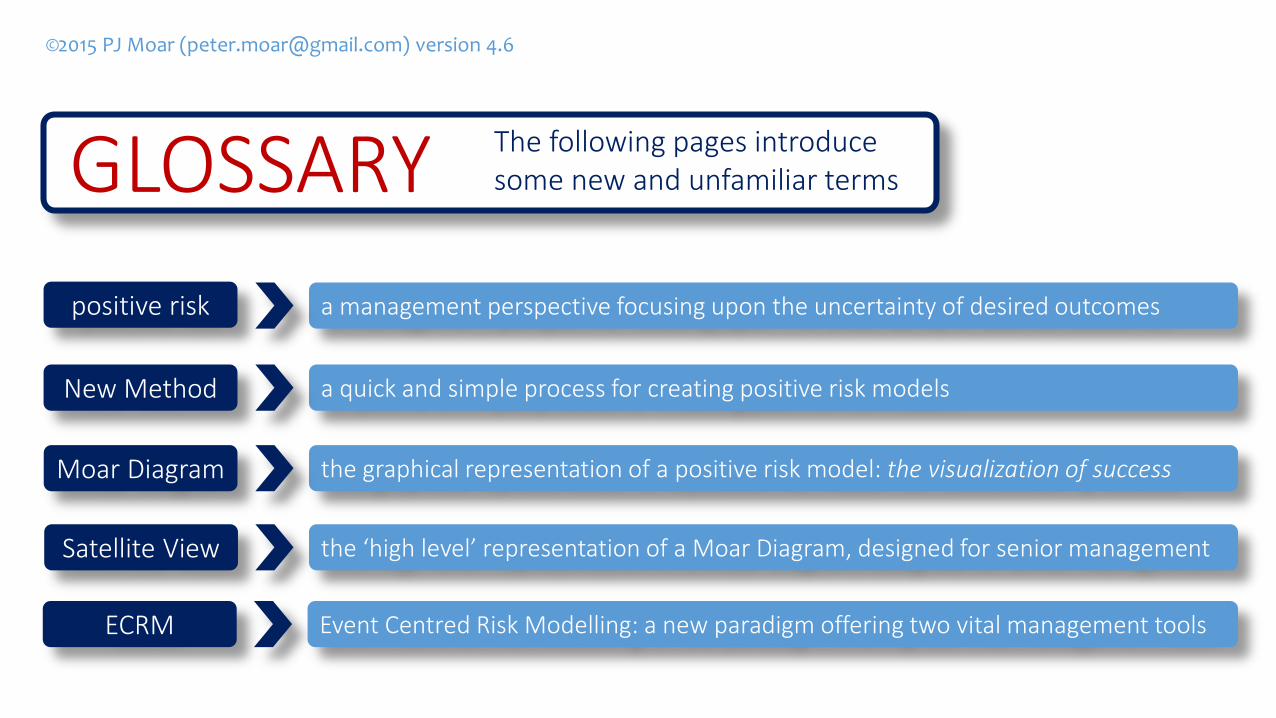
positive risk a management perspective focusing upon the uncertainty of desired outcomes
New Method
Moar Diagram
Satellite View
a quick and simple process for creating positive risk models
the graphical representation of a positive risk model: the visualization of success
the ‘high level’ representation of a Moar Diagram, designed for senior management
GLOSSARY The following pages introduce some new and unfamiliar terms
ECRM Event Centred Risk Modelling: a new paradigm offering two vital management tools
©20
15 P
J M
oar
(p
ete
r.m
oar
@g
mai
l.co
m)
vers
ion
4.6
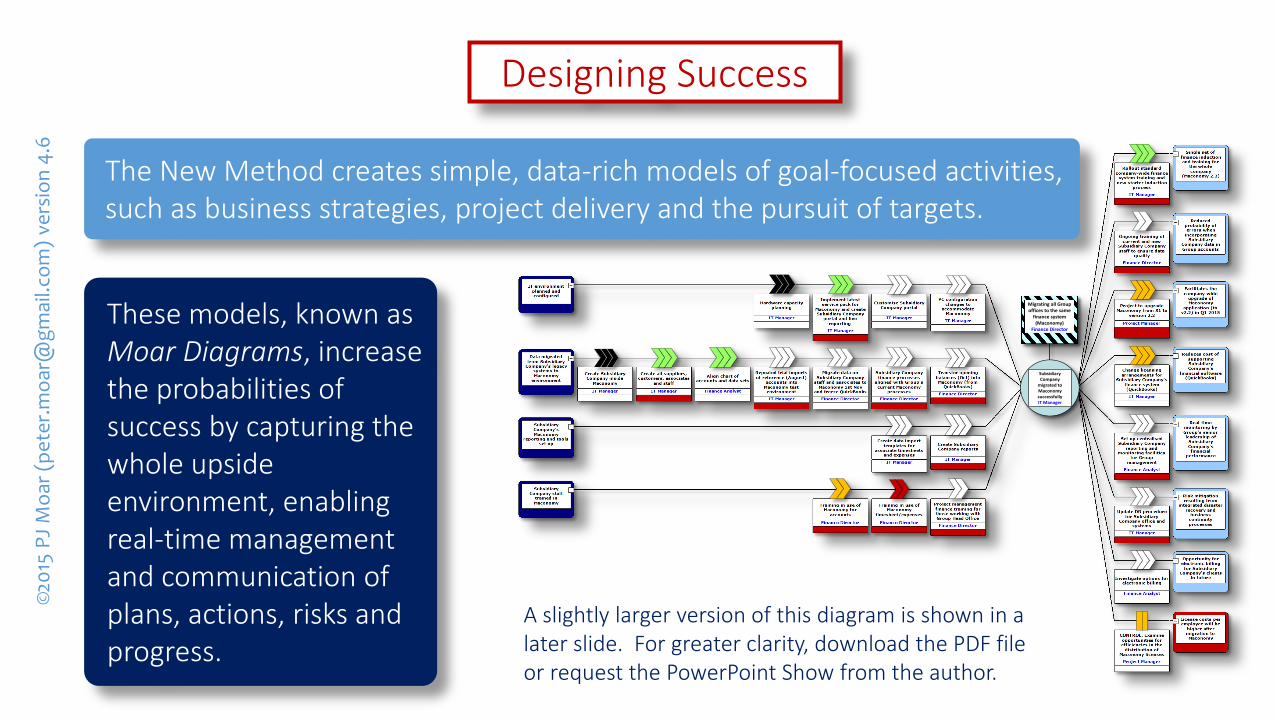
The New Method creates simple, data-rich models of goal-focused activities, such as business strategies, project delivery and the pursuit of targets.
These models, known as Moar Diagrams, increase the probabilities of success by capturing the whole upside environment, enabling real-time management and communication of plans, actions, risks and progress.
Designing Success
A slightly larger version of this diagram is shown in a later slide. For greater clarity, download the PDF file or request the PowerPoint Show from the author.
Migrating all Group offices to the same
finance system (Maconomy)
Finance Director
Subsidiary Company
migrated to Maconomy successfullyIT Manager
Moar Diagrams illustrate the solutions totwo fundamental business problems:
1. How to navigate successfully towards goals or targets and
2. How to maximise the benefits we expect those goals and targets to deliver.
Paradoxically, the origins of this technique may be traced back to one of the world’s worst industrial accidents, more than 25 years ago.
©2015 PJ Moar ([email protected]) version 4.6

The Theory• ISO 31000 (the international risk management standard)
defines risk as “the effect of uncertainty on objectives”.
• Therefore, the probability of a risk event is always >0 and <1 (because probabilities of zero and one are both certainties).
©20
15 PJ M
oar (p
ete
r.mo
ar@g
mail.co
m) ve
rsion
4.6
So the probability of a risk event is always a positive number
The PowerPoint Show of this presentation is available upon request.
Now consider the classic risk equation:
Risk = Probability x Outcome
If probability is always a positive number, Risk must be negative when the outcome is negative. This is the traditional domain of risk management.
So Risk will become positive if the outcome is positive.Presumably, these are the outcomes we want. If so, how do we achieve and maximise these positive outcomes?
The Theory
©2015 PJ Moar ([email protected]) version 4.6
This is negative risk(or downside risk)
Traditional risk managementis focused upon negativeoutcomes, such as financialloss, technical failures andhuman casualties – the eventswe try to avoid.
However, positive risk (orupside risk) is concerned withsuccess, profits and victories –the events we want tohappen.
Is this something we can understand better by modelling?
The Theory
©2015 PJ Moar ([email protected]) version 4.6
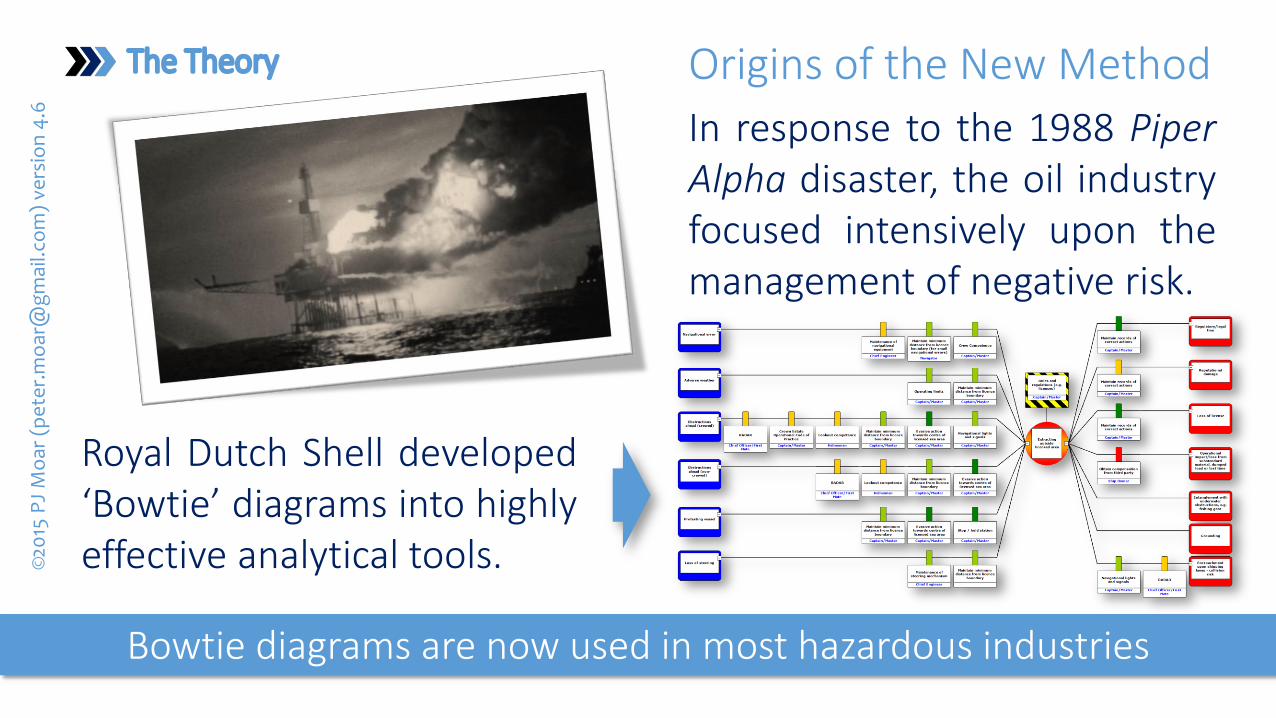
Origins of the New Method
In response to the 1988 PiperAlpha disaster, the oil industryfocused intensively upon themanagement of negative risk.
Royal Dutch Shell developed‘Bowtie’ diagrams into highlyeffective analytical tools.
Bowtie diagrams are now used in most hazardous industries
The Theory©
2015
PJ
Mo
ar (
pe
ter.
mo
ar@
gm
ail.c
om
) ve
rsio
n 4
.6
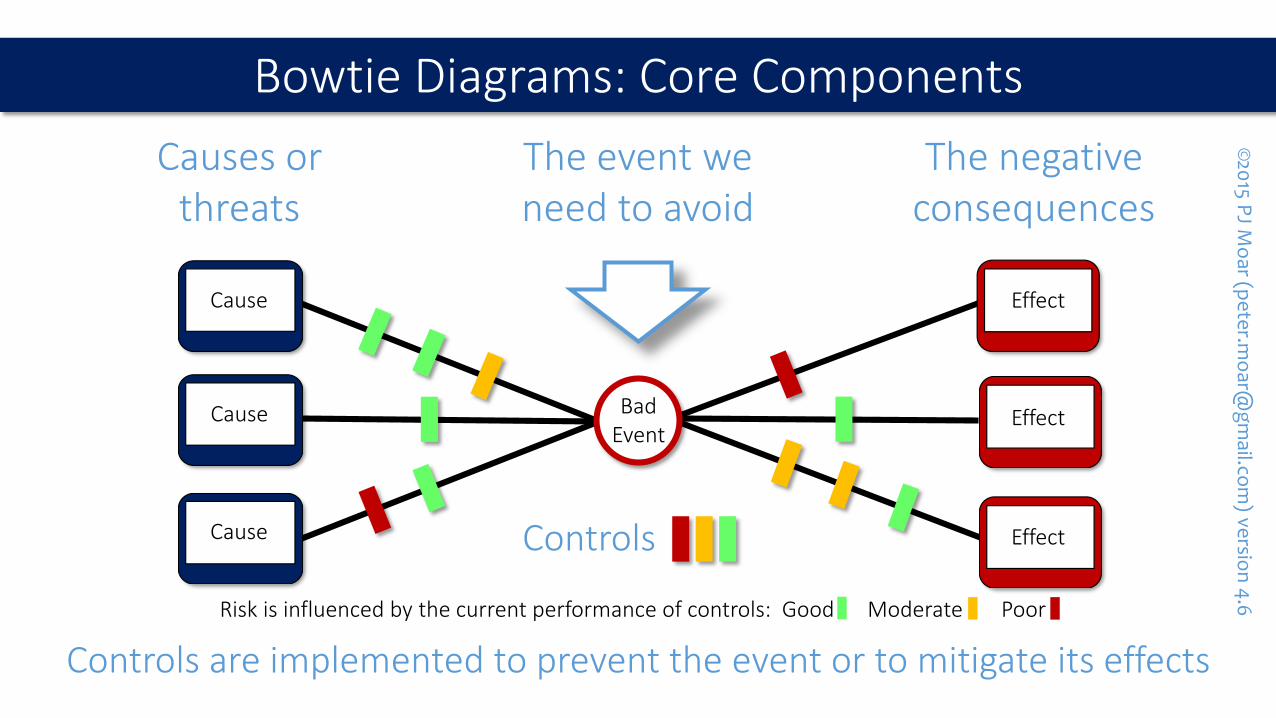
Risk is influenced by the current performance of controls: Good Moderate Poor
Bowtie Diagrams: Core Components
Causes orthreats
The event we need to avoid
The negative consequences
Controls are implemented to prevent the event or to mitigate its effects
Bad Event
Effect
Effect
Effect
Cause
Cause
Cause
Controls
©20
15 PJ M
oar (p
ete
r.mo
ar@g
mail.co
m) ve
rsion
4.6
©2015 PJ Moar ([email protected]) version 4.6
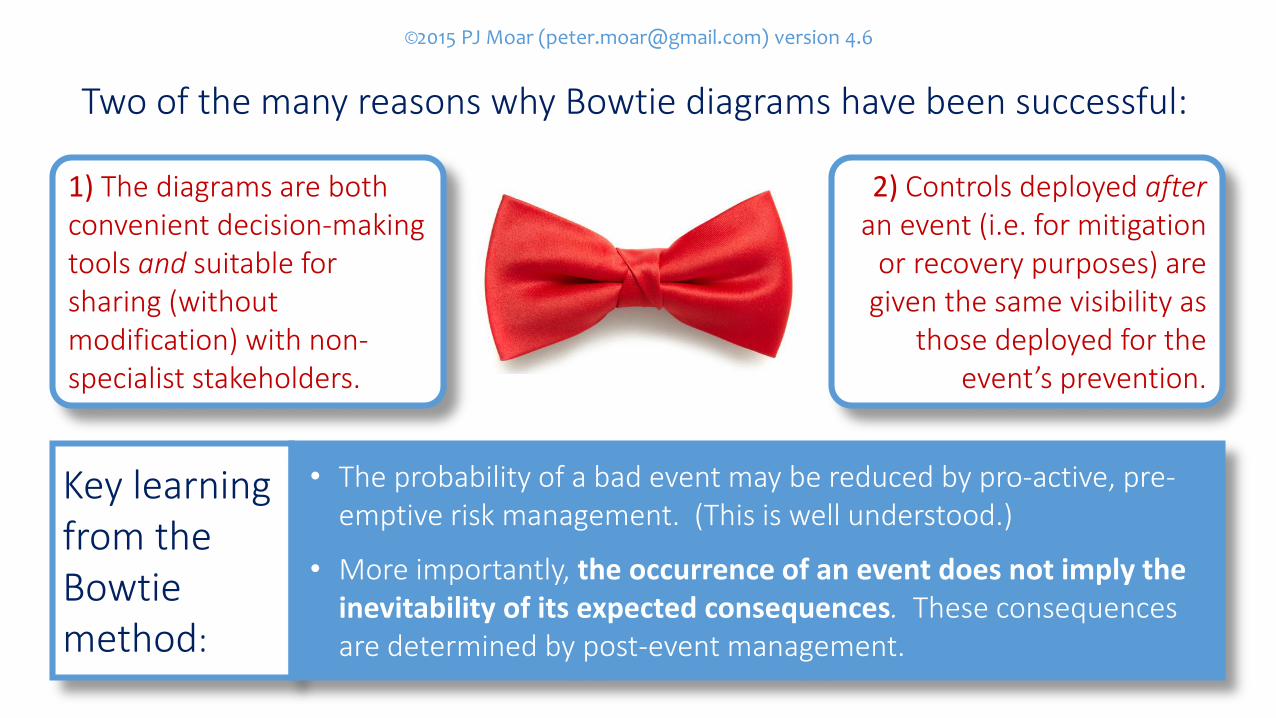
Key learning from theBowtie method:
• The probability of a bad event may be reduced by pro-active, pre-emptive risk management. (This is well understood.)
• More importantly, the occurrence of an event does not imply the inevitability of its expected consequences. These consequences are determined by post-event management.
Two of the many reasons why Bowtie diagrams have been successful:
1) The diagrams are both convenient decision-making tools and suitable for sharing (without modification) with non-specialist stakeholders.
2) Controls deployed afteran event (i.e. for mitigation
or recovery purposes) are given the same visibility as
those deployed for the event’s prevention.
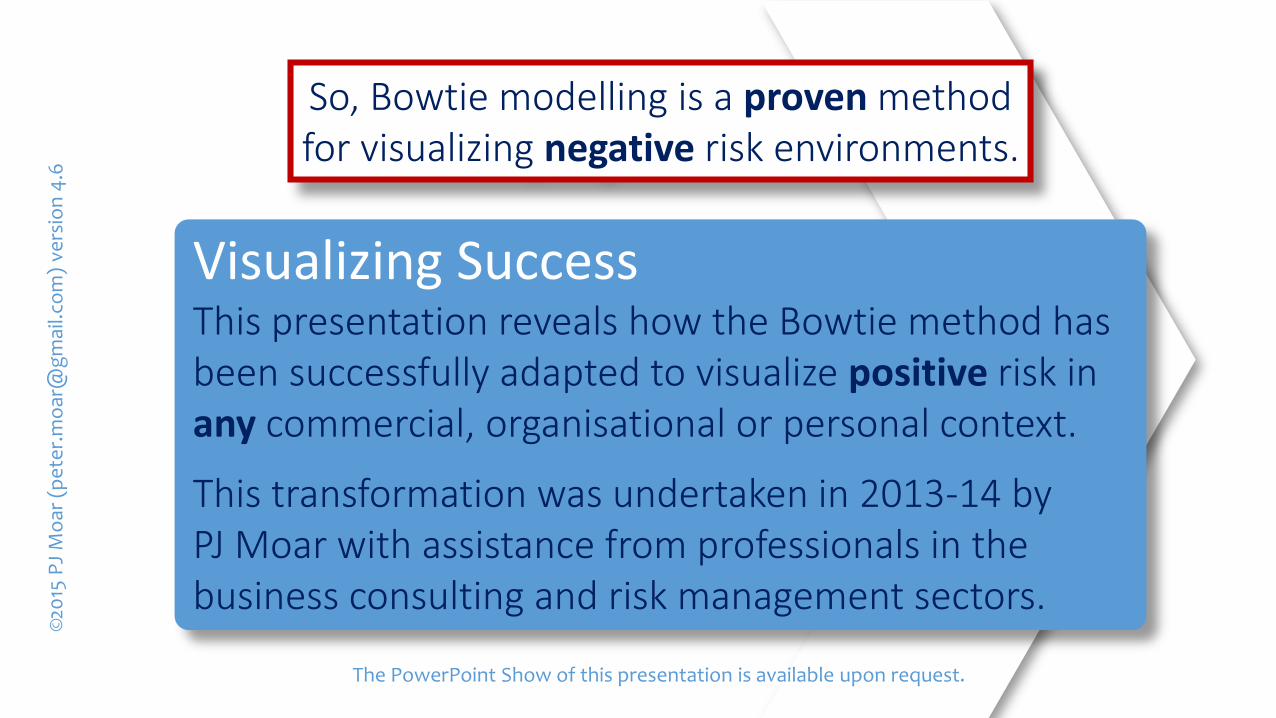
Visualizing SuccessThis presentation reveals how the Bowtie method has been successfully adapted to visualize positive risk inany commercial, organisational or personal context.
This transformation was undertaken in 2013-14 byPJ Moar with assistance from professionals in the business consulting and risk management sectors.
©20
15 P
J M
oar
(p
ete
r.m
oar
@g
mai
l.co
m)
vers
ion
4.6
So, Bowtie modelling is a proven method for visualizing negative risk environments.
The PowerPoint Show of this presentation is available upon request.
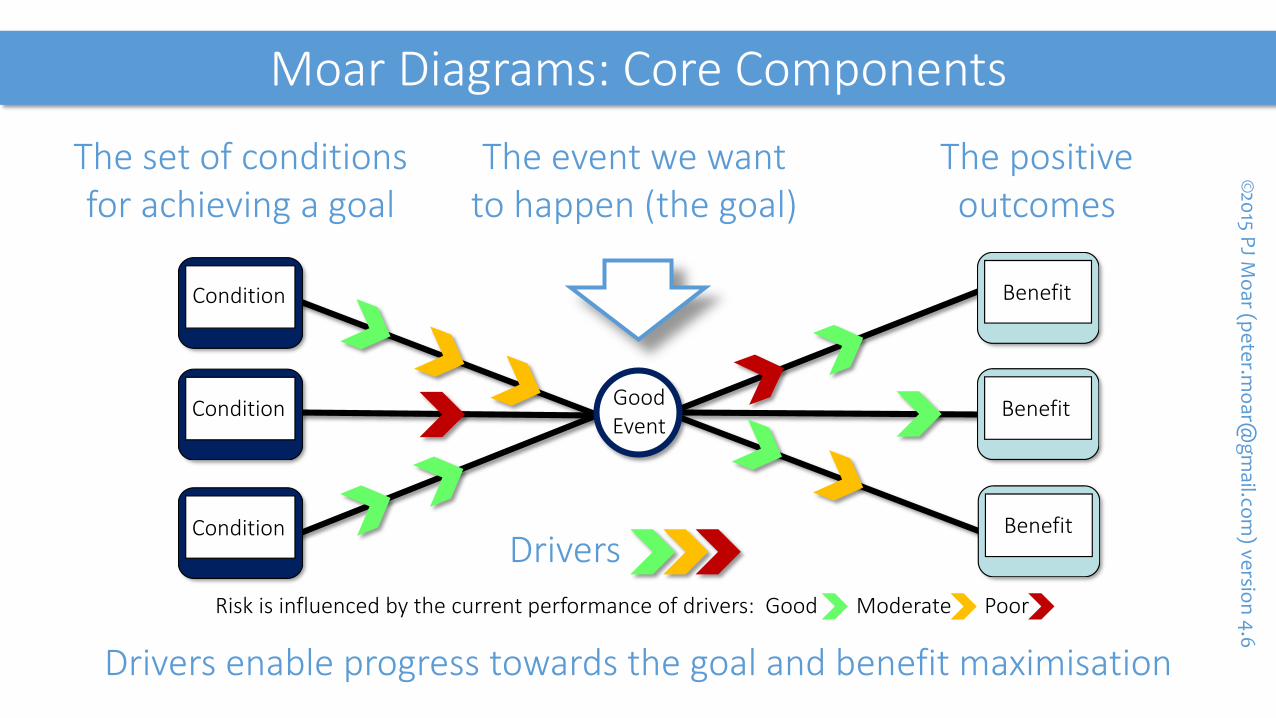
Moar Diagrams: Core Components
The set of conditions for achieving a goal
The event we want to happen (the goal)
The positive outcomes
Drivers enable progress towards the goal and benefit maximisation
Good Event
Risk is influenced by the current performance of drivers: Good Moderate Poor
Benefit
Benefit
Benefit
Condition
Drivers
©20
15 PJ M
oar (p
ete
r.mo
ar@g
mail.co
m) ve
rsion
4.6
Condition
Condition
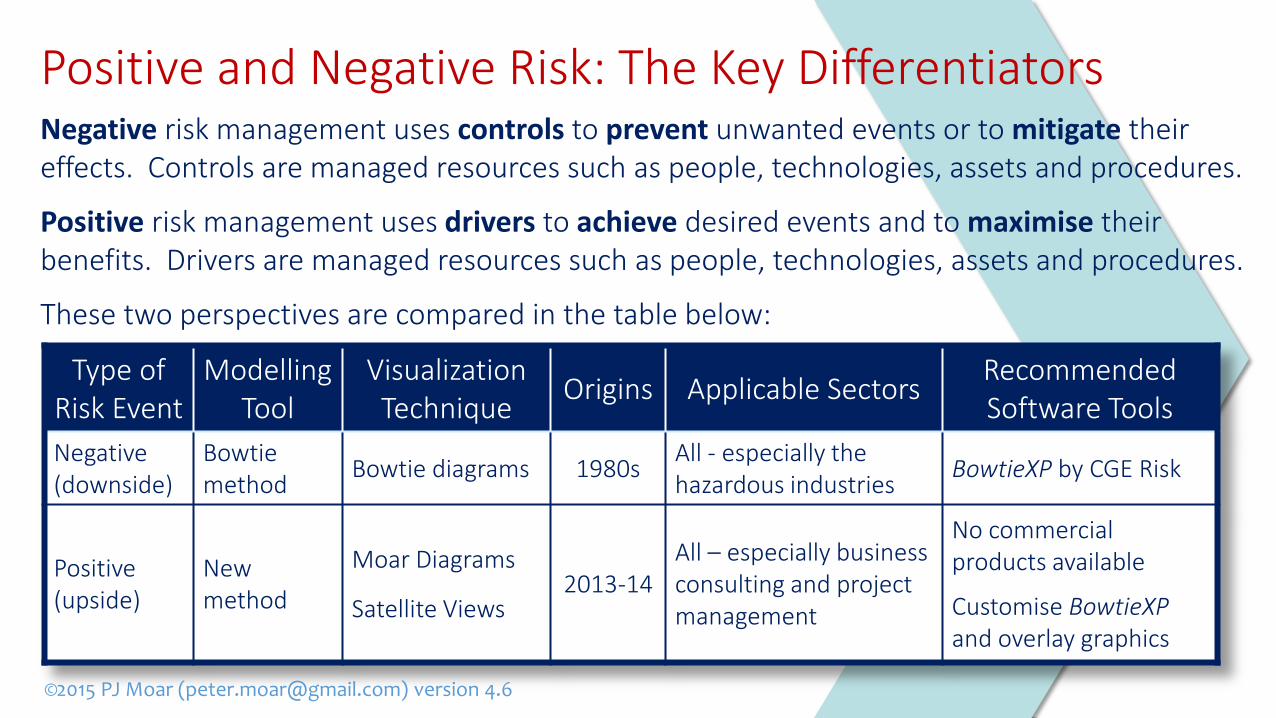
Type of Risk Event
Modelling Tool
VisualizationTechnique
Origins Applicable SectorsRecommended Software Tools
Negative(downside)
Bowtie method
Bowtie diagrams 1980sAll - especially the hazardous industries
BowtieXP by CGE Risk
Positive(upside)
New method
Moar Diagrams
Satellite Views2013-14
All – especially business consulting and project management
No commercialproducts available
Customise BowtieXPand overlay graphics
Positive and Negative Risk: The Key DifferentiatorsNegative risk management uses controls to prevent unwanted events or to mitigate their effects. Controls are managed resources such as people, technologies, assets and procedures.
Positive risk management uses drivers to achieve desired events and to maximise their benefits. Drivers are managed resources such as people, technologies, assets and procedures.
These two perspectives are compared in the table below:
©2015 PJ Moar ([email protected]) version 4.6
©20
15 P
J M
oar
(p
ete
r.m
oar
@g
mai
l.co
m)
vers
ion
4.6
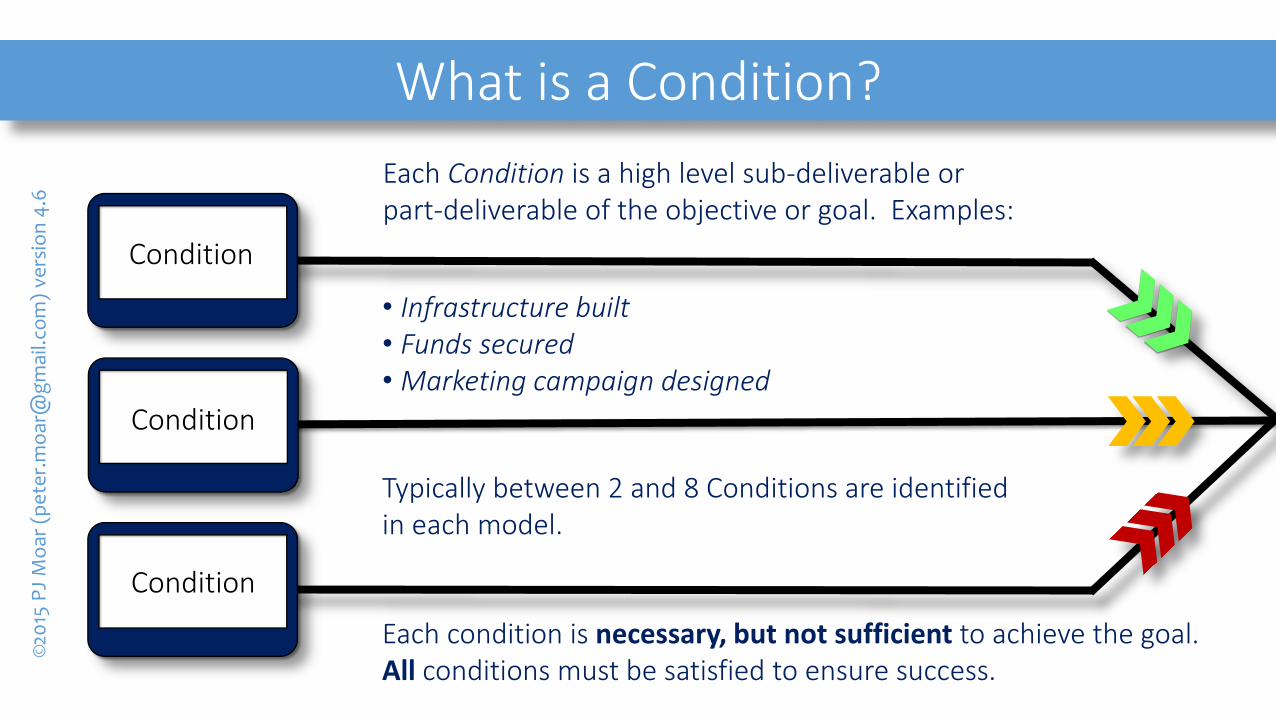
Each Condition is a high level sub-deliverable or part-deliverable of the objective or goal. Examples:
Typically between 2 and 8 Conditions are identified in each model.
What is a Condition?
Condition
Condition
Condition
• Infrastructure built• Funds secured• Marketing campaign designed
Each condition is necessary, but not sufficient to achieve the goal.All conditions must be satisfied to ensure success.
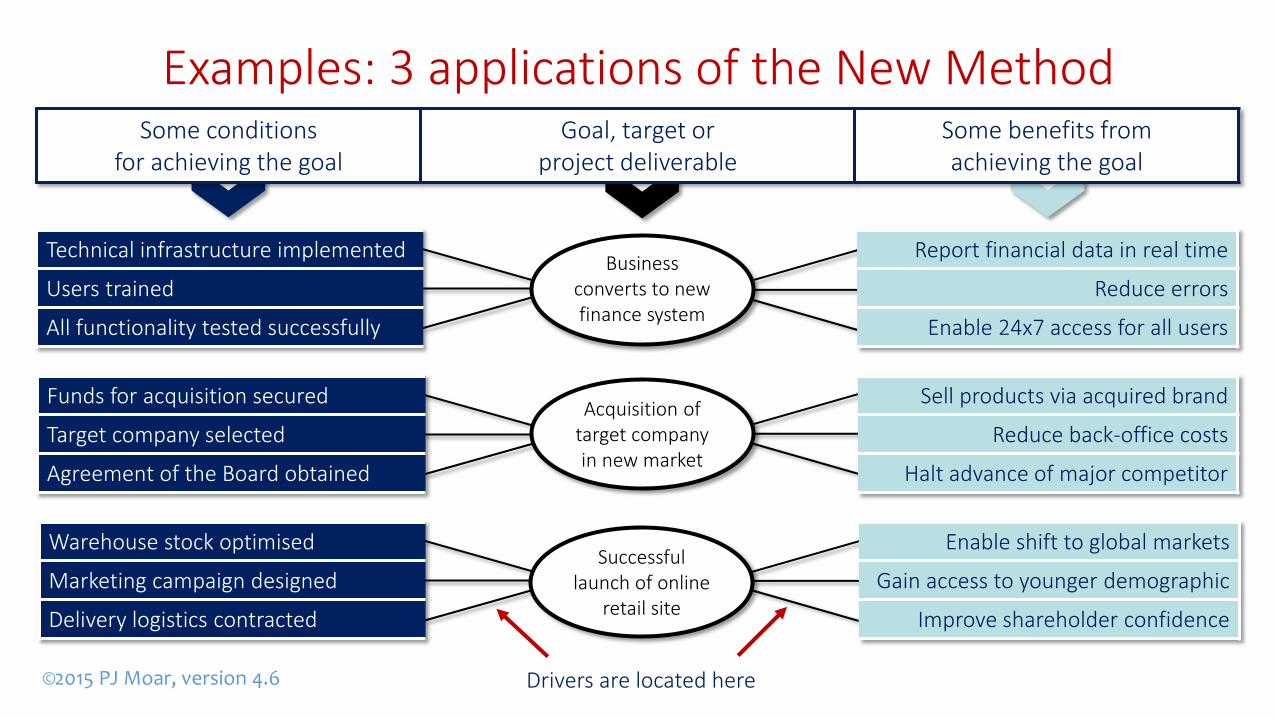
Warehouse stock optimised Enable shift to global markets
Marketing campaign designed Gain access to younger demographic
Delivery logistics contracted Improve shareholder confidence
Funds for acquisition secured Sell products via acquired brand
Target company selected Reduce back-office costs
Agreement of the Board obtained Halt advance of major competitor
Technical infrastructure implemented Report financial data in real time
Users trained Reduce errors
All functionality tested successfully Enable 24x7 access for all users
Examples: 3 applications of the New MethodSome conditions
for achieving the goalGoal, target or
project deliverableSome benefits fromachieving the goal
©2015 PJ Moar, version 4.6
Acquisition of target company in new market
Successful launch of online
retail site
Business converts to new finance system
Drivers are located here
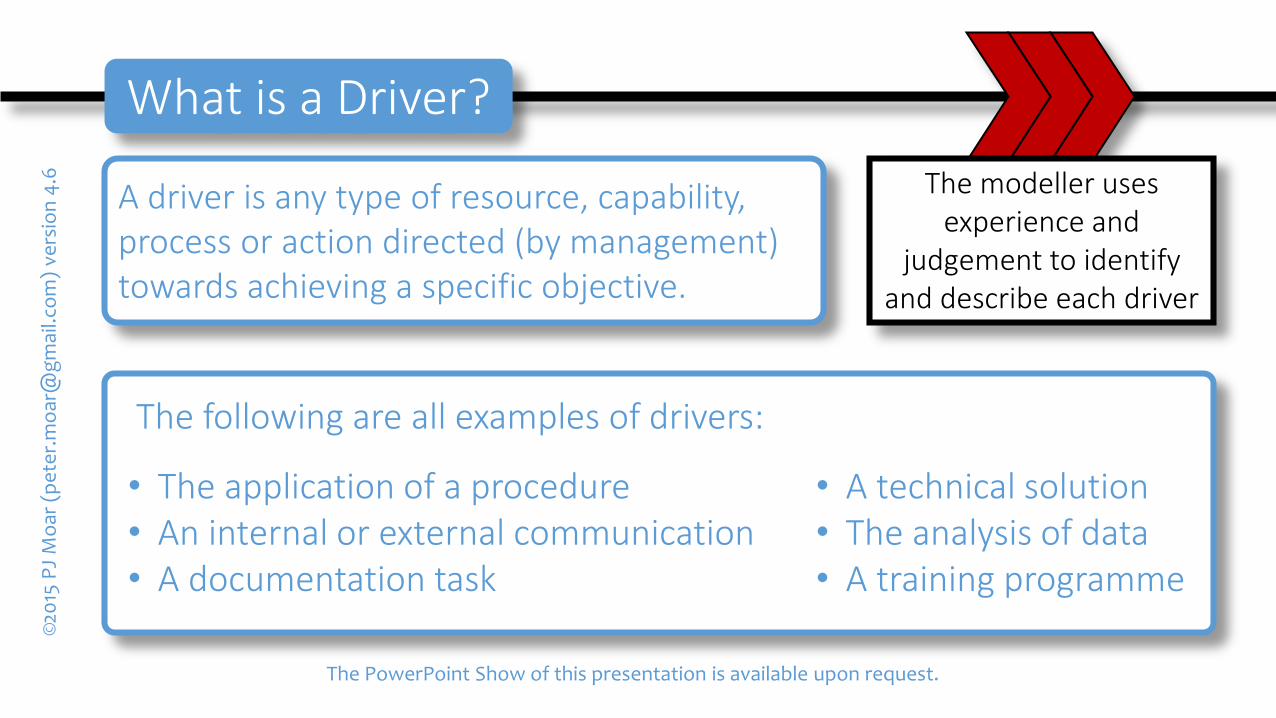
The following are all examples of drivers:
A driver is any type of resource, capability, process or action directed (by management) towards achieving a specific objective.
What is a Driver?©
2015
PJ
Mo
ar (
pe
ter.
mo
ar@
gm
ail.c
om
) ve
rsio
n 4
.6 The modeller uses experience and
judgement to identify and describe each driver
• A technical solution• The analysis of data• A training programme
• The application of a procedure• An internal or external communication• A documentation task
The PowerPoint Show of this presentation is available upon request.
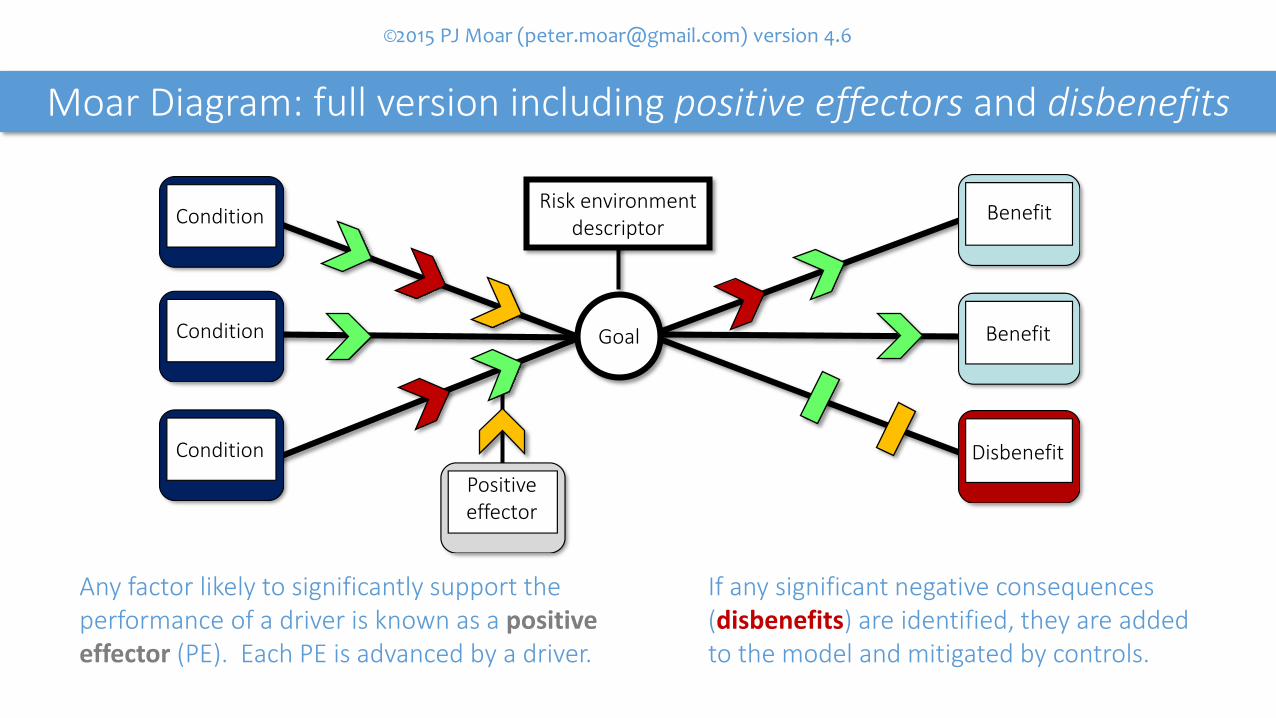
Moar Diagram: full version including positive effectors and disbenefits
If any significant negative consequences (disbenefits) are identified, they are added to the model and mitigated by controls.
Goal Benefit
BenefitCondition
Condition
Condition
©2015 PJ Moar ([email protected]) version 4.6
Disbenefit
Positive effector
Any factor likely to significantly support the performance of a driver is known as a positive effector (PE). Each PE is advanced by a driver.
Risk environment descriptor
Projects
Successful delivery is the goal
Subsequent benefits are assumed
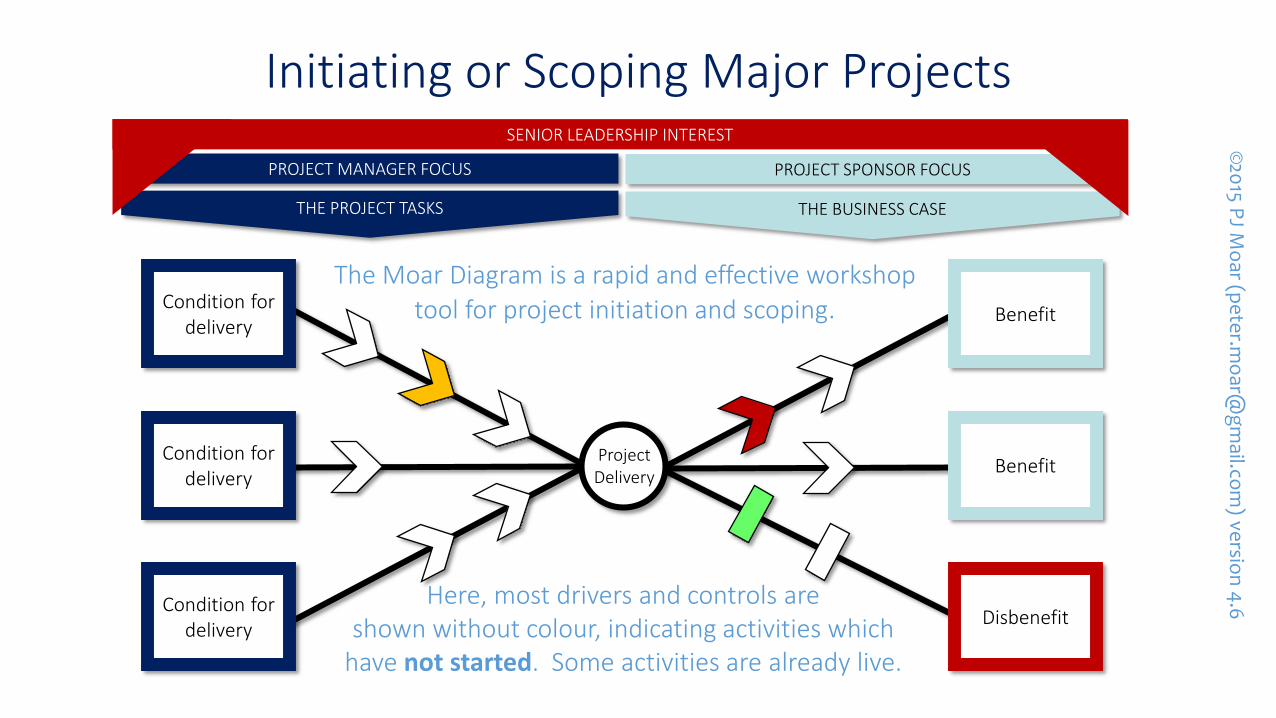
THE PROJECT TASKS THE BUSINESS CASE
Initiating or Scoping Major Projects
PROJECT MANAGER FOCUS PROJECT SPONSOR FOCUS
Condition for delivery
Condition for delivery
Condition for delivery
Benefit
Disbenefit
SENIOR LEADERSHIP INTEREST
Benefit
ProjectDelivery
The Moar Diagram is a rapid and effective workshoptool for project initiation and scoping.
©20
15 PJ M
oar (p
ete
r.mo
ar@g
mail.co
m) ve
rsion
4.6Here, most drivers and controls are
shown without colour, indicating activities whichhave not started. Some activities are already live.

Managing Small or Non-Complex Projects
Condition for delivery
Condition for delivery
Condition for delivery
Benefit
Disbenefit
Benefit
ProjectDelivery
A small project may be managed using only thediagram and shared in real-time
with other stakeholders.
©20
15 PJ M
oar (p
ete
r.mo
ar@g
mail.co
m) ve
rsion
4.6
Completed tasks are marked black.Drivers scheduled to start in the future remain white.
Green indicates on-schedule and on-budget.
THE PROJECT TASKS THE BUSINESS CASE
PROJECT MANAGER FOCUS PROJECT SPONSOR FOCUS
SENIOR MANAGEMENT INTEREST
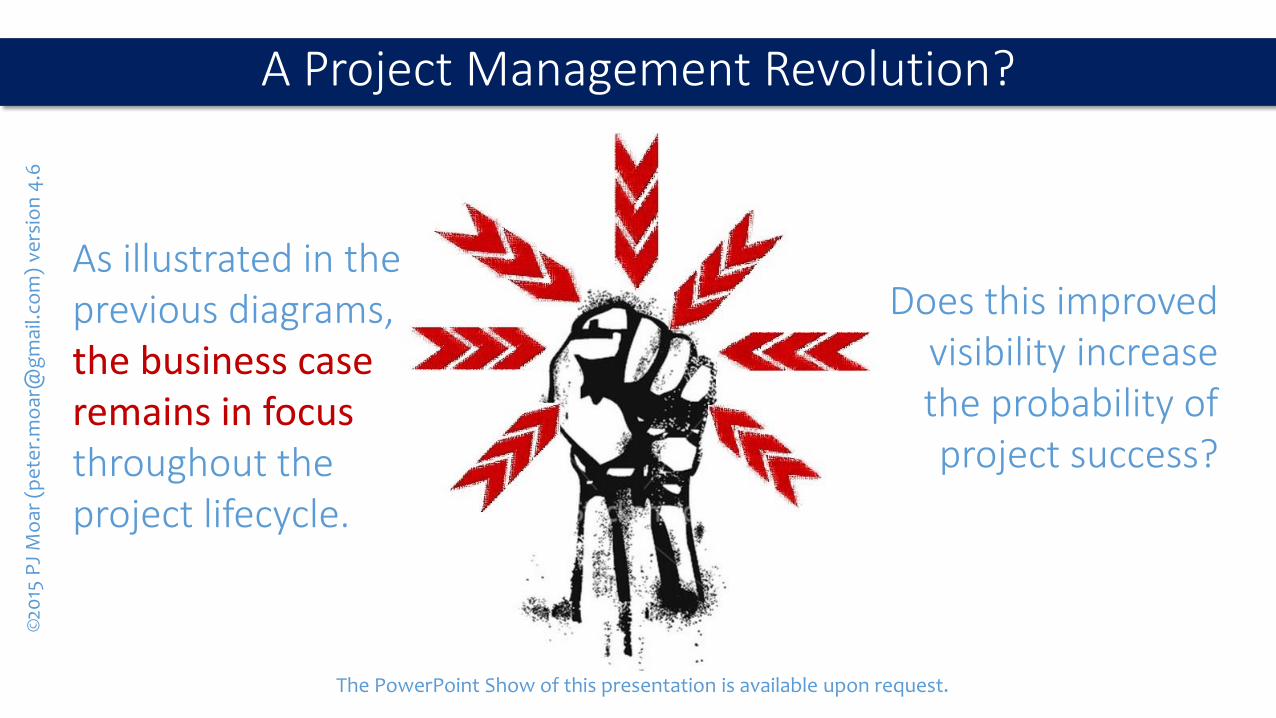
A Project Management Revolution?
Does this improved visibility increase the probability of project success?
As illustrated in the previous diagrams, the business case remains in focus throughout the project lifecycle.
©20
15 P
J M
oar
(p
ete
r.m
oar
@g
mai
l.co
m)
vers
ion
4.6
The PowerPoint Show of this presentation is available upon request.
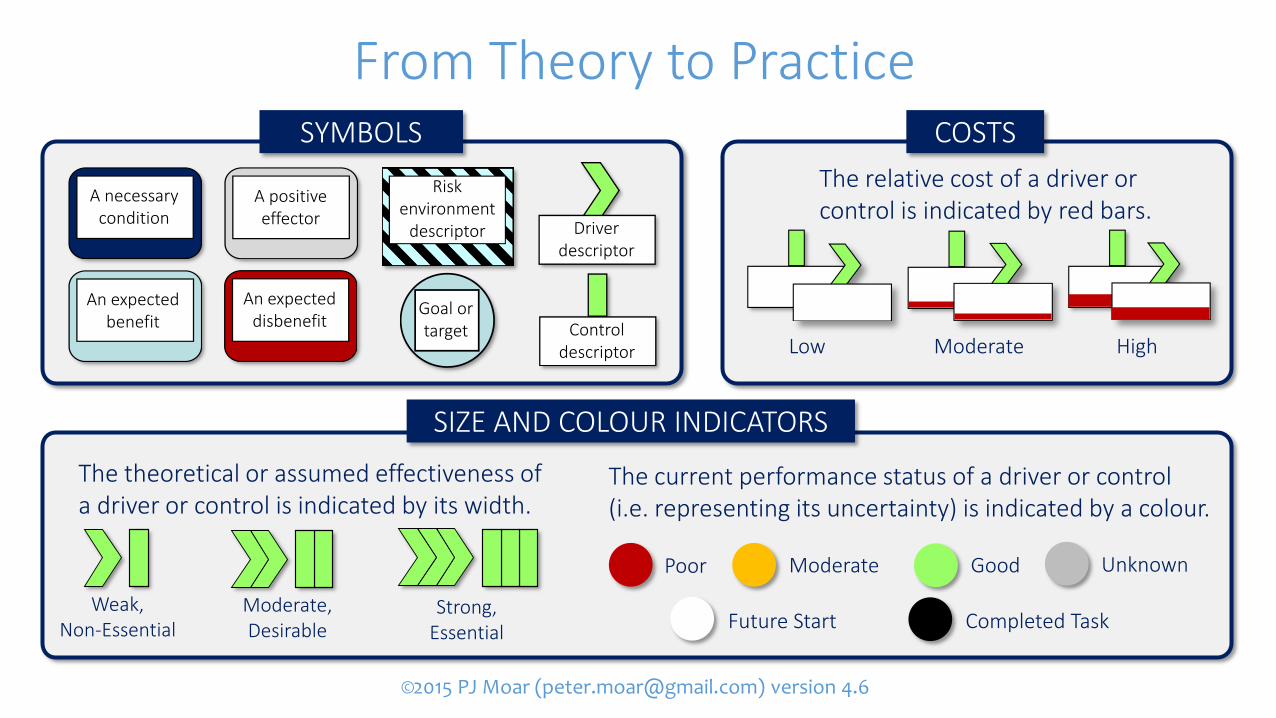
From Theory to Practice
©2015 PJ Moar ([email protected]) version 4.6
The current performance status of a driver or control (i.e. representing its uncertainty) is indicated by a colour.
Weak,Non-Essential
A necessary condition
An expected benefit
An expected disbenefit
A positive effector
Goal or target
Driver descriptor
Control descriptor
The relative cost of a driver or control is indicated by red bars.
Low Moderate High
Poor Moderate Good
Future Start Completed Task
Unknown
Risk environment
descriptor
The theoretical or assumed effectiveness of a driver or control is indicated by its width.
Moderate,Desirable
Strong,Essential
SYMBOLS
SIZE AND COLOUR INDICATORS
COSTS
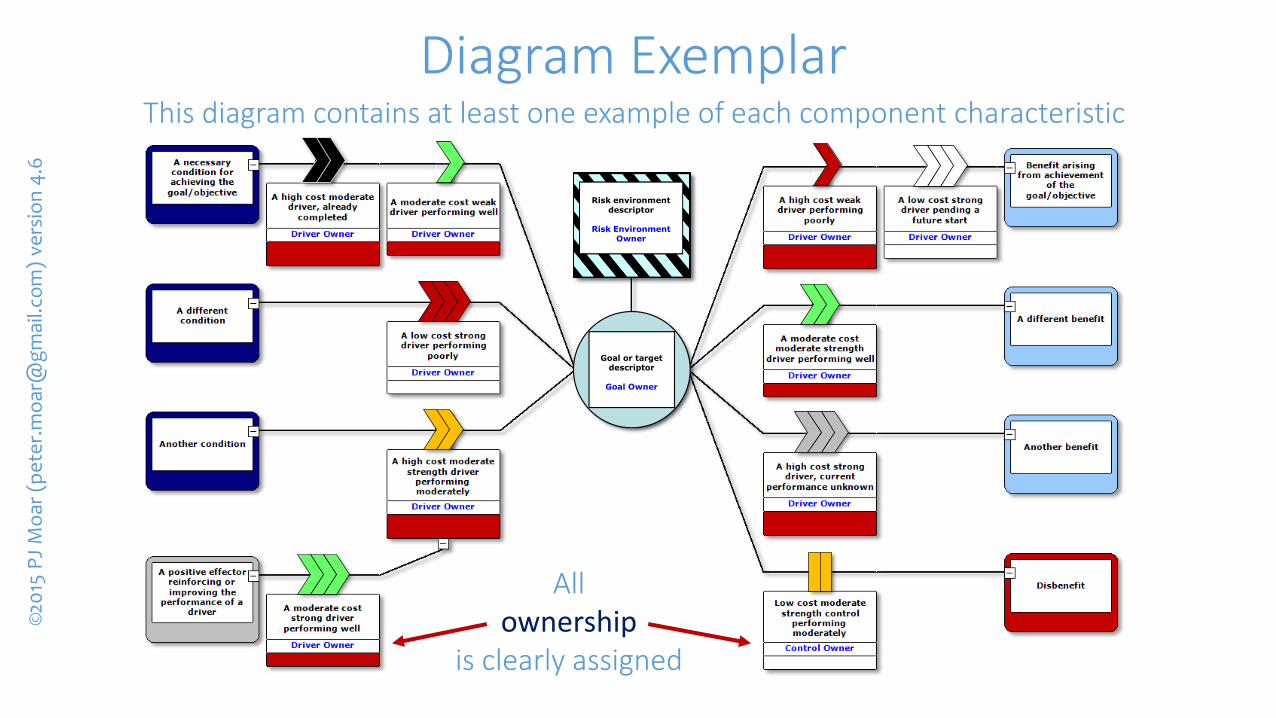
Diagram Exemplar©
2015
PJ
Mo
ar (
pe
ter.
mo
ar@
gm
ail.c
om
) ve
rsio
n 4
.6
This diagram contains at least one example of each component characteristic
Risk environment descriptor
Risk Environment Owner
Goal or target descriptor
Goal Owner
Allownership
is clearly assigned
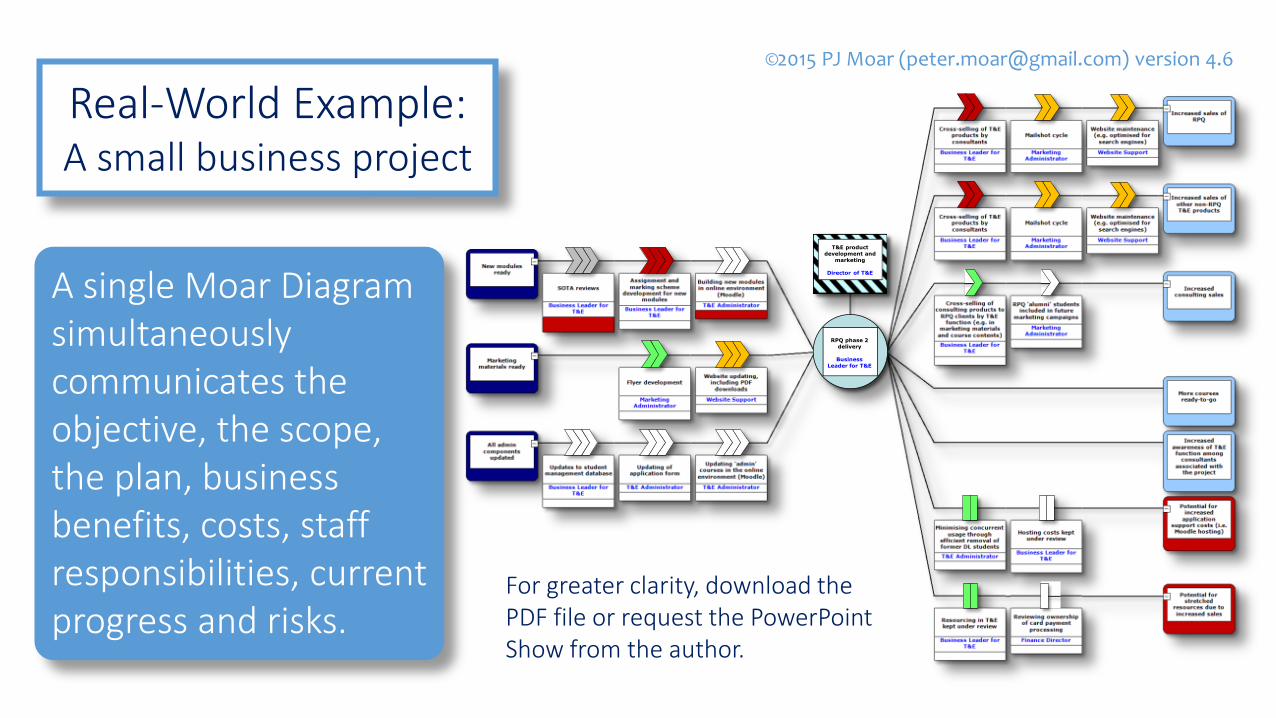
A single Moar Diagram simultaneously communicates the objective, the scope, the plan, business benefits, costs, staff responsibilities, current progress and risks.
Real-World Example:A small business project
©2015 PJ Moar ([email protected]) version 4.6
For greater clarity, download the PDF file or request the PowerPoint Show from the author.
RPQ phase 2 delivery
Business Leader for T&E
T&E product development and
marketing
Director of T&E
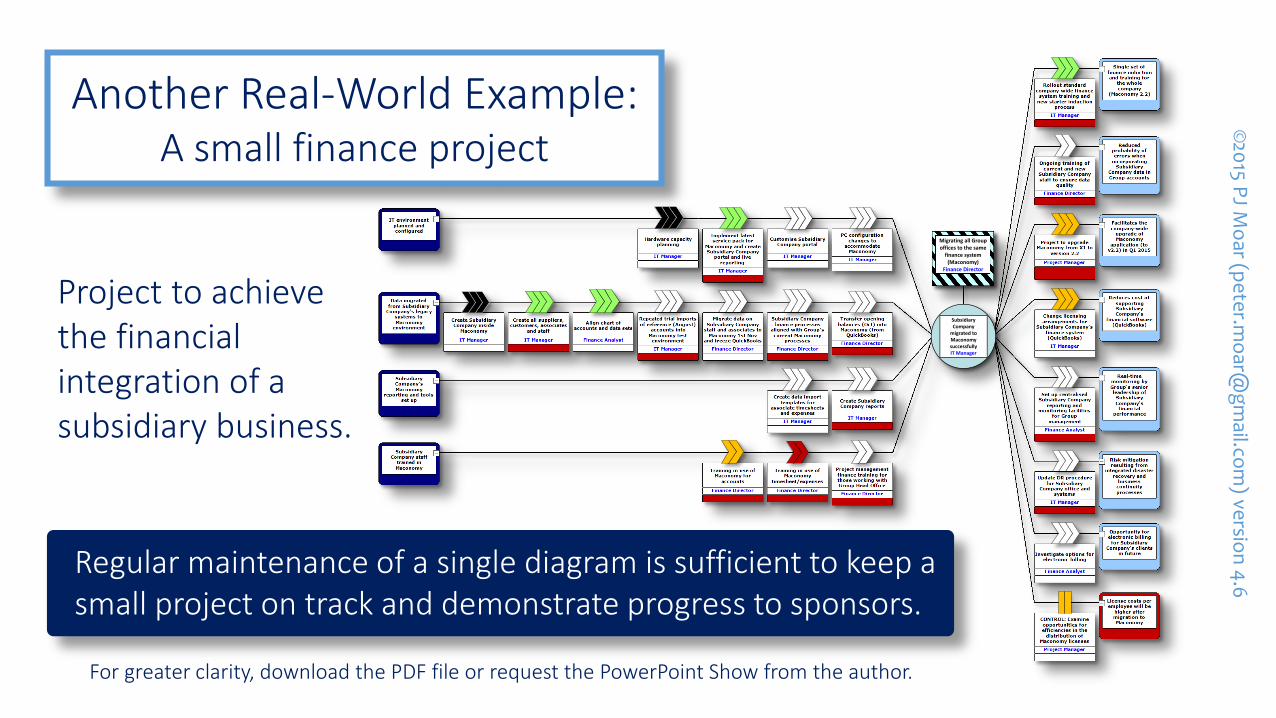
Regular maintenance of a single diagram is sufficient to keep a small project on track and demonstrate progress to sponsors.
Project to achieve the financial integration of a subsidiary business.
©20
15 PJ M
oar (p
ete
r.mo
ar@g
mail.co
m) ve
rsion
4.6
For greater clarity, download the PDF file or request the PowerPoint Show from the author.
Migrating all Group offices to the same
finance system (Maconomy)
Finance Director
Subsidiary Company
migrated to Maconomy successfullyIT Manager
Another Real-World Example:A small finance project
©20
15 PJ M
oar (p
ete
r.mo
ar@g
mail.co
m) ve
rsion
4.6
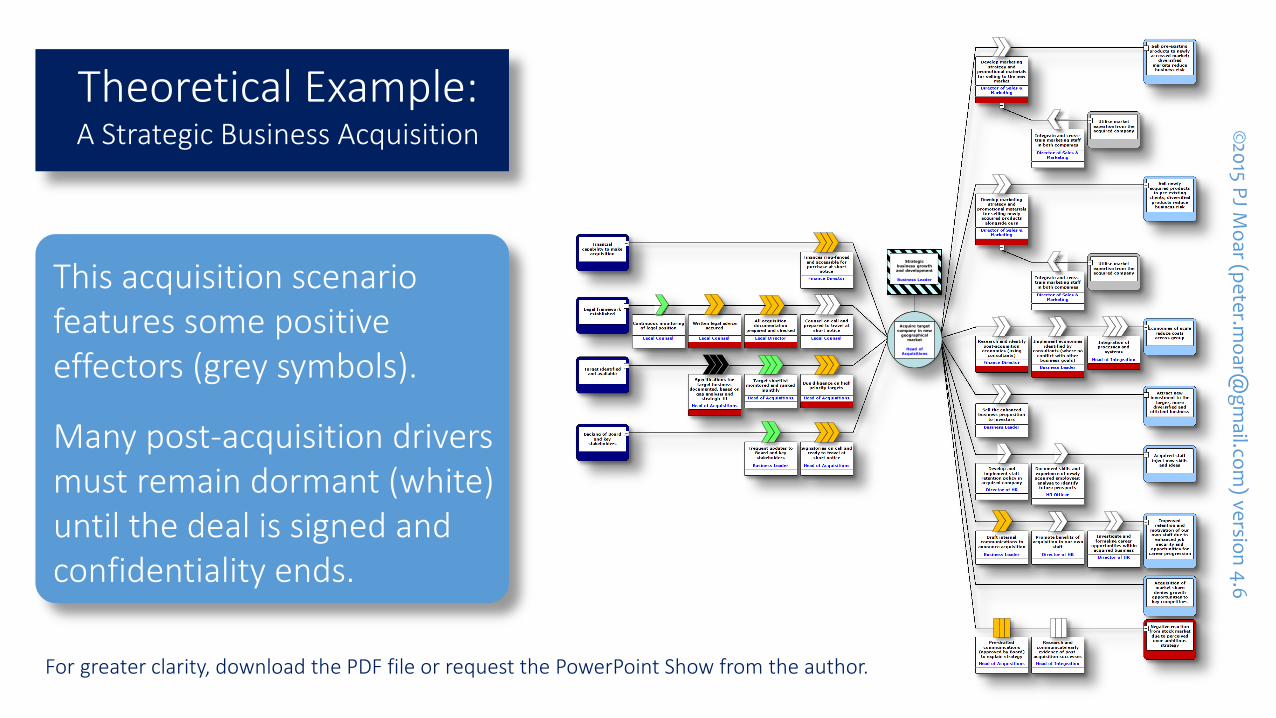
Theoretical Example:A Strategic Business Acquisition
This acquisition scenario features some positive effectors (grey symbols).
Many post-acquisition drivers must remain dormant (white) until the deal is signed and confidentiality ends.
For greater clarity, download the PDF file or request the PowerPoint Show from the author.
Strategic
business growth
and development
Business Leader
Acquire target
company in new
geographical
market
Head of
Acquisitions
SEEING RED©
2015 P
J Mo
ar (pe
ter.m
oar@
gm
ail.com
) versio
n 4
.6
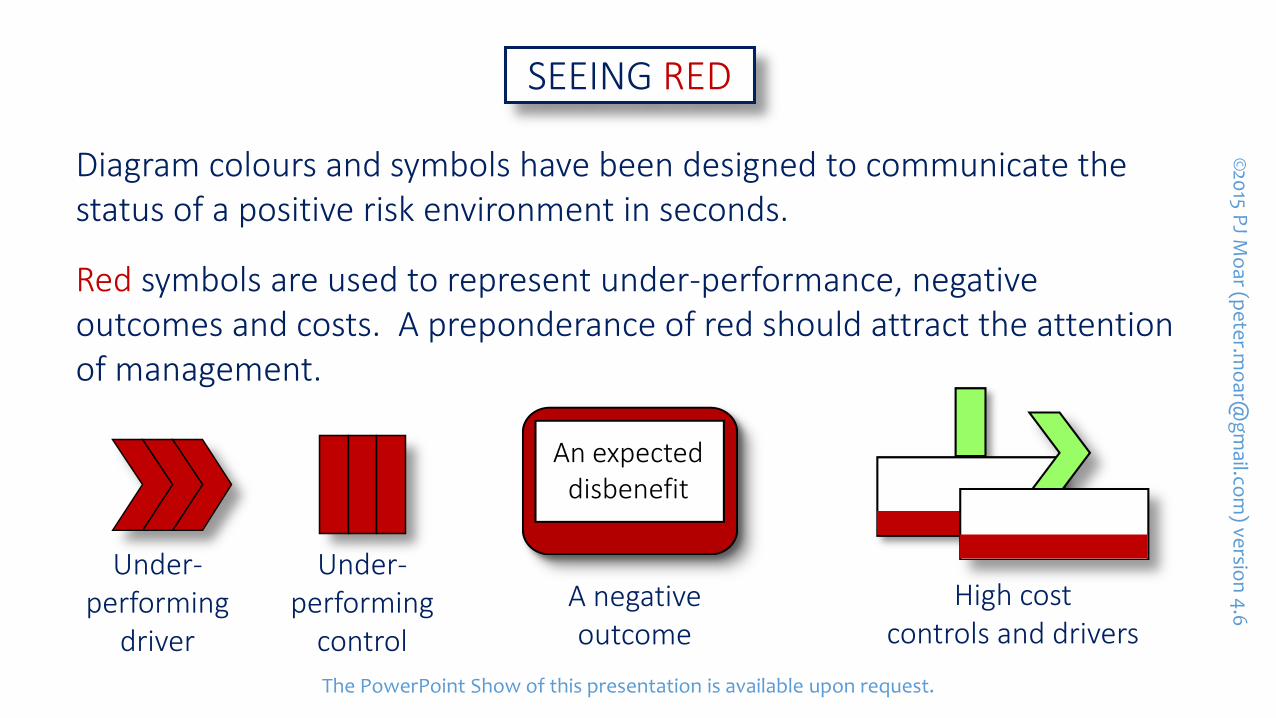
Diagram colours and symbols have been designed to communicate the status of a positive risk environment in seconds.
Red symbols are used to represent under-performance, negative outcomes and costs. A preponderance of red should attract the attention of management.
An expected disbenefit
Under-performing
driver
Under-performing
control
A negative outcome
High costcontrols and drivers
The PowerPoint Show of this presentation is available upon request.
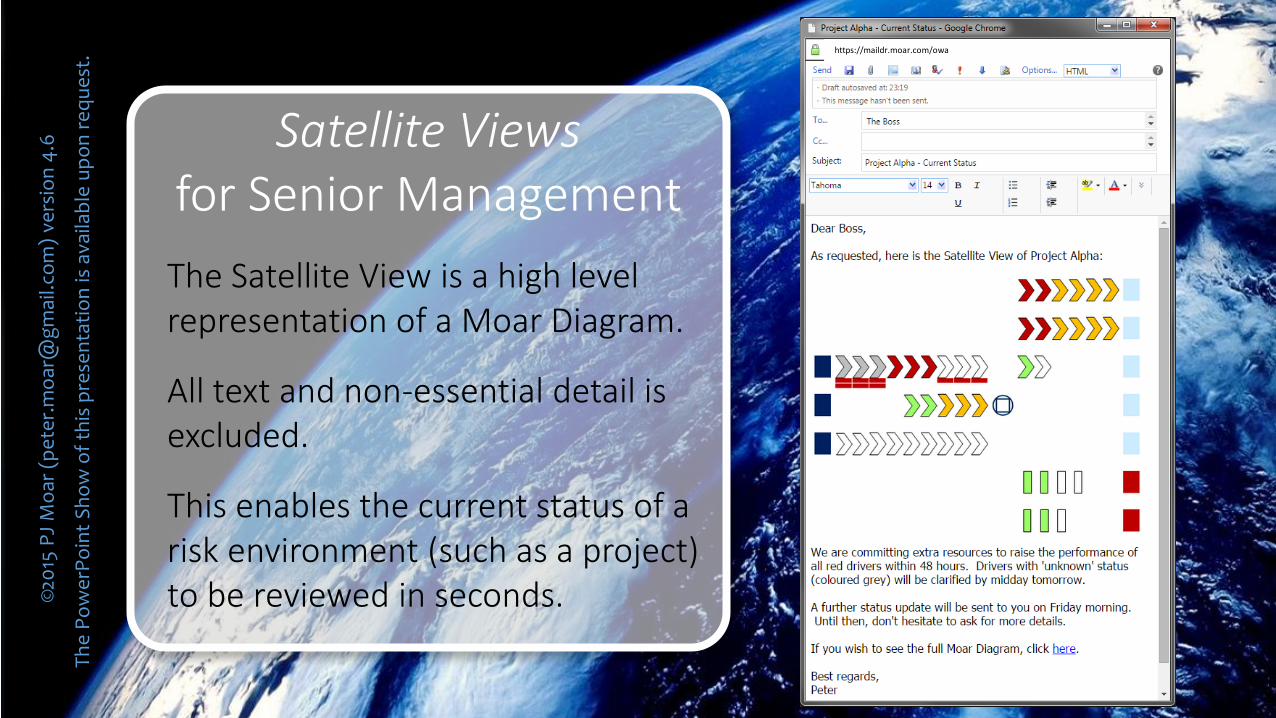
Satellite Viewsfor Senior Management
The Satellite View is a high level representation of a Moar Diagram.
All text and non-essential detail is excluded.
This enables the current status of a risk environment (such as a project) to be reviewed in seconds.©
2015
PJ
Mo
ar (
pe
ter.
mo
ar@
gm
ail.c
om
) ve
rsio
n 4
.6
Th
e P
ow
erP
oin
t S
ho
w o
f th
is p
rese
nta
tio
n is
ava
ilab
le u
po
n r
eq
ue
st. https://maildr.moar.com/owa
©2015 PJ Moar ([email protected]) version 4.6
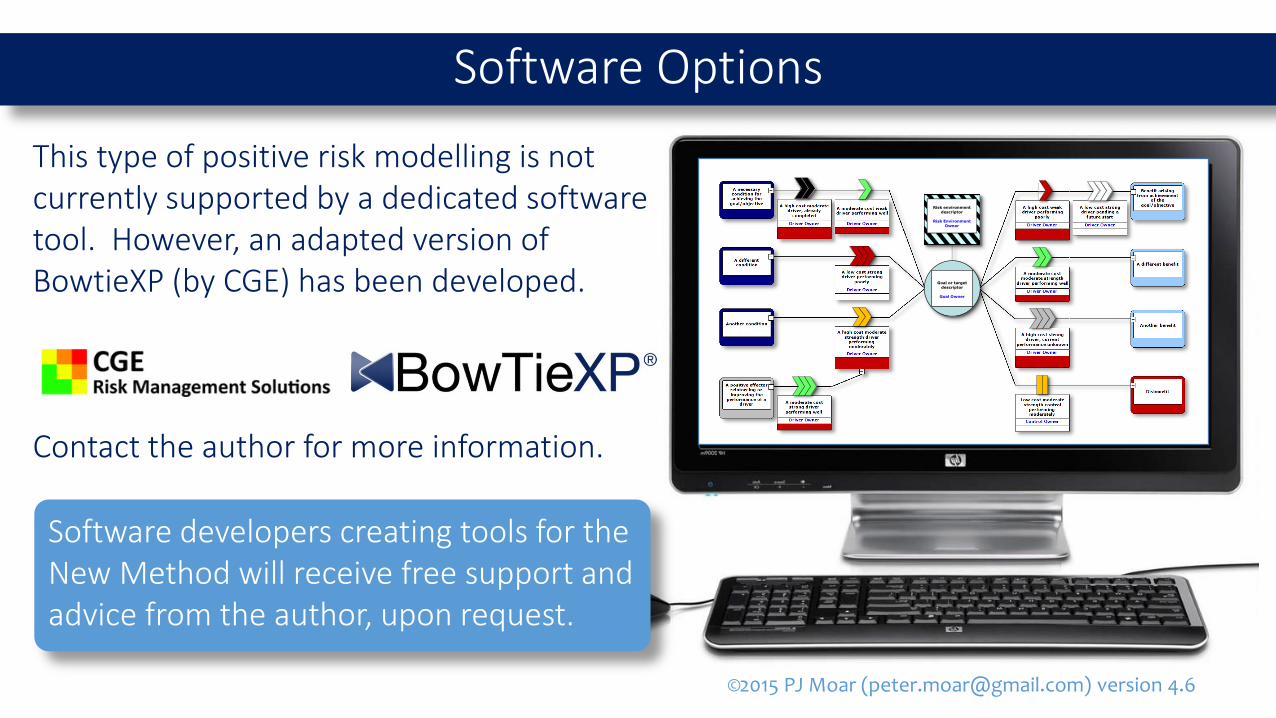
Software Options
Software developers creating tools for the New Method will receive free support and advice from the author, upon request.
This type of positive risk modelling is not currently supported by a dedicated software tool. However, an adapted version of BowtieXP (by CGE) has been developed.
Contact the author for more information.
Risk environment descriptor
Risk Environment Owner
Goal or target descriptor
Goal Owner

A New Method for
Visualizing Success
©20
15 PJ M
oar (p
ete
r.mo
ar@g
mail.co
m) ve
rsion
4.6
Until software becomes available, tryusing custom sticky notes or Excel
Click the document to view and/or download a free guide to
the Method (via Slideshare)
Workshop Techniquesand Outputs
For high quality diagrams use graphical tools, such as MS PowerPoint or Visio
©2015 PJ [email protected]
version 4.6
POSITIVE OR UPSIDE RISKModelling good events
Maximising positive outcomes
Moar Diagram
NEGATIVE OR DOWNSIDE RISKModelling bad events
Minimising negative outcomes
Bowtie Diagram
VISUALIZINGUNCERTAINTY
The ECRM paradigm delivers two powerful management tools
RESISTANCE MOMENTUM
Event Centred Risk Modelling
Condition
Condition
Condition Good Event
NegativeEffect
BadEvent
Positive EffectCause
Cause
Cause NegativeEffect
NegativeEffect
Positive Effect
Positive Effect
©20
15 PJ M
oar (p
ete
r.mo
ar@g
mail.co
m) ve
rsion
4.6
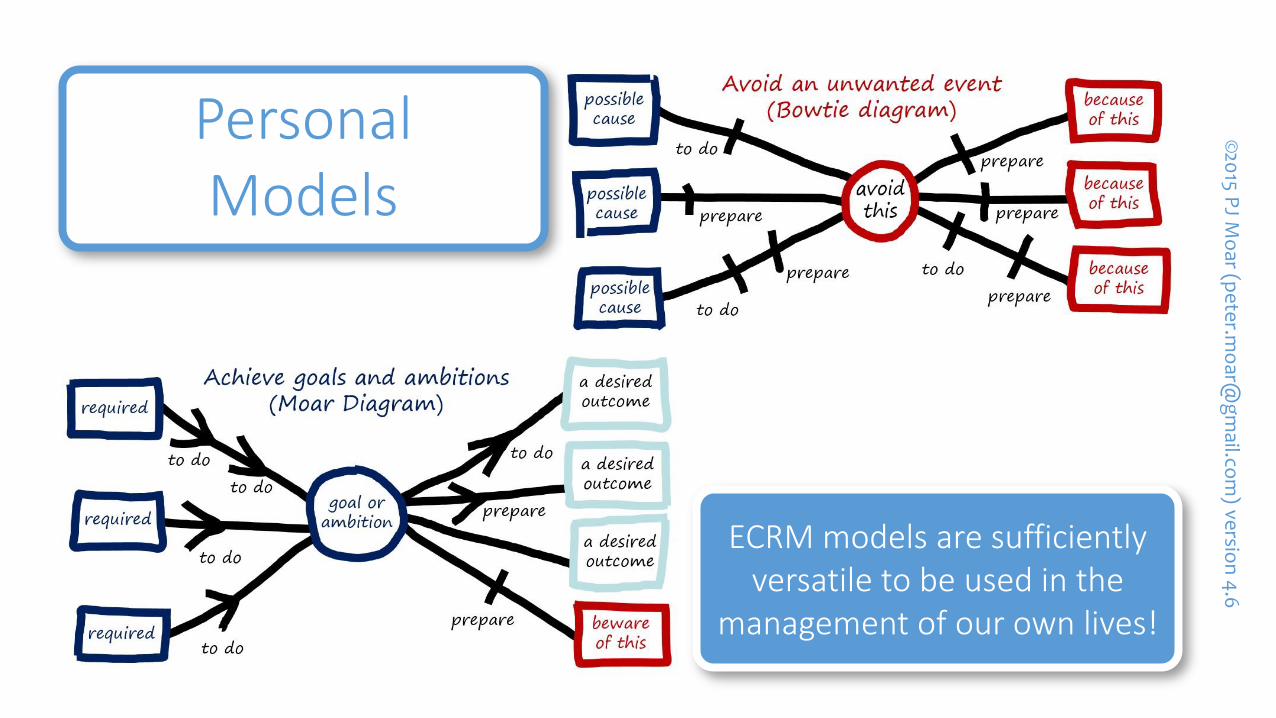
PersonalModels
ECRM models are sufficiently versatile to be used in the
management of our own lives!

©2015 PJ Moar ([email protected]) version 4.6
SUMMARY
The New Method of positive risk modelling aims to maximise the probability of successful outcomes in goal-focused environments.
Data acquired via the method is visualized as Moar Diagrams.
Each diagram identifies an objective and its expected benefits; it clarifies the ownership of drivers and controls, using colours and shapes to highlight both costs and performance risk.
Satellite Views offer senior management an informative, high level insight to the contents of a Moar Diagram.
Project initiation or scoping using the method becomes a fast, outcome-focused activity.
Small projects may be managed and communicated through a single Moar Diagram.
A new analytical paradigm has emerged: Event Centred Risk Modelling (ECRM).
The PowerPoint Show of this presentation is available upon request.
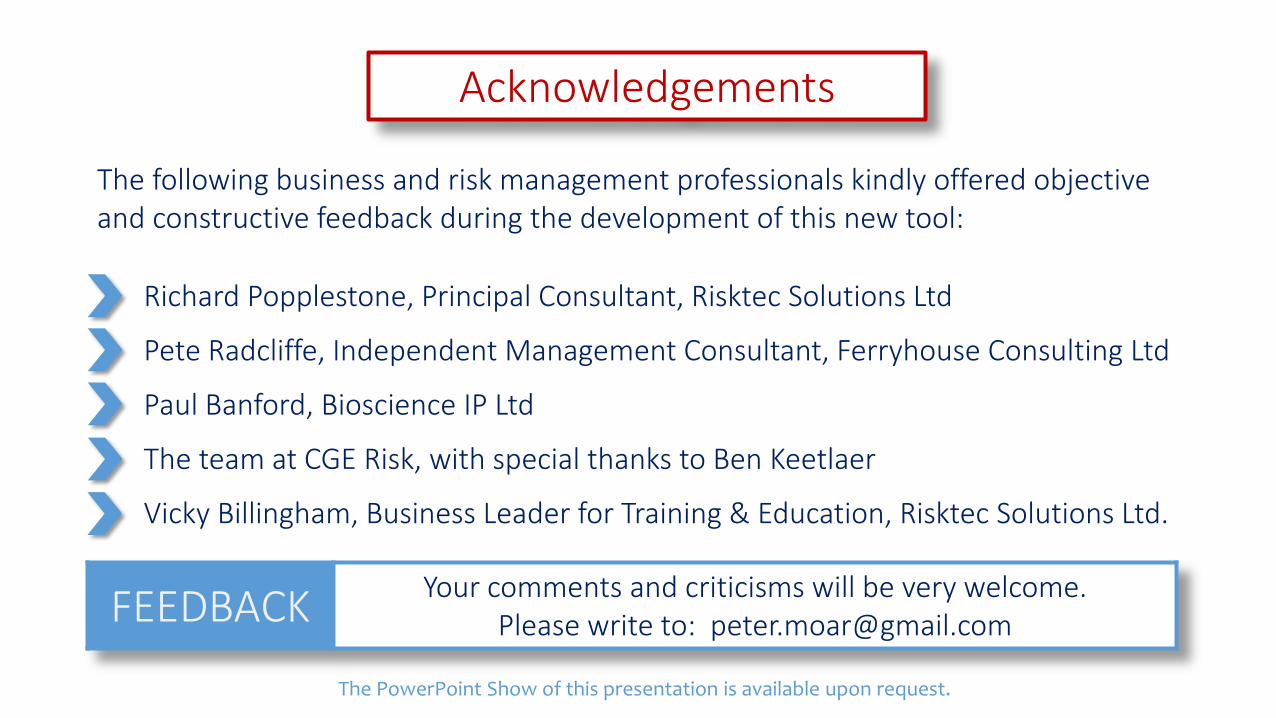
The following business and risk management professionals kindly offered objective and constructive feedback during the development of this new tool:
Richard Popplestone, Principal Consultant, Risktec Solutions Ltd
Pete Radcliffe, Independent Management Consultant, Ferryhouse Consulting Ltd
Paul Banford, Bioscience IP Ltd
The team at CGE Risk, with special thanks to Ben Keetlaer
Vicky Billingham, Business Leader for Training & Education, Risktec Solutions Ltd.
FEEDBACKYour comments and criticisms will be very welcome.
Please write to: [email protected]
Acknowledgements
The PowerPoint Show of this presentation is available upon request.
©2015 PJ Moar ([email protected]) version 4.6
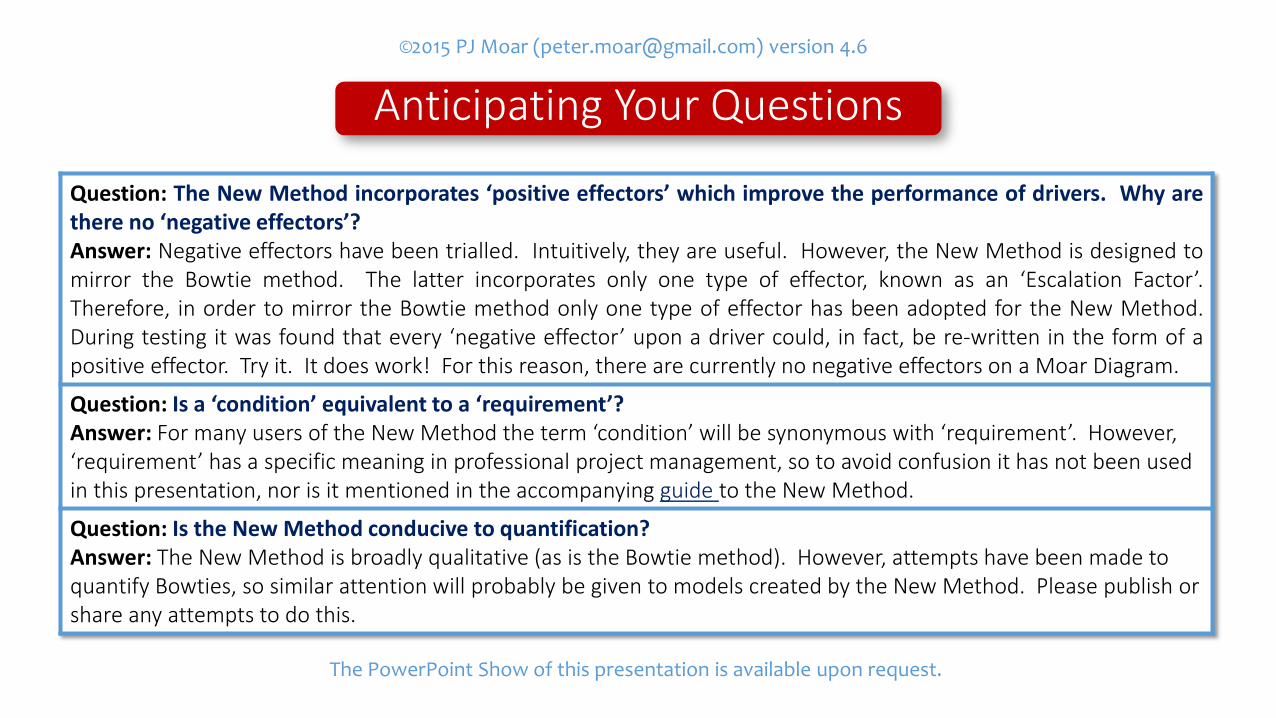
Anticipating Your Questions
Question: The New Method incorporates ‘positive effectors’ which improve the performance of drivers. Why arethere no ‘negative effectors’?Answer: Negative effectors have been trialled. Intuitively, they are useful. However, the New Method is designed tomirror the Bowtie method. The latter incorporates only one type of effector, known as an ‘Escalation Factor’.Therefore, in order to mirror the Bowtie method only one type of effector has been adopted for the New Method.During testing it was found that every ‘negative effector’ upon a driver could, in fact, be re-written in the form of apositive effector. Try it. It does work! For this reason, there are currently no negative effectors on a Moar Diagram.
Question: Is a ‘condition’ equivalent to a ‘requirement’?Answer: For many users of the New Method the term ‘condition’ will be synonymous with ‘requirement’. However, ‘requirement’ has a specific meaning in professional project management, so to avoid confusion it has not been used in this presentation, nor is it mentioned in the accompanying guide to the New Method.
Question: Is the New Method conducive to quantification?Answer: The New Method is broadly qualitative (as is the Bowtie method). However, attempts have been made to quantify Bowties, so similar attention will probably be given to models created by the New Method. Please publish or share any attempts to do this.
The PowerPoint Show of this presentation is available upon request.
©2015 PJ Moar ([email protected]) version 4.6
Anticipating Your Questions - continued
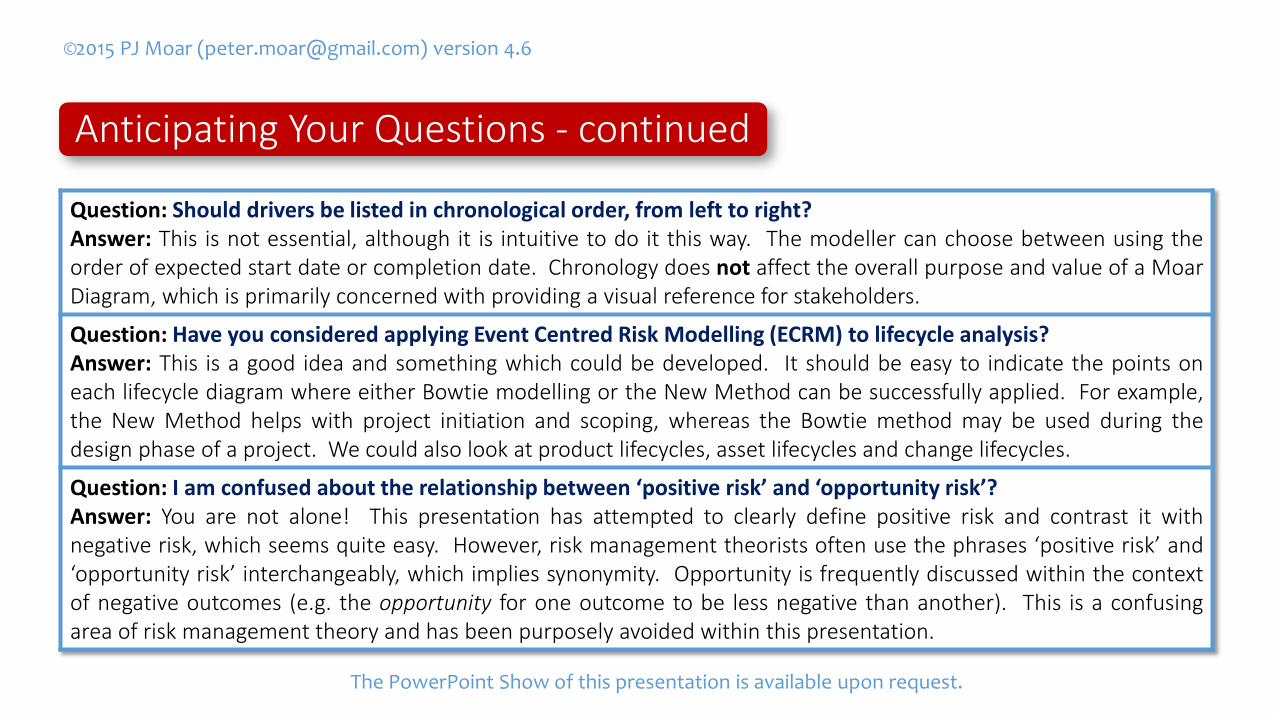
Question: Should drivers be listed in chronological order, from left to right?Answer: This is not essential, although it is intuitive to do it this way. The modeller can choose between using theorder of expected start date or completion date. Chronology does not affect the overall purpose and value of a MoarDiagram, which is primarily concerned with providing a visual reference for stakeholders.
Question: Have you considered applying Event Centred Risk Modelling (ECRM) to lifecycle analysis?Answer: This is a good idea and something which could be developed. It should be easy to indicate the points oneach lifecycle diagram where either Bowtie modelling or the New Method can be successfully applied. For example,the New Method helps with project initiation and scoping, whereas the Bowtie method may be used during thedesign phase of a project. We could also look at product lifecycles, asset lifecycles and change lifecycles.
Question: I am confused about the relationship between ‘positive risk’ and ‘opportunity risk’?Answer: You are not alone! This presentation has attempted to clearly define positive risk and contrast it withnegative risk, which seems quite easy. However, risk management theorists often use the phrases ‘positive risk’ and‘opportunity risk’ interchangeably, which implies synonymity. Opportunity is frequently discussed within the contextof negative outcomes (e.g. the opportunity for one outcome to be less negative than another). This is a confusingarea of risk management theory and has been purposely avoided within this presentation.
The PowerPoint Show of this presentation is available upon request.
©2015 PJ Moar ([email protected]) version 4.6
Anticipating Your Questions - continued
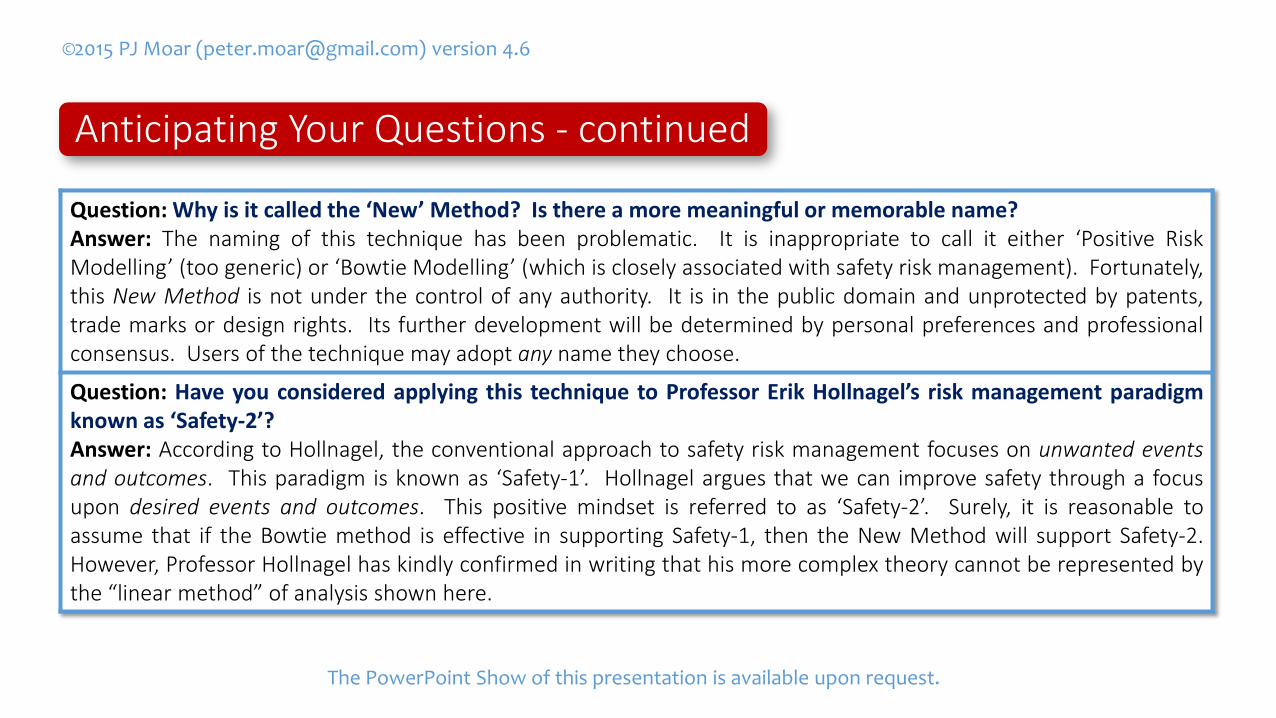
Question: Why is it called the ‘New’ Method? Is there a more meaningful or memorable name?Answer: The naming of this technique has been problematic. It is inappropriate to call it either ‘Positive RiskModelling’ (too generic) or ‘Bowtie Modelling’ (which is closely associated with safety risk management). Fortunately,this New Method is not under the control of any authority. It is in the public domain and unprotected by patents,trade marks or design rights. Its further development will be determined by personal preferences and professionalconsensus. Users of the technique may adopt any name they choose.
Question: Have you considered applying this technique to Professor Erik Hollnagel’s risk management paradigmknown as ‘Safety-2’?Answer: According to Hollnagel, the conventional approach to safety risk management focuses on unwanted eventsand outcomes. This paradigm is known as ‘Safety-1’. Hollnagel argues that we can improve safety through a focusupon desired events and outcomes. This positive mindset is referred to as ‘Safety-2’. Surely, it is reasonable toassume that if the Bowtie method is effective in supporting Safety-1, then the New Method will support Safety-2.However, Professor Hollnagel has kindly confirmed in writing that his more complex theory cannot be represented bythe “linear method” of analysis shown here.
The PowerPoint Show of this presentation is available upon request.

©2015 PJ Moar ([email protected]) version 4.6
Anticipating Your Questions - continued
Question: How could the New Method be further improved?Answer: Firstly, the creation of a fully functional software tool will result in significant improvements due to theanalytical rigour of the software development process and the opportunities to embed more valuable data withineach of the diagram components. Within the modelling theory, there may be a significant difference betweenpositive events which are planned (e.g. project delivery) and those events which are more ‘random’ or unpredictablein nature (e.g. a favourable product review, a patentable innovation, a sale, or an industry award). It is feasible thatevents perceived as ‘random’ may be made more likely to occur through ‘positive risk’ management.
Question: Why is the word “Visualizing” spelt with the letter “z” rather than “s”?Answer: On the internet, US English spellings tend to predominate. Hence, although British English is usedthroughout this presentation and its supporting documents, US English has been used for the title page andsubsequent recurrences of the word “visualize” (and its derivatives). This is done to support search engines andmaximise readership.
The PowerPoint Show of this presentation is available upon request.
About the Author
PJ Moar is a management consultant specialising in business technologies, product innovation, entrepreneurship and risk management. Peter is based in the UK with substantial international experience in many sectors.
Will your organisation benefit from the visualization of risk environments?If so, contact Peter now to arrange your first ECRM workshops.
[email protected] http://uk.linkedin.com/in/pmoar
Moar Ltd is a UK registered company No. 08281339 UK VAT Registration No. 152323738
Challenges Worldwide (CWW)Operating in some of the world’s poorest economies, CWW enables entrepreneurs andenterprises to improve their skills and grow businesses, generating income andsustainable economic growth. Visit CWW here:http://www.challengesworldwide.org/
Mines Advisory Group (MAG)Working in more than 40 countries since 1989, MAG saves lives and builds futures byreclaiming land contaminated with the remnants of conflict, such as landmines, clustermunitions, bombs, shells and mortars. Please donate here:http://www.maginternational.org/get-involved/donate
Share the BenefitsMoar Diagrams are free to employ in any commercial or non-commercial context.However, you are encouraged to share some of their benefits by supporting orpromoting one of the following international organisations:
Thanks
©20
15 PJ M
oar (p
ete
r.mo
ar@g
mail.co
m) ve
rsion
4.6
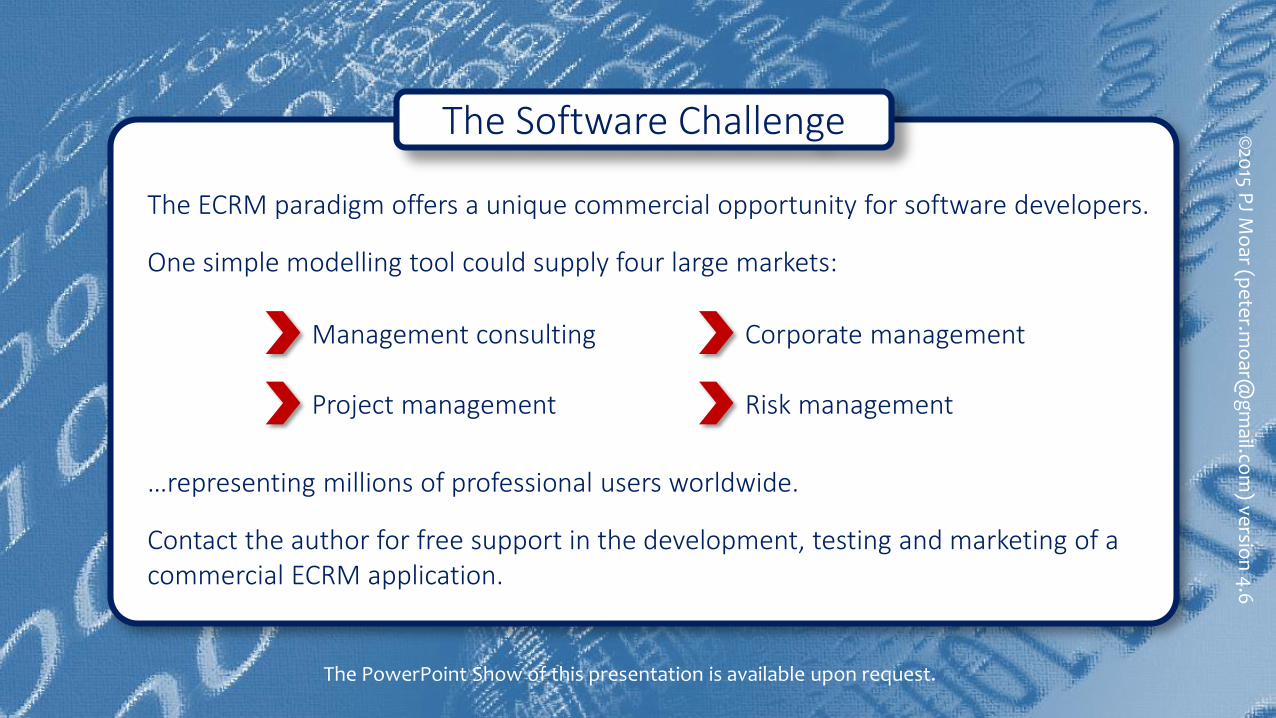
The ECRM paradigm offers a unique commercial opportunity for software developers.
One simple modelling tool could supply four large markets:
…representing millions of professional users worldwide.
Contact the author for free support in the development, testing and marketing of a commercial ECRM application.
The Software Challenge
Corporate management
Risk management
Management consulting
Project management
The PowerPoint Show of this presentation is available upon request.
This presentation may be freely distributed and shared. However, no part may be sold or publishedwithout the author’s express permission. Please contact Peter Moar: [email protected]
Version Control: This is version 4.6, which may not be the latest. The latest version will be found on Slideshare, accessible via this shortened link: http://bit.ly/Viz-Success
The PowerPoint Show of this presentation is available upon request.
The End
Visualizing Success