viva energy reit - asx · this presentation contains statistics, data and other information...
TRANSCRIPT

NOT FOR DISTRIBUTION OR RELEASE IN THE UNITED STATES
Viva Energy REITFY2018 Results &
Equity Raising
21 February 2019
VV
R F
Y2
01
8 R
ES
UL
TS
For
per
sona
l use
onl
y

NO
T F
OR
DIS
TR
IBU
TIO
N O
R R
EL
EA
SE
IN
TH
E U
NIT
ED
ST
AT
ES
This presentation has been prepared by Viva Energy REIT (“VVR” or
“Viva Energy REIT”) which is a stapled entity comprising shares in
Viva Energy REIT Limited (ABN 35 612 986 517) (“Company”)
stapled with units in the Viva Energy REIT Trust (ARSN 613 146
464) (“Trust”). VER Limited (ABN 436 609 868 000 and AFSL
483795) is the Responsible Entity of the Trust, and VER Manager
Pty Ltd provides management services to VER Limited and Viva
Energy REIT. This presentation contains information in relation to an
institutional placement (“Institutional Placement”) of new ordinary
fully paid stapled securities in VVR (“New Securities”) and an offer of
New Securities under a Security Purchase Plan (“SPP”) (together,
the “Equity Raising”).
The information provided in this presentation should be read in
conjunction with VVR's other periodic and continuous disclosure
announcements lodged with the ASX which are available at
www.asx.com.au.
Summary information
The information in this presentation is in summary form and does not
purport to be complete. This presentation is for information purposes
only, is of a general nature, does not constitute financial product
advice, nor is it intended to constitute legal, tax or accounting advice
or opinion. This information does not purport to include or summarise
all information than an investor should consider when making an
investment decision nor does it contain all information which would
be required in a Product Disclosure Statement, or other disclosure
documents prepared in accordance with the requirements of the
Corporations Act 2001 (Cth) (“Corporations Act”).
Not an offer
This presentation is for information purposes only and is not a
prospectus, product disclosure statement or other disclosure or
offering document under Australian law or any other law (and will not
be lodged with the Australian Securities Investments Commission
(“ASIC”)). It does not constitute in any jurisdiction, whether in
Australia or elsewhere, an offer or invitation to apply for or purchase
stapled securities of VVR or any other financial product and neither
this presentation nor any of the information contained herein shall
form the basis of any contract or commitment.
This presentation may not be distributed or released in the United
States. This presentation does not constitute an offer to sell, or the
solicitation of an offer to buy, any securities in the United States. The
New Securities have not been, and will not be, registered under the
U.S. Securities Act of 1933 (“U.S. Securities Act”) or the securities
laws of any state or other jurisdiction of the United States. The New
Securities may not be offered or sold to, directly or indirectly, any
person in the United States, except in a transaction exempt from, or
not subject to, the registration requirements of the U.S. Securities
Act and any other applicable U.S. state securities laws.
The distribution of this presentation outside Australia may be
restricted by law. Any recipient of this presentation outside Australia
should seek advice on and observe such restrictions. Any non-
compliance with these restrictions may constitute a violation of
applicable securities laws. Refer to the “Foreign Selling Restriction”’
section in Appendix 3 of this presentation for more information.
Investment risk
An investment in securities in VVR is subject to investment and other
known and unknown risks, some of which are beyond the control of
VVR, including possible loss of income and principal invested. VVR
does not guarantee any particular rate of return or the performance
of VVR, nor does it guarantee any particular tax treatment. Investors
should have regard to (amongst other things) the risk factors
described in the “Key Risk Factor” section in Appendix 2 of this
presentation when making their investment decision.
No investment or financial product advice
The information contained in this presentation does not constitute
investment or financial product advice (nor taxation, accounting or
legal advice), is not a recommendation to acquire New Securities
and does not and will not form the basis of any contract or
commitment for the acquisition of New Securities. This presentation
has been prepared without taking into account the investment
objectives, financial situation or particular needs of any particular
person. Before making an investment decision, investors must
consider the appropriate of the information (including but not limited
to the assumptions, uncertainties and contingencies which may
affect future operations of VVR and the values and the impact that
different future outcomes may have on VVR) and rely on their own
examination of VVR, including the merits and risks involved having
regard to their own investment objectives, financial situation and
needs. Each person should consult a professional investment
adviser and seek legal, accounting and taxation advice appropriate
to their jurisdiction before making any decision regarding a financial
product. Cooling off rights do not apply to the acquisition of New
Securities pursuant to the Equity Raising.
Industry data and third party market data
This presentation contains statistics, data and other information
relating to markets, market sizes, market shares, market positions
and other industry data pertaining to VVR’s business and markets.
Unless otherwise indicated, such information is based on an industry
report (“Market Report”) that Viva Energy REIT commissioned from
Jones Lang LaSalle Advisory Services Pty Ltd, as well as Viva
Energy REIT’s analysis of such information. The information
contained in the Market Report has been accurately reproduced,
and, as far as VVR is aware, no facts have been omitted which
would render the information provided inaccurate or misleading.
You should note that market data and statistics are inherently
predictive and subject to uncertainty and not necessarily reflective of
actual market conditions.
In preparing this presentation the authors have relied upon and
assumed, without independent verification, the accuracy and
completeness of all information available from public sources or
which has otherwise been reviewed in preparation of the
presentation. All reasonable care has been taken in preparing the
information and assumptions contained in this presentation, however
no representation or warranty, express or implied, is made as to the
fairness, accuracy, completeness or correctness of the information,
opinions and conclusions contained in this presentation. The
information contained in this presentation is current as at the date of
this presentation and is subject to change without notice.
IMPORTANT NOTICE AND DISCLAIMERF
or p
erso
nal u
se o
nly

NO
T F
OR
DIS
TR
IBU
TIO
N O
R R
EL
EA
SE
IN
TH
E U
NIT
ED
ST
AT
ES
Future performance and forward looking statements
This presentation contains forward-looking statements, including
statements regarding the plans, strategies and objectives of VVR
management, distribution guidance, the timetable for the Equity
Raising and the use of the proceeds thereof. Forward looking
statements can generally be identified by the use of forward looking
words such as, 'expect', 'anticipate', 'likely', 'intend', 'should, 'could',
'may', 'predict', 'plan', 'propose', 'will', 'believe', 'forecast', 'estimate',
'target', ‘guidance’ and other similar expressions. Indications of, and
guidance or outlook on, future earnings or financial position or
performance are also forward looking statements. Such prospective
financial information contained within this presentation may be
unreliable given the circumstances and the underlying assumptions
to this information may materially change in the future.
Any forward-looking statements, including projections, guidance on
future revenues, earnings and estimates, are provided as a general
guide only and should not be relied upon as an indication or
guarantee of future performance. You are cautioned not to place
undue reliance on any forward looking statement. While due care
and attention has been used in the preparation of forward looking
statements, forward-looking statements involve known and unknown
risks, uncertainties and other factors that may cause VVR’s actual
results, performance or achievements to differ materially from any
future results, performance or achievements expressed or implied by
these forward-looking statements. Any forward-looking statements,
opinions and estimates in this presentation are based on
assumptions and contingencies which are subject to change without
notice, as are statements about market and industry trends, which
are based on interpretations of current market conditions. A number
of important factors could cause VVR’s actual results to differ
materially from the plans, objectives, expectations, estimates and
intentions expressed in such forward looking statements, including
the risk factors described in the “Key Risk Factor” section in
Appendix 2 of this presentation, and many of these factors are
beyond VVR’s control.
You should rely on your own independent assessment of any
information, statements or representations contained in this
presentation and any reliance on information in this presentation will
be entirely at your own risk. This presentation may not be
reproduced or published, in whole or in part, for any purpose without
the prior written permission of VVR. VVR disclaims any intent or
obligation to update publicly any forward-looking statements,
whether as a result of new information, future events or results or
otherwise.
Past performance
Past performance and pro-forma historical information in this
presentation is given for illustrative purposes only and should not be
relied upon (and is not) an indication of future performance including
future security price information. Historical information in this
presentation relating to VVR is information that has been released to
the market. For further information, please see past announcements
released to ASX.
Financial data
All dollar values are in Australian dollars ($ or AUD) unless stated
otherwise. All references starting with “FY” refer to the financial year
for VVR, ending 31 December. For example, “FY2018” refers to the
financial year ended 31 December 2018.
The financial information in this presentation has been prepared and
presented in accordance with the recognition and measurements
principles prescribed in the Australian Accounting Standards
(including the Australian Accounting Interpretations) issued by the
Australian Accounting Standards Board (“Australian Accounting
Standards” or “AAS”), which are consistent with International
Financial Reporting Standards (“IFRS”) and interpretations issued by
the International Accounting Standards Board. The financial
presentation in this presentation is presented in an abbreviated form
insofar as it does not include all of the presentation and disclosures
required by the AAS and other mandatory professional reporting
requirements applicable to general purpose financial reports
prepared in accordance with the Corporations Act.
This presentation includes certain pro forma historical financial
information. The pro forma historical financial information provided in
this presentation is for illustrative purposes only and is not
represented as being indicative of VVR's views on its, nor anyone
else’s, future financial position and/or performance. The pro forma
historical financial information has been prepared by VVR in
accordance with the measurement and recognition principles, but not
the disclosure requirements prescribed by Australian Accounting
Standards. The pro forma historical financial information included in
this presentation does not purport to be in compliance with Article 11
of Regulation S-X of the rules and regulations of the U.S. Securities
and Exchange Commission, and such information does not purport
to comply with Article 3-05 of Regulation S-X.
In addition, investors should be aware that certain financial
measures in this Presentation are "non-IFRS financial information"
under ASIC Regulatory Guide 230 Disclosing non-IFRS financial
information published by ASIC and also non-GAAP financial
measures’ within the meaning of Regulation G under the U.S.
Securities Exchange Act of 1934 and are not recognised under AAS
and IFRS. Non-IFRS financial information/non-GAAP financial
measures in this presentation include, among other things,
distributable earnings, gearing and gearing ratio and the pro-forma
balance sheet set out on page 32. VVR believes this non-IFRS
financial information/non-GAAP financial measures provide useful
information to users in measuring the financial performance and
condition of VVR. However, investors should note that the non-IFRS
financial information and non-GAAP financial measures do not have
a standardised meaning prescribed by AAS or IFRS and, therefore,
may not be comparable to similarly titled measures presented by
other entities, nor should they be construed as an alternative to other
financial measures determined in accordance with AAS or IFRS.
Investors are cautioned, therefore, not to place undue reliance on
any non-IFRS financial information/non-GAAP financial measures
and ratios included in this presentation.
Effect of rounding
A number of figures, amounts, percentages, estimates, calculations
of value and fractions in this presentation are subject to the effect of
rounding. Accordingly, the actual calculation of these figures may
differ from the figures set out in this presentation.
IMPORTANT NOTICE AND DISCLAIMERF
or p
erso
nal u
se o
nly
NO
T F
OR
DIS
TR
IBU
TIO
N O
R R
EL
EA
SE
IN
TH
E U
NIT
ED
ST
AT
ES
General disclaimer
The underwriters to the Institutional Placement, together with their
related bodies corporate, shareholders or affiliates and each of their
respective officers, directors, employees, affiliates, agents or
advisers (each a “Limited Party”) have not authorised, permitted or
caused the issue, lodgement, submission, dispatch or provision of
this presentation and do not make or purport to make any statement
in this presentation and there is no statement in this presentation
which is based on any statement by a Limited Party.
No representation or warranty, express or implied, is made by VVR,
its related bodies corporate, any of their respective officers, directors,
employees, agents or advisers, nor any Limited Party as to the
accuracy, reliability, completeness or fairness of the information,
opinions and conclusions contained in this presentation.
Neither VVR, VER Limited, VER Manager Pty Ltd, nor any of their
associates, related entities or any of their respective officers,
directors, employees, agents, consultants or advisers, nor any
Limited Party, gives any warranty or representation (express or
implied) as to the accuracy, reliability or completeness of the
information, opinions or conclusions contained in this presentation.
In particular, the Limited Parties have not independently verified
such information and take no responsibility for any part of this
presentation or the Equity Raising.
To the maximum extent permitted by law and subject to any
continuing obligations under the ASX listing rules, VVR, VER
Manager Pty Ltd and VER Limited and each of their respective
associates, related entities, officers, directors, employees, agents,
consultants and advisers and each of the Limited Parties do not
accept and expressly disclaim any liability for any loss or damage
(including, without limitation, any liability arising out of fault or
negligence and whether direct, indirect, consequential or otherwise)
arising from the use of, or reliance on, anything contained in or
omitted from this presentation. Statements made in this presentation
are made only at the date of the presentation. VVR is under no
obligation to update this presentation. The information in this
presentation remains subject to change by VVR without notice.
The Limited Parties make no recommendations as to whether you or
your related parties should participate in the Equity Raising, nor do
they make any representations or warranties to you concerning the
Equity Raising, and you represent, warrant and agree that you have
not relied on any statements made by a Limited Party in relation to
the Equity Raising and you further expressly disclaim that you are in
a fiduciary relationship with any of them.
Investors acknowledge and agree that determination of eligibility of
investors for the purposes of the Equity Raising is determined by
reference to a number of matters, including legal and regulatory
requirements, logistical and registry constraints and the discretion of
VVR and/or the Limited Parties, and each of VVR and the Limited
Parties disclaim any duty or liability (including for negligence) in
respect of that determination and the exercise or otherwise of that
discretion, to the maximum extent permitted by law.
IMPORTANT NOTICE AND DISCLAIMERF
or p
erso
nal u
se o
nly

NO
T F
OR
DIS
TR
IBU
TIO
N O
R R
EL
EA
SE
IN
TH
E U
NIT
ED
ST
AT
ES
5
Highlights
MARGARET KENNEDY
Managing Director VER Manager Pty LimitedFor
per
sona
l use
onl
y

NO
T F
OR
DIS
TR
IBU
TIO
N O
R R
EL
EA
SE
IN
TH
E U
NIT
ED
ST
AT
ES
6
Results overviewVVR continues to deliver on strategic objectives
KE
Y H
IGH
LIG
HT
S
VV
R F
Y2
01
8 R
ES
UL
TS
FY2018 Distributable Earnings of 14.02 CPS1, ahead of guidance
Continued growth in portfolio size whilst maintaining focus on quality
Acquisition pipeline replenished
Active capital management delivers path to continued growth
FY2019 Distributable Earnings per security growth guidance range of 3-3.75%2,3 from FY2018
1 Based on weighted average number of stapled securities on issue during the reporting period2 Includes the impact of the $100 million fully underwritten Institutional Placement but does not include any impact attributable to the SPP (see page 30 for further details in relation to the
Institutional Placement and the SPP)3 Provided there are no material changes in market conditions and no other factors adversely affecting VVR
For
per
sona
l use
onl
y

NO
T F
OR
DIS
TR
IBU
TIO
N O
R R
EL
EA
SE
IN
TH
E U
NIT
ED
ST
AT
ES
7
FY2018 key highlights
Portfolio & Acquisitions Capital ManagementFinancial Performance
1 Based on weighted average number of stapled securities on issue during the reporting period2 NTA reported at 31 December 2018 included a provision for the declared distribution of 7.03 CPS. Reported NTA in prior periods has included distributions accrued to the reporting date3 12 of 454 properties are subject to annual rent increases other than fixed 3% per annum4 By value5 Gearing calculated as total liabilities to total tangible assets measured in accordance with Australian Accounting Standards, but excluding any mark-to-market valuations of derivative
assets/liabilities. Increased gearing relative to 30 June FY2018 partly reflects inclusion of a distribution provision (see page 12 for further details)6 Includes the impact of the $100 million fully underwritten Institutional Placement but does not include any impact attributable to the SPP (see page 30 for further details in relation to the
Institutional Placement and the SPP)
14.02 CPS Distributable Earnings1
(up 4.5% from FY2017)
NTA $2.20 per security2
(up 3.8% from December 2017)
20bps Management Expense Ratio(down from 24bps in FY2017)
$2.5 billion portfolio454 high-quality service stations and
convenience properties with WACR 5.8%
WALE of 12.6 yearsWith 3% per annum fixed rent increases3
Well located portfolio75% metro propert ies 4
36.2% gearing ratio5
Reduces to 32.3% pro-forma for
the Institutional Placement 6
Weighted debt facility
maturity of 3.8 yearsIncreased from 2.6 years in December 2017
Increased debt facilities,
lengthened tenor and
diversified sources of capital$160m of new facilities
KE
Y H
IGH
LIG
HT
S
VV
R F
Y2
01
8 R
ES
UL
TS
For
per
sona
l use
onl
y
NO
T F
OR
DIS
TR
IBU
TIO
N O
R R
EL
EA
SE
IN
TH
E U
NIT
ED
ST
AT
ES
8
Positioning VVR for future growthK
EY
HIG
HL
IGH
TS
VV
R F
Y2
01
8 R
ES
UL
TS
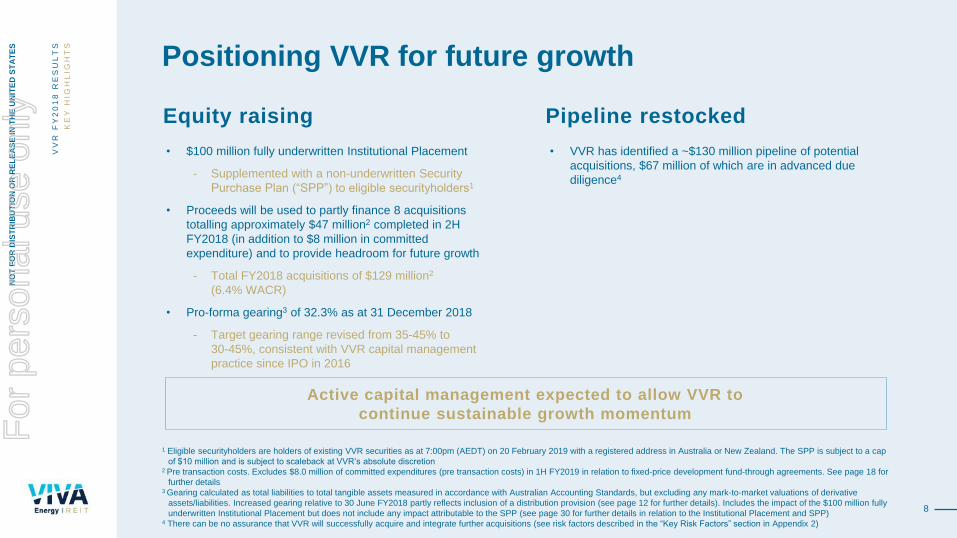
Equity raising
• $100 million fully underwritten Institutional Placement
- Supplemented with a non-underwritten Security
Purchase Plan (“SPP”) to eligible securityholders1
• Proceeds will be used to partly finance 8 acquisitions
totalling approximately $47 million2 completed in 2H
FY2018 (in addition to $8 million in committed
expenditure) and to provide headroom for future growth
- Total FY2018 acquisitions of $129 million2
(6.4% WACR)
• Pro-forma gearing3 of 32.3% as at 31 December 2018
- Target gearing range revised from 35-45% to
30-45%, consistent with VVR capital management
practice since IPO in 2016
Pipeline restocked
• VVR has identified a ~$130 million pipeline of potential
acquisitions, $67 million of which are in advanced due
diligence4
Active capital management expected to allow VVR to
continue sustainable growth momentum
1 Eligible securityholders are holders of existing VVR securities as at 7:00pm (AEDT) on 20 February 2019 with a registered address in Australia or New Zealand. The SPP is subject to a cap
of $10 million and is subject to scaleback at VVR’s absolute discretion2 Pre transaction costs. Excludes $8.0 million of committed expenditures (pre transaction costs) in 1H FY2019 in relation to fixed-price development fund-through agreements. See page 18 for
further details3 Gearing calculated as total liabilities to total tangible assets measured in accordance with Australian Accounting Standards, but excluding any mark-to-market valuations of derivative
assets/liabilities. Increased gearing relative to 30 June FY2018 partly reflects inclusion of a distribution provision (see page 12 for further details). Includes the impact of the $100 million fully
underwritten Institutional Placement but does not include any impact attributable to the SPP (see page 30 for further details in relation to the Institutional Placement and SPP)4 There can be no assurance that VVR will successfully acquire and integrate further acquisitions (see risk factors described in the “Key Risk Factors” section in Appendix 2)
For
per
sona
l use
onl
y
NO
T F
OR
DIS
TR
IBU
TIO
N O
R R
EL
EA
SE
IN
TH
E U
NIT
ED
ST
AT
ES
9
Financial Results
GUY FARRANDS
Chief Financial Officer VER Manager Pty LimitedFor
per
sona
l use
onl
y

NO
T F
OR
DIS
TR
IBU
TIO
N O
R R
EL
EA
SE
IN
TH
E U
NIT
ED
ST
AT
ES
10
Statutory financial performanceF
INA
NC
IAL
RE
SU
LT
S
Statutory Profit and Loss
Full year
31 December 2018
$ million1
Full year
31 December 2017
$ million1
% Change
FY2018 vs FY2017
Income
Rental income from investment properties 136.8 127.9
Revenue from investment properties –
straight-line lease adjustments25.9 29.0
Finance income 0.7 0.9
Net revaluation of investment properties2 43.6 48.2
Total income 207.0 206.0 0.5%
Expenses
Management and administration expenses 5.3 5.5
Finance costs 34.5 30.0
Impact of straight-line lease adjustments on
fair value of investment properties- -
Total expenses 39.8 35.5
Statutory net profit before tax 167.2 170.5 (1.9%)
Tax expense 0.1 -
Statutory net profit 167.1 170.5 (1.9%)
VV
R F
Y2
01
8 R
ES
UL
TS
• Rental income growth driven by fixed rent
escalators and incremental acquisitions
• MER: 20bps
• Efficiencies have reduced management
and administration expenses, despite
portfolio growth
• Increased finance costs reflect
debt-funded acquisitions and write-off of
capitalised borrowing costs
1 Totals may not add due to rounding2 Net of transaction costs
For
per
sona
l use
onl
y

NO
T F
OR
DIS
TR
IBU
TIO
N O
R R
EL
EA
SE
IN
TH
E U
NIT
ED
ST
AT
ES
11
Distributable earningsAhead of guidance and up 4.5% on FY2017
1 Totals may not add due to rounding2 Includes impact of straight lining reversal. Gross increment of $77 million
FIN
AN
CIA
L R
ES
UL
TS
Distributable Earnings
Full year
31 December 2018
$ million1
Full year
31 December 2017
$ million1
% Change
FY2018 vs FY2017
Statutory net profit 167.1 170.5
Add back:
Amortisation/write off of debt
establishment costs4.1 1.6
Adjust for:
Straight-line lease adjustments 25.9 29.0
Net revaluation - investment properties2 43.6 48.2
Distributable Earnings 101.7 95.0
Weighted average number ordinary securities 725.7 708.3
Distributable Earnings per security (CPS) 14.02 13.41 4.5%
VV
R F
Y2
01
8 R
ES
UL
TS
• Distributable earnings of 14.02 CPS for
FY2018, exceeding top end of guidance
- FY2018 guidance range was
13.81 – 13.91 CPS
• Distributable earnings per security growth
of 4.5%
• Full year distribution of $101.7 million
• 100% payout ratio
For
per
sona
l use
onl
y

NO
T F
OR
DIS
TR
IBU
TIO
N O
R R
EL
EA
SE
IN
TH
E U
NIT
ED
ST
AT
ES
12
Financial position
1 Totals may not add due to rounding2 Gearing calculated as total liabilities to total tangible assets measured in accordance with Australian Accounting Standards, but excluding any mark-to-market valuations of derivative assets/liabilities3 NTA and gearing reported as at 31 December 2017 adjusted for the distribution of 6.60 CPS paid on 15 February 2018 to allow for like for like comparison4 Excludes $8.0 million of committed expenditures (pre transaction costs) in 1H FY2019 in relation to fixed-price development fund-through agreements. See page 18 for further details5 Relates to Alderley settling in FY20186 $43.6 million after impact of straight lining reversal and write-off of property acquisition costs
FIN
AN
CIA
L R
ES
UL
TS
Balance Sheet
Full year
31 December 2018
$ million1
Full year
31 December 2017
$ million1
Assets
Cash and cash equivalents 12.3 43.6
Prepayments and property deposits 1.7 8.2
Fair value of interest rate swaps 0.9 5.4
Investment properties 2,496.1 2,281.0
Total assets 2,511.0 2,338.1
Liabilities
Accounts payable and accruals 8.3 15.7
Fair value of interest rate swaps 7.7 -
Distribution payable 51.0 -
Borrowings 852.7 736.7
Deferred borrowing costs (3.4) (3.7)
Total liabilities 916.3 748.7
Net assets 1,594.7 1,589.5
NTA per security $2.20 $2.123
Gearing2 36.2% 34.1%3
VV
R F
Y2
01
8 R
ES
UL
TS
• NTA increased by 3.8% to $2.20 per stapled
security from $2.12, on a like-for-like basis3
- VVR now includes a provision for the
distribution on balance sheet (consistent
with A-REIT peers)
• Investment properties held increased by 9.4%
from $2,281 million to $2,496 million
- Acquisitions settled - $129 million4
- FY2017 announced acquisitions and settled
in FY2018 - $10 million5
- FY2018 Valuation uplift - $77 million6
For
per
sona
l use
onl
y
NO
T F
OR
DIS
TR
IBU
TIO
N O
R R
EL
EA
SE
IN
TH
E U
NIT
ED
ST
AT
ES
FIN
AN
CIA
L R
ES
UL
TS
VV
R F
Y2
01
8 R
ES
UL
TS
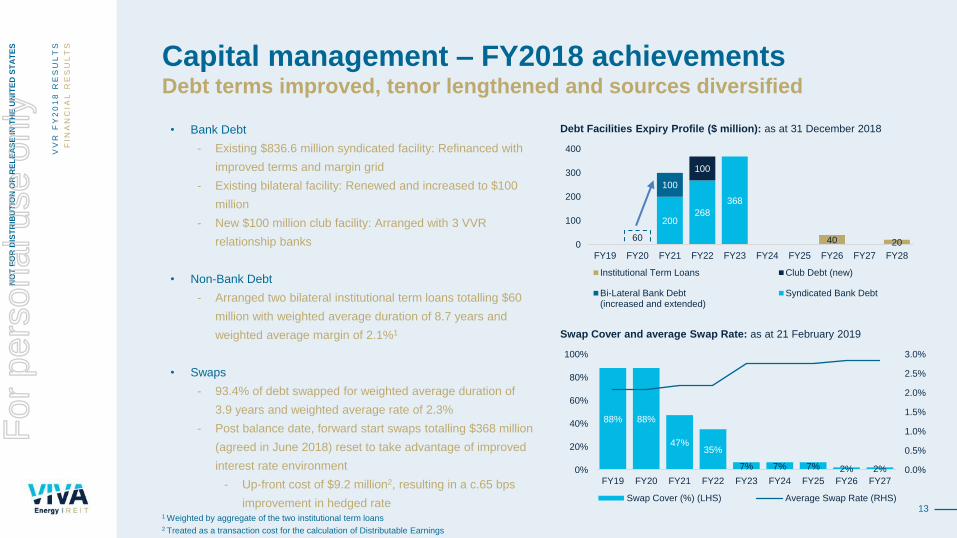
Capital management – FY2018 achievementsDebt terms improved, tenor lengthened and sources diversified
• Bank Debt
- Existing $836.6 million syndicated facility: Refinanced with
improved terms and margin grid
- Existing bilateral facility: Renewed and increased to $100
million
- New $100 million club facility: Arranged with 3 VVR
relationship banks
• Non-Bank Debt
- Arranged two bilateral institutional term loans totalling $60
million with weighted average duration of 8.7 years and
weighted average margin of 2.1%1
• Swaps
- 93.4% of debt swapped for weighted average duration of
3.9 years and weighted average rate of 2.3%
- Post balance date, forward start swaps totalling $368 million
(agreed in June 2018) reset to take advantage of improved
interest rate environment
- Up-front cost of $9.2 million2, resulting in a c.65 bps
improvement in hedged rate
Debt Facilities Expiry Profile ($ million): as at 31 December 2018
200268
368
60
100
100
40 200
100
200
300
400
FY19 FY20 FY21 FY22 FY23 FY24 FY25 FY26 FY27 FY28
Institutional Term Loans Club Debt (new)
Bi-Lateral Bank Debt(increased and extended)
Syndicated Bank Debt
1 Weighted by aggregate of the two institutional term loans2 Treated as a transaction cost for the calculation of Distributable Earnings
Swap Cover and average Swap Rate: as at 21 February 2019
88% 88%
47%35%
7% 7% 7% 2% 2% 0.0%
0.5%
1.0%
1.5%
2.0%
2.5%
3.0%
0%
20%
40%
60%
80%
100%
FY19 FY20 FY21 FY22 FY23 FY24 FY25 FY26 FY27
Swap Cover (%) (LHS) Average Swap Rate (RHS)13
For
per
sona
l use
onl
y

NO
T F
OR
DIS
TR
IBU
TIO
N O
R R
EL
EA
SE
IN
TH
E U
NIT
ED
ST
AT
ES
14
FIN
AN
CIA
L R
ES
UL
TS
VV
R F
Y2
01
8 R
ES
UL
TS
Capital managementActive capital management provides opportunity for continued
growth
• Weighted average cost of debt was 3.83% for FY2018
• Interest cover ratio 5.3x for FY20181
• Drawn-debt was 93.4% hedged for a weighted average 3.8
years at 31 December 2018
• Pro-forma gearing2 as at 31 December 2018 reduces to
32.3% after the fully underwritten Institutional Placement3
• Revised gearing policy to better reflect VVR practice:
- Target gearing range revised from 35-45% to 30-45%
- VVR retains significant headroom to make further
acquisitions, consistent with VVR’s investment criteria
• Distribution Reinvestment Plan implemented for 2H
FY2018 distribution
Capital Management
Full year
31 December
2018
$ million
Full year
31 December
2017
$ million
Facility limit $1,096.7m4 $896.7m
Drawn debt $852.7m $736.7m
Gearing2 (including distribution provision)36.2%
(reported)34.1%
% debt fixed 93.4% 100.0%
Weighted average cost of debt5 3.83% 3.85%
Weighted debt facility maturity (years) 3.8 2.6
Average fixed / hedged debt maturity (years) 3.8 2.6
Interest cover ratio4 5.3x 4.4x
1 Interest cover ratio calculated as earnings before interest, tax, depreciation and amortisation (excluding any asset revaluations, mark-to-market movements and transaction costs) divided by Net
Interest Expense2 Gearing calculated as total liabilities to total tangible assets measured in accordance with Australian Accounting Standards, but excluding any mark-to-market valuations of derivative
assets/liabilities3 Includes the impact of the $100 million fully underwritten Institutional Placement but does not include any impact attributable to the SPP (see page 30 for further details in relation to the
Institutional Placement and the SPP) 4 Facility limit as at 31 December 2018 is $956.7m. Facility limit as at 21 February 2019 includes new $100m club facility and extended $40m bilateral facility5 Weighted average cost of debt including undrawn commitment fees
For
per
sona
l use
onl
y

NO
T F
OR
DIS
TR
IBU
TIO
N O
R R
EL
EA
SE
IN
TH
E U
NIT
ED
ST
AT
ES
15
Acquisitions, Portfolio and Industry Update
MARGARET KENNEDY
Managing Director VER Manager Pty LimitedFor
per
sona
l use
onl
y

NO
T F
OR
DIS
TR
IBU
TIO
N O
R R
EL
EA
SE
IN
TH
E U
NIT
ED
ST
AT
ES
16
Acquisition strategyA
CQ
UIS
ITIO
NS
, P
OR
TF
OL
IO A
ND
IN
DU
ST
RY
UP
DA
TE
VV
R F
Y2
01
8 R
ES
UL
TS
VVR will continue to consider acquisition and development
opportunities consistent with the following investment criteria:
1. Investment is high quality and strategically located;
2. Portfolio remains geographically diversified;
3. Investment has strong lease characteristics; and
4. Investment provides security holders with potential for capital growth
over time.
Liberty Woodville SA
Shell Coles Express Alderley QLDFor
per
sona
l use
onl
y

NO
T F
OR
DIS
TR
IBU
TIO
N O
R R
EL
EA
SE
IN
TH
E U
NIT
ED
ST
AT
ES
17
FY2018 acquisitions and FY2019 expected pipelineVVR acquired 16 sites for $129 million1 at a WACR of 6.4%2
VV
R F
Y2
01
8 R
ES
UL
TS
1 Pre transaction costs. Excludes $8.0 million of committed expenditures (pre transaction costs) in 1H FY2019 in relation to fixed-price development fund-through agreements. See page 18
for further details2 Capitalisation rate at acquisition is reported pre transaction costs3 50% owned by Viva Energy Australia, as disclosed in Viva Energy Australia’s 2018 Half Year Financial Report4 See page 22 for further details5 Excludes Coomera, Caboolture and Aratula6 There can be no assurance that VVR will successfully acquire and integrate further acquisitions (see risk factors described in the “Key Risk Factors” section in Appendix 2)
• Acquisitions are consistent with VVR’s growth strategy
• The addition of Caltex, 7-Eleven and Liberty Oil3 properties provides additional fuel brands to the portfolio4
• Acquisitions were all double or triple net structures with fixed 3% rent reviews5
• VVR has identified a ~$130 million pipeline of potential acquisitions, $67 million of which are in advanced due diligence6
Caltex Longwarry 7-Eleven Silkstone
AC
QU
ISIT
ION
S,
PO
RT
FO
LIO
AN
D I
ND
US
TR
Y U
PD
AT
E
For
per
sona
l use
onl
y
NO
T F
OR
DIS
TR
IBU
TIO
N O
R R
EL
EA
SE
IN
TH
E U
NIT
ED
ST
AT
ES
18
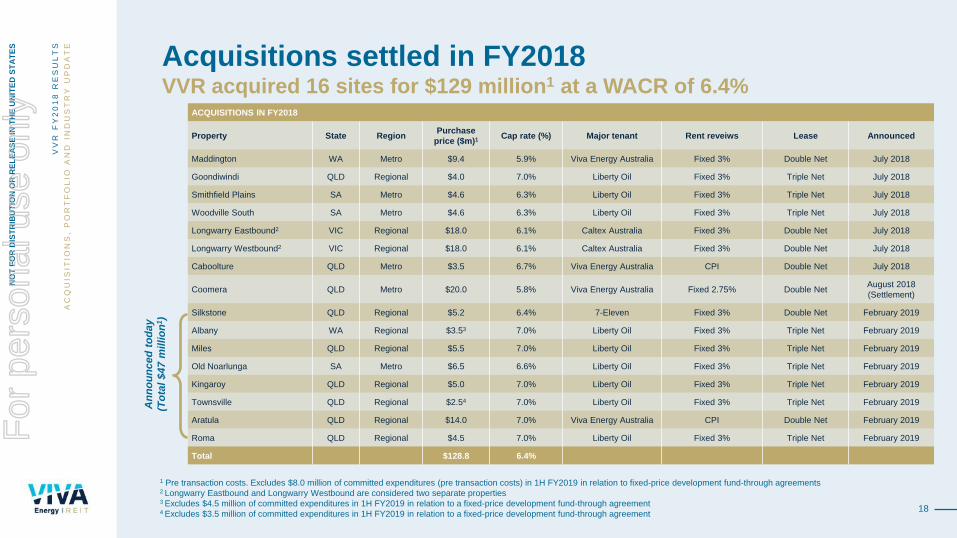
Acquisitions settled in FY2018VVR acquired 16 sites for $129 million1 at a WACR of 6.4%
ACQUISITIONS IN FY2018
Property State RegionPurchase
price ($m)1Cap rate (%) Major tenant Rent reveiws Lease Announced
Maddington WA Metro $9.4 5.9% Viva Energy Australia Fixed 3% Double Net July 2018
Goondiwindi QLD Regional $4.0 7.0% Liberty Oil Fixed 3% Triple Net July 2018
Smithfield Plains SA Metro $4.6 6.3% Liberty Oil Fixed 3% Triple Net July 2018
Woodville South SA Metro $4.6 6.3% Liberty Oil Fixed 3% Triple Net July 2018
Longwarry Eastbound2 VIC Regional $18.0 6.1% Caltex Australia Fixed 3% Double Net July 2018
Longwarry Westbound2 VIC Regional $18.0 6.1% Caltex Australia Fixed 3% Double Net July 2018
Caboolture QLD Metro $3.5 6.7% Viva Energy Australia CPI Double Net July 2018
Coomera QLD Metro $20.0 5.8% Viva Energy Australia Fixed 2.75% Double NetAugust 2018
(Settlement)
Silkstone QLD Regional $5.2 6.4% 7-Eleven Fixed 3% Double Net February 2019
Albany WA Regional $3.53 7.0% Liberty Oil Fixed 3% Triple Net February 2019
Miles QLD Regional $5.5 7.0% Liberty Oil Fixed 3% Triple Net February 2019
Old Noarlunga SA Metro $6.5 6.6% Liberty Oil Fixed 3% Triple Net February 2019
Kingaroy QLD Regional $5.0 7.0% Liberty Oil Fixed 3% Triple Net February 2019
Townsville QLD Regional $2.54 7.0% Liberty Oil Fixed 3% Triple Net February 2019
Aratula QLD Regional $14.0 7.0% Viva Energy Australia CPI Double Net February 2019
Roma QLD Regional $4.5 7.0% Liberty Oil Fixed 3% Triple Net February 2019
Total $128.8 6.4%
1 Pre transaction costs. Excludes $8.0 million of committed expenditures (pre transaction costs) in 1H FY2019 in relation to fixed-price development fund-through agreements 2 Longwarry Eastbound and Longwarry Westbound are considered two separate properties3 Excludes $4.5 million of committed expenditures in 1H FY2019 in relation to a fixed-price development fund-through agreement4 Excludes $3.5 million of committed expenditures in 1H FY2019 in relation to a fixed-price development fund-through agreement
VV
R F
Y2
01
8 R
ES
UL
TS
AC
QU
ISIT
ION
S,
PO
RT
FO
LIO
AN
D I
ND
US
TR
Y U
PD
AT
E
An
no
un
ced
to
day
(To
tal
$4
7 m
illio
n1)
For
per
sona
l use
onl
y

NO
T F
OR
DIS
TR
IBU
TIO
N O
R R
EL
EA
SE
IN
TH
E U
NIT
ED
ST
AT
ES
19
Portfolio overview
PORTFOLIO AT 31 DECEMBER 2018
Properties Value ($m) Average1 value ($m) Average1 size (m2) WACR (%) WALE (years)
Metropolitan 316 1,863 5.9 3,683 5.5 13.0
Regional 138 633 4.6 6,842 6.8 11.7
Total 454 2,496 5.5 4,643 5.8 12.6
VV
R F
Y2
01
8 R
ES
UL
TS
• 2.11 million m2 of property geographically diversified and aligned with the
Australian population density
• 81% of properties by value located in Australia’s more populous Eastern
seaboard states
• 75% of properties by value located in metropolitan areas
• 82% of VIC property value located within the metropolitan region
• 71% of NSW property value located within the metropolitan region
1 Calculated as the arithmetic average
Shell Maddington WA
AC
QU
ISIT
ION
S,
PO
RT
FO
LIO
AN
D I
ND
US
TR
Y U
PD
AT
E
For
per
sona
l use
onl
y

NO
T F
OR
DIS
TR
IBU
TIO
N O
R R
EL
EA
SE
IN
TH
E U
NIT
ED
ST
AT
ES
20
Portfolio lease profile As at 31 December 2018
1 12 of 454 properties in the portfolio are subject to annual rent increases other than fixed 3% per annum2 6 of 454 properties have reviews prior to FY26: FY20 (Rouse Hill) and FY21 (Half Way Creek, Blaxland, Caboolture, Silkstone and Townsville)3 WALE is calculated from service station properties only and excludes retail lease agreements between VVR and the tenants on some properties (~$1.1m p.a.)
VV
R F
Y2
01
8 R
ES
UL
TS
0%
5%
10%
15%
20%
25%
FY19 FY20 FY21 FY22 FY23 FY24 FY25 FY26 FY27 FY28 FY29 FY30 FY31 FY32 FY33 FY34
% o
f in
co
me
Year of lease expiry
Portfolio Lease Expiry Profile - Service Stations only3
• 100% occupancy
• 3% per annum fixed rental increases1
• Majority of market rent reviews not until 20262 (IPO Portfolio)
• Current WALE of 12.6 years
AC
QU
ISIT
ION
S,
PO
RT
FO
LIO
AN
D I
ND
US
TR
Y U
PD
AT
E
For
per
sona
l use
onl
y

NO
T F
OR
DIS
TR
IBU
TIO
N O
R R
EL
EA
SE
IN
TH
E U
NIT
ED
ST
AT
ES
21
Property revaluationsRevaluations supported by contracted rental growth
VV
R F
Y2
01
8 R
ES
UL
TS
Valuation Policy
• Fair value of the individual properties are reviewed by the Board at each
reporting date
• Rolling one third of the portfolio is independently valued each year with
each individual property valued at least once every three years
5.6%
6.3%
5.4%
6.3%
5.9%
7.0%
6.6%
6.6%
WACR by State (%): as at 31 December 2018
6.5%
1 Excludes acquisitions completed after 30 June 2017
Northern QLD
Southern QLD
ACT
NSW
Note: QLD is separated north and south. ACT is separate from NSW
Gross increase WACR
$m %
150 properties independently valued by Jones Lang LaSalle
Metro $28 +4.8% 5.4%
Regional $6 +3.2% 6.8%
Sub-total $34 +4.5% 5.7%
275 properties valued by VVR
directors1$43 +3.0% 5.8%
Total Portfolio $77 +3.5% 5.8%
VIC
TAS
WA
SA
NT
AC
QU
ISIT
ION
S,
PO
RT
FO
LIO
AN
D I
ND
US
TR
Y U
PD
AT
E
For
per
sona
l use
onl
y
NO
T F
OR
DIS
TR
IBU
TIO
N O
R R
EL
EA
SE
IN
TH
E U
NIT
ED
ST
AT
ES
22
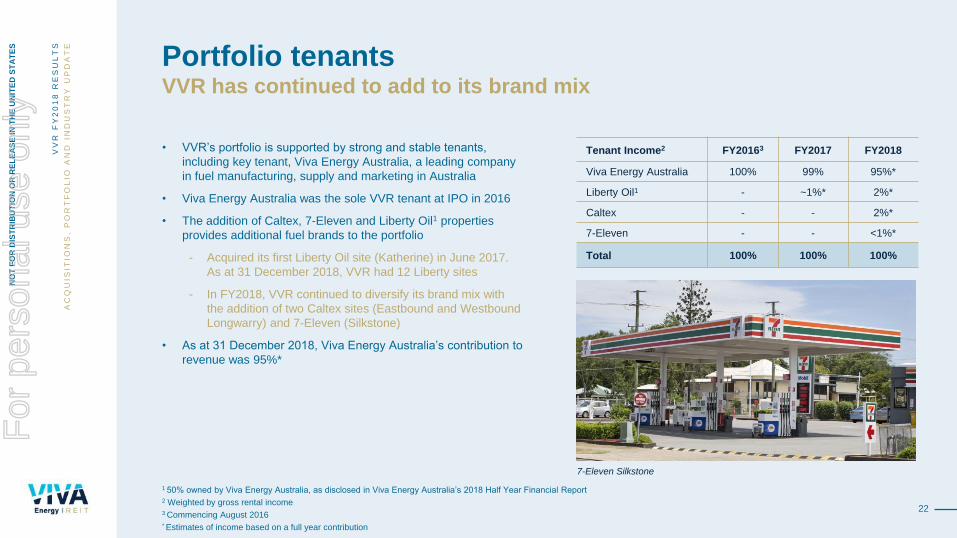
Portfolio tenantsVVR has continued to add to its brand mix
VV
R F
Y2
01
8 R
ES
UL
TS
• VVR’s portfolio is supported by strong and stable tenants,
including key tenant, Viva Energy Australia, a leading company
in fuel manufacturing, supply and marketing in Australia
• Viva Energy Australia was the sole VVR tenant at IPO in 2016
• The addition of Caltex, 7-Eleven and Liberty Oil1 properties
provides additional fuel brands to the portfolio
- Acquired its first Liberty Oil site (Katherine) in June 2017.
As at 31 December 2018, VVR had 12 Liberty sites
- In FY2018, VVR continued to diversify its brand mix with
the addition of two Caltex sites (Eastbound and Westbound
Longwarry) and 7-Eleven (Silkstone)
• As at 31 December 2018, Viva Energy Australia’s contribution to
revenue was 95%*
1 50% owned by Viva Energy Australia, as disclosed in Viva Energy Australia’s 2018 Half Year Financial Report2 Weighted by gross rental income3 Commencing August 2016* Estimates of income based on a full year contribution
AC
QU
ISIT
ION
S,
PO
RT
FO
LIO
AN
D I
ND
US
TR
Y U
PD
AT
E
Tenant Income2 FY20163 FY2017 FY2018
Viva Energy Australia 100% 99% 95%*
Liberty Oil1 - ~1%* 2%*
Caltex - - 2%*
7-Eleven - - <1%*
Total 100% 100% 100%
7-Eleven Silkstone
For
per
sona
l use
onl
y

NO
T F
OR
DIS
TR
IBU
TIO
N O
R R
EL
EA
SE
IN
TH
E U
NIT
ED
ST
AT
ES
0.0%
1.0%
2.0%
3.0%
4.0%
5.0%
6.0%
7.0%
8.0%
Jan-1
4
Apr-
14
Jul-14
Oct-
14
Jan-1
5
Apr-
15
Jul-15
Oct-
15
Jan-1
6
Apr-
16
Jul-16
Oct-
16
Jan-1
7
Apr-
17
Jul-17
Oct-
17
Jan-1
8
Apr-
18
Jul-18
Oct-
18
Initia
l Y
ield
23
Retail fuel & convenience property salesTransaction yields continue to remain attractive
VV
R F
Y2
01
8 R
ES
UL
TS
Source: Bloomberg and Jones Lang LaSalle Advisory Services Pty Limited (JLL) Market Report 31 December 2018 for VER Manager Pty Ltd as Manager of Viva Energy REIT.
Yields are net initial yields based upon net passing income at the time of sale and are based on a sample of service station sales through metropolitan and regional Australia during 2016,
2017 and 2018. This sales data is intended to provide an indication only. JLL are not representing that every sale within the Sector has been captured within the sample. JLL accepts no
liability for any inaccuracies contained in the information that has been sourced from a variety of industry sources, or for conclusions which are drawn either wholly or partially from that
information. No responsibility is accepted to any third parties.1 Reported weighted average transaction yield includes sales data provided by JLL only
• VVR portfolio cap rate remains in-
line with the weighted average
transaction yield
• Both the market transaction yield
and VVR portfolio cap rate have
traded at a ~3% premium to the
10 year government bond rate
over the last two years
VVR Portfolio Cap Rate
Reported Wtd Ave Transaction Yield
(JLL Market Report 31 December 2018)1
5 Year Swap Curve
Legend:
10 Year Gov. Bond
AC
QU
ISIT
ION
S,
PO
RT
FO
LIO
AN
D I
ND
US
TR
Y U
PD
AT
E
For
per
sona
l use
onl
y

NO
T F
OR
DIS
TR
IBU
TIO
N O
R R
EL
EA
SE
IN
TH
E U
NIT
ED
ST
AT
ES
24
Convenience retail market trendsConvenience retailing has become an integral component of the
service station industry
VV
R F
Y2
01
8 R
ES
UL
TS
• Structural changes over the past decade have enhanced the
attractiveness of service stations
• Customer needs continue to be met with the evolution of fuel
retailing and wider service station offerings
• The opportunity from profit margins of the convenience offering
continues to grow, and VVR’s portfolio and tenants are well
positioned to take advantage of that trend
• Modern service stations are now characterised by expanded
format convenience stores, quasi-supermarkets, fast food
outlets, coffee shops and automated car washes
- In 2017 the convenience sales (excluding fuel) market has
grown to $8.4bn1
AC
QU
ISIT
ION
S,
PO
RT
FO
LIO
AN
D I
ND
US
TR
Y U
PD
AT
E
Viva Energy Australia – Coles Express Alliance
• On 6 February 2019, Viva Energy Australia
announced the extension of a retail alliance with
Coles Express to 2029 under new arrangements to
support future growth and cement the network as
Australia’s leading fuel and convenience business2
• VVR welcomes the announcement, which confirms
both parties’ commitment to the Alliance, provides
greater alignment to capture future growth
opportunities, and supports significant reinvestment2
1 Australasian Association of Convenience Stores (AACS): 2017 State of the Industry Report2 As disclosed in Viva Energy Australia’s ASX announcement dated 6 February 2019
For
per
sona
l use
onl
y

NO
T F
OR
DIS
TR
IBU
TIO
N O
R R
EL
EA
SE
IN
TH
E U
NIT
ED
ST
AT
ES
25
Strategy & Outlook
MARGARET KENNEDY
Managing Director VER Manager Pty LimitedFor
per
sona
l use
onl
y

NO
T F
OR
DIS
TR
IBU
TIO
N O
R R
EL
EA
SE
IN
TH
E U
NIT
ED
ST
AT
ES
26
• Irreplicable high-quality, strategically located service station and convenience retail
distribution platform
Competitive strengthsMarket-leading national service station and convenience retail
distribution platform
• National distribution platform aligned with population density
• 100% occupancy, predominantly long-term Triple Net leases to high-quality tenants1
• 3% per annum rent increases and ongoing growth through acquisition and
development opportunities2
• Portfolio underpinned by 2.11 million m2 of quality real estate
1 16 of 454 properties in the portfolio have Double Net leases in place2 12 of 454 properties in the portfolio are subject to annual rent increases other than fixed 3% per annum
ST
RA
TE
GY
& O
UT
LO
OK
VV
R F
Y2
01
8 R
ES
UL
TS
• Pursuing value enhancing site optimisations with key tenant Viva Energy Australia
For
per
sona
l use
onl
y
NO
T F
OR
DIS
TR
IBU
TIO
N O
R R
EL
EA
SE
IN
TH
E U
NIT
ED
ST
AT
ES
27
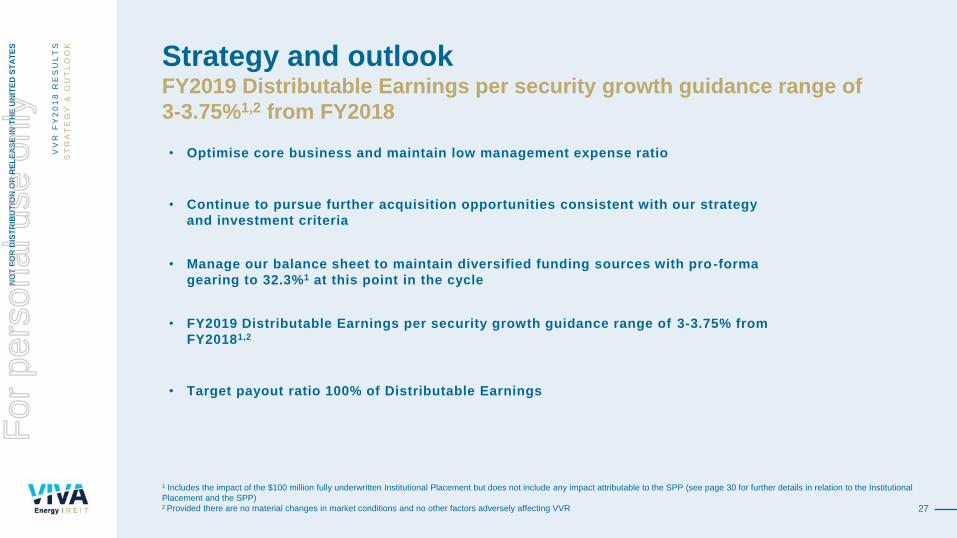
Strategy and outlookFY2019 Distributable Earnings per security growth guidance range of
3-3.75%1,2 from FY2018
ST
RA
TE
GY
& O
UT
LO
OK
VV
R F
Y2
01
8 R
ES
UL
TS
• Optimise core business and maintain low management expense ratio
• Continue to pursue further acquisition opportunities consistent with our strategy
and investment criteria
• Manage our balance sheet to maintain diversified funding sources with pro-forma
gearing to 32.3%1 at this point in the cycle
• FY2019 Distributable Earnings per security growth guidance range of 3-3.75% from
FY20181,2
• Target payout ratio 100% of Distributable Earnings
1 Includes the impact of the $100 million fully underwritten Institutional Placement but does not include any impact attributable to the SPP (see page 30 for further details in relation to the Institutional
Placement and the SPP)2 Provided there are no material changes in market conditions and no other factors adversely affecting VVR
For
per
sona
l use
onl
y

NO
T F
OR
DIS
TR
IBU
TIO
N O
R R
EL
EA
SE
IN
TH
E U
NIT
ED
ST
AT
ES
28
Questions
For
per
sona
l use
onl
y

NO
T F
OR
DIS
TR
IBU
TIO
N O
R R
EL
EA
SE
IN
TH
E U
NIT
ED
ST
AT
ES
29
Equity Raising
MARGARET KENNEDY
Managing Director VER Manager Pty LimitedFor
per
sona
l use
onl
y

NO
T F
OR
DIS
TR
IBU
TIO
N O
R R
EL
EA
SE
IN
TH
E U
NIT
ED
ST
AT
ES
EQ
UIT
Y R
AIS
ING
VV
R F
Y2
01
8 R
ES
UL
TS
Equity Raising overview
• Fully underwritten Institutional Placement to raise $100 million
• Institutional Placement issue price of $2.32 per New Security
− A discount of 4.1% to the last closing price of $2.42 on 20 February 2019
− A discount of 3.5% to the 5-day VWAP of $2.40 to 20 February 2019
− Represents a FY2019 distributable earnings yield of 6.2-6.3%1
Institutional
Placement offer
structure and price
Use of proceeds
30
Financial outcomes
1 Includes the impact of the $100 million fully underwritten Institutional Placement but does not include any impact attributable to the SPP2 Pre transaction costs. Excludes $8.0 million of committed expenditures (pre transaction costs) in 1H FY2019 in relation to fixed-price development fund-through agreements. See
page 18 for further details3 Provided there are no material changes in market conditions and no other factors adversely affecting VVR
Ranking
• Proceeds will be used to partly finance 8 acquisitions totalling approximately $47 million2 completed in 2H FY2018
(in addition to the $8 million in committed expenditure) and to provide headroom for future growth
• Balance sheet refreshed with capacity to pursue further acquisitions, consistent with VVR investment criteria, as
opportunities arise
• Pro-forma gearing of 32.3%1
• FY2019 Distributable Earnings per security growth guidance range of 3-3.75% from FY20181,3
• New Securities issued under the Institutional Placement and the SPP will rank pari passu with existing securities
from issue
• New securities issued under the Institutional Placement and SPP will be entitled to any distribution for the six
months ending 30 June 2019, however, they will not be entitled to the distribution for the 6 months ended 31
December 2018, to be paid on 28 February 2019.For
per
sona
l use
onl
y
NO
T F
OR
DIS
TR
IBU
TIO
N O
R R
EL
EA
SE
IN
TH
E U
NIT
ED
ST
AT
ES
EQ
UIT
Y R
AIS
ING
VV
R F
Y2
01
8 R
ES
UL
TS
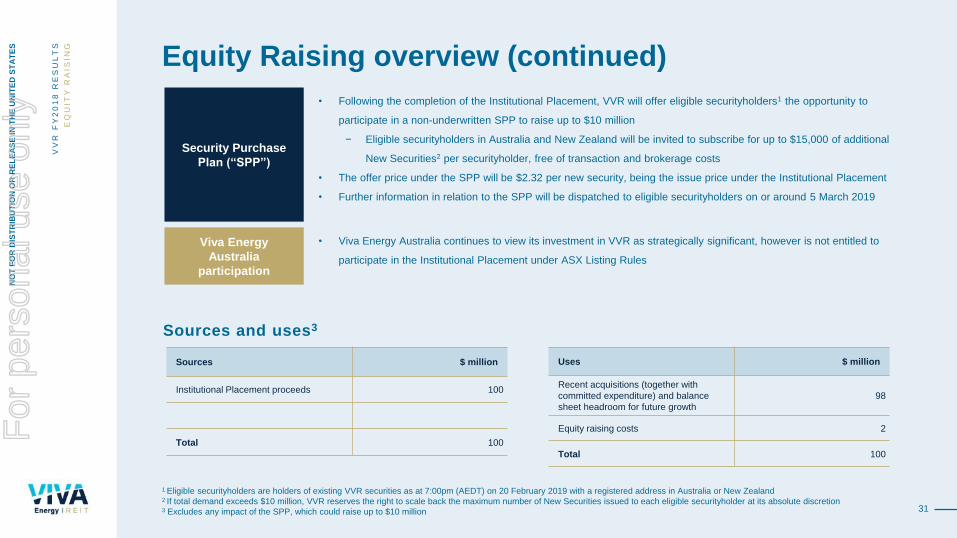
Equity Raising overview (continued)
• Following the completion of the Institutional Placement, VVR will offer eligible securityholders1 the opportunity to
participate in a non-underwritten SPP to raise up to $10 million
− Eligible securityholders in Australia and New Zealand will be invited to subscribe for up to $15,000 of additional
New Securities2 per securityholder, free of transaction and brokerage costs
• The offer price under the SPP will be $2.32 per new security, being the issue price under the Institutional Placement
• Further information in relation to the SPP will be dispatched to eligible securityholders on or around 5 March 2019
Security Purchase
Plan (“SPP”)
31
1 Eligible securityholders are holders of existing VVR securities as at 7:00pm (AEDT) on 20 February 2019 with a registered address in Australia or New Zealand2 If total demand exceeds $10 million, VVR reserves the right to scale back the maximum number of New Securities issued to each eligible securityholder at its absolute discretion3 Excludes any impact of the SPP, which could raise up to $10 million
Viva Energy
Australia
participation
Sources $ million
Institutional Placement proceeds 100
Total 100
Uses $ million
Recent acquisitions (together with
committed expenditure) and balance
sheet headroom for future growth
98
Equity raising costs 2
Total 100
Sources and uses3
• Viva Energy Australia continues to view its investment in VVR as strategically significant, however is not entitled to
participate in the Institutional Placement under ASX Listing Rules
For
per
sona
l use
onl
y

NO
T F
OR
DIS
TR
IBU
TIO
N O
R R
EL
EA
SE
IN
TH
E U
NIT
ED
ST
AT
ES
EQ
UIT
Y R
AIS
ING
VV
R F
Y2
01
8 R
ES
UL
TS
Timetable
Event Date
Trading halt and announcement of Equity Raising Thursday, 21 February 2019
Institutional Placement
Institutional Placement bookbuild Thursday, 21 February 2019
Announcement of outcome of Institutional Placement Friday, 22 February 2019
Trading halt lifted Friday, 22 February 2019
Settlement of New Securities under the Institutional Placement Tuesday, 26 February 2019
Allotment and trading of New Securities issued under the Institutional Placement Wednesday, 27 February 2019
SPP
Record date for SPP Wednesday, 20 February 2019 (7:00pm AEDT)
SPP offer period Tuesday, 5 March 2019 — Tuesday, 19 March 2019
Allotment of New Securities issued under the SPP Tuesday, 26 March 2019
New Securities issued under the SPP commence trading on ASX Wednesday, 27 March 2019
Holding statement dispatch date Thursday, 28 March 2019
32
Note: The above timetable is indicative only and subject to change. Subject to the requirements of the Corporations Act, the ASX Listing Rules and any other applicable laws, VVR, in
consultation with the underwriters, reserves the right to amend this timetable and withdraw the offer at any time
For
per
sona
l use
onl
y

NO
T F
OR
DIS
TR
IBU
TIO
N O
R R
EL
EA
SE
IN
TH
E U
NIT
ED
ST
AT
ES
EQ
UIT
Y R
AIS
ING
VV
R F
Y2
01
8 R
ES
UL
TS
Pro-forma balance sheetThe pro forma balance sheet has been derived from VVR’s financial statements for the financial year
ended 31 December 2018, adjusted for the effects of the pro forma adjustments described below
Actual
31 December 2018
$ million1
Institutional Placement
Pro forma adjustments (net of costs)
$ million1
Pro-forma
31 December 2018
$ million1
Cash 12 - 12
Prepayments and property deposits 2 - 2
Fair value of interest rate swaps 1 - 1
Investment properties 2,496 - 2,496
Total Assets 2,511 - 2,511
Accounts payable and accruals 8 - 8
Fair value of interest rate swaps 8 - 8
Distribution payable 51 - 51
Borrowings 853 (98) 754
Deferred borrowing costs (3) - (3)
Total Liabilities 916 (98) 818
Net Assets 1,595 98 1,693
NTA per security $2.20 $2.20
Gearing2 36.2% 32.3%
Number of securities 725.7 43.1 768.9
33
1 Totals may not add due to rounding2 Gearing calculated as total liabilities to total tangible assets measured in accordance with Australian Accounting Standards, but excluding any mark-to-market valuations of derivative
assets/liabilities
For
per
sona
l use
onl
y

NO
T F
OR
DIS
TR
IBU
TIO
N O
R R
EL
EA
SE
IN
TH
E U
NIT
ED
ST
AT
ES
34
Questions
For
per
sona
l use
onl
y

NO
T F
OR
DIS
TR
IBU
TIO
N O
R R
EL
EA
SE
IN
TH
E U
NIT
ED
ST
AT
ES
35
Glossary
For
per
sona
l use
onl
y
NO
T F
OR
DIS
TR
IBU
TIO
N O
R R
EL
EA
SE
IN
TH
E U
NIT
ED
ST
AT
ES
36
GlossaryG
LO
SS
AR
Y
VV
R F
Y2
01
8 R
ES
UL
TS
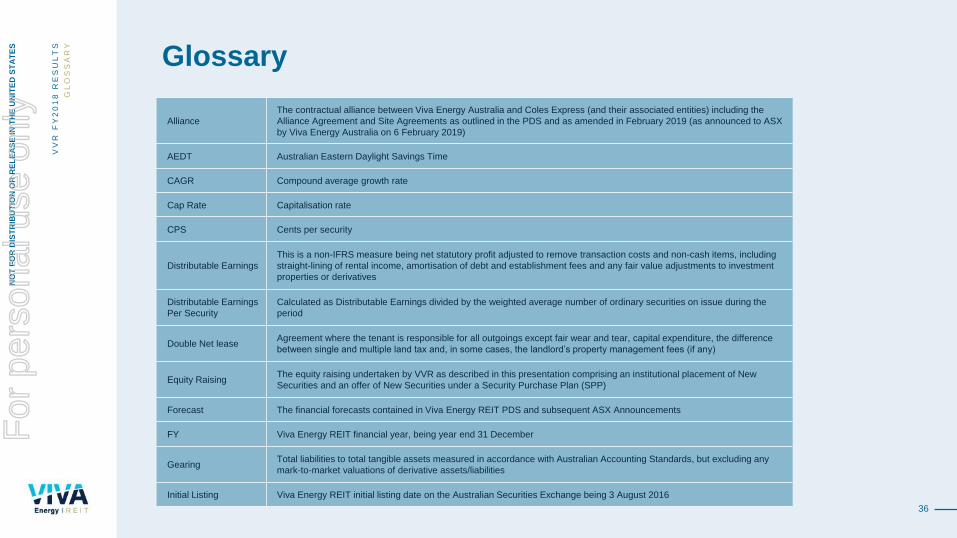
Alliance
The contractual alliance between Viva Energy Australia and Coles Express (and their associated entities) including the
Alliance Agreement and Site Agreements as outlined in the PDS and as amended in February 2019 (as announced to ASX
by Viva Energy Australia on 6 February 2019)
AEDT Australian Eastern Daylight Savings Time
CAGR Compound average growth rate
Cap Rate Capitalisation rate
CPS Cents per security
Distributable Earnings
This is a non-IFRS measure being net statutory profit adjusted to remove transaction costs and non-cash items, including
straight-lining of rental income, amortisation of debt and establishment fees and any fair value adjustments to investment
properties or derivatives
Distributable Earnings
Per Security
Calculated as Distributable Earnings divided by the weighted average number of ordinary securities on issue during the
period
Double Net leaseAgreement where the tenant is responsible for all outgoings except fair wear and tear, capital expenditure, the difference
between single and multiple land tax and, in some cases, the landlord’s property management fees (if any)
Equity RaisingThe equity raising undertaken by VVR as described in this presentation comprising an institutional placement of New
Securities and an offer of New Securities under a Security Purchase Plan (SPP)
Forecast The financial forecasts contained in Viva Energy REIT PDS and subsequent ASX Announcements
FY Viva Energy REIT financial year, being year end 31 December
GearingTotal liabilities to total tangible assets measured in accordance with Australian Accounting Standards, but excluding any
mark-to-market valuations of derivative assets/liabilities
Initial Listing Viva Energy REIT initial listing date on the Australian Securities Exchange being 3 August 2016
For
per
sona
l use
onl
y

NO
T F
OR
DIS
TR
IBU
TIO
N O
R R
EL
EA
SE
IN
TH
E U
NIT
ED
ST
AT
ES
37
GlossaryG
LO
SS
AR
Y
VV
R F
Y2
01
8 R
ES
UL
TS
Interest Coverage
Ratio or ICR
Earnings before interest, tax, depreciation and amortisation (excluding any asset revaluations, mark-to-market
movements and transaction costs) divided by net interest expense
IPO Initial Public Offering
Liberty Oil Liberty Oil Holdings Pty Limited (ABN 67 068 080 124)
Management Expense
Ratio or MERManagement and corporate expenses as a percentage of Viva Energy REIT’s total assets
Metropolitan regionProperties that are located within the Urban Boundary, which is sourced from the Australian Bureau of Statistics
(ABS 2016 Significant Urban Area (SUA) boundary)
Net Interest Expense Finance costs less finance income
NTA Net tangible assets
PDS Viva Energy REIT’s Replacement Prospectus and Product Disclosure Statement dated 22 July 2016
Regional All other properties not located within the Urban Boundary
Triple Net leaseAgreement where the tenant is responsible for all outgoings. In the case of Viva Energy REIT’s leases to Viva Energy
Australia, the landlord’s property management fees (if any) are not paid by the tenant
Viva Energy Australia Viva Energy Australia Pty Ltd (ABN 46 004 610 459) (a wholly owned subsidiary of Viva Energy Group Limited)
Viva Energy REIT
or VVR
Viva Energy REIT is a stapled entity comprising one share in Viva Energy REIT Limited (ABN 35 612 986 517)
and one unit in the Viva Energy REIT Trust (ARSN 613 146 464)
WACR Weighted average capitalisation rate, weighted by contract price excluding transaction costs
WALE Weighted average lease expiry, weighted by rental income
For
per
sona
l use
onl
y

NO
T F
OR
DIS
TR
IBU
TIO
N O
R R
EL
EA
SE
IN
TH
E U
NIT
ED
ST
AT
ES
38
Appendix 1
For
per
sona
l use
onl
y

NO
T F
OR
DIS
TR
IBU
TIO
N O
R R
EL
EA
SE
IN
TH
E U
NIT
ED
ST
AT
ES
AP
PE
ND
IX
VV
R F
Y2
01
8 R
ES
UL
TS
Source: Viva Energy Australia analyst management presentation dated 22 November 20181 Market share data is based on total Australian market fuel volumes of 59.6 billion litres, as per Australia Petroleum Statistics in 2017, and in respect of Viva Energy, is based on total fuel volumes of
14.2 billion litres in the 2017 calendar year.2 Includes 23 import terminals and 21 active depots (including 16 Liberty Oil depots), Viva Energy holds a 50% interest in the Liberty business and supplies it with fuel3 Viva Energy has been granted that right by an affiliate of Royal Dutch Shell and Viva Energy has in turn granted a sub-licence to Coles Express and to certain other operators of Retail Sites4 Viva Energy and Coles Express extended the Alliance to 2029 as per Viva Energy Australia and Coles Group announcements dated 6 February 20195 Pre impact of the Equity Raising6 Based on ASX market price of $2.42 per security as at 20 February 2019
24%1 of the Australian downstream petroleum market
1,215 service station sites nationwide in Viva Energy’s network
44 fuel import terminals and depots2 nationally to support operations
52 Airports and airfields across Australia supplied by Viva Energy
120 kbbls/d capacity oil refinery in Geelong, Australia
110+ years proudly operating in Australia
Strategic relationship with Vitol companies
38%5 holding in ASX listed Viva Energy REIT – c.$668 million6
Sole right to use the Shell brand in Australia for the sale of retail fuels3
Retail Alliance with Coles – extended to 20294
Viva Energy Australia snapshotA leading integrated downstream petroleum company in Australia
39
For
per
sona
l use
onl
y

NO
T F
OR
DIS
TR
IBU
TIO
N O
R R
EL
EA
SE
IN
TH
E U
NIT
ED
ST
AT
ES
40
Retail fuel & convenience property salesA highly liquid market
AP
PE
ND
IX
VV
R F
Y2
01
8 R
ES
UL
TS
Source: Jones Lang LaSalle Advisory Services Pty Limited (JLL) Market Report 31 December 2018 for VER Manager Pty Ltd as Manager of Viva Energy REIT. Yields are net initial yields
based upon net passing income at the time of sale and are based on a sample of service station sales through metropolitan and regional Australia during 2016, 2017 and 2018. This sales
data is intended to provide an indication only. JLL are not representing that every sale within the Sector has been captured within the sample. JLL accepts no liability for any inaccuracies
contained in the information that has been sourced from a variety of industry sources, or for conclusions which are drawn either wholly or partially from that information. No responsibility is
accepted to any third parties.
2.0%
3.0%
4.0%
5.0%
6.0%
7.0%
8.0%
9.0%
10.0%
0 5 10 15 20
Initia
l Y
ield
Remaining Lease Term (years) at Time of Sale
VVR Portfolio
2016 sales
2017 sales
2018 sales
Legend:
VVR Portfolio (IPO)
• Sales continue to remain stable
• Market is highly liquid with tight
yields being achieved
• Demand remains high for
attractive properties that have
quality tenants and lease
covenants
For
per
sona
l use
onl
y

NO
T F
OR
DIS
TR
IBU
TIO
N O
R R
EL
EA
SE
IN
TH
E U
NIT
ED
ST
AT
ES
41
Australian fuel industry landscape
1 Calculated on the basis of Estimated Motor Vehicles on Register of 17,180,596 as at January 2012 and 19,173,279 as at January 2018 according to ABS Motor Vehicle Census (9309.0)2 ClimateWorks Australia, “The state of electric vehicles in Australia”, June 2018. Note that Tesla numbers are estimated and included in this figure
• Vehicle ownership in Australia has experienced a +2.2% CAGR from 2013 to 20181
• Composition of fuel demand is expected to change over time due to population growth, improved vehicle efficiency, changes in
mobility choices and new fuel technologies
• Increased vehicle ownership in Australia has offset fuel efficiency and the impact of Electric Vehicles, which represent less than
0.1% of total vehicles on road2
• Australian growth in EV uptake trails behind global leaders2
• Some barriers impacting the uptake rate in Australia include2:
- Battery technology and range anxiety;
- Model type availability;
- Lack of second hand market and upfront purchase price;
- Charging infrastructure challenges; and
- New technology to develop induction charging
AP
PE
ND
IX
VV
R F
Y2
01
8 R
ES
UL
TS
For
per
sona
l use
onl
y
NO
T F
OR
DIS
TR
IBU
TIO
N O
R R
EL
EA
SE
IN
TH
E U
NIT
ED
ST
AT
ES
42
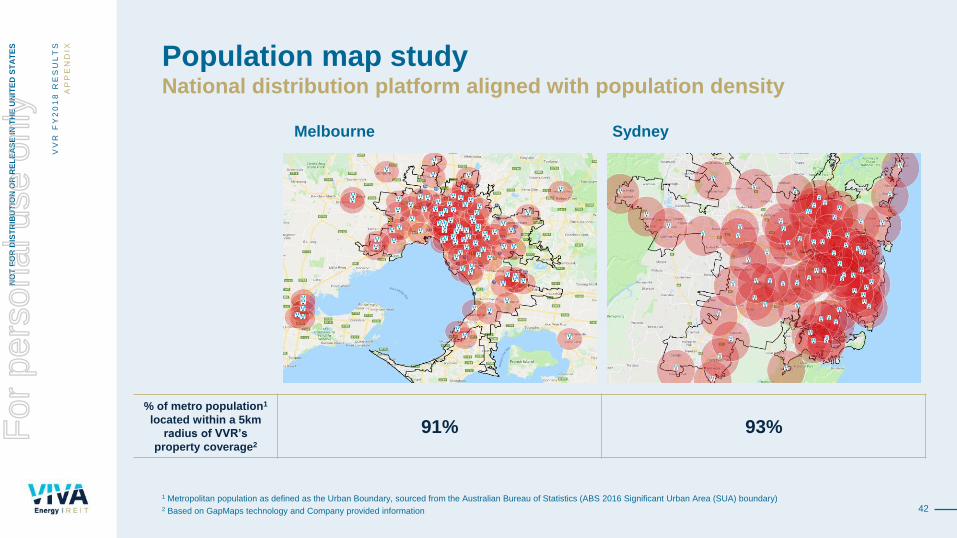
Population map studyNational distribution platform aligned with population density
1 Metropolitan population as defined as the Urban Boundary, sourced from the Australian Bureau of Statistics (ABS 2016 Significant Urban Area (SUA) boundary)2 Based on GapMaps technology and Company provided information
VV
R F
Y2
01
8 R
ES
UL
TS
AP
PE
ND
IX
Melbourne Sydney
% of metro population1
located within a 5km
radius of VVR’s
property coverage2
91% 93%For
per
sona
l use
onl
y

NO
T F
OR
DIS
TR
IBU
TIO
N O
R R
EL
EA
SE
IN
TH
E U
NIT
ED
ST
AT
ES
43
Appendix 2
KEY RISK FACTORS
For
per
sona
l use
onl
y

NO
T F
OR
DIS
TR
IBU
TIO
N O
R R
EL
EA
SE
IN
TH
E U
NIT
ED
ST
AT
ES
44
Key risk factorsThis section sets out some of the key risks associated with:
• VVR and its existing business and the industry in which VVR operates
• participation in the Equity Raising.
The risks set out in this section are not listed in order of importance and do not constitute an exhaustive list of all risks involved with an investment in VVR.
Before investing in VVR you should be aware that a number of risks and uncertainties, which are both specific to VVR and of a more general nature, may affect the future operating
and financial performance of VVR and the value of VVR securities. You should note that the occurrence or consequence of many of the risks described in this section are partially or
completely outside of the control of VVR, its directors and senior management.
Before investing in VVR securities, you should carefully consider the risk factors and your personal circumstances. Potential investors should consider publicly available information on
VVR (such as that available on the ASX website), and consult their stockbroker, solicitor, accountant or other professional advisor before making an investment decision.
1. TENANT CONCENTRATION RISK
Viva Energy Australia is the primary tenant of VVR’s existing portfolio of service station properties. Accordingly, approximately 95% of VVR’s rental income is received from Viva
Energy Australia as at the date of this Presentation. If Viva Energy Australia’s financial standing materially deteriorates, its ability to make rental payments to VVR may be adversely
impacted, which may have a materially adverse impact on VVR’s results of operations, financial position and ability to service and/or obtain financing.
2. TERMINATION OF ALLIANCE AGREEMENT OR SHELL BRANDING AGREEMENT
Termination of the agreement between Coles Express and Viva Energy Australia (and certain of their associated entities) dated 27 May 2003, as amended in February 2019 and from
time to time (Alliance Agreement), including the resulting removal of Coles Express branding from the properties, could adversely affect Viva Energy Australia’s ability to meet its
rental obligations, the value of the Portfolio and VVR’s ability to service and/or obtain financing.
Termination of Viva Energy Australia’s right to use Shell branding could also adversely affect Viva Energy Australia’s ability to meet its rental obligations, the value of the Portfolio and
VVR’s ability to service and/or obtain financing.
Viva Energy Australia announced on 6 February 2019 that they had extended the Alliance Agreement for an additional 5 years to 2029 on new terms to support future growth and
cement the network as Australia's leading fuel and convenience business.
In certain circumstances following the occurrence of a termination event under the Alliance Agreement, Coles Express may require Viva Energy Australia to assign and transfer to
Coles Express all of Viva Energy Australia’s rights under the site leases between Viva Energy Australia and VVR. If this were to occur, Coles Express (or any assignee of its rights)
would become the tenant of VVR’s properties.
For
per
sona
l use
onl
y

NO
T F
OR
DIS
TR
IBU
TIO
N O
R R
EL
EA
SE
IN
TH
E U
NIT
ED
ST
AT
ES
45
Key risk factors (continued)3. EXPOSURE TO SITE AGREEMENTS IN THE EVENT THE LEASES ARE TERMINATED
If a site lease between Viva Energy Australia and VVR terminates or expires while a site agreement between Viva Energy Australia and Coles Express (Site Agreement) in respect of
the same property remains on foot, it is possible that Coles Express would continue to have its rights under that Site Agreement, with VVR becoming its direct landlord. In such a
circumstance, VVR would be the direct landlord to Coles Express under the terms of that Site Agreement and would, in that capacity, be bound by its terms for the remaining term of
that Site Agreement.
The terms of the Site Agreements are not as favourable to the landlord as the terms of the existing leases between Viva Energy Australia and VVR. In particular, the rent payable
under the Site Agreements is materially less than the rent payable under the existing leases and they are not on a “triple-net” basis. Further, if it is required to perform the obligations
of the landlord under a Site Agreement, VVR is likely to have obligations with regard to maintenance of the fuel equipment, and with regard to subsequent environmental
contamination, in respect of that site.
4. RE-LEASING AND MARKET RENT REVIEWS
At expiry of each lease, VVR may not be able to negotiate an extension with the tenant or replace the tenant on substantially the same terms. Viva Energy Australia may also have a
right of first refusal over any lease offered to a third party. At expiry or upon exercise of an option to extend by Viva Energy Australia or another tenant, rents will be subject to
prevailing market conditions and market rent reviews, as a result of which rents may go up or down.
At expiry or on termination of the Alliance Agreement, Coles Express may cease to operate the service stations on the properties in the Portfolio. If Coles Express ceases to be the
operator of properties in VVR’s portfolio of properties, the aggregate value and performance of the portfolio may be adversely impacted. As a result, any market-based rents achieved
at lease expiry or upon exercise of an option to extend by VVR may be lower. In addition, if some or all properties cease to be Shell and/or Coles Express branded, the aggregate
value and performance of the portfolio may be adversely impacted. As a result, market-based rents achieved at lease expiry or upon exercise of an option to extend by VVR may be
lower. VVR is not a party to these agreements and has no rights regarding enforcement, renewal or termination.
5. PORTFOLIO VALUE
The value of VVR’s portfolio of properties may be adversely affected by a number of other factors, including a number of factors outside the control of VVR, such as supply and
demand for service station properties, fuel volume throughput of the properties, gross fuel margin, gross convenience store sales, general property market conditions, the availability
of credit, the ability to attract and implement economically viable rental arrangements, Viva Energy Australia or another tenant not extending the term of leases, re-leasing of
properties, capitalisation rates and general economic factors such as the level of inflation and interest rates. The valuation of properties may fall. As changes in valuations are
recorded on the income statement, any decreases in value will have a negative impact on the income statement and in turn the price of VVR’s securities may fall. Decreases in
property valuations may also cause VVR to breach its financial covenants under the syndicated facility agreement dated 24 May 2018 under which a number of domestic and
international banks have agreed to provide unsecured debt facilities (Debt Facility Agreement).
For
per
sona
l use
onl
y

NO
T F
OR
DIS
TR
IBU
TIO
N O
R R
EL
EA
SE
IN
TH
E U
NIT
ED
ST
AT
ES
46
Key risk factors (continued)6. PROPERTY ILLIQUIDITY
VVR may be required to dispose of its property assets in response to adverse business conditions. Given the relatively illiquid nature of property investments, VVR may not be able to
achieve the disposal of the asset in a timely manner or at a sale price that matches the carrying value of the property. This may affect VVR’s net asset value or the trading price of
VVR’s securities.
7. CGT IMPLICATIONS OF DISPOSAL OF PROPERTIES
The CGT cost base of Viva Energy Australia in the freehold interest in the properties transferred in connection with VVR’s ASX listing was inherited by VVR. As at 31 December 2016,
the cost base was $1,306 million (based on then current law). As the inherited cost base for the initial portfolio is significantly below the current market value of those assets, if VVR
disposes of any of those properties, its taxable gain or loss for tax purposes will be calculated having regard to the difference between the sale price and the cost base of those
properties (regardless of the amount paid by VVR for the properties). VVR has no current intention to sell any of those properties, but it may do so in the future.
8. FIRST RIGHT OF REFUSAL ON DISPOSALS
If VVR wishes to sell a property that is leased to Viva Energy Australia, VVR will need to comply with certain rights of first refusal granted in favour of Viva Energy Australia and Coles
Express. The existence of these rights of first refusal may make it more difficult for VVR to attract a third party purchaser who is willing to enter into an agreement to buy such a
property from VVR on commercially acceptable terms.
9. GUARANTEE OF VIVA ENERGY AUSTRALIA’S OBLIGATIONS UNDER SITE AGREEMENTS
VVR has guaranteed to Coles Express that Viva Energy Australia will perform its obligations to Coles Express under each Site Agreement which relates to a property that is the
subject of a lease between Viva Energy Australia and VVR. While Viva Energy Australia has undertaken to VVR that it will perform those obligations, if Viva Energy Australia is unable
to perform them, Coles Express may call upon VVR to do so and also demand indemnification for any associated liability or loss.
10. RELIANCE ON THE MANAGER AND POTENTIAL CONFLICT WITH VIVA ENERGY AUSTRALIA
The manager of VVR, VER Manager Pty Ltd (ACN 613 163 385) (VER Manager), is a member of the Viva Energy Australia group. VVR has limited rights to replace the manager and
no right to replace the manager’s representatives, including the senior executives of VER Manager responsible for managing VVR. The manager has the right to terminate the
Management Agreement on six months’ notice. If the Management Agreement is terminated, VVR may not be able to appoint a new manager with the same expertise, which could
have a materially adverse impact on the management and financial performance of VVR. Because Viva Energy Australia is VVR’s primary tenant and will be the primary tenant of the
properties and a potential counterparty in future sale and leasing transactions, there is an inherent risk of actual or perceived conflicts of interest between Viva Energy Australia and
VVR. Because of the size of the interest in VVR that is held by the Viva Energy Australia group, Viva Energy Australia will have, for so long as it retains that substantial equity
investment, significant influence over the election of directors and the potential outcome of matters submitted to a vote of VVR securityholders. The interests of Viva Energy Australia
may differ from the interests of VVR and the interests of other securityholders.
For
per
sona
l use
onl
y

NO
T F
OR
DIS
TR
IBU
TIO
N O
R R
EL
EA
SE
IN
TH
E U
NIT
ED
ST
AT
ES
47
Key risk factors (continued)VVR does not have direct employees (other than non-executive directors) and consequently is reliant on the expertise and experience of the key executives of Viva Energy Australia
made available to the VER Manager which provides the services to Viva Energy REIT under the Management Agreement. As a consequence, loss of such key personnel could
potentially have an adverse impact on the management and the financial performance of VVR and in turn may affect the returns to security holders.
11. ENVIRONMENTAL LIABILITIES
Viva Energy Australia and VVR have entered into various arrangements designed to ensure that, in respect of the 454 service station sites acquired in connection with VVR’s IPO in
2016, environmental liabilities associated with the properties in the portfolio are the responsibility of Viva Energy Australia in most cases. VVR depends on Viva Energy Australia to
perform its obligations under the environmental indemnification arrangements in relation to those sites. If Viva Energy Australia was to fail to meet its obligations under these
arrangements (including due to its insolvency), VVR may incur significant costs to rectify contamination on (and in respect of) its properties. Moreover, these arrangements provide
that VVR will not be indemnified for certain losses arising from contamination of a property in the portfolio in specified circumstances.
With respect to each other site in VVR’s portfolio (including those under contract), the lease in relation to that site allocates risk for liability arising in connection with contamination
between the landlord and the tenant. Typically, those arrangements allocate responsibility for costs associated with contamination that predates the lease to the landlord and require
the tenant to remediate contamination which it causes during the lease term.
In addition, although VVR is unlikely to be primarily liable under the “polluter pays” regime that generally applies under Australian State-based environmental legislation as it does not
operate the sites, there remains a risk that VVR will incur liability if the polluter cannot be identified or is unable to meet its obligations. This could have a material adverse effect on
VVR’s performance and financial condition.
12. RELIANCE ON INFORMATION PROVIDED
VVR undertakes a due diligence process in respect of all newly acquired properties, which relies in part on the review of financial and other information provided by the vendors of the
properties. Despite taking reasonable efforts, VVR is not able to verify the accuracy, reliability or completeness of all the information which is provided to it against independent data. If
any such information provided to and relied upon by VVR in its due diligence process and in its preparation of this Presentation proves to be incorrect, incomplete or misleading, there
is a risk that the actual financial position and performance of the properties and the combined group may be materially different to the expectations reflected in this Presentation.
Investors should also note that there is no assurance that the due diligence conducted was conclusive and that all material issues and risks in respect of the acquisition have been
identified. Accordingly, there is a risk that unforeseen issues and risks may arise which also have a material impact on VVR. With regard to development and fund through
acquisitions, completion and development risks have been considered.
13. MARGIN STEP-UP UNDER THE DEBT FACILITY AGREEMENT AND IMPACT OF CHANGE OF VVR OWNERSHIP
The margin under the Debt Facility Agreement is variable, depending on the gearing of VVR.
If Viva Energy Australia ceases to beneficially own and control, either directly or indirectly, at least 20% of the securities in VVR by selling or transferring its interests, or an entity other
than a member of the Viva Energy Australia group controls VVR, then this would constitute a review event under the terms of the Debt Facility Agreement and (subject to certain
agreed negotiation and notification periods) a repayment of VVR’s debt facilities may be required.
For
per
sona
l use
onl
y
NO
T F
OR
DIS
TR
IBU
TIO
N O
R R
EL
EA
SE
IN
TH
E U
NIT
ED
ST
AT
ES
48
Key risk factors (continued)14. BREACH OF DEBT FACILITY AGREEMENT
If there is a breach of any of the financial covenants contained in the Debt Facility Agreement which is not remedied within 30 business days by way of an equity cure, an event of
default will occur under the terms of the Debt Facility Agreement. If an event of default occurs, immediate repayment of VVR’s debt facilities may be required. In these circumstances,
VVR may need to dispose of some or all of its properties for less than their market value, raise additional equity, and/or reduce or suspend distributions in order to repay its debt
facilities.
15. COMPLIANCE
The Trust is a managed investment scheme, which means that VER Limited ("Responsible Entity"), the Responsible Entity of the Trust, is subject to strict regulatory and compliance
arrangements under the Corporations Act and its Australian Financial Services Licence. If the Responsible Entity fails to comply with the conditions of its Australian Financial Services
Licence and the Corporations Act, ASIC may suspend or revoke the licence or take other action which in turn could adversely impact the Trust.
16. INTEREST RATE RISK
The nature of VVR’s financing arrangements exposes VVR to interest rate risk, including from the movement in underlying interest rates, which impacts on VVR’s cost of funding and
may adversely impact VVR’s financial performance. The Group’s cash and cash equivalents, floating rate borrowings and interest rate swaps also expose it to a risk of change in fair
value or future cash flows due to changes in interest rates. The Group economically hedges some or all of its exposure to changes in interest rates on variable rate borrowings by
using floating-to-fixed interest rate swaps. By hedging against changes in interest rates, the Group has limited its exposure to changes in interest rates on its outward cash flows.
17. REFINANCING RISK
VVR has outstanding debt facilities. Such indebtedness may result in VVR being subject to certain covenants restricting its ability to engage in certain types of activities or to pay
distributions or dividends to VVR securityholders. General economic and business conditions that impact the debt or equity markets could impact VVR’s ability to refinance its
operations.
18. GEARING
Any increase in VVR’s gearing level will also increase the extent to which its financial performance and financial position are affected by changes in interest rates, asset prices and
other financial indicators. If the market considers VVR to be highly geared, the cost of replacement (or incremental) funding may increase relative to current levels and refinancing
options may become difficult to secure.For
per
sona
l use
onl
y
NO
T F
OR
DIS
TR
IBU
TIO
N O
R R
EL
EA
SE
IN
TH
E U
NIT
ED
ST
AT
ES
49
Key risk factors (continued)19. SECURITIES PRICE RISK
There are general risks associated with an investment in the share market. As such, the value of New Securities may rise above or fall below the offer price, depending on the
financial position and operating performance of VVR and other factors. Further, the market price of VVR securities will fluctuate due to various factors, many of which are non-specific
to VVR, including recommendations by brokers and analysts, Australian and international general economic conditions, inflation rates, interest rates, changes in government, fiscal,
monetary and regulatory policies, global geo-political events and hostilities and acts of terrorism, investor perceptions and volatility in global markets. In the future, these factors may
cause VVR securities to trade at a lower price.
20. TAXATION
Future changes in taxation law in Australia and in other jurisdictions, including changes in interpretation or application of the law by the courts or taxation authorities in Australia or
other jurisdictions, may impact the future tax liabilities of VVR or may affect taxation treatment of an investment in VVR securities, or the holding or disposal of those securities.
21. FUTURE ACQUISITION RISKS
From time to time VVR evaluates acquisition opportunities. Any acquisition would lead to a change in the sources of VVR’s earnings and could increase the volatility of its earnings.
Integration of new properties or businesses into VVR may be costly and may not generate expected earnings and may occupy a large amount of management’s time. There is no
guarantee that future potential acquisitions will be available on favourable terms or that they will be successfully integrated.
22. ACCOUNTING STANDARDS AND ASSET IMPAIRMENT
VVR prepares its general purpose financial statements in accordance with AIFRS and with the Corporations Act. Australian Accounting Standards are subject to amendment from
time to time, and any such changes may impact on VVR’s statement of financial position or statement of financial performance. Under AIFRS, VVR is required to review the carrying
value of its assets annually or whenever there is an indication of impairment. If there is any indication of impairment, then the assets recoverable amount is estimated. Changes in key
assumptions underlying the recoverable amount of certain assets of VVR (or of the properties post-acquisition) could result in an impairment of such assets, which may have a
material adverse effect on VVR’s financial performance and position.
23. IMPAIRMENT AND FAIR VALUE
VVR undertakes an assessment of the carrying value of its portfolio of properties as part of its half and full year accounts preparation to determine if the carrying value of any of these
assets is impaired. If VVR recognises an impairment in the value of a material number of sites in its portfolio of properties, this could have an adverse effect on VVR’s financial
position.
24. LITIGATION AND DISPUTES
VVR may become involved in litigation or disputes, which could adversely affect financial performance and reputation.
For
per
sona
l use
onl
y

NO
T F
OR
DIS
TR
IBU
TIO
N O
R R
EL
EA
SE
IN
TH
E U
NIT
ED
ST
AT
ES
50
Key risk factors (continued)25. ECONOMIC CONDITIONS
The operating and financial performance of VVR’s businesses are influenced by a variety of general economic and business conditions including the level of inflation, interest rates
and exchange rates and government fiscal, monetary and regulatory policies. A prolonged deterioration in domestic or general economic conditions, including an increase in interest
rates or a decrease in consumer and business demand, could be expected to have a material adverse impact on the financial performance of VVR’s businesses.
For
per
sona
l use
onl
y
NO
T F
OR
DIS
TR
IBU
TIO
N O
R R
EL
EA
SE
IN
TH
E U
NIT
ED
ST
AT
ES
51
Appendix 3
FOREIGN SELLING RESTRICTIONS
For
per
sona
l use
onl
y

NO
T F
OR
DIS
TR
IBU
TIO
N O
R R
EL
EA
SE
IN
TH
E U
NIT
ED
ST
AT
ES
52
Foreign Selling Restrictions
This presentation does not constitute an offer of New Securities in any jurisdiction in which it would be unlawful. In particular, this presentation may not be distributed to any person,
and the New Securities may not be offered or sold, in any country outside Australia except to the extent permitted below.
Canada
The New Securities may only be offered or sold, directly or indirectly, in the provinces of British Columbia, Alberta, Ontario and Quebec ( the “Private Placement Provinces”) or to
residents thereof and not in, or to the residents of, any other province or territory of Canada. Such offers or sales will be made pursuant to an exemption from the requirement to file a
prospectus with the regulatory authorities in the Private Placement Provinces and will be made only by a dealer duly registered under the applicable securities laws of such provinces,
as the case may be, or in accordance with an exemption from the applicable registered dealer requirements. The New Securities may be sold in the Private Placement Provinces only
to purchasers purchasing, or deemed to be purchasing, as principal that are accredited investors, as defined in National Instrument 45-106 Prospectus Exemptions or subsection
73.3(1) of the Securities Act (Ontario), and are permitted clients, as defined in National Instrument 31-103 Registration Requirements, Exemptions and Ongoing Registrant
Obligations. Any resale of the New Securities must be made in accordance with an exemption from, or in a transaction not subject to, the prospectus requirements of applicable
securities laws.
Pursuant to section 3A.3 of National Instrument 33-105 Underwriting Conflicts (NI 33-105), the underwriters are not required to comply with the disclosure requirements of NI 33-105
regarding underwriter conflicts of interest in connection with this offering.
Upon receipt of this offering circular, each Canadian purchaser hereby confirms that it has expressly requested that all documents evidencing or relating in any way to the sale of the
securities described herein (including for greater certainty any purchase confirmation or any notice) be drawn up in the English language only. Par la reception de ce document,
chaque acheteur canadien confirme par les présentes qu’il a expressément exigé que tous les documents faisant foi ou se rapportant de quelque manière que ce soit à la vente des
valeurs mobilières décrites aux présentes (incluant, pour plus de certitude, toute confirmation d’achat ou tout avis) soient rédigés en anglais seulement.
Hong Kong
WARNING: The contents of this presentation have not been reviewed by any regulatory authority in Hong Kong. You are advised to exercise caution in relation to the Institutional
Placement. If you are in any doubt about any of the contents of this presentation, you should obtain independent professional advice.
This presentation has not been approved by the Securities and Futures Commission in Hong Kong and, accordingly, (i) the New Securities may not be offered or sold in Hong Kong
by means of this presentation or any other document other than (a) to "professional investors" as defined in the Securities and Futures Ordinance (Cap. 571) of Hong Kong (the
“SFO”) and any rules made under the SFO; or (b) in other circumstances which do not result in the document being a "prospectus" as defined in the Companies (Winding Up and
Miscellaneous Provisions) Ordinance (Cap. 32) of Hong Kong (the “C(WUMP)O”) or which do not constitute an offer to the public within the meaning of the C(WUMP)O; and (ii) no
person shall issue or possess for the purposes of issue, whether in Hong Kong or elsewhere, any advertisement, invitation or document relating to the New Securities which is
directed at, or the contents of which are likely to be accessed or read by, the public of Hong Kong (except if permitted to do so under the securities laws of Hong Kong) other than with
respect to the New Securities which are or are intended to be disposed of only to persons outside Hong Kong or only to “professional investors” as defined in the SFO and any rules
made under the SFO.
For
per
sona
l use
onl
y

NO
T F
OR
DIS
TR
IBU
TIO
N O
R R
EL
EA
SE
IN
TH
E U
NIT
ED
ST
AT
ES
53
Foreign Selling RestrictionsNew Zealand
This document is not a product disclosure statement or any other form of disclosure document under the Financial Markets Conduct Act 2013 ("FMC Act") and has not been registered, filed
with or approved by any New Zealand regulatory authority under the FMC Act.
Other than pursuant to the SPP, the New Securities may only be offered or sold in New Zealand (or allotted with a view to being offered for sale in New Zealand) to a person who:
(a) is an “investment business” within the meaning of clause 37 of Schedule 1 of the FMC Act;
(b) meets the investment activity criteria specified in clause 38 of Schedule 1 of the FMC Act;
(c) is “large” within the meaning of clause 39 of Schedule 1 of the FMC Act;
(d) is a “government agency” within the meaning of clause 40 of Schedule 1 of the FMC Act; or
(e) is an “eligible investor” within the meaning of clause 41 of Schedule 1 of the FMC Act
Singapore
NOTE: Investors should note that VVR is not a collective investment scheme which is authorised under Section 286 of the Securities and Futures Act, Chapter 289 of Singapore (the ”SFA”) or
recognised under section 287 of the Act.
This presentation has not been registered as a prospectus with the Monetary Authority of Singapore and the New Securities will be offered pursuant to exemptions under the SFA.
Accordingly, the New Securities may not be offered or sold or made the subject of an invitation for subscription or purchase nor may this presentation or any other document or material in
connection with the offer or sale or invitation for subscription or purchase of any New Securities be circulated or distributed, whether directly or indirectly, to persons in Singapore other than (i)
to an institutional investor (as defined in Section 4A of the SFA) pursuant to Section 274 of the SFA, (ii) to a relevant person (as defined in Section 275(2) of the SFA) pursuant to Section
275(1) of the SFA, or any person pursuant to Section 275(1A) of the SFA, and in accordance with the conditions specified in Section 275 of the SFA, or (iii) otherwise pursuant to, and in
accordance with the conditions of, any other applicable provision of the SFA.
Where New Securities are subscribed or purchased under Section 275 of the SFA by a relevant person which is:
(1) a corporation (which is not an accredited investor (as defined in Section 4A of the SFA)) the sole business of which is to hold investments and the entire share capital of which is owned
by one or more individuals, each of whom is an accredited investor; or
(2) a trust (where the trustee is not an accredited investor) whose sole purpose is to hold investments and each beneficiary of the trust is an individual who is an accredited investor,
securities or securities-based derivatives contracts (each term as defined in Section 2(1) of the SFA) of that corporation or the beneficiaries' rights and interest (howsoever described) in that
trust shall not be transferred within six months after that corporation or that trust has acquired the New Securities pursuant to an offer made under Section 275 of the SFA except:
(1) to an institutional investor or to a relevant person, or to any person arising from an offer referred to in Section 275(1A) or Section 276(4)(i)(B) of the SFA; or
(2) where no consideration is or will be given for the transfer; or
(3) where the transfer is by operation of law; or
(4) as specified in Section 276(7) of the SFA; or
(5) as specified in Regulation 37A of the Securities and Futures (Offers of Investments) (Securities and Securities-based Derivatives Contracts) Regulations 2018.
Notification under Section 309B(1)(c) of the SFA -- In connection with Section 309B of the SFA and the Securities and Futures (Capital Markets Products) Regulations 2018 (the “CMP
Regulations 2018”), VVR has determined the classification of the New Securities as prescribed capital markets products (as defined in the CMP Regulations 2018) and Excluded Investment
Products (as defined in MAS Notice SFA 04-N12: Notice on the Sale of Investment Products and MAS Notice FAA-N16: Notice on Recommendations on Investment Products).
For
per
sona
l use
onl
y

NO
T F
OR
DIS
TR
IBU
TIO
N O
R R
EL
EA
SE
IN
TH
E U
NIT
ED
ST
AT
ES
54
Foreign Selling Restrictions
Switzerland
VVR has not been approved by the Swiss Financial Market Supervisory Authority FINMA ("FINMA") as a foreign collective investment scheme pursuant to Article 120 paragraph 1 of
the Swiss Collective Investment Schemes Act of June 23, 2006, as amended ("CISA") and no representative or paying agent in Switzerland has been appointed pursuant to Article
120 paragraph 4 CISA with respect to VVR. The New Securities may only be offered, advertised or otherwise distributed, directly or indirectly, in, into or from Switzerland (i)
exclusively to regulated qualified investors ("Regulated Qualified Investors") as defined in Article 10(3)(a) and (b) CISA, and (ii) in a manner which does not constitute a public offering
within the meaning of Article 652a or 1156 of the Swiss Code of Obligations ("CO"). The New Securities will not be listed on the SIX Swiss Exchange ("SIX") or on any other stock
exchange or regulated trading facility in Switzerland.
This presentation has been prepared without regard to the disclosure standards for prospectuses under the CISA, issuance prospectuses under Article 652a or 1156 CO or listing
prospectuses under the listing rules of SIX or any other stock exchange or regulated trading facility in Switzerland. This presentation and any other offering or marketing material
relating to the New Securities may only be distributed or made available in, into or from Switzerland (i) exclusively to Regulated Qualified Investors, and (ii) in a manner which does
not constitute a public offering within the meaning of Article 652a or 1156 CO. This presentation is personal to the recipient only and not for general circulation in Switzerland.
Neither this presentation nor any other offering or marketing material relating to the New Securities have been or will be filed with, or approved by, any Swiss regulatory authority. In
particular, this presentation will not be filed with, and the offering of New Securities will not be approved or supervised by FINMA. The investor protection afforded to investors of
interests in collective investment schemes under the CISA and the supervision by FINMA in connection with the licensing for distribution or the appointment of a representative and a
paying agent in Switzerland do not extend to acquirers of the New Securities.
United Arab Emirates
In accordance with the provisions of the United Arab Emirates (“UAE”) Securities and Commodities Authority’s (“SCA”) Board Decision No. (9/R.M) of 2016 Concerning the
Regulations as to Mutual Funds as well as the SCA Promotion and Introduction Regulations, the New Securities to which this Presentation relates may only be promoted in the UAE
as follows: without the prior approval of SCA, only in so far as the promotion is directed to (i) the UAE federal government and local governments, governmental institutions and
authorities; (ii) companies fully owned by any of the aforementioned; (iii) international bodies and organizations; (iv) entities licensed to engage in a commercial business in the UAE,
provided that at least one of their stated objectives is to engage in investment business; (iv) an investment manager who has authority to make investment decisions on behalf of
clients and (v) investors following a reverse enquiry; or with the prior approval of the SCA. Any approval of the SCA to the promotion of the New Securities in the UAE does not
represent a recommendation to purchase or invest in the Fund. The SCA has not verified this presentation or other documents in connection with VVR and the New Securities and the
SCA may not be held liable for any default by any party involved in the operation, management or promotion of VVR in the performance of their responsibilities and duties, or the
accuracy or completeness of the information in this presentation.
The New Securities to which this presentation relates may be illiquid and/or subject to restrictions on their resale. Prospective investors should conduct their own due diligence on the
New Securities in VVR. If you do not understand the contents of this presentation you should consult an authorised financial advisor.
For
per
sona
l use
onl
y

NO
T F
OR
DIS
TR
IBU
TIO
N O
R R
EL
EA
SE
IN
TH
E U
NIT
ED
ST
AT
ES
55
Foreign Selling Restrictions
United States
This presentation does not constitute an offer to sell, or the solicitation of an offer to buy, any securities in the United States. The New Securities have not been, and will not be,
registered under the U.S. Securities Act of 1933 (the "U.S. Securities Act") or the securities laws of any state or other jurisdiction of the United States. The New Securities may not be
offered or sold to, directly or indirectly, any person in the United States, except in a transaction exempt from, or not subject to, the registration requirements of the U.S. Securities Act
and any other applicable U.S. state securities laws.
For
per
sona
l use
onl
y