voc emissions from manufacturing...
TRANSCRIPT
Working Report No. 6 2001Arbejdsrapport fra Miljøstyrelsen
VOC Emissions from ManufacturingProcesses
Cleaner Technology in the Lacquer and Paint Industry
Jørgen VinekeCarl Bro A/S
Jürgen ZimmerFichtner GmbH & Co. KG

The Danish Environmental Protection Agency will, when opportunity
offers, publish reports and contributions relating to environmental
research and development projects financed via the Danish EPA.
Please note that publication does not signify that the contents of the
reports necessarily reflect the views of the Danish EPA.
The reports are, however, published because the Danish EPA finds thatthe studies represent a valuable contribution to the debate on
environmental policy in Denmark.

3
Contents
Preface ................................................................................................. 5
Sammenfatning og konklusioner........................................................... 7
Summary and conclusions ................................................................... 15
1 INTRODUCTION.....................................................................................................22
1.1 DESCRIPTION OF PROBLEM ............................................................................... 23
2 ENVIRONMENTAL REGULATION.................................................................24
2.1 NATIONAL LEGISLATION AND EC DIRECTIVES .............................................. 242.2 VOC LIMITS AND THRESHOLD VALUES........................................................... 252.3 IMPLEMENTATION OF THE VOC DIRECTIVE .................................................. 25
3 APPROACHES TO CUTTING VOC EMISSIONS ........................................27
4 VOC REDUCTION, STEP BY STEP ..................................................................29
4.1 INTRODUCTION................................................................................................... 294.2 GENERAL METHODOLOGY................................................................................. 304.3 DETAILED METHODOLOGY................................................................................ 32
4.3.1 Detailed survey of emissions from all sources.........................................324.3.2 Control of compliance with present and future limit values .................354.3.3 Setting up of different reduction scenarios...............................................374.3.4 Choosing the best reduction scenario .......................................................384.3.5 Action plans ...................................................................................................39
4.4 REPORTING ON ACTIVITIES AND EPI VALUES................................................ 40
5 PROCESS-INTEGRATED PRODUCTION MODIFICATIONMEASURES ..........................................................................................................................42
5.1 UNLOADING SYSTEM FOR FEEDSTOCK DOSING AND TANKFARMS............... 455.2 DISSOLVER AND REACTOR................................................................................ 455.3 HOLDING STORE FOR MOBILE BINS.................................................................. 495.4 DOSING STATION FOR MOBILE PRODUCTION BINS......................................... 495.5 MILLS FOR FINE DISPERSING............................................................................. 505.6 FINISH TANKS...................................................................................................... 505.7 FILTER SYSTEMS................................................................................................. 515.8 FILLING SYSTEMS............................................................................................... 515.9 RINSING BASINS.................................................................................................. 525.10 SOLVENT -BASED WASHING OF MOBILE PRODUCTION BINS IN CLEANINGCABINET ............................................................................................................................. 52
6 STRATEGY.................................................................................................................54
6.1 PRODUCT DEVELOPMENT .................................................................................. 546.1.1 Measures.........................................................................................................54
6.2 PRODUCTION PLANNING.................................................................................... 556.2.1 Supply of feedstocks......................................................................................556.2.2 Planning activities ........................................................................................566.2.3 Education and further company-internal training..................................57
Appendix A Photos (Catalogue of measures)Appendix B Photos

4
5
Preface
This report describes possibilities for reducing VOC emission frommanufacturing processes in the lacquer and paint industry. Regulationaccording to Danish legislation and EC directives is summarised by way ofintroduction.
The overall stress will be laid on method description for review, setting-upand assessment of proposals as well as the final action plan. As use for thiswork a catalogue has been elaborated with emission limiting initiatives. Thecatalogue describes solutions to different parts of the process withinformation of expected efficiency and economy.
There is a short description of possibilities for reduction through productdevelopment and planning of production including training and education ofemployees.
The project has been carried out with financial support from the Councilconcerning recycling and less polluting technology, with the DanishPaintmakers’ Association as project manager.
Fichtner ⋅ Carl Bro a|s has been the consultant of the Danish Paintmakers’Association regarding the implementation of the project. Employees fromFichtner GmbH & Co. KS in Germany and Carl Bro a|s in Denmark haveparticipated as consultants on the project.
The report can be seen as a continuation of Trade information for the lacquerand paint industry no. 5, 1996 from the Danish EPA (Brancheorientering forlak- og farveindustrien nr. 5, 1996 fra Miljøstyrelsen).
The project has been followed by a group of experts with participation of:
Ole E. Jensen Teknos Technology A/SRikke Østergaard Teknos Technology A/S
Ole Jacobsen Akzo Nobel Decorative Coatings A/S
Further employees from the two companies have supplemented on relevantsub fields.
A number of companies in Germany have kindly placed information,material and experience at our disposal for the project, especially AkzoNobel Coatings GmbH in Berlin and Stuttgart respectively, who kindlyplaced production facilities at our disposal for inspection.
Besides, a responsible steering committee has been appointed consisting of:
Erik Thomsen The Danish EPALilian Petersen The Danish Directorate for National Labour InspectionSteen Mejlby SiD (The General Workers Union in Denmark)Finn Toft Jensen The County of Vejle (Association of County Councils
in Denmark)Vibeke Plambeck the Danish Paintmakers’ AssociationJørgen Vineke Fichtner ⋅ Carl Bro a|s

6

7
Sammenfatning og konklusion
Som resumé gengives tekstdele fra projektets artikel i publikationen ”NyViden”, der udgives af Miljøstyrelsen.
VOC begrænsning – step by step – er mulig
Lak- og farveindustrien kan begrænse emission af VOC’er (flygtigeorganiske forbindelser) til arbejdsmiljøet og det eksterne miljø. Dettedokumenteres i en rapport, der beskriver metoder for kortlægning, opstillingog vurdering af løsningsforslag samt opstilling af endelige handlingsplaner.Begrænsning kan ske gennem produktudvikling og ændret tilrettelæggelse afproduktionen herunder uddannelse af medarbejdere. Men i mange situationerer der behov for tekniske tiltag. Til brug for vurdering heraf er derudarbejdet et katalog med forskellige emissionsbegrænsende tiltag, ogforventet effektivitet og økonomi er vurderet.
Nye krav til lak- og farveindustrien
Baggrund og formålLak- og farveindustrien i Danmark består af i alt ca. 20 malevareproducentersamt ca. 10 lim- og fugemasseproducenter.
Der er i EU-regi vedtaget to direktiver som får betydning for branchensmiljøarbejde.
EU-direktiv 1999/13/EF af 11. marts 1999 stiller krav om begrænsning afemissionen af VOC fra bl.a. branchens virksomheder. Direktivetimplementeres i dansk lovgivning senest i marts 2001. For de aktuellevirksomheder vil dette betyde krav om dokumentation og opstilling afhandlingsplaner med henblik på at overholde fastsatte krav til emissionen frapunktkilder og diffuse kilder.
EU-direktiv 96/61/EF af 24. september 1996 om integreret forebyggelse ogbekæmpelse af forurening er implementeret i Danmark med en nybekendtgørelse om godkendelse af listevirksomhed, Miljø- ogEnergiministeriets bekendtgørelse nr. 807 af 25. oktober 1999.Bekendtgørelsen, der præciserer kravene til redegørelse om anvendelse afbedste tilgængelige teknik (BAT), får betydning for virksomheder igodkendelsessituationen og ved revurdering af tidligere udstedtegodkendelser.
Foreningen for Danmarks Lak- og Farveindustri (FDLF) har i 1994-1995gennemført en kortlægning af mulighederne for anvendelse af renereteknologi i lak- og farveindustrien. Rapport om denne kortlægning ertidligere udsendt som Brancheorientering for lak- og farveindustrien nr. 5,1996 fra Miljøstyrelsen.
I fortsættelse af kortlægningen i 1994-1995 har FDLF gennemført et projektmed vurdering af tekniske muligheder for at begrænse VOC emissionen frafremstillingsprocesser i lak- og farveindustrien. Formålet er at vise hvilkemuligheder, der kan tages i anvendelse, og hvorledes branchensvirksomheder kan arbejde med problemstillingen. Medarbejdere fra FichtnerGmbH & Co. KG i Tyskland og Carl Bro as i Danmark har væretkonsulenter på projektet.

8
Projektets målgruppe er branchens virksomheder samt miljømyndighederne.Hensigten har været at introducere muligheder for tiltag på beståendevirksomheder. Mere vidtgående tiltag, som primært vil være mulige ved ennyetablering, ligger uden for projektet.
Muligheden for at gennemføre projektet er skabt af økonomisk støtte fraMiljøstyrelsen.
Opsamling af relevante erfaringer
ProjektetHovedvægten er lagt på en metodebeskrivelse for kortlægning, opstilling ogvurdering af løsningsforslag samt opstilling af den endelig handlingsplan. Tilbrug for dette arbejde er der udarbejdet et katalog medemissionsbegrænsende tiltag. Kataloget beskriver løsninger til forskelligedele af procesforløbet med angivelse af forventet effektivitet og økonomi.
Der er en kortere beskrivelse af muligheder for begrænsning gennemproduktudvikling og tilrettelæggelse af produktion herunder uddannelse afmedarbejdere.
En række virksomheder blandt udstyrsleverandører og producerendevirksomheder i Tyskland har velvilligt stillet oplysninger, materiale ogerfaringer til rådighed for projektet.
To danske virksomheder, Teknos Technology A/S og Akzo NobelDecorative Coatings A/S, har deltaget i en teknikergruppe, som har fulgtprojektet.
Miljøstyrelsen, Direktoratet for Arbejdstilsynet, SiD, Amtsrådsforeningen ogFDLF har været repræsenteret i en styregruppe.
Kravene skærpes
HovedkonklusionerFor at forstå projektets problemstillinger er det vigtigt, at se på indholdet afdet nye VOC-direktiv.
Direktivet om begrænsning af emissionen af VOC betyder for lak- ogfarveindustrien, at virksomheder med et forbrug af VOC større end 100tons/år skal:
• Udarbejde dokumentation gennem emissionskortlægning• Beskrive udvikling frem til situationen i 2007• Identificere og beskrive tiltag, der opfylder direktivets krav• Etablere tiltag i nødvendigt omfang
Emissionskravene for branchens virksomheder er vist i Tabel 1.
9
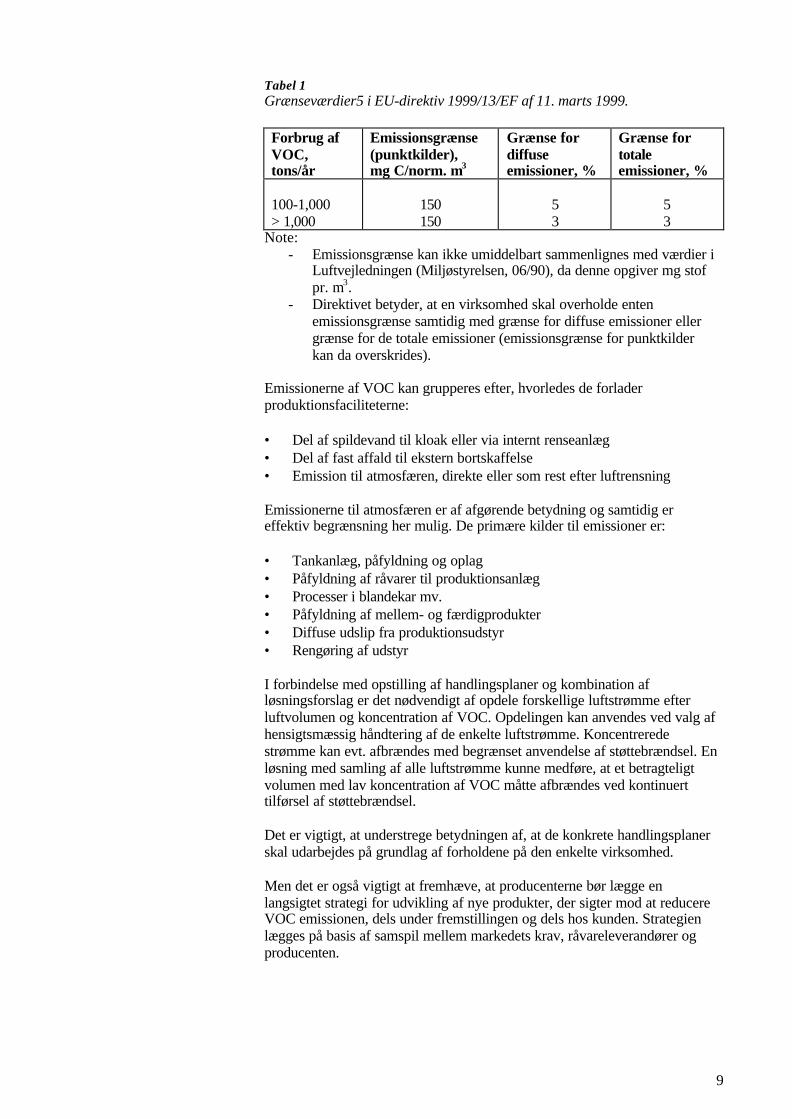
Tabel 1Grænseværdier5 i EU-direktiv 1999/13/EF af 11. marts 1999.
Forbrug afVOC,tons/år
Emissionsgrænse(punktkilder),mg C/norm. m3
Grænse fordiffuseemissioner, %
Grænse fortotaleemissioner, %
100-1,000> 1,000
150150
53
53
Note:- Emissionsgrænse kan ikke umiddelbart sammenlignes med værdier i
Luftvejledningen (Miljøstyrelsen, 06/90), da denne opgiver mg stofpr. m3.
- Direktivet betyder, at en virksomhed skal overholde entenemissionsgrænse samtidig med grænse for diffuse emissioner ellergrænse for de totale emissioner (emissionsgrænse for punktkilderkan da overskrides).
Emissionerne af VOC kan grupperes efter, hvorledes de forladerproduktionsfaciliteterne:
• Del af spildevand til kloak eller via internt renseanlæg• Del af fast affald til ekstern bortskaffelse• Emission til atmosfæren, direkte eller som rest efter luftrensning
Emissionerne til atmosfæren er af afgørende betydning og samtidig ereffektiv begrænsning her mulig. De primære kilder til emissioner er:
• Tankanlæg, påfyldning og oplag• Påfyldning af råvarer til produktionsanlæg• Processer i blandekar mv.• Påfyldning af mellem- og færdigprodukter• Diffuse udslip fra produktionsudstyr• Rengøring af udstyr
I forbindelse med opstilling af handlingsplaner og kombination afløsningsforslag er det nødvendigt af opdele forskellige luftstrømme efterluftvolumen og koncentration af VOC. Opdelingen kan anvendes ved valg afhensigtsmæssig håndtering af de enkelte luftstrømme. Koncentreredestrømme kan evt. afbrændes med begrænset anvendelse af støttebrændsel. Enløsning med samling af alle luftstrømme kunne medføre, at et betragteligtvolumen med lav koncentration af VOC måtte afbrændes ved kontinuerttilførsel af støttebrændsel.
Det er vigtigt, at understrege betydningen af, at de konkrete handlingsplanerskal udarbejdes på grundlag af forholdene på den enkelte virksomhed.
Men det er også vigtigt at fremhæve, at producenterne bør lægge enlangsigtet strategi for udvikling af nye produkter, der sigter mod at reducereVOC emissionen, dels under fremstillingen og dels hos kunden. Strategienlægges på basis af samspil mellem markedets krav, råvareleverandører ogproducenten.
10
VOC begrænsning – step by step
VejledningDe generelle trin i arbejdet med emissionsbegrænsning er:
• Etablering af detaljeret emissionsregister• Vurdering i forhold til myndighedskrav• Opstilling af scenarier for begrænsning• Valg af bedste kombination af tiltag• Opstilling af handlingsplaner• Opfølgning og rapporteringTrinene beskrives i rapporten med gode vink til, hvorledes arbejdet gribesan.
Da der er adskillige delstrømme og processer, som skal kortlægges vedmåling af VOC, anbefaler rapporten, at målingerne i høj grad foretages somTOC-målinger (total organisk kulstof) med transportabelt måleudstyr (FID –Flame Ionisation Detector). Målinger bør i nødvendigt omfang kalibreresmed traditionelle målinger med opsamling af VOC i kulrør og efterfølgendelaboratorieanalyse.
I forbindelse med arbejdet med scenarier, handlingsplaner og efterfølgendeopfølgning introduceres et EPI-tal (Environmental Performance Indicator):
EPI = [Q (kg VOC/år)] / [Br x Produktion (ton/år)]
EPI kan påvirkes ved ændring af emissionen (Q) eller ved ændring af deanvendte råvarers karakter (Br – en vægtet B-værdi). Det skal bemærkes, atBr-værdien er en teoretisk værdi, som principielt kun kan anvendes for ikke-lugtrelaterede stoffer med samme toksikologiske effekt. EPI kan anvendespå den enkelte virksomhed, men vil ikke umiddelbart kunne anvendes somsammenligningsgrundlag mellem virksomheder. Anvendelsen af EPI sætterfokus på såvel udledningens størrelse som på substitution af farligeopløsningsmidler til mindre farlige opløsningsmidler. EPI kan anvendes somen miljøindikator, der fortæller om udviklingen i virksomhedensmiljøperformance og kan som sådan f.eks. indgå som en styringsparameter iet miljøledelsessystem. Den praktiske opgørelse af EPI foretages på basis afproduktionsdata sammenholdt med erfaringstal fra emissionsmålinger forenkeltprocesser og/eller på basis af massebalancer.
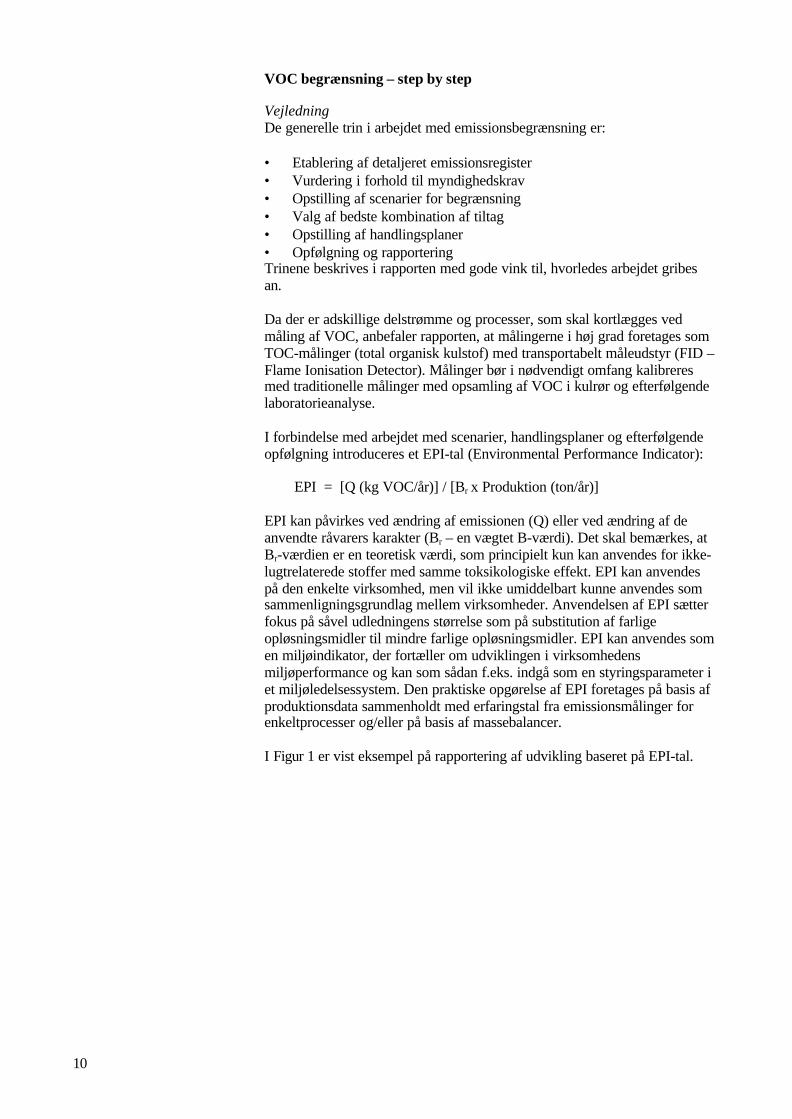
I Figur 1 er vist eksempel på rapportering af udvikling baseret på EPI-tal.

11
Figur 1Eksempel på udvikling i EPI-tal over tid og ved gennemførelse afhandlingsplaner.
Emissionsbegrænsende tiltag
KatalogKatalog over emissionsbegrænsende foranstaltninger er baseret påproduktions- og delaktiviteter angivet i Figur 2.
Levering afråvarer
5.1
Tappeanlæg5.7
Tankanlæg5.1
Filtrering5.8
Blandeanlæg Udstyr forrivning
5.2 5.5
Lager forblandekar
Færdigvare-tanke
5.3 5.6
Tappeanlæg Rengøring af kar, tanke og udstyr 5.9
5.4 5.10
Figur 2Typiske delaktiviteter i lak- og farveindustrien.
Tid
Plan 1 Plan 2
EPI = [Q (kg VOC/år)] / [Br x Produktion (ton/år)]

12
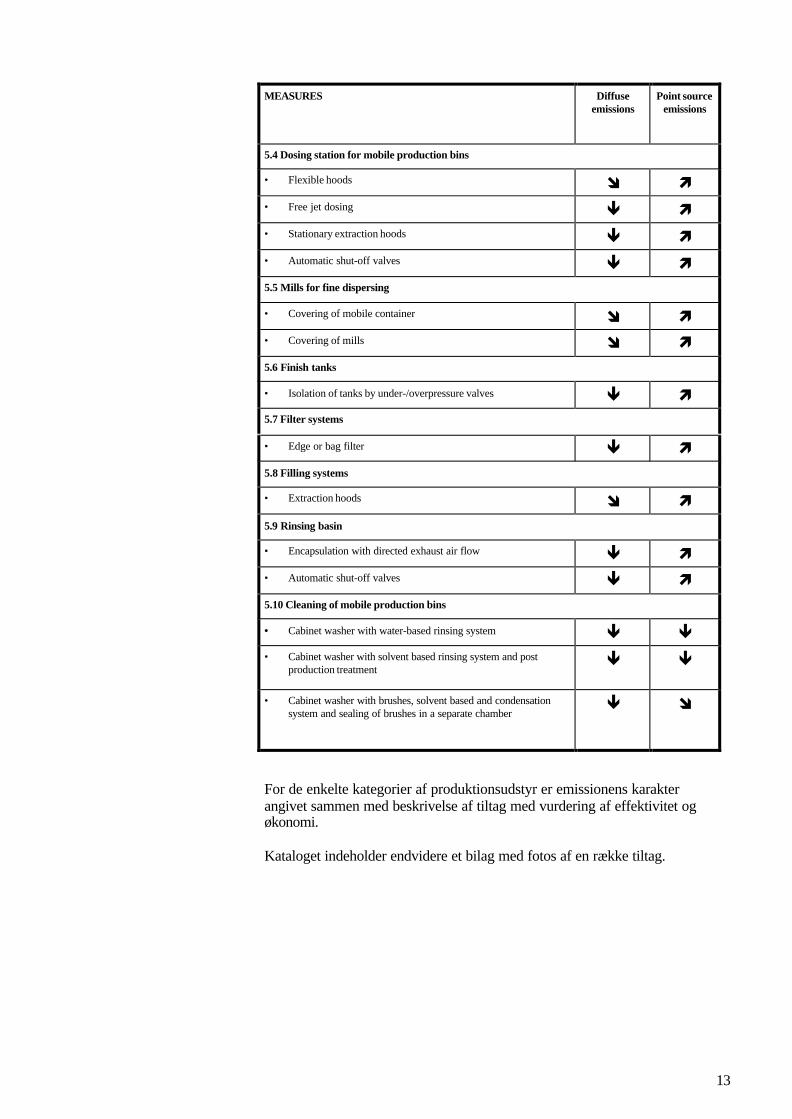
Katalogets enkelte elementer er oversigtligt angivet i Tabel 2. Betydning foremission fra punktkilder og diffus emission er indikeret med pile:
ê Reduktion af VOC koncentrationî Svag reduktion af VOC koncentrationì Svag stigning i VOC koncentrationé Stigning i VOC koncentration
Tabel 2Emissionsbegrænsende tiltag og deres betydning for diffuse emissioner ogpunktkilder.
MEASURES Diffuseemissions
Point sourceemissions
5.1 Unloading system for feedstock dosing and tankfarms
• Installation of a pressure equalizing line ê ê• Isolation of tank by fitting over-/under pressure valves ê ê5.2 Dissolver and reactor
• Feedstock charging via closed systems ê ì• Feedstock distribution and dosing via closed systems ê ì• Feedstock dosing or charging from mobile bins into partially closed
systemsî ì
• Feedstock dosing or charging from drums into partially closedsystems
î ì
• Interlocking of systems for extraction of solvents and particulates(e.g. no extraction when plant not operating)
ê ê
• Encapsulation of mobile bins during dispersing / mixing ê ì
• Encapsulation of dissolver and condensation ê ê• Encapsulation of dissolver ê é• Automation of dissolver cleaning ê é• Volumetric flow minimized by flow restrictors - î5.3 Holding store for mobile bins
• Covering of mobile bins î-
13
MEASURES Diffuseemissions
Point sourceemissions
5.4 Dosing station for mobile production bins
• Flexible hoods î ì• Free jet dosing ê ì• Stationary extraction hoods ê ì• Automatic shut-off valves ê ì5.5 Mills for fine dispersing
• Covering of mobile container î ì• Covering of mills î ì5.6 Finish tanks
• Isolation of tanks by under-/overpressure valves ê ì5.7 Filter systems
• Edge or bag filter ê ì5.8 Filling systems
• Extraction hoods î ì5.9 Rinsing basin
• Encapsulation with directed exhaust air flow ê ì• Automatic shut-off valves ê ì5.10 Cleaning of mobile production bins
• Cabinet washer with water-based rinsing system ê ê• Cabinet washer with solvent based rinsing system and post
production treatmentê ê
• Cabinet washer with brushes, solvent based and condensationsystem and sealing of brushes in a separate chamber
ê î
For de enkelte kategorier af produktionsudstyr er emissionens karakterangivet sammen med beskrivelse af tiltag med vurdering af effektivitet ogøkonomi.
Kataloget indeholder endvidere et bilag med fotos af en række tiltag.

14
15
Summary and conclusions
As summary parts of the text from the project article in the publication “NyViden”, issued by the Danish EPA are reproduced.
VOC-reduction - step by step - is possible
The lacquer and paint industry is able to reduce the emission of VOC’s(volatile organic compounds) to the working environment and the externalenvironment. This is documented in a report describing methods formapping, preparation and assessment of solution proposals as well aspreparation of final action plans. Reduction can take place through productdevelopment and changed planning of production including training ofemployees. However, in many situations there is a need for technicalinitiatives. As use for assessment hereof a catalogue has been prepared withdifferent emission limiting initiatives and expected efficiency and economyhas been assessed.
New requirements for the lacquer and paint industry
Background and purposeThe lacquer and paint industry in Denmark consists of approx. 20manufacturers of paints as well as approx. 10 manufacturers of glue andsealing compounds.
Under the auspices of the EC, two directives have been adopted which willbecome important for the environmental work within the paint industry.
EC-directive 1999/13/EC of 11 March 1999 makes a request for reduction ofthe VOC emission from among others the companies within this industry.The directive shall be implemented in the Danish legislation in March 2001at the latest. For the actual companies this will mean requests fordocumentation and set-up of action plans with a view to meet specifiedrequirements for emission from point sources and diffuse sources.
EC-directive 96/61/EC of 24 September 1996 about integrated preventionand abatement of pollution is implemented in Denmark with a new orderregarding approval of listed activities, The Danish Ministry of Environmentand Energy’s ministerial order no. 807 of 25 October 1999 (Miljø- ogEnergiministeriets bekendtgørelse nr. 807 af 25. oktober 1999). Theministerial order, clarifying the requirements for statement with regard to useof best accessible technique (BAT), will acquire an importance forcompanies in the situation of approval and by reassessment of approvalsformerly issued.
In 1994-1995 the Danish Paintmakers’ Association made a review of thepossibilities for using cleaner technology within the lacquer and paintindustry. Report regarding this review has previously been published/issuedas Trade Information for the lacquer and paint industry no. 5, 1996 from theDanish EPA (Brancheorientering for lak- og farveindustrien nr. 5, 1996 fraMiljøstyrelsen).
In continuation of the review in 1994-1995 the Danish Paintmakers’Association has completed a project with assessment of technicalpossibilities for reducing VOC emissions from manufacturing processes
16
within the lacquer and paint industry. The aim is to demonstrate thepossibilities being used and how the industry can work with the way ofpresenting the problems. Employees from Fichtner GmbH & Co. KG inGermany and Carl Bro a|s in Denmark have been consultants on the project.
The target group of the project is companies within the lacquer and paintindustry as well as the environmental authorities. The purpose has been tointroduce possibilities for initiatives at existing companies. More far-reaching initiatives primarily being possible in connection with a newestablishment are beyond this project.
The possibility of implementing the project is created by financial supportfrom the Danish EPA.
Collecting of relevant experiences
The projectThe main stress will be laid on method description for review, setting-up andassessment of solutions as well as the final action plan. As use for this worka catalogue has been elaborated with emission limiting initiatives. Thecatalogue describes solutions to different parts of the process withinformation of expected efficiency and economy.
There is a brief description of possibilities for reduction through productdevelopment and planning of production including training and education ofemployees.
A number of companies in Germany among suppliers of equipment andmanufacturers have kindly placed information, material and experience atour disposal for the project,
Two Danish companies Teknos Technology A/S and Akzo Nobel DecorativeCoatings A/S have participated in a group of experts having followed theproject.
The Danish EPA, the Danish Directorate for National Labour Inspection SiD(the General Workers Union in Denmark), the Association of CountyCouncils in Denmark and the Danish Paintmakers’ Association have beenrepresented in a steering committee.
Increase of demands
Main conclusionsIn order to understand the way of presenting the problems it is important tolook at the contents of the new VOC-directive.
The directive concerning reduction of the VOC-emission means for thelacquer and paint industry that companies with a consumption of VOC largerthan 100 tons/year shall:
• Prepare documentation through emission review• Describe the development up to the situation in 2007• Identify and describe initiatives meeting the demands of the directive• Establish initiatives to an extent as circumstances may require
The emission requirements for the companies in the lacquer and paintindustry are shown in table 1.

17
Table 1Limit value in EC-directive 1999/13/EC of 11 March 1999.
Consumptionof VOC,tons/year
Emission limit(point sources),mg C/norm. m3
Limit fordiffuseemissions, %
Limit for totalemissions, %
100-1,000> 1,000
150150
53
53
Note:• Emission limit cannot be compared directly with the values in the Air
Instruction (Luftvejledningen, the Danish EPA, 06/90), as this states mgsubstances per m3.
• The directive means that a company has to meet either the emissionlimit together with limit for diffuse emissions or limit for the totalemissions (emission limit for point sources can then be exceeded)
The VOC emissions can be grouped depending on how they leave theproduction facilities:
• Part of wastewater to sewer or through internal purifying plant• Part of solid waste to external disposal• Emission to the atmosphere, directly or as residues after air cleaning
The emissions to the atmosphere are of major importance and at the sametime is efficient reduction possible here. The primary sources for emissionsare:
• Tank facility, filling and storage• Filling of raw materials to production plant• Processes in mixing vessels etc.• Filling of semi-finished products and finished products• Diffuse exhaust from production equipment• Cleaning of equipment
In connection with set-up of action plans and combination of solutions it isnecessary to separate different airflows after air volume and concentration ofVOC. The separation can be used by choice of appropriate handling of eachairflow. Concentrated flows can possibly be incinerated with limited use ofsupport fuel. A solution with collection of all airflows could cause the factthat a considerable volume with low concentration of VOC had to beincinerated by means of continuous supply of support fuel.
It is important to emphasise the importance of the fact that the concreteaction plans have to be elaborated on the basis of the conditions at theindividual companies.
However, it is also important to stress that the manufacturers should plan along-term strategy for development of new products aiming at reducing theVOC emission, partly during production and partly at the customer. Thestrategy is planned on the basis of interplay between the demands of themarket, suppliers of raw materials and the manufacturer.

18
VOC reduction - step by step
InstructionThe general steps in the work with emission reduction are:
• Establishment of detailed emission register• Assessment in relation to requirements from authorities• Planning of scenarios for reduction• Choice of best combination of initiatives• Set-up of action plans• Follow-up and reporting
The steps are described in the report advising how the work can be initiated.
As there are several partial flows and processes having to be reviewed bymeasurement of VOC the report recommends that measurements to a largeextent are carried out as TOC-measurements (Total Organic Carbon) withtransportable measuring equipment (FID - Flame Ionisation Detector).Measurements should to the extent required be calibrated with traditionalmeasurements with collection of VOC on active carbon tubes andsubsequently laboratory analysis.
In connection with the work with scenarios, action plans and subsequentlyfollow-up an EPI-figure (Environmental Performance Indicator) isintroduced:
EPI = [Q (kg VOC/year)] / [Cr x Production (tons/year)]
EPI can be influenced by changing the emission (Q) or by changing thecharacter of the raw materials in use (Cr - a weighted C-value). It shall benoted that a Cr -value is a theoretical value in principle to be used only fornot odour-regulated substances with same toxicological effect. EPI can beused on each individual company, however it cannot be used directly asstandard of comparison between companies. The use of EPI brings both thesize of the emission and the substitution of dangerous solvents to lessdangerous solvents into focus. EPI can be used as environmental indicatorinforming about the development of the environmental performance of thecompany and as such may enter as a management parameter in anenvironmental management system. The practical making-up of EPI iscarried out on the basis of production data compared to experience figuresfrom emission measurements for single processes and/or on the basis ofmass balances.
An example of reporting of development based on EPI-figures is shown infigure 1.

19
Figure 1Example of development in EIP-figures over time and by implementation ofaction plans.
Emission limiting initiatives
CatalogueThe catalogue of emission limiting measures is based on productionactivities and partial activities indicated in figure 2.
Unloadingstation forfeedstock
5.1
Filling system5.7
Tankfarm5.1
Filter system5.8
Dissolver Mills for finedispersing
5.2 5.5
Holding storefor bins
Finishtanks
5.3 5.6
Dosing station Rinsing basin 5.9Container cleaning 5.10
5.4 Cleaning of mobile bins 5.10
Figure 2Typical partial activities within the lacquer and paint industry.
Tid
Plan 1 Plan 2
EPI = [Q (kg VOC/year)] / [Cr x Production (tons/year)]
20
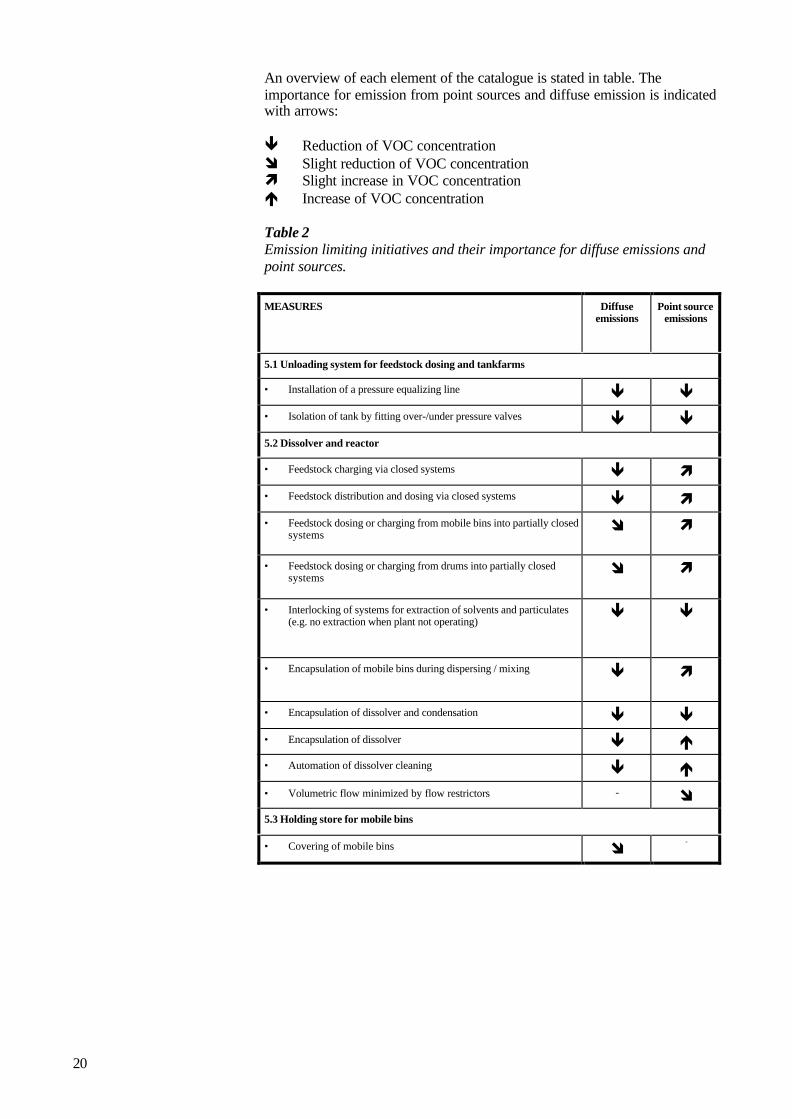
An overview of each element of the catalogue is stated in table. Theimportance for emission from point sources and diffuse emission is indicatedwith arrows:
ê Reduction of VOC concentrationî Slight reduction of VOC concentrationì Slight increase in VOC concentrationé Increase of VOC concentration
Table 2Emission limiting initiatives and their importance for diffuse emissions andpoint sources.
MEASURES Diffuseemissions
Point sourceemissions
5.1 Unloading system for feedstock dosing and tankfarms
• Installation of a pressure equalizing line ê ê• Isolation of tank by fitting over-/under pressure valves ê ê5.2 Dissolver and reactor
• Feedstock charging via closed systems ê ì• Feedstock distribution and dosing via closed systems ê ì• Feedstock dosing or charging from mobile bins into partially closed
systemsî ì
• Feedstock dosing or charging from drums into partially closedsystems
î ì
• Interlocking of systems for extraction of solvents and particulates(e.g. no extraction when plant not operating)
ê ê
• Encapsulation of mobile bins during dispersing / mixing ê ì
• Encapsulation of dissolver and condensation ê ê• Encapsulation of dissolver ê é• Automation of dissolver cleaning ê é• Volumetric flow minimized by flow restrictors - î5.3 Holding store for mobile bins
• Covering of mobile bins î-
21
MEASURES Diffuseemissions
Point sourceemissions
5.4 Dosing station for mobile production bins
• Flexible hoods î ì• Free jet dosing ê ì• Stationary extraction hoods ê ì• Automatic shut-off valves ê ì5.5 Mills for fine dispersing
• Covering of mobile container î ì• Covering of mills î ì5.6 Finish tanks
• Isolation of tanks by under-/overpressure valves ê ì5.7 Filter systems
• Edge or bag filter ê ì5.8 Filling systems
• Extraction hoods î ì5.9 Rinsing basin
• Encapsulation with directed exhaust air flow ê ì• Automatic shut-off valves ê ì5.10 Cleaning of mobile production bins
• Cabinet washer with water-based rinsing system ê ê• Cabinet washer with solvent based rinsing system and post
production treatmentê ê
• Cabinet washer with brushes, solvent based and condensationsystem and sealing of brushes in a separate chamber
ê î
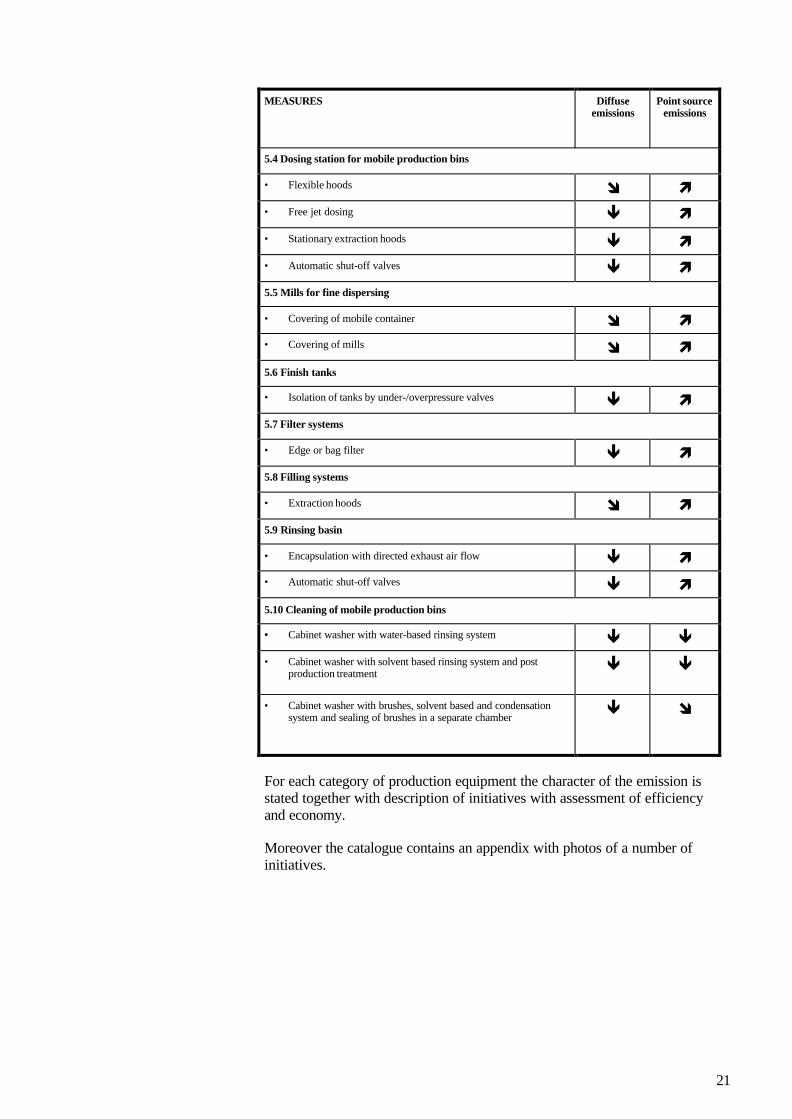
For each category of production equipment the character of the emission isstated together with description of initiatives with assessment of efficiencyand economy.
Moreover the catalogue contains an appendix with photos of a number ofinitiatives.

22
1 Introduction
In the production and use of solvent-containing paints and coatings,substantial quantities of VOCs are emitted to the surroundings. Therefore,for environmental protection, measures must be implemented to reduce theseemissions.
The best and most practical measure for reducing VOC emissions issubstitution by alternative and less critical solvents. In this connection,water-based paints and coatings are gaining in importance. Wheresubstitution of organic solvents is not possible, a further measure reductionof the proportion of organic solvents in the products may be considered, suchas the development of so-called “high solids” coatings.
Nevertheless, for certain applications currently no substitution possibilitiesfor organic solvents are foreseeable. For this reason, over both the short andmedium terms, solvent-containing products will continue to be used. Whenmanufacturing solvent-containing paints and coatings, VOCs are emitted atvarious points during the production process.
Prior to constructing costly air pollution purification plants, measures forreducing the emissions of VOCs as well as for reducing the volumetric flowshould be implemented. Apart from these purely economic considerations,regarding the implementation of emission reduction measures, also othercriteria like practicability (no negative effects on operation, access, etc.),ecology (abatement of solvent emissions), safety, and so on have to be takeninto account.
To give manufacturers of solvent-based paints and coatings a basis forcoming to a decision on new investments in production facilities and/orpollution abatement technology, the Danish Paintmakers Association hasinitiated the project:
"Cleaner technology in the lacquer and paint industry"
with one report concerned with “VOC emissions from manufacturingprocesses” and another report with “Water-based cleaning of mixing vesselsand equipment”.
The general aim of the project is to qualify the individual companies withinthe industry to plan and to implement technology in the manufacturing phasethat is actually cleaner.
The results of the study “VOC emissions from manufacturing processes” aredescribed in this report.
In the study “Water-based cleaning of mixing vessels and equipment”- thefocus will be on the possibilities of using water-based cleaning of mixingvessels and equipment, and to provide companies with a sound basis whenconfronted with new investments in cleaner water-based technology. Bothreports are available on the Internet - www.mst.dk - homepage of the DanishEPA (Danish versions) and on – www.fdlf.dk - homepage of the DanishPaintmakers’ Association (English versions).
The project period was from January 1999 to February 2000.
23
The project has been carried out by Fichtner · Carl Bro a|s, with thepartic ipation of representatives from the companies Teknos Technology A/Sand Akzo Nobel Decorative Coatings A/S.
1.1 Description of problem
The application, and release, of volatile organic compounds can, due to theirproperties, cause harm to human health and/or contribute to local or trans-boundary formation of photochemical oxidants in the boundary layers of thetroposphere, leading to environmental degradation.
To prevent, or mitigate, emissions of volatile organic compounds over thelong term, in March 1999 the European Communities issued Directive1999/13/EC of the Commission on the Limitation of Emissions of VolatileOrganic Compounds, referred to in the following as the VOC Directive. Thisrequires registration of all plants or plant components covered by thisDirective. Furthermore, their operators must initiate measures, within thestated transition periods and as far as necessary, to prevent or reduce VOCemissions.
The purpose of this study is to identify measures integrated into theproduction process for cutting VOC emissions from point and diffusesources specifically for enterprises manufacturing solvent-based paints andcoatings, and to assess these under the aspects of efficiency and costs.
Process integrated measures mean technical and organizational measures forpreventing emissions directly at their sources, or by means of whichemissions are reduced, extracted and directed to treatment or disposal.
This is contrasted with post-production pollutant destruction and exhaust airclean-up, which is not the subject of this Study. Photos in Appendix B showan example of a postproduction cleaning plant.
Particularly of interest in this connection are the following production units:
• unloading stations for feedstocks• tankfarms• production equipment, like dissolvers, mills, finish tanks, filters, dosing
stations• holding stores for mobile bins• rinsing basins for special tools• cleaning cabinets for mobile bins, drums and containers Measures for preventing and/or mitigating solvent-containing emissions canbe classified under the following headings: • process-integrated measures• product development• production planning
The purpose of thestudy
Production unitsat interest
24
2 Environmental Regulation
2.1 National legislation and EC directives
As noted in the introduction, March 1999 Directive 1999/13/EC of theEuropean Commission was promulgated. This addresses limitation ofemissions of volatile organic compounds arising due to certain activities andin specific plants when organic solvents are used.
The VOC Directive will be implemented in national legislation before 30March 2001.
Granting of a permit to operate a plant for the manufacture of paints andcoatings in Denmark is currently regulated essentially by the followingguidelines, laws and ordinances:
• Order regarding approval of listed activities (Bekendtgørelse nr. 807 af25. oktober 1999 om godkendelse af listevirksomhed) 1
• Guidelines for approval of listed activities (Vejledning nr. 3, 1993 omgodkendelse af listevirksomhed) 2
• DEPA: Industrial Air Pollution Control Guidelines No. 9/1992(Vejledning nr. 6 1990 om begrænsning af luftforurening fravirksomheder). A revision is planned issued in 2000
• Information from DEPA, no. 15, 1996 C-values - Industrial AirPollution (B-værdier)
Subject to their amendment in connection with implementation of Directive1999/13/EC, these ordinances and guidelines will continue to apply innational legislation. The VOC Directive affects in particular large and medium-sized plantsthough for a few sectors – like vehicle refinishing – also small-sized plantsare covered due to the particular features of these sectors. For plants emitting certain dangerous substances e.g. chlorinated solventsspecial limit values apply. The paint and coatings industry, that is the manufacturers of coatingsubstances, clear varnishes, printing inks and adhesives, is, according toAppendix I of the VOC Directive, affected if they use more than 100 t/a ofsolvents. These enterprises are now confronted with the challenging tasks of: • Documenting their solvent situation with a high degree of transparency
so as to allow tracking of these substances• Projecting their market situation in 2007 - product range, production
volumes - under the aspect of the future solvent balance
• Identifying measures needed for compliance with the VOC Directiveand evaluating these under their cost aspects
• As far as necessary, initiating measures to cut VOC emissions
1 For plants having a production capacity exceeding 3000 tons per year.2 Compiled under the previous regulation.
Danish legislation
The VOC Directive

25
2.2 VOC limits and threshold values
According to the Danish legislation the limits and threshold values in Table2.1 apply.
Table 2.1Mass flow limits and emission limits for companies that emit organics substances(Industrial Air Pollution Control Guidelines No. 9/1992). In the air pollutionguidelines a C-value is fixed as a mean hourly value that must not be exceeded bymore than about seven hours a month, i.e. 1% of the time.
Class C-valuemg/m3
Mass flowg/h
Emission limitmg/normal m3
I < 0,01 100 5II > 0,01 < 0,2 2.000 100III > 0,2 6.250 300
Additionally, enterprises in the paint and coatings industry as well asmanufacturers of coating materials, clear lacquers, printing inks andadhesives using more than 100 t/a solvent must, according to the new VOCDirective and after the transition limits stipulated in this have elapsed,comply as a minimum with the threshold values and limits for solvents asshown in Table 2.2.
Table 2.2Threshold values and limits for solvents in accordance with Directive 1999/13/EC,Appendix II A. The regulation means that each company shall fulfil the limits forexhaust gases and diffuse emissions or the total emission limit (then the limit forexhaust gases can be exceeded.)
No. Activity Thresholdvalue
t/a
Emissionslimit
for exhaustgases
mg C/n. m³
Limits fordiffuse
emissions%
Totalemission
limit%
17 Manufacture ofcoatingmaterials, clearlacquers,printing inksand adhesives
100-1,000>1,000
150150
53
53
It may be assumed that more stringent limit or threshold values arising fromthe specific situation at the site or from any other officially imposedconditions will continue to apply.
2.3 Implementation of the VOC Directive
Apart from the above threshold and limit values, key components of theVOC Directive are:
• Elaboration of a reduction plan as per Appendix II B, which will allowoperators to take other measures to cut emissions by the same amountthat would have been attained by application of the emission standards(in this connection, operators can apply any emissions reduction plan)
• Compilation of a solvent balance, to serve for the responsible regulatoryauthorities and the general public as a basis for checking compliance
Key components ofthe VOC Directive
26
with emissions standards and for determining which reduction optionsare open
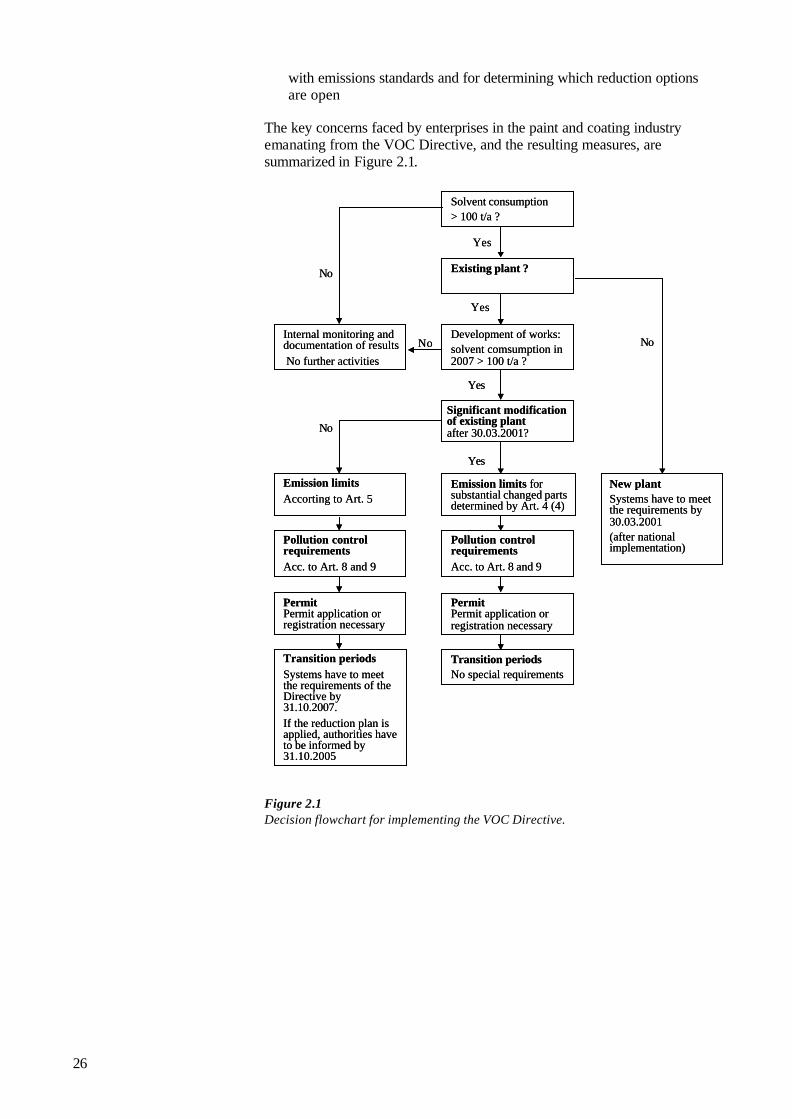
The key concerns faced by enterprises in the paint and coating industryemanating from the VOC Directive, and the resulting measures, aresummarized in Figure 2.1.
Figure 2.1Decision flowchart for implementing the VOC Directive.
Solvent consumption > 100 t/a ?
Development of works: solvent comsumption in 2007 > 100 t/a ?
Significant modification of existing plantafter 30.03.2001?
Internal monitoring and documentation of resultsNo further activities
Emission limits for substantial changed parts determined by Art. 4 (4)
Yes
Yes
No
No
Emission limitsAccorting to Art. 5
New plantSystems have to meet the requirements by 30.03.2001(after national implementation)
Yes
No
Pollution control requirementsAcc. to Art. 8 and 9
Permit Permit application or registration necessary
Pollution control requirements Acc. to Art. 8 and 9
Permit Permit application or registration necessary
Transition periodsNo special requirements
Existing plant ?
No
Transition periodsSystems have to meet the requirements of the Directive by 31.10.2007.If the reduction plan is applied, authorities have to be informed by 31.10.2005
Yes
27
3 Approaches to Cutting VOCEmissions
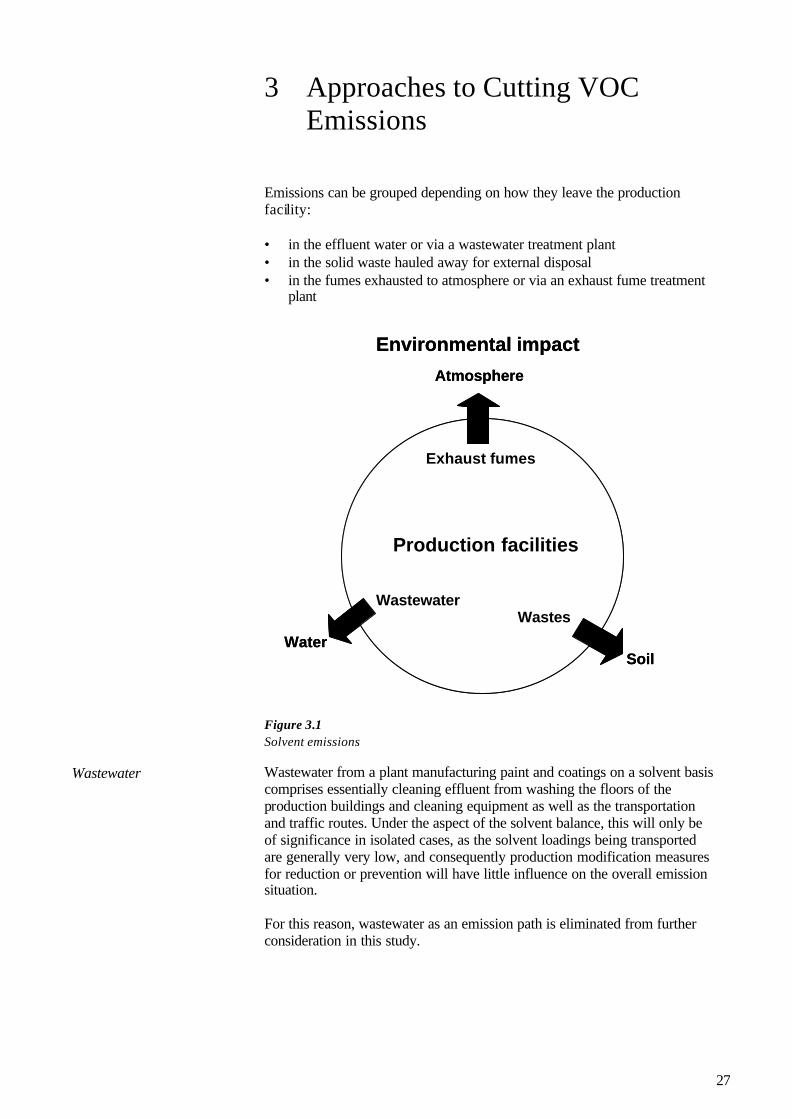
Emissions can be grouped depending on how they leave the productionfacility:
• in the effluent water or via a wastewater treatment plant• in the solid waste hauled away for external disposal• in the fumes exhausted to atmosphere or via an exhaust fume treatment
plant
Figure 3.1 Solvent emissions Wastewater from a plant manufacturing paint and coatings on a solvent basiscomprises essentially cleaning effluent from washing the floors of theproduction buildings and cleaning equipment as well as the transportationand traffic routes. Under the aspect of the solvent balance, this will only beof significance in isolated cases, as the solvent loadings being transportedare generally very low, and consequently production modification measuresfor reduction or prevention will have little influence on the overall emissionsituation. For this reason, wastewater as an emission path is eliminated from furtherconsideration in this study.
Wastewater
Environmental impact
Production facilities
Atmosphere
Exhaust fumes
Water
Wastewater
Soil
Wastes
Environmental impact
Production facilities
Atmosphere
Exhaust fumes
Water
Wastewater
Soil
Wastes

28
The solid waste arising in a paints and coatings manufacturing plantcomprises essentially disposable packaging, transportation drums as well assedimentation and filtration residues. These are likewise of importance forthe solvent balance and the overall emissions situation only in isolated cases,and are therefore not considered further. Effective prevention and/or reduction of solvent emissions is only possiblein connection with fume extraction and exhaust. A basic distinction is made between point and diffuse emission sources. Apoint source is a specific outlet through pipe or stack. Point sources are oftenestablished by compulsory ventilation. Diffuse emissions are not related tospecific outlets. For instance diffuse discharges, such as emissions fromvessels and tanks not furnished with compulsory ventilation. The determining causes of emissions in a paint and coatings manufacturingplant are: • displacements of solvent-laden air when filling and emptying road and
rail tankers• respiration losses at tanks in general• displacement of solvent-laden air when dosing tanks and dissolvers with
feedstocks• emissions as temperature rises due to chemical reactions or shearing
forces in reactors and dissolvers• displacement of solvent-laden air when decanting and filling
intermediate and final products• diffuse emissions from systems and components that are open or only
partially closed• cleaning of stationary tanks and dissolvers• cleaning of mobile tanks and small parts
As a rule, the originators of emissions of volatile organic compounds aresolvents and binding agents.
Solid waste
Fume extraction andexhaust
Causes of emissions
29
4 VOC Reduction, Step by Step
4.1 Introduction
This chapter presents a practical and effective method to reduce emissions ofVOCs to the atmosphere.
Every company is different from other companies, and the described methodshould be regarded as a guideline that can be modified according to thenature and needs of each company.
The reduction of VOC serves two main purposes:
1. To comply with present and future regulation (see chapter 2)regarding:
• emission concentrations• immission contribution
2. To reduce the impact on the environment to the extent possible withregard to technical and economical possibilities.
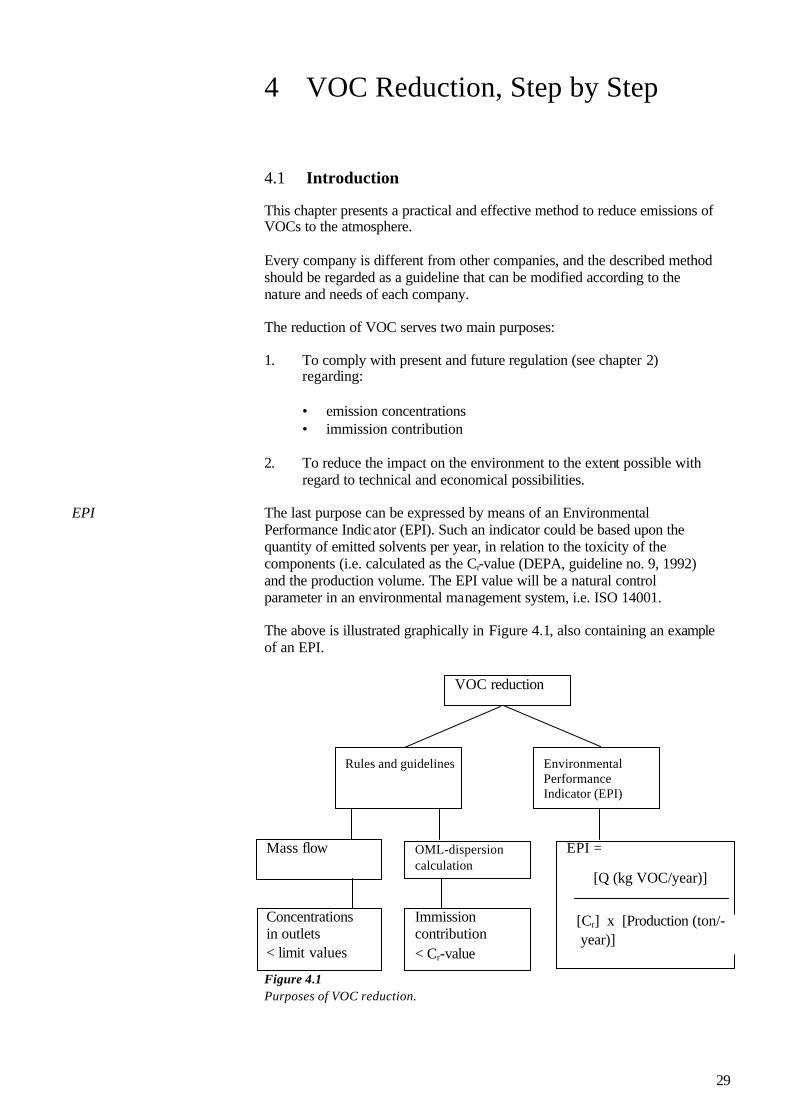
The last purpose can be expressed by means of an EnvironmentalPerformance Indicator (EPI). Such an indicator could be based upon thequantity of emitted solvents per year, in relation to the toxicity of thecomponents (i.e. calculated as the Cr-value (DEPA, guideline no. 9, 1992)and the production volume. The EPI value will be a natural controlparameter in an environmental management system, i.e. ISO 14001.
The above is illustrated graphically in Figure 4.1, also containing an exampleof an EPI.
Figure 4.1Purposes of VOC reduction.
EPI
VOC reduction
EnvironmentalPerformanceIndicator (EPI)
Rules and guidelines
Mass flow OML-dispersioncalculation
Immissioncontribution< Cr-value
Concentrationsin outlets< limit values
EPI =
[Q (kg VOC/year)]
[Cr] x [Production (ton/- year)]

30
The EPI will require measurements of VOC concentrations but only in thebeginning. Afterwards simulations by spreadsheets can be used and onlyvery few measurements are needed.
The Cr-value is a theoretical value to be used only in cases with toxicologicalsubstances (not odour-related) with the same effect.
Activities to fulfil above purposes cannot and should not be handledseparately but should be regarded as an integrated process. In practice, thismeans that intermediate reduction methods always should fit into an overallprogram for fulfilling future reduction goals. This will be illustrated in thenext chapter.
4.2 General methodology
Methods for reduction of VOC can be grouped into two categories:
1. Cleaner technology methods (reduction at the source), includingsubstitution
2. Traditional methods (end of pipe solutions), i.e. incineration
Ideally, all reductions should be managed by means of cleaner technologymethods or by means of Best Available Technology (BAT). Practise hashowever shown that in general it is not possible to use only such methods toobtain compliance with rules and guidelines. This is especially the case inrelation to older existing plants.
Practise has also shown that using cleaner technology methods before havinga total view of the future reduction needs can lead to a substantial increase inthe total investment and operation cost for the emission reduction system.
An example is reduction of the concentration of VOC in certain outlets,which are later being combined with other outlets to be cleaned by anincineration plant and where fuel is necessary to maintain the properincineration temperature. In such a case, it would had been better both froman economic - and also often from an environmental viewpoint to maintainthe high VOC concentration and thus reduce (or avoid) the use of e.g. naturalgas to obtain the demanded incineration temperature.
This example illustrates the very importance of having a total view of thewhole situation before deciding what methods to use for the reduction ofVOCs.
The recommended methodology in emission reduction is:
1. Survey of present status including detailed knowledge of emissionsfrom all sources
2. Control of compliance with present and future demands regardingemission concentrations and immission contribution
3. Setting up of different scenarios with different combinations ofreduction means (by use of “Reduction Catalogue”, see chapter 5). Foreach scenario control of compliance with rules and guidelines shouldbe made
Methods forreduction of VOCemissions
Methodology inemission reduction
31
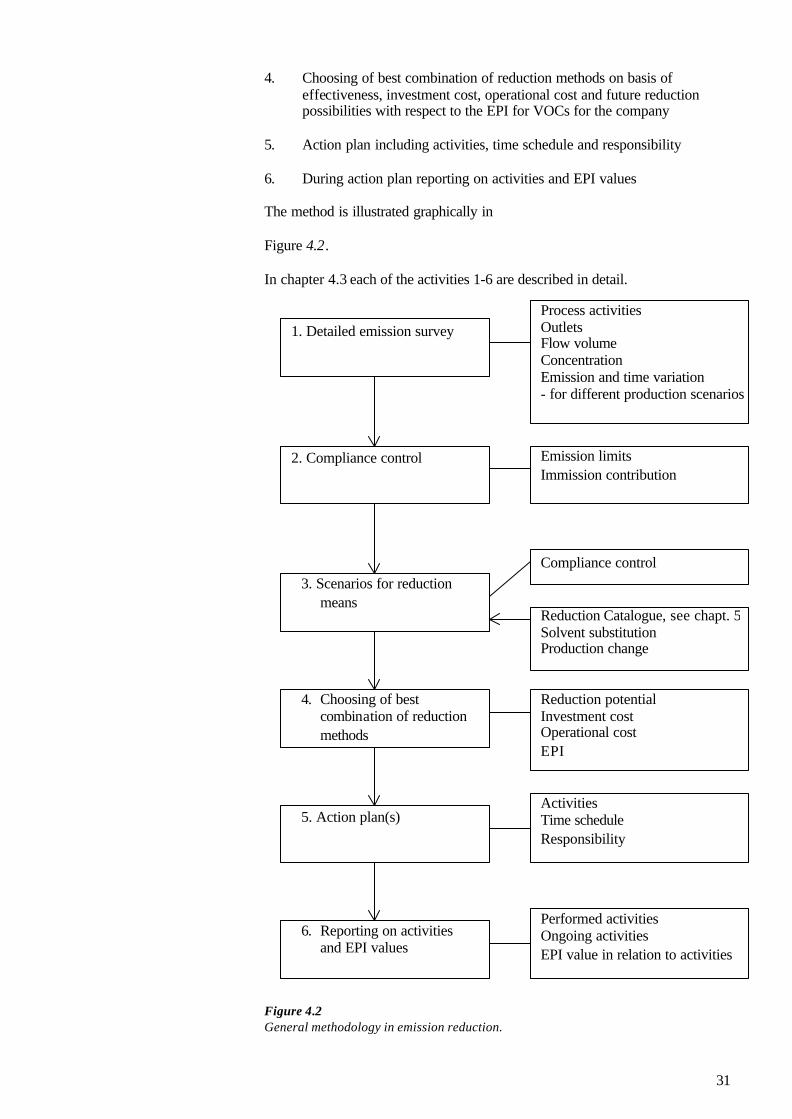
4. Choosing of best combination of reduction methods on basis ofeffectiveness, investment cost, operational cost and future reductionpossibilities with respect to the EPI for VOCs for the company
5. Action plan including activities, time schedule and responsibility
6. During action plan reporting on activities and EPI values
The method is illustrated graphically in
Figure 4.2.
In chapter 4.3 each of the activities 1-6 are described in detail.
Figure 4.2General methodology in emission reduction.
6. Reporting on activitiesand EPI values
1. Detailed emission survey
2. Compliance control
3. Scenarios for reductionmeans
4. Choosing of bestcombination of reductionmethods
5. Action plan(s)
Emission limitsImmission contribution
ActivitiesTime scheduleResponsibility
Performed activitiesOngoing activitiesEPI value in relation to activities
Reduction potentialInvestment costOperational costEPI
Compliance control
Process activitiesOutletsFlow volumeConcentrationEmission and time variation- for different production scenarios
Reduction Catalogue, see chapt. 5Solvent substitutionProduction change
32
(Pipe)
4.3 Detailed methodology
In the following, each of the activities mentioned in chapter 4.2 and thecorresponding
Figure 4.2 are described in detail.
4.3.1 Detailed survey of emissions from all sourcesThis is the most important activity as it gives the whole foundation for allfuture activities. The work is time-consuming, but it is very important tounderstand that only a detailed knowledge of the emissions and the relationsto the production can give the background for optimum reduction activities(effectiveness, costs, and future production flexibility).
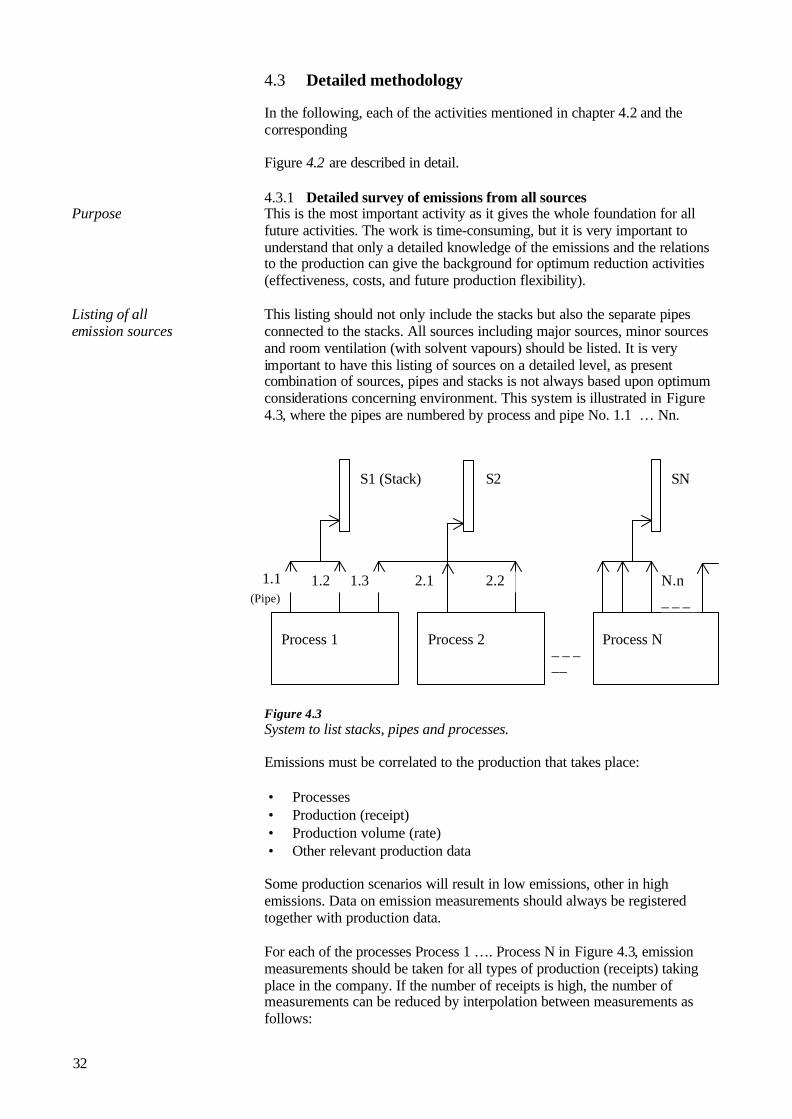
This listing should not only include the stacks but also the separate pipesconnected to the stacks. All sources including major sources, minor sourcesand room ventilation (with solvent vapours) should be listed. It is veryimportant to have this listing of sources on a detailed level, as presentcombination of sources, pipes and stacks is not always based upon optimumconsiderations concerning environment. This system is illustrated in Figure4.3, where the pipes are numbered by process and pipe No. 1.1 … Nn.
Figure 4.3System to list stacks, pipes and processes.
Emissions must be correlated to the production that takes place:
• Processes• Production (receipt)• Production volume (rate)• Other relevant production data
Some production scenarios will result in low emissions, other in highemissions. Data on emission measurements should always be registeredtogether with production data.
For each of the processes Process 1 …. Process N in Figure 4.3, emissionmeasurements should be taken for all types of production (receipts) takingplace in the company. If the number of receipts is high, the number ofmeasurements can be reduced by interpolation between measurements asfollows:
Purpose
Listing of allemission sources
Process 1 Process 2 Process N_ _ ___
2.11.31.1 1.2 2.2 N.n_ _ _
S1 (Stack) S2 SN
33
1. Production (receipt) with low emission values2. Production (receipt) with medium emission values3. Production (receipt) with high emission values
If interpolation is used, it is recommended that the difference between thelowest and highest emission does not exceed a factor 2. If this not is the case,the number of measurements must be increased. Interpolation betweendifferent measurements can be done on basis of vapour pressure.
As the emission varies during the time of production, it is important that theemission measurements are performed continuously over the productionperiod. This can be obtained by taking a high number of samples onactivated carbon tubes. This method is both very time-consuming and veryexpensive.
A better, easier and more economical method is to use TOC (Total OrganicCarbon) measurements by use of a portable FID (Flame Ionisation Detector).
It is a practical experience, that TOC measurements are more reliable thanmeasurements of VOC (by use of carbon tubes). The emission values caneasily be calculated into VOC concentrations by knowledge of the mixtureof the solvents. Use of TOC measurements are especially of high value foremissions varying with time, which is the case for the processes dealt with inthis report.
Based upon the TOC measurements, calibration data, and knowledge on thecomposition of the solvents in the actual process (the distribution of thedifferent solvents), it is possible to calculate the actual concentration in thegas in mg VOC/m3. (The detailed calculation method is not described in thepresent text – but can in most cases be found in the manual of the measuringinstrument).
Data can be registered in a spreadsheet as shown in Table 4.1 and Table 4.2.When all data have been collected, it is possible to simulate differentproduction scenarios, i.e. different combinations of processes and receipts.By using the “SORT” and “SUM” functions in the spreadsheet, theemissions from the different processes and stacks can be separated.
Such scenarios should be performed for several (realistic) combinations ofprocesses, receipts and time-relation.
In Table 4.1 and Table 4.2 simple examples are given on a scenario sortedby process (
Emissionmeasurements
34
Table 4.1) and by stacks (Table 4.2).
Table 4.1 is a spreadsheet which can be sorted in different ways. Thespreadsheet gives detailed information for all streams for specific processes,i.e. combination of process, receipt, pipe and stack. (More pipes to onestack). The emissions for each separate pipe are given on concentration basisand on emission basis, both related to time (i.e. exceeding 8 hours). Thespreadsheet gives a good overview of the emission situation. It will forexample be possible to access whether or not it can be a good idea tocombine the separate pipes to other stacks (i.e. to collect high concentrationsto an incineration unit and low concentrations to a direct outlet).

35
Table 4.1Example of scenario with 3 processes sorted by processes. (Concentration values are not shown.)
Pro-cessno.
Re-ceiptno.
Stackno.
Pipeno.
Flown.m3/h
Temp.oC
Cr-valuemg/m3
of gas
Concentration (mgVOC/m3), time-related data(8 periods)
Emission (g VOC/sec.)time-related data(8 periods)
1 9 1 1.1 1000 40 0.2 1 2 3 4 3 2 1 11 9 1 1.2 1000 60 0.2 2 2 2 2 2 2 2 01 9 2 1.3 2000 30 0.2 0 1 2 3 4 3 1 1Sum 4000 3 5 7 9 9 7 4 22 7 2 2.1 2000 20 0.15 1 1 1 1 1 1 1 12 7 2 2.2 2000 20 0.15 1 2 3 5 7 5 4 2Sum 4000 2 3 4 6 8 6 5 33 5 3 3.1 3000 60 0.1 1 1 1 1 1 1 1 13 5 3 3.2 1000 40 0.1 2 2 2 2 2 2 2 23 5 3 3.3 2000 40 0.1 1 2 3 4 1 1 1 13 5 8 3.4 4000 20 0.1 0 0 1 1 0 0 0 0Sum 10000 4 5 7 8 4 4 4 4
Cr-value: Calculated in accordance to DEPA Guideline no. 9, 1992 on basis of composition of gas mixture(approximately = composition of process mixture of solvents). The Cr-value for mixture of gases is calculatedon basis of the concentration and the flow in each stream.
Table 4.2Example of scenario with 3 processes sorted by stacks. (Concentration values are not shown)
Pro-cessno.
Re-ceiptno.
Stackno.
Pipeno.
Flown.m3/h
Temp.oC
Cr-valuemg/m3
of gas
Concentration (mgVOC/m3), time-relateddata (8 periods)
Emission (g VOC/sec.)time-related data(8 periods)
1 9 1 1.1 1000 40 0.2 1 2 3 4 3 2 1 11 9 1 1.2 1000 60 0.2 2 2 2 2 2 2 2 0Sum 2000 3 4 5 6 5 4 3 11 9 2 1.3 2000 30 0.2 0 1 2 3 4 3 1 12 7 2 2.1 2000 20 0.15 1 1 1 1 1 1 1 12 7 2 2.2 2000 20 0.15 1 2 3 5 4 5 4 2Sum 6000 2 4 6 9 9 9 6 43 5 3 3.1 3000 60 0.1 1 1 1 1 1 1 1 13 5 3 3.2 1000 40 0.1 2 2 2 2 2 2 2 23 5 3 3.3 2000 40 0.1 1 2 3 4 1 1 1 1Sum 6000 4 5 6 7 4 4 4 43 5 8 3.4 4000 20 0.1 0 0 1 1 0 0 0 0
Cr-value: Calculated in accordance to DEPA Guideline no. 9, 1992 on basis of composition of gas mixture(approximately = composition of process mixture of solvents). The Cr-value for mixture of gases is calculatedon the basis of the concentration and the flow in each stream.
4.3.2 Control of compliance with present and future limit valuesThe purpose of this activity is to control compliance with existing rules andguidelines and with conditions in environmental permits.
Control of compliance is made on basis of the emission scenarios. Emissionscenarios can be chosen among the scenarios performed in chapter 4.3.1.
The emission scenarios used for control should be the scenarios with thehighest emissions and lowest Cr-values estimated by the factor [Emissiong/sec.]/[Cr-value]. The scenario with the highest value is the most criticalscenario.
Purpose
Activities
36
The emission is the total emission from all processes and stacks, and the Cr-value is the total value calculated on basis of the formula in DEPA guidelineno. 9, 1992.
Control of compliance is performed in accordance with DEPA guideline no.9, 1992. The mass flow is determined as the [Total flow in kg/working shift]/[Number of hours in working shift] before cleaning (incineration etc.). Themass flow is easily calculated by use of the emission spreadsheet.
If the mass flow is above the limit given in DEPA guideline no. 9, 1992, allemission concentrations should be below the emission limit for the differentclasses of organic solvents.
This is controlled on basis of the emission spreadsheet where it is possible tocalculate the hourly mean value of the concentrations in the different stacksfor the relevant production scenarios.
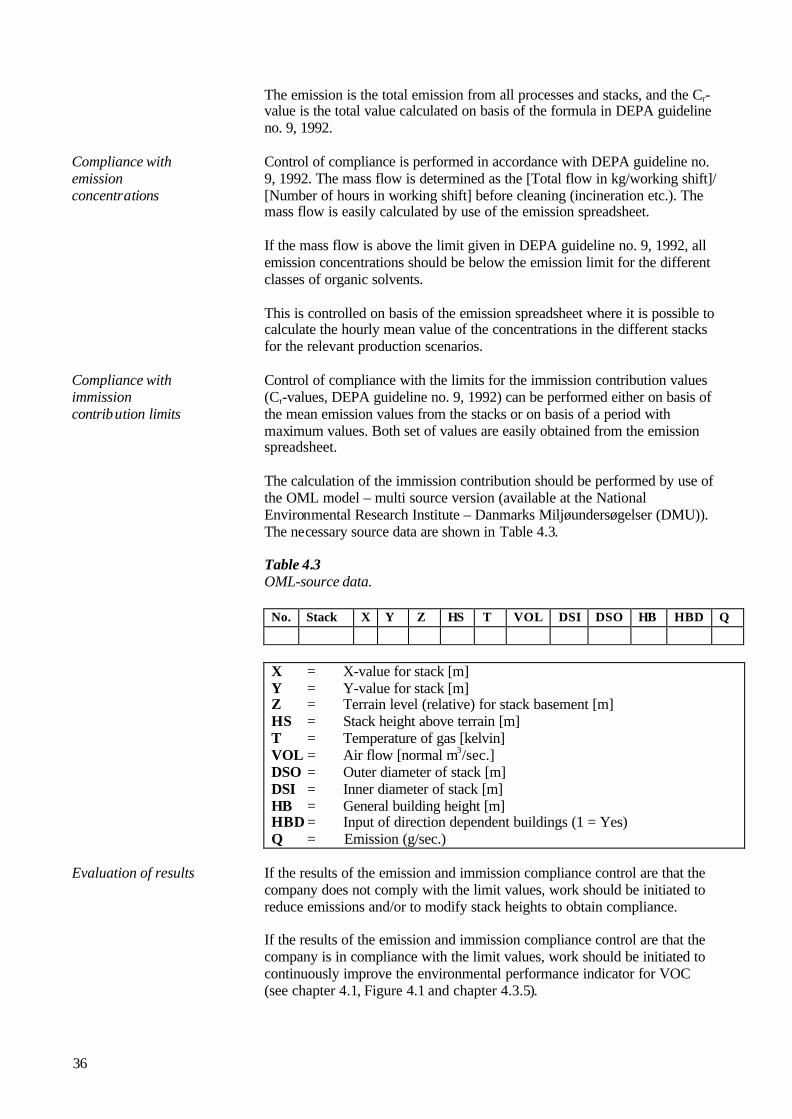
Control of compliance with the limits for the immission contribution values(Cr-values, DEPA guideline no. 9, 1992) can be performed either on basis ofthe mean emission values from the stacks or on basis of a period withmaximum values. Both set of values are easily obtained from the emissionspreadsheet.
The calculation of the immission contribution should be performed by use ofthe OML model – multi source version (available at the NationalEnvironmental Research Institute – Danmarks Miljøundersøgelser (DMU)).The necessary source data are shown in Table 4.3.
Table 4.3OML-source data.
No. Stack X Y Z HS T VOL DSI DSO HB HBD Q
X = X-value for stack [m]Y = Y-value for stack [m]Z = Terrain level (relative) for stack basement [m]HS = Stack height above terrain [m]T = Temperature of gas [kelvin]VOL = Air flow [normal m3/sec.]DSO = Outer diameter of stack [m]DSI = Inner diameter of stack [m]HB = General building height [m]HBD = Input of direction dependent buildings (1 = Yes)Q = Emission (g/sec.)
If the results of the emission and immission compliance control are that thecompany does not comply with the limit values, work should be initiated toreduce emissions and/or to modify stack heights to obtain compliance.
If the results of the emission and immission compliance control are that thecompany is in compliance with the limit values, work should be initiated tocontinuously improve the environmental performance indicator for VOC(see chapter 4.1, Figure 4.1 and chapter 4.3.5).
Compliance withemissionconcentrations
Compliance withimmissioncontribution limits
Evaluation of results

37
4.3.3 Setting up of different reduction scenariosThe purpose of this activity is to give the best background for choosing thebest combination of reduction methods.
If the company not is in compliance with the limit values for VOCs, theprocedure is as shown in Figure 4.4
Figure 4.4The procedure when the company is not in compliance with the limit values.
Only scenarios capable of fulfilling compliance should be regarded.In finding the best solutions, it is often advisable to review the differentstreams (pipes) of VOC flows and to assess if other combinations of pipesand stacks would be more relevant. This is specially the case whenincineration is necessary. Here it is of utmost importance to obtain as highconcentrations as possible to reduce the need for supply energy (for examplenatural gas).
If the company already is in compliance, it should look upon how to reducethe impact on the environment by reducing the value of relevant EPI. This isillustrated in Figure 4.5, where the dynamic relationship between thedifferent parameters in the EPI formula, the reduction possibilities and thecorresponding action plans are shown.
The illustrated EPI should only be regarded as an example.
For use of action plans, please refer to chapter 4.3.5 and for reporting of EPIchapter 4.3.4.
Purpose
Activities
Description of reduction methods
Calculation of emissions
Formation of emission spreadsheet(chapter 4.3.1)
Control of compliance(chapter 4.3.2)
ReductionCatalogue,chapter 5
Solventsubstitution
Productionchange
Solvent substitutionProduction changeCleaner technologyIncinerationStack height

38
Figure 4.5From EPI to action plans.
4.3.4 Choosing the best reduction scenarioIn general, there is no specific method to choose the best combination ofmethods for VOC reduction, but some general advice can be given.
The different scenarios are compared by a number of parameters regardingreduction efficiency, costs, production related parameters etc.
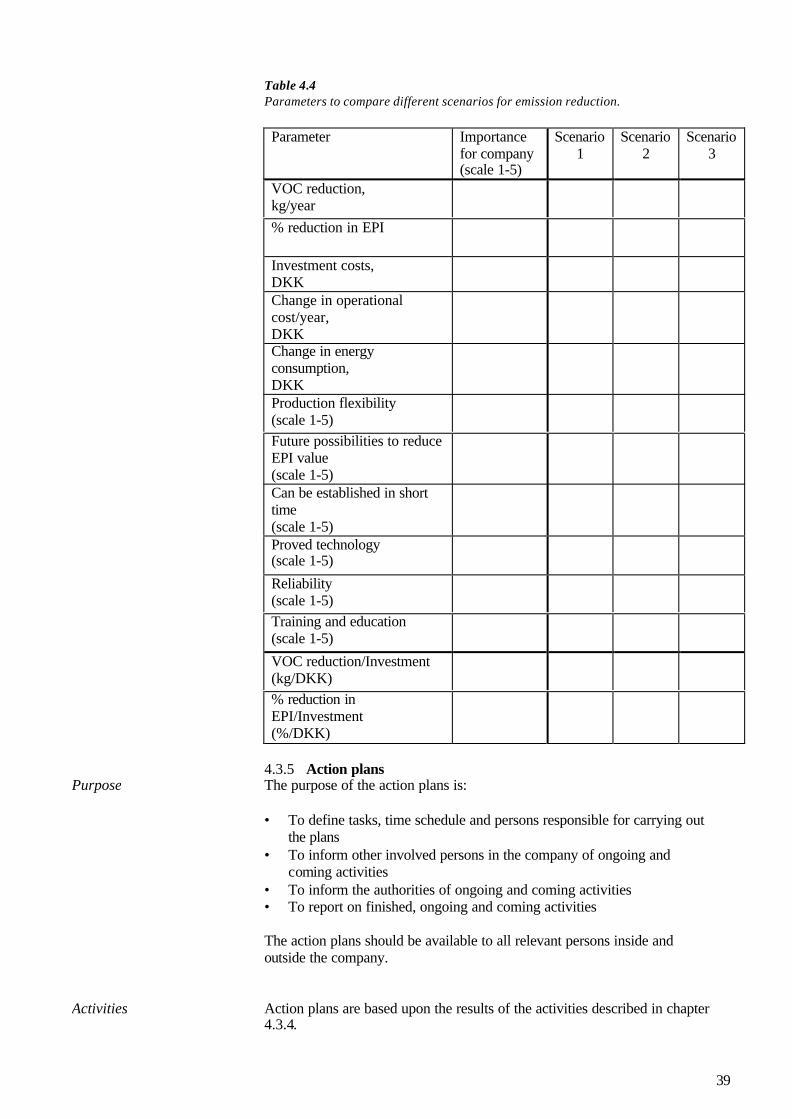
The different scenarios can be compared as illustrated in Table 4.4.
The parameters used are only examples. Choosing of scenario can be madeon basis of the parameters and the importance of each parameter for thecompany. Common sense and knowledge of present and future needs for thecompany should be used in this process.
Purpose
Activities
[Q (kg VOC/year)]____________________
[Cr] x [Production (ton/year)]
EPI =
Emission reduction
Substitution Marketing(non and low solvent products)
Research Marketing
Action Plan
Action Plan
Action Plan
Action Plan
39
Table 4.4Parameters to compare different scenarios for emission reduction.
Parameter Importancefor company(scale 1-5)
Scenario1
Scenario2
Scenario3
VOC reduction,kg/year% reduction in EPI
Investment costs,DKKChange in operationalcost/year,DKKChange in energyconsumption,DKKProduction flexibility(scale 1-5)Future possibilities to reduceEPI value(scale 1-5)Can be established in shorttime(scale 1-5)Proved technology(scale 1-5)
Reliability(scale 1-5)Training and education(scale 1-5)
VOC reduction/Investment(kg/DKK)% reduction inEPI/Investment(%/DKK)
4.3.5 Action plansThe purpose of the action plans is:
• To define tasks, time schedule and persons responsible for carrying outthe plans
• To inform other involved persons in the company of ongoing andcoming activities
• To inform the authorities of ongoing and coming activities• To report on finished, ongoing and coming activities
The action plans should be available to all relevant persons inside andoutside the company.
Action plans are based upon the results of the activities described in chapter4.3.4.
Purpose
Activities

40
Action plans are best organised on a pyramidal structure as shown in Figure4.6.
Figure 4.6Action plan structure.
A dynamic concept for the design of action plans is shown in Table 4.5.
Table 4.5Example of design of action plan
4.4 Reporting on activities and EPI values
The purpose of this activity is to report on finished, ongoing and comingactivities and related results with regard to the impact on the environment.
Action plan no: 1
Name: XXResponsible: NN
Activityno.
Subactionplanno.
Activityname anddescription
Respon-sible person(name)
Scheduledstart ofactivity(date)
Scheduledend ofactivity(date)
Control(name)
Comments,corrections
1.1 1.11.21.31.4 1.41.51.6 1.61.71.81.9
Purpose
MainActionPlan
SubActionPlan 1
SubActionPlan 2
SubActionPlan 3
SubActionPlan 4
Sub-subActionPlan 1.1
Sub-subActionPlan 1.2
Sub-subActionPlan 1.3
41
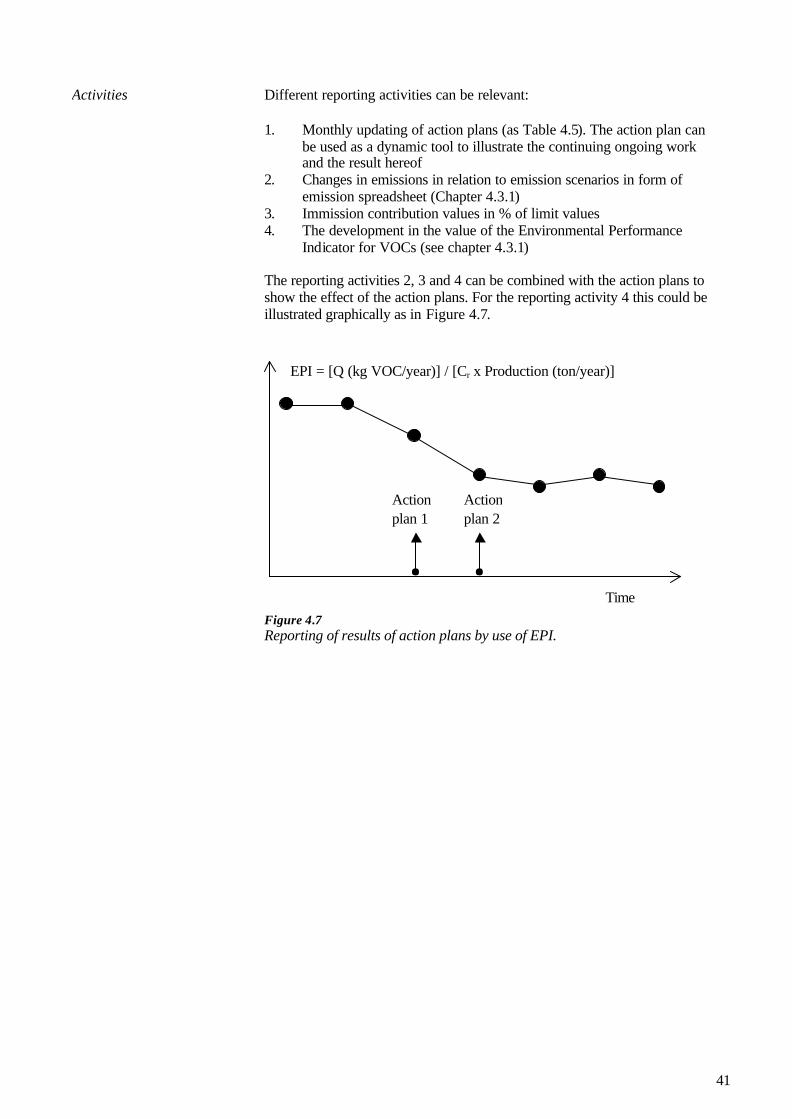
Different reporting activities can be relevant:
1. Monthly updating of action plans (as Table 4.5). The action plan canbe used as a dynamic tool to illustrate the continuing ongoing workand the result hereof
2. Changes in emissions in relation to emission scenarios in form ofemission spreadsheet (Chapter 4.3.1)
3. Immission contribution values in % of limit values4. The development in the value of the Environmental Performance
Indicator for VOCs (see chapter 4.3.1)
The reporting activities 2, 3 and 4 can be combined with the action plans toshow the effect of the action plans. For the reporting activity 4 this could beillustrated graphically as in Figure 4.7.
Figure 4.7Reporting of results of action plans by use of EPI.
Activities
Time
Actionplan 1
Actionplan 2
EPI = [Q (kg VOC/year)] / [Cr x Production (ton/year)]

42
5 Process-Integrated ProductionModification Measures
This chapter contains catalogue of abatement measures for different post-processes. Measures from the catalogue can be used in the scenarios andaction plans described in chapter 4.
Process-integrated measures generally involve technical modifications toprevent emissions at their source, or by means of which emissions arereduced, extracted and transported away.
In the following sections 5.1 to 5.10, potential process-integrated emissionreduction measures are examined more closely.
The capital costs stated in this project are based on costs in Germany and areconverted from DM to DKK with a conversion rate of 4. Differences in thesize of taxes etc. are not included.
The production units are shown in Figure 5.1 where the numbers refer tosections 5.1 to 5.10.
Unloadingstation forfeedstock
5.1
Filling system5.7
Tankfarm5.1
Filter system5.8
Dissolver Mills for finedispersing
5.2 5.5
Holding storefor bins
Finishtanks
5.3 5.6
Dosing station Rinsing basin 5.9Container cleaning 5.10
5.4 Cleaning of mobile bins 5.10
Figure 5.1Overview of production units in the paint and coatings industry.
Implementation of the production modification measures described in 5.1-5.10 will result as a rule in the prevention (in enclosed systems) or reduction(by extraction of fumes) of emissions from diffuse sources. They bring abouta significant improvement of the emissions situation at the workplace, andwill generally lead to compliance with the maximum allowableconcentrations (MAC) stipulated for places of work.
But it must be noted that changing diffuse emissions by extracting fumesinto directed emissions can result in an increase of VOC loadings in the
Technicalmodifications
43
exhaust air stream. This is unavoidable in particular if the exhaust air systemis over dimensioned with regard to the fan extraction rate and at the sametime the emitters are encapsulated. Therefore, a prerequisite for successfulreduction of the emissions by modification of production facilities is carefuldesign of the fume extraction equipment.
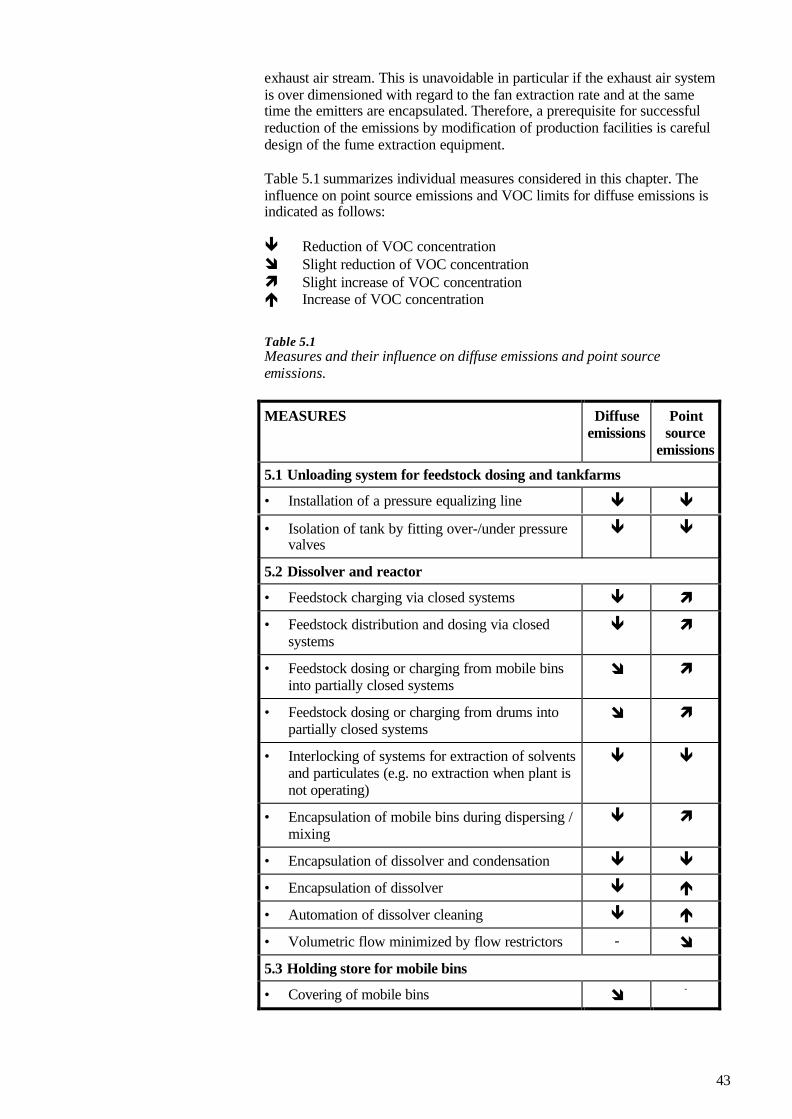
Table 5.1 summarizes individual measures considered in this chapter. Theinfluence on point source emissions and VOC limits for diffuse emissions isindicated as follows:
ê Reduction of VOC concentrationî Slight reduction of VOC concentrationì Slight increase of VOC concentrationé Increase of VOC concentration
Table 5.1Measures and their influence on diffuse emissions and point sourceemissions.
MEASURES Diffuseemissions
Pointsource
emissions
5.1 Unloading system for feedstock dosing and tankfarms
• Installation of a pressure equalizing line ê ê
• Isolation of tank by fitting over-/under pressurevalves
ê ê
5.2 Dissolver and reactor
• Feedstock charging via closed systems ê ì
• Feedstock distribution and dosing via closedsystems
ê ì
• Feedstock dosing or charging from mobile binsinto partially closed systems
î ì
• Feedstock dosing or charging from drums intopartially closed systems
î ì
• Interlocking of systems for extraction of solventsand particulates (e.g. no extraction when plant isnot operating)
ê ê
• Encapsulation of mobile bins during dispersing /mixing
ê ì
• Encapsulation of dissolver and condensation ê ê
• Encapsulation of dissolver ê é
• Automation of dissolver cleaning ê é
• Volumetric flow minimized by flow restrictors - î
5.3 Holding store for mobile bins
• Covering of mobile bins î -

44
MEASURES Diffuseemissions
Pointsource
emissions
5.4 Dosing station for mobile production bins
• Flexible hoods î ì
• Free jet dosing ê ì
• Stationary extraction hoods ê ì
• Automatic shut-off valves ê ì
5.5 Mills for fine dispersing
• Covering of mobile container î ì
• Covering of mills î ì
5.6 Finish tanks
• Isolation of tanks by under-/overpressure valves ê ì
5.7 Filter systems
• Edge or bag filter ê ì
5.8 Filling systems
• Extraction hoods î ì
5.9 Rinsing basin
• Encapsulation with directed exhaust air flow ê ì
• Automatic shut-off valves ê ì
5.10 Cleaning of mobile production bins
• Cabinet washer with water-based rinsingsystem
ê ê
• Cabinet washer with solvent based rinsingsystem and post production treatment
ê ê
• Cabinet washer with brushes, solvent based andcondensation system and sealing of brushes in aseparate chamber
ê î
Examples of some measures are shown on photos in Appendix A.
Avoidance of diffuse VOC emissions to the atmosphere is described in 5.1-5.10.

45
5.1 Unloading system for feedstock dosing and tankfarms
VOC emissions from tankfarms and loading/unloading systems are causedmainly by:
Displacement of exhaust air to atmosphere during loading and unloading ofroad or rail tankers:Volumetric flow: 20-50 normal m³/hConcentration: 1,000-5,000 mg org. C/normal m³, depending on
temperature
Respiration losses in the tankfarm to atmosphere:Volumetric flow: < 1 normal m³/hResins concentration: 1,000-5,000 mg org. C/normal m³Solvents concentration: 10,000-50,000 mg org. C/normal m³
Measures for cutting VOC emissions and their capital costs are:
A1: Installation of a pressure equalizing lineEfficiency: Nearly 100%Capital costs: Approx. 20,000-80,000 DKK for one line,
depending on number of tanks and distancebetween unloading station and tankfarm (pipingsystem, valves, flashback arresters)
A2: Isolation of tank by fitting over-/under pressure valvesCloses the system at a defined pressure (e.g. -5/+10 mbar)
Efficiency: Nearly 100% because of closed system at a definedpressure
Capital costs: 10,000-20,000 DKK/tank, depending on pipediameter and pressure drop
5.2 Dissolver and reactor
VOC emissions from dissolver and reactor are caused mainly by:
Displacement during liquid feedstock dosing:Volumetric flow: 5-10 normal m³/h, depending on installed pump
capacityConcentration: 1,000-5,000 mg org. C/normal m³, depending on
temperature
Chemical reactions:Temperature: Rise up to 50-70°CConcentration: Up to 10,000 mg org. C/normal m³
Rising temperatures caused by shearing forces, among others:Temperature: Rise up to 50-70°CConcentration: Up to 10,000 mg org. C/normal m³
Cleaning of dissolver (shaft and disc) or reactorConcentration: 1,000-3,000 mg org. C/normal m³
Emissions
Measures
Emissions
46
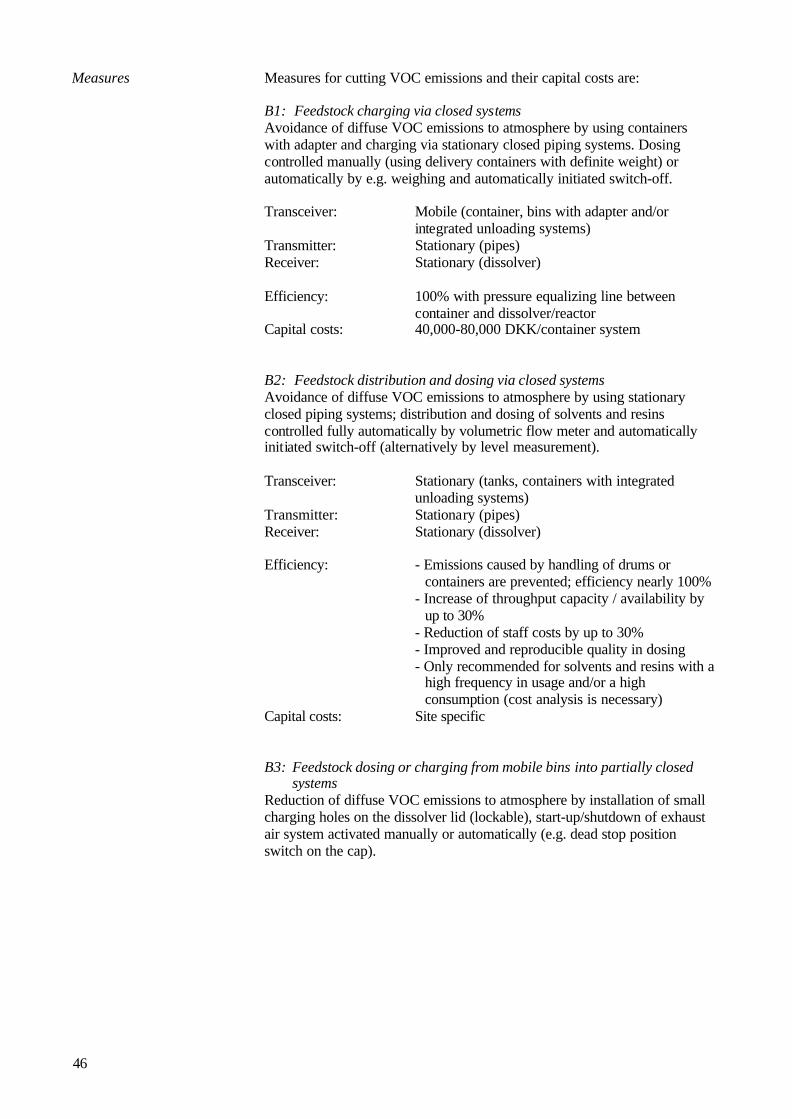
Measures for cutting VOC emissions and their capital costs are:
B1: Feedstock charging via closed systemsAvoidance of diffuse VOC emissions to atmosphere by using containerswith adapter and charging via stationary closed piping systems. Dosingcontrolled manually (using delivery containers with definite weight) orautomatically by e.g. weighing and automatically initiated switch-off.
Transceiver: Mobile (container, bins with adapter and/orintegrated unloading systems)
Transmitter: Stationary (pipes)Receiver: Stationary (dissolver)
Efficiency: 100% with pressure equalizing line betweencontainer and dissolver/reactor
Capital costs: 40,000-80,000 DKK/container system
B2: Feedstock distribution and dosing via closed systemsAvoidance of diffuse VOC emissions to atmosphere by using stationaryclosed piping systems; distribution and dosing of solvents and resinscontrolled fully automatically by volumetric flow meter and automaticallyinitiated switch-off (alternatively by level measurement).
Transceiver: Stationary (tanks, containers with integratedunloading systems)
Transmitter: Stationary (pipes)Receiver: Stationary (dissolver)
Efficiency: - Emissions caused by handling of drums orcontainers are prevented; efficiency nearly 100%
- Increase of throughput capacity / availability byup to 30%
- Reduction of staff costs by up to 30%- Improved and reproducible quality in dosing- Only recommended for solvents and resins with a
high frequency in usage and/or a highconsumption (cost analysis is necessary)
Capital costs: Site specific
B3: Feedstock dosing or charging from mobile bins into partially closedsystems
Reduction of diffuse VOC emissions to atmosphere by installation of smallcharging holes on the dissolver lid (lockable), start-up/shutdown of exhaustair system activated manually or automatically (e.g. dead stop positionswitch on the cap).
Measures

47
Transceiver: Mobile (bins, container with adapter or integratedunloading system)
Transmitter: Mobile/flexible (e.g. pumps with flexible hose onpressure side)
Receiver: Stationary (dissolver)
Efficiency: - Improvement in personnel protection; reductionof emissions at place of work
- Reduction of diffuse emissions by about 100%Capital costs: Approx. 20,000 DKK/lid
B4: Feedstock dosing or charging from drums into partially closed systemsReduction of diffuse VOC emissions to atmosphere by installation ofhoppers with, for example, side extraction slit on the dissolver lid; start-up/shutdown of exhaust air system activated manually or automatically (e.g.dead stop position switch on the cap).
Transceiver: Mobile (drum)Transmitter: -Receiver: Stationary (dissolver)
Efficiency: - Improvement in personnel protection; reductionof emissions at place of work
- Reduction of diffuse emissionsCapital costs: 10,000-20,000 DKK/lid
B5: Interlocking of systems for extraction of solvents and particulatesReduction of VOC loadings by interlocking of extraction systems forsolvents and particulates to minimize volumetric flows of solvent-dilutedexhaust fumes (reduction of respiration losses).Extraction of particulate emissions by way of a filter to atmosphere, dosingof solids as automatic or semi-automatic system with integrated dust filterand ventilator.
Efficiency: Respiration losses of solvents will be reduced.Dilution of VOC emissions will be avoided.Volumetric flow rate will be reduced as much aspossible
Capital costs: Site specific
B6: Encapsulation of mobile bins during dispersing / mixingReduction of diffuse VOC emissions to atmosphere by encapsulation ofmobile bins during dosing with an extraction hood; alternatively increase ofperipheral extraction.
Efficiency: - Improvement in personnel protection; reductionof emissions at place of work
- Reduction of diffuse emissions by 90-100%Capital costs: 20,000-40,000 DKK/dissolver, depending on
performance
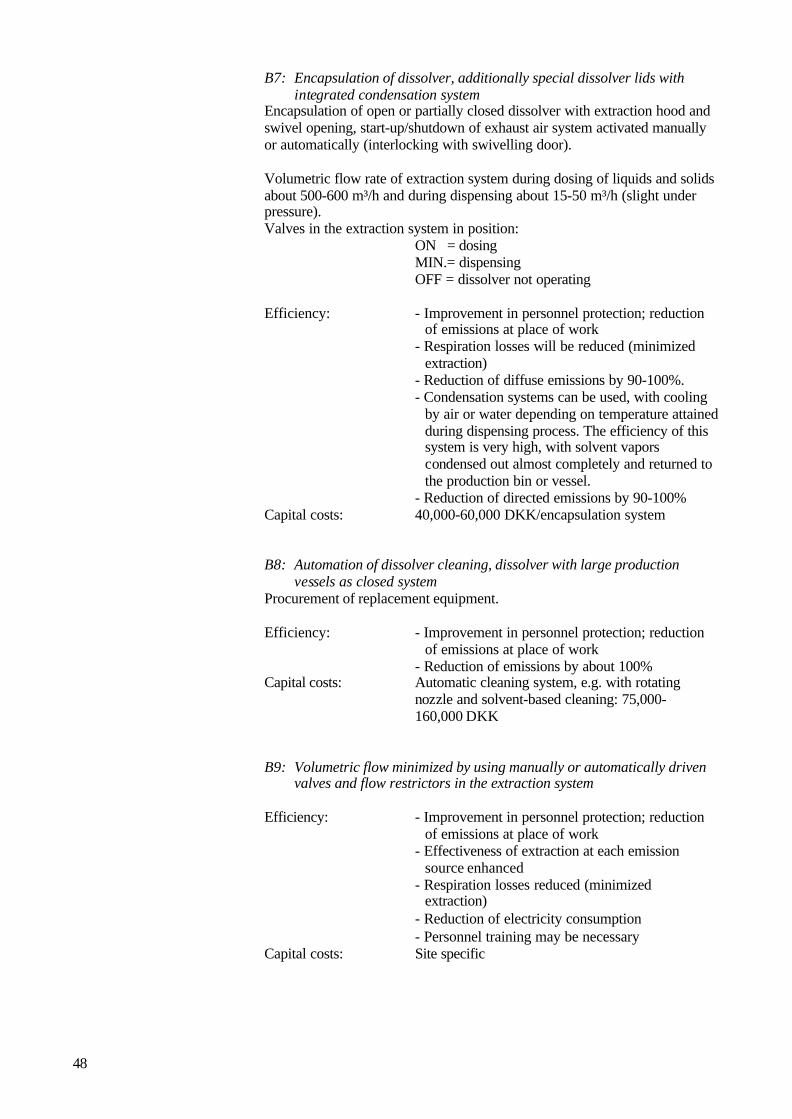
48
B7: Encapsulation of dissolver, additionally special dissolver lids withintegrated condensation system
Encapsulation of open or partially closed dissolver with extraction hood andswivel opening, start-up/shutdown of exhaust air system activated manuallyor automatically (interlocking with swivelling door).
Volumetric flow rate of extraction system during dosing of liquids and solidsabout 500-600 m³/h and during dispensing about 15-50 m³/h (slight underpressure).Valves in the extraction system in position:
ON = dosingMIN.= dispensingOFF = dissolver not operating
Efficiency: - Improvement in personnel protection; reductionof emissions at place of work
- Respiration losses will be reduced (minimizedextraction)
- Reduction of diffuse emissions by 90-100%.- Condensation systems can be used, with cooling
by air or water depending on temperature attainedduring dispensing process. The efficiency of thissystem is very high, with solvent vaporscondensed out almost completely and returned tothe production bin or vessel.
- Reduction of directed emissions by 90-100%Capital costs: 40,000-60,000 DKK/encapsulation system
B8: Automation of dissolver cleaning, dissolver with large productionvessels as closed system
Procurement of replacement equipment.
Efficiency: - Improvement in personnel protection; reductionof emissions at place of work
- Reduction of emissions by about 100%Capital costs: Automatic cleaning system, e.g. with rotating
nozzle and solvent-based cleaning: 75,000-160,000 DKK
B9: Volumetric flow minimized by using manually or automatically drivenvalves and flow restrictors in the extraction system
Efficiency: - Improvement in personnel protection; reductionof emissions at place of work
- Effectiveness of extraction at each emissionsource enhanced
- Respiration losses reduced (minimizedextraction)
- Reduction of electricity consumption- Personnel training may be necessary
Capital costs: Site specific

49
5.3 Holding store for mobile bins
VOC emissions at holding stores for mobile bins are caused mainly by:
Respiration losses to atmosphere during temporary storage
Measures for cutting VOC emissions and their capital costs are:
C1: Covering of mobile bins with wooden lids or plastic membranes
Efficiency: - Reduction of emissions at place of work byapprox. 100%
- Personnel training may be necessaryCapital costs: Costs are negligible
C2: Provision of special storage areas for bins with separate extractionsystems
Efficiency gains and capital costs are site-specific.
5.4 Dosing station for mobile production bins
VOC emissions at dosing stations for mobile production bins are causedmainly by:
Displacement during dosing of solvents and resins into open bin.
Leaks at dosing valves.
Emission releases during free jet dosing into open bins.
Diameters of extraction systems are often over-dimensioned.
Correct positioning of the extraction system is not possible or isinconvenient (and therefore not done properly by operators)
Measures for cutting VOC emissions and their capital costs are:
D1: Flexible hoodsReduction of diffuse emissions by installation of flexible extraction systemswith hood (peripheral or segmental extraction rate of about 500 m³/h;DN 150).
Efficiency: Improvement in personnel protection; reduction ofemissions at place of work by about 100%
Capital costs: Approx. 20,000-40,000 DKK
D2: Free jet dosingAvoidance of leaks by installation of flexible hoses or lengthening dosingpipelines (offshore dosing).
Efficiency: Improvement in personnel protection; reduction ofemissions at place of work.
D3: Installation of stationary extraction hood
Emissions
Measures
Emissions
Measures

50
Only if dosing equipment is arranged close together or if replacementequipment is procured.Peripheral or segmental extraction of about 500 m³/h; DN 150.Interlocking of extraction system with automatically driven valves or pumpsonly recommended for solvents and resins that are often used.
Efficiency: Improvement in personnel protection; reduction ofemissions at place of work
D4: Installation of automatic shut-off valvesDosing valves (e.g. ball valves) are not shut-off valves, because they do notclose fully. If there are no shut-off valves, drip pans have to be installedbeneath the dosing valves.
5.5 Mills for fine dispersing
VOC emissions at mills for fine dispersing are caused mainly by:
Open mills and mobile container.
Outlet of mills (free jet) directed to container of different height.
Splashing during inflow into container.
Measures for cutting VOC emissions and their capital costs are:
E1: Covering of mobile containerUsing movable lids; lids equipped with connection for inflow and extraction.Extraction: max. 50 m³/h (DN 50).Extraction via flexible hoods.
Efficiency: - Improvement in personnel protection; reductionof emissions at place of work
- Reduction of diffuse emissions by nearly 100%
E2: Covering of millsInstallation of hoppers at mill outlets, with flexible tubes and adapter forcontainer lid.
Efficiency: Improvement in personnel protection; reductionof emissions at place of work
Capital costs: 10,000-20.000 DKK, depending on milling system
5.6 Finish tanks
VOC emissions at finish tanks are caused mainly by:
Displacement during charging to atmosphere.
Respiration losses to atmosphere.
Emissions
Measures
Emissions
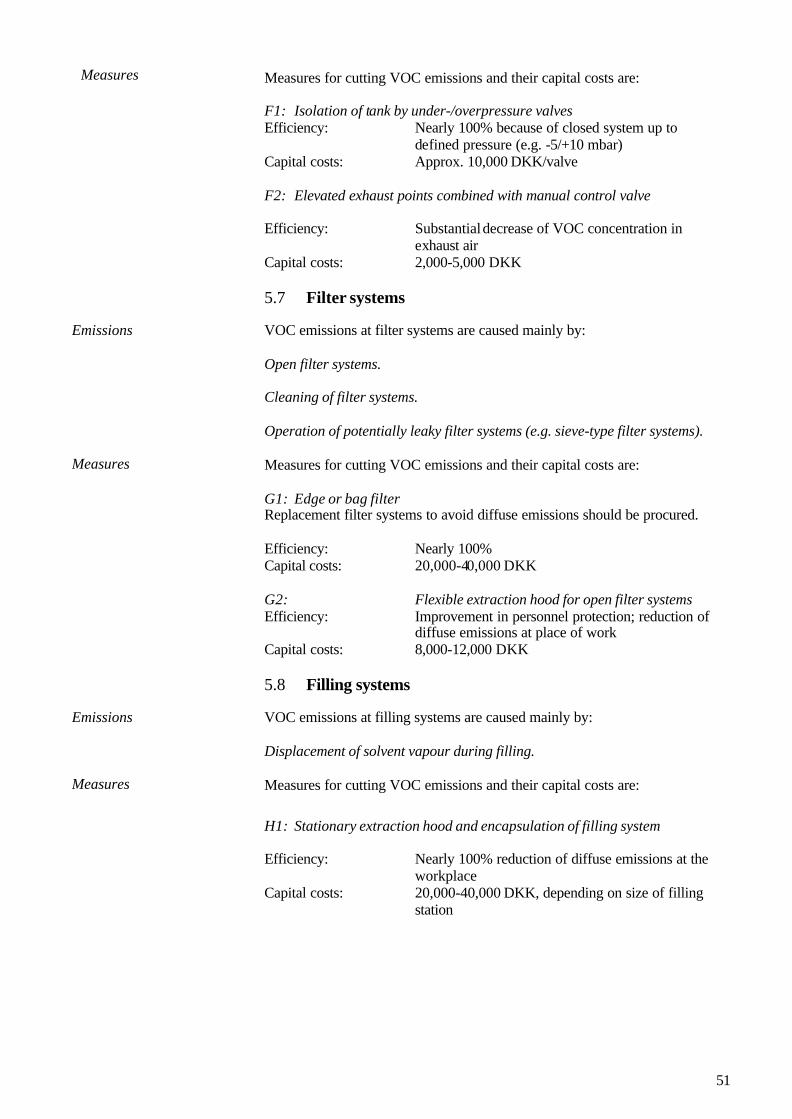
51
Measures for cutting VOC emissions and their capital costs are:
F1: Isolation of tank by under-/overpressure valvesEfficiency: Nearly 100% because of closed system up to
defined pressure (e.g. -5/+10 mbar)Capital costs: Approx. 10,000 DKK/valve
F2: Elevated exhaust points combined with manual control valve
Efficiency: Substantial decrease of VOC concentration inexhaust air
Capital costs: 2,000-5,000 DKK
5.7 Filter systems
VOC emissions at filter systems are caused mainly by:
Open filter systems.
Cleaning of filter systems.
Operation of potentially leaky filter systems (e.g. sieve-type filter systems).
Measures for cutting VOC emissions and their capital costs are:
G1: Edge or bag filterReplacement filter systems to avoid diffuse emissions should be procured.
Efficiency: Nearly 100%Capital costs: 20,000-40,000 DKK
G2: Flexible extraction hood for open filter systemsEfficiency: Improvement in personnel protection; reduction of
diffuse emissions at place of workCapital costs: 8,000-12,000 DKK
5.8 Filling systems
VOC emissions at filling systems are caused mainly by:
Displacement of solvent vapour during filling.
Measures for cutting VOC emissions and their capital costs are:
H1: Stationary extraction hood and encapsulation of filling system
Efficiency: Nearly 100% reduction of diffuse emissions at theworkplace
Capital costs: 20,000-40,000 DKK, depending on size of fillingstation
Measures
Emissions
Measures
Emissions
Measures

52
5.9 Rinsing basins
VOC emissions at solvent-based rinsing basins are caused mainly by:
Manual cleaning of tools and small bins in open cleaning basins.
Drying of tools after cleaning them gives rise to solvent vapour emissions atrinsing basin locations.
Measures for cutting VOC emissions and their capital costs are:
I1: Encapsulated rinsing basins (fitted with lids) with automatic, directedexhaust air flow
For loading and unloading parts for rinsing, the lids of the rinsing basins areraised by a knee-operated device; air extraction switches in automatically byopening of the respective pneumatic dampers.Additionally, solvent vapours are swept by the extraction airflow from theoperator gangway to the exhaust duct.The flow rate is around 2000 m³/h, but matched to the size of the rinsingbasin, with VOC concentration 200-300 mg/m³, depending on flow rate andtemperature.Due to the high concentration, cleaning of the extracted exhaust is necessaryfor compliance with the emissions standards.
Capital costs: 160,000-200,000 DKK
5.10 Solvent-based washing of mobile production bins incleaning cabinet
VOC emissions at solvent-based cleaning cabinets are caused mainly by:
Cleaning cabinets are not completely enclosed systems.
The cleaning cycle does not conclude with a drying step, so the cleaningcabinet location is exposed to organic solvents after removal of cleanedbins.
Generally, due to the high concentration of VOCs, the exhaust air requirespost-treatment, like thermal combustion, for compliance with emissionstandards.
Measures for cutting VOC emissions and their capital costs are:
J1: Cabinet washing installation with water-based (e.g. hot alkaline)rinsing system
Efficiency: Emissions reduced by 100%, with no post-treatment needed for VOC removal; wastewatermust be treated.
Capital costs: 1,000,000-1,600,000 DKK, depending on plantsize; additional costs for water treatment plant
J2: Cabinet washing installation with solvent-based rinsing system andexhaust fume cleaning equipment
Emissions
Measures
Emissions
Measures

53
Cabinet washing installation with integrated fume extraction and drying isthe present state of the art; explosion proofed; cleaning with rotating nozzleand high-pressure jet or rotating brushes.Condensing system to remove a major part of the solvent emissions from theexhaust air.Distillation plant for recycling used solvent.Storage vessels for clean and used solvent.
Efficiency: Reduction of diffuse emissions at workplace bynearly 100%.Connection to incinerator or other exhaust airtreatment plant is necessary for compliance withemission standards.
Capital costs: Approx. 1,600,000 DKK, depending on plant size;additional costs for post-production clean-up, e.g.incineration, of exhaust air.

54
6 Strategy
6.1 Product development
For practical purposes, product development signifies an integrateddevelopment of new products and processes, for which all significant risksand environmental impacts throughout the product life cycle have beenconsidered right from the time of start of development.
Key indicators of product development are the principles of ecologicalefficiency and of inherent safety.
A measure of the ecological efficiency is the value added per consumed orpolluted environmental unit. Ecological efficiency therefore describes theratio of economic utilization to a key ecological factor.
Principle of ecological efficiency: Minimization of use of resources insteadof disposal of resulting wastes and emissions by environmental clean-uptechnology
The inherent safety is a product/process characteristic necessarily limitingthe risk to a level predetermined by the design. The measure of inherentsafety is determined by the magnitude of remaining risk potential.
Principle of inherent safety: Elimination or reduction of risk instead ofsubsequent control of risk by monitoring and taking safety precautions.
Tools essential for implementing product development are, alongsidedrawing up the ecological balance, also market analysis, cost analysis andrisk analysis.
Today, enterprises are confronted with the challenge of securing andexpanding their existing market situation - as a rule with newly launchedproducts - while at the same time exploiting competitive advantages byinnovation and strengthening core competencies.
The decision for product development, for example to cut emissions ofvolatile organic compounds, cannot be made by an enterprise in isolation.
Critical influences are the external market constraints - competitive pressure,price development, supply and demand - and the acceptance and willingnessto co-operate of the actors in the market - strategic partners, customers,competitors, material and service suppliers.
6.1.1 MeasuresProduct development for cutting emissions of volatile organic compoundssignifies specifically for the paint and coatings industry:
• modification of recipes and/or• modification of the manufacturing process with the objective of preventing such emissions completely or limiting themto an unavoidable minimum.
Definition
Ecological efficiency
Inherent safety

55
Prevention and reducing emissions at source requires that the approach toachieve this must be adopted for the company's own development ofproducts at an early stage, since as development proceeds, the possibilitiesfor intervention rapidly reduce. Under economic aspects in particular, the latitude for action should thus beexploited in the early phases of product and process development, to permitdecisions to be taken that are advantageous for the enterprise over the longterm. Despite time pressures and the meager data available at the start, thisrequires systematic examination of the available knowledge on possibleactions and orientation. To cope with integration of all relevant information, it is important that: • the development process as a whole is broken down into practical
phases, to each of which are unambiguously assigned the requisitepersonnel resources, budgets, tasks and intermediate objectives
• the results of each phase are evaluated under consideration of the generalobjective, and when necessary, corrective measures initiated
• users and customers are tied into the overall development process at anearly stage
• communications between persons from differing backgrounds ofexperience, such as marketing, sales, research and development,engineering and production, are promoted
• an effective exchange of information is maintained between parallellines of development, initiated in the interest of speeding up the process
Options for improving the emissions situation at a production site are asfollows: • analysis and possibly restructuring of site-specific product ranges on the
basis of the ecological balance and a cost-benefit analysis• company internal restructuring of production, taking in all operating
sites, involving concentration of production of emissions-relevantintermediate and final products at one production site, possibly allowingmore cost-effective implementation of production modification and post-production pollutant clean-up under consideration of the legal situationat specific sites
• integration of new low-emission products and processes that havealready been developed by third parties or have been launched onto themarket
6.2 Production planning
6.2.1 Supply of feedstocksIt is noted right at the outset that the inducement for adopting strategicmeasures in connection with feedstocks supply is frequently the exploitationof economic advantages, like more favourable purchases, reduction of tiedup personnel resources and shortening of lead times.
Reduction or avoidance of diffuse emissions of volatile organic compounds,arising in particular when decanting feedstocks from supply containers todosing containers, during batching in the as-supplied condition or dosinginto open tank systems, is in this respect a beneficial consequence underenvironmental aspects.
56
The basis for evaluating measures in connection with feedstocks supplycomprises:
• analysis of consumption structures:• segmental distribution• frequency of use• use quantity categories• quantity consumption per component and time interval• number of components
• analysis of costs of feedstock provision:
• form of supply• supplied unit quantities• form of storage• stored unit quantities
The objective is to clearly present the structures of consumption and thecurrent costs of feedstock provision, and so derive savings potentials.
Possible cost-cutting and emission reducing measures are:
1. switching the form of supply from small casks to, for example, tankertrucks
2. conversion of storage systems from small casks to, for example, tanksystems or container shelving
3. conversion of dosing to fully automated, closed systems
The effectiveness of preventing and reducing diffuse emissions is almost100%.
The capital investments for such conversions must be determined for thespecific company and site circumstances. Nevertheless, in particular forcompanies with a very large product range, small batch sizes and a widediversity of feedstocks, savings as follows are possible:
• by exploiting purchaser advantages: up to 5%• by reducing the staff requirement: some 5 to 10%• by reducing the costs of disposal for one-way containers/drums: up to
50%
6.2.2 Planning activitiesFrequently, the adoption of strategic measures in connection with productionlogistics is prompted by the exploitation of economic advantages, likeenhancement of flexibility and upgrading of production capacity byshortening through flow times, and reducing tied up personnel resources.
Reduction or prevention of diffuse VOC emissions in particular, which ariseespecially during cleaning, is in this context more of a positive subsidiaryeffect, benefiting the environment.
The basis for evaluating measures in the area of production planning is:
• analysis of processes• batches, batch sizes• machine occupation times• lead times
The basis for evaluatingmeasures
The objective
The basis for evaluatingmeasures

57
• equipment setting times• demands for energy and operating supplies• availability• quality
The objective is to present the production complexity and associated costs inthe value added chain in a transparent way as well as derive savingspotentials from these. Possible cost-cutting and emission reducing measures are as follows: • switching from linear, order-oriented production (from basic feedstocks)
to manufacture from semi-finished products taken from stock• outsourcing manufacture of intermediate or final products• outsourcing of functions, like container cleaning, to external service
providers
A decision about outsourcing must be based on a total environmentalevaluation. It is obvious that moving the operation is not a solution withoutdocumentation for better technology at the subcontractor.
The principal emission sources, referred to pollutant loadings, in productionare dissolvers, mixing tanks, open mills and cylinder mills as well assolvent-based tank cleaning. Subsequent process steps play more asubordinate role, and can be neglected when drawing up a rough balance ofemitted pollutant loadings.
The loadings of emitted VOCs at production equipment and tanks aredetermined essentially by the number of charges and cycles of cleaning overan investigation period. Potentials for preventing or reducing emittedpollutant loadings throughout the entire production chain are virtuallylinearly dependent on the potentials for cutting the number of charges andshortening cycles of cleaning.
Potentials for avoiding emitted pollutant loadings during tank cleaning aremore or less a linear function of the number of tanks. By switching fromsolvent-based tank cleaning to water-based (alkali) cleaning, VOC emissionscan be prevented completely.
When investing in new equipment, this option should be investigated undertechnical and economic aspects.
6.2.3 Education and further company-internal trainingReductions of VOC emissions can be achieved by improved housekeeping,like increased attention to correctly operating air outlet valves.
Therefore, in-depth training of operatives is desirable.
The objective

Appendix A
58
Appendix A: Photos (Catalogue of measures)Dissolver and reactor
Photo 1:Dosing of liquid raw material into a Dissolver, condensation system andflexible hose system on the dissolver lid.
Photo 2:Dosing station for mobile bins with exhaust air extraction and curtain.

Appendix A
59
Photo 3:Dosing station for mobile bins (semi-closed).
Photo 4:Dosing station for mobile bins, full encapsulated.

Appendix A
60
Photo 5:Dissolver with mobile bin and exhaust air extraction by flexible hose duringdosing of liquids and dispersing.
Photo 6:Encapsulation of dissolver with mobile bin and exhaust air extraction.

Appendix A
61
Photo 7:Dissolver with mobile bin and flexible hose with extraction hood.
Photo 8:Encapsulation of dissolver.

Appendix A
62
Photo 9:Encapsulation of dissolver.
Photo 10:Encapsulation of dissolver.
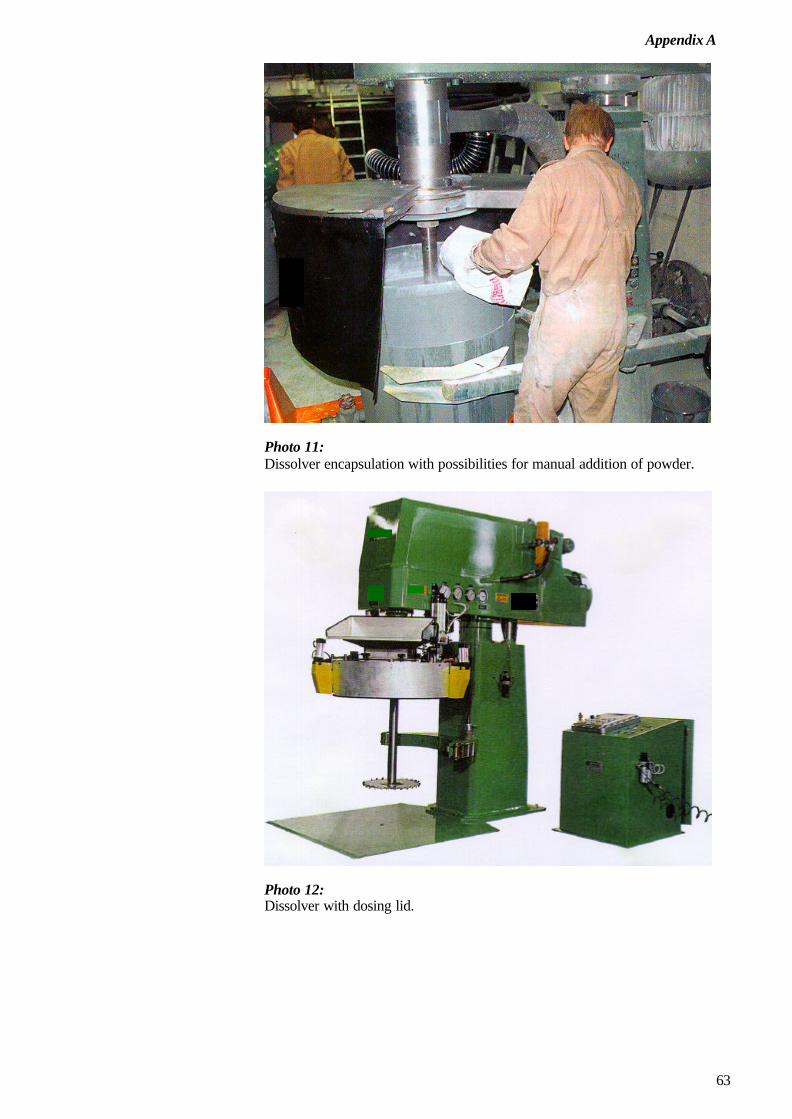
Appendix A
63
Photo 11:Dissolver encapsulation with possibilities for manual addition of powder.
Photo 12:Dissolver with dosing lid.

Appendix A
64
Photo 13:Closed dissolver system with automatic liquid dosing via pipe andcondensation system.
Photo 14:Closed Dissolver system with automatic liquid dosing via pipe, condensationsystem and dust extraction system by flexible hose.
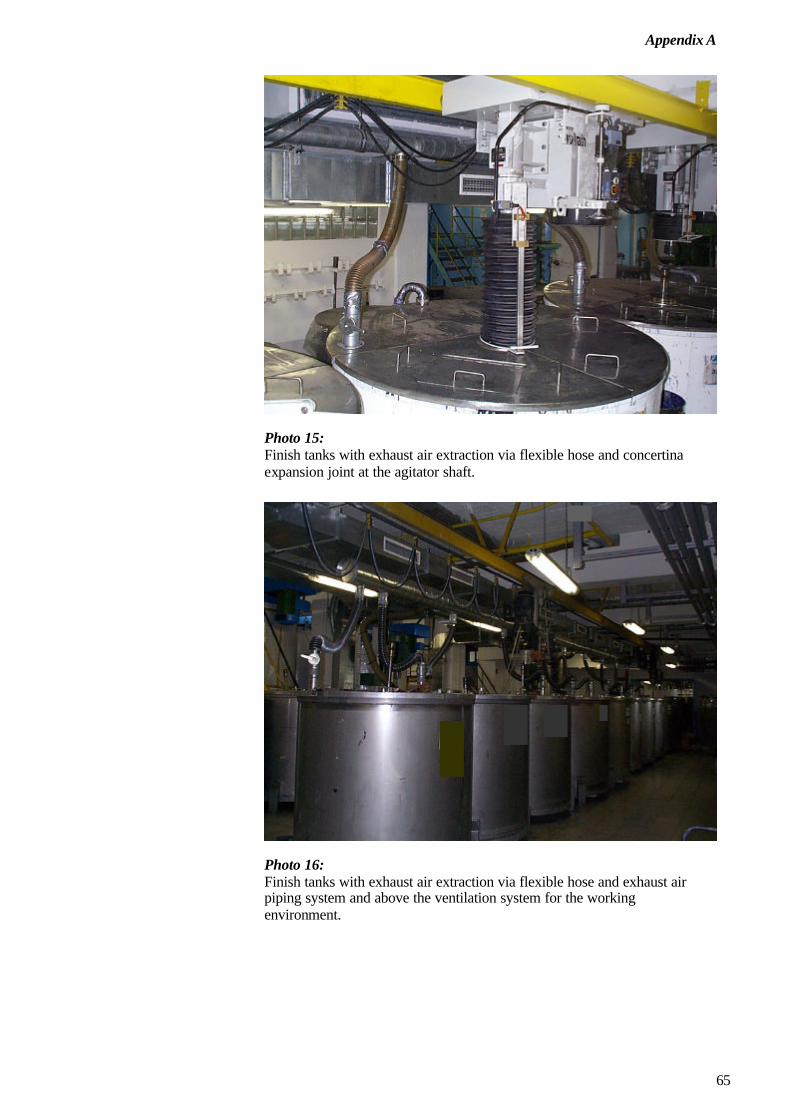
Appendix A
65
Photo 15:Finish tanks with exhaust air extraction via flexible hose and concertinaexpansion joint at the agitator shaft.
Photo 16:Finish tanks with exhaust air extraction via flexible hose and exhaust airpiping system and above the ventilation system for the workingenvironment.

Appendix A
66
Photo 17:Automatic filling station.
Photo 18:Rinsing basin with automatic, directed exhaust air flow.
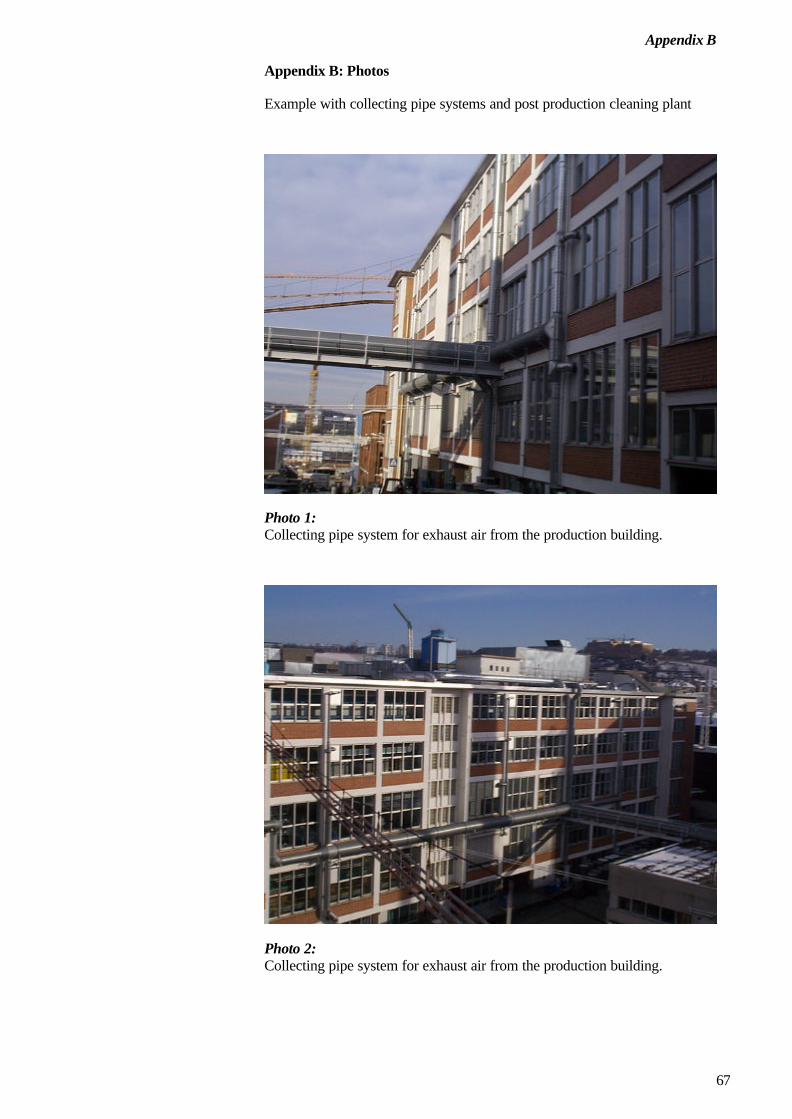
Appendix B
67
Appendix B: Photos
Example with collecting pipe systems and post production cleaning plant
Photo 1:Collecting pipe system for exhaust air from the production building.
Photo 2:Collecting pipe system for exhaust air from the production building.
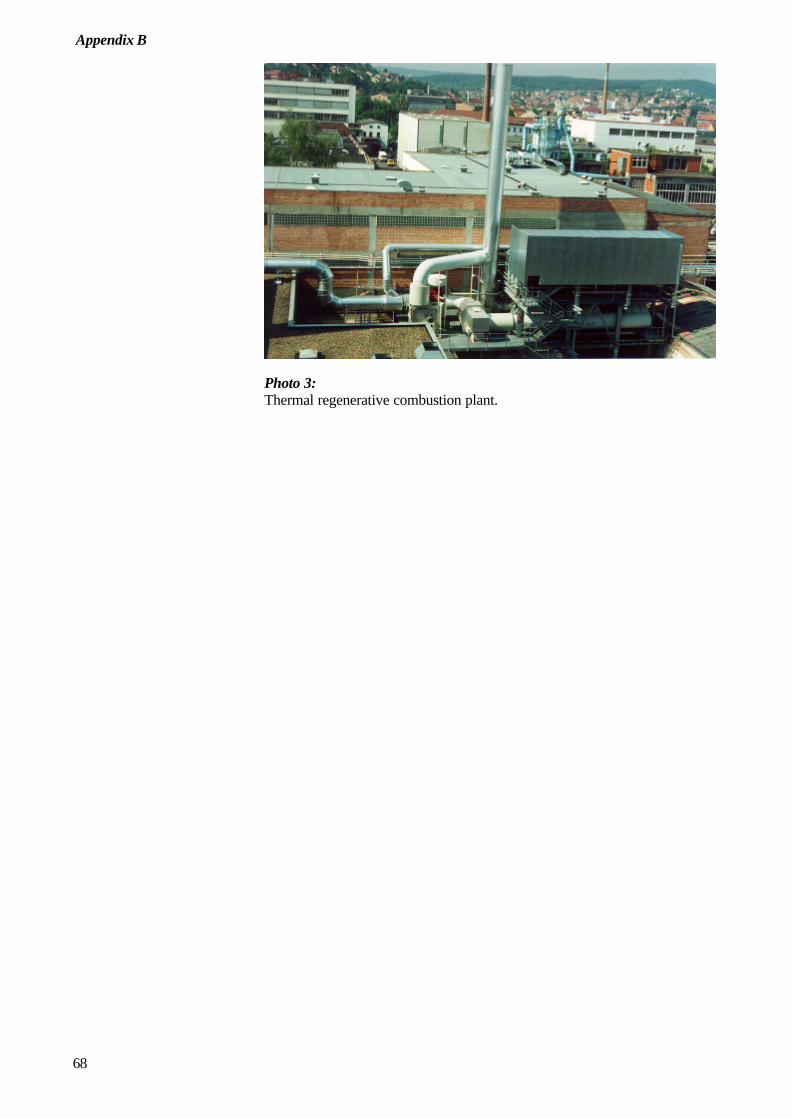
Appendix B
68
Photo 3:Thermal regenerative combustion plant.