voice of the customer - thinkjar – the...
TRANSCRIPT

A data-based analysis of adoption and optimization of VoC initiatives August 2011SPONSORED BY:
ThinkJar is an advisory and think-tank focused on Customer Strategies.
ESTEBAN KOLSKY: crm intelligence & strategy
VOICE OF THE CUSTOMER Initiatives Research Report

RESEARCH REPORT — AUGUST 2011
page 2Voice of the Customer
Table of Contents
Executive Summary ...............................................................................................................3
The Study ..............................................................................................................................4
Defining Voice of the Customer Initiatives .............................................................................6
Insights into Voice of the Customer ......................................................................................7
Size Matters: Defining Who Should Embark on VoC Initiatives .........................................7
The Right Information Helps To Extend Awareness into Action ........................................9
Adopting VoC Initiatives Requires Executive Sponsorship to Succeed ..........................11
There are Better Justifications for VoC than ROI .............................................................12
Adopting VoC Also Requires a Reason ..........................................................................15
Tools Used in Deploying VoC Initiatives ..........................................................................17
Optimizing VoC Initiatives ................................................................................................19
About ThinkJar ....................................................................................................................22
About Attensity™ ................................................................................................................22
Appendix A – Questions, Answers ......................................................................................23
DEMOGRAPHIC INFORMATION Industry ................................................................................23
DEMOGRAPHIC INFORMATION Location ...............................................................................24
DEMOGRAPHIC INFORMATION Department or Function ......................................................24
DEMOGRAPHIC INFORMATION Company Size .....................................................................24
Q1: VoC Current Situation ..............................................................................................25
Q2: Primary Owner of VoC Initiatives .............................................................................25
Q3: Confusion about VoC ...............................................................................................26
Q4: Driver for Project ......................................................................................................26
Q5: Problems Caused by Lack of VoC ...........................................................................27
Q6: Documents Used to Justify VoC ..............................................................................27
Q8: Current Tools and Technologies Use .......................................................................28
Q9: Planned Technology Investment ..............................................................................29
Q10: Currently Analytics Use ..........................................................................................29
Q11: Planned Analytics Use ...........................................................................................30
Q12: Reading about VoC ................................................................................................30
Q13: Finding Relevant Information .................................................................................31
Q14: Rate your VoC Implementation ..............................................................................31

RESEARCH REPORT — AUGUST 2011
page 3Voice of the Customer
Executive Summary
Is there confusion out there about what “Voice of the Customer (VoC)” means?
No, according to almost two thirds of people we asked recently. In a survey of nearly 400 VoC practitioners, there was general agreement that the definition of VoC has evolved from using surveys to collect customer feedback (also known as enterprise feedback management, or EFM) to a broader definition. Today’s VoC initiatives are more likely to encompass multiple customer conversation channels, including social media sites like Facebook and Twitter, online reviews, forums and discussion groups, as well as direct channels such as emails, calls, text messages and, yes, surveys.
Yet, while the vast majority of organizations we surveyed generally agree on the definition of VoC, many are still floundering when it comes to the actual implementation of VoC initiatives. There is still a fair degree of uncertainty about the key factors and best practices in making a VoC deployment successful. Faced with this uncertainty, we set out to ask organizations about their experiences and the paths they have taken to deploy VoC and Customer Experience projects.
Among the insights we found:
• Common sense is still the best tool to use in releasing VoC initiatives.
• VoC is more successful when done in a continuum, or ever-evolving series of iterations, not as a single project.
• There is a lot of information out there, but it is very hard to find relevant data beyond the basics.
• Executive sponsorship is still the best indicator of success for VoC deployments.
• Focusing on Return on Investment is not as much an indicator of success as is having a VoC strategy.
• The size of the organization matters. Larger organizations tend to be more successful with VoC initiatives, not because of their size but because of the resources available to dedicate to the project.
• The ultimate goal of VoC initiatives is to listen to the voice of the customer and act on it, anything else is just a waste of time and resources.
The first point is the most commonly misunderstood according to the practi-tioners we interviewed—there is a sense that VoC initiatives include some new, magic way of doing things. However, the research shows that any organization invested in listening to and learning from its customers can achieve success with its VoC initiatives—as long as the organization uses common sense and follows a few lessons learned.
>
Focusing on Return on
Investment is not as
much an indicator of
success as is having a
VoC strategy.

RESEARCH REPORT — AUGUST 2011
page 4Voice of the Customer
The Study
We started to wonder about the state of the VoC market as we spent more time talk-ing to clients and prospects about it. There seems to be a lot of confusion in the market as to what makes for a good deployment. We found plenty of myths, old wives’ tales, and a-friend-of-a-friend accounts, but we wanted to take a look at those accounts from the statistical perspective, to know what it takes to make a good VoC deployment.
We wanted to hear from actual VoC practitioners, those people who are running (or have run) VoC initiatives in different organizations. We sought them out via direct email, direct contact with clients and prospects, and via social media channels. The first lesson we learned: in spite of the hype surrounding Social Media as a channel for engagement and communications, we received far better response from our email requests. Obviously, this is not a conclusive data point—but one to keep in mind for future market research.
We coordinated the study to include all facets of the adoption timeline (Figure 1), from curiosity and investigation through deployment. We included basic demograph-ics for the enterprise, size and industry, as well as experience and plans.
The goal of our research was to gain a better understanding of which of the common perceptions and accepted approaches were being confirmed in practice, and which were not yielding the expected results. We cross-referenced some of the data to see how the answers vary in specific cases where we saw significant discrepancies.
>
Figure 1

RESEARCH REPORT — AUGUST 2011
page 5Voice of the Customer
We received close to 400 answers with an average response per question of 367 answers. A few of the answers chosen, in instances where we required more detail to an answer or we required detailed cross-tabbing, did not have sufficient number of entries to make it anonymous, and so we did not use that information in reporting. All source information we received has been, and will continue to be, treated as confidential and will not be revealed.
When the data we analyzed offered conclusions that required additional clarification, we contacted 20 randomly selected participants among those that provided answers similar to what we were analyzing for follow up interviews. In these cases, we were able to conduct, on average, 13 interviews. The information from these interviews was used to further our understanding of the responses, and that understanding, combined with our knowledge and expertise in the market, is the opinion we provide where necessary. Those opinions reflect our research and experience in the mar-ket, but they are not data-driven (as most opinions tend not to be). We stand behind those findings, but we cannot guarantee the repeatability of the answers with the same error level as the rest of the survey.
We cannot produce every single conceivable cross-tab and insight from the data—there is not enough time in the world. Instead, we are going to focus on the top ten insights, those items that caught our attention and required more analysis. We are also providing, at the end of the report in an appendix, tables with the results for each question. We compiled the most interesting insights into this report to summarize both the state of VoC initiatives, as well as the key factors an organization should keep in mind as VoC is adopted. And we used the adoption model above as our guide; those are the sections we used for each insight we found.
What follows is a detailed explanation of the most relevant insights we found while analyzing the survey data.

RESEARCH REPORT — AUGUST 2011
page 6Voice of the Customer
Defining Voice of the Customer Initiatives
While we did not set out to define what is included in a VoC initiative, a few of the respondents to the survey asked, and some of the discussions in the follow-up interviews included a definition. We found that most of our respon-dents concluded that our definition was in line with what they were doing or thinking about doing.
A VoC Initiative is a program or strategy implemented by an organization to capture the customer’s needs, wants, desires, concerns, problems and dislikes. Through different methods implemented across multiple channels of communication, an organization sets out to discover what its customers think, feel and believe about their company, products and services. A well imple-mented VoC initiative will then use those insights to feed a myriad of projects and systems throughout the organization, leveraging the Voice of the Customer to improve products, services, or to plan for the future.
The main difference between a VoC and a Customer Experience Management initiative, two terms that are often used interchangeably, is the reach of the former. While Customer Experience Management solutions focus on the actual interaction between customers and organizations, a VoC initiative is focused on using customer feedback across the enterprise to improve products and services as well as interactions and “experiences”.
There are several tools and technologies used in VoC initiatives including Analytical Engines, Business Process Management, Enterprise Feedback Management, and most any integration platform that the company is already running. The focus of this report was not on the technologies used as much as the experiences from the practitioners in adopting and deploying VoC initiatives.
>
The main difference between a VoC and a Customer Experience Management initiative,
two terms that are often used interchangeably, is the reach of the former.

RESEARCH REPORT — AUGUST 2011
page 7Voice of the Customer
Insights into Voice of the Customer
Trying to find incredible morsels of wisdom never before acknowledged in a sea of data is not easy. As with anything else that involves analyzing data, it is not about just “going in and seeing what you can find,” but requires some structure and knowledge of what you are looking for. If you do a good job, you can do that from the moment the questions are created, and it is simply an issue of finding the data to support the theories.
Our leading theory was that there is a high degree of confusion in regards to VoC deployments, and not a lot of “standardization.” There is not a single department, position or model that is so widely deployed as to be a de-facto standard, nor is there a way to do it that is foolproof and guaranteed. We sought to find, from among the experienced practitioners we questioned, the key lessons learned, which tools and resources were most effective, and which elements should be used by newcomers.
Size Matters: Defining Who Should Embark on VoC Initiatives
As we began to look at the responses and the data, one of the demographic questions struck me as odd. We have long heard that VoC is an expensive initiative, that it takes large organizations with deep pockets to implement it.
The need for time, people and software makes it an expensive proposition—even at the starting level.
The reason we asked the question on com-pany size was to either prove or disprove this theory. We split the levels in a way that would highlight the very small (relatively speaking) companies that make less than $100 million, and the very large that make more than $1 billion.
When we asked organizations to describe their position in relation to VoC implementations, almost a quarter of them indicated they had never deployed VoC projects (Figure 2).
>
When we asked orga-
nizations to describe
their position in relation
to VoC implementa-
tions, almost a quarter
of them indicated they
had never deployed VoC
projects.
Figure 2

RESEARCH REPORT — AUGUST 2011
page 8Voice of the Customer
Although we expected to have a number between ten and twenty percent, we saw more than we expected. We took to the phones to chat with some of the people who have never deployed a VoC project.
Their reactions were pretty uniform: either their company was too small to fully lever-age VoC (they could not implement the insights obtained easily), or they did not have the resources to do it properly, or could not justify the investment. More than 46% of respondents who said they had never implement-ed VoC projects were among the smallest com-pany size we recorded (below $100 million).
The most interesting part was when we cross-referenced with respondents that have already deployed VoC initiatives in their organizations. We heard many times that larger companies were able to do better projects, we would have expect-ed the number of organizations to increase as the size of the organization increases, showing a trending line that results in more large companies than smaller ones.
Surprisingly (Figure 3), that was not what we saw.
We found that an approximate equal number of companies above and below $1 Billion in revenue were working on VoC. In addition, the breakdown below $1 Billion showed that an equal number of small and midsize organizations were working with VoC initiatives as well. This proves that com-pany size is not an impediment to implementing VoC initiatives.
Cross-tabbing the company size with the com-pany satisfaction, we saw an interesting trend (Figure 4). Larger organizations are more likely to report being satisfied with their VoC initiatives, while smaller companies rate their satisfaction level at mediocre or lower. This was a significantly intriguing answer, so we reached out to a few of the respondents who rated themselves lower.
In conversations, they shared that the problem was that they saw they had a lot more to do—but did not have the resources (either people or access to budget) to do everything they want to do. In these cases, “there is a need for time, money and the right people to implement VoC as well as you can.” However, none of the individuals we interviewed said they would stop their programs if they were not able to improve them. They all saw value in continuing their initiatives—even if they could not do them at the desired level.
Figure 3
Figure 4

RESEARCH REPORT — AUGUST 2011
page 9Voice of the Customer
CONCLUSION: As the title for this section says, size does matter. It is not true that larger companies are capable of de-ploying better projects or managing the feedback differently just by being larger—but they can do so by having more resources available. We don’t want to discourage any size organization from starting down the path to VoC—but we want to encourage those with fewer resources to aim for smaller, simpler proj-ects that they can manage more easily. The value they can obtain from a project made to their scale and capabilities is bound to be right for their organization. Remember, none of the individuals interviewed say there was no value in VoC initiatives—just that they wished they could do more, or have more resources.
The Right Information Helps To Extend Awareness into Action
The idea of using the Voice of the Customer to improve the Customer Experi-ence has been at the forefront of Customer Strategies for over a decade. There has been a lot of information and data created around these themes, and many more sources being created almost daily (if not weekly) to share that informa-tion. Finding information about VoC is not hard—a simple Google search on the subject yields over 17,000,000 results.
To find out what people prefer to read, or whom, and what information they are seeking, we asked practitioners where they get their information about VoC topics. Then, to see what their opinion was of the information received, we asked them to rank the same sites based on their relevancy. Figure 5 shows the results of these two questions together.
The first insight that surfaced from this line of questioning is that users seem to get most of their information either from online magazines or journals, or from their colleagues. These colleagues, in turn, read information online and passed it along via email or other collaboration tools (we asked them in the follow-up interviews, a very small number mentioned print journals or magazines, too few to mention as a trend). In reality, this means that the vast majority—if not all of the users—prefer online publications to get their information.
Once we merged the response of readership and relevance, we notice that the same online maga-zines and publications that were cited as the larg-est source were also, by comparison, the ones that were not ranked as relevant (when compared
to other relevancy-to-readership ratios). We see an increase in the relevancy of bloggers, analysts, and research houses (thank you), again in relation to the number of answers.
This is where it gets interesting—we wanted to see how satisfaction with their current implementations correlates to the value of the information received. We evaluated the correlation between the informa-tion our respondents read and the level of satisfaction with their current implementations. What we
Larger organizations
are more likely
to report being
satisfied with their
VoC initiatives.
Figure 5

RESEARCH REPORT — AUGUST 2011
page 10Voice of the Customer
found, shown here in Figure 6, is something surprising. In spite of all the information read and all the distribution and exchange of information be-tween colleagues, the majority of all cases (highlighted in red in the table) shows that those that read and took advice from—well, virtually anywhere—never managed to create something above average.
This was almost shocking. For years as an analyst and advisor to organiza-tions of all sizes, I had been led to believe that best practices and lessons learned (that information which is shared and written to distribute to practitio-ners) are the best way to deploy leading-edge initiatives. What on earth could push those implementing the advice we give them to rate their implementations as average?
We interviewed a few of them and we found an answer. Well, two answers. First, the level of reported satisfaction is not an indication of how well they are doing (the large majority said this) in relation to the rest of the world, but in relation to what their expectations were. Thus, a rating of “Average” simply means that their expectations were met. Alas, the relief lasted shortly. The reason their expectations were met was because the literature and research led them to believe that was all they could do.
In reality, the majority of the practitioners wanted to do something special for their customers: deploy incredibly insightful and personalized experiences, innovate beyond what others had done. Unfortunately, and this is where the second part of the answer came in, that was not possible with the information we had shared.
The information that users were given, via any channel, led them to create something that was similar to what others were doing, albeit slightly person-alized to their customers’ needs. What these organizations were looking for, especially the 75% that have done or were doing something about VoC, was something above and highly different.
Figure 6
The majority of the
practitioners wanted to
do something special
for their customers:
deploy incredibly
insightful and person-
alized experiences,
innovate beyond what
others had done.
RESEARCH REPORT — AUGUST 2011
page 11Voice of the Customer
CONCLUSION: Our respondents’ belief, and their responses to us, led us to understand that they did not think they could be different and innovative by following lessons learned and best practices. While those were very useful in deploying the first stage of VoC, each organization realized that they had to create their own program, with their own lessons learned and best practices, to deliver what they wanted.
Adopting VoC Initiatives Requires Executive Sponsorship to Succeed
The perennial question: is Executive Sponsorship and Support of a project critical for it to suc-ceed? Or is that more new-age philosophy used as an excuse for the failing projects (e.g. “it did not have executive sponsorship”).
While I have maintained for a very long time that Executive Sponsorship is critical for the success of the project, and still believe that, I wanted to explore this in correlation to the quality of the VoC solution deployed. We first sought to find an entry level benchmark in relation to Executive Sponsorship and ownership of the project: who sponsors and is in charge of the VoC projects.
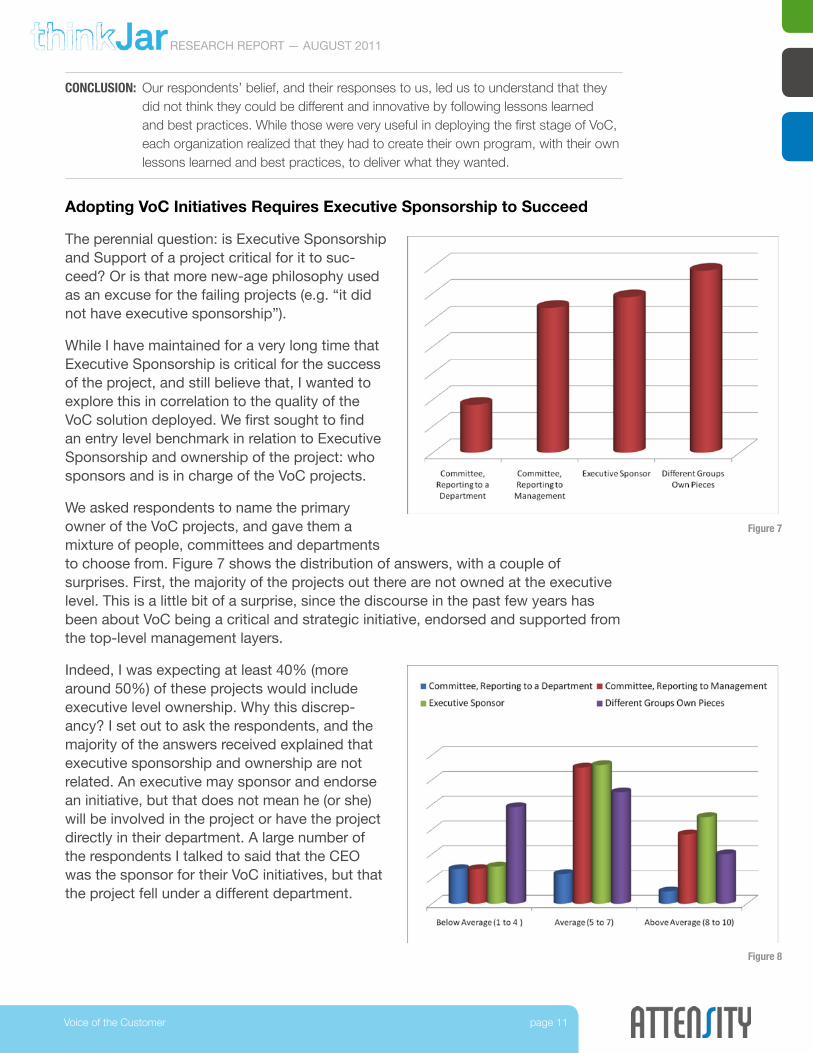
We asked respondents to name the primary owner of the VoC projects, and gave them a mixture of people, committees and departments to choose from. Figure 7 shows the distribution of answers, with a couple of surprises. First, the majority of the projects out there are not owned at the executive level. This is a little bit of a surprise, since the discourse in the past few years has been about VoC being a critical and strategic initiative, endorsed and supported from the top-level management layers.
Indeed, I was expecting at least 40% (more around 50%) of these projects would include executive level ownership. Why this discrep-ancy? I set out to ask the respondents, and the majority of the answers received explained that executive sponsorship and ownership are not related. An executive may sponsor and endorse an initiative, but that does not mean he (or she) will be involved in the project or have the project directly in their department. A large number of the respondents I talked to said that the CEO was the sponsor for their VoC initiatives, but that the project fell under a different department.
Figure 7
Figure 8

RESEARCH REPORT — AUGUST 2011
page 12Voice of the Customer
When we looked at the data (we asked respondents who said an executive owned the project to tell us which department it was) we find a few more clues into this: half of the respondents said that the initiative is owned by either Marketing or Customer Service, with another quarter of the answers with Customer Experience, Client, or VoC in the title (the rest is distributed among many keywords like operations, research, analytics, and the like).
Essentially, as we discovered by talking to the respondents and looking at the data, Customer Service or Marketing are the executives sponsoring over 60% of the projects. This is in line with our expectations. The other 40% either have other executives sponsoring it (the CEO is the one that came the most often) or no executive sponsorship (we concluded that between 5-10% of projects had no executive sponsorship by combining the data and the interviews).
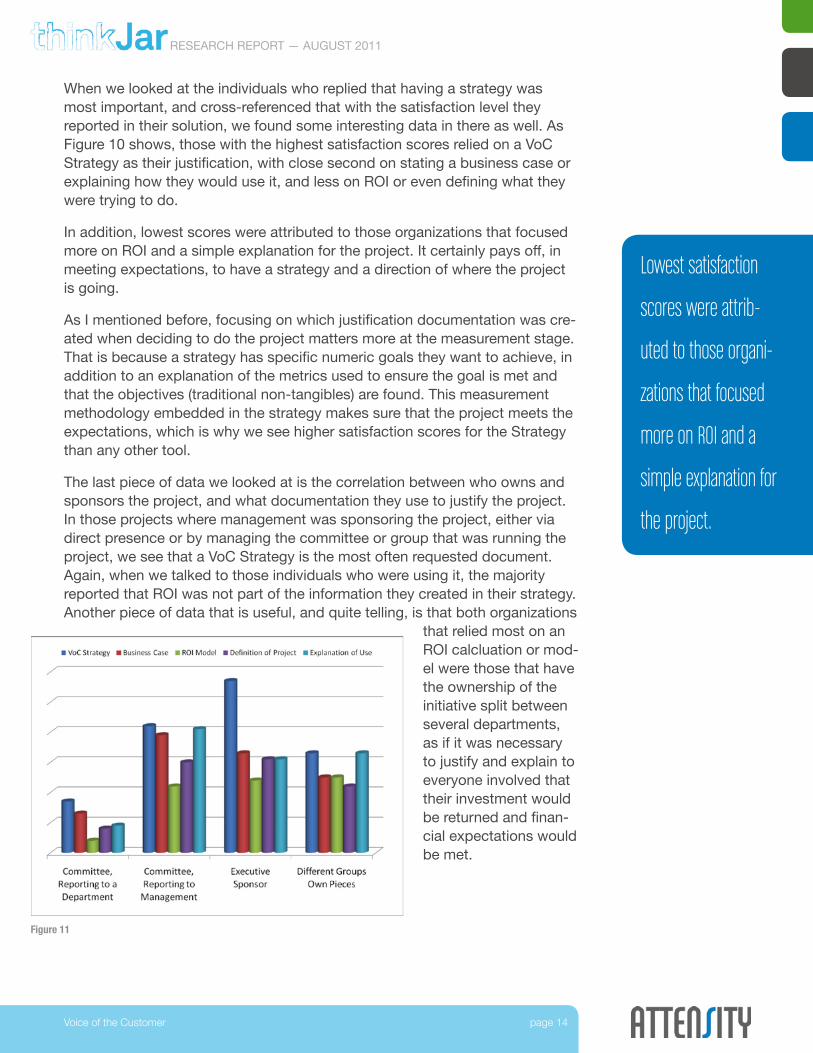
Once we determined that executive sponsorship was present in most of the initiatives, we wanted to examine how the ownership of the project would change the satisfaction with its results. We cross-tabbed the above responses to the self-reported quality of the initiative, as we have done for the other questions in this report. Figure 8 shows the results, and this is where we see the importance of executive ownership and sponsorship.
Projects owned by an executive sponsor had the highest overall degree of sat-isfaction with the results. Projects that were haphazardly owned by several had the lowest scores for satisfaction. The level of satisfaction we measured, as explained before, talks to the project delivering the results expected and having a high quality per the respondents.
The second data point to note: those projects that were owned by committee, but reporting to Management, had a high-degree of internal satisfaction as well, while those owned by a department—not reporting directly to management, had a lower degree of satisfaction. When we looked at the crosstabs for company size and industry, we saw no changes in the distribution.
CONCLUSION: Executive Sponsorship is critical, mandatory, or essential for the VoC project to be successful. There is not a lot more to say here.
There are Better Justifications for VoC than ROI
With the question of Executive Sponsorship and ownership behind us, is time to move along the adoption timeline into deployment. Here is where we find the next best practice: a good VoC initiative can prove the ROI and justify itself with a good business plan.
In all the years I have done these projects, I have met many different theories (and practices) surrounding the business case for VoC. I was curious how the data would (or would not) support my findings: having a business case is no indicator of success, expectations met, or satisfaction with the project. The best calculated ROI means nothing to a project that does not achieve its goals (and there is no direct correlation between having an ROI or strategy and knowing the goals of objectives for the project, but I digress).
Half of the respon-
dents said that the
initiative is owned by
either Marketing or
Customer Service, with
another quarter of the
answers with Custom-
er Experience, Client,
or VoC in the title.
Projects owned by an
executive sponsor had
the highest overall
degree of satisfaction
with the results.

RESEARCH REPORT — AUGUST 2011
page 13Voice of the Customer
We asked respondents to the survey which documents they were expected to produce before the project was approved. The exact wording of the question is in Appendix A, and the results of the same are in Figure 9.
If you have been driven to believe that all enterprise software projects require a ROI calculation, you are looking at this chart and saying “No way, that is wrong!” Hard to believe, but the good-old ROI calculation was not a requirement to justify the initiative.
Finally, some good news supported by data (and one that vendors may hate): ROI on strategic projects is
not necessary. Because we differentiate between business case and ROI, we wanted to make sure there was no “hidden” ROI documentation within the business cases. We interviewed a few of those respondents, and the consen-sus (over three-quarters of the interviewees) was that ROI was not part of the business case, but benefits and costs were (just not related together as in a traditional ROI model).
Further, from the fairly large number of respon-dents who chose “Other” as their response, more than half of them reported not being asked for any documentation at all. When we talked to them, they insisted that the justification was not necessary since it was a corporate-driven strategy, and the need for it to remain competi-tive was sufficient justification.
This was going in the right direction already, but I wanted to see two more things in more detail: 1) how having a strategy related to the satisfaction level on the project; and 2) how the documentation requirements cross-tabbed to the ownership of the project. These are very important questions that have more implications in measurement than anything else.
Figure 9
The good-old ROI
calculation was not a
requirement to justify
the initiative.
Figure 10
RESEARCH REPORT — AUGUST 2011
page 14Voice of the Customer
When we looked at the individuals who replied that having a strategy was most important, and cross-referenced that with the satisfaction level they reported in their solution, we found some interesting data in there as well. As Figure 10 shows, those with the highest satisfaction scores relied on a VoC Strategy as their justification, with close second on stating a business case or explaining how they would use it, and less on ROI or even defining what they were trying to do.
In addition, lowest scores were attributed to those organizations that focused more on ROI and a simple explanation for the project. It certainly pays off, in meeting expectations, to have a strategy and a direction of where the project is going.
As I mentioned before, focusing on which justification documentation was cre-ated when deciding to do the project matters more at the measurement stage. That is because a strategy has specific numeric goals they want to achieve, in addition to an explanation of the metrics used to ensure the goal is met and that the objectives (traditional non-tangibles) are found. This measurement methodology embedded in the strategy makes sure that the project meets the expectations, which is why we see higher satisfaction scores for the Strategy than any other tool.
The last piece of data we looked at is the correlation between who owns and sponsors the project, and what documentation they use to justify the project. In those projects where management was sponsoring the project, either via direct presence or by managing the committee or group that was running the project, we see that a VoC Strategy is the most often requested document. Again, when we talked to those individuals who were using it, the majority reported that ROI was not part of the information they created in their strategy. Another piece of data that is useful, and quite telling, is that both organizations
that relied most on an ROI calcluation or mod-el were those that have the ownership of the initiative split between several departments, as if it was necessary to justify and explain to everyone involved that their investment would be returned and finan-cial expectations would be met.
Lowest satisfaction
scores were attrib-
uted to those organi-
zations that focused
more on ROI and a
simple explanation for
the project.
Figure 11
RESEARCH REPORT — AUGUST 2011
page 15Voice of the Customer
CONCLUSION: In spite of the assumption that ROI is a critical part of justifying the deployment of a VoC initaitive, it is more important to create a complete strategy with specific metrics, goals and objectives, and rely on that to ensure that expectations are met. In highly political cases, as when the ownership is distributed, an ROI may prove valuable to justify the investment by the many different departments, but the higher degree of satisfaction among those projects that are sponsored and owned by man-agement will steer leading edge adopters away from any committee-owned project in favor of direct executive sponsorship with management involvement.
Adopting VoC Also Requires a Reason
We know from customer and executive interviews we conduct that the two main reasons organizations quote for pursuing a VoC initiative are customer satisfaction and feedback. However, we also know that financials and competitive forces are at play—always—and alter the way VoC initiatives happen. It changes them from vision-ary and proactive (when the reason is known before starting) to reactionary in those cases when the solution is deployed first, and justification comes after.
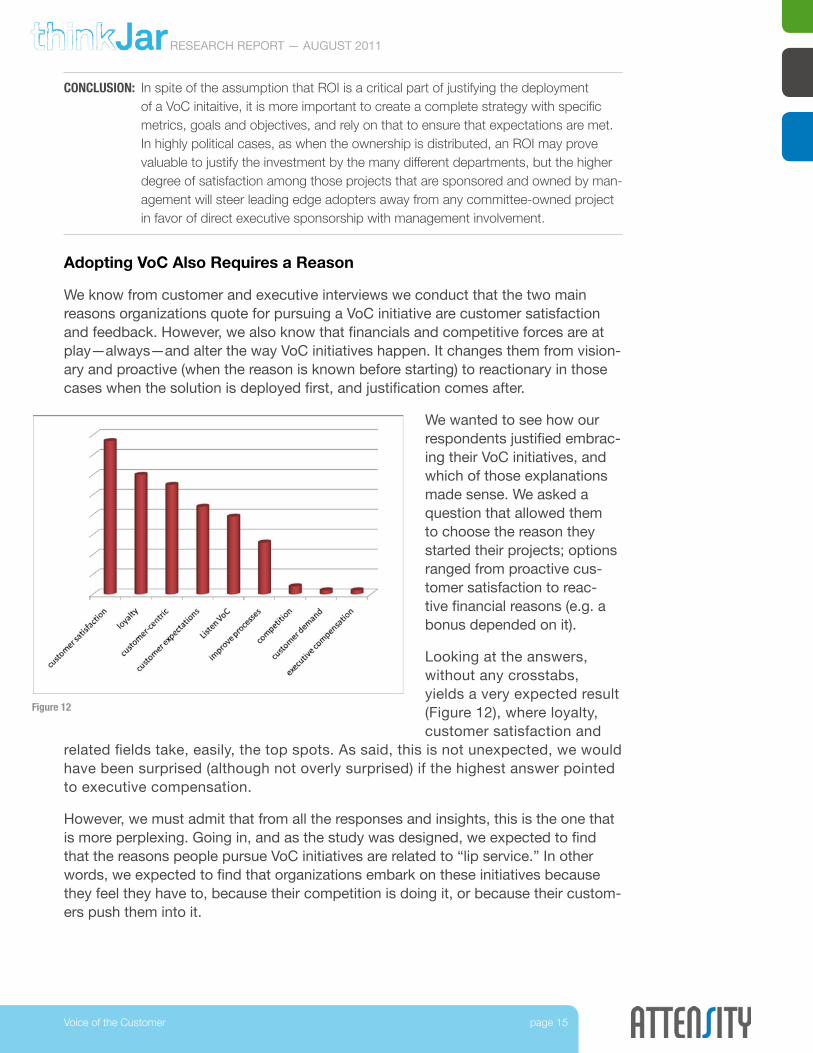
We wanted to see how our respondents justified embrac-ing their VoC initiatives, and which of those explanations made sense. We asked a question that allowed them to choose the reason they started their projects; options ranged from proactive cus-tomer satisfaction to reac-tive financial reasons (e.g. a bonus depended on it).
Looking at the answers, without any crosstabs, yields a very expected result (Figure 12), where loyalty, customer satisfaction and
related fields take, easily, the top spots. As said, this is not unexpected, we would have been surprised (although not overly surprised) if the highest answer pointed to executive compensation.
However, we must admit that from all the responses and insights, this is the one that is more perplexing. Going in, and as the study was designed, we expected to find that the reasons people pursue VoC initiatives are related to “lip service.” In other words, we expected to find that organizations embark on these initiatives because they feel they have to, because their competition is doing it, or because their custom-ers push them into it.
Figure 12

RESEARCH REPORT — AUGUST 2011
page 16Voice of the Customer
Until not that long ago, the lack of understanding of what VoC initiatives entailed and what was meant by it would have yielded results along these lines: we expected to see the chart in Figure 12 above, but we also expected organiza-tions to be more focused on how they need to do things, rather than on how the customers ask them to. The logic behind this argument told us we should have seen a heavier investment in CRM, BPM and traditional tools of customer management to justify this position.
Instead, what we found was that our respondents were using the right tools to focus on customer-centricity: social media monitoring, surveys, analytics and EFM. True, there are some gaps in this proof—but it is there. What we would consider the core rea-son for deploying these solutions, i.e. listening to the customer and acting on those conversations, is not at the top of the responses, rather in the middle. This is slightly
off; we would expect that listening to the customer and their expectations would have been at the top of reasons for implementing a VoC initiative.
We followed up with some interviews, and the answers yield some insight. Most of them consider customer satisfaction the measurement of customer expectations being met, and of the company meeting their needs. It is not that simple. Customer satisfaction scores, while influenced by expectations being met, are also influenced by a slew of external factors over which the company has no control.
In a perfect world, with perfect customers, there would be a direct relationship. Alas, we don’t live in perfect worlds. Customer Satisfaction is a fuzzy (or vanity) metric that is used, incorrectly, to showcase health of the customer experience. In reality, a well implemented focus on the customer (that relies on other more actionable metrics) is a better approach. We bundle these initiatives under the term customer-centricity. The tools they use to conduct EFM, as shown in Figure 13, showcase how organizations are better suited to complete customer-centric initiatives than we previously estimated, with one minor caveat.
Figure 13
Customer Satisfaction
is a fuzzy (or vanity)
metric that is used,
incorrectly, to show-
case health of the
customer experience.

RESEARCH REPORT — AUGUST 2011
page 17Voice of the Customer
The use of EFM (enterprise feedback management, a centralizing set of tools used to both aggregate corporate data with feedback and to generate insights from the feedback collected) is very low. In fact, we would have expected to see a far larger adoption of EFM tools (more discussion on tools used can be found in the next section) than we found. We know that generating insights from the feedback collected is one of the two core jobs a customer-centric organization must carry out (the other one is to actually implement those insights), so we were a little concerned that this was not getting done. Until we noticed that the use of Analytics was far more advanced than we expected.
The next two sections will dig deeper into the use of different tools and the use of analytics, but we found the correlation between the reason used to justify the investment, and the reality of the investment, to be a powerful point that reflects on how money, time and efforts seem to be focused on the right actions to deploy VoC Initiatives.
CONCLUSION: While we expected coming into this study to see a better use of feedback management tools, we can see that is not the case. The surprising discovery that use of analytics is farther along than expected, coupled with the slow adoption of EFM tools, prompted us to believe that deployments of VoC projects are far better off than we expected and that organizations are not only talking about being customer-centric and listen to the VoC, they are actually “walking the talk” and doing it quite well.
Tools Used in Deploying VoC Initiatives
Traditionally, tools have been sought as the answer to VoC and Customer Experience projects. These initiatives, always looking to listen to the customer and understand them better, have been focused primarily on how to capture the needs and desires of the customer directly. Tools such as surveys, and its “centralizing” cousin EFM, as well as Business Intelligence and Analytics (used to understand what the captured and stored data reveal about the customer) have been dom-inant in the fields of VoC and CEM.
When we began this research, we wanted to confirm two things: first, that this was still the case and that those tools were the most used; and secondly, to corroborate the degree to which these tools were fulfilling corporate needs, which would be evidenced by continuous invest-ment in them.
We compared current investments to future in-vestments in Figure 14, revealing two interesting facts: first, a decrease in the investment in these traditional tools; and second the return to more “traditional” tools for managing the relationship with the customer. Let’s dig a little deeper into these two trends.
Figure 14
RESEARCH REPORT — AUGUST 2011
page 18Voice of the Customer
Further conversations with practitioners told us even though tools like surveys and analytics had proven useful, they had proven more complex to manage and harder to deploy than initially thought. One of the respondents we talked to said specifically that, without specialized knowledge, they found that their surveys were simply not returning the value they expected from asking customers. Their analysis of the responses yielded insights that were not sufficiently vetted to be acted on (they did not have sufficient number of similar responses, or the results were not the same each time, making it very hard to trust the results and to rely on them to make decisions).
When it comes to analytics, the results were almost as bad, but for different reasons: it seems easy at first, but the complicated interfaces and the needs for highly spe-cialized users that understand how to manage and use data, and what to do with it, makes it hard to justify the use by business users. Those organizations that had stakeholders well versed in the use and manipulation of data saw good results, but the time it took them to figure it out was too long (in their opinion).
These two opinions highlight one of the core lessons we learned in VoC implemen-tations: reporting what data we have is fairly easy to do, and an essential part of an early VoC program, but it pales to the value that can be obtained from a well executed Analytics function within the initiative that relies on large volumes of data. The problem lately has been that survey fatigue and low volume of survey responses (users are getting tired of getting asked for their opinion everywhere they go—from web sites to fast food places) has yielded volumes that leave organizations unable to analyze the incoming data.
The second trend, the shift to Social Media Monitoring and to traditional CRM and BPM functions, shows where we are today (and where we are going) in VoC. After we tried to collect direct feedback, via surveys and EFM tools, and analyze them for insights (and after we discovered that the low volume was our enemy) we turned to finding more data. The data produced and captured from social channels, can be up to 100 times more than data collected via traditional feedback channels.
The lack of understanding of social data, how to merge it with existing data and how to process it is leading the move to invest in capturing this data (SMM tools), to aggregate it with CRM systems, and to use BPM to change processes to adapt and embrace so-cial data. This data confirms the same trends we are hearing from our clients.
CONCLUSION: While organizations understand that they need to ask their customers directly for their needs and desires, they are also finding out that use of social data and the tools to analyze it and act on it is becoming a more critical source of information. Consequently, we are seeing a shift from traditional feedback capture and analyz-ing tools to social media capture and integration tools. We expect to continue to see an embrace of analytics tools in the coming year, or rather organizations go-ing back to them, once the analytical tools that ship with Social Media monitoring and analysis offers prove inadequate for the task at hand: analyzing big data.
We are seeing a
shift from traditional
feedback capture
and analyzing tools to
social media capture
and integration tools.

RESEARCH REPORT — AUGUST 2011
page 19Voice of the Customer
Optimizing VoC Initiatives
We wanted to spend more time looking at optimization of VoC deployments, since our research has shown that this is the area where there is more room for growth. Getting the justification, choosing the tools and creating the infrastructure to support Customer Experience and VoC initiatives is something that we have been doing for quite some time with a certain degree of success. As reflected in the previous sections, there are certain elements that must be present for the project to achieve objectives, but that is usually the first phase.
The second phase, or the recurring phases after the first one, to be more accurate, is about opti-mizing the deployment. Optimizing a VoC proj-ect is about understanding what the customer wants, what is missing or not-very-successful from the current deployments, and making the necessary changes to systems, processes and even people, if necessary, to address those shortcomings. As you can imagine, the first task is to adequately understand what is being done with the data being collected.
In truth, most organizations already have plans for the feedback before deploying their VoC initia-tives: it is part of the business justification and the first phase described earlier. Alas, once the first phase is complete, the analysis to determine where to go next, and what to improve, is where things get tricky. More often than not, organizations either fail to recognize the value of the information they collected, or fail to understand what it is saying. We asked the respondents what they were doing with this feedback; their responses are in Figure 15.
We were glad to see that over 35% of the respondents are using feedback as a critical component of their VoC initiatives, but somewhat discouraged that 15% of them don’t collect it, with another 15% or so that use it sparingly. This represents more than 30% of the re-spondents not leverag-ing the value of having deployed VoC program.
Figure 15
More often than not,
organizations either
fail to recognize the
value of the informa-
tion they collected,
or fail to understand
what it is saying.Figure 16

RESEARCH REPORT — AUGUST 2011
page 20Voice of the Customer
Since we know that, after all is said and done, the only purpose of launching these initiatives is to listen to the feedback and act on it; we wanted to cross-reference the responses to this question with the perception from the respon-dents on whether they had a good, average, or bad deployment. We think that those that met the expectations, and thus had a higher-than-average score for satisfaction with the deployment, were those that were appropriately using the feedback. Figure 16 shows the data from that cross-referencing.
As you can see, there are no major surprises here, but a good validation: those with the highest satisfaction ratings have both identified the feedback collected as a critical component of their VoC deployments and have used it to improve their business. Even those with average-rated solutions (which were the vast majority of them) expressed the same thing.
There is one more aspect we wanted to explore when we created this study: how is the feedback collected used to solve the problems that drove the organization to be interested in VoC solutions? We asked VoC practitioners what problems they noted they were having with their business that drove them to be interested in listening to the customers. The answers ranged from no problems to losing customers to lagging competitors. To evaluate how those originating problems were addressed by collecting the appropriate feedback from customers we cross-tabbed those two questions. The resulting chart can be seen in Figure 17.
First, if we look at practitioners who claim to have problems knowing what their customers’ expectations were, we notice that a fairly large group of those use feedback sparingly (even though they have marked it as being a critical component). This inconsistency led me to set up some interviews.
During these inter-views, we learned that these respondents had not used feedback in the past, and the large majority were still not using it as much as they wanted. This led them to rank themselves as using it sparingly. However, they have now, as they begin to iterate and leverage their deploy-ment, identified feed-back as critical since they understand that
is where the customer information is. They are working their way back into understanding their customers, and that is why they marked themselves as “trying to get better.”
More than 30% of
the respondents
are not leveraging
the value of
having deployed
VoC program.
A fairly large group
use customer feed-
back sparingly, even
though they have
marked it as being a
critical component.
Figure 17

RESEARCH REPORT — AUGUST 2011
page 21Voice of the Customer
Second, outside of those who declared their VoC solutions satisfactory, there are two groups: one of them is concerned with customer intimacy (losing them, or not knowing their expectations), and the second group is concerned with operational excellence (how well the company is executing in relation to its competitors).
The group that is focused on customer intimacy identified feedback as a critical component of their VoC deployments. Rightfully so, this is how they remain con-nected and listening to their customers, and how they see the deployed solutions making a difference for the organization. A part of this group are those that are focused on knowing their customer expectations, which will prove a challenging and equally interesting process through the next 2-3 years.
The second group, the one focused on operational excellence, is more focused on competing effectively and, of course, making money. As shown in the chart, these organizations, even though they consider feedback critical, also con-fess to using it sparingly and are working on improving the way they use it. We wanted to learn a little bit more about this group, so we interviewed some of them over the phone to round out our knowledge of what they were looking for.
This was another very interesting insight. Those that used feedback “once in a while,” as one of the interviewees declared, are coming around. The availability of more data, not only Big Data but also the overabundance of data that part-ners and alliances are willing to share in an ever-more connected world, is giving them room to ponder. The results that we are seeing published in journal and business publications, and all the discussions on what EFM, surveys and analyt-ics can do, are piquing the curiosity of those that were not big fans before.
That, coupled with the initial results they are seeing when they do move to using analytics, is fueling this growth. The biggest challenge, as they say and we saw before, are not the tools and technologies, or even the results, but finding the right people to make the data useful and the analysis insightful. As one of the practitioners we talked to said, “It is a far, far cry from intuitive and with the huge promise looming, well, we are definitely in need of someone to help us there.”
Indeed, learning how to make sense of the data collected in VoC initiatives is the next frontier for businesses, not deploying VoC projects. That is a given.
Learning how to make sense of the data collected in VoC initiatives is the next
frontier for businesses, not deploying VoC projects. That is a given.

RESEARCH REPORT — AUGUST 2011
page 22Voice of the Customer
About ThinkJar
ThinkJar (http://thinkJar.net) is an advisory and think tank focused on Customer Strategies. It conducts the research and analysis of the information necessary for clients to succeed in their planning and implementations of CRM, CEM and CX initiatives. Founded by Esteban Kolsky, a former Gartner analyst, and with partnerships and alliances among the most regarded thought-leaders in the industry, ThinkJar provides the necessary information to adapt to the Social Customer and evolve though the Social Evolution.
About Attensity™
Attensity’s text analytics solutions are the choice of the world’s leading brands for Customer Experience Management (CEM). Attensity is the only company that gives business users the ability to analyze millions of real-time customer conver-sations from any online, social media or internal source, and extract the industry’s most accurate insights to drive business decisions. From its headquarters in Palo Alto, Calif., and Kaiserslautern, Germany, Attensity is powering the customer experience strategies of companies such as Charles Schwab, Citi, HP, JetBlue, Lloyd’s Banking Group, Siemens, Starwood Resorts, Travelocity and Whirlpool. Visit www.attensity.com and follow the company at blog.attensity.com, on Twitter @Attensity, and on facebook.com/Attensity.
>
>
©2011 Attensity Group. Attensity is a trademark of Attensity Group in the United States and/or other countries. All rights reserved.

RESEARCH REPORT — AUGUST 2011
page 23Voice of the Customer
Appendix A – Questions, Answers>DEMOGRAPHIC INFORMATION Industry
Agriculture 4
Business Services/Consulting 29
Chemicals 6
Consumer Products 21
Electronics 6
Energy/Utilities 6
Finance: Brokerage 5
Finance: Other 16
Finance: Retail Banking 25
Finance 46
Food & Beverage Mfg 4
Government: Federal 4
Government: State & local 2
Government 6
Healthcare 15
Home/Appliances 1
Hospitality: Hotels 4
Hospitality: Other 2
Hospitality: Restaurants & Bars 2
Hospitality 8
Industrial Manufacturing 17
Insurance: Health 9
Insurance: Life 10
Insurance: Other/reinsurance 1
Insurance: P&C 19
Insurance 39
Media 4
Media/Entertainment 4
Media 8
Nonprofit 7
Other 25
Pharma/Biotech 11
continued >>
Professional Services 13
Retail: Big Box 1
Retail: Grocery 1
Retail: Other 7
Retail 9
Technology: Computers 5
Technology: Mobile Devices 3
Technology: Other 16
Technology: Software Products 38
Technology 62
Telco/ISP/Comms 18
Transportation 7
Travel: Airlines 7
Travel: Reservations 3
Travel 10
>> industry continued ...

RESEARCH REPORT — AUGUST 2011
page 24Voice of the Customer
DEMOGRAPHIC INFORMATION Location
* Afghanistan 1
* Australia 3
* Austria 1
* Azerbaijan 1
* Belgium 1
* Brazil 1
* Canada 29
* Colombia 1
* Czech Republic 1
* Dominican Republic 1
* Finland 2
* Germany 1
* India 4
* Ireland 2
* Italy 1
* Mayotte 1
* Mexico 5
* Norway 1
* Qatar 1
* Romania 1
* Singapore 1
* Sri Lanka 1
* Switzerland 3
* Thailand 1
* United Kingdom 6
* United States 328
DEMOGRAPHIC INFORMATION Department or Function
Customer Service 64
IT 43
Marketing 150
Other (Please Specify) 142
Experience 2
Analytics 5
Client 2
Customer 3
VoC 1
Research 4
Operations 2
Marketing 2
DEMOGRAPHIC INFORMATION Company Size
0-$100M 101
$101M-$1B 92
Over $1B 206

RESEARCH REPORT — AUGUST 2011
page 25Voice of the Customer
Q1: VoC Current Situation
QUESTION
Select the statement that best describes your organization’s situation.
ANSWERS
WeareactivelyplanningourfirstVoiceoftheCustomerprojecttoberolled out in the near future 33
Wearepreparingtorollout(orhavejustrolledout)ourfirstVoiceofthe Customer project 27
We deployed Voice of the Customer projects in the past and we need more projects; already launched them 154
We deployed Voice of the Customer projects in the past and we need more projects; not currently scheduled 70
WedeployedVoiceoftheCustomerprojectsinthepast,theyarefinished and we are not doing any more 21
We never deployed any Voice of the Customer projects 94
Q2: Primary Owner of VoC Initiatives
QUESTION
Who is the primary owner of the Voice of the Customer projects deployed or currently underway in your company?
ANSWERS
A committee or group of departments, reporting to a department, is responsible for Voice of the Customer projects 36
A committee or group of departments, reporting to management, is responsible for Voice of the Customer projects 109
An Executive is responsible for Voice of the Customer projects 117
There is not one responsible entity, department, or person; different groups and people own parts of it 137

RESEARCH REPORT — AUGUST 2011
page 26Voice of the Customer
Q3: Confusion about VoC
QUESTION
Would you say your organization is confused about what Voice of the Customer is, or how to implement it?
ANSWERS
Yes 126
No 221
Q4: Driver for Project
QUESTION
What is the main driver for Voice of the Customer projects in your organization (choose one)?
ANSWERS
Becoming customer-centric 55
Delivering to customers expectations 44
Improving our processes 26
Increasing customer satisfaction 77
Increasing loyalty 60
Listening to the voice of the customer 39
Our competitors are doing it 4
Our customers demanded it 2
Our executives have to do it (MBO, Bonus, Compensation) 2
I am not sure, don’t know, or has not been communicated 90

RESEARCH REPORT — AUGUST 2011
page 27Voice of the Customer
Q5: Problems Caused by Lack of VoC
QUESTION
What problems has it caused (in the past), or is causing (currently) in your organization to NOT have Voice of the Customer initiatives (check all that apply)?
ANSWERS
WearesatisfiedwithourVoiceoftheCustomerInitiatives 106
We lost customers, partners, suppliers, or prospects 77
We lost money to customer retention practices 43
We don’t know what our customers expect from us 101
Our products and services lag our competitors’ 67
We lost our competitive advantage 54
Other (please specify) 63
Q6: Documents Used to Justify VoC
QUESTION
Were you asked to create any of the following documents before starting your Voice of the Customer project (check all that apply)?
ANSWERS
A Voice of the Customer strategy 149
A business case 110
A return on investment model 75
A thought leadership document explaining what it is, and how it can be used 91
A detailed explanation of where it will be used and how 114
Other (please specify) 85

RESEARCH REPORT — AUGUST 2011
page 28Voice of the Customer
Q7: Use of Feedback
QUESTION
How has your organization used the feedback generated from the Voice of the Customer initiatives?
ANSWERS
We don’t collect feedback on Voice of the Customer projects 51
We don’t do a great job of collecting feedback; we are changing our feedback processes to do a better job 48
We experienced improved business results from insights generated by Voice of the Customer feedback 79
Wehavesparinglyusedfeedbacktofixthemostpressingproblemsour customersidentified 54
WeidentifiedfeedbackonVoiceoftheCustomerasacriticalcomponent for the success of the initiatives 115
Q8: Current Tools and Technologies Use
QUESTION
From the following tools and technologies, which are you already using in your VoC initiatives (check all that apply)?
ANSWERS
Social media monitoring 159
Business Intelligence 137
Analytics 181
Surveys 271
Enterprise Feedback Management 68
Call Center / Contact Center 170
Email management 91
Website development 101
Customer Relationship Management 144
Business Process Management or Similar 71
Other (please specify) 25

RESEARCH REPORT — AUGUST 2011
page 29Voice of the Customer
Q9: Planned Technology Investment
QUESTION
From the following tools and technologies, which ones will you invest in 2011-2012? (check all that apply)
ANSWERS
Social media monitoring 188
Business Intelligence 123
Analytics 172
Surveys 199
Enterprise Feedback Management 64
Call Center / Contact Center 117
Email management 91
Website development 140
Customer Relationship Management 150
Business Process Management or Similar 86
Other (please specify) 21
Q10: Currently Analytics Use
QUESTION
Which type of analytics software are you using (check all that applies)?
ANSWERS
Customer Analytics 20
Text Analytics 10
Web Analytics 14
Predictive Analytics 4
Speech Analytics 6
Analytics Engine 1
Other 6
RESEARCH REPORT — AUGUST 2011
page 30Voice of the Customer
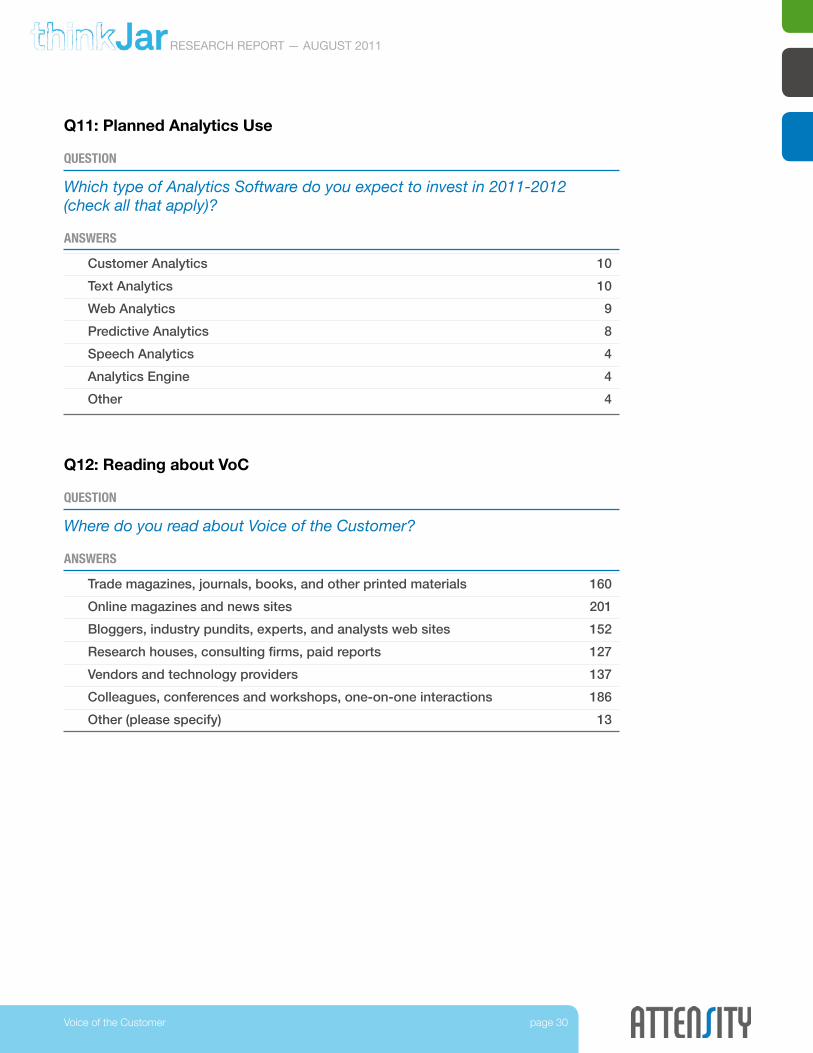
Q11: Planned Analytics Use
QUESTION
Which type of Analytics Software do you expect to invest in 2011-2012 (check all that apply)?
ANSWERS
Customer Analytics 10
Text Analytics 10
Web Analytics 9
Predictive Analytics 8
Speech Analytics 4
Analytics Engine 4
Other 4
Q12: Reading about VoC
QUESTION
Where do you read about Voice of the Customer?
ANSWERS
Trade magazines, journals, books, and other printed materials 160
Online magazines and news sites 201
Bloggers, industry pundits, experts, and analysts web sites 152
Researchhouses,consultingfirms,paidreports 127
Vendors and technology providers 137
Colleagues, conferences and workshops, one-on-one interactions 186
Other (please specify) 13

RESEARCH REPORT — AUGUST 2011
page 31Voice of the Customer
Q13: Finding Relevant Information
QUESTION
Where do you find the most relevant information on Voice of the Customer?
ANSWERS
Trade magazines, journals, books, and other printed materials 83
Online magazines and news sites 120
Bloggers, industry pundits, experts, and analysts web sites 104
Researchhouses,consultingfirms,paidreports 83
Vendors and technology providers 76
Colleagues, conferences and workshops, one-on-one interactions 127
Other (please specify) 17
Q14: Rate your VoC Implementation
QUESTION
On a scale from 1-10, where 1 is poor and 10 is excellent, how would you rate your current Voice of the Customer initiatives?
ANSWERS
1 – Poor 17
2 16
3 22
4 27
5 – Average 59
6 46
7 63
8 61
9 19
10 – Excellent 8