vojtěch janoušek czech geological survey & charles ...janousek/rkurz/r_motivation.pdf ·...
TRANSCRIPT

Vojtěch Janoušek Czech Geological Survey
& Charles University, Prague
Jean-François Moyen Université Saint Etienne, France
Vojtěch Erban Czech Geological Survey, Prague
Colin M. Farrow ex-Computing Service, University of Glasgow,
Scotland

The challenge: Interpretation of whole-rock geochemical data
• Lunar program in the late 1960’s came with the requirement of precise and accurate chemical, and then isotopic, analyses of small samples.
• This led to innovations: in 1970’s appeared analytical techniques for trace-element determinations (e.g., XRF; INAA), later ICP-OES, ICP-MS.
• Advancement of radiogenic isotope methods (originally TIMS, then SIMS, ICP-MS).
• Downside: the current flood of precise geochemical data needs to be interpreted by a potent and widely available software tool.

Spreadsheets (+ AddOns)?
Dedicated programs?
The challenge: Interpretation of whole-rock geochemical data

Spreadsheets
• Scarcity of dedicated applications – – DIY (mostly)
• Complex, prone to errors • Low efficiency for repeated tasks • Limited protection of the
primary data • Low quality of graphical output
• Widespread • Easy to use • Zero extra costs • DIY (mostly)
Program Reference
Petro.calc. plot
Sidder (1994)
PetroPlot Su et al.(2003)
GeoPlot Zhou & Li (2006)
GCDPlot Wang (2008)
Disadvantages:
Advantages:

Dedicated software
• DOS/MS Windows:
Program Reference OS Distribution
NewPet Clarke (1993)
DOS Shareware stopped
Norman Janoušek (2000)
DOS Freeware, stopped
MinPet Richard (1995)
Win Commercial [CAN$ 1000],
dead?
IgPet By M. Carr (TerraSofta)
Win Commercial [US$ 199]
Petro-Graph
Petrelli et al. (2004)
Win Freeware

• Lack of documentation (‘black box’)
• Incomplete & difficult to modify (source not available, legal problems, programming required)
• Complicated data input/import
• Poor quality of graphical output
• (User interface)
• (Price)
Dedicated software
Disadvantages:

Solution ?!
Complex statistical &
computing environments (S-Plus, Statistica,
MatLab, Mathematica & Co.)

???@!??
eRrrr!

A revolution? The Language
• Designed by Ihaka & Gentleman (1996), version 1.0 published on 29 Feb 2000
• Based on syntax of the S language (Becker et al. 1988)
• Since 1997 developed by R Core Team (http://www.r-project.org)
• Open-source (GNU) software
• Frequently updated, large and still growing community • High number of additional packages
• Available for all main OS (Mac, M$ Win, Unix...)
• Large collection of statistical and database tools
• Graphical facilities for data exploration and plotting, high-level graphical output
• Effective object-oriented programming language
• Excellent control over individual functions [= power]


http://www.gcdkit.org MAIN FEATURES:
Geochemical Data Toolkit = GCDkit
• A more human (less inhuman) interface to the wealth of functions in R • Windows-like GUI = no programming
necessary!!
• Data ready for further handling under R (dot prompt veterans)
• Standard geochemical calculations involving whole-rock major-, trace- element data and Sr-Nd isotopes
• Effective data management (searching, subsetting, grouping)
• Common plots (binary, ternary, spider, classification, geotectonic…)
• Publication quality graphic output

• 2000 – launched graduate-level courses on interpretation of geochemical data using R (Masaryk University in Brno & Charles University in Prague)
• 2003 – Goldschmidt Conference, Kurashiki, Japan – GCDkit 1.0 released
• 2006 key publication in Journal of Petrology (134 hits on WOS)
• 11 May 2013, last stable version (3.0, French connection) released
• October 2015 – Monograph on Geochemical modelling in R/GCDkit (Springer Verlag)
• GCDkit 4.0 (Indian summer) released for current R (ver. 3.2.1)
Main ‚milestones‘

Invited workshops on GCDkit and/or R modeling
• Czech Geological Survey, Prague, (11 June 2004),
• TU Bergakademie Freiberg, Germany (16 Oct 2005),
• CGS/EOST, Université Louis Pasteur Strasbourg, France (23–24 Oct 2008),
• University of Tromsø, Norway (16–17 June 2010),
• Université Jean Monnet, Saint-Etienne, France (9–11 May 2011),
• University of Helsinki, Finland (7–11 Nov 2011),
• University of Stellenbosch, South Africa (19–23 Mar 2012),
• National Geophysical Research Institute, Hyderabad, India (12–15 Jan 2013),
• University of Arba Minch, Ethiopia (2–6 April 2015)
• Polish Academy of Sciences, Cracow, Poland (23–27 Nov 2015)

Main features of GCDkit: I/O
• Modular architecture (= easily expandable and modifiable)
• Transparent functionality & availability (open source, WWW)
• Input data by copying from clipboard, files in TXT, XLS, MDB, DBF
• Import from geochemical databases (e.g., GEOROC, PETDB), concurrent geochemical packages (IgPet, MinPet, PetroGraph)
• Common recalculations • Norms (Niggli’s values, CIPW, Catanorm,
Granite Mesonorm....) • Custom variables & formulae (+ scripts) • Results can be copied to clipboard,
appended to the data, saved to HTML, TXT, XLS, MDB

Typical session with GCDkit

Statistics Plotting symbols Plotting colours Special diagrams
GROUP = samples that belong together on the basis of:
• identical label the same rock type, intrusion, locality, ...
• value of a numeric variable SiO2 <65 %, SiO2 = 65-70 %, SiO2 >70 %
• position in a classification diagram e.g. TAS diagram: rhyolites, basalts...
• cluster analysis • groups by outline
(defined interactively on a diagram)
Data handling: Grouping

Data handling: Grouping

Data handling: Grouping

Data handling: Searching & subsets
• Range of samples
• Boolean conditions
• Regular expressions in sample names or textual labels
• Subsets by diagram
Suite=“Sázava“.AND.SiO2>55

Data handling: Grouping

• Subsets by diagram
Data handling: Searching & subsets

Descriptive statistics
• Box-and-whiskers plots
• Correlation matrices
• Principal components
• Cluster analysis
• ...many others (including standard R functions)
• Histograms
SiO2,A/CNK,mg#

Plotting
• XYZ plots
• Coplots
• Binary plots
• Ternary plots
• 3D plots
• Anomaly plots

Multiple plots

Spiderplots
• By groups * shaded fields * for each an extra window
• Spider boxplots (+ normalization by a sample)
• Selected samples * Numerous standards (new added easilly) * by sample * by average

• Eight styles of x-axis annotations
• Double normalized spiderplots to eliminate effects of fractional crystallization in order to look solely on the source characteristics (Thompson et al. 1983).
Spiderplots

• A set of graphical utilities for R implemented in GCDkit
• Tools to create figure objects, containing both data and methods to make subsequent changes to plot
• classification algorithm – gives name of the polygon which the given analysis falls into (or a link to a new plot)
• Allows a degree of interactive editing before committing to hardcopy.
Figaro: Plot editing
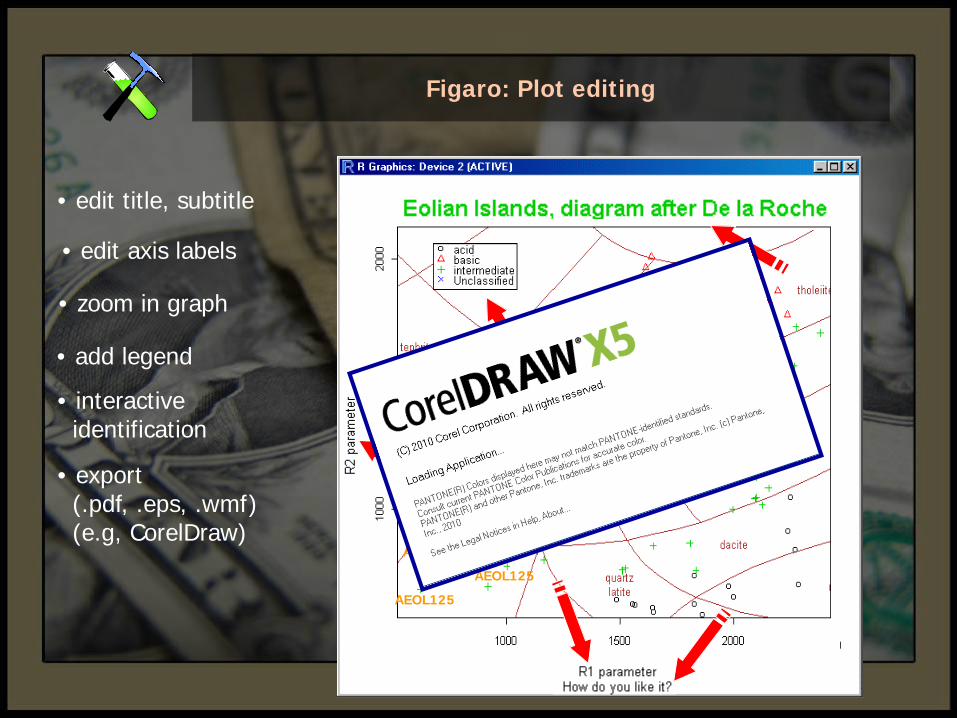
Figaro: Plot editing
• edit title, subtitle
• edit axis labels
• zoom in graph
• add legend
• export (.pdf, .eps, .wmf) (e.g, CorelDraw)
• interactive identification
AEOL125
AEOL125
AEOL126

Plates: Figaro-like editing of multiple plots
• Right click the plate, select a diagram (slot) to edit/replace
• Figaro-like commands to change its appearance
• Additional commands to affect the whole plate (set it to B & W, output to PostScript, scaling of common x axes, text size of axis labels…)
• Make you own plates combining binary, ternary, spider plots with classification and geotectonic plots

Calculations
Na2O+K2O SiO2,FeOt/TiO2,3*CaO,MgO
Built-in calculation
engine

• Common recalculations – Millications, anhydrous basis – Various indices (Larsen’s, Kuno’s)
• Norms (Niggli’s values, CIPW, Catanorm, Granite Mesonorm etc.)
• Custom variables & formulae (+ scripts) • Ready for standard R functions
Calculations
Results can be: • copied to clipboard • saved in a text file • exported as HTML, Excel, Access... • appended to the data for further use (ploting,
grouping)

Calculations
Appending calculation
results to the data
CIPW normative compositions

Calculations
Well-formatted output to HTML

Plugins
Standard plugins: • Zrn, Mnz & Ap saturation calculations • Sr–Nd isotopic data • Tetrad effect • Advanced plotting • Isocon plots
• R code files stored in directory Plugin
• All executed upon loading new data
• Additional functions, accessible via newly appended menu items
• Perhaps code for special type of data
• A platform for DIY additions written by R literate geochemists

New features of the GCDkit 4.0
• GCDkit has got a NAMESPACE, which is obligatory for R 3.0 and higher
• Transparency
• Assigning colours according to values of a variable
• New diagrams – e.g., Pearce (2008) and Müller et al. (1992)
• Rutile saturation models

New features of the GCDkit 4.0
• Improved help system/manual in HTML and PDF
• Includes images and hyperlinks via DOI

New features of the GCDkit 4.0
• Commands executed directly, i.e. without pestering dialogues
• Enables writing ‚programs‘ and run them at once
• Good for repeated tasks, mutating datasets
• Allows for reproducible research
• Brings power (not all functions or parameters are available via GUI)

Future?
• Connection to online databases (EathChem.org) – O. Laurent
• Switching between multiple datasets
• Localization to more languages (beyond English, French and Czech)

Future?
• Separation of the core functions from the interface, opening a possibility of building new interfaces (Tcl/Tk, Java, WWW)
• Versions for other OS (Mac, Linux...)
• Automated generation of reports (Latex: Sweave, Open Office: OdfWeave, MS Office: SWORD)
• Example – SWORD (T. Baier, Vienna)

Future?
• Development of new plugins, e.g. for modelling of petrogenetic processes in igneous geochemistry (such as crystallization of the magma), GIS or recalculation of mineral data from EMPA
• Trigger user feedback (bug reports, contributed code)
http://blog.gcdkit.org
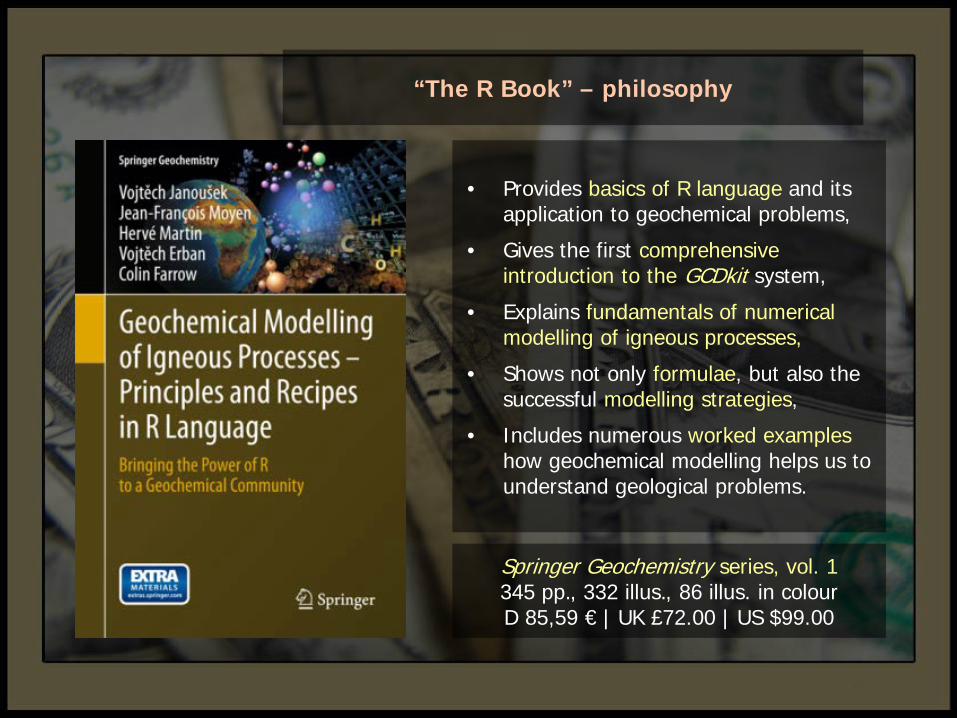
“The R Book” – philosophy
• Provides basics of R language and its application to geochemical problems,
• Gives the first comprehensive introduction to the GCDkit system,
• Explains fundamentals of numerical modelling of igneous processes,
• Shows not only formulae, but also the successful modelling strategies,
• Includes numerous worked examples how geochemical modelling helps us to understand geological problems.
Springer Geochemistry series, vol. 1 345 pp., 332 illus., 86 illus. in colour D 85,59 € | UK £72.00 | US $99.00

“The R Book” – contents
• Part I: Practical Modelling – Loading and manipulating data
– Linking Whole-Rock Chemistry with Mineral Stoichiometry
– Statistics
– Classification and Grouping
– Classical Plots (binary, Harker, ternary, spider)
– Specialized Plots (log–log, specialized spiderplots, contour plots, anomaly plots…)
– Radiogenic isotopes (initial ratios, epsilon values, model ages, isochrons…)

“The R Book” – contents
• Parts II–IV: Majors, traces, radiogenic isotopes
– Core of the book
– Explains fundamentals of each direct and reverse modelling, including the relevant formulae
– Then introduces the numerical solution and its implementation in the R language
– Includes a number of real numerical problems
– Each is presented as a numerical receipt with solution in R (± GCDkit )

• Part V: Practical Modelling – Choosing an Appropriate Model
(evidence for crystallization, partial melting, magma mixing and assimilation…)
– Semi-Quantitative Approach (assessing the trace-element compatibility, process identification, mixing test…)
– Constraining a Model (using appropriate strategy, obtaining input parameters for the model, partition coefficients, dealing with accessories…)
– Numerical Tips and Tricks (reducing system, colinearity, breaking minerals to end-members, coupling majors and traces…)
– Common Sense in Action (thermodynamic, rheological constraints, scale and speed of processes, how well can we distinguish between models, dangerous projections…)
“The R Book” – contents

• Part VI: Worked Examples – Differentiation of a Calc-Alkaline Series:
Atacazo-Ninahuilca volcanoes, Ecuador – Progressive Melting of a Metasedimentary
Sequence: the Saint-Malo Migmatitic Complex, France
• Appendix A: R Syntax in a Nutshell
• Appendix B: Introduction to GCDkit • Appendix C: Solving Systems of
Linear Algebraic Equations in R
“The R Book” – contents

• YOU for attention (?!)
• R Development Core Team (for R)
• Brave β testers (for bravery)
• Springer Verlag (Annett Buettner, Ulrike Stricker and Chris Bendall)
• Testing, feedback, localized versions: J. Trubač (Prague)
• O. Laurent (Eartchem module…)
• Eartchem.org (K. Lehnert)
• The Czech brewing industry
Acknowledgements • Austrian Science Foundation (15133-GEO),
• Czech Grant Agency (GAČR 205/01/0331, P210/11/1168),
• Czech Geological Survey (3314, 336200)
• French–Czech program Mobility (7AMB13FR026)
http://www.r-project.org, http://www.gcdkit.org, http://blog.gcdkit.org`