vol. no. 11 issue no. 12 june 2014 - hdfc mutual fund mf...2 june 2014 intouchmutually page no....
TRANSCRIPT

Vol. No. 11 Issue No. 12 June 2014

2 June 2014 Intouchmutually
PAGE NO.MARKET REVIEW 3EDITORIAL 4FEATURES OF OUR SELECT SCHEMES 5-116HDFC GROWTH FUND 17HDFC EQUITY FUND 17HDFC TOP 200 FUND 18HDFC CAPITAL BUILDER FUND 18HDFC CORE & SATELLITE FUND 19HDFC PREMIER MULTI-CAP FUND 19HDFC MID-CAP OPPORTUNITIES FUND 20HDFC INFRASTRUCTURE FUND 20HDFC INDEX FUND - SENSEX PLAN & NIFTY PLAN 21HDFC INDEX FUND - SENSEX PLUS PLAN 22HDFC GOLD EXCHANGE TRADED FUND 22HDFC GOLD FUND 22HDFC BALANCED FUND 23HDFC PRUDENCE FUND 23HDFC CHILDREN’S GIFT FUND - INVESTMENT PLAN & SAVINGS PLAN 24HDFC LONG TERM ADVANTAGE FUND 25HDFC TAXSAVER 25SIP PERFORMANCE OF SELEECT SCHEMES 26-227HDFC MF MIP - SHORT TERM PLAN & LONG TERM PLAN 28HDFC MULTIPLE YIELD FUND 29HDFC MULTIPLE YIELD FUND - PLAN 2005 29HDFC INCOME FUND 30HDFC HIGH INTEREST FUND - DYNAMIC PLAN 30HDFC HIGH INTEREST FUND - SHORT TERM PLAN 31HDFC SHORT TERM PLAN 31HDFC SHORT TERM OPPORTUNITIES FUND 32HDFC MEDIUM TERM OPPORTUNITIES FUND 32HDFC GILT FUND - SHORT TERM PLAN & LONG TERM PLAN 33HDFC FLOATING RATE INCOME FUND - SHORT TERM PLAN & LONG TERM PLAN 34HDFC LIQUID FUND 35HDFC CASH MANAGEMENT FUND - SAVINGS PLAN 35HDFC CASH MANAGEMENT FUND - TREASURY ADVANTAGE PLAN 36HDFC CORPORATE DEBT OPPORTUNITIES FUND 36SCHEME PERFORMANCE SUMMARY - REGULAR PLANS 37-51SCHEME PERFORMANCE SUMMARY - DIRECT PLANS 52-62DIVIDEND HISTORY 63-66DISCLAIMER 66
CONTENTS

Despite concerns over Iraq situation, S&PBSE SENSEX and NIFTY continued tomove up and reached new highs during
the month of June 2014. The SENSEX and Nifty were up ~5% each. The CNX Midcap Indexoutperformed and gained 9.5%. IT, Healthcare,Infra, Metals, Capital goods, Banking and Oil &Gas sectors performed well, with Healthcarebeing the best performer, while FMCG sectorunderperformed.
INR depreciated 1.8% in June. FII’s boughtUS$ 0.5 bn of Indian equities in June. DomesticMutual funds saw healthy inflows.
It was a mixed performance for global equitymarkets during the month. Dow Jones was up by~ 0.7% and the NASDAQ by 3.9%. In Europe, theDAX, FTSE and CAC were down between 1-2%.Asian markets were flattish with an exception ofNikkei which was up by 3.6%. The Shanghai,Hang Seng and Kospi indices were up between0.4 to 0.5%.
On the commodities front, impacted by situa-tion in Iraq, Brent Crude rose by 3.4%, its sharpestincrease in last few months and is now tradingabove USD 112 per barrel. Precious metalsrebounded in the month of June. Gold and silverwere up by 6.2% and 11.8% respectively. Copper,Aluminium and lead were up by 2-4%. Zinc hadhighest gain and was up by~ 8%.
In the near term, weak monsoon, situation inIraq etc. may weigh down sentiment. But from alonger term perspective, with an improving macroenvironment, peaking interest rates, bottoming ofnet profit margins and reasonable valuations in amajority of segments, prospects for equity mar-kets remain encouraging. Markets are still belowlong term averages and with improvement ingrowth prospects and likely fall in interest rates,earnings may surprise on upside. In our opiniontherefore, this is a time to increase allocation toequities (for those with a medium to long termview) in a phased manner and to stay invested.
Equity market update
During the month of June 2014, the yield on10-year benchmark Government bond(8.83% GoI 2023) ended at 8.75% as
against 8.65% at the end of May 2014.The liquidity availed through various sources
(Liquidity Adjustment Facility, export refinance,marginal standing facility and term repos) from RBIduring the month was lower at `103,317 crs ascompared to `111,948 crs in May 2014. The NSEovernight MIBOR ended at 9.02%, higher than therate seen in end May 2014 (7.92%).
Due to concerns over situation in Iraq, the INRdepreciated to 60.2 against the US dollar as com-pared to 59.10 at the end of previous month, adepreciation of about 1.8% for the month. The netFII investment in equities & debt was an inflow ofUSD 0.7 billion in June 2014 as compared to aninflow of 7.6 billion in May 2014.
The annual rate of inflation, based on monthlyWPI, stood at 6.01% (provisional) for the month ofMay, 2014 (over June, 2013) as compared to 5.20%(provisional) for the previous month and 4.58% dur-ing the corresponding month of the previous year.Headline CPI moderated in May to 8.3% from 8.6%in April 2014. Core CPI declined marginally to7.7% as against 7.8% in the previous month.
In the June ’14 credit policy review, RBI keptpolicy repo rate under the liquidity adjustment facil-ity (LAF) unchanged at 8% and reduced the statuto-ry liquidity ratio (SLR) of scheduled commercialbanks by 50 bps from 23% to 22.5%.
As per the Credit Policy review, RBI views therisks to its CPI target of 8% by January 2015 asbroadly balanced. It is of the view that even thoughsub normal monsoon poses a risk to food prices, thelikelihood of government measures to improve foodsupply, fiscal consolidation efforts as well as passthrough of recent appreciation of rupee could beimportant mitigating factors.
OutlookIn our view, RBI’s policy stance appears to haveturned slightly dovish as it is willing to supportgrowth provided the government delivers on sup-ply side issues and fiscal consolidation. Given thelikely inflation trajectory, improving currentaccount deficit, stabilizing currency and fiscalconsolidation, we continue to maintain our view oflower interest rates over the medium term.However the exact timing and extent of fall willdepend at the pace at which inflation and its expec-tations are moderated.
Debt market update
June 2014 3Intouchmutually
Market Review - June 2014
Source for various data points: Bloomberg, Reuters, www.sebi.gov.in, www.rbi.org.in and Central Statistics Office (CSO).

Asmall set of unconventionalhoteliers is putting India on theglobal luxury travel map. Their
properties, spread across the country,are small but they sell rooms at a size-able premium to the country’s top cityhotels. They are independent, refuse topartner with any big hotel chain,Indian or overseas, and none has anyambition to run a big city hotel.
None of them has studied hotelmanagement or worked for aluxury brand, but they were nostrangers to money while grow-ing up. One comes from a formerroyal family in Rajasthan, who,immediately after passing out ofa well-known boarding school in1984, got down to the task ofrefurbishing the family palace —his first hotel.
Another comes from the fam-ily that had a big role in buildingNew Delhi seventy years ago,
and a third (whose first hotel is inKarnataka’s coffee-growing region) is thedaughter of a large IT company chief execu-tive. The fourth, the son of the promoter of asuper-speciality hospital, has opened a well-ness destination that offers alternate thera-pies like Ayurveda, Tibetan healing, yogaand naturopathy.
Attention to detail is paramount in luxu-ry. The owner of the wellness destination,for instance, has slept in almost every roomto make sure it’s comfortable, interviewedall job seekers including the gardeners, madeall therapists work on him at least twicebefore handing them an appointment letter,and searched for alternate-medicine special-ists all over the country. There is a drill forrefusing tips and also for accepting it, if theguest persists. “The idea is that it shouldn’tfeel like a hotel; the guest should feel he is ata friend’s place,” explains the former royal.For his wildlife safari lodge, he took hisarchitect to see two high-end wildlife resortsin South Africa and one in Tanzania.
Luxury, says one of the hoteliers, is notabout opulence; it must be understated andsubtle, something that can be felt but notmeasured. “We sell an experience, not aroom. It shows in the coffee we serve, in the
food basket we give you for the junglesafari.” When a guest checks in, his stafftries to figure out why he is here: to chill outor to see wildlife? Accordingly, the servicesare tweaked. For example, the wildlifeenthusiast may want to settle for a function-al lunch, while another guest may want asumptuous and leisurely lunch.
The hoteliers say luxury evolves overtime. So, people like them have to innovateall the time. Moreover, luxury travel,because it is a growing segment, has arousedthe interest of the big chains as well. That’swhy it is essential for boutique luxury hote-liers to constantly reinvent themselves, orthink of new experiences for their guests.Thus, the luxury cottages in the hotel inKarnataka’s coffee country are built onstilts, while the conference room is next to awaterfall. Guests can create their own coffeeblend at the resort using a table-top coffeemachine. The Karnataka hotelier’s nextproperty will come up at Kodaikanal inTamil Nadu, at a spot where a 150-year-oldchurch and convent stood.
The key to luxury being service, peopleare the most critical element. Most of thehoteliers prefer to employ locals, even forguest-facing roles. Only a handful of onehotelier’s employees are educated. He hadhired a butler for a property in Rajasthanfrom a hotel management school, but a localemployee proved better on the job.
The former royal discloses that 70 percent of his staff comprises local people. Halfof the waiters in his three properties in andaround Jaipur have become fluent enough inFrench to work as guides. The Karnatakahotel has let its staff retain their individuali-ty while serving guests. Most of these hotelshave over three people for every room. Noneoffloads staff during the lean season.
But does luxury make money? One hote-lier says his first resort began making a prof-it in the third year of operations. Most oth-ers say it takes four to five years to breakeven, but after that the profit margins can besubstantial.
B S REPORTER
This article is issued in general investor interest.
Please refer Page No. 66 for disclaimer.
Luxury hotels
Intouchmutually4 June 2014

Intouchmutually June 2014 5
Nature of Scheme
This product issuitable for investorswho are seeking ~
Fund Manager
Inception Date(Date of Allotment)
Entry / Sales Load
Exit Load
Investment Pllan
Investment Options
MinimumApplication Amount(Under each Plan /Option)
Net Asseet Value(NAV)
RedemptionProceeds
HDFC Growth Fund
Open-ended Growth Scheme
● Capital appreciation over long term.
● Investment predominantlyin equity and equity related instruments
● High risk. (Brown)
Srinivas Rao Ravuri(since April 3, 06)#
September 11, 2000
HDFC Growth Fund, HDFC Growth Fund - DirectPlan
HDFC Equity Fund
Open-ended Growth Scheme
● Capital appreciation over long term.
● Investment predominantlyin equity and equity related instruments ofmedium to large sizedcompanies
● High risk. (Brown)
Prashant Jain(since June 19, 03)*#
January 1, 1995
HDFC Equity Fund, HDFC Equity Fund - DirectPlan
HDFC Top 200 Fund
Open-ended Growth Scheme
● Capital appreciation over long term.
● Investment in equity andequity linked instrumentsincluding equity derivatives primarilydrawn from the companiesin the S&P BSE 200 Index.
● High risk. (Brown)
Prashant Jain(since June19, 03)*#
October 11, 1996
HDFC Top 200 Fund, HDFC Top 200 Fund - DirectPlan
HDFC Capital Builder Fund
Open-ended Growth Scheme
● Capital appreciation over long term.
● Investment predominantlyin equity and equity related instruments ofstrong companies.
● High risk. (Brown)
Chirag Setalvad (since April 2, 07) & Miten Lathia(since May 10, 12)#
February 1, 1994
(With effect from July 1, 2014)● In respect of each purchase
/ switch-in of Units, an Exit Load of 1.00% ispayable if Units areredeemed / switched-outwithin 18 months from the date of allotment.
● No Exit Load is payable ifUnits are redeemed /switched-out after 18months from the date ofallotment.
HDFC Capital Builder Fund,HDFC Capital Builder Fund - Direct Plan
Investors are advised to consult their tax advisors with respect to the tax consequences of the purchase, ownership and disposal of mutual fund units. For Tax Benefits / Consequences, Please refer to page 16* Date of migration from Zurich India Mutual Fund# Dedicated Fund Manager for Overseas Investments: Mr Rakesh Vyas.
Features of our select schemes
HDFC Core &Satellite Fund
Open-ended Growth Scheme
● Capital appreciation over long term.
● Investment primarily inequity and equity relatedinstruments of companieswhose shares are quotingat prices below their truevalue.
● High risk. (Brown)
Vinay Kulkarni(since November 21, 06)#
September 17, 2004
● In respect of each purchase/ switch-in of Units, an Exit Load of 1% is payableif units are redeemed /switched-out within 1 year from the date of allotment.
● No Exit Load is payable ifUnits are redeemed /switched-out after 1 yearfrom the date of allotment.
HDFC Core & Satellite Fund,HDFC Core & Satellite Fund -Direct Plan
Not Applicable. Upfront commission shall be paid directly by the investor to the ARN Holder (AMFI registered Distributor) based on the investors’assessment of various factors including the service rendered by the ARN Holder.
Under Each Plan : Growth & Dividend. The Dividend Option offers Dividend Payout and Reinvestment facility.
(Brown) - Investors understand that their principal will be at high risk.
(Blue) - Investors understand that their principal will be at low risk.(Yellow) - Investors understand that their principal will be at medium risk.
~ Investors should consult their financial advisers if in doubt about whether the product is suitable for them.Note: Risk is represented as:
● In respect of each purchase / switch-in of Units, an Exit Load of 1% is payable if unitsare redeemed / switched-out within 1 year from the date of allotment.
● No Exit Load is payable if Units are redeemed / switched-out after 1 year from thedate of allotment.
For further details, please refer to para ‘Exit Load’ on Pg 16.
Normally despatched within 3-4 Business Days.
Every Business Day
Purchase : ` 5,000 and any amount thereafter. Additional Purchase : ` 1,000 and any amount thereafter.

Features of our select schemes
Intouchmutually6 June 2014
Nature of Scheme
This product issuitable for investorswho are seeking ~
Fund Manager
Inception Date(Date of Allotment)
Entry / Sales Load
Exit Load
Investment Pllan
Investment Options
MinimumApplication Amount(Under each Plan /Option)
Net AAsset Value(NAV)
RedemptionProceeds
HDFC Premier Multi-Cap Fund
Open-ended Growth Scheme
● Capital appreciation over long term.
● Investment predominantly in equity and equity related instruments of Mid Cap and Large Cap ‘blue chip’ companies.
● High risk. (Brown)
Vinay Kulkarni(since November 21, 06) #
April 6, 2005
HDFC Premier Multi-Cap Fund,HDFC Premier Multi-Cap Fund -Direct Plan
HDFC Mid-Cap Opportunities Fund
Open-ended Equity Scheme
● Capital appreciation over long term.
● Investment predominantly in equity and equity related instruments of Small and Mid Cap companies.
● High risk. (Brown)
Chirag Setalvad (since June 25, 07) #
June 25, 2007
HDFC Mid-Cap Opportunities Fund,HDFC Mid-Cap Opportunities Fund- Direct Plan
HDFC Small and Mid Cap Fund(Erstwhile Morgan Stanley A.C.E. Fund)
Open-ended Equity Scheme
● Capital appreciation over long term.
● Investment predominantly in equity and equity related instruments of Small-Cap and Mid-Cap companies.
● High risk. (Brown)
Chirag Setalvad (since June 28, 14) #
April 3, 2008
(With effect from July 1, 2014)● In respect of each purchase / switch-in
of Units, an Exit Load of 2.00% ispayable if Units are redeemed/switched-out within 12 months fromthe date of allotment.
● In respect of each purchase / switch-inof Units, an Exit Load of 1.00% ispayable if Units are redeemed /switched-out after 12 months butbefore 18 months from the date ofallotment.
● No Exit Load is payable if Units areredeemed / switched-out after 18months from the date of allotment.
HDFC Small and MidCap Fund - Regular PlanHDFC Small and MidCap Fund - Direct Plan
Investors are advised to consult their tax advisors with respect to the tax consequences of the purchase, ownership and disposal of mutual fund units. For Tax Benefits / Consequences, Please refer to page 16# Dedicated Fund Manager for Overseas Investments: Mr Rakesh Vyas.
HDFC Large Cap Fund (Erstwhile Morgan Stanley Growth Fund)
Open-ended Equity Scheme
● Capital appreciation over long term.
● Investment in equity and equity related instruments ofLarge Cap companies.
● High risk. (Brown)
Vinay Kulkarni(since June 28, 14) #
February 18, 1994
HDFC Large Cap Fund - Regular PlanHDFC Large Cap Fund - Direct Plan
(Brown) - Investors understand that their principal will be at high risk.
(Blue) - Investors understand that their principal will be at low risk.(Yellow) - Investors understand that their principal will be at medium risk.
~ Investors should consult their financial advisers if in doubt about whether the product is suitable for them.Note: Risk is represented as:
Not Applicable. Upfront commission shall be paid directly by the investor to the ARN Holder (AMFI registered Distributor) based on the investors’ assessment of various factors including the service rendered by the ARN Holder.
● In respect of each purchase / switch-in of Units, an Exit Load of 1% is payable if units are redeemed /switched-out within 1 year from the date of allotment.
● No Exit Load is payable if Units are redeemed / switched-out after 1 year from the date of allotment.
For further details, please refer to para ‘Exit Load’ on Pg 16.
Under Each Plan : Growth & Dividend. The Dividend Option offers Dividend Payout and Reinvestment facility.
Purchase : ` 5,000 and any amount thereafter. Additional Purchase : ` 1,000 and any amount thereafter.
Every Business Day
Normally despatched within 3-4 Business Days.
Nature of Scheme
This product issuitable for investorswho are seeking ~
Fund Managger
Inception Date(Date of Allotment)
Entry / Sales Load
Exit Load
Investment Plan
Investment Options
MinimumApplication Amount(Under each Plan /Option)
Net Asset Value(NAV)
RedemptionProceeds
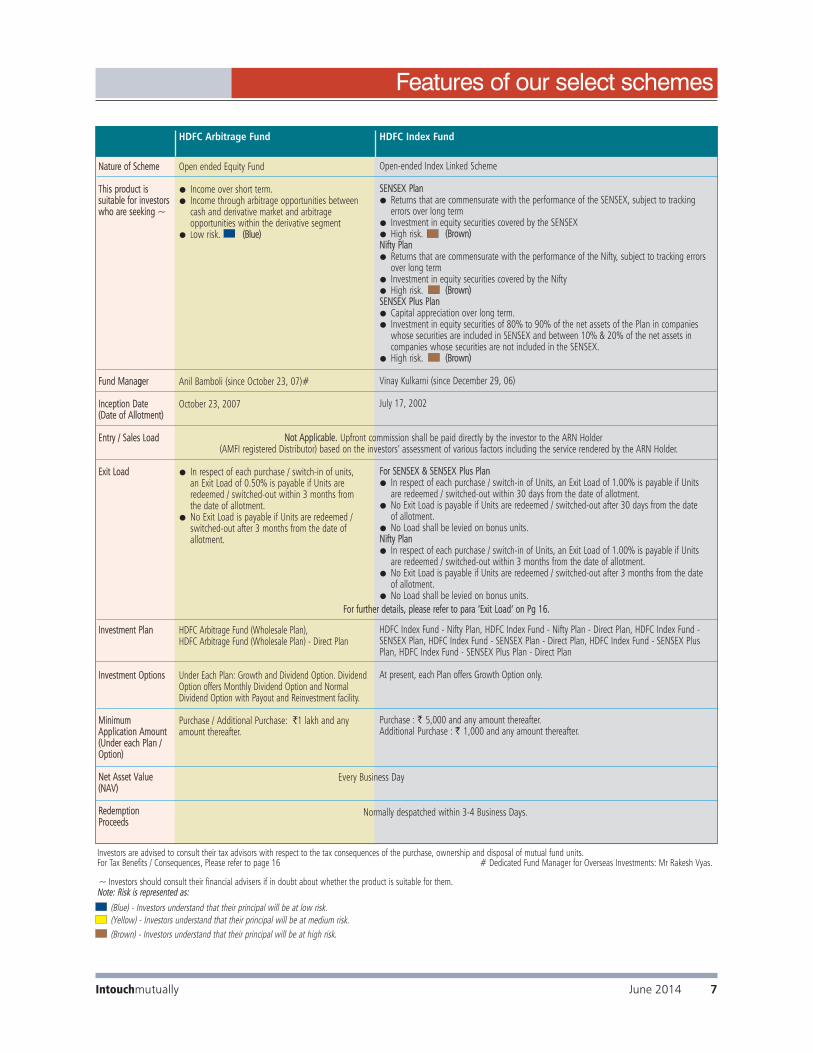
HDFC Index Fund
Open-ended Index Linked Scheme
SENSEX Plan● Returns that are commensurate with the performance of the SENSEX, subject to tracking
errors over long term● Investment in equity securities covered by the SENSEX● High risk. (Brown)Nifty Plan● Returns that are commensurate with the performance of the Nifty, subject to tracking errors
over long term● Investment in equity securities covered by the Nifty ● High risk. (Brown)SENSEX Plus Plan● Capital appreciation over long term. ● Investment in equity securities of 80% to 90% of the net assets of the Plan in companies
whose securities are included in SENSEX and between 10% & 20% of the net assets in companies whose securities are not included in the SENSEX.
● High risk. (Brown)
Vinay Kulkarni (since December 29, 06)
July 17, 2002
For SENSEX & SENSEX Plus Plan● In respect of each purchase / switch-in of Units, an Exit Load of 1.00% is payable if Units
are redeemed / switched-out within 30 days from the date of allotment.● No Exit Load is payable if Units are redeemed / switched-out after 30 days from the date
of allotment.● No Load shall be levied on bonus units.Nifty Plan● In respect of each purchase / switch-in of Units, an Exit Load of 1.00% is payable if Units
are redeemed / switched-out within 3 months from the date of allotment.● No Exit Load is payable if Units are redeemed / switched-out after 3 months from the date
of allotment.● No Load shall be levied on bonus units.
HDFC Index Fund - Nifty Plan, HDFC Index Fund - Nifty Plan - Direct Plan, HDFC Index Fund -SENSEX Plan, HDFC Index Fund - SENSEX Plan - Direct Plan, HDFC Index Fund - SENSEX PlusPlan, HDFC Index Fund - SENSEX Plus Plan - Direct Plan
At present, each Plan offers Growth Option only.
Purchase : ` 5,000 and any amount thereafter. Additional Purchase : ` 1,000 and any amount thereafter.
HDFC Arbitrage Fund
Open ended Equity Fund
● Income over short term. ● Income through arbitrage opportunities between
cash and derivative market and arbitrage opportunities within the derivative segment
● Low risk. (Blue)
Anil Bamboli (since October 23, 07)#
October 23, 2007
● In respect of each purchase / switch-in of units, an Exit Load of 0.50% is payable if Units areredeemed / switched-out within 3 months fromthe date of allotment.
● No Exit Load is payable if Units are redeemed /switched-out after 3 months from the date of allotment.
HDFC Arbitrage Fund (Wholesale Plan), HDFC Arbitrage Fund (Wholesale Plan) - Direct Plan
Under Each Plan: Growth and Dividend Option. DividendOption offers Monthly Dividend Option and NormalDividend Option with Payout and Reinvestment facility.
Purchase / Additional Purchase: `1 lakh and anyamount thereafter.
Not Applicable. Upfront commission shall be paid directly by the investor to the ARN Holder (AMFI registered Distributor) based on the investors’ assessment of various factors including the service rendered by the ARN Holder.
Every Business Day
Normally despatched within 3-4 Business Days.
Investors are advised to consult their tax advisors with respect to the tax consequences of the purchase, ownership and disposal of mutual fund units. For Tax Benefits / Consequences, Please refer to page 16 # Dedicated Fund Manager for Overseas Investments: Mr Rakesh Vyas.
For further details, please refer to para ‘Exit Load’ on Pg 16.
Intouchmutually June 2014 7
Features of our select schemes
(Brown) - Investors understand that their principal will be at high risk.
(Blue) - Investors understand that their principal will be at low risk.(Yellow) - Investors understand that their principal will be at medium risk.
~ Investors should consult their financial advisers if in doubt about whether the product is suitable for them.Note: Risk is represented as:
Intouchmutually8 June 2014
Features of our select schemes
Investors are advised to consult their tax advisors with respect to the tax consequences of the purchase, ownership and disposal of mutual fund units. For Tax Benefits / Consequences, Please refer to page 16 # Dedicated Fund Manager for Overseas Investments: Mr Rakesh Vyas.
Nature of Scheme
This product issuitable for investorswho are seeking ~
Fund Manager
Inception Date(Date of Allotment)
Entry / Sales Load
Exit Load
Investment Plan
Investment Options
MinimumApplication Amount(Under each Plan /Option)
Lock-iin Period
Net Asset Value(NAV)
RedemptionProceeds
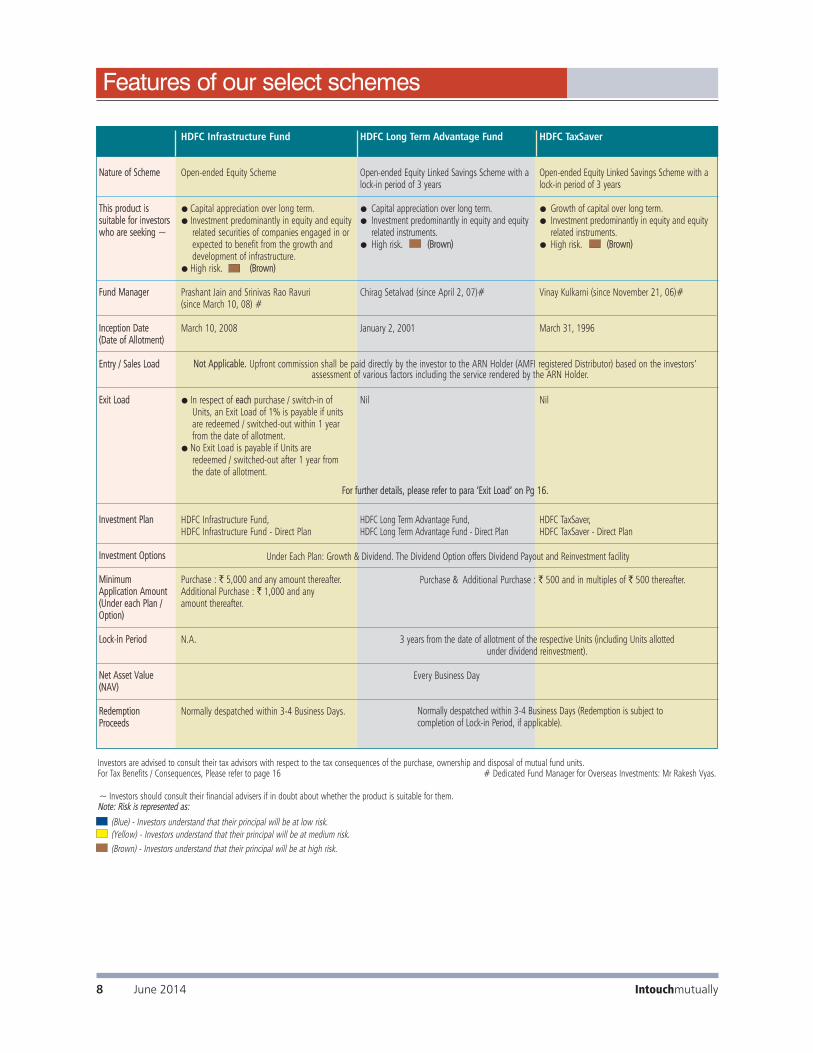
HDFC Infrastructure Fund
Open-ended Equity Scheme
● Capital appreciation over long term.● Investment predominantly in equity and equity
related securities of companies engaged in orexpected to benefit from the growth anddevelopment of infrastructure.
● High risk. (Brown)
Prashant Jain and Srinivas Rao Ravuri (since March 10, 08) #
March 10, 2008
● In respect of each purchase / switch-in ofUnits, an Exit Load of 1% is payable if unitsare redeemed / switched-out within 1 yearfrom the date of allotment.
● No Exit Load is payable if Units are redeemed / switched-out after 1 year from the date of allotment.
HDFC Infrastructure Fund, HDFC Infrastructure Fund - Direct Plan
Purchase : ` 5,000 and any amount thereafter.Additional Purchase : ` 1,000 and any amount thereafter.
N.A.
Normally despatched within 3-4 Business Days.
HDFC TaxSaver
Open-ended Equity Linked Savings Scheme with alock-in period of 3 years
● Growth of capital over long term.● Investment predominantly in equity and equity
related instruments.● High risk. (Brown)
Vinay Kulkarni (since November 21, 06)#
March 31, 1996
Nil
HDFC TaxSaver, HDFC TaxSaver - Direct Plan
HDFC Long Term Advantage Fund
Open-ended Equity Linked Savings Scheme with alock-in period of 3 years
● Capital appreciation over long term.● Investment predominantly in equity and equity
related instruments.● High risk. (Brown)
Chirag Setalvad (since April 2, 07)#
January 2, 2001
Nil
HDFC Long Term Advantage Fund, HDFC Long Term Advantage Fund - Direct Plan
Not Applicable. Upfront commission shall be paid directly by the investor to the ARN Holder (AMFI registered Distributor) based on the investors’assessment of various factors including the service rendered by the ARN Holder.
Under Each Plan: Growth & Dividend. The Dividend Option offers Dividend Payout and Reinvestment facility
Purchase & Additional Purchase : ` 500 and in multiples of ` 500 thereafter.
3 years from the date of allotment of the respective Units (including Units allotted under dividend reinvestment).
Every Business Day
Normally despatched within 3-4 Business Days (Redemption is subject tocompletion of Lock-in Period, if applicable).
(Brown) - Investors understand that their principal will be at high risk.
(Blue) - Investors understand that their principal will be at low risk.(Yellow) - Investors understand that their principal will be at medium risk.
~ Investors should consult their financial advisers if in doubt about whether the product is suitable for them.Note: Risk is represented as:
For further details, please refer to para ‘Exit Load’ on Pg 16.

Intouchmutually June 2014 9
Features of our select schemes
Investors are advised to consult their tax advisors with respect to the tax consequences of the purchase, ownership and disposal of mutual fund units. For Tax Benefits / Consequences, Please refer to page 16* Date of migration from Zurich India Mutual Fund # Dedicated Fund Manager for Overseas Investments: Mr Rakesh Vyas. $ For Large Investors, subscriptions shall only be allowed by payment of requisite Cash through RTGS/NEFT or Funds Transfer Letter/ Transfer Cheque of a bank where the Scheme has a collection account.
Nature of Scheme
This product issuitable for investorswho are seeking ~
Fund Manager
Inception Date(Date of Allotment)
Entry / Sales Load
Exit Load
Investment Plan
Investment Options
MinimumApplication Amount(Under each Plan /Option)
Net AAsset Value(NAV)
RedemptionProceeds
HDFC Gold Exchange Traded Fund
An Open-ended Exchange Traded Fund
● Returns that are commensurate withthe performance of gold, subject totracking errors over long term.
● Investment predominantly in Goldbullion of 0.995 fineness
● High risk. (Brown)
Anil Bamboli (since August 13, 10)
August 13, 2010
● For Creation Unit Size:No Exit load will be levied on redemptions made by AuthorisedParticipants / Large Investors directlywith the Fund in Creation Unit Size.
● For other than Creation Unit Size:Not Applicable. The Units in other than Creation Unit Size cannot be directly redeemed with theFund. These Units can be redeemed(sold) on a continuous basis on thestock exchange(s) during the tradinghours on all trading days.
HDFC Gold Exchange Traded Fund
Currently, there are no Options beingoffered under the Scheme.
Directly with the Fund – Subscription /Redemption in exchange of PortfolioDeposit and Cash Component in creation unit size of 1,000 units and inmultiples thereafter. $ On the Exchange(s) – 1 unit and in multiples of 1 unit thereafter.
HDFC Gold Fund
An Open-ended Fund of Fund Schemeinvesting in HDFC Gold Exchange TradedFund
● Capital appreciation over long term.● Investment in Units of HDFC Gold
Exchange Traded Fund (HGETF). HGETF invests in gold bullion of 0.995 fineness.
● High risk. (Brown)
Anil Bamboli (since November 1, 11)
November 1, 2011
In respect of each purchase / switch-in of units ● An Exit Load of 2% is payable if Units
are redeemed / switched-out within 6 months from the date of allotment.
● An Exit Load of 1% is payable if Unitsare redeemed / switched-out after 6 months but within 1 year from thedate of allotment.
● No Exit Load is payable if Units areredeemed / switched-out after 1 yearfrom the date of allotment.
HDFC Gold Fund, HDFC Gold Fund - Direct Plan
Currently each Plan offers only Growth Option.
HDFC Balanced Fund
Open-ended Balanced Scheme
● Capital appreciation alongwith current income overlong term.
● Investment predominantlyin equity and equity related instruments with balance exposure to debt andmoney market instruments.
● High risk. (Brown)
Chirag Setalvad (since April 2, 07)#
September 11, 2000
(With effect from July 1, 2014)● In respect of each purchase
/ switch-in of Units, an ExitLoad of 1.00% is payable ifUnits are redeemed /switched-out within 18months from the date ofallotment.
● No Exit Load is payable ifUnits are redeemed /switched-out after 18months from the date ofallotment.
HDFC Balanced Fund, HDFCBalanced Fund - Direct Plan
HDFC Prudence Fund
Open-ended Balanced Scheme
● Periodic income with capitalappreciation and prevention ofcapital erosion over long term.
● Investment predominantly inequity and equity related instruments with balance exposure to debt and moneymarket instruments
● High risk. (Brown)
Prashant Jain (since June 19, 03)*#
February 1, 1994
● In respect of each purchase /switch-in of Units, an Exit Load of 1% is payableif units are redeemed / switched-out within 1 yearfrom the date of allotment.
● No Exit Load is payable if Unitsare redeemed / switched-outafter 1 year from the date ofallotment.
HDFC Prudence Fund, HDFCPrudence Fund - Direct Plan
Not Applicable. Upfront commission shall be paid directly by the investor to the ARN Holder (AMFI registered Distributor) based on the investors’ assessment of various factors including the service rendered by the ARN Holder.
For further details, please refer to para ‘Exit Load’ on Pg 16.
Under Each Plan: Growth & Dividend. The Dividend Option offersDividend Payout and Reinvestment facility.
Purchase: ` 5,000 and any amount thereafter. Additional Purchase: ` 1,000 and any amount thereafter.
Every Business Day
Normally despatched within 3-4 Business Days.
(Brown) - Investors understand that their principal will be at high risk.
(Blue) - Investors understand that their principal will be at low risk.(Yellow) - Investors understand that their principal will be at medium risk.
~ Investors should consult their financial advisers if in doubt about whether the product is suitable for them.Note: Risk is represented as:

^ Eligibility (of Unit holder) : Children less than 18 years of age as on the date of investment by the Investor / Applicant are eligible as Unit holders in the Scheme. @ Personal Accident InsuranceCover for Parent / Legal Guardian (upto the age of 80 years) of the Unit holder, equivalent to 10 times the cost value of the outstanding Units held by the Unit holder under all the applications /account statements / folios, subject to a maximum amount of ` 10 lakhs per Unit holder. The insurance premium in respect of the personal accident insurance cover will be borne by the AMC. Thisaccident insurance cover is subject to conditions of the group personal accident insurance policy. Investors are advised to consult their tax advisors with respect to the tax consequences of the purchase, ownership and disposal of mutual fund units. For Tax Benefits / Consequences, Please refer to page 16 # Dedicated Fund Manager for Overseas Investments: Mr Rakesh Vyas.
Nature of Scheme
This product issuitable for investorswho are seeking ~
Fund Manager
Inception Date(Date of Allotment)
Entry / Sales Load
Exit Load
Investment Plan
Investment Options
MinimumApplication Amount(Under each Plan /Option)
Lock-iin Period
Net Asset Value(NAV)
RedemptionProceeds
HDFC Children’s Gift Fund (CGF)^@
Open-ended Balanced Scheme
CGF - IInvestment Plan● Capital appreciation over long term ● Investment in equity and equity related instruments as well
as debt and money market instruments.● High risk. (Brown)CGF - SSavings Plan● Capital appreciation over medium to long term.● Investment in debt and money market instruments as well
as equity and equity related instruments.● Medium risk. (Yellow)
Chirag Setalvad (since April 2, 07)#
March 2, 2001
● For Units subject to Lock-in Period: NIL● For Units not subject to Lock-in Period: 3% if the Units are
redeemed / switched-out within one year from the date ofallotment; 2% if the Units are redeemed / switched-outbetween the first and second year of the date of allotment; 1% if Units areredeemed / switched-out between the second and third yearof the date of allotment; Nil if the Units are redeemed /switched-out after third year from the date of allotment.
Equity Oriented - Investment Plan, Investment Plan - Direct Plan Debt Oriented - Savings Plan, Savings Plan - Direct Plan
Nil
Purchase : ` 5,000 and any amount thereafter. Additional Purchase : ` 1,000 and any amount thereafter.
If opted : Until the Unit holder (being the beneficiary child)attains the age of 18 years or until completion of 3 years fromdate of allotment, whichever is later.
Normally despatched within 3-4 Business Days (Redemption is subject to completion of Lock-in Period, if opted).
Intouchmutually10 June 2014
Features of our select schemes
(Brown) - Investors understand that their principal will be at high risk.
(Blue) - Investors understand that their principal will be at low risk.(Yellow) - Investors understand that their principal will be at medium risk.
~ Investors should consult their financial advisers if in doubt about whether the product is suitable for them.Note: Risk is represented as:
HDFC MF Monthly Income Plan (HDFC MF MIP)
An open-ended income scheme. Monthly income is not assured and is subject to avail-ability of distributable surplus
HDFC MF MIP - SShort Term Plan (STP) & Long Term Plan (LTP)● Regular income over medium to long term.● Investment in debt and money market instruments as well as equity and equity
related instruments.● Medium risk. (Yellow)
LTP – Prashant Jain (Equities) (since December 26, 03),Shobhit Mehrotra (Debt) (since September 1, 07)#,STP – Vinay Kulkarni (Equities) (since November 21, 06),Shobhit Mehrotra (Debt) (since February 16, 04)#
December 26, 2003
MIP - SShort Term Plan● In respect of each purchase / switch-in of Units, an Exit Load of 1% is payable if
units are redeemed / switched-out within 1 year from the date of allotment.● No Exit Load is payable if Units are redeemed / switched-out after 1 year from the
date of allotment.MIP - LLong Term Plan - (With effect from July 1, 2014)● In respect of each purchase / switch-in of Units, an Exit Load of 1.00% is payable if
Units are redeemed / switched-out within 18 months from the date of allotment.● No Exit Load is payable if Units are redeemed / switched-out after 18 months from
the date of allotment.
HDFC MF MIP - Short Term Plan (STP), HDFC MF MIP - STP - Direct Plan, HDFC MF MIP -Long Term Plan (LTP), HDFC MF MIP - LTP - Direct Plan
Each Plan offers Growth, Monthly Dividend & Quarterly Dividend Option. The DividendOption offers Dividend Payout and Reinvestment facility.
Purchase :(Growth & Quarterly Dividend Option) – ` 5,000 and any amount thereafter.(Monthly Dividend Option) – ` 25,000 and any amount thereafter. Additional Purchase : ` 1,000 and any amount thereafter.
N.A.
Normally despatched within 3-4 Business Days.
Not Applicable. Upfront commission shall be paid directly by the investor to the ARN Holder (AMFI registered Distributor) based on the investors’assessment of various factors including the service rendered by the ARN Holder.
For further details, please refer to para ‘Exit Load’ on Pgg 16.
Every Business Day

Intouchmutually June 2014 11
Features of our select schemes
Nature of Scheme
This product issuitable for investorswho are seeking ~
Fund MManager
Inception Date(Date of Allotment)
Entry / Sales Load
Exit Load
Investment Pllan
Investment Options
MinimumApplication Amount(Under each Plan /Option)
Net AAsset Value(NAV)
RedemptionProceeds
HDFC Multiple Yield Fund
Open-ended Income Scheme
● Positive returns over medium term with lowrisk of capital loss over medium term.
● Investment in debt and money market instruments with maturity of 1 year (85%) as well as equity and equity related instruments (15%).
● Medium risk. (Yellow)
Vinay Kulkarni (Equities), (since Nov 21, 06)Anil Bamboli (Debt) (since September 17, 04)#
September 17, 2004
● In respect of each purchase / switch-in ofUnits, an Exit Load of 1% is payable if unitsare redeemed / switched-out within 1 yearfrom the date of allotment.
● No Exit Load is payable if Units are redeemed/ switched-out after 1 year from the date ofallotment.
HDFC Multiple Yield Fund, HDFC Multiple Yield Fund - Direct Plan
HDFC Multiple Yield Fund (MYF) – Plan 2005
Open-ended Income Scheme
● Positive returns over medium term with lowrisk of capital loss over medium term.
● Investment in debt and money market instruments with maturity of 15 months (85%) as well as equity and equity relatedinstruments (15%).
● Medium risk. (Yellow)
Chirag Setalvad (Equities), (since April 2, 07)Anil Bamboli (Debt) (since Aug 17, 05)#
August 17, 2005
● In respect of each purchase / switch-in ofUnits, an Exit Load of 1% is payable if unitsare redeemed / switched-out within 15months from the date of allotment.
● No Exit Load is payable if Units are redeemed/ switched-out after 15 months from the dateof allotment.
HDFC MYF - Plan 2005, HDFC MYF - Plan 2005 - Direct Plan
For further details, please refer to para ‘Exit Load’ on Pg 16.
Investors are advised to consult their tax advisors with respect to the tax consequences of the purchase, ownership and disposal of mutual fund units. For Tax Benefits / Consequences, Please refer to page 16 # Dedicated Fund Manager for Overseas Investments: Mr Rakesh Vyas.
(Brown) - Investors understand that their principal will be at high risk.
(Blue) - Investors understand that their principal will be at low risk.(Yellow) - Investors understand that their principal will be at medium risk.
~ Investors should consult their financial advisers if in doubt about whether the product is suitable for them.Note: Risk is represented as:
HDFC Dynamic PE Ratio Fund of Funds(erstwhile Morgan Stanley Multi Asset Fund)
Open-ended Fund of Funds Scheme
● Capital appreciation over long term.● Investment in specified equity and debt schemes
of HDFC Mutual Fund based on PE Ratios.
● High risk. (Brown)
Miten Lathia (Equities), (since June 28, 14)Anil Bamboli (Debt) (since June 28, 14)
February 6, 2012
● In respect of each purchase / switch-in of Units,an Exit Load of 1% is payable if units areredeemed / switched-out within 1 year from thedate of allotment.
● No Exit Load is payable if Units are redeemed /switched-out after 1 year from the date of allotment.
HDFC Dynamic PE Ratio Fund of Funds - Regular PlanHDFC Dynamic PE RatioFund of Funds - Direct Plan
Not Applicable. Upfront commission shall be paid directly by the investor to the ARN Holder (AMFI registered Distributor) based on the investors’assessment of various factors including the service rendered by the ARN Holder.
Under Each Plan: Growth & Dividend. The Dividend Option offers Dividend Payout and Reinvestment facility.
Purchase : ` 5,000 and any amount thereafter. Additional Purchase : ` 1,000 and any amount thereafter.
Every Business Day
Normally despatched within 3-4 Business Days.

Intouchmutually12 June 2014
Features of our select schemes
HDFC Income Fund
Open-ended Income Scheme
● Regular income over medium to long term.
● To optimise returns while maintaining a balance of safety, yield and liquidity by investment in debt and money market instruments.
● Low risk. (Blue)
Shobhit Mehrotra (since September 1, 07)#
September 11, 2000
● In respect of each purchase / switch-inof Units, an Exit Load of 0.5% ispayable if units are redeemed /switched-out within 6 months from the date of allotment.
● No Exit Load is payable if Units areredeemed / switched-out after 6 months from the date of allotment.
HDFC Income Fund, HDFC Income Fund - Direct Plan
Under each Plan: Growth & Dividend. The Dividend Option offers Dividend Payoutand Reinvestment facility.
Nature of Scheme
This product issuitable for investorswho are seeking ~
Fund Manager
Inception Date(Date of Allotment)
Entry / Sales Load
Exit Load
Investmennt Plan
Investment Option
MinimumApplication Amount(Under each Plan /Option)
Net Asset Value(NAV)
RedemptionProceeds
HDFC Short Term Plan
Open-ended Income Scheme
● Regular income over short to medium term.
● Investment in debt and money marketinstruments with a short to medium termmaturity (average maturity profile of 1-3 years).
● Low risk. (Blue)
Anil Bamboli (since January 13, 04)#
February 28, 2002
● In respect of each purchase / switch-in of Units, an Exit Load of0.75% is payable if units are redeemed/ switched-out within 12 months fromthe date of allotment.
● No Exit Load is payable if Units areredeemed / switched-out after 12months from the date of allotment.
HDFC Short Term Plan, HDFC Short Term Plan - Direct Plan
Under both the Plans: Growth & Dividend(Dividend Option offers Payout andReinvestment facility).
HDFC High Interest Fund (HHIF)
Open-ended Income Scheme
HDFC High Interest Fund - DDynamic Plan● Stable returns over medium to long term.● To maximize income while maintaining the optimum balance of
yield, safety and liquidity by investing in a range of debt andmoney market instruments of various maturity dates.
● Low risk. (Blue)HDFC High Interest Fund - SShort Term Plan (HHIF - SSTP)● Stable returns over short to medium term.● To maximize income while maintaining the optimum balance of
yield, safety and liquidity by investing in a range of debt andmoney market instruments of various maturity dates.
● Low risk. (Blue)
Anil Bamboli (HHIF - Dynamic Plan) (since February 16, 04)#, Shobhit Mehrotra (HHIF - STP) (since September 1, 07)#
HHIF - DDynamic Plan : April 28, 1997HHIF - SSTP : February 6, 2002
HHIF - DDynamic Plan:● In respect of each purchase / switch-in of Units, an Exit Load
of 0.50% is payable if units are redeemed / switched-outwithin 3 months from the date of allotment.
● No Exit Load is payable if Units are redeemed / switched-outafter 3 months from the date of allotment.
HHIF - SSTP● In respect of each purchase / switch-in of units, an Exit Load of
0.25% is payable if units are redeemed / switched-out within 1month from the date of allotment.
● No Exit Load is payable if Units are redeemed / switched-out after1 month from the date of allotment.
HHIF - Dynamic Plan, HHIF - Dynamic Plan - Direct Plan, HHIF - STP, HHIF - STP - Direct Plan
HHIF - DDynamic Plan : Under both the Plans: Growth, Quarterly, Half Yearly and Yearly Dividend Options.HHIF - SSTP : Under both the Plans: Growth & Dividend OptionAll Dividend Options offer Dividend Payout and Reinvestment facility.
For further details, please refer to para ‘Exit Load’ on Pg 16.
Every Business Day
Normally despatched within 3-4 Business Days.
Not Appliccable. Upfront commission shall be paid directly by the investor to the ARN Holder (AMFI registered Distributor) based on the investors’assessment of various factors including the service rendered by the ARN Holder.
Investors are advised to consult their tax advisors with respect to the tax consequences of the purchase, ownership and disposal of mutual fund units. For Tax Benefits / Consequences, Please refer to page 16# Dedicated Fund Manager for Overseas Investments: Mr Rakesh Vyas.
Purchase : ` 5,000 and any amount thereafter. Additional Purchase : ` 1,000 and any amount thereafter.
(Brown) - Investors understand that their principal will be at high risk.
(Blue) - Investors understand that their principal will be at low risk.(Yellow) - Investors understand that their principal will be at medium risk.
~ Investors should consult their financial advisers if in doubt about whether the product is suitable for them.Note: Risk is represented as:

Intouchmutually June 2014 13
Features of our select schemes
Nature of Scheme
This product issuitable for investorswho are seeking ~
Fund Manager
Inception Date(Date of Allotment)
Entry / Sales Load
Exit Load
Investment Pllan
Investment Option
MinimumApplication Amount(Under each Plan) /Option
Net Assset Value(NAV)
RedemptionProceeds
Investors are advised to consult their tax advisors with respect to the tax consequences of the purchase, ownership and disposal of mutual fund units. For Tax Benefits / Consequences, Please refer to page 16 # Dedicated Fund Manager for Overseas Investments: Mr Rakesh Vyas.
HDFC Gilt Fund
Open-ended Income Scheme
Short Term Plan● Credit risk free returns over short to
medium term. ● Investment in sovereign securities
issued by Central/ State Governmentwith short to medium term maturities.
● Low risk. (Blue)Long Term Plan● Credit risk free returns over medium
to long term.● Investment in sovereign securities
issued by Central / State Governmentwith medium to long term maturities.
● Low risk. (Blue)
Anil Bamboli (since September 1, 07)
July 25, 2001
Short Term Plan : NilLong Term Plan : Nil
Short Term Plan, Short Term Plan - Direct Plan,Long Term Plan, Long Term Plan - Direct Plan
HDFC Medium Term Opportunities Fund
Open-ended Income Scheme
● Regular income over medium tolong term.
● Investment in debt, money marketinstruments and government securities with maturities notexceeding 60 months.
● Low risk. (Blue)
Shobhit Mehrotra (since June 29, 10) #
June 29, 2010
● In respect of each purchase/switch-in of units, an exit load of1% is payable if units areredeemed/switched out within 12months from the date of allot-ment.
● No exit load is payable if units are redeemed/ switched-out after 12 months from the date ofallotment.
HDFC Medium Term OpportunitiesFund, HDFC Medium TermOpportunities Fund - Direct Plan
HDFC Short Term Opportunities Fund
Open-ended Income Scheme
● Regular income over short to medium term.
● Investment in debt and money market instruments and government securities with maturities not exceeding 36months.
● Low risk. (Blue)
Anil Bamboli (since June 25, 10) #
June 25, 2010
● In respect of eachpurchase/switch-in of units, anExit load of 0.50% is payable ifunits are redeemed/ switched-outwithin 3 months from the date ofallotment.
● No Exit Load is payable if unitsare redeemed/switched-out after 3 months from the date of allotment.
HDFC Short Term Opportunities Fund, HDFC Short Term Opportunities Fund -Direct Plan
Under both the Plans: Growth &Fortnightly Dividend Option (DividendOption offers Dividend Payout andReinvestment facility).
HDFC Inflation Indexed BondFund (erstwhile Morgan Stanley Gilt Fund)
Open-ended Income Scheme
● Generate income and capitalappreciation indexed to inflation.
● Investment in inflation indexedsecurities issued by governmentand corporate issuers
● Low risk. (Blue)
Anil Bamboli (since June 28, 14)
Mar 4, 2013
● In respect of each purchase /switch-in of units, an exit load of1.5% is payableif units areredeemed / switched outwithin 12months from the date ofallotment.
● No exit load is payable if unitsareredeemed / switched-out after 12months from the date ofallotment.
HDFC Inflation Indexed Bond Fund -Regular Plan, HDFC Inflation Indexed Bond Fund -Direct Plan
Under Each Plan: Growth,RegularDividend andQuarterly Dividend.BothDividend Options offerPayout andReinvestmentfacilities.
Not Applicable. Upfront commission shall be paid directly by the investor to the ARN Holder (AMFI registered Distributor) based on the investors’assessment of various factors including the service rendered by the ARN Holder.
Purchase : ` 5,000 and any amount thereafter. Additional Purchase : ` 1,000 and any amount thereafter.
Every Business Day
Normally despatched within 3-4 Business Days.
(Brown) - Investors understand that their principal will be at high risk.
(Blue) - Investors understand that their principal will be at low risk.(Yellow) - Investors understand that their principal will be at medium risk.
~ Investors should consult their financial advisers if in doubt about whether the product is suitable for them.Note: Risk is represented as:
Under both the Plans: Growth & Dividend Option (Dividend Option offersDividend Payout and Reinvestment facility).
For further details, please refer to para ‘Exit Load’ on Pg 16.
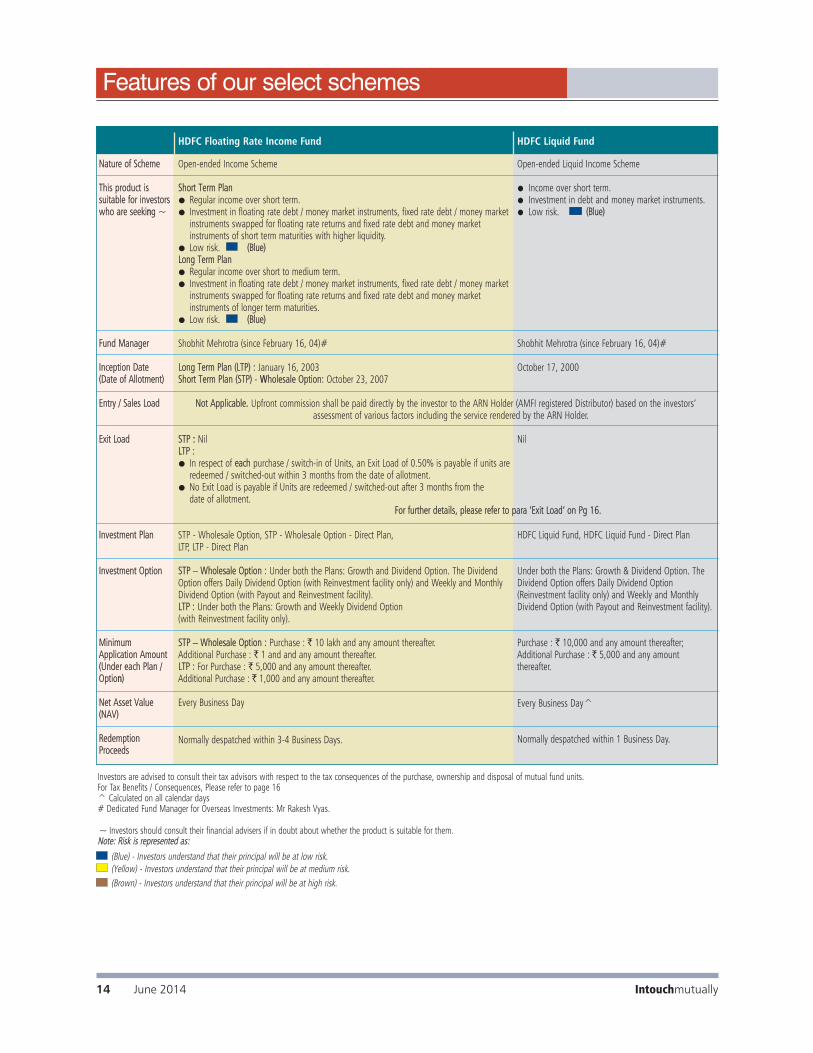
HDFC Floating Rate Income Fund
Open-ended Income Scheme
Short Term Plan● Regular income over short term.● Investment in floating rate debt / money market instruments, fixed rate debt / money market
instruments swapped for floating rate returns and fixed rate debt and money market instruments of short term maturities with higher liquidity.
● Low risk. (Blue)Long Term Plan● Regular income over short to medium term.● Investment in floating rate debt / money market instruments, fixed rate debt / money market
instruments swapped for floating rate returns and fixed rate debt and money market instruments of longer term maturities.
● Low risk. (Blue)
Shobhit Mehrotra (since February 16, 04)#
Long Term Plan (LTP) : January 16, 2003 Short Term Plan (STP) - WWholesale Option: October 23, 2007
STP :: NilLTP :● In respect of each purchase / switch-in of Units, an Exit Load of 0.50% is payable if units are
redeemed / switched-out within 3 months from the date of allotment.● No Exit Load is payable if Units are redeemed / switched-out after 3 months from the
date of allotment.
STP - Wholesale Option, STP - Wholesale Option - Direct Plan,LTP, LTP - Direct Plan
STP – Wholesale Option : Under both the Plans: Growth and Dividend Option. The DividendOption offers Daily Dividend Option (with Reinvestment facility only) and Weekly and MonthlyDividend Option (with Payout and Reinvestment facility).LTP : Under both the Plans: Growth and Weekly Dividend Option (with Reinvestment facility only).
STP – Wholesale Option : Purchase : ` 10 lakh and any amount thereafter. Additional Purchase : ` 1 and and any amount thereafter.LTP : For Purchase : ` 5,000 and any amount thereafter.Additional Purchase : ` 1,000 and any amount thereafter.
Every Business Day
Normally despatched within 3-4 Business Days.
Nature of Scheme
This product issuitable for investorswho are seekinng ~
Fund Manager
Inception Date(Date of Allotment)
Entry / Sales Load
Exit Load
Investment Plan
Investment Option
MinimumApplication Amount(Under each Plan /Optionn)
Net Asset Value(NAV)
RedemptionProceeds
Investors are advised to consult their tax advisors with respect to the tax consequences of the purchase, ownership and disposal of mutual fund units. For Tax Benefits / Consequences, Please refer to page 16^ Calculated on all calendar days# Dedicated Fund Manager for Overseas Investments: Mr Rakesh Vyas.
HDFC Liquid Fund
Open-ended Liquid Income Scheme
● Income over short term.● Investment in debt and money market instruments.● Low risk. (Blue)
Shobhit Mehrotra (since February 16, 04)#
October 17, 2000
Nil
HDFC Liquid Fund, HDFC Liquid Fund - Direct Plan
Under both the Plans: Growth & Dividend Option. TheDividend Option offers Daily Dividend Option(Reinvestment facility only) and Weekly and MonthlyDividend Option (with Payout and Reinvestment facility).
Purchase : ` 10,000 and any amount thereafter; Additional Purchase : ` 5,000 and any amount thereafter.
Every Business Day^
Normally despatched within 1 Business Day.
Not Applicable. Upfront commission shall be paid directly by the investor to the ARN Holder (AMFI registered Distributor) based on the investors’assessment of various factors including the service rendered by the ARN Holder.
For further details, please refer to para ‘Exit Load’ on Pg 16.
Intouchmutually14 June 2014
Features of our select schemes
(Brown) - Investors understand that their principal will be at high risk.
(Blue) - Investors understand that their principal will be at low risk.(Yellow) - Investors understand that their principal will be at medium risk.
~ Investors should consult their financial advisers if in doubt about whether the product is suitable for them.Note: Risk is represented as:

Intouchmutually June 2014 15
Features of our select schemes
Investors are advised to consult their tax advisors with respect to the tax consequences of the purchase, ownership and disposal of mutual fund units.For Tax Benefits / Consequences, Please refer to page 16^ Calculated on all calendar days# Dedicated Fund Manager for Overseas Investments: Mr Rakesh Vyas.
(Brown) - Investors understand that their principal will be at high risk.
(Blue) - Investors understand that their principal will be at low risk.(Yellow) - Investors understand that their principal will be at medium risk.
~ Investors should consult their financial advisers if in doubt about whether the product is suitable for them.Note: Risk is represented as:
Nature of Scheme
This product issuitable for investorswho are seeking ~
Fund Manager
Inception Date(Date of Allotment)
Entry / Sales Load
Exit Load
Investment Plan
Investment Option
MinimumApplication Amount(Under each Plan /Option)
Net Asset Value(NAV)
RedemptionProceeds
HDFC Cash Management Fund
Savings & Call Plan: Open-ended High Liquidity Income SchemeTreasury Advantage Plan: Open-ended Income Scheme
Anil Bamboli Savings & Call Plan (since July 25, 12)# Treasury Advaantage Plan (since September 1, 07)#
Savings & Treasury Advantage Plan (Retail Option): November 18, 1999 Call Plan : February 6, 2002
Not Applicable. Upfront commission shall be paid directly by the investor to the ARN Holder (AMFI registered Distributor) based on the investors’assessment of various factors including the service rendered by the ARN Holder.
Savings, Call & Treasury Advantage Plan : Nil
Savings Plan, Savings Plan - Direct Plan, Call Plan, Call Plan - Direct Plan, Treasury Advantage Plan, Treasury Advantage Plan - Direct Plan
Savings & Call Plan : Each Plan offers Growth Option & Daily Dividend Option (with Reinvestment facility only). Savings Plan also offers Weekly DividendOption (with Payout and Reinvestment facility). Treasury Advantage Plan (Retail Option): Each Plan offers Growth and Dividend Option. Dividend Option offers Daily Dividend Option with Reinvestment facility only and Weekly and Monthly Dividend Option with Payout and Reinvestment facility.
Savings & Call Plan : Purchase ` 10,000 and any amount thereafter; Additional Purchase ` 5,000 and any amount thereafter.Treasuryy Advantage Plan – Retail Option: Growth, Weekly and Monthly Dividend Option : Purchase ` 5,000 and any amount thereafter.Additional Purchase: ` 1,000 and any amount thereafter. Daily Dividend Option : Purchase ` 10,000 and any amount thereafter; Additional Purchase ` 5,000 and any amount thereafter.
Savings & Call Plan: Every Business Day^ Treasury Advantage Plan: Every Business Day
Savings & Call Plan : Normally despatched within 1 Business Day.Treasury Advantage Plan: Normally despatched within 3-4 Business Days.
Savings Plan● Optimal returns over short term. ● Investment in debt and money
market instruments with maturityof upto 91 days only.
● Low risk. (Blue)
Treasury Advantage Plan● Regular income over short term.● Investment in debt and money
market instruments.● Low risk. (Blue)
Call Plan● Optimal returns over short term that may be in line with the
overnight call rates. ● Investment typically in Collateralised Borrowing & Lending
Obligations (CBLO), overnight reverse repos in Government securitiesand fixed income instruments with overnight maturity/ liquidity.
● Low risk. (Blue)
For further details, please refer to para ‘Exit Load’ on Pg 16.

Intouchmutually16 June 2014
Features of our select schemes
Nature of Scheme
This product issuitable for investorswho are seeking ~
Fund Manager
Inception Date(Date of Allotment)
Entry / Sales Load
Exit Load
Investment Plan
Investment Option
MinimumApplication Amount(Under each Plan /Option)
Net Asset Value(NAV)
RedemptionProceeds
HDFC Banking and PSU Debt Fund
Open-ended Income Scheme
● Regular income over medium to long term● Investments in debt and money market instruments consisting predominantly of
securities issued by Scheduled Commercial Banks and Public Sector undertakings.● Low risk. (Blue)
Anil Bamboli (Since March 26, 14) #
March 26, 2014
● In respect of each purchase/switch-in of units, an Exit load of 0.25% is payable ifunits are redeemed / switched-out within 1 month from the date of allotment.
● No Exit Load is payable if units are redeemed / switched-out after 1 month from the date of allotment.
HDFC Banking and PSU Debt Fund - Regular PlanHDFC Banking and PSU Debt Fund - Direct Plan
HDFC Corporate Debt Opportunities Fund
Open-ended Income Scheme
● Regular income over medium to long term.● To generate regular income and capital appreciation by
investing predominantly in corporate debt.● Medium risk. (Yellow)
Shobhit Mehrotra (since March 25, 14) #
March 25, 2014
(With effect from July 1, 2014)● In respect of each purchase / switch-in of Units, an Exit Load
of 2% is payable if Units are redeemed / switched-out within12 months from the date of allotment.
● In respect of each purchase / switch-in of Units, an Exit Loadof 1% is payable if Units are redeemed / switched-out after12 months but within 24 months from the date of allotment.
● No Exit Load is payable if Units are redeemed / switched-outafter 24 months from the date of allotment.
HDFC Corporate Debt Opportunities Fund - Regular Plan, HDFCCorporate Debt Opportunities Fund - Direct Plan
.
Not Applicable. Upfront commission shall be paid directly by the investor to the ARN Holder (AMFI registered Distributor) based on the investors’assessment of various factors including the service rendered by the ARN Holder.
Investors are advised to consult their tax advisors with respect to the tax consequences of the purchase, ownership and disposal of mutual fund units.^ Calculated on all calendar days # Dedicated Fund Manager for Overseas Investments: Mr Rakesh Vyas since May 10, 2012. Exit Load: (i) No exit load shall be levied for switching between Options under the same Plan within a Scheme. (ii) Switch of investments to Direct Plan within the same Scheme shall be subjectto applicable exit load, unless the investments were made without any distributor code. However, any subsequent switch-out or redemption of such investments from the Direct Plan will not besubject to any exit load.(iii) No exit load shall be levied for switch-out from Direct Plan to other Plan within the same Scheme. However, any subsequent switch-out or redemption of such investment from the other Plan shall be subject to exit load based on the original date of investment in the Direct Plan. (iv) Switch of investments between Plans under a Scheme having separate portfolios, will be subject to applicable exit load. (v) No exit load will be levied on Bonus Units and Units allotted on Dividend Re-investment.
Tax Benefits / Consequences : Income distributed by the Scheme(s) is free from Income–tax in the hands of Investors. The additional income-tax on distribution of income by a money marketmutual fund or a liquid fund to an individual / HUF shall be payable by the mutual fund at the rate of 28.325%* and at the rate of 33.99%* to any other investor. The additional income-tax ondistribution of income by any other fund (not being an equity oriented fund) to an individual / HUF shall be payable at the rate of 28.325%* and at the rate of 33.99%* on distribution ofincome to any other investor. Units of the Scheme(s) are not subject to Wealth-tax and Gift-tax. Unit holders are required to pay Securities Transaction Tax (STT) at the rate of 0.001% at the time of redemption / switch-out of units of an equity-oriented fund.* including applicable surcharge, education cess and secondary and higher education cessInvestors should be aware that the fiscal rules / tax laws may change and there can be no guarantee that the current tax position may continue indefinitely. In view of individual nature of taxconsequences, each investor is advised to consult his / her own professional tax advisor.
Prashant Jain Over 22 yearsVinay Kulkarni Over 23 yearsSrinivas Rao Ravuri Over 18 yearsChirag Setalvad Over 16 years
Shobhit Mehrotra Over 20 yearsAnil Bamboli Over 19 yearsMiten Lathia Over 13 yearsRakesh Vyas Over 9 years
Fund Manager Total Experience Fund Manager Total Experience
(Brown) - Investors understand that their principal will be at high risk.
(Blue) - Investors understand that their principal will be at low risk.(Yellow) - Investors understand that their principal will be at medium risk.
~ Investors should consult their financial advisers if in doubt about whether the product is suitable for them.Note: Risk is represented as:
Every Business Day
Normally despatched within 3-4 Business Days.
Purchase : ` 5,000 and any amount thereafter. Additional Purchase : ` 1,000 and any amount thereafter
Under Each Plan: Growth & Dividend. The Dividend Option offers Dividend Payout and Dividend Reinvestment facility.

Portfolio – Top 10 Holdings
HDFC Growth Fund
$ Sponsor
An open-ended growth scheme
HDFC Equity FundAn open-ended growth scheme
Banks 22.88Software 13.14Petroleum Products 8.33Auto 6.49Consumer Non Durables 6.40Pharmaceuticals 5.33Finance 5.20Construction Project 4.77Oil 4.63Industrial Capital Goods 4.57
Chemicals 3.16Power 2.33Construction 1.91Minerals / Mining 1.68Gas 1.62Ferrous Metals 1.58Telecom - Services 1.32Cement 1.15Industrial Products 0.57
Industry Allocation of Equity Holding (% of Net Assets)
Portfolio Turnover Ratio (Last 1 Year) 27.02%
NAV NAV per Unit (`)
Growth Option 121.172Dividend Option 30.609Direct Plan - Growth Option 121.967Direct Plan - Dividend Option 30.832
Std Deviation Beta Sharpe Ratio*
Risk Ratio 5.49% 1.0307 0.058(for the 3-yr period ended June 30, 14)Based on month-end NAV
Std Deviation Beta Sharpe Ratio*
Risk Ratio 6.51% 1.1127 0.096(for the 3-yr period ended June 30, 14)Based on month-end NAV
NAV NAV per Unit (`)
Growth Option 423.663Dividend Option 53.394Direct Plan - Growth Option 427.915Direct Plan - Dividend Option 53.981
Portfolio – Top 10 Holdings
Portfolio Turnover Ratio (Last 1 Year) 47.49%
Banks 25.05Software 16.49Petroleum Products 8.51Auto 7.70Finance 5.59Pharmaceuticals 5.57Construction Project 5.49Consumer Non Durables 4.65Power 4.37Industrial Capital Goods 4.02
Auto Ancillaries 2.36Oil 2.29Cement 1.79Construction 1.41Ferrous Metals 1.16Industrial Products 0.96Media And Entertainment 0.71Fertilisers 0.52Gas 0.07
Industry Allocation of Equity Holding (% of Net Assets)
Company Industry+ % to NAV
EQUITY & EQUITY RELATED
ICICI Bank Ltd. Banks 7.89
State Bank of India Banks 6.72
ITC Ltd. Consumer Non Durables 6.40
Infosys Ltd. Software 6.24
Housing Development Finance Corporation Ltd. $ Finance 5.20
Tata Motors Ltd. DVR Auto 4.85
Tata Consultancy Services Ltd. Software 4.70
Larsen & Toubro Ltd. Construction Project 4.64
Reliance Industries Ltd. Petroleum Products 4.49
Bharat Petroleum Corporation Ltd. Petroleum Products 3.84
Total of Top Ten Equity & Equity Related Holdings 54.97
Total Equity & Equity Related Holdings 97.06
Cash, Cash Equivalents and Net Current Assets 2.94
Grand Total 100.00
Average AUM for the quarter ended June 30, 2014 (` In Lakhs) 1008,248.72
Company Industry+ % to NAV
EQUITY & EQUITY RELATED
State Bank of India Banks 9.30
Infosys Ltd. Software 7.30
ICICI Bank Ltd. Banks 6.85
Larsen & Toubro Ltd. Construction Project 4.76
Tata Motors Ltd. DVR Auto 4.26
Bharat Petroleum Corporation Ltd. Petroleum Products 4.05
Aurobindo Pharma Ltd. Pharmaceuticals 3.98
Maruti Suzuki India Ltd. Auto 3.44
CESC Ltd. Power 2.83
Bank of Baroda Banks 2.76 Total of Top Ten Equity & Equity Related Holdings 49.53
Total Equity & Equity Related Holdings 98.71
Cash margin 0.01
Other Cash, Cash Equivalents and Net Current Assets 1.28 Grand Total 100.00
Average AUM for the quarter ended June 30, 2014 (` In Lakhs) 11,288,604.66
Source for Risk ratio: CRISIL Fund Analyser * Risk-free rate assumed to be 8.66% (364-day Treasury Bill yield on 30-06-14)
Face Value per Unit: ` 10 unless otherwise specified + Industry Classification as recommended by AMFI Data is as of June 30, 2014 unless otherwise specified.
Intouchmutually June 2014 17

HDFC Top 200 FundAn open-ended growth scheme
HDFC Capital Builder FundAn open-ended growth scheme
NAV NAV per Unit (`)
Growth Option 168.606Dividend Option 25.733Direct Plan - Growth Option 169.604Direct Plan - Dividend Option 25.906
NAV NAV per Unit (`)
Growth Option 313.916Dividend Option 50.817Direct Plan - Growth Option 316.552Direct Plan - Dividend Option 51.281
Company Industry+ % to NAV
EQUITY & EQUITY RELATED
State Bank of India Banks 8.16
Infosys Ltd. Software 6.29
ICICI Bank Ltd. Banks 5.49
Larsen & Toubro Ltd. Construction Project 5.03
Tata Motors Ltd. DVR Auto 4.35
Reliance Industries Ltd. Petroleum Products 3.86
ITC Ltd. Consumer Non Durables 3.73
HDFC Bank Ltd. Banks 3.58
Aurobindo Pharma Ltd. Pharmaceuticals 3.29
Maruti Suzuki India Ltd. Auto 3.19
Total of Top Ten Equity & Equity Related Holdings 46.97
Total Equity & Equity Related Holdings 98.60
Cash, Cash Equivalents and Net Current Assets 1.40
Grand Total 100.00
Average AUM for the quarter ended June 30, 2014 (` In Lakhs) 1,,165,735.32
Portfolio – Top 10 Holdings Portfolio – Top 10 Holdings
Portfolio Turnover Ratio (Last 1 Year) 34.46%
Company Industry+ % to NAV
EQUITY & EQUITY RELATED
ICICI Bank Ltd. Banks 6.48
Infosys Ltd. Software 6.30
State Bank of India Banks 5.19
Bharat Petroleum Corporation Ltd. Petroleum Products 4.22
Larsen & Toubro Ltd. Construction Project 4.19
Tata Consultancy Services Ltd. Software 4.05
Solar Industries India Ltd. Chemicals 3.82
HDFC Bank Ltd. Banks 3.76
Dr. Reddy's Laboratories Ltd. Pharmaceuticals 3.69
Indusind Bank Ltd. Banks 3.12
Total of Top Ten Equity & Equity Related Holdings 44.82
Total Equity & Equity Related Holdings 95.05
Cash margin 0.34
Other Cash, Cash Equivalents and Net Current Assets 4.61
Grand Total 100.00
Average AUM for the quarter ended June 30, 2014 (` In Lakhs) 500,924.43
Banks 27.05
Software 10.61
Petroleum Products 8.46
Auto 8.27
Finance 5.36
Construction Project 5.03
Pharmaceuticals 4.84
Oil 4.82
Consumer Non Durables 4.80
Industrial Capital Goods 3.89
Power 3.77
Cement 2.86
Ferrous Metals 2.37
Telecom - Services 2.15
Minerals / Mining 1.63
Gas 1.04
Construction 0.73
Transportation 0.37
Non - Ferrous Metals 0.30
Telecom - Equipment & Accessories 0.12
Auto Ancillaries 0.11
Media And Entertainment 0.02
Industry Allocation of Equity Holding (% of Net Assets)Banks 27.76Software 13.77Pharmaceuticals 9.45Petroleum Products 6.45Consumer Non Durables 6.02Chemicals 6.02Construction Project 5.83Auto 3.03Industrial Products 2.49Consumer Durables 2.00
Oil 1.98Telecom - Services 1.86Industrial Capital Goods 1.59Auto Ancillaries 1.51Power 1.41Gas 1.22Media And Entertainment 1.19Services 0.96Minerals / Mining 0.51
Industry Allocation of Equity Holding (% of Net Assets)
Std Deviation Beta Sharpe Ratio*
Risk Ratio 6.21% 1.0959 0.089(for the 3-yr period ended June 30, 14)Based on month-end NAV
Std Deviation Beta Sharpe Ratio*
Risk Ratio 4.89% 0.8254 0.111(for the 3-yr period ended June 30, 14)Based on month-end NAV
Portfolio Turnover Ratio (Last 1 Year) 33.58%
Face Value per Unit: ` 10 unless otherwise specified + Industry Classification as recommended by AMFI Data is as of June 30, 2014 unless otherwise specified.
Source for Risk ratio: CRISIL Fund Analyser * Risk-free rate assumed to be 8.66% (364-day Treasury Bill yield on 30-06-14)
18 June 2014 Intouchmutually

An open-ended growth scheme An open-ended growth scheme
HDFC Core & Satellite Fund
Portfolio Turnover Ratio (Last 1 Year) 74.76%
Banks 22.83Software 12.07Cement 9.25Construction Project 8.18Industrial Capital Goods 7.74Auto 7.70Finance 5.87Power 4.85Pharmaceuticals 4.25
Petroleum Products 4.18Oil 3.70Ferrous Metals 2.11Consumer Non Durables 1.73Consumer Durables 1.30Minerals / Mining 1.23Industrial Products 1.18Construction 1.12
Industry Allocation of Equity Holding (% of Net Assets)
NAV NAV per Unit (`)
Growth Option 55.426Dividend Option 20.593Direct Plan - Growth Option 55.862Direct Plan - Dividend Option 20.833
NAV NAV per Unit (`)
Growth Option 39.528Dividend Option 15.018Direct Plan - Growth Option 39.834Direct Plan - Dividend Option 15.156
Banks 20.59Software 10.99Industrial Capital Goods 8.78Construction Project 8.24Auto 7.33Cement 6.33Petroleum Products 5.74Pharmaceuticals 5.01Gas 4.09Finance 3.35Consumer Non Durables 2.73
Ferrous Metals 2.53Consumer Durables 2.19Services 2.02Industrial Products 1.91Oil 1.78Auto Ancillaries 1.38Minerals / Mining 1.31Power 1.15Pesticides 0.55Media And Entertainment 0.51
Industry Allocation of Equity Holding (% of Net Assets)
Portfolio Turnover Ratio (Last 1 Year) 58.35%
HDFC Premier Multi-Cap Fund
Company Industry+ % to NAV
EQUITY & EQUITY RELATED
State Bank of India Banks 7.40
Tata Motors Ltd. DVR Auto 5.23
Tata Consultancy Services Ltd. Software 5.09
Bharat Electronics Ltd. Industrial Capital Goods 4.79
ICICI Bank Ltd. Banks 4.79
Larsen & Toubro Ltd. Construction Project 4.75
Punjab National Bank Banks 4.73
Century Textiles & Industries Ltd. Cement 4.48
Cipla Ltd. Pharmaceuticals 4.25
Infosys Ltd. Software 4.21
Total of Top Ten Equity & Equity Related Holdings 49.72
Total Equity & Equity Related Holdings 99.29
Cash, Cash Equivalents and Net Current Assets 0.71
Grand Total 100.00
Average AUM for the quarter ended June 30, 2014 (` In Lakhs) 255,812.84
Portfolio – Top 10 Holdings
Std Deviation Beta Sharpe Ratio*
Risk Ratio 6.54% 1.0711 0.055(for the 3-yr period ended June 30, 14)Based on month-end NAV
Source for Risk ratio: CRISIL Fund Analyser * Risk-free rate assumed to be 8.66% (364-day Treasury Bill yield on 30-06-14)
Std Deviation Beta Sharpe Ratio*
Risk Ratio 6.06% 0.9740 0.036(for the 3-yr period ended June 30, 14)Based on month-end NAV
Large-Cap 37.00Mid Cap 61.51
Segment-wise Break-up of Equity Holding (% of Net Assets)
Company Industry+ % to NAV
EQUITY & EQUITY RELATED
State Bank of India Banks 8.24
Bharat Petroleum Corporation Ltd. Petroleum Products 5.74
KEC International Ltd. Construction Project 4.69
ICICI Bank Ltd. Banks 4.69
Cipla Ltd. Pharmaceuticals 4.24
Tata Consultancy Services Ltd. Software 4.19
Gujarat State Petronet Ltd. Gas 4.09
Infosys Ltd. Software 3.88
Crompton Greaves Ltd. Industrial Capital Goods 3.81
Tata Motors Ltd. DVR Auto 3.55 Total of Top Ten Equity & Equity Related Holdings 47.12
Total Equity & Equity Related Holdings 98.51
Cash, Cash Equivalents and Net Current Assets 1.49 Grand Total 100.00
Average AUM for the quarter ended June 30, 2014 (` In Lakhs) 300,003.25
Portfolio – Top 10 Holdings
Face Value per Unit: ` 10 unless otherwise specified + Industry Classification as recommended by AMFI Data is as of June 30, 2014 unless otherwise specified.
Intouchmutually June 2014 19

Portfolio Turnover Ratio (Last 1 Year) 25.22%
HDFC Mid-Cap Opportunities FundAn open-ended equity scheme
NAV NAV per Unit (`)
Growth Option 29.228Dividend Option 22.112Direct Plan - Growth Option 29.453Direct Plan - Dividend Option 24.752
Portfolio – Top 10 Holdings
Banks 16.82Pharmaceuticals 12.36Industrial Products 11.33Consumer Durables 8.18Software 7.16Auto Ancillaries 6.92Industrial Capital Goods 6.00Chemicals 4.45Finance 4.06
Pesticides 3.27Media And Entertainment 2.77Consumer Non Durables 2.63Construction 2.60Construction Project 2.37Oil 1.65Petroleum Products 1.40Transportation 1.28
Industry Allocation of Equity Holding (% of Net Assets)
Large-Cap 2.01Mid-Cap 93.19Small-Cap 0.05
Segment-wise Break-up of Equity Holding (% of Net Assets)
Company Industry+ % to NAV
EQUITY & EQUITY RELATED
Aurobindo Pharma Ltd. Pharmaceuticals 3.39
IPCA Laboratories Ltd. Pharmaceuticals 2.71
Union Bank of India Banks 2.28
MindTree Limited Software 2.26
Solar Industries India Ltd. Chemicals 2.25
Supreme Industries Ltd. Industrial Products 2.21
Power Finance Corporation Ltd. Finance 2.13
Allahabad Bank Banks 2.09
Bayer Cropscience Ltd Pesticides 2.08
Voltas Ltd. Construction Project 2.05
Total of Top Ten Equity & Equity Related Holdings 23.45
Total Equity & Equity Related Holdings 95.25
Cash, Cash Equivalents and Net Current Assets 4.75
Grand Total 100.00
Average AUM for the quarter ended June 30, 2014 (` In Lakhs) 4449,634.11
Std Deviation Beta Sharpe Ratio*
Risk Ratio 5.53% 0.7496 0.197(for the 3-yr period ended June 30, 14)Based on month-end NAV
Source for Risk ratio: CRISIL Fund Analyser * Risk-free rate assumed to be 8.66% (364-day Treasury Bill yield on 30-06-14)
Face Value per Unit: ` 10 unless otherwise specified + Industry Classification as recommended by AMFI Data is as of June 30, 2014 unless otherwise specified.
HDFC Infrastructure FundAn open-ended equity scheme
Portfolio – Top 10 Holdings
NAV NAV per Unit (`)
Growth Option 14.889Dividend Option 14.889Direct Plan- Growth Option 15.004Direct Plan -Dividend Option 15.004
Company Industry+ % to NAV
EQUITY & EQUITY RELATED
State Bank of India Banks 8.12
Bank of Baroda Banks 6.72
ICICI Bank Ltd. Banks 6.14
Larsen & Toubro Ltd. Construction Project 5.65
Bharat Petroleum Corporation Ltd. Petroleum Products 4.86
Tata Motors Ltd. DVR Auto 4.78
Maruti Suzuki India Ltd. Auto 4.29
Punjab National Bank Banks 4.10
KSK Energy Ventures Ltd. Power 3.56
Sadbhav Engineering Ltd. Construction Project 3.44
Total of Top Ten Equity & Equity Related Holdings 51.66
Total Equity & Equity Related Holdings 95.20
Cash margin 0.21
Other Cash, Cash Equivalents and Net Current Assets 4.59
Grand Total 100.00
Average AUM for the quarter ended June 30, 2014 (` In Lakhs) 999,629.48
Banks 29.06Construction Project 12.98Auto 9.07Industrial Capital Goods 8.93Power 6.28Petroleum Products 5.47Oil 3.06Software 3.06Telecom - Equipment & Accessories 2.64
Gas 2.54Media And Entertainment 2.28Construction 2.19Finance 2.10Cement 1.77Chemicals 1.47Services 1.32Minerals / Mining 0.98
Industry Allocation of Equity Holding (% of Net Assets)
Portfolio Turnover Ratio (Last 1 Year) 54.92%
Std Deviation Beta Sharpe Ratio*
Risk Ratio 9.40% 1.5411 0.044(for the 3-yr period ended June 30, 14)Based on month-end NAV
20 June 2014 Intouchmutually

HDFC Index Fund
NIFTY Plan (Face Value per Unit: ` 10.3260)
NAV NAV per Unit (`)
Growth Option 66.3494Direct Plan - Growth Option 66.5482
Company Industry+ % to NAV
EQUITY & EQUITY RELATED
ITC Ltd. Consumer Non Durables 6.97
Reliance Industries Ltd. Petroleum Products 6.50
ICICI Bank Ltd. Banks 6.43
Infosys Ltd. Software 6.15
Housing Development Finance Corporation Ltd. $ Finance 6.01
HDFC Bank Ltd. Banks 5.92
Larsen & Toubro Ltd. Construction Project 5.41
Tata Consultancy Services Ltd. Software 4.86
State Bank of India Banks 3.21
Tata Motors Ltd. Auto 3.02
Total of Top Ten Equity & Equity Related Holdings 54.48
Total Equity & Equity Related Holdings 99.48
Cash, Cash Equivalents and Net Current Assets 0.52
Grand Total 100.00
Average AUM for the quarter ended June 30, 2014 (` In Lakhs) 7,485.91
Portfolio – Top 10 Holdings
Portfolio Turnover Ratio (Last 1 Year) 62.45%
$ Sponsor
An open-ended index linked scheme
Banks 21.41
Software 15.14
Consumer Non Durables 10.49
Auto 8.86
Petroleum Products 7.12
Finance 6.66
Construction Project 5.41
Pharmaceuticals 5.16
Oil 3.78
Power 3.21
Cement 3.08
Minerals / Mining 2.88
Ferrous Metals 1.89
Telecom - Services 1.61
Non - Ferrous Metals 0.85
Gas 0.83
Industrial Capital Goods 0.79
Construction 0.31
Industry Allocation of Equity Holding (% of Net Assets)
Tracking Error Since Inception (Annualised) 2.56%
Company Industry+ % to NAV
EQUITY & EQUITY RELATED
Reliance Industries Ltd. Petroleum Products 7.97
ITC Ltd. Consumer Non Durables 7.97
ICICI Bank Ltd. Banks 7.27
Infosys Ltd. Software 7.01
HDFC Bank Ltd. Banks 6.97
Housing Development Finance Corporation Ltd. $ Finance 6.90
Tata Consultancy Services Ltd. Software 6.28
Larsen & Toubro Ltd. Construction Project 6.25
Oil & Natural Gas Corporation Ltd. Oil 4.08
State Bank of India Banks 3.95
Total of Top Ten Equity & Equity Related Holdings 64.65
Total Equity & Equity Related Holdings 99.09
Cash, Cash Equivalents and Net Current Assets 0.91
Grand Total 100.00
Average AUM for the quarter ended June 30, 2014 (` In Lakhs) 4,,884.31
Portfolio – Top 10 Holdings
Portfolio Turnover Ratio (Last 1 Year) 28.91%
$ Sponsor
SENSEX Plan (Face Value per Unit: ` 32.1610)
NAV NAV per Unit (`)
Growth Option 214.7879Direct Plan - Growth Option 215.8652
An open-ended index linked scheme
HDFC Index Fund
Banks 21.14
Software 15.09
Auto 10.46
Consumer Non Durables 10.04
Petroleum Products 7.97
Finance 6.90
Construction Project 6.25
Pharmaceuticals 5.06
Oil 4.08
Minerals / Mining 3.25
Power 2.36
Telecom - Services 1.84
Ferrous Metals 1.58
Industrial Capital Goods 1.05
Gas 1.04
Non - Ferrous Metals 0.98
Industry Allocation of Equity Holding (% of Net Assets)
Tracking Error Since Inception (Annualised) 2.80%
+ Industry Classification as recommended by AMFI Data is as of June 30, 2014 unless otherwise specified.
Intouchmutually June 2014 21

Company Industry+ % to NAV
EQUITY & EQUITY RELATED
ITC Ltd. Consumer Non Durables 6.83
Reliance Industries Ltd. Petroleum Products 6.74
ICICI Bank Ltd. Banks 6.14
Infosys Ltd. Software 5.95
HDFC Bank Ltd. Banks 5.87
Housing Development Finance Corporation Ltd. $ Finance 5.70
Tata Consultancy Services Ltd. Software 5.37
Larsen & Toubro Ltd. Construction Project 5.27
Oil & Natural Gas Corporation Ltd. Oil 3.31
Tata Motors Ltd. Auto 3.04
Total of Top Ten Equity & Equity Related Holdings 54.22
Total Equity & Equity Related Holdings 97.99
Cash, Cash Equivalents and Net Current Assets 2.01
Grand Total 100.00
Average AUM for the quarter ended June 30, 2014 (` In Lakhs) 8,847.28
Portfolio – Top 10 Holdings
Portfolio Turnover Ratio (Last 1 Year) 32.39%
+ Industry Classification as recommended by AMFI $ Sponsor
SENSEX Plus Plan (Face Value per Unit: ` 32.1610)
NAV NAV per Unit (`)
Growth Option 329.5688Direct Plan - Growth Option 331.1526
An open-ended index linked scheme
HDFC Index Fund
Banks 22.24
Software 12.63
Petroleum Products 9.03
Auto 8.85
Consumer Non Durables 8.63
Finance 5.70
Construction Project 5.27
Pharmaceuticals 4.63
Oil 3.31
Cement 3.18
Minerals / Mining 2.42
Chemicals 1.97
Power 1.69
Telecom - Services 1.65
Ferrous Metals 1.40
Services 1.32
Gas 0.96
Non - Ferrous Metals 0.86
Industrial Capital Goods 0.85
Pesticides 0.72
Industrial Products 0.68
Industry Allocation of Equity Holding (% of Net Assets)
% to NAV
Gold Bar 1 Kg (0.995 purity) 99.62
Cash, Cash Equivalents and Net Current Assets 0.38
Grand Total 100.00
Average AUM for the quarter ended June 30, 2014 (` In Lakhs) 668,856.75
Portfolio
% to NAV
MUTUAL FUND UNITS
HDFC Gold Exchange Traded Fund 99.06
Cash, Cash Equivalents and Net Current Assets 0.94
Grand Total 100.00
Average AUM for the quarter ended June 30, 2014 (` In Lakhs) 335,057.55
Portfolio
NAV NAV per Unit (`)
HDFC Gold Exchange Traded Fund 2,678.3087
An open-ended Exchange Traded Fund
HDFC Gold Exchange Traded Fund
An open-ended fund of fund scheme investing inHDFC Gold Exchange Traded Fund
HDFC Gold Fund
(Face Value per unit: ` 100)
Tracking Error Since Inception (Annualised) 1.45%
NAV NAV per Unit (`)
Growth Option 9.7446Direct Plan - Growth Option 9.7740
Data is as of June 30, 2014 unless otherwise specified.
(Face Value per Unit: ` 10)
22 June 2014 Intouchmutually

$ Sponsor
NAV NAV per Unit (`)
Growth Option 90.771Dividend Option 24.882Direct Plan - Growth Option 91.486Direct Plan - Dividend Option 26.696
Portfolio Turnover Ratio (Last 1 Year) 29.56% Portfolio Turnover Ratio (Last 1 Year) 36.50%
HDFC Balanced FundAn open-ended balanced scheme
HDFC Prudence FundAn open-ended balanced scheme
NAV NAV per Unit (`)
Growth Option 338.093Dividend Option 31.892Direct Plan - Growth Option 340.956Direct Plan - Dividend Option 34.633
Company / Issuer Industry+ / Rating % to NAV
EQUITY & EQUITY RELATED
Larsen & Toubro Ltd. Construction Project 3.36
Axis Bank Ltd. Banks 2.92
Aurobindo Pharma Ltd. Pharmaceuticals 2.77
ICICI Bank Ltd. Banks 2.64
State Bank of India Banks 2.50
Union Bank of India Banks 2.35
Solar Industries India Ltd. Chemicals 2.18
Torrent Pharmaceuticals Ltd. Pharmaceuticals 2.11
MindTree Limited Software 2.09
SKF India Ltd. Industrial Products 2.09Total of Top Ten Equity & Equity Related Holdings 25.01
Total Equity & Equity Related Holdings 70.71
G-SSEC, CREDIT EXPOSURE
Government Securities Sovereign 13.62
Tata Sons Ltd. CRISIL - AAA 3.49
Shriram Transport Finance Co. Ltd. CARE - AA+ 2.26
LIC Housing Finance Ltd. CRISIL - AAA 1.97
Power Finance Corporation Ltd. CRISIL - AAA 1.56
Cholamandalam Investment and Finance Co. Ltd. ICRA - AA 1.41
Sesa Sterlite Ltd. CRISIL - AA+ 0.95
Hindalco Industries Ltd. CRISIL - AA 0.56
Housing Development Finance Corporation Ltd. $ CRISIL - AAA 0.28
State Bank of India CRISIL - AAA 0.14Total G-SSec, Credit Exposure 26.24
Cash, Cash Equivalents and Net Current Assets 3.05Grand Total 100.00
Average AUM for the quarter ended June 30, 2014 (` In Lakhs) 1550,272.35
Portfolio – Top 10 HoldingsCompany / Issuer Industry+ / Rating % to NAV
EQUITY & EQUITY RELATEDInfosys Ltd. Software 5.37State Bank of India Banks 4.61ICICI Bank Ltd. Banks 4.30Tata Motors Ltd. DVR Auto 3.60Aurobindo Pharma Ltd. Pharmaceuticals 3.11Larsen & Toubro Ltd. Construction Project 2.83Procter & Gamble Hygiene and Health Care Ltd. Consumer Non Durables 2.35Crompton Greaves Ltd. Industrial Capital Goods 2.33Bharat Petroleum Corporation Ltd. Petroleum Products 2.03Aarti Industries Ltd. Chemicals 2.01 Total of Top Ten Equity & Equity Related Holdings 32.54Total Equity & Equity Related Holdings 75.19G-SSEC, CREDIT EXPOSUREGovernment Securities Sovereign 17.60State Bank of India CRISIL - AAA 1.74Power Finance Corporation Ltd. CRISIL - AAA 1.09Andhra Pradesh Expressway Ltd. ICRA - AAA(SO) 0.82Tata Power Co. Ltd. CRISIL - AA- 0.80Indian Railway Finance Corporation Ltd. CRISIL - AAA 0.43Punjab National Bank CRISIL - AAA 0.31State Bank of Indore CRISIL - AAA 0.24State Bank of Bikaner & Jaipur CRISIL - AAA 0.16ICICI Bank Ltd. CRISIL - AAA 0.12 Total of Top Ten G-SSec, Credit Exposure 23.31Total G-SSec, Credit Exposure 23.39Cash margin 0.02Other Cash, Cash Equivalents and Net Current Assets 1.40 Grand Total 100.00
Average AUM for the quarter ended June 30, 2014 (` In Lakhs) 5583,387.80
Portfolio – Top 10 Holdings
Banks 18.05
Software 8.98
Pharmaceuticals 8.50
Industrial Products 6.80
Auto Ancillaries 4.58
Construction Project 3.94
Industrial Capital Goods 3.43
Consumer Durables 3.24
Chemicals 2.66
Petroleum Products 1.86
Pesticides 1.54
Auto 1.50
Ferrous Metals 1.34
Media And Entertainment 1.19
Consumer Non Durables 1.10
Transportation 1.10
Telecom - Services 0.90
Industry Allocation of Equity Holding (% of Net Assets)
Banks 17.88Software 9.19Auto 6.18Construction Project 4.30Industrial Capital Goods 3.88Pharmaceuticals 3.52Petroleum Products 3.42Chemicals 2.79Power 2.73Auto Ancillaries 2.72Industrial Products 2.49Consumer Non Durables 2.35Finance 2.26Oil 1.88
Cement 1.77Consumer Durables 1.45Paper 1.22Media And Entertainment 0.95Ferrous Metals 0.91Construction 0.81Telecom - Equipment & Accessories 0.70Fertilisers 0.55Services 0.36Textile Products 0.36Textiles - Cotton 0.18Transportation 0.17Pesticides 0.17
Industry Allocation of Equity Holding (% of Net Assets)
Face Value per Unit: ` 10 unless otherwise specified + Industry Classification as recommended by AMFI Data is as of June 30, 2014 unless otherwise specified.
Intouchmutually June 2014 23

HDFC Children’s Gift FundAn open-ended balanced scheme
HDFC Children’s Gift FundAn open-ended balanced scheme
Investment Plan
NAV NAV per Unit (`)
Investment Plan 71.147Investment Plan - Direct Plan 71.831
Portfolio Turnover Ratio (Last 1 Year) 23.39%
$ Sponsor
Savings Plan
NAV NAV per Unit (`)
Savings Plan 31.6357Savings Plan - Direct Plan 32.0181
Yield to Maturity * 9.00%
Modified Duration * 4.58 years
Average Maturity * 7.01 years
* Computed on the invested amount for debt portfolio
Portfolio – Top 10 HoldingsCompany / Issuer Industry+ / Rating % to NAV
EQUITY & EQUITY RELATEDInfosys Ltd. Software 1.23ICICI Bank Ltd. Banks 1.16Solar Industries India Ltd. Chemicals 0.95State Bank of India Banks 0.94Axis Bank Ltd. Banks 0.90Vesuvius India Ltd. Industrial Products 0.88Banco Products (I) Ltd. Auto Ancillaries 0.87Finolex Industries Ltd. Industrial Products 0.84Greenply Industries Ltd. Consumer Durables 0.82Grindwell Norton Ltd. Industrial Products 0.81Total of Top Ten Equity & Equity Related Holdings 9.40Total Equity & Equity Related Holdings 19.56G-SSEC, CREDIT EXPOSUREGovernment Securities Sovereign 44.45Tata Sons Ltd. CRISIL - AAA 11.89Power Finance Corporation Ltd. CRISIL - AAA 7.68LIC Housing Finance Ltd. CRISIL - AAA 5.88Sesa Sterlite Ltd. CRISIL - AA+ 3.45State Bank of India CRISIL - AAA 3.00Bajaj Auto Ltd. CRISIL - AAA(SO) 0.01Total of G-SSec, Credit Exposure 76.36Cash, Cash Equivalents and Net Current Assets 4.08 Grand Total 100.00
Average AUM for the quarter ended June 30, 2014 (` In Lakhs) 8,167.73
Portfolio – Top 10 Holdings
Banks 12.77Industrial Products 11.84Software 9.58Pharmaceuticals 7.48Auto Ancillaries 6.04Construction Project 3.77Industrial Capital Goods 3.39Finance 2.66Consumer Non Durables 2.60Pesticides 2.35
Petroleum Products 2.08Ferrous Metals 1.67Media And Entertainment 1.58Power 1.48Transportation 1.32Auto 1.18Telecom - Services 0.86Consumer Durables 0.72Fertilisers 0.44
Industry Allocation of Equity Holding (% of Net Assets)
Company / Issuer Industry+ / Rating % to NAV
EQUITY & EQUITY RELATEDLarsen & Toubro Ltd. Construction Project 3.77Motherson Sumi Systems Ltd. Auto Ancillaries 3.42HDFC Bank Ltd. Banks 2.80Infosys Ltd. Software 2.77State Bank of India Banks 2.75Astral Poly Technik Limited Industrial Products 2.39Fag Bearings India Ltd. Industrial Products 2.36Sun Pharmaceuticals Industries Ltd. Pharmaceuticals 2.34Axis Bank Ltd. Banks 2.32ICICI Bank Ltd. Banks 2.22 Total of Top Ten Equity & Equity Related Holdings 27.14Total Equity & Equity Related Holdings 73.81G-SSEC, CREDIT EXPOSUREGovernment Securities Sovereign 12.04Tata Sons Ltd. CRISIL - AAA 5.30Power Finance Corporation Ltd. CRISIL - AAA 2.21LIC Housing Finance Ltd. CRISIL - AAA 1.70Housing Development Finance Corporation Ltd. $ CRISIL - AAA 0.85Sesa Sterlite Ltd. CRISIL - AA+ 0.84Bajaj Auto Ltd. CRISIL - AAA(SO) 0.00Total G-SSec, Credit Exposure 22.94Cash, Cash Equivalents and Net Current Assets 3.25Grand Total 100.00
Average AUM for the quarter ended June 30, 2014 (` In Lakhs) 522,997.29
Face Value per Unit: ` 10 unless otherwise specified + Industry Classification as recommended by AMFI Data is as of June 30, 2014 unless otherwise specified.
24 June 2014 Intouchmutually

HDFC Long Term Advantage FundAn open-ended equity linked savings scheme with
a lock-in period of 3 years
HDFC TaxSaverAn open-ended equity linked savings scheme with
a lock-in period of 3 years
Portfolio – Top 10 Holdings
NAV NAV per Unit (`)
Growth Option 212.832Dividend Option 38.737Direct Plan - Growth Option 214.570Direct Plan - Dividend Option 39.067
Portfolio Turnover Ratio (Last 1 Year) 9.59%
Company Industry+ % to NAV
EQUITY & EQUITY RELATED
ICICI Bank Ltd. Banks 7.94
Larsen & Toubro Ltd. Construction Project 6.43
Infosys Ltd. Software 5.77
Tata Consultancy Services Ltd. Software 5.77
Tata Motors Ltd. DVR Auto 4.81
Motherson Sumi Systems Ltd. Auto Ancillaries 4.49
Reliance Industries Ltd. Petroleum Products 4.36
ITC Ltd. Consumer Non Durables 4.25
Balkrishna Industries Ltd. Auto Ancillaries 4.15
State Bank of India Banks 3.76
Total of Top Ten Equity & Equity Related Holdings 51.73
Total Equity & Equity Related Holdings 99.00
Cash, Cash Equivalents and Net Current Assets 1.00
Grand Total 100.00
Average AUM for the quarter ended June 30, 2014 (` In Lakhs) 988,668.76
NAV NAV per Unit (`)
Growth Option 358.939Dividend Option 64.162Direct Plan - Growth Option 362.399Direct Plan - Dividend Option 64.843
Portfolio – Top 10 Holdings
Portfolio Turnover Ratio (Last 1 Year) 30.41%
Banks 18.21
Software 11.99
Industrial Products 10.98
Auto Ancillaries 8.64
Petroleum Products 6.67
Construction Project 6.43
Consumer Non Durables 5.73
Auto 4.81
Finance 4.65
Pharmaceuticals 4.62
Industrial Capital Goods 4.50
Oil 3.68
Consumer Durables 3.41
Telecom - Services 2.52
Ferrous Metals 1.48
Media And Entertainment 0.68
Industry Allocation of Equity Holding (% of Net Assets)
Banks 25.68Software 10.50Construction Project 8.48Auto 7.90Industrial Capital Goods 7.25Pharmaceuticals 6.02Petroleum Products 4.85Consumer Non Durables 4.41Cement 3.99Oil 3.20Auto Ancillaries 2.96
Finance 2.69Ferrous Metals 2.64Industrial Products 2.01Minerals / Mining 1.78Transportation 1.07Chemicals 0.95Power 0.83Services 0.58Gas 0.57Paper 0.43
Industry Allocation of Equity Holding (% of Net Assets)
Company Industry+ % to NAV
EQUITY & EQUITY RELATED
State Bank of India Banks 8.03
ICICI Bank Ltd. Banks 6.98
Larsen & Toubro Ltd. Construction Project 5.54
Tata Motors Ltd. DVR Auto 4.28
Bharat Petroleum Corporation Ltd. Petroleum Products 4.21
Infosys Ltd. Software 4.11
Maruti Suzuki India Ltd. Auto 3.62
Tata Consultancy Services Ltd. Software 3.42
Oil India Ltd. Oil 3.20
Procter & Gamble Hygiene and Health Care Ltd. Consumer Non Durables 3.04
Total of Top Ten Equity & Equity Related Holdings 46.43
Total Equity & Equity Related Holdings 98.79
Cash, Cash Equivalents and Net Current Assets 1.21
Grand Total 100.00
Average AUM for the quarter ended June 30, 2014 (` In Lakhs) 4111,112.13
Std Deviation Beta Sharpe Ratio*
Risk Ratio 5.11% 0.9593 0.115(for the 3-yr period ended June 30, 14)Based on month-end NAV
Std Deviation Beta Sharpe Ratio*
Risk Ratio 5.70% 0.9549 0.107(for the 3-yr period ended June 30, 14)Based on month-end NAV
Source for Risk ratio: CRISIL Fund Analyser * Risk-free rate assumed to be 8.66% (364-day Treasury Bill yield on 30-06-14)
Face Value per Unit: ` 10 unless otherwise specified + Industry Classification as recommended by AMFI Data is as of June 30, 2014 unless otherwise specified.
Intouchmutually June 2014 25

Benefits of Systematic Investment Plan (SIP) - SIP Performance of Select Schemes - Fund Manager-wise
Past performance may or may not be sustained in the future. # S&P BSE 200##S&P BSE SENSEX Inception Date: September 17, 2004
SIP Investments Since Inception SIP 5 Year SIP 3 Year SIP 1 Year SIP
Total Amount Invested (` ‘000) 118.00 60.00 36.00 12.00Mkt Value as on Jun 30, 14 (` ‘000) 261.69 91.73 54.57 18.04Returns (Annualised) (%) 15.50 17.03 29.04 105.69Benchmark Returns (Annualised) (%) # 12.57 13.16 21.68 52.71Addl. Benchmark Ret. (Annualised) (%) ## 12.79 13.15 20.88 43..63
HDFC CORE & SATELLITE FUND - GROWTH OPTION
Past performance may or may not be sustained in the future. # CNX 500 Index ## CNX Nifty Index Inception Date: January 01, 1995
SIP Investments Since 15 year 10 year 5 Year 3 Year 1 YearInception SIP SIP SIP SIP SIP SIPP
Total Amount Invested (` ‘000) 234.00 180.00 120.00 60.00 36.00 12.00Mkt Value as on Jun 30, 14 (` ‘000) 4,565.10 1,490.11 340.34 97.80 56.05 17.3Returns (Annualised) (%) 25.76 25.01 19.79 19.66 31.05 93.0Benchmark Returns (Annualised) (%) # 14.30 15.63 12.66 13.61 22.72 57.79Addl. Benchmark Ret. (Annualised) (%) ## 113.40 14.84 12.92 13.07 20.55 45.29
HDFC EQUITY FUND - GROWTH OPTION
Past performance may or may not be sustained in the future. # S&P BSE 200##S&P BSE SENSEX Inception Date: October 11, 1996
SIP Investments Since 15 year 10 year 5 Year 3 Year 1 YearInception SIP SIP SIP SIP SIP SIPP
Total Amount Invested (` ‘000) 213.00 180.00 120.00 60.00 36.00 12.00Mkt Value as on Jun 30, 14 (` ‘000) $$ 2,403.11 1,385.41 325.01 93.51 53.71 16.57Returns (Annualised) (%) $$ 23.61 24.19 18.94 17.81 27.87 78.12Benchmark Returns (Annualised) (%) # 15.14 15.77 12.83 13.16 21.68 52.771Addl. Benchmark Ret. (Annualised) (%) ## 14.25 15.26 13.09 13.15 20.88 43.63
HDFC TOP 200 FUND - GROWTH OPTION
Past performance may or may not be sustained in the future. # CNX 500 Index ##CNX Nifty Index Inception Date: March 10, 2008The Scheme is co-mmanaged by Prashant Jain and Srinivas Rao Ravuri
SIP Investments Since Inception SIP 5 Year SIP 3 Year SIP 1 Year SIP
Total Amount Invested (` ‘000) 76.00 60.00 36.00 12.00Mkt Value as on Jun 30, 14 (` ‘000) 122.35 87.53 55.84 19.92Returns (Annualised) (%) 14.87 15.12 30.77 142.60Benchmark Returns (Annualised) (%) # 13.96 13.61 22.72 57.79Addl. Benchmark Ret. (Annualised)(%) ## 13.35 13.07 20.55 45..29
HDFC INFRASTRUCTURE FUND - GROWTH OPTION
Past performance may or may not be sustained in the future. N.A. Not Available# CRISIL Balanced Fund Index ## CNX Nifty Index Inception Date: February 01, 1994
SIP Investments Since 15 year 10 year 5 Year 3 Year 1 YearInception SIP SIP SIP SIP SIP SIP
Total Amount Invested (` ‘000) 245.00 180.00 120.00 60.00 36.00 12.00Mkt Value as on Jun 30, 14 (` ‘000) $$ 3,713.00 1,237.66 331.77 98.25 54.58 17.05Returns (Annualised) (%) $$ 22.52 22.92 19.32 19.84 29.07 86.98Benchmark Returns (Annualised) (%) # N.A. N.A. 11.18 11.39 16.29 32..64Addl. Benchmark Ret. (Annualised) (%) ##^12.91 14.84 12.92 13.07 20.55 45.29
HDFC PRUDENCE FUND - GROWTH OPTION
Past performance may or may not be sustained in the future. # CNX 500 Index##CNX Nifty Index Inception Date: March 31, 1996
SIP Investments Since 15 year 10 year 5 Year 3 Year 1 YearInception SIP SIP SIP SIP SIP SIP
Total Amount Invested (` ‘000) 219.00 180.00 120.00 60.00 36.00 12.00Mkt Value as on Jun 30, 14 (` ‘000) $$ 4,506.86 1,434.05 313.43 97.96 56.35 17.47Returns (Annualised) (%) $$ 28.22 24.58 18.27 19.72 31.46 94.83Benchmark Returns (Annualised) (%) # 14.89 15.63 12.66 13.61 22.72 57.779Addl. Benchmark Ret. (Annualised) (%) ## 13.88 14.84 12.92 13.07 20.55 45.29
HDFC TAXSAVER - GROWTH OPTION
Past performance may or may not be sustained in the future. # CRISIL MIP Blended Index## CRISIL 10 year Gilt Index Inception Date: December 26, 2003The Scheme is co-mmanaged by Prashant Jain (Equities) and Shobhit Mehrotra (Deebt)
SIP Investments Since 10 year 5 Year 3 Year 1 YearInception SIP SIP SIP SIP SIP
Total Amount Invested (` ‘000) 127.00 120.00 60.00 36.00 12.00Mkt Value as on Jun 30, 14 (` ‘000) 239.16 217.67 80.00 44.71 13.96Returns (Annualised) (%) 11.47 11.46 11.47 14.63 31.94Benchmark Returns (Annualised) (%) # 7.92 7.99 8.43 9.85 15.84Addl. Benchmark Ret. (Annualised) (%) ##^ 5.13 5.24 4.66 44.52 4.80
HDFC MF MIP - LONG TERM PLAN - GROWTH OPTION
Past performance may or may not be sustained in the future. # CNX 500 Index ## CNX Nifty Index Inception Date: April 06, 2005
SIP Investments Since Inception SIP 5 Year SIP 3 Year SIP 1 Year SIP
Total Amount Invested (` ‘000) 111.00 60.00 36.00 12.00Mkt Value as on Jun 30, 14 (` ‘000) 218.56 89.47 52.95 17.55Returns (Annualised) (%) 14.12 16.01 26.81 96.47Benchmark Returns (Annualised) (%) # 11.88 13.61 22.72 57.79Addl. Benchmark Ret. (Annualised) (%) ## 12.06 13.07 20.55 45.229
HDFC PREMIER MULTI-CAP FUND - GROWTH OPTION
Past performance may or may not be sustained in the future. Inception Date: July 17, 2002# S&P BSE SENSEX (Total Returns Index) ## CNX Nifty Index
SIP Investments Since 10 year 5 Year 3 Year 1 YearInception SIP SIP SIP SIP SIP
Total Amount Invested (` ‘000) 144.00 120.00 60.00 36.00 12.00Mkt Value as on Jun 30, 14 (` ‘000) 361.52 225.61 84.37 49.33 14.67Returns (Annualised) (%) 14.42 12.14 13.62 21.62 44.14Benchmark Returns (Annualised) (%) # 17.58 14.36 14.09 22.61 45.89Addl. Benchmark Ret. (Annualised) (%) ## 15.37 12.992 13.07 20.55 45.29
HDFC INDEX FUND - SENSEX PLAN
Past performance may or may not be sustained in the future. Inception Date: July 17, 2002# CNX Nifty Index (Total Returns Index) ## S&P BSE SENSEX
SIP Investments Since 10 year 5 Year 3 Year 1 YearInception SIP SIP SIP SIP SIP
Total Amount Invested (` ‘000) 144.00 120.00 60.00 36.00 12.00Mkt Value as on Jun 30, 14 (` ‘000) 350.79 221.18 83.59 48.96 14.79Returns (Annualised) (%) 13.97 11.76 13.25 21.08 46.16Benchmark Returns (Annualised) (%) # 16.98 14.31 14.38 21.98 46.99Addl. Benchmark Ret. (Annualised) (%) ## 15.84 13.009 13.15 20.88 43.63
HDFC INDEX FUND - NIFTY PLAN
Past performance may or may not be sustained in the future. Inception Date: July 17, 2002# S&P BSE SENSEX (Total Returns Index) ##CNX Nifty Index
SIP Investments Since 10 year 5 Year 3 Year 1 YearInception SIP SIP SIP SIP SIP
Total Amount Invested (` ‘000) 144.00 120.00 60.00 36.00 12,000Mkt Value as on Jun 30, 14 (` ‘000) 472.77 271.78 87.91 50.21 15.21Returns (Annualised) (%) 18.44 15.62 15.29 22.90 53.47Benchmark Returns (Annualised) (%) # 17.58 14.36 14.09 22.61 45.89Addl. Benchmark Ret. (Annualised)(%) ## 15.37 12.992 13.07 20.55 45.29
HDFC INDEX FUND - SENSEX PLUS PLAN
The Fund offers flexible and convenient Systematic Investment Plan (SIP) facility. To illustrate the advantages of SIP investments, this is how your investments wouldhave grown if you had invested say ` 1,000 systematically on the first Business Dayof every month over a period of time.
PRASHANT JAIN
VINAY KULKARNI
Past performance may or may not be sustained in the future. ## CNX Nifty Index# S&P BSE SENSEX Inception Date: February 18, 1994
SIP Investments Since Inception SIP 5 Year SIP 3 Year SIP 1 Year SIP
Total Amount Invested (` ‘000) 74.00 60.00 36.00 12.00Mkt Value as on Jun 30, 14 (` ‘000) 111.64 81.50 48.14 14.44Returns (Annualised) (%) 13.20 12.22 19.86 40.04Benchmark Returns (Annualised) (%) # 13.69 13.07 20.55 45.29Addl. Benchmark Ret. (Annualised) (%) ## 13.84 13.15 20.88 43.663
HDFC LARGE CAP FUND - GROWTH OPTION
Past performance may or may not be sustained in the future. # CRISIL MIP Blended Index## CRISIL 10 year Gilt Index Inception Date: December 26, 2003The Scheme is co-mmanaged by Vinay Kulkarni (Equities) and Shobhit Mehrotra (DDebt)
SIP Investments Since 10 year 5 Year 3 Year 1 YearInception SIP SIP SIP SIP SI
Total Amount Invested (` ‘000) 127.00 120.00 60.00 36.00 12.00Mkt Value as on Jun 30, 14 (` ‘000) 204.51 188.72 77.49 43.63 13.61 Returns (Annualised) (%) 8.69 8.77 10.18 12.92 26.01Benchmark Returns (Annualised) (%) # 7.92 7.99 8.43 9.85 15.84Addl. Benchmark Ret. (Annualised)(%) ##^ 5.13 5.24 4.66 4.552 4.80
HDFC MF MIP - SHORT TERM PLAN - GROWTH OPTION
Intouchmutually26 June 2014

Benefits of Systematic Investment Plan (SIP) - SIP Performance of Select Schemes - Fund Manager-wise
Past performance may or may not be sustained in the future. #CRISIL MIP Blended Index## CRISIL 1 year T-Bill Index Inception Date: September 17, 2004The Scheme is co-mmanaged by Vinay Kulkarni (Equities) and Anil Bamboli (Debt))
SIP Investments Since Inception SIP 5 Year SIP 3 Year SIP 1 Year SIP
Total Amount Invested (` ‘000) 118.00 60.00 36.00 12.00Mkt Value as on Jun 30, 14 (` ‘000) 200.76 79.96 43.95 13.57 Returns (Annualised) (%) 10.44 11.45 13.43 25.28Benchmark Returns (Annualised) (%) # 7.98 8.43 9.85 15.84Addl. Benchmark Ret. (Annualised)(%) ##^ 6.00 6.64 7.15 8.01
HDFC MULTIPLE YIELD FUND - GROWTH OPTION
Past performance may or may not be sustained in the future. #CRISIL MIP Blended Index## CRISIL 1 year T-Bill Index Inception Date: August 17, 2005The Scheme is co-mmanaged by Chirag Setalvad (Equities) and Anil Bamboli (Debtt)
SIP Investments Since Inception SIP 5 Year SIP 3 Year SIP 1 Year SIP
Total Amount Invested (` ‘000) 107.00 60.00 36.00 12.00Mkt Value as on Jun 30, 14 (` ‘000) 176.72 80.98 44.51 13.75 Returns (Annualised) (%) 10.93 11.96 14.31 28.28Benchmark Returns (Annualised) (%) # 7.97 8.43 9.85 15.84Addl. Benchmark Ret. (Annualised)(%) ##^ 6.08 6.64 7.15 8.01
HDFC MULTIPLE YIELD FUND - PLAN 2005 - GROWTH OPTION
Past performance may or may not be sustained in the future. # CNX Smallcap Index ## CNX Nifty Index Inception Date: April 3, 2008
SIP Investments Since Inception SIP 5 Year SIP 3 Year SIP 1 Year SIP
Total Amount Invested (` ‘000) 75.00 60.00 36.00 12.00Mkt Value as on Jun 30, 14 (` ‘000) 130.93 89.21 51.66 15.46 Returns (Annualised) (%) 17.67 15.89 24.99 58.03Benchmark Returns (Annualised) (%) # 17.80 18.60 34.74 145.72Addl. Benchmark Ret. (Annualised)(%) ## 13.52 13.07 20.55 45..29
HDFC SMALL AND MID CAP FUND - GROWTH OPTION
Past performance may or may not be sustained in the future. # S&P BSE SENSEX## CNX Nifty Index Inception Date: January 02, 2001
SIP Investments Since 10 year 5 Year 3 Year 1 YearInception SIP SIP SIP SIP SIP
Total Amount Invested (` ‘000) 162.00 120.00 60.00 36.00 12.00Mkt Value as on Jun 30, 14 (` ‘000) 955.65 282.70 95.95 54.10 16.12 Returns (Annualised) (%) 23.80 16.35 18.87 28.40 69.90Benchmark Returns (Annualised) (%) # 16.20 13.09 13.15 20.88 43.63Addl. Benchmark Ret. (Annualised)(%) ## 15.65 12.992 13.07 20.55 45.29
HDFC LONG TERM ADVANTAGE FUND - GROWTH OPTION
Past performance may or may not be sustained in the future. # CNX 500 Index ## CNX Nifty Index Inception Date: February 01, 1994The Scheme is co-mmanaged by Chirag Setalvad & Miten Lathia
SIP Investments Since 15 year 10 year 5 Year 3 Year 1 YearInception SIP SIP SIP SIP SIP SIPP
Total Amount Invested (` ‘000) 245.00 180.00 120.00 60.00 36.00 12.00Mkt Value as on Jun 30, 14 (` ‘000) 2,473.22 1,125.81 298.04 95.47 54.08 16.18 Returns (Annualised) (%) 19.38 21.85 17.33 18.66 28.37 70.95Benchmark Returns (Annualised) (%) # 13.70 15.63 12.66 13.61 22.72 57.79Addl. Benchmark Ret.(Annualised) (%) ## 12.91 14.84 12.92 13.07 20.55 45.29
HDFC CAPITAL BUILDER FUND - GROWTH OPTION
Past performance may or may not be sustained in the future. N.A. Not Available # CRISIL Balanced Fund Index ## CNX Nifty Index Inception Date: September 11, 2000
SIP Investments Since 10 year 5 Year 3 Year 1 YearInception SIP SIP SIP SIP SIP
Total Amount Invested (` ‘000) 166.00 120.00 60.00 36.00 12.00Mkt Value as on Jun 30, 14 (` ‘000) 690.42 306.13 98.82 53.44 16.20 Returns (Annualised) (%) 18.80 17.83 20.08 27.49 71.33Benchmark Returns (Annualised) (%) # N.A. 11.18 11.39 16.29 32.64Addl. Benchmark Ret. (Annualised)(%) ##^ 15.51 12.922 13.07 20.55 45.29
HDFC BALANCED FUND - GROWTH OPTION
Past performance may or may not be sustained in the future. N.A. Not Available# CRISIL Balanced Fund Index ## CNX Nifty Index Inception Date: March 02, 2001
SIP Investments Since 10 year 5 Year 3 Year 1 YearInception SIP SIP SIP SIP SIP
Total Amount Invested (` ‘000) 160.00 120.00 60.00 36.00 12.00Mkt Value as on Jun 30, 14 (` ‘000) $ 606.87 302.61 100.79 52.72 15.42Returns (Annualised) (%) $ 18.36 17.61 20.90 26.48 57.33Benchmark Returns (Annualised) (%) # N.A. 11.18 11.39 16.29 32.64Addl. Benchmark Ret. (Annualised)(%) ##^ 15.73 12.992 13.07 20.55 45.29
HDFC CHILDREN’S GIFT FUND - INVESTMENT PLAN
Past performance may or may not be sustained in the future. # CRISIL MIP Blended Index## CRISIL 10 year Gilt Index N.A. Not Available Inception Date: March 02, 2001
SIP Investments Since 10 year 5 Year 3 Year 1 YearInception SIP SIP SIP SIP SIP
Total Amount Invested (` ‘000) 160.00 120.00 60.00 36.00 12.00Mkt Value as on Jun 30, 14 (` ‘000) $ 343.54 209.71 80.66 44.07 13.72 Returns (Annualised) (%) $ 10.79 10.76 11.80 13.62 27.76Benchmark Returns (Annualised) (%) # N.A. 7.99 8.43 9.85 15.84Addl. Benchmark Ret. (Annualised)(%) ##^ N.A. 5.24 4.666 4.52 4.80
HDFC CHILDREN’S GIFT FUND - SAVINGS PLAN
Past performance may or may not be sustained in the future. # CNX Midcap Index## CNX Nifty Index Inception Date: June 25, 2007
SIP Investments Since Inception SIP 5 Year SIP 3 Year SIP 1 Year SIP
Total Amount Invested (` ‘000) 85.00 60.00 36.00 12.00Mkt Value as on Jun 30, 14 (` ‘000) 200.38 114.05 60.80 18.02Returns (Annualised) (%) 23.80 26.04 37.27 105.29Benchmark Returns (Annualised) (%) # 14.19 15.25 26.48 88.71Addl. Benchmark Ret. (Annualised)(%) ## 11.85 13.07 20.55 45..29
HDFC MID-CAP OPPORTUNITIES FUND - GROWTH OPTION
Past performance may or may not be sustained in the future. # S&P BSE SENSEX ## CNX Nifty Index Inception Date: September 11, 2000
SIP Investments Since 10 year 5 Year 3 Year 1 YearInception SIP SIP SIP SIP SIP
Total Amount Invested (` ‘000) 166.00 120.00 60.00 36.00 12.00Mkt Value as on Jun 30, 14 (` ‘000) 887.15 287.37 87.84 50.18 16.10Returns (Annualised) (%) 21.94 16.65 15.26 22.86 69.48Benchmark Returns (Annualised) (%) # 16.05 13.09 13.15 20.88 43.63Addl. Benchmark Ret. (Annualised) (%) ## 15.51 12.92 133.07 20.55 45.29
HDFC GROWTH FUND - GROWTH OPTION
Past performance may or may not be sustained in the future. # CNX 500 Index ## CNX Nifty Index Inception Date: March 10, 2008The Scheme is co-mmanaged by Prashant Jain and Srinivas Rao Ravuri
SIP Investments Since Inception SIP 5 Year SIP 3 Year SIP 1 Year SIP
Total Amount Invested (` ‘000) 76.00 60.00 36.00 12.00Mkt Value as on Jun 30, 14 (` ‘000) 122.35 87.53 55.84 19.92Returns (Annualised) (%) 14.87 15.12 30.77 142.60Benchmark Returns (Annualised) (%) # 13.96 13.61 22.72 57.79Addl. Benchmark Ret. (Annualised)(%) ##
HDFC INFRASTRUCTURE FUND - GROWTH OPTION
$ Adjusted for Bonus units declared under the Scheme. ^ Scheme performance may not strictly be comparable with that of its Additional Benchmark in view of hybrid nature of the scheme$$ All dividends declared prior to the splitting of the Scheme into Dividend & Growth Options are assumed to be reinvested in the units of the Scheme at the then prevailing NAV (ex-dividend NAV).Load is not taken into consideration for computation of performance.Investors are advised to refer to the performance summary table on page 37-662Disclaimer: The above investment simulation is for illustrative purposes only and should not be construed as a promise on minimum returns and safeguard of capital. The AMC / Mutual Fund is not guaranteeing or promising or forecasting any returns. SIP does not assure a profit or guarantee protection against a loss in a declining market.Please refer SIP Enrolment Form or contact nearest ISC for SSIP Load Structure and other details.
CHIRAG SETALVAD
Past performance may or may not be sustained in the future. # CNX 500 Index ## CNX Nifty Index Inception Date: February 01, 1994The Scheme is co-mmanaged by Chirag Setalvad & Miten Lathia
SIP Investments Since 15 year 10 year 5 Year 3 Year 1 YearInception SIP SIP SIP SIP SIP SIP
Total Amount Invested (` ‘000) 245.00 180.00 120.00 60.00 36.00 12.00Mkt Value as on Jun 30, 14 (` ‘000) 2,473.22 1,125.81 298.04 95.47 54.08 16.18 Returns (Annualised) (%) 19.38 21.85 17.33 18.66 28.37 70.95Benchmark Returns (Annualised) (%) # 13.70 15.63 12.66 13.61 22.72 57.79Addl. Benchmark Ret.(Annualised) (%) ## 12.91 14.84 12.92 13.07 20.55 45.29
HDFC CAPITAL BUILDER FUND - GROWTH OPTION
MITEN LATHIA
SRINIVAS RAO RAVURI
Intouchmutually June 2014 27

Company / Issuer Industry+ / Rating % to NAV
EQUITY & EQUITY RELATEDBank of Baroda Banks 2.36ICICI Bank Ltd. Banks 2.29State Bank of India Banks 2.17Solar Industries India Ltd. Chemicals 1.56Oil India Ltd. Oil 1.47NHPC Ltd. Power 1.42Century Textiles & Industries Ltd. Cement 1.40Tata Consultancy Services Ltd. Software 1.31KEC International Ltd. Construction Project 1.24Tata Steel Ltd. Ferrous Metals 1.14Total of Top Ten Equity & Equity Related Holdings 16.36Total Equity & Equity Related Holdings 23.49CD/CP, CREDIT EXPOSUREOriental Bank of Commerce CRISIL - A1+ 10.64Rural Electrification Corporation Ltd. CRISIL - AAA 8.13Infiniti Retail Ltd. CARE - A+ 7.01Power Finance Corporation Ltd. CRISIL - AAA 6.93Shriram City Union Finance Ltd. CRISIL - AA- 6.00BMW India Financial Services Pvt. Ltd. CRISIL - AAA 5.47State Bank of India CRISIL - AAA 4.06Tata Steel Ltd. CARE - AA 2.87India Infoline Housing Finance Ltd. CRISIL - AA- 2.76HDB Financial Services Ltd. CARE - AAA 2.71Total of Top Ten CD/CP, Credit Exposure 56.58Total CD/CP, Credit Exposure 73.67Cash, Cash Equivalents and Net Current Assets 2.84Grand Total 100.00
Average AUM for the quarter ended June 30, 2014 (` In Lakhs) 118,514.80
Portfolio – Top 10 HoldingsCompany / Issuer Industry+ / Rating % to NAV
EQUITY & EQUITY RELATEDState Bank of India Banks 2.02Infosys Ltd. Software 1.62ICICI Bank Ltd. Banks 1.55Larsen & Toubro Ltd. Construction Project 1.24Tata Motors Ltd. DVR Auto 1.20Crompton Greaves Ltd. Industrial Capital Goods 1.09Tamil Nadu Newsprint & Papers Ltd. Paper 1.03Maruti Suzuki India Ltd. Auto 1.00KEC International Ltd. Construction Project 0.94CMC Ltd. Software 0.92Total of Top Ten Equity & Equity Related Holdings 12.61Total Equity & Equity Related Holdings 25.11G-SSEC / SDL, CD/CP, CREDIT EXPOSUREGovernment Securities Sovereign 30.32Rural Electrification Corporation Ltd. CRISIL - AAA 3.92Hindalco Industries Ltd. CRISIL - AA 3.91Tata Power Co. Ltd. CRISIL - AA- 3.56State Bank of India CRISIL - AAA 3.29Tata Motors Finance Ltd. CRISIL - AA 3.02Indian Railway Finance Corporation Ltd. CRISIL - AAA 2.88Housing Development Finance Corporation Ltd. $ CRISIL - AAA 2.40LIC Housing Finance Ltd. CARE - AAA / CRISIL - AAA 2.19Power Grid Corporation of India Ltd. CRISIL - AAA 2.18Total of Top Ten G-SSec / SDL, CD/CP,Credit Exposure 57.67Total G-SSec / SDL, CD/CP, Credit Exposure 72.80Cash, Cash Equivalents and Net Current Assets 2.09 Grand Total 100.00
Average AUM for the quarter ended June 30, 2014 (` In Lakhs) 3770,089.65
Portfolio – Top 10 Holdings
* Computed on the invested amount for debt portfolio
$ Sponsor
Modified Duration * 5.55 years
Yield to Maturity * 9.13%Yield to Maturity * 9.50%
Average Maturity * 11.12 years
* Computed on the invested amount for debt portfolio
Modified Duration * 2.37 years
Average Maturity * 5.78 years
NAV NAV per Unit (`)Growth Option 23.1059Monthly Dividend Option 12.0510Quarterly Dividend Option 12.3750Direct Plan - Growth Option 23.2115Direct Plan - Monthly Dividend Option 12.1098Direct Plan - Quarterly Dividend Option 12.4358
NAV NAV per Unit (`)Growth Option 31.5788Monthly Dividend Option 14.1138Quarterly Dividend Option 14.5360Direct Plan - Growth Option 31.7772Direct Plan - Monthly Dividend Option 14.2073Direct Plan - Quarterly Dividend Option 14.6334
HDFC MF MIP - Short Term PlanAn open-ended income scheme. Monthly income is not
assured and is subject to availability of distributable surplus
HDFC MF MIP - Long Term PlanAn open-ended income scheme. Monthly income is not
assured and is subject to availability of distributable surplus
Intouchmutually28 June 2014
CD - Certificate of Deposit; CP - Commercial Papers
Face Value per Unit: ` 10 unless otherwise specified + Industry Classification as recommended by AMFI Data is as of June 30, 2014 unless otherwise specified.

HDFC Multiple Yield FundAn open-ended income scheme
* Computed on the invested amount for debt portfolio * Computed on the invested amount for debt portfolio
NAV NAV per Unit (`)Growth Option 25.0464Dividend Option 11.9044Direct Plan - Growth Option 25.1739Direct Plan - Dividend Option 11.9674
NAV NAV per Unit (`)Growth Option 23.0698Dividend Option 11.9561Direct Plan - Growth Option 23.2781Direct Plan - Dividend Option 12.4342
HDFC Multiple Yield Fund - Plan 2005An open-ended income scheme
Modified Duration * 138 days
Average Maturity * 150 days Average Maturity * 115 days
Company / Issuer Industry+ / Rating % to NAV
EQUITY & EQUITY RELATEDTata Motors Ltd. DVR Auto 1.43Rural Electrification Corporation Ltd. Finance 1.26Union Bank of India Banks 1.17State Bank of India Banks 1.17IDFC Ltd. Finance 1.09Indian Bank Banks 1.04Solar Industries India Ltd. Chemicals 1.01Grindwell Norton Ltd. Industrial Products 0.91Sundram Fasteners Ltd. Auto Ancillaries 0.89Vesuvius India Ltd. Industrial Products 0.89Total of Top Ten Equity & Equity Related Holdings 10.86Total Equity & Equity Related Holdings 19.53CD/CP, CREDIT EXPOSURENational Housing Bank CARE - AAA 13.50Small Industries Development Bank of India [SIDBI] CARE - AAA 13.49Export - Import Bank of India CRISIL - A1+ 13.33Power Finance Corporation Ltd. CRISIL - AAA 8.07State Bank of Mysore ICRA - A1+ 7.93Cholamandalam Investment and Finance Co. Ltd. ICRA - AA 5.63IDFC Ltd. ICRA - AAA 4.59Shriram City Union Finance Ltd. CARE - AA 3.18Sundaram BNP Paribas Home Finance Ltd. CARE - AA+ 3.14Central Bank of India CARE - A1+ 2.53Total of Top Ten CD/CP, Credit Exposure 75.39Total CD/CP, Credit Exposure 75.52Cash, Cash Equivalents and Net Current Assets 4.95 Grand Total 100.00
Average AUM for the quarter ended June 30, 2014 (` In Lakhs) 18,067.29
Portfolio – Top 10 Holdings
Modified Duration * 106 days
Company / Issuer Industry+ / Rating % to NAV
EQUITY & EQUITY RELATED
Power Finance Corporation Ltd. Finance 2.37
Tata Steel Ltd. Ferrous Metals 1.70
Bharat Petroleum Corporation Ltd. Petroleum Products 1.54
Tata Motors Ltd. DVR Auto 1.51
Cipla Ltd. Pharmaceuticals 1.41
Power Grid Corporation of India Ltd. Power 1.34
Punjab National Bank Banks 1.27
GVK Power & Infrastructure Ltd. Power 1.23
Oil India Ltd. Oil 1.21
Federal Bank Ltd. Banks 1.20 Total of Top Ten Equity & Equity Related Holdings 14.78
Total Equity & Equity Related Holdings 24.19
CD/CP, CREDIT EXPOSURE
IDFC Ltd. ICRA - AAA 12.87
LIC Housing Finance Ltd. CRISIL - AAA 12.86
Power Finance Corporation Ltd. CRISIL - AAA 12.86
Canara Bank CRISIL - A1+ 9.69
Corporation Bank CRISIL - A1+ 7.50
Central Bank of India CARE - A1+ 7.41
State Bank of Mysore ICRA - A1+ 6.29Total CD/CP, Credit Exposure 69.48
Cash, Cash Equivalents and Net Current Assets 6.33Grand Total 100.00
Average AUM for the quarter ended June 30, 2014 (` In Lakhs) 77,525.68
Portfolio – Top 10 Holdings
June 2014 29Intouchmutually
CD - Certificate of Deposit; CP - Commercial Papers
Face Value per Unit: ` 10 unless otherwise specified + Industry Classification as recommended by AMFI Data is as of June 30, 2014 unless otherwise specified.
Yield to Maturity * 8.80% Yield to Maturity * 8.81%

NAV NAV per Unit (`)Growth Option 28.5980Dividend Option 10.7715Direct Plan - Growth Option 28.9252Direct Plan - Dividend Option 10.9088
NAV NAV per Unit (`)Growth Option 42.8443Quarterly Dividend Option 11.3647Half-Yearly Dividend Option 11.2134Yearly Dividend Option 12.0687Direct Plan - Growth Option 43.3681Direct Plan - Quarterly Dividend Option 11.5089Direct Plan - Half-Yearly Dividend Option 11.6275Direct Plan - Yearly Dividend Option 12.2281
HDFC Income FundAn open-ended income scheme
Modified Duration * 6.69 years Average Maturity * 10.03 years
Average Maturity * 12.96 years
HDFC High Interest Fund - Dynamic PlanAn open-ended income scheme
Modified Duration * 5.61 years
Issuer Rating % to NAV
G-SSEC / SDL, CREDIT EXPOSURE
Government Securities Sovereign 52.24
Union Bank of India CRISIL - AAA 6.75
Power Finance Corporation Ltd. CRISIL - AAA 5.86
Hindalco Industries Ltd. CRISIL - AA 5.07
Indian Railway Finance Corporation Ltd. CRISIL - AAA 3.65
State Bank of India CRISIL - AAA 2.87
Tata Power Co. Ltd. CRISIL - AA- 2.44
Mahanagar Telephone Nigam Ltd. CARE - AAA(SO) 2.19
Food Corporation of India CRISIL - AAA(SO) 2.08
State Government of Gujarat Sovereign 1.72
Total of Top Ten G-SSec / SDL, Credit Exposure 84.87
Total G-SSec / SDL, Credit Exposure 96.26
Cash, Cash Equivalents and Net Current Assets 3.74
Grand Total 100.00
Average AUM for the quarter ended June 30, 2014 (` In Lakhs) 2268,753.19
Portfolio – Top 10 Holdings
Issuer Rating % to NAV
G-SSEC / SDL, CD/CP, CREDIT EXPOSUREGovernment Securities Sovereign 54.61Food Corporation of India CRISIL - AAA(SO) 9.30Power Finance Corporation Ltd. CRISIL - AAA 6.64State Government of Maharashtra Sovereign 5.72State Government of Gujarat Sovereign 5.14Rural Electrification Corporation Ltd. CRISIL - AAA 3.37Housing Development Finance Corporation Ltd. $ CRISIL - AAA 3.36Mahanagar Telephone Nigam Ltd. CARE - AAA(SO) 2.88Punjab & Sind Bank ICRA - A1+ 2.11Indian Railway Finance Corporation Ltd. CRISIL - AAA 0.63 Total of Top Ten G-SSec / SDL, CD/CP, Credit Exposure 93.76Total G-SSec / SDL, CD/CP, Credit Exposure 95.54Cash, Cash Equivalents and Net Current Assets 4.46 Grand Total 100.00
Average AUM for the quarter ended June 30, 2014 (` In Lakhs) 73,852.59
Portfolio – Top Holdings
* Computed on the invested amount
* Computed on the invested amount
$ SponsorTotal outstanding position (as at June 30, 2014) in Derivative Instruments
(Interest Rate Swap) (Gross Notional) ` 500 lakhs.
Intouchmutually30 June 2014
CD - Certificate of Deposit; CP - Commercial Papers
Face Value per Unit: ` 10 unless otherwise specified Data is as of June 30, 2014 unless otherwise specified.
Yield to Maturity * 8.92%
Yield to Maturity * 9.01%

NAV NAV per Unit (`)Growth Option 25.0251Dividend Option 10.3306Direct Plan - Growth Option 25.1165Direct Plan - Dividend Option 10.3308
NAV NAV per Unit (`)Growth Option 25.5628Dividend Option 10.5945Direct Plan - Growth Option 25.7325Direct Plan - Dividend Option 10.5973
HDFC Short Term PlanAn open-ended income scheme
HDFC High Interest Fund - Short Term PlanAn open-ended income scheme
Modified Duration * 1.38 years
Average Maturity * 1.68 years
Modified Duration * 2.02 years
Average Maturity * 2.56 years
Portfolio – Top 10 HoldingsIssuer Rating % to NAV
G-SSEC / SDL, CREDIT EXPOSURE
Government Securities Sovereign 9.53
Tube Investments of India Ltd. CRISIL - AA 7.99
Cholamandalam Investment and Finance Co. Ltd. ICRA - AA 6.59
Rural Electrification Corporation Ltd. CRISIL - AAA 5.93
Shriram City Union Finance Ltd. CRISIL - AA- 5.01
BMW India Financial Services Pvt. Ltd. CRISIL - AAA 5.01
Volkswagen Finance Private Limited FITCH - AAA 4.30
Andhra Pradesh Expressway Ltd. ICRA - AAA(SO) 3.71
Housing Development Finance Corporation Ltd. $ CRISIL - AAA 3.31
Power Finance Corporation Ltd. CRISIL - AAA 3.29
Total of Top Ten G-SSec / SDL, Credit Exposure 54.67
Total G-SSec / SDL, Credit Exposure 89.83
Cash, Cash Equivalents and Net Current Assets 10.17
Grand Total 100.00
AAverage AUM for the quarter ended June 30, 2014 (` In Lakhs)) 142,269.67
Portfolio – Top 10 HoldingsIssuer Rating % to NAV
G-SSEC, T-BBILLS, CD/CP, CREDIT EXPOSUREAditya Birla Retail Ltd. CRISIL - A- 5.52Indiabulls Housing Finance Ltd. CARE - AA+ 4.84Bank of India CRISIL - A1+ 4.57Adani Ports and Special Economic Zone Ltd. ICRA - A1+, AA- 4.56Power Finance Corporation Ltd. CRISIL - A1+, AAA 4.51Madura Garments Lifestyle Retail Co. Ltd. (100% Put on ABNL) ICRA - AA+(SO) 4.33Samvardhana Motherson International Ltd.(Secured with shares of Motherson Sumi Systems Ltd.) BWR - A(SO) 4.07
Prime Publishing Private Limited (Secured with shares of ZEE Entertainment Enterprise Ltd.) Unrated 4.00Shriram Transport Finance Co. Ltd. CARE - AA+ / CRISIL - AA 3.65Jay Properties Private Ltd. (Secured with shares of ZEE Entertainment Enterprise Ltd. & Dish TV) Unrated 3.63Total of Top Ten G-SSec, T-BBills, CD/CP, Credit Exposure 43.68Total G-SSec, T-BBills, CD/CP, Credit Exposure 97.04Cash, Cash Equivalents and Net Current Assets 2.96 Grand Total 100.00
Average AUM for the quarter ended June 30, 2014 (` In Lakhs) 1191,774.11
* Computed on the invested amount* Computed on the invested amount
$ Sponsor
Intouchmutually June 2014 31
CD - Certificate of Deposit; CP - Commercial Papers
Face Value per Unit: ` 10 unless otherwise specified Data is as of June 30, 2014 unless otherwise specified.
Yield to Maturity * 9.34% Yield to Maturity * 9.97%

Intouchmutually32 June 2014
Portfolio – Top 10 HoldingsIssuer Rating % to NAV
HDFC Short Term Opportunities FundAn open-ended income scheme An open-ended income scheme
HDFC Medium Term Opportunities Fund
* Computed on the invested amount
$ Sponsor$ Sponsor
Average Maturity * 2.27 yearsAverage Maturity * 1.46 years
Modified Duration * 1.22 years Modified Duration * 1.81 years
Portfolio – Top HoldingsIssuer Rating % to NAV
NAV NAV per Unit (`)
Growth Option 14.1751Dividend Option 10.1302Direct Plan - Growth Option 14.1967Direct Plan - Dividend Option 10.1305
NAV NAV per Unit (`)
Growth Option 14.0930Dividend Option 10.0722Direct Plan - Growth Option 14.1111Direct Plan - Dividend Option 10.1444
CD/CP, CREDIT EXPOSURE
LIC Housing Finance Ltd. CARE - AAA / CRISIL - AAA 13.23
Rural Electrification Corporation Ltd. CRISIL - AAA 12.43
Housing Development Finance Corporation Ltd. $ CRISIL - AAA 8.87
Power Finance Corporation Ltd. CRISIL - AAA 8.65
Export - Import Bank of India CRISIL - AAA 7.52
Tata Sons Ltd. CRISIL - AAA 6.87
National Bank for Agriculture & Rural Development CRISIL - AAA 5.25
Tata Motors Ltd. CARE - AA+ 4.71
Sesa Sterlite Ltd. CRISIL - AA+ 4.42
Hindustan Petroleum Corporation Ltd. CRISIL - AAA 3.50
Total of Top Ten CD/CP, Credit Exposure 75.45
Total CD/CP, Credit Exposure 93.22
Cash, Cash Equivalents and Net Current Assets 6.78
Grand Total 100.00
Average AUM for the quarter ended June 30, 2014 (` In Lakhs) 2006,780.54
CD/CP, CREDIT EXPOSURE
Power Finance Corporation Ltd. CRISIL - AAA 13.57
Rural Electrification Corporation Ltd. CRISIL - AAA 10.02
Housing Development Finance Corporation Ltd. $ CRISIL - AAA 9.63
LIC Housing Finance Ltd. CARE - AAA / CRISIL - AAA 9.15
Steel Authority of India Ltd. CARE - AAA 5.61
Bank of Baroda CRISIL - A1+ 4.47
Small Industries Development Bank of India [SIDBI] CARE - AAA 4.30
Tata Motors Finance Ltd. CRISIL - AA, AA- 3.23
National Bank for Agriculture & Rural Development CRISIL - AAA 3.22
Shriram Transport Finance Co. Ltd. CARE - AA+ / CRISIL - AA 3.06
Total of Top Ten CD/CP, Credit Exposure 66.26
Total CD/CP, Credit Exposure 93.39
Cash, Cash Equivalents and Net Current Assets 6.61
Grand Total 100.00
Average AUM for the quarter ended June 30, 2014 (` In Lakhs) 2251,406.06
CD - Certificate of Deposit; CP - Commercial Papers
* Computed on the invested amount
Face Value per Unit: ` 10 unless otherwise specified Data is as of June 30, 2014 unless otherwise specified.
Yield to Maturity * 9.20%Yield to Maturity * 9.14%

An open-ended income schemeHDFC Gilt Fund
Short Term Plan Long Term Plan
Modified Duration * 1.77 years Modified Duration * 7.52 years
Average Maturity * 2.24 years Average Maturity * 14.92 years
Issuer Rating % to NAV
G-SSEC / SDL
8.07 GOI 2017 Sovereign 19.76
6.49 GOI 2015 Sovereign 16.33
7.83 GOI 2018 Sovereign 12.97
7.28 GOI 2019 Sovereign 12.57
State Government of Punjab Sovereign 3.60
8.19 GOI 2020 Sovereign 0.10
Total G-SSec / SDL 65.33
Cash, Cash Equivalents and Net Current Assets 34.67
Grand Total 100.00
Average AUM for the quarter ended June 30, 2014 (` In Lakhs) 742.91
Portfolio – Top HoldingsIssuer Rating % to NAV
G-SSEC
8.32 GOI 2032 Sovereign 20.59
9.20 GOI 2030 Sovereign 18.29
8.83 GOI 2023 Sovereign 12.32
8.28 GOI 2027 Sovereign 11.45
8.33 GOI 2026 Sovereign 5.89
8.3 GOI 2042 Sovereign 5.84
8.60 GOI 2028 Sovereign 5.34
7.28 GOI 2019 Sovereign 3.63
9.23 GOI 2043 Sovereign 3.21
7.16 GOI 2023 Sovereign 2.75
Total of Top Ten G-SSec 89.31
Total G-SSec 97.50
Cash, Cash Equivalents and Net Current Assets 2.50
Grand Total 100.00
Average AUM for the quarter ended June 30, 2014 (` In Lakhs) 322,608.79
Portfolio – Top 10 Holdings
Face Value per Unit: ` 10 unless otherwise specified Data is as of June 30, 2014 unless otherwise specified.
Intouchmutually June 2014 33
NAV NAV per Unit (`)
Growth Option 21.1427Dividend Option 10.9767Direct Plan - Growth Option 21.2303Direct Plan - Dividend Option 11.0264
NAV NAV per Unit (`)
Growth Option 24.7123Dividend Option 10.6813Direct Plan - Growth Option 24.8109Direct Plan - Dividend Option 10.7256
* Computed on the invested amount * Computed on the invested amount
Yield to Maturity * 8.75%Yield to Maturity * 8.69%

Modified Duration * 133 days
Yield to Maturity * 8.98%
Short Term Plan
T-BBILLS, CD/CP, CREDIT EXPOSUREHousing Development Finance Corporation Ltd. $ CRISIL - AAA 5.66Treasury Bills Sovereign 4.46Ranbaxy Laboratories Ltd. ICRA - A1+ 3.82Shriram Transport Finance Co. Ltd. CARE - AA+ / CRISIL - AA 3.82UCO Bank CRISIL - A1+ 3.42Tata Motors Finance Ltd. CARE - AA- / CRISIL - AA /
ICRA - A1+ 3.41Union Bank of India CRISIL - A1+ 3.38Essel Mining and Industries Ltd. ICRA - A1+ 3.35Tata Power Co. Ltd. ICRA - A1+ 2.87Vodafone India Ltd. CRISIL - A1+ 2.51Total of Top Ten T-BBills, CD/CP, Credit Exposure 36.70Total T-BBills, CD/CP, Credit Exposure 82.66Cash, Cash Equivalents and Net Current Assets 17.34Grand Total 100.00
Average AUM for the quarter ended June 30, 2014 (` In Lakhs) 4440,542.43
Portfolio – Top 10 HoldingsIssuer Rating % to NAV
CD/CP
Punjab & Sind Bank ICRA - A1+ 15.92
Central Bank of India CARE - A1+ 15.15
UCO Bank CRISIL - A1+ 13.24
Vijaya Bank CARE - A1+ 11.11
Punjab National Bank FITCH - A1+ 8.08
Andhra Bank FITCH - A1+ 7.34
Canara Bank CRISIL - A1+ 6.97
Axis Bank Ltd. CRISIL - A1+ 4.66
Dena Bank CRISIL - A1+ 3.67
ICICI Bank Ltd. CARE - A1+ 2.44
Total of Top Ten CD/CP 88.58
Total CD/CP 99.82
Cash, Cash Equivalents and Net Current Assets 0.18
Grand Total 100.00
Average AUM for the quarter ended June 30, 2014 (` In Lakhs) 1186,656.66
Portfolio – Top 10 HoldingsIssuer Rating % to NAV
HDFC Floating Rate Income FundAn open-ended income scheme
HDFC Floating Rate Income FundAn open-ended income scheme
Long Term Plan
Modified Duration * 240 days
Yield to Maturity * 8.84%
Average Maturity * 147 days
Average Maturity * 261 days
NAV NAV per Unit (`)Retail OptionGrowth Option 21.9169Daily Dividend Reinvestment Option 10.0809Weekly Dividend Option 10.1525Monthly Dividend Option 10.2295Wholesale OptionGrowth Option 22.4094Daily Dividend Reinvestment Option 10.0809Weekly Dividend Option 10.1532Monthly Dividend Option 10.2329Direct Plan - Growth Option 22.4267Direct Plan - Daily Dividend Reinvestment Option 10.0809Direct Plan - Weekly Dividend Option 10.1532Direct Plan - Monthly Dividend Option 10.2334
NAV NAV per Unit (`)Growth Option 22.8303Weekly Dividend Reinvestment Option 10.2511Direct Plan - Growth Option 22.8501Direct Plan - Weekly Dividend Reinvestment Option 10.2512
CD - Certificate of Deposit; CP - Commercial Papers
* Computed on the invested amount
* Computed on the invested amount
Face Value per Unit: ` 10 unless otherwise specified Data is as of June 30, 2014 unless otherwise specified.
$ Sponsor
Intouchmutually34 June 2014

Savings PlanAn open-ended high liquidity income scheme
Portfolio – Top 10 HoldingsIssuer Rating % to NAV
HDFC Liquid FundAn open-ended liquid income scheme
HDFC Cash Management Fund
* Computed on the invested amount
* Computed on the invested amount
Average Maturity * 43 days
Average Maturity * 47 days
Modified Duration * 43 days
Modified Duration * 40 days
Portfolio – Top 10 HoldingsIssuer Rating % to NAV
NAV NAV per Unit (`)Growth Option 27.3830Daily Dividend Reinvestment Option 10.6364Weekly Dividend Option 10.6323Direct Plan - Growth Option 27.4057Direct Plan - Daily Dividend Reinvestment Option 10.6364Direct Plan - Weekly Dividend Option 10.6324
NAV NAV per Unit (`)
HDFC Liquid FundGrowth Option 25.8737Daily Dividend Reinvestment Option 10.1982Weekly Dividend Option 10.3275Monthly Dividend Option 10.3479Direct Plan - Growth Option 25.8981Direct Plan - Daily Dividend Reinvestment Option 10.1982Direct Plan - Weekly Dividend Option 10.3275Direct Plan - Monthly Dividend Option 10.3484HDFC Liquid Fund - PPremium PlanGrowth Option 26.3024Daily Dividend Reinvestment Option 12.2598 T-BBILLS, BRDS, CD/CP, CREDIT EXPOSURE
Treasury Bills Sovereign 24.61
Central Bank of India CARE - A1+ 4.81
Andhra Bank FITCH - A1+ 4.73
Canara Bank CRISIL - A1+ 4.35
Allahabad Bank CRISIL - A1+ 4.02
Indusind Bank Ltd. CRISIL - A1+ 3.95
Housing Development Finance Corporation Ltd. $ CRISIL - AAA 3.94
ICICI Bank Ltd. BRDS 3.22
IDBI Bank Ltd. CRISIL - A1+ / ICRA - A1+ 3.22
Bank of Maharashtra CRISIL - A1+ 3.21 Total of Top Ten T-BBills, BRDS, CD/CP,
Credit Exposure 60.06
Total T-BBills, BRDS, CD/CP, Credit Exposure 93.87
Cash, Cash Equivalents and Net Current Assets 6.13
Grand Total 100.00
Average AUM for the quarter ended June 30, 2014 (` In Lakhs) 7704,569.27
T-BBILLS, BRDS, CD/CP, CREDIT EXPOSURE
Treasury Bills Sovereign 17.42
National Bank for Agriculture & Rural Development CRISIL - A1+ 12.01
IDBI Bank Ltd. CRISIL - A1+ / ICRA - A1+ 4.69
Syndicate Bank CARE - A1+ 4.02
Union Bank of India CRISIL - A1+ 3.34
Steel Authority of India Ltd. CARE - A1+ / CRISIL - A1+ 3.34
Punjab & Sind Bank ICRA - A1+ 3.33
UCO Bank CRISIL - A1+ 3.00
Canara Bank CRISIL - A1+ 2.98
Allahabad Bank CRISIL - A1+ 2.67Total of Top Ten T-BBills, BRDS, CD/CP,
Credit Exposure 56.80
Total T-BBills, BRDS, CD/CP, Credit Exposure 101.46
Cash, Cash Equivalents and Net Current Assets (1.46) Grand Total 100.00
Average AUM for the quarter ended June 30, 2014 (` In Lakhs) 1,,923,226.26
Portfolio Classification by Asset Class (%)T-bills 17.42BRDS, CD/CP 83.60Credit Exposure 0.44Cash,Cash Equivalents and Net Current Assets (1.46)
Portfolio Classification by Rating Class (%)Sovereign 17.42AAA / AAA(SO) / A1+ / A1+(SO) & Equivalent 80.80AA+ & Below 2.57BRDS 0.67Cash,Cash Equivalents and Net Current Assets (1.46)
BRDS - Bills Rediscounting (not rated); CD - Certificate of Deposit; CP - Commercial Papers
Face Value per Unit: ` 10 unless otherwise specified Data is as of June 30, 2014 unless otherwise specified.
Yield to Maturity * 8.75%
Yield to Maturity * 8.70%
$ Sponsor
Intouchmutually June 2014 35

Portfolio – Top 10 Holdings
Average Maturity * 3.18 years
Modified Duration * 2.39 years
HDFC Cash Management Fund HDFC Corporate Debt Opportunities Fund
Note for All Aforesaid Open-EEnded Schemes (as at June 30 2014)i) Total NPAs provided for and its percentage to NAV : Nilii) Investment in ADR/GDR/Foreign Securities : Niliii) Total outstanding exposure in derivative instruments (Gross Notional)
a) Equity : Nil
b) Debt : Interest Rates Swaps / Forward Rate Agreement :HDFC High Interest Fund - DDynamic Plan (Interest Rates Swaps) ` 500.00 lakhs
Total ` 500.00 lakhs
Treasury Advantage PlanAn open-ended income scheme An open-ended income scheme
* Computed on the invested amount
* Computed on the invested amount
Average Maturity * 170 days
Modified Duration * 152 days
Issuer Rating % to NAV
NAV NAV per Unit (`)Retail OptionGrowth Option 27.8035Daily Dividend Reinvestment Option 10.0315Weekly Dividend Option 10.0781Monthly Dividend Option 10.1293Direct Plan - Growth Option 28.0832Direct Plan - Daily Dividend Reinvestment Option 10.0315Direct Plan - Weekly Dividend Option 10.0795Direct Plan - Monthly Dividend Option 10.3539Wholesale OptionGrowth Option 28.6537Daily Dividend Reinvestment Option 10.0315Weekly Dividend Option 10.0792Monthly Dividend Option 10.1351
NAV NAV per Unit (`)Growth Option 10.3358Dividend Option 10.3358Direct Plan - Growth Option 10.3481Direct Plan - Dividend Option 10.3481
T-BBILLS, CD/CP, CREDIT EXPOSURECanara Bank CRISIL - A1+ 8.60Union Bank of India CRISIL - A1+ 5.68UCO Bank CRISIL - A1+ 4.61Tata Capital Financial Services Ltd. CARE - AA+ /
CRISIL - AA+ / ICRA - A1+ 3.53Ranbaxy Laboratories Ltd. ICRA - A1+ 3.25Adani Ports and Special Economic Zone Ltd. ICRA - A1+, AA- 3.10Tata Power Co. Ltd. ICRA - A1+ 2.93Corporation Bank CRISIL - A1+ 2.92Housing Development Finance Corporation Ltd. $ CRISIL - AAA 2.84Treasury Bills Sovereign 2.81 Total of Top Ten T-BBills, CD/CP, Credit Exposure 40.27Total T-BBills, CD/CP, Credit Exposure 87.41Cash, Cash Equivalents and Net Current Assets 12.59 Grand Total 100.00
Average AUM for the quarter ended June 30, 2014 (` In Lakhs) 9948,370.05
Portfolio – HoldingsIssuer Rating % to NAVCD/CP, CREDIT EXPOSUREAditya Birla Retail Ltd CRISIL - A- 6.42Samvardhana Motherson International Ltd. (Secured with shares of Motherson Sumi Systems Ltd.) BWR - A(SO) 6.28Rural Electrification Corporation Ltd. CRISIL - AAA 5.95Sesa Sterlite Ltd. CRISIL - AA+ 5.15Indiabulls Housing Finance Ltd. CARE - AA+ 4.75Infiniti Retail Ltd. CARE - A+ 4.63Ranbaxy Laboratories Ltd. CARE - AA 4.02L&T Ship Building Ltd. ICRA - AAA(SO) 3.97Tata Sons Ltd. CRISIL - AAA 3.59Food Corporation of India CRISIL - AAA(SO) 3.45Total of Top Ten CD/CP, Credit Exposure 48.21Total CD/CP, Credit Exposure 95.94Cash, Cash Equivalents and Net Current Assets 4.06 Grand Total 100.00
Average AUM for the quarter ended June 30, 2014 (` In Lakhs) 1110,656.18
CD - Certificate of Deposit CP - Commercial Papers
Face Value per Unit: ` 10 unless otherwise specified Data is as of June 30, 2014 unless otherwise specified.
Yield to Maturity * 8.90%
Yield to Maturity * 10.33%
$ Sponsor
Intouchmutually36 June 2014

SCHEME PERFORMANCE - GROWTH OPTION (FUND MANAGER-WISE)
Date Period NAV Scheme Benchmark Additional Value of investment of ` 10,000@per Unit Returns Returns Benchmark Scheme Benchmark Additional
(`) (%)^ (%)# Returns (`) #(`) Benchmark##(%) (`) ##
^Past performance may or may not be sustained in the future. Returns greater than 1 year period are compounded annualized (CAGR). # CNX 500 Index ## CNX Nifty Index
A. Cumulative performance
Jun 28, 13 Last 1 Year 268.408 57.45 36.64 30.09 15,784 13,687 13,028Jun 29, 12 Last 2 Years 257.763 28.16 21.64 20.05 16,436 14,804 14,418Jun 30, 11 Last 3 Years 281.213 14.62 10.92 10.45 15,066 13,651 13,478Jan 01, 95 Since Inception 10.000 21.17 9.93 N.A. 423,663 63,396 N.A.
Period Scheme Benchmark Additional^ # Benchmark
##
B. Discrete 12 month returns (%)
Jun 28, 13 to Jun 30, 14 57.45 36.64 30.09
Jun 29, 12 to Jun 28, 13 4.13 8.16 10.67
Jun 30, 11 to Jun 29, 12 -8.34 -7.79 -6.53
HDFC EQUITY FUND NAV as at June 30, 2014 ` 423.663
Date Period NAV Scheme Benchmark Additional Value of investment of ` 10,000@per Unit Returns Returns Benchmark Scheme Benchmark Additional
(`) (%)^$$ (%)# Returns (`) $$ #(`) Benchmark(%)## (`) ##
^Past performance may or may not be sustained in the future. Returns greater than 1 year period are compounded annualized (CAGR). # S&P BSE 200 ## S&P BSE SENSEX$$ All dividends declared prior to the splitting of the Scheme into Dividend & Growth Options are assumed to be reinvested in the units of the Scheme at the then prevailing NAV (ex-dividend NAV).
A. Cumulative performance
Jun 28, 13 Last 1 Year 210.742 48.63 34.23 30.83 14,896 13,445 13,103Jun 29, 12 Last 2 Years 199.564 25.38 20.85 20.72 15,730 14,613 14,580Jun 30, 11 Last 3 Years 212.186 13.93 10.51 10.47 14,794 13,498 13,485Oct 11, 96 Since Inception 10.000 22.82 13.85 12.47 382,758 99,646 80,295
Period Scheme Benchmark Additional^$$ # Benchmark
##
B. Discrete 12 month returns (%)
Jun 28, 13 to Jun 30, 14 48.63 34.23 30.83
Jun 29, 12 to Jun 28, 13 5.60 8.69 11.28
Jun 30, 11 to Jun 29, 12 -5.95 -7.63 -7.51
HDFC TOP 200 FUND NAV as at June 30, 2014 ` 313.916
PRASHANT JAIN
Date Period NAV Scheme Benchmark Additional Value of investment of ` 10,000@per Unit Returns Returns Benchmark Scheme Benchmark Additional
(`) (%)^ (%)# Returns (`) #(`) Benchmark(%)## (`) ##
^Past performance may or may not be sustained in the future. Returns greater than 1 year period are compounded annualized (CAGR). # CNX 500 Index ## CNX Nifty Index The Scheme is co-mmanaged by Prashant Jain and Srinivas Rao Ravuri.
A. Cumulative performance
Jun 28, 13 Last 1 Year 8.672 71.19 36.64 30.09 17,169 13,687 13,028Jun 29, 12 Last 2 Years 9.865 22.82 21.64 20.05 15,093 14,804 14,418Jun 30, 11 Last 3 Years 11.503 8.97 10.92 10.45 12,944 13,651 13,478Mar 10, 08 Since Inception 10.000 6.51 7.43 7.58 14,889 15,719 15,856
Period Scheme Benchmark Additional^ # Benchmark
##
B. Discrete 12 month returns (%)
Jun 28, 13 to Jun 30, 14 71.19 36.64 30.09
Jun 29, 12 to Jun 28, 13 -12.09 8.16 10.67
Jun 30, 11 to Jun 29, 12 -14.24 -7.79 -6.53
HDFC INFRASTRUCTURE FUND NAV as at June 30, 2014 ` 14.889
Date Period NAV Scheme Benchmark Additional Value of investment of ` 10,000@per Unit Returns Returns Benchmark Scheme Benchmark Additional
(`) (%)^$$ (%)# Returns (`) $$ #(`) Benchmark(%)## (`) ##
^Past performance may or may not be sustained in the future. Returns greater than 1 year period are compounded annualized (CAGR). # CRISIL Balanced Fund Index ## CNX Nifty Index$$ All dividends declared prior to the splitting of the Scheme into Dividend & Growth Options are assumed to be reinvested in the units of the Scheme at the then prevailing NAV (ex-dividend NAV).Scheme performance may not strictly be comparable with that of its Additional Benchmark in view of balanced nature of the scheme where a portion of scheme's investments are made in debt instruments
A. Cumulative performance
Jun 28, 13 Last 1 Year 222.825 51.39 20.88 30.09 15,173 12,101 13,028Jun 29, 12 Last 2 Years 213.804 25.71 15.82 20.05 15,813 13,420 14,418Jun 30, 11 Last 3 Years 217.174 15.88 9.93 10.45 15,568 13,287 13,478Feb 01, 94 Since Inception 10.000 20.32 N.A. 9.34 436,985 N.A. 61,884
Period Scheme Benchmark Additional^$$ # Benchmark
##
B. Discrete 12 month returns (%)
Jun 28, 13 to Jun 30, 14 51.39 20.88 30.09
Jun 29, 12 to Jun 28, 13 4.22 10.90 10.67
Jun 30, 11 to Jun 29, 12 -1.55 -0.99 -6.53
HDFC PRUDENCE FUND NAV as at June 30, 2014 ` 338.093
Performance of dividend option under the schemes for the investors would be net of distribution tax as applicable. Load is not taken into consideration for computation of performance. N.A.: Not Available@ shows the current value of ` 10,000/- invested at the beginning of a given periodWhere either NAV or Benchmark Index value is not available for the start/end date of a concerned period, the previous date where both NAV and Benchmark Index value are available, is considered for returns computation except for since inception returns
Intouchmutually June 2014 37

VINAY KULKARNI
Date Period NAV Scheme Benchmark Additional Value of investment of ` 10,000@per Unit Returns Returns Benchmark Scheme Benchmark Additional
(`) (%)^ (%)# Returns (`) (`)# Benchmark(%)## (`) ##
^Past performance may or may not be sustained in the future. Returns greater than 1 year period are compounded annualized (CAGR). # CNX 500 Index ## CNX Nifty Index
A. Cumulative performance
Jun 28, 13 Last 1 Year 24.316 62.13 36.64 30.09 16,256 13,687 13,028Jun 29, 12 Last 2 Years 26.008 23.25 21.64 20.05 15,198 14,804 14,418Jun 30, 11 Last 3 Years 30.009 9.61 10.92 10.45 13,172 13,651 13,478Apr 06, 05 Since Inception 10.000 16.04 14.23 15.14 39,528 34,168 36,782
Period Scheme Benchmark Additional^ # Benchmark
##
B. Discrete 12 month returns (%)
Jun 28, 13 to Jun 30, 14 62.13 36.64 30.09
Jun 29, 12 to Jun 28, 13 -6.51 8.16 10.67
Jun 30, 11 to Jun 29, 12 -13.33 -7.79 -6.53
HDFC PREMIER MULTI-CCAP FUND NAV as at June 30, 2014 ` 39.528
Date Period NAV Scheme Benchmark Additional Value of investment of ` 10,000@per Unit Returns Returns Benchmark Scheme Benchmark Additional
(`) (%)^ (%)# Returns (`) (`)# Benchmark(%)## (`) ##
^Past performance may or may not be sustained in the future. Returns greater than 1 year period are compounded annualized (CAGR). # S&P BSE 200 ## S&P BSE SENSEX
A. Cumulative performance
Jun 28, 13 Last 1 Year 33.528 64.86 34.23 30.83 16,531 13,445 13,103Jun 29, 12 Last 2 Years 35.593 24.75 20.85 20.72 15,572 14,613 14,580Jun 30, 11 Last 3 Years 40.400 11.11 10.51 10.47 13,719 13,498 13,485Sep 17, 04 Since Inception 10.000 19.12 16.10 16.79 55,426 43,109 45,699
Period Scheme Benchmark Additional^ # Benchmark
##
B. Discrete 12 month returns (%)
Jun 28, 13 to Jun 30, 14 64.86 34.23 30.83
Jun 29, 12 to Jun 28, 13 -5.80 8.69 11.28
Jun 30, 11 to Jun 29, 12 -11.90 -7.63 -7.51
HDFC CORE & SATELLITE FUND NAV as at June 30, 2014 ` 55.426
SCHEME PERFORMANCE - GROWTH OPTION (FUND MANAGER-WISE)
Date Period NAV Scheme Benchmark Additional Value of investment of ` 10,000@per Unit Returns Returns Benchmark Scheme Benchmark Additional
(`) (%)^ (%)# Returns (`) #(`) Benchmark(%)## (`) ##
^Past performance may or may not be sustained in the future. Returns greater than 1 year period are compounded annualized (CAGR). # CRISIL MIP Blended Index ## CRISIL 10 year Gilt IndexScheme performance may not strictly be comparable with that of its Additional Benchmark in view of hybrid nature of the scheme where a portion of scheme's investments are made in equity instruments.
The Scheme is co-mmanaged by Prashant Jain (Equities) and Shobhit Mehrotra (Debt).
A. Cumulative performance
Jun 28, 13 Last 1 Year 26.7025 18.15 8.24 -2.46 11,826 10,828 9,753Jun 29, 12 Last 2 Years 24.5544 13.39 9.54 4.55 12,861 12,001 10,933Jun 30, 11 Last 3 Years 23.3865 10.52 8.53 5.40 13,503 12,787 11,709Dec 26, 03 Since Inception 10.0000 11.55 7.39 4.29 31,579 21,162 15,556
Period Scheme Benchmark Additional^ # Benchmark
##
B. Discrete 12 month returns (%)
Jun 28, 13 to Jun 30, 14 18.15 8.24 -2.46
Jun 29, 12 to Jun 28, 13 8.75 10.83 12.10
Jun 30, 11 to Jun 29, 12 4.99 6.54 7.10
HDFC MF MIP LONG TERM PLAN NAV as at June 30, 2014 ` 31.5788
PRASHANT JAIN...CONTINUED
Performance of dividend option under the schemes for the investors would be net of distribution tax as applicable. Load is not taken into consideration for computation of performance. N.A.: Not Available@ shows the current value of ` 10,000/- invested at the beginning of a given periodWhere either NAV or Benchmark Index value is not available for the start/end date of a concerned period, the previous date where both NAV and Benchmark Index value are available, is considered for returns computation except for since inception returns
Intouchmutually38 June 2014
Date Period NAV Scheme Benchmark Additional Value of investment of ` 10,000@per Unit Returns Returns Benchmark Scheme Benchmark Additional
(`) (%)^ (%)# Returns (`) (`)# Benchmark(%)## (`) ##
^Past performance may or may not be sustained in the future. Returns greater than 1 year period are compounded annualized (CAGR). # CNX Nifty Index ## S&P BSE SENSEX
A. Cumulative performance
Jun 28, 13 Last 1 Year 65.536 24.60 30.09 30.83 12,475 13,028 13,103Jun 29, 12 Last 2 Years 55.372 21.48 20.05 20.72 14,765 14,418 14,580Jun 30, 11 Last 3 Years 61.202 10.12 10.45 10.47 13,359 13,478 13,485Feb 18, 94 Since Inception 10.000 11.52 N.A. N.A. 92,223 N.A. N.A.
Period Scheme Benchmark Additional^ # Benchmark
##
B. Discrete 12 month returns (%)
Jun 28, 13 to Jun 30, 14 24.60 30.09 30.83
Jun 29, 12 to Jun 28, 13 18.36 10.67 11.28
Jun 30, 11 to Jun 29, 12 -9.53 -6.53 -7.51
HDFC LARGE CAP FUND NAV as at June 30, 2014 ` 81.758

Date Period NAV Scheme Benchmark Additional Value of investment of ` 10,000@per Unit Returns Returns Benchmark Scheme Benchmark Additional
(`) (%)^$$ (%)# Returns (`) $$ (`)# Benchmark(%)## (`) ##
^Past performance may or may not be sustained in the future. Returns greater than 1 year period are compounded annualized (CAGR). # CNX 500 Index ## CNX Nifty Index$$ All dividends declared prior to the splitting of the Scheme into Dividend & Growth Options are assumed to be reinvested in the units of the Scheme at the then prevailing NAV (ex-dividend NAV).
A. Cumulative performance
Jun 28, 13 Last 1 Year 220.988 62.00 36.64 30.09 16,242 13,687 13,028Jun 29, 12 Last 2 Years 216.522 28.71 21.64 20.05 16,577 14,804 14,418Jun 30, 11 Last 3 Years 235.455 15.08 10.92 10.45 15,244 13,651 13,478Mar 31, 96 Since Inception 10.000 27.99 12.66 N.A. 905,460 88,186 N.A.
Period Scheme Benchmark Additional^$$ # Benchmark
##
B. Discrete 12 month returns (%)
Jun 28, 13 to Jun 30, 14 62.00 36.64 30.09
Jun 29, 12 to Jun 28, 13 2.06 8.16 10.67
Jun 30, 11 to Jun 29, 12 -8.04 -7.79 -6.53
HDFC TAXSAVER NAV as at June 30, 2014 ` 358.939
SCHEME PERFORMANCE - GROWTH OPTION (FUND MANAGER-WISE)
Performance of dividend option under the schemes for the investors would be net of distribution tax as applicable. Load is not taken into consideration for computation of performance. N.A.: Not Available@ shows the current value of ` 10,000/- invested at the beginning of a given periodWhere either NAV or Benchmark Index value is not available for the start/end date of a concerned period, the previous date where both NAV and Benchmark Index value are available, is considered for returns computation except for since inception returns
VINAY KULKARNI...CONTINUED
Date Period NAV Scheme Benchmark Additional Value of investment of ` 10,000@per Unit Returns Returns Benchmark Scheme Benchmark Additional
(`) (%)^ (%)# Returns (`) (`)# Benchmark(%)## (`) ##
^Past performance may or may not be sustained in the future. Returns greater than 1 year period are compounded annualized (CAGR). # CNX Nifty Index (Total Returns Index) ## S&P BSE SENSEXSince inception returns are calculated on ` 10.3260 ( allotment price)
A. Cumulative performance
Jun 28, 13 Last 1 Year 50.6218 30.88 31.57 30.83 13,107 13,177 13,103Jun 29, 12 Last 2 Years 45.5916 20.60 21.45 20.72 14,553 14,758 14,580Jun 30, 11 Last 3 Years 48.9867 10.63 11.78 10.47 13,544 13,971 13,485Jul 17, 02 Since Inception 10.3260 16.83 19.94 18.86 64,255 88,009 79,021
Period Scheme Benchmark Additional^ # Benchmark
##
B. Discrete 12 month returns (%)
Jun 28, 13 to Jun 30, 14 30.88 31.57 30.83
Jun 29, 12 to Jun 28, 13 11.03 12.00 11.28
Jun 30, 11 to Jun 29, 12 -6.93 -5.34 -7.51
HDFC INDEX FUND - NNIFTY PLAN NAV as at June 30, 2014 ` 66.3494
Date Period NAV Scheme Benchmark Additional Value of investment of ` 10,000@per Unit Returns Returns Benchmark Scheme Benchmark Additional
(`) (%)^ (%)# Returns (`) (`)# Benchmark(%)## (`) ##
^Past performance may or may not be sustained in the future. Returns greater than 1 year period are compounded annualized (CAGR). # S&P BSE SENSEX (Total Returns Index) ## CNX Nifty IndexSince inception returns are calculated on ` 32.1610 ( allotment price)
A. Cumulative performance
Jun 28, 13 Last 1 Year 247.0139 33.21 32.67 30.09 13,342 13,287 13,028Jun 29, 12 Last 2 Years 222.7468 21.60 22.58 20.05 14,796 15,034 14,418Jun 30, 11 Last 3 Years 231.5010 12.48 10.79 10.45 14,236 13,604 13,478Jul 17, 02 Since Inception 32.1610 21.48 20.91 18.18 102,475 96,937 73,714
Period Scheme Benchmark Additional^ # Benchmark
##
B. Discrete 12 month returns (%)
Jun 28, 13 to Jun 30, 14 33.21 32.67 30.09
Jun 29, 12 to Jun 28, 13 10.89 13.15 10.67
Jun 30, 11 to Jun 29, 12 -3.78 -9.51 -6.53
HDFC INDEX FUND - SSENSEX PLUS PLAN NAV as at June 30, 2014 ` 329.5688
Intouchmutually June 2014 39
Date Period NAV Scheme Benchmark Additional Value of investment of ` 10,000@per Unit Returns Returns Benchmark Scheme Benchmark Additional
(`) (%)^ (%)# Returns (`) (`)# Benchmark(%)## (`) ##
^Past performance may or may not be sustained in the future. Returns greater than 1 year period are compounded annualized (CAGR). # S&P BSE SENSEX (Total Returns Index) ## CNX Nifty IndexSince inception returns are calculated on ` 32.1610 ( allotment price)
A. Cumulative performance
Jun 28, 13 Last 1 Year 162.9871 31.58 32.67 30.09 13,178 13,287 13,028Jun 29, 12 Last 2 Years 145.6168 21.42 22.58 20.05 14,750 15,034 14,418Jun 30, 11 Last 3 Years 156.7599 11.06 10.79 10.45 13,702 13,604 13,478Jul 17, 02 Since Inception 32.1610 17.20 20.91 18.18 66,785 96,937 73,714
Period Scheme Benchmark Additional^ # Benchmark
##
B. Discrete 12 month returns (%)
Jun 28, 13 to Jun 30, 14 31.58 32.67 30.09
Jun 29, 12 to Jun 28, 13 11.93 13.15 10.67
Jun 30, 11 to Jun 29, 12 -7.11 -9.51 -6.53
HDFC INDEX FUND - SSENSEX PLAN NAV as at June 30, 2014 ` 214.7879
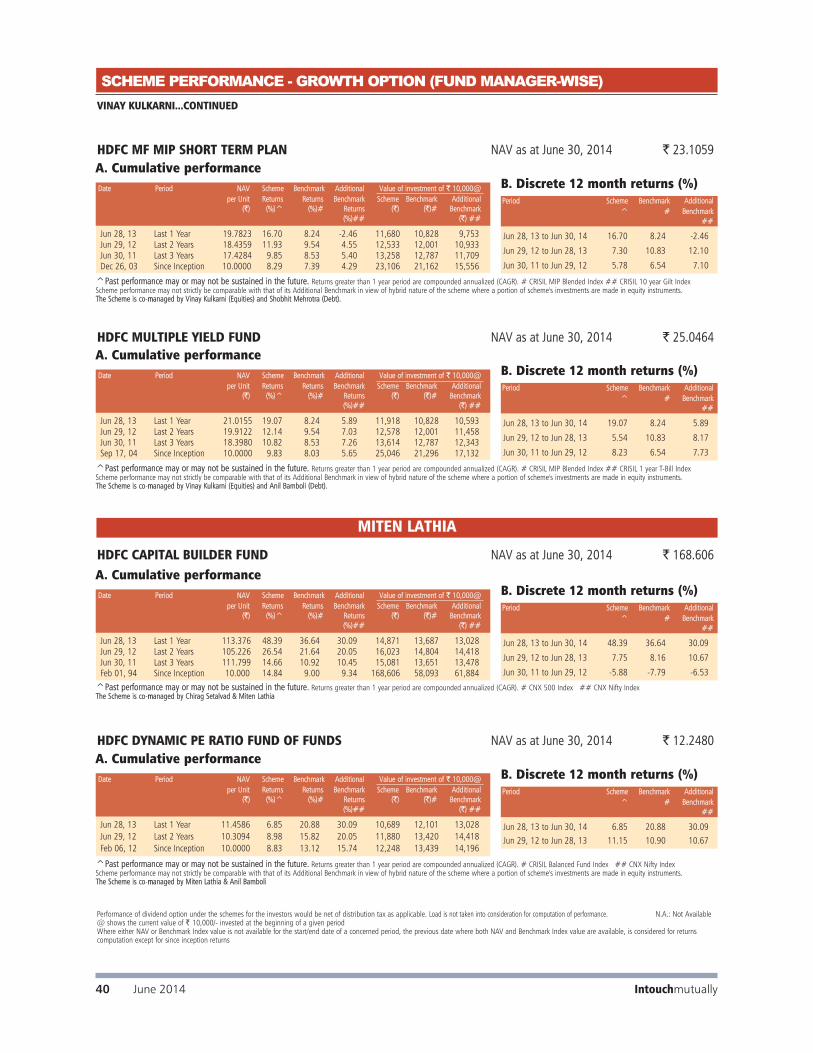
SCHEME PERFORMANCE - GROWTH OPTION (FUND MANAGER-WISE)
Performance of dividend option under the schemes for the investors would be net of distribution tax as applicable. Load is not taken into consideration for computation of performance. N.A.: Not Available@ shows the current value of ` 10,000/- invested at the beginning of a given periodWhere either NAV or Benchmark Index value is not available for the start/end date of a concerned period, the previous date where both NAV and Benchmark Index value are available, is considered for returns computation except for since inception returns
Date Period NAV Scheme Benchmark Additional Value of investment of ` 10,000@per Unit Returns Returns Benchmark Scheme Benchmark Additional
(`) (%)^ (%)# Returns (`) (`)# Benchmark(%)## (`) ##
^Past performance may or may not be sustained in the future. Returns greater than 1 year period are compounded annualized (CAGR). # CRISIL MIP Blended Index ## CRISIL 1 year T-Bill IndexScheme performance may not strictly be comparable with that of its Additional Benchmark in view of hybrid nature of the scheme where a portion of scheme's investments are made in equity instruments. The Scheme is co-mmanaged by Vinay Kulkarni (Equities) and Anil Bamboli (Debt).
A. Cumulative performance
Jun 28, 13 Last 1 Year 21.0155 19.07 8.24 5.89 11,918 10,828 10,593Jun 29, 12 Last 2 Years 19.9122 12.14 9.54 7.03 12,578 12,001 11,458Jun 30, 11 Last 3 Years 18.3980 10.82 8.53 7.26 13,614 12,787 12,343Sep 17, 04 Since Inception 10.0000 9.83 8.03 5.65 25,046 21,296 17,132
Period Scheme Benchmark Additional^ # Benchmark
##
B. Discrete 12 month returns (%)
Jun 28, 13 to Jun 30, 14 19.07 8.24 5.89
Jun 29, 12 to Jun 28, 13 5.54 10.83 8.17
Jun 30, 11 to Jun 29, 12 8.23 6.54 7.73
HDFC MULTIPLE YIELD FUND NAV as at June 30, 2014 ` 25.0464
MITEN LATHIA
Date Period NAV Scheme Benchmark Additional Value of investment of ` 10,000@per Unit Returns Returns Benchmark Scheme Benchmark Additional
(`) (%)^ (%)# Returns (`) (`)# Benchmark(%)## (`) ##
^Past performance may or may not be sustained in the future. Returns greater than 1 year period are compounded annualized (CAGR). # CNX 500 Index ## CNX Nifty IndexThe Scheme is co-mmanaged by Chirag Setalvad & Miten Lathia
A. Cumulative performance
Jun 28, 13 Last 1 Year 113.376 48.39 36.64 30.09 14,871 13,687 13,028Jun 29, 12 Last 2 Years 105.226 26.54 21.64 20.05 16,023 14,804 14,418Jun 30, 11 Last 3 Years 111.799 14.66 10.92 10.45 15,081 13,651 13,478Feb 01, 94 Since Inception 10.000 14.84 9.00 9.34 168,606 58,093 61,884
Period Scheme Benchmark Additional^ # Benchmark
##
B. Discrete 12 month returns (%)
Jun 28, 13 to Jun 30, 14 48.39 36.64 30.09
Jun 29, 12 to Jun 28, 13 7.75 8.16 10.67
Jun 30, 11 to Jun 29, 12 -5.88 -7.79 -6.53
HDFC CAPITAL BUILDER FUND NAV as at June 30, 2014 ` 168.606
Date Period NAV Scheme Benchmark Additional Value of investment of ` 10,000@per Unit Returns Returns Benchmark Scheme Benchmark Additional
(`) (%)^ (%)# Returns (`) (`)# Benchmark(%)## (`) ##
^Past performance may or may not be sustained in the future. Returns greater than 1 year period are compounded annualized (CAGR). # CRISIL Balanced Fund Index ## CNX Nifty IndexScheme performance may not strictly be comparable with that of its Additional Benchmark in view of hybrid nature of the scheme where a portion of scheme's investments are made in equity instruments. The Scheme is co-mmanaged by Miten Lathia & Anil Bamboli
A. Cumulative performance
Jun 28, 13 Last 1 Year 11.4586 6.85 20.88 30.09 10,689 12,101 13,028Jun 29, 12 Last 2 Years 10.3094 8.98 15.82 20.05 11,880 13,420 14,418Feb 06, 12 Since Inception 10.0000 8.83 13.12 15.74 12,248 13,439 14,196
Period Scheme Benchmark Additional^ # Benchmark
##
B. Discrete 12 month returns (%)
Jun 28, 13 to Jun 30, 14 6.85 20.88 30.09Jun 29, 12 to Jun 28, 13 11.15 10.90 10.67
HDFC DYNAMIC PE RATIO FUND OF FUNDS NAV as at June 30, 2014 ` 12.2480
VINAY KULKARNI...CONTINUED
Intouchmutually40 June 2014
Date Period NAV Scheme Benchmark Additional Value of investment of ` 10,000@per Unit Returns Returns Benchmark Scheme Benchmark Additional
(`) (%)^ (%)# Returns (`) (`)# Benchmark(%)## (`) ##
^Past performance may or may not be sustained in the future. Returns greater than 1 year period are compounded annualized (CAGR). # CRISIL MIP Blended Index ## CRISIL 10 year Gilt IndexScheme performance may not strictly be comparable with that of its Additional Benchmark in view of hybrid nature of the scheme where a portion of scheme's investments are made in equity instruments. The Scheme is co-mmanaged by Vinay Kulkarni (Equities) and Shobhit Mehrotra (Debt).
A. Cumulative performance
Jun 28, 13 Last 1 Year 19.7823 16.70 8.24 -2.46 11,680 10,828 9,753Jun 29, 12 Last 2 Years 18.4359 11.93 9.54 4.55 12,533 12,001 10,933Jun 30, 11 Last 3 Years 17.4284 9.85 8.53 5.40 13,258 12,787 11,709Dec 26, 03 Since Inception 10.0000 8.29 7.39 4.29 23,106 21,162 15,556
Period Scheme Benchmark Additional^ # Benchmark
##
B. Discrete 12 month returns (%)
Jun 28, 13 to Jun 30, 14 16.70 8.24 -2.46
Jun 29, 12 to Jun 28, 13 7.30 10.83 12.10
Jun 30, 11 to Jun 29, 12 5.78 6.54 7.10
HDFC MF MIP SHORT TERM PLAN NAV as at June 30, 2014 ` 23.1059

SCHEME PERFORMANCE - GROWTH OPTION (FUND MANAGER-WISE) CHIRAG SETALVAD...CONTINUED
Performance of dividend option under the schemes for the investors would be net of distribution tax as applicable. Load is not taken into consideration for computation of performance.@ shows the current value of ` 10,000/- invested at the beginning of a given periodWhere either NAV or Benchmark Index value is not available for the start/end date of a concerned period, the previous date where both NAV and Benchmark Index value are available, is considered for returns computation except for since inception returns
Date Period NAV Scheme Benchmark Additional Value of investment of ` 10,000@per Unit Returns Returns Benchmark Scheme Benchmark Additional
(`) (%)^ (%)# Returns (`) (`)# Benchmark(%)## (`) ##
^Past performance may or may not be sustained in the future. Returns greater than 1 year period are compounded annualized (CAGR). # CRISIL Balanced Fund Index ## CNX Nifty IndexScheme performance may not strictly be comparable with that of its Additional Benchmark in view of balanced nature of the scheme where a portion of scheme's investments are made in debt instruments
A. Cumulative performance
Jun 28, 13 Last 1 Year 60.677 49.27 20.88 30.09 14,960 12,101 13,028Jun 29, 12 Last 2 Years 58.211 24.84 15.82 20.05 15,593 13,420 14,418Jun 30, 11 Last 3 Years 57.575 16.37 9.93 10.45 15,766 13,287 13,478Sep 11, 00 Since Inception 10.000 17.32 N.A. 12.72 90,771 N.A. 52,263
Period Scheme Benchmark Additional^ # Benchmark
##
B. Discrete 12 month returns (%)
Jun 28, 13 to Jun 30, 14 49.27 20.88 30.09
Jun 29, 12 to Jun 28, 13 4.24 10.90 10.67
Jun 30, 11 to Jun 29, 12 1.10 -0.99 -6.53
HDFC BALANCED FUND NAV as at June 30, 2014 ` 90.771
Intouchmutually June 2014 41
Date Period NAV Scheme Benchmark Additional Value of investment of ` 10,000@per Unit Returns Returns Benchmark Scheme Benchmark Additional
(`) (%)^ (%)# Returns (`) (`)# Benchmark(%)## (`) ##
^Past performance may or may not be sustained in the future. Returns greater than 1 year period are compounded annualized (CAGR). # CNX Midcap Index ## CNX Nifty Index
A. Cumulative performance
Jun 28, 13 Last 1 Year 17.183 69.61 50.79 30.09 17,010 15,113 13,028Jun 29, 12 Last 2 Years 16.104 34.67 22.82 20.05 18,150 15,094 14,418Jun 30, 11 Last 3 Years 16.138 21.87 11.65 10.45 18,111 13,921 13,478Jun 25, 07 Since Inception 10.000 16.51 9.61 8.62 29,228 19,044 17,870
Period Scheme Benchmark Additional^ # Benchmark
##
B. Discrete 12 month returns (%)
Jun 28, 13 to Jun 30, 14 69.61 50.79 30.09
Jun 29, 12 to Jun 28, 13 6.70 -0.13 10.67
Jun 30, 11 to Jun 29, 12 -0.21 -7.77 -6.53
HDFC MID-CCAP OPPORTUNITIES FUND NAV as at June 30, 2014 ` 29.228
Date Period NAV Scheme Benchmark Additional Value of investment of ` 10,000@per Unit Returns Returns Benchmark Scheme Benchmark Additional
(`) (%)^ (%)# Returns (`) (`)# Benchmark(%)## (`) ##
^Past performance may or may not be sustained in the future. Returns greater than 1 year period are compounded annualized (CAGR). # CNX Smallcap Index ## CNX Nifty Index
A. Cumulative performance
Jun 28, 13 Last 1 Year 15.024 40.31 84.78 30.09 14,058 18,540 13,028Jun 29, 12 Last 2 Years 13.452 25.26 26.78 20.05 15,700 16,084 14,418Jun 30, 11 Last 3 Years 14.723 12.77 13.70 10.45 14,345 14,705 13,478Apr 03, 08 Since Inception 10.000 12.72 6.25 7.77 21,120 14,603 15,951
Period Scheme Benchmark Additional^ # Benchmark
##
B. Discrete 12 month returns (%)
Jun 28, 13 to Jun 30, 14 40.31 84.78 30.09
Jun 29, 12 to Jun 28, 13 11.69 -13.25 10.67
Jun 30, 11 to Jun 29, 12 -8.63 -8.57 -6.53
HDFC SMALL AND MID CAP FUND NAV as at June 30, 2014 ` 21.120
CHIRAG SETALVAD
Date Period NAV Scheme Benchmark Additional Value of investment of ` 10,000@per Unit Returns Returns Benchmark Scheme Benchmark Additional
(`) (%)^ (%)# Returns (`) (`)# Benchmark(%)## (`) ##
^Past performance may or may not be sustained in the future. Returns greater than 1 year period are compounded annualized (CAGR). # CNX 500 Index ## CNX Nifty IndexThe Scheme is co-mmanaged by Chirag Setalvad & Miten Lathia
A. Cumulative performance
Jun 28, 13 Last 1 Year 113.376 48.39 36.64 30.09 14,871 13,687 13,028Jun 29, 12 Last 2 Years 105.226 26.54 21.64 20.05 16,023 14,804 14,418Jun 30, 11 Last 3 Years 111.799 14.66 10.92 10.45 15,081 13,651 13,478Feb 01, 94 Since Inception 10.000 14.84 9.00 9.34 168,606 58,093 61,884
Period Scheme Benchmark Additional^ # Benchmark
##
B. Discrete 12 month returns (%)
Jun 28, 13 to Jun 30, 14 48.39 36.64 30.09
Jun 29, 12 to Jun 28, 13 7.75 8.16 10.67
Jun 30, 11 to Jun 29, 12 -5.88 -7.79 -6.53
HDFC CAPITAL BUILDER FUND NAV as at June 30, 2014 ` 168.606

SCHEME PERFORMANCE - GROWTH OPTION (FUND MANAGER-WISE)
Performance of dividend option under the schemes for the investors would be net of distribution tax as applicable. Load is not taken into consideration for computation of performance.@ shows the current value of ` 10,000/- invested at the beginning of a given periodWhere either NAV or Benchmark Index value is not available for the start/end date of a concerned period, the previous date where both NAV and Benchmark Index value are available, is considered for returns computation except for since inception returns
Date Period NAV Scheme Benchmark Additional Value of investment of ` 10,000@per Unit Returns Returns Benchmark Scheme Benchmark Additional
(`) (%)^ (%)# Returns (`) (`)# Benchmark(%)## (`) ##
^Past performance may or may not be sustained in the future. Returns greater than 1 year period are compounded annualized (CAGR). # CRISIL MIP Blended Index ## CRISIL 1 year T-Bill IndexScheme performance may not strictly be comparable with that of its Additional Benchmark in view of hybrid nature of the scheme where a portion of scheme's investments are made in equity instruments. The Scheme is co-mmanaged by Chirag Setalvad (Equities) and Anil Bamboli (Debt).
A. Cumulative performance
Jun 28, 13 Last 1 Year 19.1310 20.47 8.24 5.89 12,059 10,828 10,593Jun 29, 12 Last 2 Years 18.0659 12.98 9.54 7.03 12,770 12,001 11,458Jun 30, 11 Last 3 Years 16.7582 11.23 8.53 7.26 13,766 12,787 12,343Aug 17, 05 Since Inception 10.0000 9.88 7.88 5.73 23,070 19,595 16,399
Period Scheme Benchmark Additional^ # Benchmark
##
B. Discrete 12 month returns (%)
Jun 28, 13 to Jun 30, 14 20.47 8.24 5.89
Jun 29, 12 to Jun 28, 13 5.90 10.83 8.17
Jun 30, 11 to Jun 29, 12 7.80 6.54 7.73
HDFC MULTIPLE YIELD FUND - PPLAN 2005 NAV as at June 30, 2014 ` 23.0698
CHIRAG SETALVAD...CONTINUED
Intouchmutually42 June 2014
Date Period NAV Scheme Benchmark Additional Value of investment of ` 10,000@per Unit Returns Returns Benchmark Scheme Benchmark Additional
(`) (%)^ (%)# Returns (`) (`)# Benchmark(%)## (`) ##
^Past performance may or may not be sustained in the future. Returns greater than 1 year period are compounded annualized (CAGR). #S&P BSE SENSEX ## CNX Nifty Index
A. Cumulative performance
Jun 28, 13 Last 1 Year 143.237 48.27 30.83 30.09 14,859 13,103 13,028Jun 29, 12 Last 2 Years 131.509 27.17 20.72 20.05 16,184 14,580 14,418Jun 30, 11 Last 3 Years 139.420 15.13 10.47 10.45 15,266 13,485 13,478Jan 02, 01 Since Inception 10.000 25.42 14.64 14.17 212,832 63,236 59,847
Period Scheme Benchmark Additional^ # Benchmark
##
B. Discrete 12 month returns (%)
Jun 28, 13 to Jun 30, 14 48.27 30.83 30.09
Jun 29, 12 to Jun 28, 13 8.92 11.28 10.67
Jun 30, 11 to Jun 29, 12 -5.67 -7.51 -6.53
HDFC LONG TERM ADVANTAGE FUND NAV as at June 30, 2014 ` 212.832
Date Period NAV Scheme Benchmark Additional Value of investment of ` 10,000@per Unit Returns Returns Benchmark Scheme Benchmark Additional
(`) (%)^$ (%)# Returns (`) $ (`)# Benchmark(%)## (`) ##
^Past performance may or may not be sustained in the future. Returns greater than 1 year period are compounded annualized (CAGR). # CRISIL Balanced Fund Index ## CNX Nifty Index$ Adjusted for bonus units declared under the schemeScheme performance may not strictly be comparable with that of its Additional Benchmark in view of balanced nature of the scheme where a portion of scheme's investments are made in debt instruments
A. Cumulative performance
Jun 28, 13 Last 1 Year 49.567 43.25 20.88 30.09 14,354 12,101 13,028Jun 29, 12 Last 2 Years 45.228 25.38 15.82 20.05 15,731 13,420 14,418Jun 30, 11 Last 3 Years 44.767 16.68 9.93 10.45 15,893 13,287 13,478Mar 02, 01 Since Inception 10.000 18.15 N.A. 14.13 92,491 N.A. 58,264
Period Scheme Benchmark Additional^$ # Benchmark
##
B. Discrete 12 month returns (%)
Jun 28, 13 to Jun 30, 14 43.25 20.88 30.09
Jun 29, 12 to Jun 28, 13 9.59 10.90 10.67
Jun 30, 11 to Jun 29, 12 1.03 -0.99 -6.53
HDFC CHILDREN’S GIFT FUND - IINVESTMENT PLAN NAV as at June 30, 2014 ` 71.147
Date Period NAV Scheme Benchmark Additional Value of investment of ` 10,000@per Unit Returns Returns Benchmark Scheme Benchmark Additional
(`) (%)^$ (%)# Returns (`) $ (`)# Benchmark(%)## (`) ##
^Past performance may or may not be sustained in the future. Returns greater than 1 year period are compounded annualized (CAGR). # CRISIL MIP Blended Index ## CRISIL 10 year Gilt Index$ Adjusted for bonus units declared under the schemeScheme performance may not strictly be comparable with that of its Additional Benchmark in view of hybrid nature of the scheme where a portion of scheme's investments are made in equity instruments.
A. Cumulative performance
Jun 28, 13 Last 1 Year 26.8282 17.81 8.24 -2.46 11,792 10,828 9,753Jun 29, 12 Last 2 Years 25.1000 12.25 9.54 4.55 12,604 12,001 10,933Jun 30, 11 Last 3 Years 23.3350 10.67 8.53 5.40* 13,557 12,787 11,709Mar 02, 01 Since Inception 10.0000 11.19 N.A. N.A. 41,126 N.A. N.A.
Period Scheme Benchmark Additional^$ # Benchmark
##
B. Discrete 12 month returns (%)
Jun 28, 13 to Jun 30, 14 17.81 8.24 -2.46
Jun 29, 12 to Jun 28, 13 6.89 10.83 12.10
Jun 30, 11 to Jun 29, 12 7.56 6.54 7.10
HDFC CHILDREN’S GIFT FUND - SSAVINGS PLAN NAV as at June 30, 2014 ` 31.6357

SHOBHIT MEHROTRA
Date Period NAV Scheme Benchmark Additional Value of investment of ` 10,000@per Unit Returns Returns Benchmark Scheme Benchmark Additional
(`) (%)^ (%)# Returns (`) (`)# Benchmark(%)## (`) ##
^Past performance may or may not be sustained in the future. Returns greater than 1 year period are compounded annualized (CAGR). # CRISIL MIP Blended Index ## CRISIL 10 year Gilt IndexScheme performance may not strictly be comparable with that of its Additional Benchmark in view of hybrid nature of the scheme where a portion of scheme's investments are made in equity instruments.
The Scheme is co-mmanaged by Vinay Kulkarni (Equities) and Shobhit Mehrotra (Debt).
A. Cumulative performance
Jun 28, 13 Last 1 Year 19.7823 16.70 8.24 -2.46 11,680 10,828 9,753Jun 29, 12 Last 2 Years 18.4359 11.93 9.54 4.55 12,533 12,001 10,933Jun 30, 11 Last 3 Years 17.4284 9.85 8.53 5.40 13,258 12,787 11,709Dec 26, 03 Since Inception 10.0000 8.29 7.39 4.29 23,106 21,162 15,556
Period Scheme Benchmark Additional^ # Benchmark
##
B. Discrete 12 month returns (%)
Jun 28, 13 to Jun 30, 14 16.70 8.24 -2.46
Jun 29, 12 to Jun 28, 13 7.30 10.83 12.10
Jun 30, 11 to Jun 29, 12 5.78 6.54 7.10
HDFC MF MIP SHORT TERM PLAN NAV as at June 30, 2014 ` 23.1059
Performance of dividend option under the schemes for the investors would be net of distribution tax as applicable. Load is not taken into consideration for computation of performance. N.A.: Not Available@ shows the current value of ` 10,000/- invested at the beginning of a given periodWhere either NAV or Benchmark Index value is not available for the start/end date of a concerned period, the previous date where both NAV and Benchmark Index value are available, is considered for returns computation except for since inception returns
SCHEME PERFORMANCE - GROWTH OPTION (FUND MANAGER-WISE)
Intouchmutually June 2014 43
Date Period NAV Scheme Benchmark Additional Value of investment of ` 10,000@per Unit Returns Returns Benchmark Scheme Benchmark Additional
(`) (%)^ (%)# Returns (`) (`) # Benchmark(%)## (`) ##
^Past performance may or may not be sustained in the future. Returns greater than 1 year period are compounded annualized (CAGR). # CNX 500 Index ## CNX Nifty IndexThe Scheme is co-mmanaged by Prashant Jain and Srinivas Rao Ravuri.
A. Cumulative performance
Jun 28, 13 Last 1 Year 8.672 71.19 36.64 30.09 17,169 13,687 13,028Jun 29, 12 Last 2 Years 9.865 22.82 21.64 20.05 15,093 14,804 14,418Jun 30, 11 Last 3 Years 11.503 8.97 10.92 10.45 12,944 13,651 13,478Mar 10, 08 Since Inception 10.000 6.51 7.43 7.58 14,889 15,719 15,856
Period Scheme Benchmark Additional^ # Benchmark
##
B. Discrete 12 month returns (%)
Jun 28, 13 to Jun 30, 14 71.19 36.64 30.09
Jun 29, 12 to Jun 28, 13 -12.09 8.16 10.67
Jun 30, 11 to Jun 29, 12 -14.24 -7.79 -6.53
HDFC INFRASTRUCTURE FUND NAV as at June 30, 2014 ` 14.889
SRINIVAS RAO RAVURI
Date Period NAV Scheme Benchmark Additional Value of investment of ` 10,000@per Unit Returns Returns Benchmark Scheme Benchmark Additional
(`) (%)^ (%)# Returns (`) (`)# Benchmark(%)## (`) ##
^Past performance may or may not be sustained in the future. Returns greater than 1 year period are compounded annualized (CAGR). # S&P BSE SENSEX ## CNX Nifty Index
A. Cumulative performance
Jun 28, 13 Last 1 Year 85.640 41.22 30.83 30.09 14,149 13,103 13,028Jun 29, 12 Last 2 Years 84.001 20.07 20.72 20.05 14,425 14,580 14,418Jun 30, 11 Last 3 Years 87.834 11.31 10.47 10.45 13,796 13,485 13,478Sep 11, 00 Since Inception 10.000 19.80 13.01 12.72 121,172 54,111 52,263
Period Scheme Benchmark Additional^ # Benchmark
##
B. Discrete 12 month returns (%)
Jun 28, 13 to Jun 30, 14 41.22 30.83 30.09
Jun 29, 12 to Jun 28, 13 1.95 11.28 10.67
Jun 30, 11 to Jun 29, 12 -4.36 -7.51 -6.53
HDFC GROWTH FUND NAV as at June 30, 2014 ` 121.172
Date Period NAV Scheme Benchmark Additional Value of investment of ` 10,000@per Unit Returns Returns Benchmark Scheme Benchmark Additional
(`) (%)^ (%)# Returns (`) (`)# Benchmark(%)## (`)##
^Past performance may or may not be sustained in the future. Returns greater than 1 year period are compounded annualized (CAGR). # S&P BSE 100 ## S&P BSE SENSEX
Jun 28, 13 Last 1 Year 10.138 41.50 33.23 30.83 14,177 13,344 13,103Mar 22, 13 Since Inception 10.000 32.94 28.21 27.04 14,373 13,724 13,564
Period Scheme Benchmark Additional^ # Benchmark
##
B. Discrete 12 month returns (%)
Jun 28, 13 to Jun 30, 14 41.50 33.23 30.83
HDFC RAJIV GANDHI EQUITY SAVINGS SCHEME - SSERIES I - FFEBRUARY 2013NAV as at June 30, 2014 ` 14.373A. Cumulative performance

Performance of dividend option under the schemes for the investors would be net of distribution tax as applicable. Load is not taken into consideration for computation of performance. N.A.: Not Available@ shows the current value of ` 10,000/- invested at the beginning of a given periodWhere either NAV or Benchmark Index value is not available for the start/end date of a concerned period, the previous date where both NAV and Benchmark Index value are available, is considered for returns computation except for since inception returns
SHOBHIT MEHROTRA...CONTINUED
Date Period NAV Scheme Benchmark Additional Value of investment of ` 10,000@per Unit Returns Returns Benchmark Scheme Benchmark Additional
(`) (%)^ (%)# Returns (`) (`)# Benchmark(%)## (`)##
^Past performance may or may not be sustained in the future. Returns greater than 1 year period are compounded annualized (CAGR). # CRISIL Liquid Fund Index ## CRISIL 1 year T-Bill IndexSince inception returns are calculated on ` 10.0104 ( allotment price)
A. Cumulative performance
Jun 28, 13 Last 1 Year 20.9829 8.75 9.63 5.89 10,880 10,968 10,593Jun 29, 12 Last 2 Years 19.1245 9.25 8.89 7.03 11,938 11,859 11,458Jun 30, 11 Last 3 Years 17.2977 9.68 8.82 7.26 13,198 12,888 12,343Jan 16, 03 Since Inception 10.0104 7.46 6.56 5.50 22,807 20,721 18,476
Period Scheme Benchmark Additional^ # Benchmark
##
B. Discrete 12 month returns (%)
Jun 28, 13 to Jun 30, 14 8.75 9.63 5.89Jun 29, 12 to Jun 28, 13 9.72 8.12 8.17Jun 30, 11 to Jun 29, 12 10.56 8.68 7.73
HDFC FLOATING RATE INCOME FUND - LLTP NAV as at June 30, 2014 ` 22.8303
Date Period NAV Scheme Benchmark Additional Value of investment of ` 10,000@per Unit Returns Returns Benchmark Scheme Benchmark Additional
(`) (%)^ (%)# Returns (`) (`)# Benchmark(%)## (`)##
^Past performance may or may not be sustained in the future. Returns greater than 1 year period are compounded annualized (CAGR). # CRISIL Liquid Fund Index ## CRISIL 1 year T-Bill IndexSince inception returns are calculated on ` 13.1821 ( allotment price)
A. Cumulative performance
Jun 28, 13 Last 1 Year 20.4660 9.44 9.63 5.89 10,950 10,968 10,593Jun 29, 12 Last 2 Years 18.7725 9.24 8.89 7.03 11,937 11,859 11,458Jun 30, 11 Last 3 Years 17.1024 9.42 8.82 7.26 13,103 12,888 12,343Oct 23, 07 Since Inception 13.1821 8.25 7.48 5.93 17,000 16,198 14,698
Period Scheme Benchmark Additional^ # Benchmark
##
B. Discrete 12 month returns (%)
Jun 28, 13 to Jun 30, 14 9.44 9.63 5.89Jun 29, 12 to Jun 28, 13 9.02 8.12 8.17Jun 30, 11 to Jun 29, 12 9.77 8.68 7.73
HDFC FLOATING RATE INCOME FUND - SSTP - WWHOLESALE OPTION NAV as at June 30, 2014 ` 22.4094
SCHEME PERFORMANCE - GROWTH OPTION (FUND MANAGER-WISE)
Intouchmutually44 June 2014
Date Period NAV Scheme Benchmark Additional Value of investment of ` 10,000@per Unit Returns Returns Benchmark Scheme Benchmark Additional
(`) (%)^ (%)# Returns (`) (`)# Benchmark(%)## (`) ##
^Past performance may or may not be sustained in the future. Returns greater than 1 year period are compounded annualized (CAGR). # CRISIL Composite Bond Fund Index ## CRISIL 10 year Gilt Index
A. Cumulative performance
Jun 28, 13 Last 1 Year 27.9452 2.32 4.57 -2.46 10,234 10,460 9,753Jun 29, 12 Last 2 Years 25.0025 6.94 7.61 4.55 11,438 11,582 10,933Jun 30, 11 Last 3 Years 22.9669 7.58 7.97 5.40 12,452 12,588 11,709Sep 11, 00 Since Inception 10.0000 7.91 N.A. N.A. 28,598 N.A. N.A.
Period Scheme Benchmark Additional^ # Benchmark
##
B. Discrete 12 month returns (%)
Jun 28, 13 to Jun 30, 14 2.32 4.57 -2.46Jun 29, 12 to Jun 28, 13 11.77 10.72 12.10Jun 30, 11 to Jun 29, 12 8.86 8.69 7.10
HDFC INCOME FUND NAV as at June 30, 2014 ` 28.5980
Date Period NAV Scheme Benchmark Additional Value of investment of ` 10,000@per Unit Returns Returns Benchmark Scheme Benchmark Additional
(`) (%)^ (%)# Returns (`) (`)# Benchmark(%)## (`)##
^Past performance may or may not be sustained in the future. Returns greater than 1 year period are compounded annualized (CAGR). # CRISIL Short Term Bond Fund Index ## CRISIL 1 year T-Bill Index
A. Cumulative performance
Jun 28, 13 Last 1 Year 23.6823 7.90 8.76 5.89 10,794 10,881 10,593Jun 29, 12 Last 2 Years 21.5429 8.92 9.04 7.03 11,866 11,893 11,458Jun 30, 11 Last 3 Years 19.7457 8.98 8.96 7.26 12,946 12,941 12,343Feb 06, 02 Since Inception 10.0000 7.86 N.A. 5.59 25,563 N.A. 19,635
Period Scheme Benchmark Additional^ # Benchmark
##
B. Discrete 12 month returns (%)
Jun 28, 13 to Jun 30, 14 7.90 8.76 5.89Jun 29, 12 to Jun 28, 13 9.93 9.30 8.17Jun 30, 11 to Jun 29, 12 9.10 8.81 7.73
HDFC HIGH INTEREST FUND - SSTP NAV as at June 30, 2014 ` 25.5628
Date Period NAV Scheme Benchmark Additional Value of investment of ` 10,000@per Unit Returns Returns Benchmark Scheme Benchmark Additional
(`) (%)^ (%)# Returns (`) (`)# Benchmark(%)## (`) ##
^Past performance may or may not be sustained in the future. Returns greater than 1 year period are compounded annualized (CAGR). # CRISIL MIP Blended Index ## CRISIL 10 year Gilt IndexScheme performance may not strictly be comparable with that of its Additional Benchmark in view of hybrid nature of the scheme where a portion of scheme's investments are made in equity instruments.
The Scheme is co-mmanaged by Prashant Jain (Equities) and Shobhit Mehrotra (Debt).
A. Cumulative performance
Jun 28, 13 Last 1 Year 26.7025 18.15 8.24 -2.46 11,826 10,828 9,753Jun 29, 12 Last 2 Years 24.5544 13.39 9.54 4.55 12,861 12,001 10,933Jun 30, 11 Last 3 Years 23.3865 10.52 8.53 5.40 13,503 12,787 11,709Dec 26, 03 Since Inception 10.0000 11.55 7.39 4.29 31,579 21,162 15,556
Period Scheme Benchmark Additional^ # Benchmark
##
B. Discrete 12 month returns (%)
Jun 28, 13 to Jun 30, 14 18.15 8.24 -2.46Jun 29, 12 to Jun 28, 13 8.75 10.83 12.10Jun 30, 11 to Jun 29, 12 4.99 6.54 7.10
HDFC MF MIP LONG TERM PLAN NAV as at June 30, 2014 ` 31.5788

Performance of dividend option under the schemes for the investors would be net of distribution tax as applicable. Load is not taken into consideration for computation of performance.@ shows the current value of ` 10,000/- invested at the beginning of a given periodWhere either NAV or Benchmark Index value is not available for the start/end date of a concerned period, the previous date where both NAV and Benchmark Index value are available, is considered for returns computation except for since inception returns
SHOBHIT MEHROTRA...CONTINUED
Date Period NAV Scheme Benchmark Additional Value of investment of ` 10,000@per Unit Returns Returns Benchmark Scheme Benchmark Additional
(`) (%)^ (%)# Returns (`) (`)# Benchmark(%)## (`)##
^Past performance may or may not be sustained in the future. Returns greater than 1 year period are compounded annualized (CAGR). # CRISIL Short Term Bond Fund Index. ## CRISIL 1 year T-Bill IndexPerformance of FMP schemes, being close-ended in nature, is not strictly comparable with that of open-ended schemes since the investment strategy for FMP schemes is primarily buy-and-hold whereas open-ended schemes are actively managed.
A. Cumulative performance
Jun 28, 13 Last 1 Year 11.7385 8.93 8.76 5.89 10,898 10,881 10,593Jun 29, 12 Last 2 Years 10.5667 10.02 9.04 7.03 12,107 11,893 11,458Dec 01, 11 Since Inception 10.0000 10.01 9.04 7.26 12,793 12,504 11,983
HDFC FMP 36M NOVEMBER 2011 (1) NAV as at June 30, 2014 ` 12.7927
Period Scheme Benchmark Additional^ # Benchmark
##
B. Discrete 12 month returns (%)
Jun 28, 13 to Jun 30, 14 8.93 8.76 5.89Jun 29, 12 to Jun 28, 13 11.09 9.30 8.17
Date Period NAV Scheme Benchmark Additional Value of investment of ` 10,000@per Unit Returns Returns Benchmark Scheme Benchmark Additional
(`) (%)^ (%)# Returns (`) (`)# Benchmark(%)## (`)##
^Past performance may or may not be sustained in the future. Returns greater than 1 year period are compounded annualized (CAGR). # CRISIL Short Term Bond Fund Index. ## CRISIL 1 year T-Bill IndexPerformance of FMP schemes, being close-ended in nature, is not strictly comparable with that of open-ended schemes since the investment strategy for FMP schemes is primarily buy-and-hold whereas open-ended schemes are actively managed.
A. Cumulative performance
Jun 28, 13 Last 1 Year 11.8463 8.68 8.76 5.89 10,873 10,881 10,593Jun 29, 12 Last 2 Years 10.6508 9.96 9.04 7.03 12,094 11,893 11,458Nov 11, 11 Since Inception 10.0000 10.08 9.05 7.41 12,881 12,565 12,074
HDFC FMP 36M OCTOBER 2011 (1) NAV as at June 30, 2014 ` 12.8808
Period Scheme Benchmark Additional^ # Benchmark
##
B. Discrete 12 month returns (%)
Jun 28, 13 to Jun 30, 14 8.68 8.76 5.89Jun 29, 12 to Jun 28, 13 11.22 9.30 8.17
SCHEME PERFORMANCE - GROWTH OPTION (FUND MANAGER-WISE)
Intouchmutually June 2014 45
Date Period NAV Scheme Benchmark Additional Value of investment of ` 10,000@per Unit Returns Returns Benchmark Scheme Benchmark Additional
(`) (%)^ (%)# Returns (`) (`)# Benchmark(%)## (`)##
^Past performance may or may not be sustained in the future. Returns greater than 1 year period are compounded annualized (CAGR). # CRISIL Composite Bond Fund Index. ## CRISIL 10 year Gilt Index
A. Cumulative performance
Jun 28, 13 Last 1 Year 13.0473 7.97 4.57 -2.46 10,801 10,460 9,753Jun 29, 12 Last 2 Years 11.7346 9.58 7.61 4.55 12,010 11,582 10,933Jun 30, 11 Last 3 Years 10.7878 9.31 7.97 5.40 13,064 12,588 11,709Jun 29, 10 Since Inception 10.0000 8.94 7.11 4.52 14,093 13,168 11,937
HDFC MEDIUM TERM OPPORTUNITIES FUND NAV as at June 30, 2014 ` 14.0930
Period Scheme Benchmark Additional^ # Benchmark
##
B. Discrete 12 month returns (%)
Jun 28, 13 to Jun 30, 14 7.97 4.57 -2.46Jun 29, 12 to Jun 28, 13 11.19 10.72 12.10Jun 30, 11 to Jun 29, 12 8.78 8.69 7.10
Date Period NAV Scheme Benchmark Additional Value of investment of ` 10,000@per Unit Returns Returns Benchmark Scheme Benchmark Additional
(`) (%)^ (%)# Returns (`) (`)# Benchmark(%)## (`)##
^Past performance may or may not be sustained in the future. Returns greater than 1 year period are compounded annualized (CAGR). # CRISIL Liquid Fund Index ## CRISIL 1 year T-Bill Index
A. Cumulative performance
Jun 23, 14 Last 7 days 25.8307 0.17 0.17 0.15 10,017 10,017 10,015Jun 15, 14 Last 15 days 25.7827 0.35 N.A. N.A. 10,035 N.A. N.A.May 30, 14 Last 1 Month 25.6861 0.73 0.72 0.63 10,073 10,072 10,063Jun 28, 13 Last 1 Year 23.6165 9.50 9.63 5.89 10,956 10,968 10,593Jun 29, 12 Last 2 Years 21.6884 9.21 8.89 7.03 11,930 11,859 11,458Jun 30, 11 Last 3 Years 19.7871 9.34 8.82 7.26 13,076 12,888 12,343Oct 17, 00 Since Inception 10.0000 7.18 N.A. 6.10 25,874 N.A. 22,525
Period Scheme Benchmark Additional^ # Benchmark
##
B. Discrete 12 month returns (%)
Jun 28, 13 to Jun 30, 14 9.50 9.63 5.89
Jun 29, 12 to Jun 28, 13 8.89 8.12 8.17
Jun 30, 11 to Jun 29, 12 9.61 8.68 7.73
HDFC LIQUID FUND NAV as at June 30, 2014 ` 25.8737

SHOBHIT MEHROTRA...CONTINUED
Performance of dividend option under the schemes for the investors would be net of distribution tax as applicable. Load is not taken into consideration for computation of performance.@ shows the current value of ` 10,000/- invested at the beginning of a given periodWhere either NAV or Benchmark Index value is not available for the start/end date of a concerned period, the previous date where both NAV and Benchmark Index value are available, is considered for returns computation except for since inception returns
SCHEME PERFORMANCE - GROWTH OPTION (FUND MANAGER-WISE)
Date Period NAV Scheme Benchmark Additional Value of investment of ` 10,000@per Unit Returns Returns Benchmark Scheme Benchmark Additional
(`) (%)^ (%)# Returns (`) (`)# Benchmark(%)## (`)##
^Past performance may or may not be sustained in the future. Returns greater than 1 year period are compounded annualized (CAGR). # CRISIL Composite Bond Fund Index. ## CRISIL 1 year T-Bill IndexPerformance of FMP schemes, being close-ended in nature, is not strictly comparable with that of open-ended schemes since the investment strategy for FMP schemes is primarily buy-and-hold whereas open-ended schemes are actively managed.
A. Cumulative performance
Jun 28, 13 Last 1 Year 11.0821 7.72 4.57 5.89 10,776 10,460 10,593Jun 29, 12 Last 2 Years 10.0294 9.11 7.61 7.03 11,907 11,582 11,458Jun 20, 12 Since Inception 10.0000 9.15 7.62 7.02 11,942 11,605 11,475
HDFC FMP 1120D JUNE 2012 (1) NAV as at June 30, 2014 ` 11.9422
Period Scheme Benchmark Additional^ # Benchmark
##
B. Discrete 12 month returns (%)
Jun 28, 13 to Jun 30, 14 7.71 4.57 5.89
Jun 29, 12 to Jun 28, 13 10.50 10.72 8.17
Intouchmutually46 June 2014
Date Period NAV Scheme Benchmark Additional Value of investment of ` 10,000@per Unit Returns Returns Benchmark Scheme Benchmark Additional
(`) (%)^ (%)# Returns (`) (`)# Benchmark(%)## (`)##
^Past performance may or may not be sustained in the future. Returns greater than 1 year period are compounded annualized (CAGR). # CRISIL Composite Bond Fund Index. ## CRISIL 1 year T-Bill IndexPerformance of FMP schemes, being close-ended in nature, is not strictly comparable with that of open-ended schemes since the investment strategy for FMP schemes is primarily buy-and-hold whereas open-ended schemes are actively managed.
A. Cumulative performanceHDFC FMP 1198D FEBRUARY 2013 (1) NAV as at June 30, 2014 ` 11.1853
Period Scheme Benchmark Additional^ # Benchmark
##
B. Discrete 12 month returns (%)
Jun 28, 13 to Jun 30, 14 7.78 4.57 5.89Jun 28, 13 Last 1 Year 10.3738 7.78 4.57 5.89 10,782 10,460 10,593Jun 20, 12 Since Inception 10.0000 8.49 6.47 6.48 11,185 10,901 10,903
Date Period NAV Scheme Benchmark Additional Value of investment of ` 10,000@per Unit Returns Returns Benchmark Scheme Benchmark Additional
(`) (%)^ (%)# Returns (`) (`)# Benchmark(%)## (`)##
^Past performance may or may not be sustained in the future. Returns greater than 1 year period are compounded annualized (CAGR). # CRISIL Composite Bond Fund Index. ## CRISIL 1 year T-Bill IndexPerformance of FMP schemes, being close-ended in nature, is not strictly comparable with that of open-ended schemes since the investment strategy for FMP schemes is primarily buy-and-hold whereas open-ended schemes are actively managed.
A. Cumulative performance
Jun 28, 13 Last 1 Year 9.9808 8.63 4.57 5.89 10,868 10,460 10,593May 23, 13 Since Inception 10.0016 7.62 2.97 5.77 10,845 10,328 10,639
HDFC FMP 1107D MAY 2013 (1) NAV as at June 30, 2014 ` 10.8468
Period Scheme Benchmark Additional^ # Benchmark
##
B. Discrete 12 month returns (%)
Jun 28, 13 to Jun 30, 14 8.63 4.57 5.89
Date Period NAV Scheme Benchmark Additional Value of investment of ` 10,000@per Unit Returns Returns Benchmark Scheme Benchmark Additional
(`) (%)^ (%)# Returns (`) (`)# Benchmark(%)## (`)##
^Past performance may or may not be sustained in the future. Returns greater than 1 year period are compounded annualized (CAGR). # CRISIL Composite Bond Fund Index. ## CRISIL 1 year T-Bill IndexPerformance of FMP schemes, being close-ended in nature, is not strictly comparable with that of open-ended schemes since the investment strategy for FMP schemes is primarily buy-and-hold whereas open-ended schemes are actively managed.
A. Cumulative performance
Jun 28, 13 Last 1 Year 11.3916 8.91 4.57 5.89 10,896 10,460 10,593Jun 29, 12 Last 2 Years 10.2120 10.23 7.61 7.03 12,155 11,582 11,458Feb 15, 12 Since Inception 10.0000 9.54 7.62 7.24 12,412 11,903 11,804
HDFC FMP 1203D JANUARY 2012 (1) - GGROWTH OPTION NAV as at June 30, 2014 ` 12.4122
Period Scheme Benchmark Additional^ # Benchmark
##
B. Discrete 12 month returns (%)
Jun 28, 13 to Jun 30, 14 8.91 4.57 5.89Jun 29, 12 to Jun 28, 13 11.55 10.72 8.17
Date Period NAV Scheme Benchmark Additional Value of investment of ` 10,000@per Unit Returns Returns Benchmark Scheme Benchmark Additional
(`) (%)^ (%)# Returns (`) (`)# Benchmark(%)## (`)##
^Past performance may or may not be sustained in the future. Returns greater than 1 year period are compounded annualized (CAGR). # CRISIL Composite Bond Fund Index. ## CRISIL 1 year T-Bill IndexPerformance of FMP schemes, being close-ended in nature, is not strictly comparable with that of open-ended schemes since the investment strategy for FMP schemes is primarily buy-and-hold whereas open-ended schemes are actively managed.
A. Cumulative performance
Jun 28, 13 Last 1 Year 10.4506 7.42 4.57 5.89 10,746 10,460 10,593Jan 08, 13 Since Inception 10.0000 8.19 6.52 6.61 11,230 10,976 10,989
HDFC FMP 1919D JANUARY 2013 (1) NAV as at June 30, 2014 ` 11.2302
Period Scheme Benchmark Additional^ # Benchmark
##
B. Discrete 12 month returns (%)
Jun 28, 13 to Jun 30, 14 7.42 4.57 5.89

SCHEME PERFORMANCE - GROWTH OPTION (FUND MANAGER-WISE)
ANIL BAMBOLI
Date Period NAV Scheme Benchmark Additional Value of investment of ` 10,000@per Unit Returns Returns Benchmark Scheme Benchmark Additional
(`) (%)^ (%)# Returns (`) (`)# Benchmark(%)## (`) ##
^Past performance may or may not be sustained in the future. Returns greater than 1 year period are compounded annualized (CAGR). # CRISIL Liquid Fund Index ## CNX Nifty IndexScheme performance is not strictly comparable with that of its Additional Benchmark since the scheme does not take directional call in equity markets but is limited to availing arbitrage opportunities, etc.
A. Cumulative performance
Jun 28, 13 Last 1 Year 15.047 8.60 9.63 30.09 10,865 10,968 13,028Jun 29, 12 Last 2 Years 13.929 8.33 8.89 20.05 11,737 11,859 14,418Jun 30, 11 Last 3 Years 12.804 8.48 8.82 10.45 12,769 12,888 13,478Oct 23, 07 Since Inception 10.000 7.62 7.48 5.05 16,349 16,198 13,905
Period Scheme Benchmark Additional^ # Benchmark
##
B. Discrete 12 month returns (%)
Jun 28, 13 to Jun 30, 14 8.60 9.63 30.09
Jun 29, 12 to Jun 28, 13 8.03 8.12 10.67
Jun 30, 11 to Jun 29, 12 8.79 8.68 -6.53
HDFC ARBITRAGE FUND - WWHOLESALE PLAN NAV as at June 30, 2014 ` 16.349
Performance of dividend option under the schemes for the investors would be net of distribution tax as applicable. Load is not taken into consideration for computation of performance. N.A.: Not Available@ shows the current value of ` 10,000/- invested at the beginning of a given periodWhere either NAV or Benchmark Index value is not available for the start/end date of a concerned period, the previous date where both NAV and Benchmark Index value are available, is considered for returns computation except for since inception returns
Date Period NAV Scheme Benchmark Additional Value of investment of ` 10,000@per Unit Returns Returns Benchmark Scheme Benchmark Additional
(`) (%)^ (%)# Returns (`) (`)# Benchmark(%)## (`) ##
^Past performance may or may not be sustained in the future. Returns greater than 1 year period are compounded annualized (CAGR). # CRISIL MIP Blended Index ## CRISIL 1 year T-Bill IndexScheme performance may not strictly be comparable with that of its Additional Benchmark in view of hybrid nature of the scheme where a portion of scheme's investments are made in equity instruments. The Scheme is co-mmanaged by Vinay Kulkarni (Equities) and Anil Bamboli (Debt).
A. Cumulative performance
Jun 28, 13 Last 1 Year 21.0155 19.07 8.24 5.89 11,918 10,828 10,593Jun 29, 12 Last 2 Years 19.9122 12.14 9.54 7.03 12,578 12,001 11,458Jun 30, 11 Last 3 Years 18.3980 10.82 8.53 7.26 13,614 12,787 12,343Sep 17, 04 Since Inception 10.0000 9.83 8.03 5.65 25,046 21,296 17,132
Period Scheme Benchmark Additional^ # Benchmark
##
B. Discrete 12 month returns (%)
Jun 28, 13 to Jun 30, 14 19.07 8.24 5.89
Jun 29, 12 to Jun 28, 13 5.54 10.83 8.17
Jun 30, 11 to Jun 29, 12 8.23 6.54 7.73
HDFC MULTIPLE YIELD FUND NAV as at June 30, 2014 ` 25.0464
Intouchmutually June 2014 47
Date Period NAV Scheme Benchmark Additional Value of investment of ` 10,000@per Unit Returns Returns Benchmark Scheme Benchmark Additional
(`) (%)^ (%)# Returns (`) (`)# Benchmark(%)## (`) ##
^Past performance may or may not be sustained in the future. Returns greater than 1 year period are compounded annualized (CAGR). # CRISIL MIP Blended Index ## CRISIL 1 year T-Bill IndexScheme performance may not strictly be comparable with that of its Additional Benchmark in view of hybrid nature of the scheme where a portion of scheme's investments are made in equity instruments. The Scheme is co-mmanaged by Chirag Setalvad (Equities) and Anil Bamboli (Debt).
A. Cumulative performance
Jun 28, 13 Last 1 Year 19.1310 20.47 8.24 5.89 12,059 10,828 10,593Jun 29, 12 Last 2 Years 18.0659 12.98 9.54 7.03 12,770 12,001 11,458Jun 30, 11 Last 3 Years 16.7582 11.23 8.53 7.26 13,766 12,787 12,343Aug 17, 05 Since Inception 10.0000 9.88 7.88 5.73 23,070 19,595 16,399
Period Scheme Benchmark Additional^ # Benchmark
##
B. Discrete 12 month returns (%)
Jun 28, 13 to Jun 30, 14 20.47 8.24 5.89
Jun 29, 12 to Jun 28, 13 5.90 10.83 8.17
Jun 30, 11 to Jun 29, 12 7.80 6.54 7.73
HDFC MULTIPLE YIELD FUND - PPLAN 2005 NAV as at June 30, 2014 ` 23.0698
Date Period NAV Scheme Benchmark Additional Value of investment of ` 10,000@per Unit Returns Returns Benchmark Scheme Benchmark Additional
(`) (%)^ (%)# Returns (`) (`)# Benchmark(%)## (`) ##
^Past performance may or may not be sustained in the future. Returns greater than 1 year period are compounded annualized (CAGR). # CRISIL Balanced Fund Index ## CNX Nifty IndexScheme performance may not strictly be comparable with that of its Additional Benchmark in view of hybrid nature of the scheme where a portion of scheme's investments are made in equity instruments. The Scheme is co-mmanaged by Miten Lathia & Anil Bamboli
A. Cumulative performance
Jun 28, 13 Last 1 Year 11.4586 6.85 20.88 30.09 10,689 12,101 13,028Jun 29, 12 Last 2 Years 10.3094 8.98 15.82 20.05 11,880 13,420 14,418Feb 06, 12 Since Inception 10.0000 8.83 13.12 15.74 12,248 13,439 14,196
Period Scheme Benchmark Additional^ # Benchmark
##
B. Discrete 12 month returns (%)
Jun 28, 13 to Jun 30, 14 6.85 20.88 30.09Jun 29, 12 to Jun 28, 13 11.15 10.90 10.67
HDFC DYNAMIC PE RATIO FUND OF FUNDS NAV as at June 30, 2014 ` 12.2480
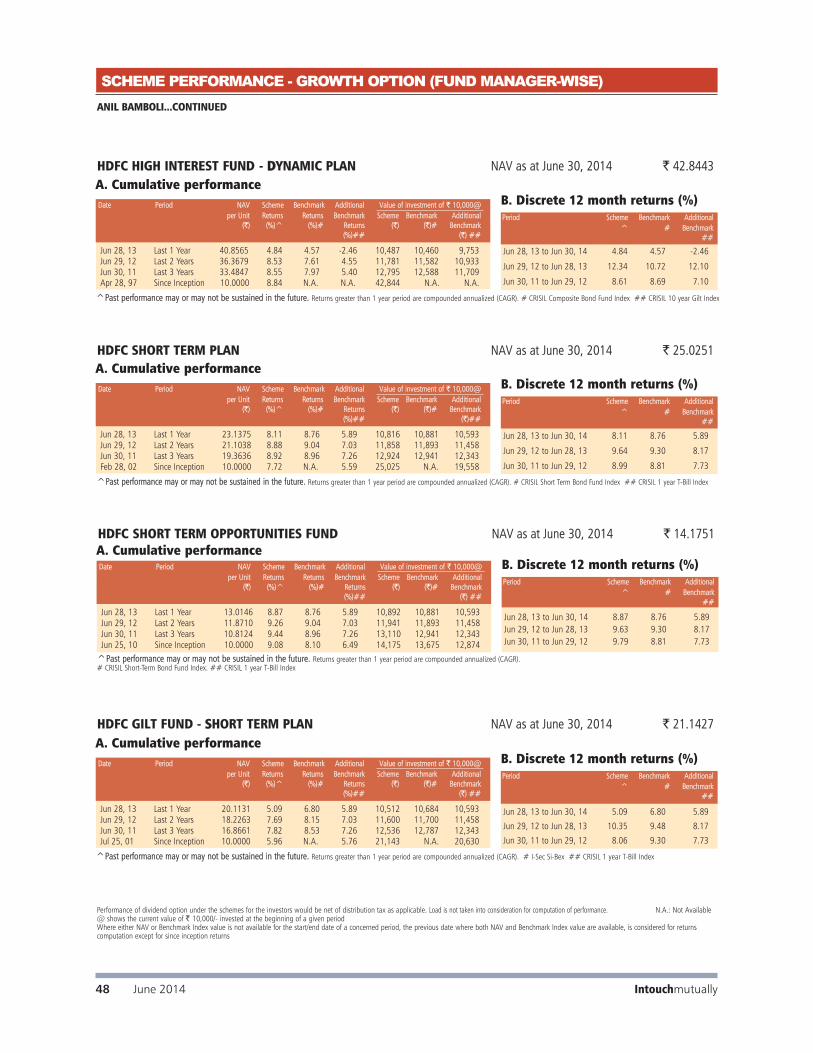
Performance of dividend option under the schemes for the investors would be net of distribution tax as applicable. Load is not taken into consideration for computation of performance. N.A.: Not Available@ shows the current value of ` 10,000/- invested at the beginning of a given periodWhere either NAV or Benchmark Index value is not available for the start/end date of a concerned period, the previous date where both NAV and Benchmark Index value are available, is considered for returns computation except for since inception returns
SCHEME PERFORMANCE - GROWTH OPTION (FUND MANAGER-WISE) ANIL BAMBOLI...CONTINUED
Date Period NAV Scheme Benchmark Additional Value of investment of ` 10,000@per Unit Returns Returns Benchmark Scheme Benchmark Additional
(`) (%)^ (%)# Returns (`) (`)# Benchmark(%)## (`)##
^Past performance may or may not be sustained in the future. Returns greater than 1 year period are compounded annualized (CAGR). # CRISIL Short Term Bond Fund Index ## CRISIL 1 year T-Bill Index
A. Cumulative performance
Jun 28, 13 Last 1 Year 23.1375 8.11 8.76 5.89 10,816 10,881 10,593Jun 29, 12 Last 2 Years 21.1038 8.88 9.04 7.03 11,858 11,893 11,458Jun 30, 11 Last 3 Years 19.3636 8.92 8.96 7.26 12,924 12,941 12,343Feb 28, 02 Since Inception 10.0000 7.72 N.A. 5.59 25,025 N.A. 19,558
Period Scheme Benchmark Additional^ # Benchmark
##
B. Discrete 12 month returns (%)
Jun 28, 13 to Jun 30, 14 8.11 8.76 5.89
Jun 29, 12 to Jun 28, 13 9.64 9.30 8.17
Jun 30, 11 to Jun 29, 12 8.99 8.81 7.73
HDFC SHORT TERM PLAN NAV as at June 30, 2014 ` 25.0251
Date Period NAV Scheme Benchmark Additional Value of investment of ` 10,000@per Unit Returns Returns Benchmark Scheme Benchmark Additional
(`) (%)^ (%)# Returns (`) (`)# Benchmark(%)## (`) ##
^Past performance may or may not be sustained in the future. Returns greater than 1 year period are compounded annualized (CAGR). # CRISIL Composite Bond Fund Index ## CRISIL 10 year Gilt Index
A. Cumulative performance
Jun 28, 13 Last 1 Year 40.8565 4.84 4.57 -2.46 10,487 10,460 9,753Jun 29, 12 Last 2 Years 36.3679 8.53 7.61 4.55 11,781 11,582 10,933Jun 30, 11 Last 3 Years 33.4847 8.55 7.97 5.40 12,795 12,588 11,709Apr 28, 97 Since Inception 10.0000 8.84 N.A. N.A. 42,844 N.A. N.A.
Period Scheme Benchmark Additional^ # Benchmark
##
B. Discrete 12 month returns (%)
Jun 28, 13 to Jun 30, 14 4.84 4.57 -2.46
Jun 29, 12 to Jun 28, 13 12.34 10.72 12.10
Jun 30, 11 to Jun 29, 12 8.61 8.69 7.10
HDFC HIGH INTEREST FUND - DDYNAMIC PLAN NAV as at June 30, 2014 ` 42.8443
Period Scheme Benchmark Additional^ # Benchmark
##
B. Discrete 12 month returns (%)
Jun 28, 13 to Jun 30, 14 8.87 8.76 5.89Jun 29, 12 to Jun 28, 13 9.63 9.30 8.17Jun 30, 11 to Jun 29, 12 9.79 8.81 7.73
Date Period NAV Scheme Benchmark Additional Value of investment of ` 10,000@per Unit Returns Returns Benchmark Scheme Benchmark Additional
(`) (%)^ (%)# Returns (`) (`)# Benchmark(%)## (`) ##
^Past performance may or may not be sustained in the future. Returns greater than 1 year period are compounded annualized (CAGR). # CRISIL Short-Term Bond Fund Index. ## CRISIL 1 year T-Bill Index
A. Cumulative performance
Jun 28, 13 Last 1 Year 13.0146 8.87 8.76 5.89 10,892 10,881 10,593Jun 29, 12 Last 2 Years 11.8710 9.26 9.04 7.03 11,941 11,893 11,458Jun 30, 11 Last 3 Years 10.8124 9.44 8.96 7.26 13,110 12,941 12,343Jun 25, 10 Since Inception 10.0000 9.08 8.10 6.49 14,175 13,675 12,874
HDFC SHORT TERM OPPORTUNITIES FUND NAV as at June 30, 2014 ` 14.1751
Intouchmutually48 June 2014
Date Period NAV Scheme Benchmark Additional Value of investment of ` 10,000@per Unit Returns Returns Benchmark Scheme Benchmark Additional
(`) (%)^ (%)# Returns (`) (`)# Benchmark(%)## (`) ##
^Past performance may or may not be sustained in the future. Returns greater than 1 year period are compounded annualized (CAGR). # I-Sec Si-Bex ## CRISIL 1 year T-Bill Index
A. Cumulative performance
Jun 28, 13 Last 1 Year 20.1131 5.09 6.80 5.89 10,512 10,684 10,593Jun 29, 12 Last 2 Years 18.2263 7.69 8.15 7.03 11,600 11,700 11,458Jun 30, 11 Last 3 Years 16.8661 7.82 8.53 7.26 12,536 12,787 12,343Jul 25, 01 Since Inception 10.0000 5.96 N.A. 5.76 21,143 N.A. 20,630
Period Scheme Benchmark Additional^ # Benchmark
##
B. Discrete 12 month returns (%)
Jun 28, 13 to Jun 30, 14 5.09 6.80 5.89
Jun 29, 12 to Jun 28, 13 10.35 9.48 8.17
Jun 30, 11 to Jun 29, 12 8.06 9.30 7.73
HDFC GILT FUND - SSHORT TERM PLAN NAV as at June 30, 2014 ` 21.1427

Performance of dividend option under the schemes for the investors would be net of distribution tax as applicable. Load is not taken into consideration for computation of performance. N.A.: Not Available@ shows the current value of ` 10,000/- invested at the beginning of a given periodWhere either NAV or Benchmark Index value is not available for the start/end date of a concerned period, the previous date where both NAV and Benchmark Index value are available, is considered for returns computation except for since inception returns
ANIL BAMBOLI...CONTINUED
SCHEME PERFORMANCE - GROWTH OPTION (FUND MANAGER-WISE)
Date Period NAV Scheme Benchmark Additional Value of investment of ` 10,000@per Unit Returns Returns Benchmark Scheme Benchmark Additional
(`) (%)^$$ (%)# Returns (`) $$ (`)# Benchmark(%)## (`)##
^Past performance may or may not be sustained in the future. Returns greater than 1 year period are compounded annualized (CAGR). # CRISIL Liquid Fund Index ## CRISIL 1 year T-Bill Index$$ All dividends declared prior to the splitting of the Scheme into Dividend & Growth Options are assumed to be reinvested in the units of the Scheme at the then prevailing NAV (ex-dividend NAV).
A. Cumulative performance
Jun 23, 14 Last 7 days 27.3381 0.16 0.17 0.15 10,016 10,017 10,015Jun 15, 14 Last 15 days 27.2873 0.35 N.A. N.A. 10,035 N.A. N.A.May 30, 14 Last 1 Month 27.1846 0.73 0.72 0.63 10,073 10,072 10,063Jun 28, 13 Last 1 Year 25.0174 9.40 9.63 5.89 10,946 10,968 10,593Jun 29, 12 Last 2 Years 22.9656 9.18 8.89 7.03 11,923 11,859 11,458Jun 30, 11 Last 3 Years 20.9293 9.36 8.82 7.26 13,084 12,888 12,343Nov 18, 99 Since Inception 10.0000 7.16 N.A. 6.24 27,476 N.A. 24,241
Period Scheme Benchmark Additional^$$ # Benchmark
##
B. Discrete 12 month returns (%)
Jun 28, 13 to Jun 30, 14 9.40 9.63 5.89
Jun 29, 12 to Jun 28, 13 8.93 8.12 8.17
Jun 30, 11 to Jun 29, 12 9.73 8.68 7.73
HDFC CASH MANAGEMENT FUND - SSAVINGS PLAN NAV as at June 30, 2014 ` 27.3830
Date Period NAV Scheme Benchmark Additional Value of investment of ` 10,000@per Unit Returns Returns Benchmark Scheme Benchmark Additional
(`) (%)^ (%)# Returns (`) (`)# Benchmark(%)## (`) ##
^Past performance may or may not be sustained in the future. Returns greater than 1 year period are compounded annualized (CAGR). # I-Sec Li-Bex ## CRISIL 10 year Gilt Index
A. Cumulative performance
Jun 28, 13 Last 1 Year 24.4948 0.88 1.70 -2.46 10,089 10,171 9,753Jun 29, 12 Last 2 Years 21.6419 6.85 7.90 4.55 11,419 11,645 10,933Jun 30, 11 Last 3 Years 19.9876 7.32 8.50 5.40 12,364 12,776 11,709Jul 25, 01 Since Inception 10.0000 7.24 N.A. N.A. 24,712 N.A. N.A.
Period Scheme Benchmark Additional^ # Benchmark
##
B. Discrete 12 month returns (%)
Jun 28, 13 to Jun 30, 14 0.88 1.70 -2.46
Jun 29, 12 to Jun 28, 13 13.18 14.46 12.10
Jun 30, 11 to Jun 29, 12 8.28 9.72 7.10
HDFC GILT FUND - LLONG TERM PLAN NAV as at June 30, 2014 ` 24.7123
Date Period NAV Scheme Benchmark Additional Value of investment of ` 10,000@per Unit Returns Returns Benchmark Scheme Benchmark Additional
(`) (%)^ (%)# Returns (`) (`)# Benchmark(%)## (`) ##
^Past performance may or may not be sustained in the future. Returns greater than 1 year period are compounded annualized (CAGR). # I-Sec Composite Index ## CRISIL 10 year Gilt Index
A. Cumulative performance
Jun 28, 13 Last 1 Year 10.5566 1.41 4.09 -2.46 10,141 10,411 9,753
Mar 04, 13 Since Inception 10.0000 5.29 6.19 1.23 10,706 10,827 10,163
Period Scheme Benchmark Additional^ # Benchmark
##
B. Discrete 12 month returns (%)
Jun 28, 13 to Jun 30, 14 1.41 4.09 -2.46
HDFC INFLATION INDEXED BOND FUND NAV as at June 30, 2014 ` 10.7058
Date Period NAV Scheme Benchmark Additional Value of investment of ` 10,000@per Unit Returns Returns Benchmark Scheme Benchmark Additional
(`) (%)^ (%)# Returns (`) (`)# Benchmark(%)## (`) ##
^Past performance may or may not be sustained in the future. Returns greater than 1 year period are compounded annualized (CAGR). # CRISIL Liquid Fund Index ## CRISIL 1 year T-Bill Index
A. Cumulative performance
Jun 28, 13 Last 1 Year 25.6320 8.42 9.63 5.89 10,847 10,968 10,593Jun 29, 12 Last 2 Years 23.6915 8.32 8.89 7.03 11,736 11,859 11,458Jun 30, 11 Last 3 Years 21.7117 8.58 8.82 7.26 12,806 12,888 12,343Nov 18, 99 Since Inception 10.0000 7.24 N.A. 6.24 27,804 N.A. 24,241
Period Scheme Benchmark Additional^ # Benchmark
##
B. Discrete 12 month returns (%)
Jun 28, 13 to Jun 30, 14 8.42 9.63 5.89
Jun 29, 12 to Jun 28, 13 8.19 8.12 8.17
Jun 30, 11 to Jun 29, 12 9.12 8.68 7.73
HDFC CASH MANAGEMENT FUND - TTREASURY ADVANTAGE PLAN - RRETAIL OPTIONNAV as at June 30, 2014 ` 27.8035
Intouchmutually June 2014 49
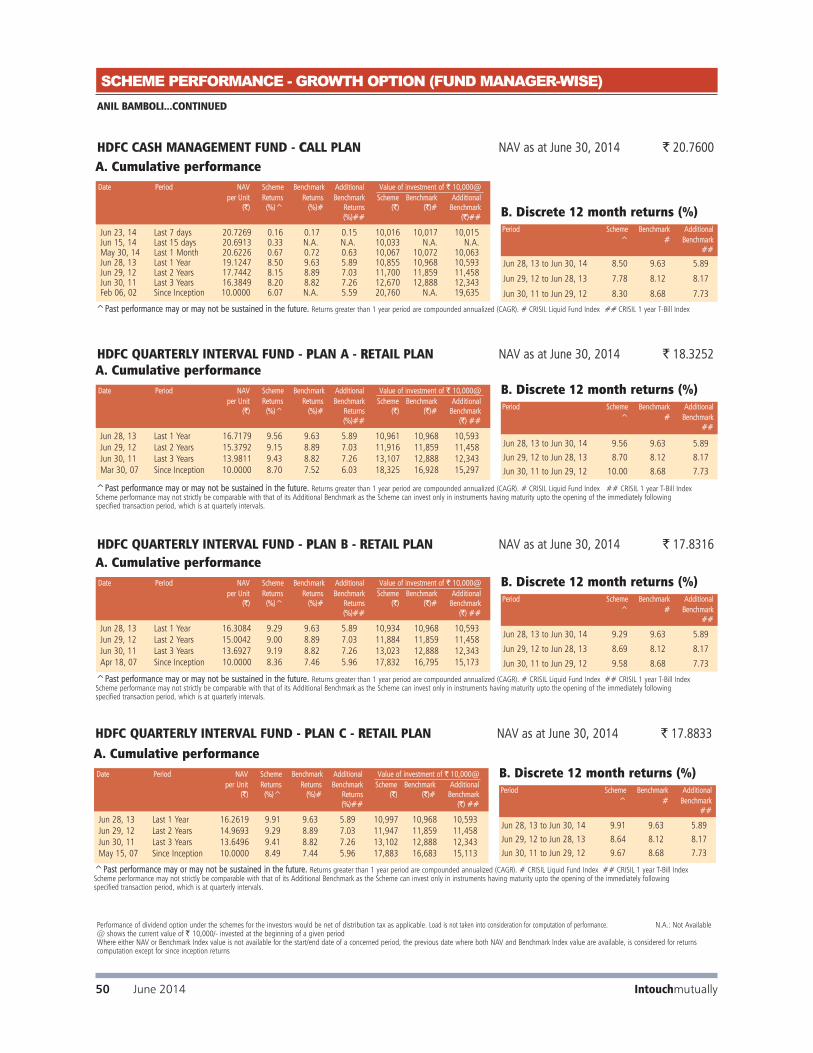
ANIL BAMBOLI...CONTINUED
SCHEME PERFORMANCE - GROWTH OPTION (FUND MANAGER-WISE)
Performance of dividend option under the schemes for the investors would be net of distribution tax as applicable. Load is not taken into consideration for computation of performance. N.A.: Not Available@ shows the current value of ` 10,000/- invested at the beginning of a given periodWhere either NAV or Benchmark Index value is not available for the start/end date of a concerned period, the previous date where both NAV and Benchmark Index value are available, is considered for returns computation except for since inception returns
Date Period NAV Scheme Benchmark Additional Value of investment of ` 10,000@per Unit Returns Returns Benchmark Scheme Benchmark Additional
(`) (%)^ (%)# Returns (`) (`)# Benchmark(%)## (`) ##
^Past performance may or may not be sustained in the future. Returns greater than 1 year period are compounded annualized (CAGR). # CRISIL Liquid Fund Index ## CRISIL 1 year T-Bill IndexScheme performance may not strictly be comparable with that of its Additional Benchmark as the Scheme can invest only in instruments having maturity upto the opening of the immediately following specified transaction period, which is at quarterly intervals.
A. Cumulative performance
Jun 28, 13 Last 1 Year 16.3084 9.29 9.63 5.89 10,934 10,968 10,593Jun 29, 12 Last 2 Years 15.0042 9.00 8.89 7.03 11,884 11,859 11,458Jun 30, 11 Last 3 Years 13.6927 9.19 8.82 7.26 13,023 12,888 12,343Apr 18, 07 Since Inception 10.0000 8.36 7.46 5.96 17,832 16,795 15,173
Period Scheme Benchmark Additional^ # Benchmark
##
B. Discrete 12 month returns (%)
Jun 28, 13 to Jun 30, 14 9.29 9.63 5.89
Jun 29, 12 to Jun 28, 13 8.69 8.12 8.17
Jun 30, 11 to Jun 29, 12 9.58 8.68 7.73
HDFC QUARTERLY INTERVAL FUND - PPLAN B - RRETAIL PLAN NAV as at June 30, 2014 ` 17.8316
Date Period NAV Scheme Benchmark Additional Value of investment of ` 10,000@per Unit Returns Returns Benchmark Scheme Benchmark Additional
(`) (%)^ (%)# Returns (`) (`)# Benchmark(%)## (`) ##
^Past performance may or may not be sustained in the future. Returns greater than 1 year period are compounded annualized (CAGR). # CRISIL Liquid Fund Index ## CRISIL 1 year T-Bill IndexScheme performance may not strictly be comparable with that of its Additional Benchmark as the Scheme can invest only in instruments having maturity upto the opening of the immediately following specified transaction period, which is at quarterly intervals.
Jun 28, 13 Last 1 Year 16.7179 9.56 9.63 5.89 10,961 10,968 10,593Jun 29, 12 Last 2 Years 15.3792 9.15 8.89 7.03 11,916 11,859 11,458Jun 30, 11 Last 3 Years 13.9811 9.43 8.82 7.26 13,107 12,888 12,343Mar 30, 07 Since Inception 10.0000 8.70 7.52 6.03 18,325 16,928 15,297
Period Scheme Benchmark Additional^ # Benchmark
##
B. Discrete 12 month returns (%)
Jun 28, 13 to Jun 30, 14 9.56 9.63 5.89
Jun 29, 12 to Jun 28, 13 8.70 8.12 8.17
Jun 30, 11 to Jun 29, 12 10.00 8.68 7.73
HDFC QUARTERLY INTERVAL FUND - PPLAN A - RRETAIL PLAN NAV as at June 30, 2014 ` 18.3252A. Cumulative performance
Date Period NAV Scheme Benchmark Additional Value of investment of ` 10,000@per Unit Returns Returns Benchmark Scheme Benchmark Additional
(`) (%)^ (%)# Returns (`) (`)# Benchmark(%)## (`)##
^Past performance may or may not be sustained in the future. Returns greater than 1 year period are compounded annualized (CAGR). # CRISIL Liquid Fund Index ## CRISIL 1 year T-Bill Index
A. Cumulative performance
Jun 23, 14 Last 7 days 20.7269 0.16 0.17 0.15 10,016 10,017 10,015Jun 15, 14 Last 15 days 20.6913 0.33 N.A. N.A. 10,033 N.A. N.A.May 30, 14 Last 1 Month 20.6226 0.67 0.72 0.63 10,067 10,072 10,063Jun 28, 13 Last 1 Year 19.1247 8.50 9.63 5.89 10,855 10,968 10,593Jun 29, 12 Last 2 Years 17.7442 8.15 8.89 7.03 11,700 11,859 11,458Jun 30, 11 Last 3 Years 16.3849 8.20 8.82 7.26 12,670 12,888 12,343Feb 06, 02 Since Inception 10.0000 6.07 N.A. 5.59 20,760 N.A. 19,635
Period Scheme Benchmark Additional^ # Benchmark
##
B. Discrete 12 month returns (%)
Jun 28, 13 to Jun 30, 14 8.50 9.63 5.89
Jun 29, 12 to Jun 28, 13 7.78 8.12 8.17
Jun 30, 11 to Jun 29, 12 8.30 8.68 7.73
HDFC CASH MANAGEMENT FUND - CCALL PLAN NAV as at June 30, 2014 ` 20.7600
Date Period NAV Scheme Benchmark Additional Value of investment of ` 10,000@per Unit Returns Returns Benchmark Scheme Benchmark Additional
(`) (%)^ (%)# Returns (`) (`)# Benchmark(%)## (`) ##
^Past performance may or may not be sustained in the future. Returns greater than 1 year period are compounded annualized (CAGR). # CRISIL Liquid Fund Index ## CRISIL 1 year T-Bill IndexScheme performance may not strictly be comparable with that of its Additional Benchmark as the Scheme can invest only in instruments having maturity upto the opening of the immediately following specified transaction period, which is at quarterly intervals.
Jun 28, 13 Last 1 Year 16.2619 9.91 9.63 5.89 10,997 10,968 10,593Jun 29, 12 Last 2 Years 14.9693 9.29 8.89 7.03 11,947 11,859 11,458Jun 30, 11 Last 3 Years 13.6496 9.41 8.82 7.26 13,102 12,888 12,343May 15, 07 Since Inception 10.0000 8.49 7.44 5.96 17,883 16,683 15,113
Period Scheme Benchmark Additional^ # Benchmark
##
B. Discrete 12 month returns (%)
Jun 28, 13 to Jun 30, 14 9.91 9.63 5.89Jun 29, 12 to Jun 28, 13 8.64 8.12 8.17Jun 30, 11 to Jun 29, 12 9.67 8.68 7.73
HDFC QUARTERLY INTERVAL FUND - PPLAN C - RRETAIL PLAN NAV as at June 30, 2014 ` 17.8833
A. Cumulative performance
Intouchmutually50 June 2014
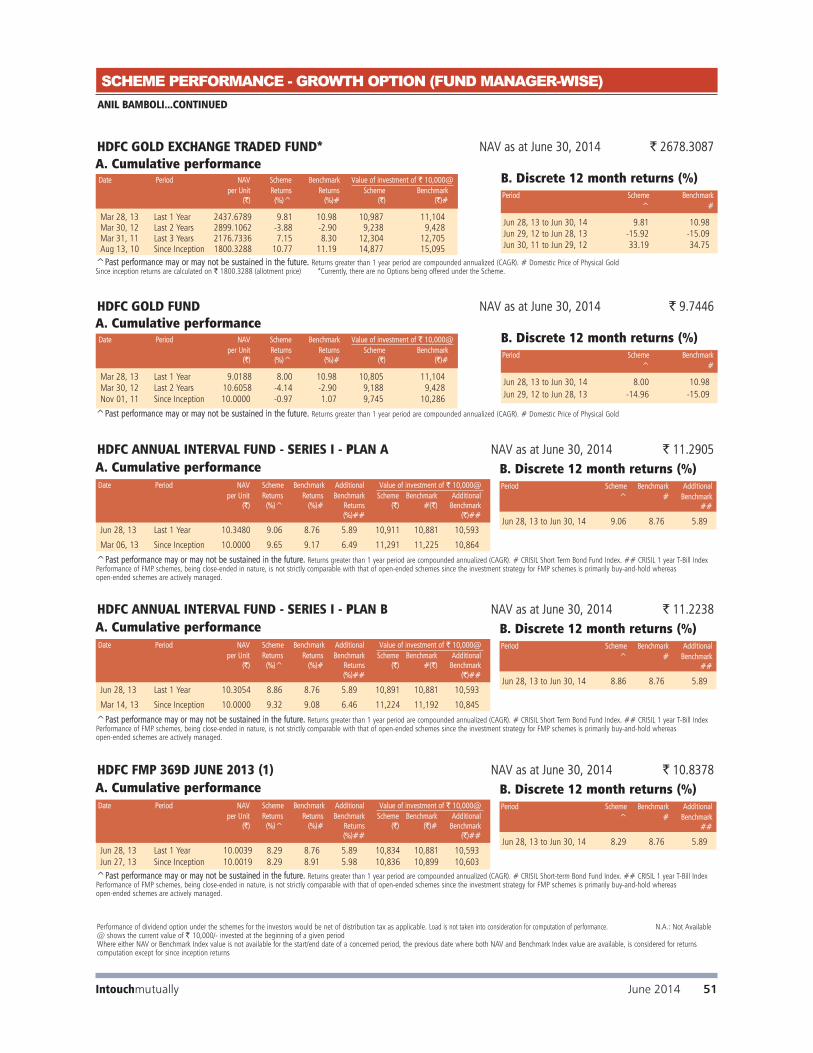
SCHEME PERFORMANCE - GROWTH OPTION (FUND MANAGER-WISE)
Performance of dividend option under the schemes for the investors would be net of distribution tax as applicable. Load is not taken into consideration for computation of performance. N.A.: Not Available@ shows the current value of ` 10,000/- invested at the beginning of a given periodWhere either NAV or Benchmark Index value is not available for the start/end date of a concerned period, the previous date where both NAV and Benchmark Index value are available, is considered for returns computation except for since inception returns
Period Scheme Benchmark^ #
B. Discrete 12 month returns (%)
Jun 28, 13 to Jun 30, 14 9.81 10.98Jun 29, 12 to Jun 28, 13 -15.92 -15.09Jun 30, 11 to Jun 29, 12 33.19 34.75
Date Period NAV Scheme Benchmark Value of investment of ` 10,000@per Unit Returns Returns Scheme Benchmark
(`) (%)^ (%)# (`) (`)#
^Past performance may or may not be sustained in the future. Returns greater than 1 year period are compounded annualized (CAGR). # Domestic Price of Physical GoldSince inception returns are calculated on ` 1800.3288 (allotment price) *Currently, there are no Options being offered under the Scheme.
A. Cumulative performance
Mar 28, 13 Last 1 Year 2437.6789 9.81 10.98 10,987 11,104Mar 30, 12 Last 2 Years 2899.1062 -3.88 -2.90 9,238 9,428Mar 31, 11 Last 3 Years 2176.7336 7.15 8.30 12,304 12,705Aug 13, 10 Since Inception 1800.3288 10.77 11.19 14,877 15,095
HDFC GOLD EXCHANGE TRADED FUND* NAV as at June 30, 2014 ` 2678.3087
Period Scheme Benchmark^ #
B. Discrete 12 month returns (%)
Jun 28, 13 to Jun 30, 14 8.00 10.98Jun 29, 12 to Jun 28, 13 -14.96 -15.09
Date Period NAV Scheme Benchmark Value of investment of ` 10,000@per Unit Returns Returns Scheme Benchmark
(`) (%)^ (%)# (`) (`)#
^Past performance may or may not be sustained in the future. Returns greater than 1 year period are compounded annualized (CAGR). # Domestic Price of Physical Gold
A. Cumulative performance
Mar 28, 13 Last 1 Year 9.0188 8.00 10.98 10,805 11,104Mar 30, 12 Last 2 Years 10.6058 -4.14 -2.90 9,188 9,428Nov 01, 11 Since Inception 10.0000 -0.97 1.07 9,745 10,286
HDFC GOLD FUND NAV as at June 30, 2014 ` 9.7446
ANIL BAMBOLI...CONTINUED
Date Period NAV Scheme Benchmark Additional Value of investment of ` 10,000@per Unit Returns Returns Benchmark Scheme Benchmark Additional
(`) (%)^ (%)# Returns (`) #(`) Benchmark(%)## (`)##
^Past performance may or may not be sustained in the future. Returns greater than 1 year period are compounded annualized (CAGR). # CRISIL Short Term Bond Fund Index. ## CRISIL 1 year T-Bill IndexPerformance of FMP schemes, being close-ended in nature, is not strictly comparable with that of open-ended schemes since the investment strategy for FMP schemes is primarily buy-and-hold whereas open-ended schemes are actively managed.
A. Cumulative performance
Jun 28, 13 Last 1 Year 10.3480 9.06 8.76 5.89 10,911 10,881 10,593
Mar 06, 13 Since Inception 10.0000 9.65 9.17 6.49 11,291 11,225 10,864
HDFC ANNUAL INTERVAL FUND - SSERIES I - PPLAN A NAV as at June 30, 2014 ` 11.2905
Period Scheme Benchmark Additional^ # Benchmark
##
B. Discrete 12 month returns (%)
Jun 28, 13 to Jun 30, 14 9.06 8.76 5.89
Date Period NAV Scheme Benchmark Additional Value of investment of ` 10,000@per Unit Returns Returns Benchmark Scheme Benchmark Additional
(`) (%)^ (%)# Returns (`) #(`) Benchmark(%)## (`)##
^Past performance may or may not be sustained in the future. Returns greater than 1 year period are compounded annualized (CAGR). # CRISIL Short Term Bond Fund Index. ## CRISIL 1 year T-Bill IndexPerformance of FMP schemes, being close-ended in nature, is not strictly comparable with that of open-ended schemes since the investment strategy for FMP schemes is primarily buy-and-hold whereas open-ended schemes are actively managed.
A. Cumulative performance
Jun 28, 13 Last 1 Year 10.3054 8.86 8.76 5.89 10,891 10,881 10,593
Mar 14, 13 Since Inception 10.0000 9.32 9.08 6.46 11,224 11,192 10,845
HDFC ANNUAL INTERVAL FUND - SSERIES I - PPLAN B NAV as at June 30, 2014 ` 11.2238
Period Scheme Benchmark Additional^ # Benchmark
##
B. Discrete 12 month returns (%)
Jun 28, 13 to Jun 30, 14 8.86 8.76 5.89
Intouchmutually June 2014 51
Date Period NAV Scheme Benchmark Additional Value of investment of ` 10,000@per Unit Returns Returns Benchmark Scheme Benchmark Additional
(`) (%)^ (%)# Returns (`) (`)# Benchmark(%)## (`)##
^Past performance may or may not be sustained in the future. Returns greater than 1 year period are compounded annualized (CAGR). # CRISIL Short-term Bond Fund Index. ## CRISIL 1 year T-Bill IndexPerformance of FMP schemes, being close-ended in nature, is not strictly comparable with that of open-ended schemes since the investment strategy for FMP schemes is primarily buy-and-hold whereas open-ended schemes are actively managed.
A. Cumulative performance
Jun 28, 13 Last 1 Year 10.0039 8.29 8.76 5.89 10,834 10,881 10,593Jun 27, 13 Since Inception 10.0019 8.29 8.91 5.98 10,836 10,899 10,603
HDFC FMP 369D JUNE 2013 (1) NAV as at June 30, 2014 ` 10.8378
Period Scheme Benchmark Additional^ # Benchmark
##
B. Discrete 12 month returns (%)
Jun 28, 13 to Jun 30, 14 8.29 8.76 5.89

SCHEME PERFORMANCE - DIRECT PLAN - GROWTH OPTION (FUND MANAGER-WISE)
Date Period NAV Scheme Benchmark Additional Value of investment of ` 10,000@per Unit Returns Returns Benchmark Scheme Benchmark Additional
(`) (%)^ (%)# Returns (`) #(`) Benchmark##(%) (`) ##
^Past performance may or may not be sustained in the future. Returns greater than 1 year period are compounded annualized (CAGR). # CNX 500 Index ## CNX Nifty Index
A. Cumulative performance
Jun 28, 13 Last 1 Year 269.278 58.51 36.64 30.09 15,891 13,687 13,028Jan 01, 13 Since Inception 296.876 27.74 18.59 17.92 14,414 12,900 12,790
Period Scheme Benchmark Additional^ # Benchmark
##
B. Discrete 12 month returns (%)
Jun 28, 13 to Jun 30, 14 58.51 36.64 30.09
HDFC EQUITY FUND NAV as at June 30, 2014 ` 427.915
Date Period NAV Scheme Benchmark Additional Value of investment of ` 10,000@per Unit Returns Returns Benchmark Scheme Benchmark Additional
(`) (%)^ (%)# Returns (`) #(`) Benchmark(%)## (`) ##
^Past performance may or may not be sustained in the future. Returns greater than 1 year period are compounded annualized (CAGR). # S&P BSE 200 ## S&P BSE SENSEX
A. Cumulative performance
Jun 28, 13 Last 1 Year 211.331 49.46 34.23 30.83 14,979 13,445 13,103Jan 01, 13 Since Inception 228.943 24.23 17.81 19.08 13,827 12,772 12,979
Period Scheme Benchmark Additional^ # Benchmark
##
B. Discrete 12 month returns (%)
Jun 28, 13 to Jun 30, 14 49.46 34.23 30.83
HDFC TOP 200 FUND NAV as at June 30, 2014 ` 316.552
PRASHANT JAIN
Date Period NAV Scheme Benchmark Additional Value of investment of ` 10,000@per Unit Returns Returns Benchmark Scheme Benchmark Additional
(`) (%)^ (%)# Returns (`) #(`) Benchmark(%)## (`) ##
^Past performance may or may not be sustained in the future. Returns greater than 1 year period are compounded annualized (CAGR). # CNX 500 Index ## CNX Nifty Index The Scheme is co-mmanaged by Prashant Jain and Srinivas Rao Ravuri.
A. Cumulative performance
Jun 28, 13 Last 1 Year 8.694 72.07 36.64 30.09 17,258 13,687 13,028Jan 01, 13 Since Inception 11.152 21.98 18.59 17.92 13,454 12,900 12,790
Period Scheme Benchmark Additional^ # Benchmark
##
B. Discrete 12 month returns (%)
Jun 28, 13 to Jun 30, 14 72.07 36.64 30.09
HDFC INFRASTRUCTURE FUND NAV as at June 30, 2014 ` 15.004
Date Period NAV Scheme Benchmark Additional Value of investment of ` 10,000@per Unit Returns Returns Benchmark Scheme Benchmark Additional
(`) (%)^ (%)# Returns (`) #(`) Benchmark(%)## (`) ##
^Past performance may or may not be sustained in the future. Returns greater than 1 year period are compounded annualized (CAGR). # CRISIL Balanced Fund Index ## CNX Nifty IndexScheme performance may not strictly be comparable with that of its Additional Benchmark in view of balanced nature of the scheme where a portion of scheme's investments are made in debt instruments
A. Cumulative performance
Jun 28, 13 Last 1 Year 223.449 52.24 20.88 30.09 15,259 12,101 13,028Jan 01, 13 Since Inception 243.322 25.35 14.20 17.92 14,013 12,194 12,790
Period Scheme Benchmark Additional^ # Benchmark
##
B. Discrete 12 month returns (%)
Jun 28, 13 to Jun 30, 14 52.24 20.88 30.09
HDFC PRUDENCE FUND NAV as at June 30, 2014 ` 340.956
Performance of dividend option under the schemes for the investors would be net of distribution tax as applicable. Load is not taken into consideration for computation of performance. N.A.: Not Available@ shows the current value of ` 10,000/- invested at the beginning of a given periodWhere either NAV or Benchmark Index value is not available for the start/end date of a concerned period, the previous date where both NAV and Benchmark Index value are available, is considered for returns computation except for since inception returns
Date Period NAV Scheme Benchmark Additional Value of investment of ` 10,000@per Unit Returns Returns Benchmark Scheme Benchmark Additional
(`) (%)^ (%)# Returns (`) #(`) Benchmark(%)## (`) ##
^Past performance may or may not be sustained in the future. Returns greater than 1 year period are compounded annualized (CAGR). # CRISIL MIP Blended Index ## CRISIL 10 year Gilt IndexScheme performance may not strictly be comparable with that of its Additional Benchmark in view of hybrid nature of the scheme where a portion of scheme's investments are made in equity instruments.
The Scheme is co-mmanaged by Prashant Jain (Equities) and Shobhit Mehrotra (Debt).
A. Cumulative performance
Jun 28, 13 Last 1 Year 26.7598 18.64 8.24 -2.46 11,875 10,828 9,753Jan 01, 13 Since Inception 26.4746 13.01 8.54 2.50 12,003 11,302 10,375
Period Scheme Benchmark Additional^ # Benchmark
##
B. Discrete 12 month returns (%)
Jun 28, 13 to Jun 30, 14 18.64 8.24 -2.46
HDFC MF MIP LONG TERM PLAN NAV as at June 30, 2014 ` 31.7772
Intouchmutually52 June 2014

VINAY KULKARNI
Date Period NAV Scheme Benchmark Additional Value of investment of ` 10,000@per Unit Returns Returns Benchmark Scheme Benchmark Additional
(`) (%)^ (%)# Returns (`) (`)# Benchmark(%)## (`) ##
^Past performance may or may not be sustained in the future. Returns greater than 1 year period are compounded annualized (CAGR). # S&P BSE SENSEX (Total Returns Index) ## CNX Nifty Index
A. Cumulative performance
Jun 28, 13 Last 1 Year 163.2244 32.05 32.67 30.09 13,225 13,287 13,028Jan 01, 13 Since Inception 163.6338 20.39 20.99 17.92 13,192 13,291 12,790
Period Scheme Benchmark Additional^ # Benchmark
##
B. Discrete 12 month returns (%)
Jun 28, 13 to Jun 30, 14 32.05 32.67 30.09
HDFC INDEX FUND - SSENSEX PLAN NAV as at June 30, 2014 ` 215.8652
Date Period NAV Scheme Benchmark Additional Value of investment of ` 10,000@per Unit Returns Returns Benchmark Scheme Benchmark Additional
(`) (%)^ (%)# Returns (`) (`)# Benchmark(%)## (`) ##
^Past performance may or may not be sustained in the future. Returns greater than 1 year period are compounded annualized (CAGR). # CNX 500 Index ## CNX Nifty Index
A. Cumulative performance
Jun 28, 13 Last 1 Year 24.378 62.96 36.64 30.09 16,340 13,687 13,028Jan 01, 13 Since Inception 28.957 23.81 18.59 17.92 13,756 12,900 12,790
Period Scheme Benchmark Additional^ # Benchmark
##
B. Discrete 12 month returns (%)
Jun 28, 13 to Jun 30, 14 62.96 36.64 30.09
HDFC PREMIER MULTI-CCAP FUND NAV as at June 30, 2014 ` 39.834
Date Period NAV Scheme Benchmark Additional Value of investment of ` 10,000@per Unit Returns Returns Benchmark Scheme Benchmark Additional
(`) (%)^ (%)# Returns (`) (`)# Benchmark(%)## (`) ##
^Past performance may or may not be sustained in the future. Returns greater than 1 year period are compounded annualized (CAGR). # S&P BSE 200 ## S&P BSE SENSEX
A. Cumulative performance
Jun 28, 13 Last 1 Year 33.614 65.73 34.23 30.83 16,619 13,445 13,103Jan 01, 13 Since Inception 40.302 24.44 17.81 19.08 13,861 12,772 12,979
Period Scheme Benchmark Additional^ # Benchmark
##
B. Discrete 12 month returns (%)
Jun 28, 13 to Jun 30, 14 65.73 34.23 30.83
HDFC CORE & SATELLITE FUND NAV as at June 30, 2014 ` 55.862
SCHEME PERFORMANCE - DIRECT PLAN - GROWTH OPTION (FUND MANAGER-WISE)
Date Period NAV Scheme Benchmark Additional Value of investment of ` 10,000@per Unit Returns Returns Benchmark Scheme Benchmark Additional
(`) (%)^ (%)# Returns (`) (`)# Benchmark(%)## (`) ##
^Past performance may or may not be sustained in the future. Returns greater than 1 year period are compounded annualized (CAGR). # CNX Nifty Index ## S&P BSE SENSEX
A. Cumulative performance
Jun 28, 13 Last 1 Year 65.633 24.97 30.09 30.83 12,513 13,028 13,103Jan 02, 13 Since Inception 67.276 14.32 17.39 18.58 12,207 12,700 12,891
Period Scheme Benchmark Additional^ # Benchmark
##
B. Discrete 12 month returns (%)
Jun 28, 13 to Jun 30, 14 24.97 30.09 30.83
HDFC LARGE CAP FUND NAV as at June 30, 2014 ` 82.125
Performance of dividend option under the schemes for the investors would be net of distribution tax as applicable. Load is not taken into consideration for computation of performance. N.A.: Not Available@ shows the current value of ` 10,000/- invested at the beginning of a given periodWhere either NAV or Benchmark Index value is not available for the start/end date of a concerned period, the previous date where both NAV and Benchmark Index value are available, is considered for returns computation except for since inception returns
Date Period NAV Scheme Benchmark Additional Value of investment of ` 10,000@per Unit Returns Returns Benchmark Scheme Benchmark Additional
(`) (%)^ (%)# Returns (`) (`)# Benchmark(%)## (`) ##
^Past performance may or may not be sustained in the future. Returns greater than 1 year period are compounded annualized (CAGR). # CNX Nifty Index (Total Returns Index) ## S&P BSE SENSEX
A. Cumulative performance
Jun 28, 13 Last 1 Year 50.7075 31.05 31.57 30.83 13,124 13,177 13,103Jan 01, 13 Since Inception 51.3793 18.92 19.37 19.08 12,952 13,026 12,979
Period Scheme Benchmark Additional^ # Benchmark
##
B. Discrete 12 month returns (%)
Jun 28, 13 to Jun 30, 14 31.05 31.57 30.83
HDFC INDEX FUND - NNIFTY PLAN NAV as at June 30, 2014 ` 66.5482
Intouchmutually June 2014 53

Date Period NAV Scheme Benchmark Additional Value of investment of ` 10,000@per Unit Returns Returns Benchmark Scheme Benchmark Additional
(`) (%)^ (%)# Returns (`) (`)# Benchmark(%)## (`) ##
^Past performance may or may not be sustained in the future. Returns greater than 1 year period are compounded annualized (CAGR). # CNX 500 Index ## CNX Nifty Index
A. Cumulative performance
Jun 28, 13 Last 1 Year 221.710 63.02 36.64 30.09 16,346 13,687 13,028Jan 01, 13 Since Inception 246.413 29.48 18.59 17.92 14,707 12,900 12,790
Period Scheme Benchmark Additional^ # Benchmark
##
B. Discrete 12 month returns (%)
Jun 28, 13 to Jun 30, 14 63.02 36.64 30.09
HDFC TAXSAVER NAV as at June 30, 2014 ` 362.399
Date Period NAV Scheme Benchmark Additional Value of investment of ` 10,000@per Unit Returns Returns Benchmark Scheme Benchmark Additional
(`) (%)^ (%)# Returns (`) (`)# Benchmark(%)## (`) ##
^Past performance may or may not be sustained in the future. Returns greater than 1 year period are compounded annualized (CAGR). # CRISIL MIP Blended Index ## CRISIL 10 year Gilt IndexScheme performance may not strictly be comparable with that of its Additional Benchmark in view of hybrid nature of the scheme where a portion of scheme's investments are made in equity instruments. The Scheme is co-mmanaged by Vinay Kulkarni (Equities) and Shobhit Mehrotra (Debt).
A. Cumulative performance
Jun 28, 13 Last 1 Year 19.8127 17.05 8.24 -2.46 11,715 10,828 9,753Jan 01, 13 Since Inception 19.5587 12.15 8.54 2.50 11,868 11,302 10,375
Period Scheme Benchmark Additional^ # Benchmark
##
B. Discrete 12 month returns (%)
Jun 28, 13 to Jun 30, 14 17.05 8.24 -2.46
HDFC MF MIP SHORT TERM PLAN NAV as at June 30, 2014 ` 23.2115
SCHEME PERFORMANCE - DIRECT PLAN - GROWTH OPTION (FUND MANAGER-WISE)
Performance of dividend option under the schemes for the investors would be net of distribution tax as applicable. Load is not taken into consideration for computation of performance. N.A.: Not Available@ shows the current value of ` 10,000/- invested at the beginning of a given periodWhere either NAV or Benchmark Index value is not available for the start/end date of a concerned period, the previous date where both NAV and Benchmark Index value are available, is considered for returns computation except for since inception returns
VINAY KULKARNI...CONTINUED
Date Period NAV Scheme Benchmark Additional Value of investment of ` 10,000@per Unit Returns Returns Benchmark Scheme Benchmark Additional
(`) (%)^ (%)# Returns (`) (`)# Benchmark(%)## (`) ##
^Past performance may or may not be sustained in the future. Returns greater than 1 year period are compounded annualized (CAGR). # CRISIL MIP Blended Index ## CRISIL 1 year T-Bill IndexScheme performance may not strictly be comparable with that of its Additional Benchmark in view of hybrid nature of the scheme where a portion of scheme's investments are made in equity instruments. The Scheme is co-mmanaged by Vinay Kulkarni (Equities) and Anil Bamboli (Debt).
A. Cumulative performance
Jun 28, 13 Last 1 Year 21.0536 19.45 8.24 5.89 11,957 10,828 10,593Jan 01, 13 Since Inception 21.0517 12.72 8.54 6.70 11,958 11,302 11,017
Period Scheme Benchmark Additional^ # Benchmark
##
B. Discrete 12 month returns (%)
Jun 28, 13 to Jun 30, 14 19.45 8.24 5.89
HDFC MULTIPLE YIELD FUND NAV as at June 30, 2014 ` 25.1739
MITEN LATHIA
Date Period NAV Scheme Benchmark Additional Value of investment of ` 10,000@per Unit Returns Returns Benchmark Scheme Benchmark Additional
(`) (%)^ (%)# Returns (`) (`)# Benchmark(%)## (`) ##
^Past performance may or may not be sustained in the future. Returns greater than 1 year period are compounded annualized (CAGR). # CNX 500 Index ## CNX Nifty IndexThe Scheme is co-mmanaged by Chirag Setalvad & Miten Lathia
A. Cumulative performance
Jun 28, 13 Last 1 Year 113.632 48.93 36.64 30.09 14,926 13,687 13,028Jan 01, 13 Since Inception 117.724 27.70 18.59 17.92 14,407 12,900 12,790
Period Scheme Benchmark Additional^ # Benchmark
##
B. Discrete 12 month returns (%)
Jun 28, 13 to Jun 30, 14 48.93 36.64 30.09
HDFC CAPITAL BUILDER FUND NAV as at June 30, 2014 ` 169.604
Intouchmutually54 June 2014
Date Period NAV Scheme Benchmark Additional Value of investment of ` 10,000@per Unit Returns Returns Benchmark Scheme Benchmark Additional
(`) (%)^ (%)# Returns (`) (`)# Benchmark(%)## (`) ##
^Past performance may or may not be sustained in the future. Returns greater than 1 year period are compounded annualized (CAGR). # S&P BSE SENSEX (Total Returns Index) ## CNX Nifty Index
A. Cumulative performance
Jun 28, 13 Last 1 Year 247.4598 33.61 32.67 30.09 13,382 13,287 13,028Jan 01, 13 Since Inception 251.2631 20.31 20.99 17.92 13,180 13,291 12,790
Period Scheme Benchmark Additional^ # Benchmark
##
B. Discrete 12 month returns (%)
Jun 28, 13 to Jun 30, 14 33.61 32.67 30.09
HDFC INDEX FUND - SSENSEX PLUS PLAN NAV as at June 30, 2014 ` 331.1526

SCHEME PERFORMANCE - DIRECT PLAN - GROWTH OPTION (FUND MANAGER-WISE)
Performance of dividend option under the schemes for the investors would be net of distribution tax as applicable. Load is not taken into consideration for computation of performance. N.A.: Not Available@ shows the current value of ` 10,000/- invested at the beginning of a given periodWhere either NAV or Benchmark Index value is not available for the start/end date of a concerned period, the previous date where both NAV and Benchmark Index value are available, is considered for returns computation except for since inception returns
Date Period NAV Scheme Benchmark Additional Value of investment of ` 10,000@per Unit Returns Returns Benchmark Scheme Benchmark Additional
(`) (%)^ (%)# Returns (`) (`)# Benchmark(%)## (`) ##
^Past performance may or may not be sustained in the future. Returns greater than 1 year period are compounded annualized (CAGR). # CNX Midcap Index ## CNX Nifty Index
A. Cumulative performance
Jun 28, 13 Last 1 Year 17.223 70.51 50.79 30.09 17,101 15,113 13,028Jan 01, 13 Since Inception 18.799 35.08 18.59 17.92 15,667 12,900 12,790
Period Scheme Benchmark Additional^ # Benchmark
##
B. Discrete 12 month returns (%)
Jun 28, 13 to Jun 30, 14 70.51 50.79 30.09
HDFC MID-CCAP OPPORTUNITIES FUND NAV as at June 30, 2014 ` 29.453
Date Period NAV Scheme Benchmark Additional Value of investment of ` 10,000@per Unit Returns Returns Benchmark Scheme Benchmark Additional
(`) (%)^ (%)# Returns (`) (`)# Benchmark(%)## (`) ##
^Past performance may or may not be sustained in the future. Returns greater than 1 year period are compounded annualized (CAGR). # CNX Smallcap Index ## CNX Nifty Index
A. Cumulative performance
Jun 28, 13 Last 1 Year 15.060 41.02 84.78 30.09 14,129 18,540 13,028Jan 02, 13 Since Inception 15.985 21.16 26.21 17.39 13,311 14,148 12,700
Period Scheme Benchmark Additional^ # Benchmark
##
B. Discrete 12 month returns (%)
Jun 28, 13 to Jun 30, 14 41.02 84.78 30.09
HDFC SMALL AND MID CAP FUND NAV as at June 30, 2014 ` 21.278
CHIRAG SETALVAD
Date Period NAV Scheme Benchmark Additional Value of investment of ` 10,000@per Unit Returns Returns Benchmark Scheme Benchmark Additional
(`) (%)^ (%)# Returns (`) (`)# Benchmark(%)## (`) ##
^Past performance may or may not be sustained in the future. Returns greater than 1 year period are compounded annualized (CAGR). # CNX Balanced Fund Index ## CNX Nifty IndexThe Scheme is co-mmanaged by Chirag Setalvad & Miten Lathia
A. Cumulative performance
Jun 28, 13 Last 1 Year 113.632 48.93 36.64 30.09 14,926 13,687 13,028Jan 01, 13 Since Inception 117.724 27.70 18.59 17.92 14,407 12,900 12,790
Period Scheme Benchmark Additional^ # Benchmark
##
B. Discrete 12 month returns (%)
Jun 28, 13 to Jun 30, 14 48.93 36.64 30.09
HDFC CAPITAL BUILDER FUND NAV as at June 30, 2014 ` 169.604
Date Period NAV Scheme Benchmark Additional Value of investment of ` 10,000@per Unit Returns Returns Benchmark Scheme Benchmark Additional
(`) (%)^ (%)# Returns (`) (`)# Benchmark(%)## (`) ##
^Past performance may or may not be sustained in the future. Returns greater than 1 year period are compounded annualized (CAGR). # CRISIL Balanced Fund Index ## CNX Nifty IndexScheme performance may not strictly be comparable with that of its Additional Benchmark in view of balanced nature of the scheme where a portion of scheme's investments are made in debt instruments
A. Cumulative performance
Jun 28, 13 Last 1 Year 60.825 50.07 20.88 30.09 15,041 12,101 13,028Jan 01, 13 Since Inception 64.365 26.55 14.20 17.92 14,214 12,194 12,790
Period Scheme Benchmark Additional^ # Benchmark
##
B. Discrete 12 month returns (%)
Jun 28, 13 to Jun 30, 14 50.07 20.88 30.09
HDFC BALANCED FUND NAV as at June 30, 2014 ` 91.486
Intouchmutually June 2014 55
MITEN LATHIA...CONTINUED
Date Period NAV Scheme Benchmark Additional Value of investment of ` 10,000@per Unit Returns Returns Benchmark Scheme Benchmark Additional
(`) (%)^ (%)# Returns (`) (`)# Benchmark(%)## (`) ##
^Past performance may or may not be sustained in the future. Returns greater than 1 year period are compounded annualized (CAGR). # CRISIL Balanced Fund Index ## CNX Nifty IndexScheme performance may not strictly be comparable with that of its Additional Benchmark in view of hybrid nature of the scheme where a portion of scheme's investments are made in equity instruments. The Scheme is co-mmanaged by Miten Lathia & Anil Bamboli
A. Cumulative performance
Jun 28, 13 Last 1 Year 11.4865 7.38 20.88 30.09 10,743 12,101 13,028Jan 02, 13 Since Inception 10.8980 8.69 13.85 17.39 11,323 12,133 12,700
Period Scheme Benchmark Additional^ # Benchmark
##
B. Discrete 12 month returns (%)
Jun 28, 13 to Jun 30, 14 7.38 20.88 30.09
HDFC DYNAMIC PE RATIO FUND OF FUNDS NAV as at June 30, 2014 ` 12.3395

SCHEME PERFORMANCE - DIRECT PLAN - GROWTH OPTION (FUND MANAGER-WISE) CHIRAG SETALVAD...CONTINUED
Performance of dividend option under the schemes for the investors would be net of distribution tax as applicable. Load is not taken into consideration for computation of performance.@ shows the current value of ` 10,000/- invested at the beginning of a given periodWhere either NAV or Benchmark Index value is not available for the start/end date of a concerned period, the previous date where both NAV and Benchmark Index value are available, is considered for returns computation except for since inception returns
Date Period NAV Scheme Benchmark Additional Value of investment of ` 10,000@per Unit Returns Returns Benchmark Scheme Benchmark Additional
(`) (%)^ (%)# Returns (`) (`)# Benchmark(%)## (`) ##
^Past performance may or may not be sustained in the future. Returns greater than 1 year period are compounded annualized (CAGR). #S&P BSE SENSEX ## CNX Nifty Index
A. Cumulative performance
Jun 28, 13 Last 1 Year 143.604 49.09 30.83 30.09 14,942 13,103 13,028Jan 01, 13 Since Inception 148.176 28.14 19.08 17.92 14,481 12,979 12,790
Period Scheme Benchmark Additional^ # Benchmark
##
B. Discrete 12 month returns (%)
Jun 28, 13 to Jun 30, 14 49.09 30.83 30.09
HDFC LONG TERM ADVANTAGE FUND NAV as at June 30, 2014 ` 214.570
Date Period NAV Scheme Benchmark Additional Value of investment of ` 10,000@per Unit Returns Returns Benchmark Scheme Benchmark Additional
(`) (%)^ (%)# Returns (`) (`)# Benchmark(%)## (`) ##
^Past performance may or may not be sustained in the future. Returns greater than 1 year period are compounded annualized (CAGR). # CRISIL MIP Blended Index ## CRISIL 1 year T-Bill IndexScheme performance may not strictly be comparable with that of its Additional Benchmark in view of hybrid nature of the scheme where a portion of scheme's investments are made in equity instruments. The Scheme is co-mmanaged by Chirag Setalvad (Equities) and Anil Bamboli (Debt).
A. Cumulative performance
Jun 28, 13 Last 1 Year 19.1911 21.17 8.24 5.89 12,130 10,828 10,593Jan 01, 13 Since Inception 19.1492 13.97 8.54 6.70 12,156 11,302 11,017
Period Scheme Benchmark Additional^ # Benchmark
##
B. Discrete 12 month returns (%)
Jun 28, 13 to Jun 30, 14 21.17 8.24 5.89
HDFC MULTIPLE YIELD FUND - PPLAN 2005 NAV as at June 30, 2014 ` 23.2781
SRINIVAS RAO RAVURI
Date Period NAV Scheme Benchmark Additional Value of investment of ` 10,000@per Unit Returns Returns Benchmark Scheme Benchmark Additional
(`) (%)^ (%)# Returns (`) (`)# Benchmark(%)## (`) ##
^Past performance may or may not be sustained in the future. Returns greater than 1 year period are compounded annualized (CAGR). # S&P BSE SENSEX ## CNX Nifty Index
A. Cumulative performance
Jun 28, 13 Last 1 Year 85.841 41.81 30.83 30.09 14,208 13,103 13,028Jan 01, 13 Since Inception 94.763 18.41 19.08 17.92 12,871 12,979 12,790
Period Scheme Benchmark Additional^ # Benchmark
##
B. Discrete 12 month returns (%)
Jun 28, 13 to Jun 30, 14 41.81 30.83 30.09
HDFC GROWTH FUND NAV as at June 30, 2014 ` 121.967
Intouchmutually56 June 2014
Date Period NAV Scheme Benchmark Additional Value of investment of ` 10,000@per Unit Returns Returns Benchmark Scheme Benchmark Additional
(`) (%)^ (%)# Returns (`) (`)# Benchmark(%)## (`) ##
^Past performance may or may not be sustained in the future. Returns greater than 1 year period are compounded annualized (CAGR). # CRISIL Balanced Fund Index ## CNX Nifty IndexScheme performance may not strictly be comparable with that of its Additional Benchmark in view of balanced nature of the scheme where a portion of scheme's investments are made in debt instruments
A. Cumulative performance
Jun 28, 13 Last 1 Year 49.729 44.16 20.88 30.09 14,444 12,101 13,028Jan 01, 13 Since Inception 50.852 26.03 14.20 17.92 14,126 12,194 12,790
Period Scheme Benchmark Additional^ # Benchmark
##
B. Discrete 12 month returns (%)
Jun 28, 13 to Jun 30, 14 44.16 20.88 30.09
HDFC CHILDREN’S GIFT FUND - IINVESTMENT PLAN NAV as at June 30, 2014 ` 71.831
Date Period NAV Scheme Benchmark Additional Value of investment of ` 10,000@per Unit Returns Returns Benchmark Scheme Benchmark Additional
(`) (%)^ (%)# Returns (`) (`)# Benchmark(%)## (`) ##
^Past performance may or may not be sustained in the future. Returns greater than 1 year period are compounded annualized (CAGR). # CRISIL MIP Blended Index ## CRISIL 10 year Gilt IndexScheme performance may not strictly be comparable with that of its Additional Benchmark in view of hybrid nature of the scheme where a portion of scheme's investments are made in equity instruments.
A. Cumulative performance
Jun 28, 13 Last 1 Year 26.934 18.76 8.24 -2.46 11,888 10,828 9,753Jan 01, 13 Since Inception 26.4861 13.55 8.54 2.50 12,089 11,302 10,375
Period Scheme Benchmark Additional^ # Benchmark
##
B. Discrete 12 month returns (%)
Jun 28, 13 to Jun 30, 14 18.76 8.24 -2.46
HDFC CHILDREN’S GIFT FUND - SSAVINGS PLAN NAV as at June 30, 2014 ` 32.0181

SCHEME PERFORMANCE - DIRECT PLAN - GROWTH OPTION (FUND MANAGER-WISE)
Performance of dividend option under the schemes for the investors would be net of distribution tax as applicable. Load is not taken into consideration for computation of performance.@ shows the current value of ` 10,000/- invested at the beginning of a given periodWhere either NAV or Benchmark Index value is not available for the start/end date of a concerned period, the previous date where both NAV and Benchmark Index value are available, is considered for returns computation except for since inception returns
SHOBHIT MEHROTRA
Date Period NAV Scheme Benchmark Additional Value of investment of ` 10,000@per Unit Returns Returns Benchmark Scheme Benchmark Additional
(`) (%)^ (%)# Returns (`) (`)# Benchmark(%)## (`) ##
^Past performance may or may not be sustained in the future. Returns greater than 1 year period are compounded annualized (CAGR). # CRISIL MIP Blended Index ## CRISIL 10 year Gilt IndexScheme performance may not strictly be comparable with that of its Additional Benchmark in view of hybrid nature of the scheme where a portion of scheme's investments are made in equity instruments.
The Scheme is co-mmanaged by Prashant Jain (Equities) and Shobhit Mehrotra (Debt).
A. Cumulative performance
Jun 28, 13 Last 1 Year 26.7598 18.64 8.24 -2.46 11,875 10,828 9,753Jan 01, 13 Since Inception 26.4746 13.01 8.54 2.50 12,003 11,302 10,375
Period Scheme Benchmark Additional^ # Benchmark
##
B. Discrete 12 month returns (%)
Jun 28, 13 to Jun 30, 14 18.64 8.24 -2.46
HDFC MF MIP LONG TERM PLAN NAV as at June 30, 2014 ` 31.7772
Date Period NAV Scheme Benchmark Additional Value of investment of ` 10,000@per Unit Returns Returns Benchmark Scheme Benchmark Additional
(`) (%)^ (%)# Returns (`) (`)# Benchmark(%)## (`) ##
^Past performance may or may not be sustained in the future. Returns greater than 1 year period are compounded annualized (CAGR). # CRISIL MIP Blended Index ## CRISIL 10 year Gilt IndexScheme performance may not strictly be comparable with that of its Additional Benchmark in view of hybrid nature of the scheme where a portion of scheme's investments are made in equity instruments.
The Scheme is co-mmanaged by Vinay Kulkarni (Equities) and Shobhit Mehrotra (Debt).
Jun 28, 13 Last 1 Year 19.8127 17.05 8.24 -2.46 11,715 10,828 9,753Jan 01, 13 Since Inception 19.5587 12.15 8.54 2.50 11,868 11,302 10,375
Period Scheme Benchmark Additional^ # Benchmark
##
B. Discrete 12 month returns (%)
Jun 28, 13 to Jun 30, 14 17.05 8.24 -2.46
HDFC MF MIP SHORT TERM PLAN NAV as at June 30, 2014 ` 23.2115
Date Period NAV Scheme Benchmark Additional Value of investment of ` 10,000@per Unit Returns Returns Benchmark Scheme Benchmark Additional
(`) (%)^ (%)# Returns (`) (`)# Benchmark(%)## (`) ##
^Past performance may or may not be sustained in the future. Returns greater than 1 year period are compounded annualized (CAGR). # CRISIL Composite Bond Fund Index ## CRISIL 10 year Gilt Index
A. Cumulative performance
Jun 28, 13 Last 1 Year 28.0322 3.17 4.57 -2.46 10,319 10,460 9,753Jan 01, 13 Since Inception 26.4718 6.12 6.78 2.50 10,927 11,029 10,375
Period Scheme Benchmark Additional^ # Benchmark
##
B. Discrete 12 month returns (%)
Jun 28, 13 to Jun 30, 14 3.17 4.57 -2.46
HDFC INCOME FUND NAV as at June 30, 2014 ` 28.9252
Date Period NAV Scheme Benchmark Additional Value of investment of ` 10,000@per Unit Returns Returns Benchmark Scheme Benchmark Additional
(`) (%)^ (%)# Returns (`) (`)# Benchmark(%)## (`)##
^Past performance may or may not be sustained in the future. Returns greater than 1 year period are compounded annualized (CAGR). # CRISIL Short Term Bond Fund Index ## CRISIL 1 year T-Bill Index
Jun 28, 13 Last 1 Year 23.7268 8.41 8.76 5.89 10,845 10,881 10,593Jan 01, 13 Since Inception 22.6787 8.83 8.97 6.70 11,347 11,369 11,017
Period Scheme Benchmark Additional^ # Benchmark
##
B. Discrete 12 month returns (%)
Jun 28, 13 to Jun 30, 14 8.41 8.76 5.89
HDFC HIGH INTEREST FUND - SSTP NAV as at June 30, 2014 ` 25.7325
Intouchmutually June 2014 57
Date Period NAV Scheme Benchmark Additional Value of investment of ` 10,000@per Unit Returns Returns Benchmark Scheme Benchmark Additional
(`) (%)^ (%)# Returns (`) (`) # Benchmark(%)## (`) ##
^Past performance may or may not be sustained in the future. Returns greater than 1 year period are compounded annualized (CAGR). # CNX 500 Index ## CNX Nifty IndexThe Scheme is co-mmanaged by Prashant Jain and Srinivas Rao Ravuri.
A. Cumulative performance
Jun 28, 13 Last 1 Year 8.694 72.07 36.64 30.09 17,258 13,687 13,028Jan 01, 13 Since Inception 11.152 21.98 18.59 17.92 13,454 12,900 12,790
Period Scheme Benchmark Additional^ # Benchmark
##
B. Discrete 12 month returns (%)
Jun 28, 13 to Jun 30, 14 72.07 36.64 30.09
HDFC INFRASTRUCTURE FUND NAV as at June 30, 2014 ` 15.004
Date Period NAV Scheme Benchmark Additional Value of investment of ` 10,000@per Unit Returns Returns Benchmark Scheme Benchmark Additional
(`) (%)^ (%)# Returns (`) (`) # Benchmark(%)## (`) ##
^Past performance may or may not be sustained in the future. Returns greater than 1 year period are compounded annualized (CAGR). # S&P BSE 100 ## S&P BSE SENSEX
Jun 28, 13 Last 1 Year 10.151 42.21 33.23 30.83 14,249 13,344 13,103Mar 22, 13 Since Inception 10.000 33.60 28.21 27.04 14,464 13,724 13,564
Period Scheme Benchmark Additional^ # Benchmark
##
B. Discrete 12 month returns (%)
Jun 28, 13 to Jun 30, 14 42.21 33.23 30.83
HDFC RAJIV GANDHI EQUITY SAVINGS SCHEME - SSERIES I - FFEBRUARY 2013NAV as at June 30, 2014 ` 14.464
SRINIVAS RAO RAVURI...CONTINUED
A. Cumulative performance
A. Cumulative performance
A. Cumulative performance

Performance of dividend option under the schemes for the investors would be net of distribution tax as applicable. Load is not taken into consideration for computation of performance. N.A.: Not Available@ shows the current value of ` 10,000/- invested at the beginning of a given periodWhere either NAV or Benchmark Index value is not available for the start/end date of a concerned period, the previous date where both NAV and Benchmark Index value are available, is considered for returns computation except for since inception returns
SCHEME PERFORMANCE - DIRECT PLAN - GROWTH OPTION (FUND MANAGER-WISE)
Date Period NAV Scheme Benchmark Additional Value of investment of ` 10,000@per Unit Returns Returns Benchmark Scheme Benchmark Additional
(`) (%)^ (%)# Returns (`) (`)# Benchmark(%)## (`)##
^Past performance may or may not be sustained in the future. Returns greater than 1 year period are compounded annualized (CAGR). # CRISIL Liquid Fund Index ## CRISIL 1 year T-Bill Index
A. Cumulative performance
Jun 28, 13 Last 1 Year 20.9868 8.83 9.63 5.89 10,888 10,968 10,593Jan 01, 13 Since Inception 20.0689 9.08 9.22 6.70 11,386 11,408 11,017
Period Scheme Benchmark Additional^ # Benchmark
##
B. Discrete 12 month returns (%)
Jun 28, 13 to Jun 30, 14 8.83 9.63 5.89
HDFC FLOATING RATE INCOME FUND - LLTP NAV as at June 30, 2014 ` 22.8501
Date Period NAV Scheme Benchmark Additional Value of investment of ` 10,000@per Unit Returns Returns Benchmark Scheme Benchmark Additional
(`) (%)^ (%)# Returns (`) (`)# Benchmark(%)## (`)##
^Past performance may or may not be sustained in the future. Returns greater than 1 year period are compounded annualized (CAGR). # CRISIL Composite Bond Fund Index. ## CRISIL 10 year Gilt Index
A. Cumulative performance
Jun 28, 13 Last 1 Year 13.0520 8.07 4.57 -2.46 10,811 10,460 9,753Jan 01, 13 Since Inception 12.4504 8.75 6.78 2.50 11,334 11,029 10,375
HDFC MEDIUM TERM OPPORTUNITIES FUND NAV as at June 30, 2014 ` 14.1111
Period Scheme Benchmark Additional^ # Benchmark
##
B. Discrete 12 month returns (%)
Jun 28, 13 to Jun 30, 14 8.07 4.57 -2.46
SHOBHIT MEHROTRA...CONTINUED
Date Period NAV Scheme Benchmark Additional Value of investment of ` 10,000@per Unit Returns Returns Benchmark Scheme Benchmark Additional
(`) (%)^ (%)# Returns (`) (`)# Benchmark(%)## (`)##
^Past performance may or may not be sustained in the future. Returns greater than 1 year period are compounded annualized (CAGR). # CRISIL Liquid Fund Index ## CRISIL 1 year T-Bill Index
A. Cumulative performance
Jun 23, 14 Last 7 days 25.8548 0.17 0.17 0.15 10,017 10,017 10,015Jun 15, 14 Last 15 days 25.8065 0.35 N.A. N.A. 10,035 N.A. N.A.May 30, 14 Last 1 Month 25.7092 0.73 0.72 0.63 10,073 10,072 10,063Jun 28, 13 Last 1 Year 23.6268 9.56 9.63 5.89 10,961 10,968 10,593Dec 31, 12 Since Inception 22.6510 9.37 9.22 6.72 11,434 11,410 11,022
Period Scheme Benchmark Additional^ # Benchmark
##
B. Discrete 12 month returns (%)
Jun 28, 13 to Jun 30, 14 9.56 9.63 5.89
HDFC LIQUID FUND NAV as at June 30, 2014 ` 25.8981
Intouchmutually58 June 2014
Date Period NAV Scheme Benchmark Additional Value of investment of ` 10,000@per Unit Returns Returns Benchmark Scheme Benchmark Additional
(`) (%)^ (%)# Returns (`) (`)# Benchmark(%)## (`)##
^Past performance may or may not be sustained in the future. Returns greater than 1 year period are compounded annualized (CAGR). # CRISIL Composite Bond Fund Index. ## CRISIL 1 year T-Bill IndexPerformance of FMP schemes, being close-ended in nature, is not strictly comparable with that of open-ended schemes since the investment strategy for FMP schemes is primarily buy-and-hold whereas open-ended schemes are actively managed.
A. Cumulative performance
Jun 28, 13 Last 1 Year 9.9808 8.63 4.57 5.89 10,868 10,460 10,593May 23, 13 Since Inception 10.0016 7.62 2.97 5.77 10,845 10,328 10,639
HDFC FMP 1107D MAY 2013 (1) NAV as at June 30, 2014 ` 10.8468
Period Scheme Benchmark Additional^ # Benchmark
##
B. Discrete 12 month returns (%)
Jun 28, 13 to Jun 30, 14 8.63 4.57 5.89
Date Period NAV Scheme Benchmark Additional Value of investment of ` 10,000@per Unit Returns Returns Benchmark Scheme Benchmark Additional
(`) (%)^ (%)# Returns (`) (`)# Benchmark(%)## (`)##
^Past performance may or may not be sustained in the future. Returns greater than 1 year period are compounded annualized (CAGR). # CRISIL Liquid Fund Index ## CRISIL 1 year T-Bill Index
A. Cumulative performance
Jun 28, 13 Last 1 Year 20.4712 9.50 9.63 5.89 10,955 10,968 10,593Jan 01, 13 Since Inception 19.6301 9.33 9.22 6.70 11,425 11,408 11,017
Period Scheme Benchmark Additional^ # Benchmark
##
B. Discrete 12 month returns (%)
Jun 28, 13 to Jun 30, 14 9.50 9.63 5.89
HDFC FLOATING RATE INCOME FUND - SSTP - WWHOLESALE OPTIONNAV as at June 30, 2014 ` 22.4267

ANIL BAMBOLI
Date Period NAV Scheme Benchmark Additional Value of investment of ` 10,000@per Unit Returns Returns Benchmark Scheme Benchmark Additional
(`) (%)^ (%)# Returns (`) (`)# Benchmark(%)## (`) ##
^Past performance may or may not be sustained in the future. Returns greater than 1 year period are compounded annualized (CAGR). # CRISIL MIP Blended Index ## CRISIL 1 year T-Bill IndexScheme performance may not strictly be comparable with that of its Additional Benchmark in view of hybrid nature of the scheme where a portion of scheme's investments are made in equity instruments. The Scheme is co-mmanaged by Vinay Kulkarni (Equities) and Anil Bamboli (Debt).
A. Cumulative performance
Jun 28, 13 Last 1 Year 21.0536 19.45 8.24 5.89 11,957 10,828 10,593Jan 01, 13 Since Inception 21.0517 12.72 8.54 6.70a 11,958 11,302 11,017
Period Scheme Benchmark Additional^ # Benchmark
##
B. Discrete 12 month returns (%)
Jun 28, 13 to Jun 30, 14 19.45 8.24 5.89
HDFC MULTIPLE YIELD FUND NAV as at June 30, 2014 ` 25.1739
SCHEME PERFORMANCE - DIRECT PLAN - GROWTH OPTION (FUND MANAGER-WISE)
Date Period NAV Scheme Benchmark Additional Value of investment of ` 10,000@per Unit Returns Returns Benchmark Scheme Benchmark Additional
(`) (%)^ (%)# Returns (`) (`)# Benchmark(%)## (`) ##
^Past performance may or may not be sustained in the future. Returns greater than 1 year period are compounded annualized (CAGR). # CRISIL MIP Blended Index ## CRISIL 1 year T-Bill IndexScheme performance may not strictly be comparable with that of its Additional Benchmark in view of hybrid nature of the scheme where a portion of scheme's investments are made in equity instruments. The Scheme is co-mmanaged by Chirag Setalvad (Equities) and Anil Bamboli (Debt).
A. Cumulative performance
Jun 28, 13 Last 1 Year 19.1911 21.17 8.24 5.89 12,130 10,828 10,593Jan 01, 13 Since Inception 19.1492 13.97 8.54 6.70 12,156 11,302 11,017
Period Scheme Benchmark Additional^ # Benchmark
##
B. Discrete 12 month returns (%)
Jun 28, 13 to Jun 30, 14 21.17 8.24 5.89
HDFC MULTIPLE YIELD FUND - PPLAN 2005 NAV as at June 30, 2014 ` 23.2781
Performance of dividend option under the schemes for the investors would be net of distribution tax as applicable. Load is not taken into consideration for computation of performance. N.A.: Not Available@ shows the current value of ` 10,000/- invested at the beginning of a given periodWhere either NAV or Benchmark Index value is not available for the start/end date of a concerned period, the previous date where both NAV and Benchmark Index value are available, is considered for returns computation except for since inception returns
Intouchmutually June 2014 59
Date Period NAV Scheme Benchmark Additional Value of investment of ` 10,000@per Unit Returns Returns Benchmark Scheme Benchmark Additional
(`) (%)^ (%)# Returns (`) (`)# Benchmark(%)## (`)##
^Past performance may or may not be sustained in the future. Returns greater than 1 year period are compounded annualized (CAGR). # CRISIL Composite Bond Fund Index. ## CRISIL 1 year T-Bill IndexPerformance of FMP schemes, being close-ended in nature, is not strictly comparable with that of open-ended schemes since the investment strategy for FMP schemes is primarily buy-and-hold whereas open-ended schemes are actively managed.
A. Cumulative performance
Jun 28, 13 Last 1 Year 10.4505 7.42 4.57 5.89 10,746 10,460 10,593Jan 08, 13 Since Inception 10.0000 8.19 6.52 6.61 11,230 10,976 10,989
HDFC FMP 1919D JANUARY 2013 (1) NAV as at June 30, 2014 ` 11.2302
Period Scheme Benchmark Additional^ # Benchmark
##
B. Discrete 12 month returns (%)
Jun 28, 13 to Jun 30, 14 7.42 4.57 5.89
SHOBHIT MEHROTRA...CONTINUED
Date Period NAV Scheme Benchmark Additional Value of investment of ` 10,000@per Unit Returns Returns Benchmark Scheme Benchmark Additional
(`) (%)^ (%)# Returns (`) (`)# Benchmark(%)## (`) ##
^Past performance may or may not be sustained in the future. Returns greater than 1 year period are compounded annualized (CAGR). # CRISIL Balanced Fund Index ## CNX Nifty IndexScheme performance may not strictly be comparable with that of its Additional Benchmark in view of hybrid nature of the scheme where a portion of scheme's investments are made in equity instruments. The Scheme is co-mmanaged by Miten Lathia & Anil Bamboli
A. Cumulative performance
Jun 28, 13 Last 1 Year 11.4865 7.38 20.88 30.09 10,743 12,101 13,028Jan 02, 13 Since Inception 10.8980 8.69 13.85 17.39 11,323 12,133 12,700
Period Scheme Benchmark Additional^ # Benchmark
##
B. Discrete 12 month returns (%)
Jun 28, 13 to Jun 30, 14 7.38 20.88 30.09
HDFC DYNAMIC PE RATIO FUND OF FUNDS NAV as at June 30, 2014 ` 12.3395
Date Period NAV Scheme Benchmark Additional Value of investment of ` 10,000@per Unit Returns Returns Benchmark Scheme Benchmark Additional
(`) (%)^ (%)# Returns (`) (`)# Benchmark(%)## (`)##
^Past performance may or may not be sustained in the future. Returns greater than 1 year period are compounded annualized (CAGR). # CRISIL Composite Bond Fund Index. ## CRISIL 1 year T-Bill IndexPerformance of FMP schemes, being close-ended in nature, is not strictly comparable with that of open-ended schemes since the investment strategy for FMP schemes is primarily buy-and-hold whereas open-ended schemes are actively managed.
A. Cumulative performance
Jun 28, 13 Last 1 Year 10.3984 8.05 4.57 5.89 10,809 10,460 10,593Feb 13, 13 Since Inception 10.0000 8.87 6.47 6.48 11,240 10,901 10,903
HDFC FMP 1198D FEBRUARY 2013 (1) NAV as at June 30, 2014 ` 11.2401
Period Scheme Benchmark Additional^ # Benchmark
##
B. Discrete 12 month returns (%)
Jun 28, 13 to Jun 30, 14 8.05 4.57 5.89

ANIL BAMBOLI...CONTINUED
SCHEME PERFORMANCE - DIRECT PLAN - GROWTH OPTION (FUND MANAGER-WISE)
Performance of dividend option under the schemes for the investors would be net of distribution tax as applicable. Load is not taken into consideration for computation of performance. N.A.: Not Available@ shows the current value of ` 10,000/- invested at the beginning of a given periodWhere either NAV or Benchmark Index value is not available for the start/end date of a concerned period, the previous date where both NAV and Benchmark Index value are available, is considered for returns computation except for since inception returns
Date Period NAV Scheme Benchmark Additional Value of investment of ` 10,000@per Unit Returns Returns Benchmark Scheme Benchmark Additional
(`) (%)^ (%)# Returns (`) (`)# Benchmark(%)## (`) ##
^Past performance may or may not be sustained in the future. Returns greater than 1 year period are compounded annualized (CAGR). # I-Sec Li-Bex ## CRISIL 10 year Gilt Index
A. Cumulative performance
Jun 28, 13 Last 1 Year 24.5221 1.17 1.70 -2.46 10,118 10,171 9,753Jan 01, 13 Since Inception 22.9789 5.27 5.95 2.50 10,797 10,901 10,375
Period Scheme Benchmark Additional^ # Benchmark
##
B. Discrete 12 month returns (%)
Jun 28, 13 to Jun 30, 14 1.17 1.70 -2.46
HDFC GILT FUND - LLONG TERM PLAN NAV as at June 30, 2014 ` 24.8109
Date Period NAV Scheme Benchmark Additional Value of investment of ` 10,000@per Unit Returns Returns Benchmark Scheme Benchmark Additional
(`) (%)^ (%)# Returns (`) (`)# Benchmark(%)## (`) ##
^Past performance may or may not be sustained in the future. Returns greater than 1 year period are compounded annualized (CAGR). # I-Sec Si-Bex ## CRISIL 1 year T-Bill Index
Jun 28, 13 Last 1 Year 20.1427 5.37 6.80 5.89 10,540 10,684 10,593Jan 01, 13 Since Inception 19.0767 7.43 7.81 6.70 11,129 11,188 11,017
Period Scheme Benchmark Additional^ # Benchmark
##
B. Discrete 12 month returns (%)
Jun 28, 13 to Jun 30, 14 5.37 6.80 5.89
HDFC GILT FUND - SSHORT TERM PLAN NAV as at June 30, 2014 ` 21.2303
Intouchmutually60 June 2014
A. Cumulative performance
Period Scheme Benchmark Additional^ # Benchmark
##
B. Discrete 12 month returns (%)
Jun 28, 13 to Jun 30, 14 8.98 8.76 5.89
Date Period NAV Scheme Benchmark Additional Value of investment of ` 10,000@per Unit Returns Returns Benchmark Scheme Benchmark Additional
(`) (%)^ (%)# Returns (`) (`)# Benchmark(%)## (`) ##
^Past performance may or may not be sustained in the future. Returns greater than 1 year period are compounded annualized (CAGR). # CRISIL Short-Term Bond Fund Index. ## CRISIL 1 year T-Bill Index
A. Cumulative performance
Jun 28, 13 Last 1 Year 13.0210 8.98 8.76 5.89 10,903 10,881 10,593Jan 01, 13 Since Inception 12.4477 9.20 8.97 6.70 11,405 11,369 11,017
HDFC SHORT TERM OPPORTUNITIES FUND NAV as at June 30, 2014 ` 14.1967
Date Period NAV Scheme Benchmark Additional Value of investment of ` 10,000@per Unit Returns Returns Benchmark Scheme Benchmark Additional
(`) (%)^ (%)# Returns (`) (`)# Benchmark(%)## (`)##
^Past performance may or may not be sustained in the future. Returns greater than 1 year period are compounded annualized (CAGR). # CRISIL Short Term Bond Fund Index ## CRISIL 1 year T-Bill Index
A. Cumulative performance
Jun 28, 13 Last 1 Year 23.1640 8.38 8.76 5.89 10,843 10,881 10,593Jan 01, 13 Since Inception 22.1829 8.67 8.97 6.70 11,322 11,369 11,017
Period Scheme Benchmark Additional^ # Benchmark
##
B. Discrete 12 month returns (%)
Jun 28, 13 to Jun 30, 14 8.38 8.76 5.89
HDFC SHORT TERM PLAN NAV as at June 30, 2014 ` 25.1165
Date Period NAV Scheme Benchmark Additional Value of investment of ` 10,000@per Unit Returns Returns Benchmark Scheme Benchmark Additional
(`) (%)^ (%)# Returns (`) (`)# Benchmark(%)## (`) ##
^Past performance may or may not be sustained in the future. Returns greater than 1 year period are compounded annualized (CAGR). # CRISIL Composite Bond Fund Index ## CRISIL 10 year Gilt Index
A. Cumulative performance
Jun 28, 13 Last 1 Year 40.9705 5.82 4.57 -2.46 10,585 10,460 9,753Jan 01, 13 Since Inception 38.4715 8.35 6.78 2.50 11,273 11,029 10,375
Period Scheme Benchmark Additional^ # Benchmark
##
B. Discrete 12 month returns (%)
Jun 28, 13 to Jun 30, 14 5.82 4.57 -2.46
HDFC HIGH INTEREST FUND - DDYNAMIC PLAN NAV as at June 30, 2014 ` 43.3681

ANIL BAMBOLI...CONTINUED
SCHEME PERFORMANCE - DIRECT PLAN - GROWTH OPTION (FUND MANAGER-WISE)
Performance of dividend option under the schemes for the investors would be net of distribution tax as applicable. Load is not taken into consideration for computation of performance. N.A.: Not Available@ shows the current value of ` 10,000/- invested at the beginning of a given periodWhere either NAV or Benchmark Index value is not available for the start/end date of a concerned period, the previous date where both NAV and Benchmark Index value are available, is considered for returns computation except for since inception returns
Intouchmutually June 2014 61
Date Period NAV Scheme Benchmark Additional Value of investment of ` 10,000@per Unit Returns Returns Benchmark Scheme Benchmark Additional
(`) (%)^ (%)# Returns (`) (`)# Benchmark(%)## (`)##
^Past performance may or may not be sustained in the future. Returns greater than 1 year period are compounded annualized (CAGR). # CRISIL Liquid Fund Index ## CRISIL 1 year T-Bill Index
Jun 23, 14 Last 7 days 27.3605 0.17 0.17 0.15 10,017 10,017 10,015Jun 15, 14 Last 15 days 27.3094 0.35 N.A. N.A. 10,035 N.A. N.A.May 30, 14 Last 1 Month 27.2060 0.73 0.72 0.63 10,073 10,072 10,063Jun 28, 13 Last 1 Year 25.0257 9.46 9.63 5.89 10,951 10,968 10,593Dec 31, 12 Since Inception 23.9920 9.30 9.22 6.72 11,423 11,410 11,022
Period Scheme Benchmark Additional^ # Benchmark
##
B. Discrete 12 month returns (%)
Jun 28, 13 to Jun 30, 14 9.46 9.63 5.89
HDFC CASH MANAGEMENT FUND - SSAVINGS PLAN NAV as at June 30, 2014 ` 27.4057A. Cumulative performance
Date Period NAV Scheme Benchmark Additional Value of investment of ` 10,000@per Unit Returns Returns Benchmark Scheme Benchmark Additional
(`) (%)^ (%)# Returns (`) (`)# Benchmark(%)## (`)##
^Past performance may or may not be sustained in the future. Returns greater than 1 year period are compounded annualized (CAGR). # CRISIL Liquid Fund Index ## CRISIL 1 year T-Bill Index
Jun 23, 14 Last 7 days 20.7430 0.16 0.17 0.15 10,016 10,017 10,015Jun 15, 14 Last 15 days 20.7072 0.33 N.A. N.A. 10,033 N.A. N.A.May 30, 14 Last 1 Month 20.6381 0.67 0.72 0.63 10,067 10,072 10,063Jun 28, 13 Last 1 Year 19.1295 8.56 9.63 5.89 10,861 10,968 10,593Dec 31, 12 Since Inception 18.4446 8.28 9.22 6.72 11,264 11,410 11,022
Period Scheme Benchmark Additional^ # Benchmark
##
B. Discrete 12 month returns (%)
Jun 28, 13 to Jun 30, 14 8.56 9.63 5.89
HDFC CASH MANAGEMENT FUND - CCALL PLAN NAV as at June 30, 2014 ` 20.7763A. Cumulative performance
Date Period NAV Scheme Benchmark Additional Value of investment of ` 10,000@per Unit Returns Returns Benchmark Scheme Benchmark Additional
(`) (%)^ (%)# Returns (`) (`)# Benchmark(%)## (`) ##
^Past performance may or may not be sustained in the future. Returns greater than 1 year period are compounded annualized (CAGR). # CRISIL Liquid Fund Index ## CRISIL 1 year T-Bill Index
Jun 28, 13 Last 1 Year 25.7201 9.14 9.63 5.89 10,919 10,968 10,593
Jan 01, 13 Since Inception 24.6535 9.12 9.22 6.70 11,391 11,408 11,017
Period Scheme Benchmark Additional^ # Benchmark
##
B. Discrete 12 month returns (%)
Jun 28, 13 to Jun 30, 14 9.14 9.63 5.89
HDFC CASH MANAGEMENT FUND - TTREASURY ADVANTAGE PLAN - RRETAIL OPTIONNAV as at June 30, 2014 ` 28.0832A. Cumulative performance
Date Period NAV Scheme Benchmark Additional Value of investment of ` 10,000@per Unit Returns Returns Benchmark Scheme Benchmark Additional
(`) (%)^ (%)# Returns (`) (`)# Benchmark(%)## (`) ##
^Past performance may or may not be sustained in the future. Returns greater than 1 year period are compounded annualized (CAGR). # I-Sec Composite Index ## CRISIL 10 year Gilt Index
A. Cumulative performance
Jun 28, 13 Last 1 Year 10.5821 2.02 4.09 -2.46 10,203 10,411 9,753Mar 04, 13 Since Inception 10.0000 5.97 6.19 1.23 10,797 10,827 10,163
Period Scheme Benchmark Additional^ # Benchmark
##
B. Discrete 12 month returns (%)
Jun 28, 13 to Jun 30, 14 2.02 4.09 -2.46
HDFC INFLATION INDEXED BOND FUND NAV as at June 30, 2014 ` 10.7971
Date Period NAV Scheme Benchmark Additional Value of investment of ` 10,000@per Unit Returns Returns Benchmark Scheme Benchmark Additional
(`) (%)^ (%)# Returns (`) (`)# Benchmark(%)## (`)##
^Past performance may or may not be sustained in the future. Returns greater than 1 year period are compounded annualized (CAGR). # CRISIL Short-term Bond Fund Index. ## CRISIL 1 year T-Bill IndexPerformance of FMP schemes, being close-ended in nature, is not strictly comparable with that of open-ended schemes since the investment strategy for FMP schemes is primarily buy-and-hold whereas open-ended schemes are actively managed.
A. Cumulative performance
Jun 28, 13 Last 1 Year 10.0039 8.34 8.76 5.89 10,839 10,881 10,593Jun 27, 13 Since Inception 10.0019 8.34 8.91 5.98 10,841 10,899 10,603
HDFC FMP 369D JUNE 2013 (1) NAV as at June 30, 2014 ` 10.8433
Period Scheme Benchmark Additional^ # Benchmark
##
B. Discrete 12 month returns (%)
Jun 28, 13 to Jun 30, 14 8.34 8.76 5.89

SCHEME PERFORMANCE - DIRECT PLAN - GROWTH OPTION (FUND MANAGER-WISE)
Intouchmutually62 June 2014
Date Period NAV Scheme Benchmark Additional Value of investment of ` 10,000@per Unit Returns Returns Benchmark Scheme Benchmark Additional
(`) (%)^ (%)# Returns (`) (`)# Benchmark(%)## (`) ##
^Past performance may or may not be sustained in the future. Returns greater than 1 year period are compounded annualized (CAGR). # CRISIL Liquid Fund Index ## CRISIL 1 year T-Bill IndexScheme performance may not strictly be comparable with that of its Additional Benchmark as the Scheme can invest only in instruments having maturity upto the opening of the immediately following specified transaction period, which is at quarterly intervals.
Jun 28, 13 Last 1 Year 16.7199 9.59 9.63 5.89 10,964 10,968 10,593Mar 18, 13 Since Inception 16.3297 9.42 9.39 6.45 11,226 11,222 10,836
Period Scheme Benchmark Additional^ # Benchmark
##
B. Discrete 12 month returns (%)
Jun 28, 13 to Jun 30, 14 9.59 9.63 5.89
HDFC QUARTERLY INTERVAL FUND - PPLAN A - RRETAIL PLAN NAV as at June 30, 2014 ` 18.3320A. Cumulative performance
Date Period NAV Scheme Benchmark Additional Value of investment of ` 10,000@per Unit Returns Returns Benchmark Scheme Benchmark Additional
(`) (%)^ (%)# Returns (`) (`)# Benchmark(%)## (`) ##
^Past performance may or may not be sustained in the future. Returns greater than 1 year period are compounded annualized (CAGR). # CRISIL Liquid Fund Index ## CRISIL 1 year T-Bill IndexScheme performance may not strictly be comparable with that of its Additional Benchmark as the Scheme can invest only in instruments having maturity upto the opening of the immediately following specified transaction period, which is at quarterly intervals.
A. Cumulative performance
Jun 28, 13 Last 1 Year 16.2676 9.97 9.63 5.89 11,003 10,968 10,593Feb 05, 13 Since Inception 15.7379 9.64 9.31 6.49 11,373 11,325 10,918
Period Scheme Benchmark Additional^ # Benchmark
##
B. Discrete 12 month returns (%)
Jun 28, 13 to Jun 30, 14 9.97 9.63 5.89
HDFC QUARTERLY INTERVAL FUND - PPLAN C - RRETAIL PLAN NAV as at June 30, 2014 ` 17.8985
Period Scheme Benchmark^ #
B. Discrete 12 month returns (%)
Jun 28, 13 to Jun 30, 14 8.24 10.98
Date Period NAV Scheme Benchmark Value of investment of ` 10,000@per Unit Returns Returns Scheme Benchmark
(`) (%)^ (%)# (`) (`)#
^Past performance may or may not be sustained in the future. Returns greater than 1 year period are compounded annualized (CAGR). # Domestic Price of Physical Gold
A. Cumulative performance
Jun 28, 13 Last 1 Year 9.0262 8.24 10.98 10,828 11,104Jan 01, 13 Since Inception 11.0586 -7.94 -5.84 8,838 9,141
HDFC GOLD FUND NAV as at June 30, 2014 ` 9.7740
Date Period NAV Scheme Benchmark Additional Value of investment of ` 10,000@per Unit Returns Returns Benchmark Scheme Benchmark Additional
(`) (%)^ (%)# Returns (`) (`)# Benchmark(%)## (`)##
^Past performance may or may not be sustained in the future. Returns greater than 1 year period are compounded annualized (CAGR). # CRISIL Short Term Bond Fund Index. ## CRISIL 1 year T-Bill IndexPerformance of FMP schemes, being close-ended in nature, is not strictly comparable with that of open-ended schemes since the investment strategy for FMP schemes is primarily buy-and-hold whereas open-ended schemes are actively managed.
A. Cumulative performance
Jun 28, 13 Last 1 Year 10.3496 9.11 8.76 5.89 10,917 10,881 10,593Mar 06, 13 Since Inception 10.0000 9.71 9.17 6.49 11,298 11,225 10,864
HDFC ANNUAL INTERVAL FUND - SSERIES I - PPLAN A NAV as at June 30, 2014 ` 11.2983
Period Scheme Benchmark Additional^ # Benchmark
##
B. Discrete 12 month returns (%)
Jun 28, 13 to Jun 30, 14 9.11 8.76 5.89
Date Period NAV Scheme Benchmark Additional Value of investment of ` 10,000@per Unit Returns Returns Benchmark Scheme Benchmark Additional
(`) (%)^ (%)# Returns (`) (`)# Benchmark(%)## (`)##
^Past performance may or may not be sustained in the future. Returns greater than 1 year period are compounded annualized (CAGR). # CRISIL Short Term Bond Fund Index. ## CRISIL 1 year T-Bill IndexPerformance of FMP schemes, being close-ended in nature, is not strictly comparable with that of open-ended schemes since the investment strategy for FMP schemes is primarily buy-and-hold whereas open-ended schemes are actively managed.
A. Cumulative performance
Jun 28, 13 Last 1 Year 10.3069 8.95 8.76 5.89 10,900 10,881 10,593Mar 14, 13 Since Inception 10.0000 9.40 9.08 6.46 11,235 11,192 10,845
HDFC ANNUAL INTERVAL FUND - SSERIES I - PPLAN B NAV as at June 30, 2014 ` 11.2347
Period Scheme Benchmark Additional^ # Benchmark
##
B. Discrete 12 month returns (%)
Jun 28, 13 to Jun 30, 14 8.95 8.76 5.89
Performance of dividend option under the schemes for the investors would be net of distribution tax as applicable. Load is not taken into consideration for computation of performance. N.A.: Not Available@ shows the current value of ` 10,000/- invested at the beginning of a given periodWhere either NAV or Benchmark Index value is not available for the start/end date of a concerned period, the previous date where both NAV and Benchmark Index value are available, is considered for returns computation except for since inception returns
ANIL BAMBOLI...CONTINUED

Mar 23, 12 43.951 4.00 4.00Mar 21, 13 41.388 4.00 4.00Mar 20, 14 43.809 4.00 4.00
Direct PlanMar 21, 13 41.447 4.00 4.00Mar 20, 14 44.172 4.00 4.00
Record Cum Div Dividend Per unit (`) ForDate NAV (`) Individuals & HUF Others
Record Cum Div Dividend Per unit (`) ForDate NAV (`) Individuals & HUF Others
HDFC Equity Fund (Past 3 years)
Mar 07, 12 42.778 4.00 4.00Mar 07, 13 43.247 4.00 4.00Mar 06, 14 42.484 4.00 4.00
Direct PlanMar 07, 13 43.293 4.00 4.00Mar 06, 14 42.768 4.00 4.00
Record Cum Div Dividend Per unit (`) ForDate NAV (`) Individuals & HUF Others
Record Cum Div Dividend Per unit (`) ForDate NAV (`) Individuals & HUF Others
HDFC Top 200 Fund (Past 3 years)
Mar 07, 12 22.595 2.50 2.50Feb 21, 13 22.391 2.50 2.50Feb 20, 14 21.788 2.50 2.50
Record Cum Div Dividend Per unit (`) ForDate NAV (`) Individuals & HUF Others
HDFC Capital Builder Fund (Past 3 years)
Feb 23, 12 30.629 3.00 3.00Feb 21, 13 29.331 3.00 3.00Feb 13, 14 25.019 3.00 3.00
Direct PlanFeb 21, 13 29.352 3.00 3.00Feb 13, 14 25.143 3.00 3.00
Record Cum Div Dividend Per unit (`) ForDate NAV (`) Individuals & HUF Others
HDFC Growth Fund
Record Cum Div Dividend Per unit (`) ForDate NAV (`) Individuals & HUF Others
Direct PlanFeb 21, 13 22.408 2.50 2.50Feb 20, 14 21.897 2.50 2.50
HDFC Balanced Fund (Past 3 years)
Record Cum Div Dividend Per unit (`) ForDate NAV (`) Individuals & HUF Others
Mar 01, 12 20.353 2.25 2.25Feb 27, 13 19.322 1.25 1.25Feb 26, 14 20.682 1.25 1.25
Record Cum Div Dividend Per unit (`) ForDate NAV (`) Individuals & HUF Others
Direct PlanFeb 27, 13 19.339 1.25 1.25
Mar 15, 12 29.516 3.50 3.50Feb 27, 13 27.526 3.00 3.00Feb 26, 14 25.965 3.00 3.00
Direct PlanFeb 27, 13 27.552 3.00 3.00Feb 26, 14 26.141 1.25 1.25
Record Cum Div Dividend Per unit (`) ForDate NAV (`) Individuals & HUF Others
Record Cum Div Dividend Per unit (`) ForDate NAV (`) Individuals & HUF Others
HDFC Prudence Fund (Past 3 years)
Record Cum Div Dividend Per unit (`) ForDate NAV (`) Individuals & HUF Others
Dividend Option
Dividend Option
Dividend Option
Dividend Option
Feb 16, 12 19.647 2.00 2.00Feb 14, 13 17.613 2.00 2.00Feb 20, 14 15.197 1.50 1.50
Record Cum Div Dividend Per unit (`) ForDate NAV (`) Individuals & HUF Others
HDFC Core & Satellite Fund (Past 3 years)
Record Cum Div Dividend Per unit (`) ForDate NAV (`) Individuals & HUF Others
Direct PlanFeb 14, 13 17.602 2.00 2.00Feb 20, 14 15.327 1.50 1.50
Dividend Option
Feb 09, 12 13.912 1.50 1.50Feb 07, 13 12.762 1.50 1.50Feb 06, 14 10.783 0.60 0.60
Record Cum Div Dividend Per unit (`) ForDate NAV (`) Individuals & HUF Others
HDFC Premier Multi-Cap Fund (Past 3 years)
Record Cum Div Dividend Per unit (`) ForDate NAV (`) Individuals & HUF Others
Direct PlanFeb 07, 13 12.769 1.50 1.50Feb 06, 14 10.854 0.60 0.60
Dividend Option
Dividend Option
Dividend Option
(Past 3 years)
Feb 09, 12 34.468 4.00 4.00Feb 07, 13 34.167 4.00 4.00Feb 06, 14 32.125 3.50 3.50
Direct PlanFeb 07, 13 34.186 4.00 4.00Feb 06, 14 32.304 3.50 3.50
Record Cum Div Dividend Per unit (`) ForDate NAV (`) Individuals & HUF Others
HDFC Long Term Advantage Fund (Past 3 years)
(An open-ended equity linked savings scheme with a lock-in period of 3 years)
Record Cum Div Dividend Per unit (`) ForDate NAV (`) Individuals & HUF Others
Dividend Option
Mar 01, 12 56.738 6.00 6.00Mar 14, 13 53.602 6.00 6.00Mar 13, 14 52.658 6.00 6.00
Direct PlanMar 14, 13 53.675 6.00 6.00Mar 13, 14 53.067 6.00 6.00
Record Cum Div Dividend Per unit (`) ForDate NAV (`) Individuals & HUF Others
Record Cum Div Dividend Per unit (`) ForDate NAV (`) Individuals & HUF Others
HDFC TaxSaver (Past 3 years)
(An open-ended equity linked savings scheme with a lock-in period of 3 years)Dividend Option
Wholesale PlanDec 26, 13 10.522 0.243 0.243Mar 25, 14 10.492 0.213 0.213Jun 25, 14 10.494 0.215 0.215
Direct PlanJun 25, 14 10.027 0.027 0.027
Record Cum Div Dividend Per unit (`) ForDate NAV (`) Individuals & HUF Others
Record Cum Div Dividend Per unit (`) ForDate NAV (`) Individuals & HUF Others
Quarterly (Dividend Option) (Past 3 quarters)
HDFC Arbitrage Fund
Dividend History ^
Feb 23, 12 16.058 1.50 1.50Feb 27, 13 15.980 1.15 1.15Feb 26, 14 17.588 1.75 1.75
Direct PlanFeb 27, 13 15.994 1.15 1.15
Record Cum Div Dividend Per unit (`) ForDate NAV (`) Individuals & HUF Others
Record Cum Div Dividend Per unit (`) ForDate NAV (`) Individuals & HUF Others
HDFC Mid-Cap Opportunities Fund (Past 3 years)Dividend Option
^ Past performance may or may not be sustained in the future.All dividends are on face value of `10 per Unit. After payment of the dividend, the per Unit NAV fallsto the extent of the payout and statutory levy, if any.
June 2014 63Intouchmutually

^ Past performance may or may not be sustained in the future.All dividends are on face value of ` 10 per Unit. After payment of the dividend, the per Unit NAV fallsto the extent of the payout and statutory levy, if any.* Please log on to www.hdfcfund.com for Record Date-wise listing of dividends declared
Monthly Dividend Option(Past 3 months)
Record Cum Div Dividend Per unit (`) ForDate NAV (`) Individuals & HUF Others
Apr 25, 14 11.4517 0.0600 0.0574May 26, 14 11.9359 0.0600 0.0574Jun 25, 14 12.0700 0.0600 0.0574
Direct PlanApr 25, 14 11.5002 0.0600 0.0574May 26, 14 11.9899 0.0600 0.0574Jun 25, 14 121281 0.0600 0.0574
Quarterly Dividend Option(Past 3 quarters)
Record Cum Div Dividend Per unit (`) ForDate NAV (`) Individuals & HUF Others
Dec 26, 13 11.6711 0.1800 0.1724Mar 25, 14 11.6475 0.1800 0.1724Jun 25, 14 12.5468 0.1800 0.1724
Direct PlanDec 26, 13 11.7079 0.1800 0.1724Mar 25, 14 11.6934 0.1800 0.1724Jun 25, 14 12.6068 0.1800 0.1724
HDFC High Interest Fund - Dynamic Plan
Dec 26, 13 11.2832 0.1500 0.1437Mar 25, 14 11.3712 0.1500 0.1437Jun 25, 14 11.6298 0.2000 0.1915
Direct PlanDec 26, 13 11.3628 0.1500 0.1437Mar 25, 14 11.4808 0.1500 0.1437Jun 25, 14 11.7734 0.2000 0.1915
Mar 25, 13 11.6533 0.5000 0.4286Sep 25, 13 11.1219 0.2704 0.2589Mar 25, 14 11.2992 0.4000 0.3831
Direct PlanMar 25, 13 11.6687 0.5000 0.4286Sep 25, 13 11.1749 0.0787 0.0753Mar 25, 14 11.6682 0.4000 0.3831
Record Cum Div Dividend Per unit (`) ForDate NAV (`) Individuals & HUF Others
Reecord Cum Div Dividend Per unit (`) ForDate NAV (`) Individuals & HUF Others
Quarterly (Dividend Option)(Past 3 quarters)
Half-yearly (Dividend Option)(Past 2 years)
Yearly (Dividend Option) (Past 3 years)
Dec 26, 13 10.7285 0.1500 0.1437Mar 25, 14 10.7776 0.1500 0.1437June 25, 14 11.0339 0.2000 0.1915
Direct PlanDec 26, 13 10.8060 0.1500 0.1437Mar 25, 14 10.8793 0.1500 0.1437June 25, 14 11.1701 0.2000 0.1915
Record Date Cum Dividend NAV (`) Dividend Per unit (`) ForIndividuals & HUF Others
Dividend Option (Past 3 quarters)
Mar 26, 12 12.3397 0.6000 0.5143Mar 25, 13 12.9081 0.9500 0.8142Mar 25, 14 12.4424 0.6500 0.6225
Direct PlanMar 25, 13 12.9251 0.9500 0.8142Mar 25, 14 12.5647 0.6500 0.6225
Record Date Cum Dividend NAV (`) Dividend Per unit (`) ForIndividuals & HUF Others
HDFC Income Fund
Short Term Plan (Dividend Option)
Dividend History ^
HDFC MF Monthly Income Plan (MIP)(An open-ended income scheme. Monthly income is not assured and is subject to availability of distributable surplus)
Long Term Plan (Dividend Option)
Monthly Dividend Option(Past 3 months)
Record Cum Div Dividend Per unit (`) ForDate NAV (`) Individuals & HUF Others
Apr 25, 14 13.2148 0.0700 0.0670May 26, 14 13.9426 0.0700 0.0670Jun 25, 14 14.1739 0.0700 0.0670
Direct PlanApr 25, 14 13.2909 0.0700 0.0670May 26, 14 14.0283 0.0700 0.0670Jun 25, 14 14.2664 0.0700 0.0670
Quarterly Dividend Option(Past 3 quarters)
Record Cum Div Dividend Per unit (`) ForDate NAV (`) Individuals & HUF Others
Dec 26, 13 13.2923 0.2100 0.2011Mar 25, 14 13.4660 0.2100 0.2011Jun 25, 14 14.7754 0.2100 0.2011
Direct PlanDec 26, 13 13.3492 0.2100 0.2011Mar 25, 14 13.5384 0.2100 0.2011Jun 25, 14 14.8718 0.2100 0.2011
HDFC Multiple Yield Fund (Past 3 years)
Feb 17, 12 12.8281 0.7500 0.6428Feb 14, 13 11.6548 0.7500 0.6428Feb 13, 14 11.5427 0.7500 0.7183
Direct PlanFeb 14, 13 11.6602 0.7500 0.6428Feb 13, 14 11.5842 0.7500 0.7183
Record Cum Div Dividend Per unit (`) ForDate NAV (`) Individuals & HUF Others
Reecord Cum Div Dividend Per unit (`) ForDate NAV (`) Individuals & HUF Others
(Dividend Option)
HDFC Multiple Yield Fund - Plan 2005 (Past 3 years)
Feb 17, 12 11.6454 0.7500 0.6428Feb 14, 13 11.5963 0.7500 0.6428Feb 13, 14 11.4924 0.7500 0.7183
Direct PlanFeb 14, 13 11.6048 0.7500 0.6428Feb 13, 14 11.5689 0.5000 0.4788
Record Cum Div Dividend Per unit (`) ForDate NAV (`) Individuals & HUF Others
Reecord Cum Div Dividend Per unit (`) ForDate NAV (`) Individuals & HUF Others
(Dividend Option)
HDFC Short Term PlanDividend Option - RReinvestment (Past 3 months)
Record Cum Div Dividend Per unit (`) ForDate NAV (`) Individuals & HUF Others
Reecord Cum Div Dividend Per unit (`) ForDate NAV (`) Individuals & HUF Others
Apr 25, 14 10.4026 0.0665 0.0637May 26, 14 10.4337 0.0908 0.0869Jun 25, 14 10.3993 0.0640 0.0613
Direct PlanApr 25, 14 10.4047 0.0682 0.0682May 26, 14 10.4359 0.0925 0.0925Jun 25, 14 10.4011 0.0654 0.0654
Apr 10, 14 10.1047 0.0212 0.0203
Apr 10, 14 10.1310 0.0417 0.0399
May 12, 14 10.1422 0.0418 0.0401
May 26, 14 10.1370 0.0288 0.0276
Jun 10, 14 10.1524 0.0295 0.0283
Jun 25, 14 10.1307 0.0126 0.0121
Direct Plan
Apr 10, 14 10.1052 0.0216 0.0207
Apr 10, 14 10.1314 0.0420 0.0402
May 12, 14 10.1426 0.0422 0.0404
May 26, 14 10.1374 0.0291 0.0279
Jun 10, 14 10.1527 0.0298 0.0285
Jun 25, 14 10.1313 0.0131 0.0125
Record Cum Div Dividend Per unit (`) ForDate NAV (`) Individuals & HUF Others
Record Cum Div Dividend Per unit (`) ForDate NAV (`) Individuals & HUF Others
Dividend Option - FFortnightly (Past 3 months)HDFC Short Term Opportunities Fund
Jun 25, 14 10.2875 0.1786 0.1710
Direct Plan
Jun 25, 14 10.3564 0.1762 0.1688
Record Cum Div Dividend Per unit (`) ForDate NAV (`) Individuals & HUF Others
Record Cum Div Dividend Per unit (`) ForDate NAV (`) Individuals & HUF Others
Dividend Option - Reinvestment (Past 3 months)
HDFC Medium Term Opportunities Fund
May 12, 14 10.6490 0.0555 0.0531May 26, 14 10.6432 0.0510 0.0488Jun 10, 14 10.6539 0.0593 0.0568
Direct PlanMay 12, 14 10.6514 0.0573 0.0549May 26, 14 10.6453 0.0525 0.0504Jun 10, 14 10.6561 0.06-0 0.0584
Record Cum Div Dividend Per unit (`) ForDate NAV (`) Individuals & HUF Others
Record Cum Div Dividend Per unit (`) ForDate NAV (`) Individuals & HUF Others
Dividend Option - FFortnightly (Past 2 months)HDFC High Interest Fund - Short Term Plan
64 June 2014 Intouchmutually

^ Past performance may or may not be sustained in the future.All dividends are on face value of ` 10 per Unit. After payment of the dividend, the per Unit NAV fallsto the extent of the payout and statutory levy, if any.* Please log on to www.hdfcfund.com for Record Date-wise listing of dividends declared
Dividend History ^
Weekly Dividend Option (Past 1 month)
Record Cum Div Dividend Per unit (`) For Record Cum Div Dividend Per unit (`) ForDate NAV (`) Individuals & HUF Others Date NAV (`) Individuals & HUF Others
Jun 02, 14 10.3274 0.0133 0.0128Jun 09, 14 10.3275 0.0134 0.0128Jun 16, 14 10.3270 0.0130 0.0125Jun 23, 14 10.3271 0.0131 0.0125Jun 30, 14 10.3275 0.0134 0.0128
Direct PlanJun 02, 14 10.3275 0.0134 0.0128Jun 09, 14 10.3276 0.0135 0.0129Jun 16, 14 10.3271 0.0131 0.0125Jun 23, 14 10.3272 0.0132 0.0126Jun 30, 14 10.3275 0.0134 0.0128
Apr 02, 14 10.3647 0.0793 0.0759Apr 28, 14 10.3295 0.0518 0.0496May 26, 14 10.3324 0.0541 0.0518Jun 30, 14 10.3479 0.0662 0.0634
Direct PlanApr 02, 14 10.3653 0.0797 0.0763Apr 28, 14 10.3299 0.0521 0.0499May 26, 14 10.3328 0.0544 0.0521Jun 30, 14 10.3484 0.0665 0.0637
Record Date Cum Dividend NAV (`) Dividend Per unit (`) ForIndividuals & HUF Others
Monthly Dividend Option (Past 3 months)
April 2014 Daily 10.1982 0.0590 0.0568May 2014 Daily 10.1982 0.0592 0.0566June 2014 Daily 10.1982 0.0560 0.0539
Direct PlanApril 2014 Daily 10.1982 0.0597 0.0570May 2014 Daily 10.1982 0.0592 0.0570June 2014 Daily 10.1982 0.0564 0.0542
Month Record Date Ex-ddividend NAV per Unit (`) Aggregate Dividend Per Unit (`)for the month Individuals & HUF Others
Daily Dividend Reinvestment Option* (Past 3 months)
HDFC Liquid Fund
Wholesale OptionJun 02, 14 10.1543 0.0147 0.0141Jun 09, 14 10.1564 0.0164 0.0157Jun 16, 14 10.1501 0.0115 0.0110Jun 23, 14 10.1515 0.0126 0.0120Jun 30, 14 10.1532 0.0138 0.0132
Wholesale Option - DDirect PlanJun 02, 14 10.1544 0.0148 0.0142Jun 09, 14 10.1564 0.0164 0.0157Jun 16, 14 10.1503 0.0116 0.0111Jun 23, 14 10.1516 0.0127 0.0121Jun 30, 14 10.1532 0.0139 0.0133
Record Cum Div Dividend Per unit (`) ForDate NAV (`) Individuals & HUF Others
Record Cum Div Dividend Per unit (`) ForDate NAV (`) Individuals & HUF Others
(Weekly Dividend Option) (Past 1 month)
Retail OptionJun 02, 14 10.2390 0.0141 0.0135Jun 09, 14 10.2455 0.0113 0.0108Jun 16, 14 10.2406 0.0075 0.0072Jun 23, 14 10.2457 0.0115 0.0110Jun 30, 14 10.2511 0.0156 0.0150
Retail Option - DDirect PlanJun 02, 14 10.2392 0.0142 0.0142Jun 09, 14 10.2457 0.0115 0.0115Jun 16, 14 10.2408 0.0076 0.0076Jun 23, 14 10.2458 0.0115 0.0115Jun 30, 14 10.2512 0.0158 0.0158
Record Cum Div Dividend Per unit (`) ForDate NAV (`) Individuals & HUF Others
Reecord Cum Div Dividend Per unit (`) ForDate NAV (`) Individuals & HUF Others
(Weekly Dividend Reinvestment Option) (Past 1 month)
HDFC Floating Rate Income Fund - Long Term Plan
Wholesale OptionApr 02, 14 10.2540 0.0857 0.0820Apr 28, 14 10.2084 0.0501 0.0480May 26, 14 10.2210 0.0600 0.0574Jun 30, 14 10.2329 0.0692 0.0663
Wholesale Option - DDirect PlanApr 02, 14 10.2545 0.0860 0.0824Apr 28, 14 10.2090 0.0506 0.0485May 26, 14 10.2214 0.0602 0.0577Jun 30, 14 10.2334 0.0696 0.0666
Record Date Cum Dividend NAV (`) Dividend Per unit (`) ForIndividuals & HUF Others
Monthly Dividend Option (Past 3 months)
Wholesale OptionApril 2014 Daily 10.0809 0.0580 0.0555May 2014 Daily 10.0809 0.0658 0.0628June 2014 Daily 10.0809 0.0586 0.0562
Wholesale Option - DDirect PlanApril 2014 Daily 10.0809 0.0584 0.0559May 2014 Daily 10.0809 0.0660 0.0634June 2014 Daily 10.0809 0.0590 0.0565
Month Record Date Ex-ddividend NAV per Unit (`) Aggregate Dividend Per Unit (`)for the month Individuals & HUF Others
Daily Dividend Reinvestment Option* (Past 3 months)
HDFC Floating Rate Income Fund - Short Term Plan
HDFC Gilt Fund (Past 3 quarters)
Dec 26, 13 11.0769 0.2000 0.1915Mar 25, 14 11.0671 0.1500 0.1437Jun 25, 14 11.1624 0.1500 0.1437
Direct PlanDec 26, 13 11.1093 0.2000 0.1915Mar 25, 14 11.1075 0.1500 0.1437Jun 25, 14 11.1624 0.2117 0.1437
Mar 25, 14 10.6364 0.1000 0.0958Jun 25, 14 10.9535 0.2000 0.1915
Direct PlanMar 25, 14 10.6703 0.1000 0.0958Jun 25, 14 10.9973 0.2000 0.1915
Record Cum Div Dividend Per unit (`) ForDate NAV (`) Individuals & HUF Others
Reecord Cum Div Dividend Per unit (`) ForDate NAV (`) Individuals & HUF Others
Short Term Plan (Dividend Option) Long Term Plan (Dividend Option)
June 2014 65Intouchmutually

Disclaimer:
The information contained herein should not be altered in any way, transmitted to, copiedor distributed, in part or in whole, to any other person or to the media or reproduced in anyform, without prior written consent of HDFC Asset Management Company Limited (HDFC AMC)or the relevant owner of the intellectual property, as the case may be. All Intellectual propertyand intellectual property rights belong to the relevant owner of the intellectual property, and“Intouch Mutually” is a trademark of HDFC AMC.
Any information herein contained does not constitute and shall be deemed not to consti-tute an advice, an offer to sell/ purchase or as an invitation or solicitation to do so for any secu-rities of any entity, and further, HDFC AMC / its subsidiaries / affiliates / sponsors / trustee (HDFCAMC Group) or their officers, employees, personnel, directors may be associated in a commer-cial, professional or personal capacity or may have a commercial interest including as propri-etary traders in or with the securities and/ or companies or issues or matters as contained in thispublication and such commercial capacity or interest whether or not differing with or conflictingwith this publication, shall not make or render (HDFC AMC Group) liable in any manner what-soever & (HDFC AMC Group) or any of their officers, employees, personnel, directors shall notbe liable for any loss, damage, liability whatsoever for any direct or indirect loss arising from theuse or access of any information that may be displayed in this publication from time to time.Recipients of the information contained herein should exercise due care and caution and readthe Scheme Information Document(s) and Statement of Additional Information (including if nec-essary, obtaining the advice of tax / legal / accounting / financial / other professionals) prior totaking of any decision, acting or omitting to act, on the basis of the information contained here-in. The printing and mailing cost of this newsletter is charged to the respective schemes subjectto Securities & Exchange Board of India (Mutual Funds) Regulations, 1996.
The author’s opinions, beliefs and viewpoints published in Intouch Mutually (Page No. 4)are his own views and not of HDFC AMC Group, or any of their officers, employees, personneland directors. HDFC AMC Group or any of their officers, employees, personnel, directors do notaccept responsibility for the author’s content and make no representation as to the accuracy,completeness or reliability of the author’s content and hereby disclaim any liability with regardto the same.
HDFC Index Fund – SENSEX Plan & SENSEX Plus Plan (“Schemes”) is based on the S&P BSESENSEX Index. S&P® is a registered trademark of S&P Financial Services Limited (S&P). BSE®and SENSEX® are registered trademarks of BSE Limited. The Schemes is not sponsored,endorsed marketed or promoted by S&P, BSE or their respective affiliates. Please refer to theScheme Information Document for disclaimers w.r.t. S&P BSE SENSEX Index.
MUTUAL FUND INVESTMENTS ARE SUBJECT TO MARKETRISKS, READ ALL SCHEME RELATED DOCUMENTS CAREFULLY.
HDFC Cash Management Fund - Treasury Advantage Plan
Retail OptionJun 02, 14 10.0795 0.0133 0.0127Jun 09, 14 10.0816 0.0149 0.0142Jun 16, 14 10.0757 0.0103 0.0098Jun 23, 14 10.0767 0.0111 0.0106Jun 30, 14 10.0781 0.0121 0.0116
Retail Option - DDirect PlanJun 02, 14 10.0808 0.0142 0.0136Jun 09, 14 10.0829 0.0159 0.0152Jun 16, 14 10.0770 0.0113 0.0108Jun 23, 14 10.0782 0.0122 0.0117Jun 30, 14 10.0795 0.0133 0.0127
Wholesale OptionJun 02, 14 10.0807 0.0142 0.0136Jun 09, 14 10.0828 0.0158 0.0151
Jun 16, 14 10.0769 0.0112 0.0107Jun 23, 14 10.0779 0.0120 0.0115Jun 30, 14 10.0792 0.0130 0.0125
Record Cum Div Dividend Per unit (`) ForDate NAV (`) Individuals & HUF Others
Reecord Cum Div Dividend Per unit (`) ForDate NAV (`) Individuals & HUF Others
Weekly Dividend Option (Past 1 month)
Monthly Dividend Option (Past 3 months)
Daily Dividend Reinvestment Option* (Past 3 months)
HDFC Cash Management Fund - Call Plan
Month Record Date Ex-ddividend NAV per Unit (`) Aggregate Dividend Per Unit (`)for the month Individuals & HUF Others
Retail OptionApril 2014 Daily 10.0315 0.0511 0.0490May 2014 Daily 10.0315 0.0598 0.0572June 2014 Daily 10.0315 0.0528 0.0505
Retail Option - DDirect PlanApril 2014 Daily 10.0315 0.0552 0.0530May 2014 Daily 10.0315 0.0640 0.0614June 2014 Daily 10.0315 0.0574 0.0549
April 2014 Daily 10.4266 0.0527 0.0507May 2014 Daily 10.4266 0.0534 0.0512June 2014 Daily 10.4266 0.0527 0.0503
Direct PlanApril 2014 Daily 10.4266 0.0532 0.0507May 2014 Daily 10.4266 0.0535 0.0515June 2014 Daily 10.4266 0.0528 0.0508
Month Record Date Ex-ddividend NAV per Unit (`) Aggregate Dividend Per Unit (`)for the month Individuals & HUF Others
Record Cum Div Dividend Per unit (`) ForDate NAV (`) Individuals & HUF Others
Retail OptionApr 28, 14 10.1065 0.0441 0.0422May 26, 14 10.1194 0.0541 0.0518Jun 30, 14 10.1293 0.0618 0.0592
Retail Option - DDirect PlanApr 28, 14 10.2093 0.0073 0.0069May 26, 14 10.2757 0.0075 0.0072Jun 30, 14 10.3539 0.0077 0.0074
Wholesale OptionApr 28, 14 10.1109 0.0475 0.0455May 26, 14 10.1242 0.0578 0.0554Jun 30, 14 10.1351 0.0663 0.0635
Daily Dividend Reinvestment Option* (Past 3 months)
HDFC Cash Management Fund - Savings PlanDaily Dividend Reinvestment Option* (Past 3 months)
Month Record Date Ex-ddividend NAV per Unit (`) Aggregate Dividend Per Unit (`)for the month Individuals & HUF Others
Weekly Dividend Option (Past 1 month)
Jun 06, 14 10.6423 0.0137 0.0131Jun 13, 14 10.6421 0.0136 0.0130Jun 20, 14 10.6421 0.0136 0.0130Jun 27, 14 10.6419 0.0134 0.0128
Direct PlanJun 06, 14 10.6424 0.0138 0.0132Jun 13, 14 10.6422 0.0137 0.0131Jun 20, 14 10.6422 0.0137 0.0131Jun 27, 14 10.6419 0.0134 0.0128
Record Cum Div Dividend Per unit (`) ForDate NAV (`) Individuals & HUF Others
Record Cum Div Dividend Per unit (`) ForDate NAV (`) Individuals & HUF Others
April 2014 Daily 10.6364 0.0620 0.0595May 2014 Daily 10.6364 0.0618 0.0592June 2014 Daily 10.6364 0.0586 0.0562
Direct PlanApril 2014 Daily 10.6364 0.0625 0.0598May 2014 Daily 10.6364 0.0621 0.0595June 2014 Daily 10.6364 0.0592 0.0564
Dividend History ^
^ Past performance may or may not be sustained in the future.All dividends are on face value of ` 10 per Unit. After payment of the dividend, the per Unit NAV fallsto the extent of the payout and statutory levy, if any.* Please log on to www.hdfcfund.com for Record Date-wise listing of dividends declared
66 June 2014 Intouchmutually

INVESTOR SERVICE CENTRES (ISCs)ANDHRA PRADESHHDFC AMC Ltd., 6-3-883/7, IInd Floor, Saphire Square, Somajiguda, Hyderabad - 500 282.Tel.: (040) 23417401 / 02 / 03 / 04 / 05, Fax: (040) 23417407. HDFC AMC Ltd., 18-2-299/B, 1st Floor, Leela MahalCircle, Tirumala Bypass Road, Tirupati - 517 507. Tel: (0877) 2222 871 / 872 / 873 / 874, Fax: (0877) 2222689. HDFC AMC Ltd., 2nd Floor, Centurion Bank Complex,Near Benz Circle, M. G. Road, Vijayawada - 520 010. Tel. No: (0866) 3988029. HDFC AMC Ltd., First Floor, Saigopal Arcade, WaltairMain Road, Siripuram, Visakhapatnam - 530 003. Tel: (0891) 2769636, 6450306 / 9685 / 7584, Fax. No.: (0891) 2738728. HDFC AMC Ltd., 2-5-83/84, 1st Floor, MitralaxmiNarayana Arcade, Nakkala Gutta, Hanmakonda,Warangal - 506 002. Tel: (0870) 2566 005 / 006 / 007 / 008/ 009, Fax: (0870) 2566010. ASSAMHDFC AMC Ltd., Premises- 1C, 1st Floor, GanpatiEnclave, G.S.Road, Guwahatii - 781 007. Tel: (0361) 2464759/60. Fax: (0361) 2464758. BIHARHDFC AMC Ltd., Ishwari Complex, 1st Floor, Dr. Rajendra Prasad Road, Bhagalpur - 812 002. Tel: (0641) 2300 390, Fax: (0641) 2300391. HDFC AMC Ltd., Ravi Market, 1st Floor, JawaharlalRoad, Muzaffarpur – 842001.Tel: (0621) 2245036/37, Fax: (0621) 2245037. HDFC AMC Ltd., C/o Hera Enclave (Above TATADocomo Office), 1st Floor, New Dak Bunglow Road,Patna - 800 001. Tel: (0612) 6457554/6457557/3201439, Telefax: (0612) 2200747. CHHATTISGARHHDFC AMC Ltd., Shop No 1, Ground Floor, Old Sada Office Block, Nehru Nagar East, Bhilai - 490020. Tel: (0788) 4092948, 4092846, Fax: (0788) 4092901. HDFC AMC Ltd., 2nd Floor, Rama Trade Centre,Opposite Rajiv Plaza, Near Bus stand, Bilaspur – 495 001. Tel: (07752) 400305/ 06. Fax: (07752) 400307. HDFC AMC Ltd., Ground Floor, Chawla Complex,Devendra Nagar, Sai Nagar Road, Near VanijyaBhawan, Near Indhira Gandhi Square, Raipur - 492 001. Tel: (0771) 4020 167 / 168. DELHIHDFC AMC Ltd., Ground Floor - 2 & 3 and First Floor,Prakashdeep Building, 7, Tolstoy Marg, ConnaughtPlace, New Delhi - 110 001. Tel: (011) 6632 4000,Fax: (011) 23351317 /18. HDFC AMC Ltd. Unit Nos. 402, 404, 406, 4th floor, Mahatta Tower, 54 B-1 Block, Community Center , Janakpuri, New Delhi – 110 058. Fax: (011) 41082131 HDFC AMC Ltd., 134/4 , Bhandari House, Lala Lajpat Rai Marg, Kailash Colony - Main Road,Near Kailash Colony Metro Station, South Delhi, New Delhi – 110 048. Tel : 011-29244801/02. Fax : 011-29244805.GOAHDFC AMC Ltd., Ground Floor, G3 & G4, Jivottam,Minguel Miranda Road, Off. Abade Faria Road,Margao - 403 601. Salcete. Tel: (0832) 2737410 / 11.Fax: (0832) 2736477. HDFC AMC Ltd., S1, Second Floor, Above Axis Bank,Edcon Centre, Angod, Mapusa - 403 507, Bardez, Goa. Tel: (0832) 2253 460 / 461, Fax: (0832) 2253465. HDFC AMC Ltd., A-3, First Floor, Krishna Building, Opp. Education Department, Behind SusheelaBuilding, G. P. Road, Panaji - 403 001. Tel: 0832 - 2425609, 2425610, Fax: 0832 - 2425614. HDFC AMC Ltd., 6, Ground Floor, Pereira Chambers,Padre Jose Vaz Road, Vasco - 403 802, Mormugao. Tel: (0832) 2513 402 / 406, Fax: (0832) 2513448. GUJARATHDFC AMC Ltd., 2nd Floor, Megha House, BesidesGRUH House, Mithakhali Six Roads, Ahmedaabad - 380 009. Tel.: 079 – 40220099/00, Fax: 079 - 40050506. HDFC AMC Ltd., Maruti Sharanam, No.117, 1st Floor, Anand-Vidhyanagar Road, Opposite Nandbhumi PartyPlot, Anand - 388 001. Tel: (02692) - 398200, Fax: (02692) - 398222.
HDFC AMC Ltd., 3rd Floor, Shreemangalam Complex,Above IDBI Bank, Patel Society Road, Ward No. 1,Kasak Circle, Bharuch - 392 012. Tel: (0264) 2227205, Fax: (0264) 2227206. HDFC AMC Ltd., 2nd Floor, Gangotri Plaza, OppositeDaxinamurty School, Waghawadi Road, Bhavnagar - 364 001. Tel: (0278) - 3988029, Fax: (0278) - 3984039. HDFC AMC Ltd., 1st Floor, B Wing, Katira Complex,RTO Circle, Bhuj - 370 001. Tel: (02832) 223 223, Fax: (02832) 251. 946 HDFC AMC Ltd., 2nd Floor, Keshav Complex, P N Marg, Opposite Dhanvantry, Jamnagar - 361 001.Tel: (0288) - 3988029, Fax: (0288) - 3982426. HDFC AMC Ltd., 1st Floor, Nos. 104 – 105, MaryGold-2 Complex, Opp. Bahhaudin College,College Road, Junagadh - 362001. Tel: (0285) 2670622/23, Fax: (0285) 2670624. HDFC AMC Ltd., 2nd Floor, Rajendra Estate, State Highway, Mehsana - 384 002. Tel: (02762) 302000. Fax: (02762) 302020. HDFC AMC Ltd., 1st Floor, Nandini Complex, Above HDFC Bank, Opp. Daboo Hospital, Station Road, Navsari- 396445. Tel: (02637) 252681/82/83, Fax: (02637) 252684. HDFC AMC Ltd., 2nd Floor, Shiv Darshan, Dr. Radha Krishnan Road, 5, Jagnath, Plot Corner,Rajkot - 360 001. Tel: 0281- 6624881 / 82, Fax: 0281 - 6624883. HDFC AMC Ltd., U1 - U3, Jolly Plaza, Opp. AthwaGate Police Station, Athwa Gate, Surat - 395 001. Tel: 0261 – 2460082 / 83, Fax: 0261 - 2460091. HDFC AMC Ltd., Upper Ground Floor, Gokulesh, R. C. Dutt Road, Vadodara - 390 007.Tel: 0265 - 6621110 / 20, Fax: 0265 - 6621150. HDFC AMC Ltd., 5-B, 2nd Floor, Sapphire Building,Daulatnagar, Chala-Vapi Road, Vapi - 396 191. Tel: (0260) 3983900, Fax: (0260) 3983908. HARYANAHDFC AMC Ltd., 1st Floor, Sudarshan Tower, CrossRoad # 1, Nicholson Road, Ambala Cantt -133 001. Tel: (0171) 2631995/6, Fax: (0171) 2631994. HDFC AMC Ltd., TA - 12A, 15-18, Third Floor, Crown Plaza, Sector 15A, Mathura Road, Faridabad - 121 001. Tel: (0124) 2221 338 / 339 /341 / 342 / 343, Fax: (0129) 2221340. HDFC AMC Ltd., Premises 105, 106 & 107, 1st Floor, Vipul Agora Building, MG Road, Gurgaon - 122 002. Tel: (0124) 2560 450/ 51, Fax: (0124) 2560455. HDFC AMC Ltd., 1175 B Royal 1, 1st Floor, AdjoiningGurudawara, G.T Road, Panipat - 132 103. Tel: (0180) 3985400/ 01, Fax: (0180) 3985403. HIMACHAL PRADESHHDFC AMC Ltd., 2nd Floor, Opposite Town Hall, 30,The Mall, Shimla – 171 001. Tel: (0177) 2816861. JAMMU & KASSHMIRHDFC AMC Ltd., Hall No-102 A/2, South Block, Bahu Plaza, Gandhi Nagar, Jammu - 180 012. Tel: (0191)-2477911/12/13 / (0191) 2474297/98/99. JHARKHANDHDFC AMC Ltd., Vardhan Complex, 1st Floor, Opp. Woodland Showroom, Bank More, Dhanbad - 826 001. Tel: (0326) 3205352, 2300552,Fax: (0326) 2301756. HDFC AMC Ltd., Gayatri Enclave, 2nd Floor, "K Road", Bistupur, Jamshedpur - 831 001. Tel: (0657) 3021203/05, Telefax: (0657) 3021204. HDFC AMC Ltd., Pradhan Towers, 1st Floor, 5, Main Road, Ranchi - 834 001. Tel: (0651) 6003358, 3242077. Fax: (0651) 3988029. KARNATAKAHDFC AMC Ltd., Nitesh Broadway, No. 9/3, 1-A, Ground Floor, M. G. Road, Opposite Trinity Metro Station, Bangalore – 560001. Tel: 080-66205300, Fax: 080-41125255. HDFC AMC Ltd., # 493, 1st Floor, 4th Cross, 2nd Main, Sampige Road, Malleshwaram, Bangalore - 560 003. HDFC AMC Ltd., Garla Garnet No. 119/A/36, 9th Main, 4th Block, Jayanagar, Bangalore – 560011. Tel No: (080) 41460260/61/62, Fax No: (080) 41460263. HDFC AMC Ltd., # 145, 1st Floor, 60 ft Road, 5th Block, Koramangala, Bangalore - 560 034. HDFC AMC Ltd., Premises No. 4830 / B, First Floor, Dr. Ambedkar Road, Opp. Civil Medical College, Belgaum - 590 002. Tel: (0831) 4206 915 / 916 / 918,Fax: (0831) 4206919.
HDFC AMC Ltd., Office No. 39 (Old No - 41), GroundFloor, Behind Maremma Temple, Opposite HDFC Bank,Kappagal Road, Bellary – 583103. Tel: 08392-256577. Fax: 08392-256575. HDFC AMC Ltd., 190/3, 1st Floor, S.V.C. Plaza, Opposite Mothi Talkies, Gandhi Circle, Davangere - 577 002. Tel: (08192) 250 240 / 241 /242, Fax: (08192) 250243. HDFC AMC Ltd., No. 1, First Floor, Revankar Comforts,Vivekanand Road, Court Circle, Hubli - 580 029. Tel: (0836) 4252 294 / 95. Fax: (0836) 4252 290. HDFC AMC Ltd., UG-II, 6 & 7, Upper Ground Floor, Maximus Commercial Complex, Light House Hill Road, Opp. KMC, Mangalore - 575 001. Tel. 0824 – 6620667/668, Fax: 0824 – 6620666. HDFC AMC Ltd., No. 2918, CH 51 / 1 B, 1st Floor, Patel Mansion, Kantharaj Urs Road, Saraswathipuram, Mysore - 570 009. Tel: (0821) 4000 530, Fax: (0821) 4000 535. KERALAHDFC AMC Ltd., 3rd Floor, City Mall, Opposite YMCA, Kannur Road, Calicuut - 673 001. Tel: (0495) - 4099222 / 333, 3982310, Fax: (0495) - 3982330. HDFC AMC Ltd., Ground Floor, Cinema cumCommercial Complex, Behind Ravipuram Bus Stop, M. G. Road, Kochi - 682 016. Tel: 0484 - 2357707 /8, 3243058 / 59, Fax: 0484 - 2358462. HDFC AMC Ltd., 14/868, Ground Floor, Sri KrishnaComplex, Coimbatore Road, Palghat - 678 001. Tel: (0491) 2548300/302, 6452188, Fax: (0491) 2548303. HDFC AMC Ltd., 2nd Floor, E-Town Shopping, College Road, East Fort, Thrissur - 680 005. Tel: (0487) 2441976. Telefax: (0487) 2422925. HDFC AMC Ltd., 1st Floor, Kaniamparambil Arcade, G S Junction, Shastri Road, Kottayam - 686 001. Tel: (0481) 3018392/93. Fax: (0481) 3018397. HDFC AMC Ltd., Ground Floor, Bhadra Tower, Cotton Hill Road, Vazhuthacaud, Thycaud P.O.,Trivandrum – 695 014. Tel: (0471) 3983 730 / 731 /732 Fax: (0471) 3983738. MADHYA PRADESHHDFC AMC Ltd., 1st Floor, Ranjeet Tower, 8, Zone-II, M. P. Nagar, Bhopal - 462 011.Tel: 0755 - 4285385, 4246995, Fax: 0755 - 4058890. HDFC AMC Ltd., M1, M2 & M3, Mezzanine Floor, Sterling Arcade,15 / 3, Race Course Road, Indore - 452 001. Tel: 0731 - 4022241 / 42. Fax: 0731 - 4245436. HDFC AMC Ltd., First Floor, Muthye UdyogBhawan,1039, Wright Town, Opp. TelephoneExchange, Jabalppur - 482 002. Tel: (0761) - 4049800,3988029 Fax: (0761) - 4068814. HDFC AMC Ltd., First Floor, Alakhnanda Towers, Shrimant Madhav Rao Scindia Marg, City Centre, Gwalior - 474 001. Tel: (0751) - 4066060, 3988029 Fax: (0751) – 3982803. MAHARASHTRAHDFC AMC Ltd., 1st Floor, Amar Arcade - 2, Opp. Rajapeth Police Station, Raja Peth, Amravati - 444 601. Tel: (0721) 2562 112 / 113 Fax: (0721) 2564115. HDFC AMC Ltd., 2nd Floor, Renuka CommercialComplex, Samarth Nagar, Nirala Bazar, NageshwarWadi Road, Aurangabad - 431 001. Tel: (0240) 3988029, Fax: (0240) 3982068. HDFC AMC Ltd., 138, Ground Floor, Kavya RatnavaliChowk, Omkareshwar Road, Jalgaon – 425 002. Tel: (0257) 3982100/ 01. Fax: (0257) 3982114. HDFC AMC Ltd., Royal Prestige, C1/C9, 1st Floor, E - Ward, Sykes Extension, Rajarampuri Road,Kolhapur - 416 008. Tel: (0231) - 3988029, Fax: (0231) - 3982060. HDFC AMC Ltd.**, Premises Nos.. F1, 2, 3 & 4, 1st Floor, “Center Square”, S.V. Road, Andheri (W),Mumbai – 400 058. Tel: (022) 26708239 / 26285389.Fax: (022) 26241131. HDFC AMC Ltd.** Shop # 7, Abhilasha Building,Punjabi Lane, Borivali (W), Mumbai - 400 092. Tel: (022) 28952702/ 28901497, Fax: (022) 28949392. HDFC AMC Ltd.,* HUL House, 2nd floor, H.T. ParekhMarg, 165-166 Backbay Reclamation, Churchgate,Mumbai – 400 020 Tel: (022) 66316333, Fax: (022) 66580200.
June 2014 67Intouchmutually
(Continued on next page)

Intouchmutually, June 2014, Registered with Registrar of Newspapers under RNI No. MAHENG/2003/10804
Registered Office: HUL House, 2nd floor, H.T. Parekh Marg, 165-166 Backbay Reclamation, Churchgate, Mumbai – 400 020.
Published and printed by Shailendra Sharad Kalelkar for and on behalf of Business Standard Limited from H4, Paragon Condominium, Opposite Century Mills, P B Marg, Worli, Mumbai 400013, and printed at M. P. Printers (A Unit of D.B.Corp. Ltd.), B- 220, Industrial Area, Phase – II, Noida – 201305 ( U.P.) India. Editor: Rajiv Shirali.
HDFC AMC Ltd., Mistry Bhavan, 2nd Floor, 122, Backbay Reclamation, Dinsha Vachha Road,Churchgate, Mumbai - 400 020. Tel: (022) 60006767, Fax: (022) 66580211. HDFC AMC Ltd.**, Shop No. 1 & 2, Ground Floor, Atlantic Tower, R B Mehta Road, Near Railway Station,Ghatkopar (East), Mumbai - 400 077. Tel: (022) 6525 3409/08/06/21, Fax: (022) 2511 6805. HDFC AMC Ltd.**, Unit No. 101, 1st Floor, Landmark Building, 136 Hill Road,Opp. St. PetersChurch, Bandra (West), Mumbai - 400 050. Tel: (022) 2643 4760 / 762 / 763 / 764, Fax: (022) 2643 4768. HDFC AMC Ltd.**, Shop no. 1 & 2, Ground floor,Gurangi Chambers, Opp. Damani Chambers, Near Teen Haath Naka, LBS Marg, Thane (West) - 400 602. Tel: (022) 2538 5659, 2539 1125, 2538 6848, 6502 0205, 6536 5246,6536 5245, 6414 2389, Fax: (022) 25301125. HDFC AMC Ltd., 106-110, 2nd Floor, Shriram ShyamTowers, Near NIT Building, Kingsway, Sadar, Nagpur - 440 001. Tel: (0712) 663 0301/02/04, Fax: (0712) 663 0206. HDFC AMC Ltd. G- 1 & G-2, "Suyojit Heights", Opp.Rajiv Gandhi Bhavan, Sharanpur Road, Nashik - 422 002. Tel: (0253) 6611831 / 32. Fax: (0253) 6611836. HDFC AMC Ltd., 6, Chetana Apartment, 2423, East Street, Pune Camp, Pune - 411 001. Tel.: (020) 41223301/02, Fax: (020) 41223310. HDFC AMC Ltd., Ground Floor, City Mall, University Circle, Ganeshkhind Road, Pune - 411 007.Tel: (020) 66073301, Fax: (020) 66073310. HDFC AMC Ltd.,** Office No. 13, Shanti CenterPremises, Plot No. 8, Sector 17, Vashi, Navi Mumbai - 400 703. Tel: (022) 39880299. Fax: (022) 39855612.HDFC AMC Ltd.**, 1st Floor, Anant Kuti (BibikarBldg.), Manpada Road, Opp. Muncipal CorporationBldg., Dombivli (East), Mumbai - 421 201. Tel: (0251) 2860 648 / 649 / 645 / 656, Fax: (0251) 2863953. ORISSAAHDFC AMC Ltd., Sri Jagannath Complex, 1st Floor, Opposite Hari - Omm Bhawan, Barbil - 758 035. Tel: 09238106515 / 09238106525, Fax: (06767) 275565. HDFC AMC Ltd., Vinayak, 2nd Floor, 96, Janpath, Bhubaneswar - 751 001. Tel: (0674) 6450502 / 1502, Fax: 0674 - 2531483. HDFC AMC Ltd., 1st Floor, Plot No. 2690 (P),Bajrakabati Road, Ranihat, Cuttack – 753 001. Tel: (0671) 2323724/ 725, Fax: (0671) 2324741. HDFC AMC Ltd., Praful Tower, 1st Floor, PanposhRoad, Rourkela - 769 004. Tel: (0661) 3988029,3982060/70, Fax: (0661) 3982068. HDFC AMC Ltd., Kadambari Complex, 1st Floor, Unit - 4, Nayapara, Golbazar, Sambalpur - 768 001. Tel: (0663) 2400 323 / 339, Fax: (0663) 2400324. PONDICHERRYHDFC AMC Ltd., No.17, I Floor, Sree VelayudhamComplex, Near Indhira Gandhi Square, Natesan Nagar, Pondicherry - 605 005. Tel: (0413) 3043 293 / 500 /600. Fax: (0413) 2206776. PUNJABHDFC AMC Ltd., SCO-28, 1st Floor, Taneja Towers, District Shopping Complex, Ranjit Avenue, Amriitsar -143 001. Tel: (0183) 3988028 /29/ 2570,Fax: (0183) 3982599. HDFC AMC Ltd., Ground Floor, Liberty Chowk, Corner Building, Municipal No. 83 - B, 3A, Bhatinda - 151 001. Tel.: (0164) 5001982,
Fax: (0164) 5191283. HDFC AMC Ltd., 1st Floor, SCO- 2909- 2910, Sector - 22-C, Opp. Hotel J W Marriot, Chandigarh - 160 022. Tel: (0172) 5050888, Fax: (0172) 277 1219. HDFC AMC Ltd., Ground Floor , Eminent Mall, SutheriRoad, Near Indusind Bank, Hoshiarpur – 146 001. Tel : 01882- 502029, Fax : 01882- 502078.HDFC AMC Ltd., 2nd Floor, Above ING Vysya Bank, Adjacent to Sekhon Grand Hotel, Namdev Chowk, G T Road, Jalandhar City - 144 001. Tel: (0181) 3988029 / 970, Fax: (0181) 3982966. HDFC AMC Ltd., SCO 122, Feroze Gandhi Market, Ludhiana - 141 001. Tel.: (0161) 277 4321 / 5014321. Fax: (0161) 3013838. HDFC AMC Ltd., SCO no - 70 , Ground Floor, New Leela Bhawan Market, Patiala -147 001.Tel : 0175 - 5010082, Fax : 0175 - 5010084.RAJASTHANHDFC AMC Ltd., 4th Floor, K.C. Complex, Opp. Daulat Bagh, Ajmer - 305 001. Tel: (0145) 3099000.Fax: (0145) 3099001. HDFC AMC Ltd., “Moondhra Bhavan”, 3-Ajmer Road, Jaipur - 302 001. Tel: (0141) 511 6681/ 82 , 237 4968, Fax: (0141) 5111126. HDFC AMC Ltd., Gulab Singh Bhavan, 11, Chopasni Road, Jodhpur - 342 003. Tel: (0291) 510 1927, 510 1937, Fax: (0291) 510 5919. HDFC AMC Ltd., 1st Floor, Gowardhan Plaza, 25, Trench Colony, Opposite Lok Kalamandal, Udaipur - 313 001. Tel: (0294) 3988029, Fax: (0294) 3982000. TAMIL NADUHDFC AMC Ltd., ITC Centre, 1st Floor, 760, Anna Salai, Chennai - 600 002. Tel: (044) 43979797 /43979716, Fax: (044) 28415855. HDFC AMC Ltd., 1371A, Ground Floor, Nadar Building, Trichy Road, Coimbatore - 641 018. Tel: (0422) 4391861/62/63. Fax: (0422) 4391714. HDFC AMC Ltd., 127 C/3 East Veli Street, Madurai - 625 001. TeleFax: (0452) 3988029. HDFC AMC Ltd., 1st Floor, No1 Bhimsena GardenStreet, Royapettah High Road, Mylapore, Chennai – 600 004. Tel: (044) 30913060, Fax: (044) 30913082. HDFC AMC Ltd., 1st floor, Ram Complex, No. 454/3, Meyanoor Main Road, Salemm - 636 009. HDFC AMC Ltd., 1st floor, No. 142/7, Sri Balaji Arcade, Opp. Alagar Jewellery, Trivandrum Road, Palayamkottai, Tirunelveli - 627 002.Tel: (0462) 2576174, Fax: (0462) 2576173. Tel: (0427) 3982680/700. Fax: (0427) 2333617. HDFC AMC Ltd., No. 60, Sri Krishna Arcade, First Floor, Tennur High Road, Tennur, Trichy - 620 017.Tel: (0431) 3982830, Fax: (0431) 3982835. HDFC AMC Ltd., Premises No.73, 1st Floor Door No. 73/19, Thiyagarjapuram Officer’sLine Officer’s Line, Vellore - 632 001, Tel: (0416) 2214670/2. Fax: (0416) 2214671. UTTARAKHANDHDFC AMC Ltd., 76, Rajpur Road, Near RTO, Dehradun - 248 001. Tel: (0135) 3988029 / 7434, Fax: (0135) 3987444. HDFC AMC Ltd., Plot No. 1, 1st Floor, Durga City Centre, Bhotia Parao, Nainital Road,Haldwani - 263 139. Tel: (05946) 285286 Fax: (05946) 285290.HDFC AMC Ltd., 1st Floor, Kumar Complex, Chandracharya Chowk, Haridwar - 249407 Tel: (01334) 222406/7 Fax: (01334) 222410. UTTAR PRADESHHDFC AMC Ltd., B2, 1st Floor, 9/4, Shankar Point,Sanjay Place, Agra - 282 002. Tel: (0562) 3984761-73, Fax: (0562) 3984777.
HDFC AMC Ltd., 3/260-A, Arena Complex, Laxmibai Marg, Marris Road, Aligarh - 202 001. Tel: (0571) 2740 770 / 771 / 772, Fax: (0571) 2740772. HDFC AMC Ltd., 3rd Floor, Agarwal Arcade, Hyundai Motors Showroom, 4 Sardar Patel Marg, Civil Lines, Allahabad - 211 001. Tel: (0532) 2561 035/036/038, Fax: (0532) 2561035. HDFC AMC Ltd., 146 Civil Lines, 1st Floor, Gupta Complex, Near Circuit House Chouraha, Bareilly - 243 001. Tel: (0581) 2510 749 / 759, Fax: (0581) 2510709. HDFC AMC Ltd., D-2, 1st Floor, Raj Nagar DistrictCentre, Raj Nagar, Gaziabad - 201 010. Tel: (0120)301 0635, Fax: (0120) 3010636. HDFC AMC Ltd., 4th Floor, A.D. Tower Compound,Bank Road, Gorakhpur -273 001, Tel. No: (0551) 6060011/2/3. HDFC AMC Ltd., 101 & 201, Sai Arcade, 16/34 Bhargava Estate, Civil Lines, Kanpur - 208 001. Tel: (0512) 3935592/93/94, Fax: (0512) 3935596. HDFC AMC Ltd., 1st Floor, Narain Ford Building, 4 Shah Najaf Road, Hazratganj, Lucknow - 226 001. Tel: (0522) 4155500/ 01, Fax: (0522) 4155555. HDFC AMC Ltd., 143/145/1, Ganpati Plaza, GroundFloor, Magal Pandey Nagar, Meerut - 250 005. Tel: (0121) 2602 380 / 2601 965, Fax: (0121) 2602380. HDFC AMC Ltd., Parsvnath Plaza-II, UGF Hall No.4,Delhi Road, Moradabbad - 244 001. Tel: (0591) 3988029 / 3982131. Fax: (0591) 3982137. HDFC AMC Ltd., K-24/25, First Floor, Pearl Plaza Building, Sector-18, Noida - 204 301. Tel: (0120) 432 5757/ 5959. Fax: (0120) 423 4349. HDFC AMC Ltd., D-64/127, 4th Floor, ArihantComplex, Sigra, Varanasi - 221 010. Tel: (0542) 6450711/ 6450712. WEST BENGALHDFC AMC Ltd., 2nd Floor, Chatterjee Plaza, 69/101,GT Road, Rambandhutala, Asansol - 713 303. Tel: (0341) 2221220, Fax: (0341) 2221219. HDFC AMC Ltd., City Plaza, City Centre, 1st Floor, Durgapur - 713 216. Tel: (0343) 3982150, Fax: (0343) 3982153. HDFC AMC Ltd., Krishna Enclave, 2nd Floor, 2/1, Bhajanlal Lohia Lane, Opposite Howrah A.C. Market, Howrah - 711 101, Phone: (033) 33546150/163, Fax: (033) 33546157. HDFC AMC Ltd., Menaka Estate, 1st Floor, 3 Red Cross Place, Kolkata - 700 001. Tel: (033) 22312875, 22312876, Fax: (033) 22439582. HDFC AMC Ltd., 2nd Floor, 209A, Sarat Bose Road, Besides Sarat Bose Road Post Office, Kolkata - 700029. Tel: (033) 33541166/67/68/70/71,Fax: (033) 33541172.HDFC AMC Ltd., Gitanjali Complex, 2nd Floor, AboveCorporation Bank, Sevoke Road, Siligurii - 734 001. Tel: (0353) 6453474. Fax: (0353) 2545270.
* This is not an Investor Service Centre for HDFCMutual Fund. However, this is an official point of acceptance for acceptance of all on-going transactions from Institutional Investors only, i.e.broadly covering all entities other than resident / non resident individuals. Institutional Investors are free to lodge their applications at any other officialpoints of acceptance also.
** Official points of acceptance of transactions forschemes of HDFC Mutual Fund except purchase transactions of Liquid Schemes / Plans viz. HDFC Liquid Fund, HDFC Liquid Fund - Premium Planand HDFC Cash Management Fund - Savings Plan &Call Plan.
WANT TO HAVE THE LATEST INFORMATION ABOUT US ?
Toll-free number : 1800 3010 6767/1800 419 7676
e-mail For any query or suggestions:-
Investors may contact us at: [email protected]
Distributors may contact us at: [email protected]
SMS: HDFCMF to 56767
Telephone Services
Visit us at www.hdfcfund.com
(Continued from previous page)
INVESTOR SERVICE CENTRES (ISCs)