vol. no. 11 issue no. 4 october 2013 - samit jhaveri 2013/hdfc mf oct 2… · 2 october 2013...
TRANSCRIPT

Vol. No. 11 Issue No. 4 October 2013

2 October 2013 Intouchmutually
PAGE NO.MARKET REVIEW 3EDITORIAL 4FEATURES OF OUR SELECT SCHEMES 5-14HDFC GROWTH FUND 15HDFC EQUITY FUND 15HDFC TOP 200 FUND 16HDFC CAPITAL BUILDER FUND 16HDFC CORE & SATELLITE FUND 17HDFC PREMIER MULTI-CAP FUND 17HDFC MID-CAP OPPORTUNITIES FUND 18HDFC FOCUSED LARGE-CAP FUND 18HDFC INFRASTRUCTURE FUND 19HDFC ARBITRAGE FUND 19HDFC INDEX FUND - SENSEX PLAN & NIFTY PLAN 20HDFC INDEX FUND - SENSEX PLUS PLAN 21HDFC GOLD EXCHANGE TRADED FUND 21HDFC GOLD FUND 21HDFC BALANCED FUND 22HDFC PRUDENCE FUND 22HDFC CHILDREN’S GIFT FUND - INVESTMENT PLAN & SAVINGS PLAN 23HDFC LONG TERM ADVANTAGE FUND 24HDFC TAXSAVER 24SIP PERFORMANCE OF SELECT SCHEMES 25-26HDFC MF MIP - SHORT TERM PLAN & LONG TERM PLAN 27HDFC MULTIPLE YIELD FUND 28HDFC MULTIPLE YIELD FUND - PLAN 2005 28HDFC INCOME FUND 29HDFC HIGH INTEREST FUND - DYNAMIC PLAN 29HDFC HIGH INTEREST FUND - SHORT TERM PLAN 30HDFC SHORT TERM PLAN 30HDFC SHORT TERM OPPORTUNITIES FUND 31HDFC MEDIUM TERM OPPORTUNITIES FUND 31HDFC GILT FUND - SHORT TERM PLAN & LONG TERM PLAN 32HDFC FLOATING RATE INCOME FUND - SHORT TERM PLAN & LONG TERM PLAN 33HDFC LIQUID FUND 34HDFC CASH MANAGEMENT FUND - SAVINGS PLAN 34HDFC CASH MANAGEMENT FUND - TREASURY ADVANTAGE PLAN & CALL PLAN 35SCHEME PERFORMANCE SUMMARY - FUND MANAGER - PRASHANT JAIN 36-37SCHEME PERFORMANCE SUMMARY - FUND MANAGER - VINAY KULKARNI 37-39SCHEME PERFORMANCE SUMMARY - FUND MANAGER - MITEN LATHIA 39SCHEME PERFORMANCE SUMMAR - FUND MANAGER - CHIRAG SETALVAD 39-41SCHEME PERFORMANCE SUMMARY - FUND MANAGER - SRINIVAS RAO RAVURI 41SCHEME PERFORMANCE SUMMARY - FUND MANAGER - SHOBHIT MEHROTRA 42-46SCHEME PERFORMANCE SUMMARY - FUND MANAGER - ANIL BAMBOLI 46-50DIVIDEND HISTORY 51-54DISCLAIMER 54
CONTENTS

The markets rose sharply this month with theSENSEX and Nifty up 9.2% and 9.8%respectively. Midcap stocks underper-
formed, the CNX Midcap Index gained 7.7%.TheRBI’s policy normalization, better than anticipat-ed quarterly results and ample global liquidityhelped stoke the rally. The capital goods andbanking sector were sharp outperformers whilethe defensive FMCG and Healthcare sectors underperformed. Better than expected trade data helpedthe Rupee gain almost 2% this month. OverOctober, FIIs bought approximately USD 2553.4million of Indian equities. For the calendar year,FIIs have invested USD 16198.9 million in Indianequities.
Global equity markets continued to move upon the expectation that the global economy maybe stabilizing and that mixed data in the US woulddelay tapering. The Dow rose 2.8% and the NAS-DAQ 3.9%. European markets also moved up
with the FTSE, CAC and DAX rising 4-5%. Asianmarkets were mixed – the Hang Seng and Kospiwere up 1-2%, the Taiex and Jakarta Compositerose 3-5% while the Shanghai Composite andNikkei lost about a percent each. Commoditiesprices were largely range bound.
The SENSEX currently trades at a PE of 14.2xone-year forward earnings and there is room forP/E’s to improve as economic conditions improveand as interest rates move lower.
Despite the promising medium to long outlookof Indian equities, equity funds have seen redemp-tions. While the retail investor may be disappoint-ed with the low returns from equities in last fewyears, nature of equities is such that periods ofpoor returns that result in low P/E’s are typicallyfollowed by periods of high returns. In our opin-ion therefore, this is a time to increase allocationto equities (for those with a medium to long termview) and stay invested. �
Equity market update
During the month of October 2013, the yieldon 10-year benchmark Government bond(7.16% GoI 2023) ended lower at 8.63%
as against 8.71% in September 2013.The liquidity availed through various sources
(Liquidity Adjustment Facility, export refinance,marginal standing facility and term repos) fromRBI during the month was lower at ` 130,772 crsas compared to ` 152,077 crs in September 2013.The NSE overnight MIBOR ended at 8.72%, lowerthan the rate seen in end September 2013 (10%).
The annual rate of inflation, based on monthlyWPI, stood at 6.46% (Provisional) for the monthof September 2013 (over September 2012) ascompared to 6.10% (Provisional) for the previousmonth and 8.07% during the corresponding monthof the previous year.
The INR appreciated to 61.50 against the USdollar as compared to 62.62 at the end of previousmonth, a gain of about 1.8% for the month. Thenet FII investments in equities & debt was aninflow of USD 356.5 million in October 2013 ascompared to an inflow of USD 1151.33 million inSeptember 2013.
In its second quarter Monetary Policy 2013 –14 Review, RBI announced a 25 bps hike in therepo rate to 7.75% and reduced the marginalstanding facility (MSF) rate by 25bps to 8.75%thereby normalizing the interest rate corridor to100 bps as prevalent prior to July tightening meas-ures. RBI increased the liquidity providedthrough term repos from 0.25% of net demand andtime liabilities to 0.50%. The RBI has revised itsoutlook on WPI inflation to remain above currentlevels (~6.5%) through rest of the year, againstearlier expectations of it falling to 5% by March2014. The RBI also lowered its GDP growth fore-cast to 5% y-o-y in FY14 from 5.5% earlier.
Outlook
RBI’s decision to raise the repo rate by 25bps triesto balance rising inflation concerns with weakergrowth, while the cut in the MSF rate – as INRvolatility subsides – suggests that the RBI is grad-ually reversing the exceptional liquidity measures.Going forward further rate moves by RBI will beclosely dependent upon the evolving growth-inflation dynamics. �
Debt market update
October 2013 3Intouchmutually
Market Review - October 2013
Source for various data points: Bloomberg, Reuters, www.sebi.gov.in, www.rbi.org.in and Central Statistics Office (CSO).
As India’s industries grow ever moresophisticated, its business schoolstoo are adding new dimensions. They
are offering more management developmentprogrammes (MDPs) for working execu-tives, as well as offbeat courses distinct fromtheir staple post graduate diploma (PGDM)programmes. Industry officials peg the sizeof India’s executive education market at ` 500 crore.
Recently, a B-school in Ghaziabad,near Delhi, conducted a programme forthe senior management of an interna-tional food chain. Within a month, thecompany asked the institute to conductanother such programme. Now, thebusiness school is looking for more
clients for its MDPs.B-schools are betting big on MDPs
because they expect these to generatemore revenues. At a management insti-
tute in Kolkata, revenue growth fromMDPs will touch 30 per cent at the end ofthe current academic year, against 20 percent in 2008. To widen its reach, the insti-tute has not only launched long-durationmanagement programmes through its tech-nology partners, but will soon also makeMDPs available on desktops through adirect-to-desktop mode. This will help stu-dents log in from wherever they wish to.
An institute in Delhi is targeting rev-enues of `24 crore from MDPs this year,while its overall target is `45 crore. At a B-school in Noida, near Delhi, the target is togenerate 20 per cent of total revenue fromMDPs this year, up from 10 per cent lastyear. So far, the institute has conducted 200MDPs. MDPs contribute about `10 crore tothe revenues of an institute in Kozhikode,while a B-school in Jamshedpur has con-ducted MDPs for 187 companies.
B-schools say companies have becomechoosy about the kind of MDPs throughwhich they want to up-skill executives.There are two kinds of MDPs — open andcustomised. While open MDPs are meant forparticipants from multiple companies, cus-tomised programmes are sought by compa-nies for a specific number and type ofemployee; these are sponsored by compa-nies. Customised programmes are now more
in demand than open programmes.There is a second trend also in evidence
— B-schools are increasingly offering offbeatmanagement programmes. For instance, aninstitute in Gurgaon is offering postgraduateprogrammes (PGP) in human resource man-agement (HRM) and international manage-ment (IM). These are different from its regu-lar management courses. An official of theinstitute says this year the institute admittedits 10th batch for the PGP-HRM course andthe eighth batch for the PGP-IM course.
The Indian business scene has becomeextremely competitive, as a result of whichthere is now increased onus on students toupgrade their technical skills and offer morevalue to prospective employers. Hence thepopularity of these specialised courses.
Certificate programmes are also becom-ing popular. The management institute inJamshedpur offers a six-month postgraduateprogramme for certificate in entrepreneur-ship management (PGP-CEM). It also has asix-month PGP certificate programme inagri-business management, aimed at supple-menting a student’s agricultural knowledgewith business skills.
Sector-specific management courses arebeing seen as the next major area of growth.A B-school in Chennai offers a PGPM inenergy, and an official of the institute saysthe industry’s response to this course hasbeen overwhelming. Last year, the coursehad a 50-member batch; this year, it has 76students. A B-school in Bangalore offers acourse in enterprise management (whichindividuals can take up while working),while a B-school in Ahmedabad offers a pro-gramme in agri-business management.
Experts say that with companies scoutingfor specialised talent, the demand for nichemanagement courses is expected to soar. “Insectors such as oil and gas or agriculture, aprofessional who is qualified in energy man-agement or agricultural management is moresuited to meet companies’ needs,” says aMumbai-based education consultant. �
B S REPORTER
This article is issued in general investor interest.
Please refer Page No. 54 for disclaimer.
Betting big on MDPs
Intouchmutually4 October 2013
Intouchmutually October 2013 5
Nature of Scheme
This product is suitable for investorswho are seeking ~
Fund Manager
Inception Date(Date of Allotment)
Entry / Sales Load
Exit Load
Investment Plan
Investment Options
Minimum Application Amount(Under each Plan /Option)
Net Asset Value(NAV)
RedemptionProceeds
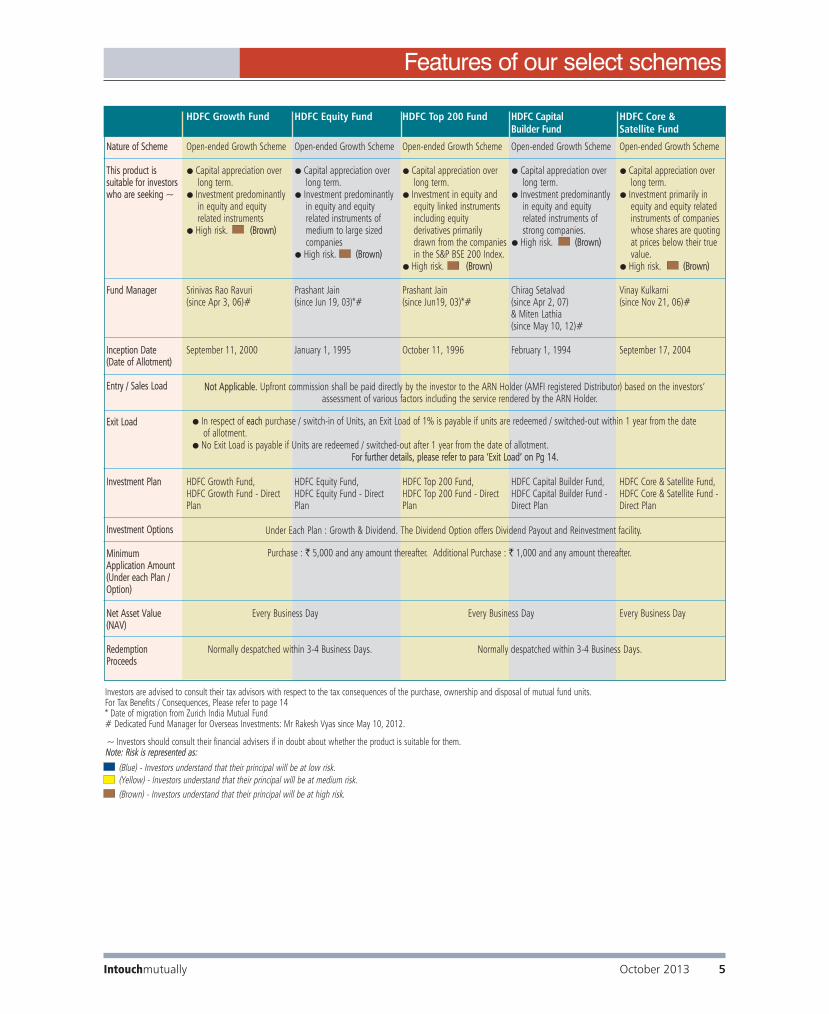
HDFC Growth Fund
Open-ended Growth Scheme
● Capital appreciation over long term.
● Investment predominantlyin equity and equity related instruments
● High risk. (Brown)
Srinivas Rao Ravuri(since Apr 3, 06)#
September 11, 2000
HDFC Growth Fund, HDFC Growth Fund - DirectPlan
HDFC Equity Fund
Open-ended Growth Scheme
● Capital appreciation over long term.
● Investment predominantlyin equity and equity related instruments ofmedium to large sizedcompanies
● High risk. (Brown)
Prashant Jain(since Jun 19, 03)*#
January 1, 1995
HDFC Equity Fund, HDFC Equity Fund - DirectPlan
HDFC Top 200 Fund
Open-ended Growth Scheme
● Capital appreciation over long term.
● Investment in equity andequity linked instrumentsincluding equity derivatives primarilydrawn from the companiesin the S&P BSE 200 Index.
● High risk. (Brown)
Prashant Jain(since Jun19, 03)*#
October 11, 1996
HDFC Top 200 Fund, HDFC Top 200 Fund - DirectPlan
HDFC Capital Builder Fund
Open-ended Growth Scheme
● Capital appreciation over long term.
● Investment predominantlyin equity and equity related instruments ofstrong companies.
● High risk. (Brown)
Chirag Setalvad (since Apr 2, 07) & Miten Lathia(since May 10, 12)#
February 1, 1994
HDFC Capital Builder Fund,HDFC Capital Builder Fund - Direct Plan
Investors are advised to consult their tax advisors with respect to the tax consequences of the purchase, ownership and disposal of mutual fund units. For Tax Benefits / Consequences, Please refer to page 14* Date of migration from Zurich India Mutual Fund# Dedicated Fund Manager for Overseas Investments: Mr Rakesh Vyas since May 10, 2012.
Features of our select schemes
Every Business Day Every Business Day
Normally despatched within 3-4 Business Days.
HDFC Core & Satellite Fund
Open-ended Growth Scheme
● Capital appreciation over long term.
● Investment primarily inequity and equity relatedinstruments of companieswhose shares are quotingat prices below their truevalue.
● High risk. (Brown)
Vinay Kulkarni(since Nov 21, 06)#
September 17, 2004
HDFC Core & Satellite Fund,HDFC Core & Satellite Fund -Direct Plan
Every Business Day
Not Applicable. Upfront commission shall be paid directly by the investor to the ARN Holder (AMFI registered Distributor) based on the investors’assessment of various factors including the service rendered by the ARN Holder.
Under Each Plan : Growth & Dividend. The Dividend Option offers Dividend Payout and Reinvestment facility.
(Brown) - Investors understand that their principal will be at high risk.
(Blue) - Investors understand that their principal will be at low risk.(Yellow) - Investors understand that their principal will be at medium risk.
~ Investors should consult their financial advisers if in doubt about whether the product is suitable for them.Note: Risk is represented as:
● In respect of each purchase / switch-in of Units, an Exit Load of 1% is payable if units are redeemed / switched-out within 1 year from the date of allotment.
● No Exit Load is payable if Units are redeemed / switched-out after 1 year from the date of allotment.For further details, please refer to para ‘Exit Load’ on Pg 14.
Normally despatched within 3-4 Business Days.
Purchase : ` 5,000 and any amount thereafter. Additional Purchase : ` 1,000 and any amount thereafter.

Features of our select schemes
Intouchmutually6 October 2013
Nature of Scheme
This product is suitable for investorswho are seeking ~
Fund Manager
Inception Date(Date of Allotment)
Entry / Sales Load
Exit Load
Investment Plan
Investment Options
Minimum Application Amount(Under each Plan /Option)
Net Asset Value(NAV)
RedemptionProceeds
HDFC Premier Multi-Cap Fund
Open-ended Growth Scheme
● Capital appreciation over long term.
● Investment predominantly in equity and equity related instruments of Mid Cap and Large Cap ‘blue chip’ companies.
● High risk. (Brown)
Vinay Kulkarni(since Nov 21, 06)#
April 6, 2005
HDFC Premier Multi-Cap Fund, HDFCPremier Multi-Cap Fund - Direct Plan
HDFC Mid-Cap Opportunities Fund
Open-ended Equity Scheme
● Capital appreciation over long term.
● Investment predominantly in equity and equity related instruments of Small and Mid Cap companies.
● High risk. (Brown)
Chirag Setalvad (since June 25, 07) #
June 25, 2007
HDFC Mid-Cap Opportunities Fund,HDFC Mid-Cap Opportunities Fund -Direct Plan
HDFC Focused Large-Cap Fund
Open-ended Equity Scheme
● Capital appreciation over long term.
● Investment predominantly in equity and equity related instruments of Large Cap companies
● High risk. (Brown)
Srinivas Rao Ravuri (since Feb 10, 06) #
February 10, 2006
HDFC Focused Large-Cap Fund,HDFC Focused Large-Cap Fund -Direct Plan
HDFC Infrastructure Fund
Open-ended Equity Scheme
● Capital appreciation over long term.
● Investment predominantly in equity and equity related securities of companies engagedin or expected to benefit from the growth and development of infrastructure.
● High risk. (Brown)
Prashant Jain and Srinivas RaoRavuri (since Mar 10, 08) #
March 10, 2008
HDFC Infrastructure Fund, HDFC Infrastructure Fund - Direct Plan
Not Applicable. Upfront commission shall be paid directly by the investor to the ARN Holder (AMFI registered Distributor) based on the investors’ assessment of various factors including the service rendered by the ARN Holder.
● In respect of each purchase / switch-in of Units, an Exit Load of 1% is payable if units are redeemed / switched-out within 1 year from the date of allotment.
● No Exit Load is payable if Units are redeemed / switched-out after 1 year from the date of allotment.For further details, please refer to para ‘Exit Load’ on Pg 14.
Under Each Plan : Growth & Dividend. The Dividend Option offers Dividend Payout and Reinvestment facility.
Purchase : ` 5,000 and any amount thereafter. Additional Purchase : ` 1,000 and any amount thereafter.
Every Business Day Every Business Day
Normally despatched within 3-4 Business Days. Normally despatched within 3-4 Business Days.
Investors are advised to consult their tax advisors with respect to the tax consequences of the purchase, ownership and disposal of mutual fund units. For Tax Benefits / Consequences, Please refer to page 14# Dedicated Fund Manager for Overseas Investments: Mr Rakesh Vyas since May 10, 2012.
(Brown) - Investors understand that their principal will be at high risk.
(Blue) - Investors understand that their principal will be at low risk.(Yellow) - Investors understand that their principal will be at medium risk.
~ Investors should consult their financial advisers if in doubt about whether the product is suitable for them.Note: Risk is represented as:

Nature of Scheme
This product is suitable for investorswho are seeking ~
Fund Manager
Inception Date(Date of Allotment)
Entry / Sales Load
Exit Load
Investment Plan
Investment Options
Minimum Application Amount(Under each Plan /Option)
Net Asset Value(NAV)
RedemptionProceeds
HDFC Index Fund
Open-ended Index Linked Scheme
SENSEX Plan● Returns that are commensurate with the performance of the SENSEX, subject to tracking
errors over long term● Investment in equity securities covered by the SENSEX● High risk. (Brown)Nifty Plan● Returns that are commensurate with the performance of the Nifty, subject to tracking errors
over long term● Investment in equity securities covered by the Nifty ● High risk. (Brown)SENSEX Plus Plan● Capital appreciation over long term. ● Investment in equity securities of 80% to 90% of the net assets of the Plan in companies
whose securities are included in SENSEX and between 10% & 20% of the net assets in companies whose securities are not included in the SENSEX.
● High risk. (Brown)
Vinay Kulkarni (since Dec 29, 06)
July 17, 2002
● In respect of each purchase / switch-in of Units, an Exit Load of 1.00% is payable if Unitsare redeemed / switched-out within 30 days from the date of allotment.
● No Exit Load is payable if Units are redeemed / switched-out after 30 days from the dateof allotment.
● No Load shall be levied on bonus units.
HDFC Index Fund - Nifty Plan, HDFC Index Fund - Nifty Plan - Direct Plan, HDFC Index Fund -SENSEX Plan, HDFC Index Fund - SENSEX Plan - Direct Plan, HDFC Index Fund - SENSEX PlusPlan, HDFC Index Fund - SENSEX Plus Plan - Direct Plan
At present, each Plan offers Growth Option only.
Purchase : ` 5,000 and any amount thereafter. Additional Purchase : ` 1,000 and any amount thereafter.
HDFC Arbitrage Fund
Open ended Equity Fund
● Income over short term. ● Income through arbitrage opportunities between
cash and derivative market and arbitrage opportunities within the derivative segment
● Low risk. (Blue)
Anil Bamboli (since Oct 23, 07)#
October 23, 2007
● In respect of each purchase / switch-in of Units, anExit Load of 0.50% is payable if units areredeemed / switched-out within 6 months from the date of allotment.
● No Exit Load is payable if Units are redeemed /switched-out after 6 months year from the date ofallotment.
HDFC Arbitrage Fund (Retail Option), HDFC Arbitrage Fund (Retail Option ) - Direct Plan
Under Each Plan : Growth and Dividend Option.Dividend Option offers Quarterly Dividend Option withPayout and Reinvestment Facility.
Purchase / Additional Purchase: `5,000 and anyamount thereafter.
Not Applicable. Upfront commission shall be paid directly by the investor to the ARN Holder (AMFI registered Distributor) based on the investors’ assessment of various factors including the service rendered by the ARN Holder.
Every Business Day
Normally despatched within 3-4 Business Days.
Investors are advised to consult their tax advisors with respect to the tax consequences of the purchase, ownership and disposal of mutual fund units. For Tax Benefits / Consequences, Please refer to page 14# Dedicated Fund Manager for Overseas Investments: Mr Rakesh Vyas since May 10, 2012.
For further details, please refer to para ‘Exit Load’ on Pg 14.
Intouchmutually October 2013 7
Features of our select schemes
(Brown) - Investors understand that their principal will be at high risk.
(Blue) - Investors understand that their principal will be at low risk.(Yellow) - Investors understand that their principal will be at medium risk.
~ Investors should consult their financial advisers if in doubt about whether the product is suitable for them.Note: Risk is represented as:

Investors are advised to consult their tax advisors with respect to the tax consequences of the purchase, ownership and disposal of mutual fund units. For Tax Benefits / Consequences, Please refer to page 14* Date of migration from Zurich India Mutual Fund # Dedicated Fund Manager for Overseas Investments: Mr Rakesh Vyas since May 10, 2012. $ For Large Investors, subscriptions shall only be allowed by payment of requisite Cash through RTGS/NEFT or Funds Transfer Letter/ Transfer Cheque of a bank where the Scheme has a collection account.
Nature of Scheme
This product is suitable for investorswho are seeking ~
Fund Manager
Inception Date(Date of Allotment)
Entry / Sales Load
Exit Load
Investment Plan
Investment Options
Minimum Application Amount(Under each Plan /Option)
Net Asset Value(NAV)
RedemptionProceeds
HDFC Gold Exchange Traded Fund
An Open-ended Exchange Traded Fund
● Returns that are commensurate withthe performance of gold, subject totracking errors over long term.
● Investment predominantly in Goldbullion of 0.995 fineness
● High risk. (Brown)
Anil Bamboli (since August 13, 10)
August 13, 2010
● For Creation Unit Size:No Exit load will be levied on redemptions made by AuthorisedParticipants / Large Investors directlywith the Fund in Creation Unit Size.
● For other than Creation Unit Size:Not Applicable. The Units in other than Creation Unit Size cannot be directly redeemed with theFund. These Units can be redeemed(sold) on a continuous basis on thestock exchange(s) during the tradinghours on all trading days.
HDFC Gold Exchange Traded Fund
Currently, there are no Options beingoffered under the Scheme.
Directly with the Fund – Subscription /Redemption in exchange of PortfolioDeposit and Cash Component in creation unit size of 1,000 units and inmultiples thereafter. $ On the Exchange(s) – 1 unit and in multiples of 1 unit thereafter.
HDFC Gold Fund
An Open-ended Fund of Fund Schemeinvesting in HDFC Gold Exchange TradedFund
● Capital appreciation over long term.● Investment in Units of HDFC Gold
Exchange Traded Fund (HGETF). HGETF invests in gold bullion of 0.995 fineness.
● High risk. (Brown)
Anil Bamboli (since November 1, 11)
November 1, 2011
In respect of each purchase / switch-in of units ● An Exit Load of 2% is payable if Units
are redeemed / switched-out within 6 months from the date of allotment.
● An Exit Load of 1% is payable if Unitsare redeemed / switched-out after 6 months but within 1 year from thedate of allotment.
● No Exit Load is payable if Units areredeemed / switched-out after 1 yearfrom the date of allotment.
HDFC Gold Fund, HDFC Gold Fund - Direct Plan
Currently each Plan offers only Growth Option.
HDFC Balanced Fund
Open-ended Balanced Scheme
● Capital appreciation alongwith current income overlong term.
● Investment predominantlyin equity and equity related instruments with balance exposure to debt andmoney market instruments.
● High risk. (Brown)
Chirag Setalvad (since Apr 2, 07)#
September 11, 2000
HDFC Balanced Fund, HDFCBalanced Fund - Direct Plan
HDFC Prudence Fund
Open-ended Balanced Scheme
● Periodic income with capitalappreciation and prevention ofcapital erosion over long term.
● Investment predominantly inequity and equity related instruments with balance exposure to debt and moneymarket instruments
● High risk. (Brown)
Prashant Jain (since Jun 19, 03)*#
February 1, 1994
HDFC Prudence Fund, HDFCPrudence Fund - Direct Plan
Not Applicable. Upfront commission shall be paid directly by the investor to the ARN Holder (AMFI registered Distributor) based on the investors’ assessment of various factors including the service rendered by the ARN Holder.
For further details, please refer to para ‘Exit Load’ on Pg 14.
● In respect of each purchase / switch-in of Units, an Exit Load of 1% is payable if units are redeemed / switched-out within 1 year from the date of allotment.
● No Exit Load is payable if Units are redeemed / switched-outafter 1 year from the date of allotment.
Under Each Plan: Growth & Dividend. The Dividend Option offersDividend Payout and Reinvestment facility.
Purchase: ` 5,000 and any amount thereafter. Additional Purchase: ` 1,000 and any amount thereafter.
Every Business Day Every Business Day
Normally despatched within 3-4 Business Days. Normally despatched within 3-4 Business Days.
Intouchmutually8 October 2013
Features of our select schemes
(Brown) - Investors understand that their principal will be at high risk.
(Blue) - Investors understand that their principal will be at low risk.(Yellow) - Investors understand that their principal will be at medium risk.
~ Investors should consult their financial advisers if in doubt about whether the product is suitable for them.Note: Risk is represented as:

^ Eligibility (of Unit holder) : Children less than 18 years of age as on the date of investment by the Investor / Applicant are eligible as Unit holders in the Scheme. @ Personal Accident InsuranceCover for Parent / Legal Guardian (upto the age of 80 years) of the Unit holder, equivalent to 10 times the cost value of the outstanding Units held by the Unit holder under all the applications /account statements / folios, subject to a maximum amount of ` 10 lakhs per Unit holder. The insurance premium in respect of the personal accident insurance cover will be borne by the AMC. Thisaccident insurance cover is subject to conditions of the group personal accident insurance policy. Investors are advised to consult their tax advisors with respect to the tax consequences of the purchase, ownership and disposal of mutual fund units. For Tax Benefits / Consequences, Please refer to page 14 # Dedicated Fund Manager for Overseas Investments: Mr Rakesh Vyas since May 10, 2012.
Nature of Scheme
This product is suitable for investorswho are seeking ~
Fund Manager
Inception Date(Date of Allotment)
Entry / Sales Load
Exit Load
Investment Plan
Investment Options
Minimum Application Amount(Under each Plan /Option)
Lock-in Period
Net Asset Value(NAV)
RedemptionProceeds
HDFC Children’s Gift Fund (CGF)^@
Open-ended Balanced Scheme
CGF - Investment Plan ● Capital appreciation over long term ● Investment in equity and equity related instruments as well
as debt and money market instruments.● High risk. (Brown)CGF - Savings Plan● Capital appreciation over medium to long term.● Investment in debt and money market instruments as well
as equity and equity related instruments.● Medium risk. (Yellow)
Chirag Setalvad (since Apr 2, 07)#
March 2, 2001
● For Units subject to Lock-in Period: NIL● For Units not subject to Lock-in Period: 3% if the Units are
redeemed / switched-out within one year from the date ofallotment; 2% if the Units are redeemed / switched-outbetween the first and second year of the date of allotment;1% if Units are redeemed / switched-out between the second and third year of the date of allotment; Nil if the Units are redeemed / switched-out after third year fromthe date of allotment.
Equity Oriented - Investment Plan, Investment Plan - Direct Plan Debt Oriented - Savings Plan, Savings Plan - Direct Plan
Nil
Purchase : ` 5,000 and any amount thereafter. Additional Purchase : ` 1,000 and any amount thereafter.
If opted : Until the Unit holder (being the beneficiary child)attains the age of 18 years or until completion of 3 years fromdate of allotment, whichever is later.
Every Business Day
Normally despatched within 3-4 Business Days (Redemption issubject to completion of Lock-in Period, if opted).
HDFC TaxSaver
Open-ended Equity Linked Savings Schemewith a lock-in period of 3 years
● Growth of capital over long term.● Investment predominantly in equity and
equity related instruments.● High risk. (Brown)
Vinay Kulkarni (since Nov 21, 06)#
March 31, 1996
Nil
HDFC TaxSaver, HDFC TaxSaver - Direct Plan
HDFC Long Term Advantage Fund
Open-ended Equity Linked Savings Schemewith a lock-in period of 3 years
● Capital appreciation over long term.● Investment predominantly in equity and
equity related instruments.● High risk. (Brown)
Chirag Setalvad (since Apr 2, 07)#
January 2, 2001
Nil
HDFC Long Term Advantage Fund, HDFC LongTerm Advantage Fund - Direct Plan
Not Applicable. Upfront commission shall be paid directly by the investor to the ARN Holder (AMFI registered Distributor) based on the investors’ assessment of various factors including the service rendered by the ARN Holder.
For further details, please refer to para ‘Exit Load’ on Pg 14.
Under Each Plan: Growth & Dividend. The Dividend Option offers Dividend Payout andReinvestment facility
Purchase & Additional Purchase : ` 500 and in multiples of ` 500 thereafter.
3 years from the date of allotment of the respective Units(including Units allotted under dividend reinvestment)
Every Business Day
Normally despatched within 3-4 Business Days (Redemption issubject to completion of Lock-in Period, if applicable).
Intouchmutually October 2013 9
Features of our select schemes
(Brown) - Investors understand that their principal will be at high risk.
(Blue) - Investors understand that their principal will be at low risk.(Yellow) - Investors understand that their principal will be at medium risk.
~ Investors should consult their financial advisers if in doubt about whether the product is suitable for them.Note: Risk is represented as:

Nature of Scheme
This product is suitable for investorswho are seeking ~
Fund Manager
Inception Date(Date of Allotment)
Entry / Sales Load
Exit Load
Investment Plan
Investment Options
Minimum Application Amount(Under each Plan /Option)
Net Asset Value(NAV)
RedemptionProceeds
HDFC MF Monthly Income Plan(HDFC MF MIP)
An open-ended income scheme. Monthly income is notassured and is subject to availability of distributable surplus
HDFC MF MIP - Short Term Plan (STP) & Long Term Plan (LTP)● Regular income over medium to long term.● Investment in debt and money market instruments as well
as equity and equity related instruments.● Medium risk. (Yellow)
LTP – Prashant Jain (Equities) (since Dec 26, 03),Shobhit Mehrotra (Debt) (since Sep 1, 07)#,STP – Vinay Kulkarni (Equities) (since Nov 21, 06),Shobhit Mehrotra (Debt) (since Feb 16, 04)#
December 26, 2003
HDFC MF MIP - Short Term Plan (STP), HDFC MF MIP - STP -Direct Plan, HDFC MF MIP - Long Term Plan (LTP), HDFC MF MIP - LTP - Direct Plan
Each Plan offers Growth, Monthly Dividend & QuarterlyDividend Option. The Dividend Option offers Dividend Payoutand Reinvestment facility.
Purchase :(Growth & Quarterly Dividend Option) – ` 5,000 and anyamount thereafter.(Monthly Dividend Option) – ` 25,000 and any amountthereafter. Additional Purchase : ` 1,000 and any amount thereafter.
Every Business Day
Normally despatched within 3-4 Business Days.
HDFC Multiple Yield Fund
Open-ended Income Scheme
● Positive returns over medium term withlow risk of capital loss over mediumterm.
● Investment in debt and money marketinstruments with maturity of 1 year(85%) as well as equity and equity related instruments (15%).
● Medium risk. (Yellow)
Vinay Kulkarni (Equities), (since Nov 21, 06)Anil Bamboli (Debt) (since Sep 17, 04)#
September 17, 2004
HDFC Multiple Yield Fund, HDFC Multiple Yield Fund - Direct Plan
HDFC Multiple Yield Fund (MYF) –Plan 2005
Open-ended Income Scheme
● Positive returns over medium term withlow risk of capital loss over medium term.
● Investment in debt and money marketinstruments with maturity of 15 months(85%) as well as equity and equity related instruments (15%).
● Medium risk. (Yellow)
Chirag Setalvad (Equities), (since April 2, 07)Anil Bamboli (Debt) (since Aug 17, 05)#
August 17, 2005
● In respect of each purchase / switch-in ofUnits, an Exit Load of 1% is payable ifunits are redeemed / switched-out within15 months from the date of allotment.
● No Exit Load is payable if Units areredeemed / switched-out after 15months from the date of allotment.
HDFC MYF - Plan 2005, HDFC MYF - Plan 2005 - Direct Plan
Not Applicable. Upfront commission shall be paid directly by the investor to the ARN Holder (AMFI registered Distributor) based on the investors’ assessment of various factors including the service rendered by the ARN Holder.
For further details, please refer to para ‘Exit Load’ on Pg 14.
Under Each Plan: Growth & Dividend. The Dividend Option offers DividendPayout and Reinvestment facility.
Purchase : ` 5,000 and any amount thereafter. Additional Purchase : ` 1,000 and any amount thereafter.
Investors are advised to consult their tax advisors with respect to the tax consequences of the purchase, ownership and disposal of mutual fund units. For Tax Benefits / Consequences, Please refer to page 14 # Dedicated Fund Manager for Overseas Investments: Mr Rakesh Vyas since May 10, 2012.
Every Business Day
Normally despatched within 3-4 Business Days.
Intouchmutually10 October 2013
Features of our select schemes
● In respect of each purchase / switch-in of Units, an Exit Load of 1% is payable if units are redeemed/ switched-out within 1 year from the date of allotment.
● No Exit Load is payable if Units are redeemed / switched-out after 1 year from the date of allotment.
(Brown) - Investors understand that their principal will be at high risk.
(Blue) - Investors understand that their principal will be at low risk.(Yellow) - Investors understand that their principal will be at medium risk.
~ Investors should consult their financial advisers if in doubt about whether the product is suitable for them.Note: Risk is represented as:

HDFC Income Fund
Open-ended Income Scheme
● Regular income over medium to long term.
● To optimise returns while maintaining a balance of safety, yield and liquidity by investment in debt and money market instruments.
● Low risk. (Blue)
Shobhit Mehrotra (since Sep 1, 07)#
September 11, 2000
● In respect of each purchase / switch-inof Units, an Exit Load of 0.5% ispayable if units are redeemed /switched-out within 6 months from the date of allotment.
● No Exit Load is payable if Units areredeemed / switched-out after 6 months from the date of allotment.
HDFC Income Fund, HDFC Income Fund - Direct Plan
Under each Plan: Growth & Dividend. The Dividend Option offers Dividend Payoutand Reinvestment facility.
Nature of Scheme
This product is suitable for investorswho are seeking ~
Fund Manager
Inception Date(Date of Allotment)
Entry / Sales Load
Exit Load
Investment Plan
Investment Option
Minimum Application Amount(Under each Plan /Option)
Net Asset Value(NAV)
RedemptionProceeds
Intouchmutually October 2013 11
Features of our select schemes
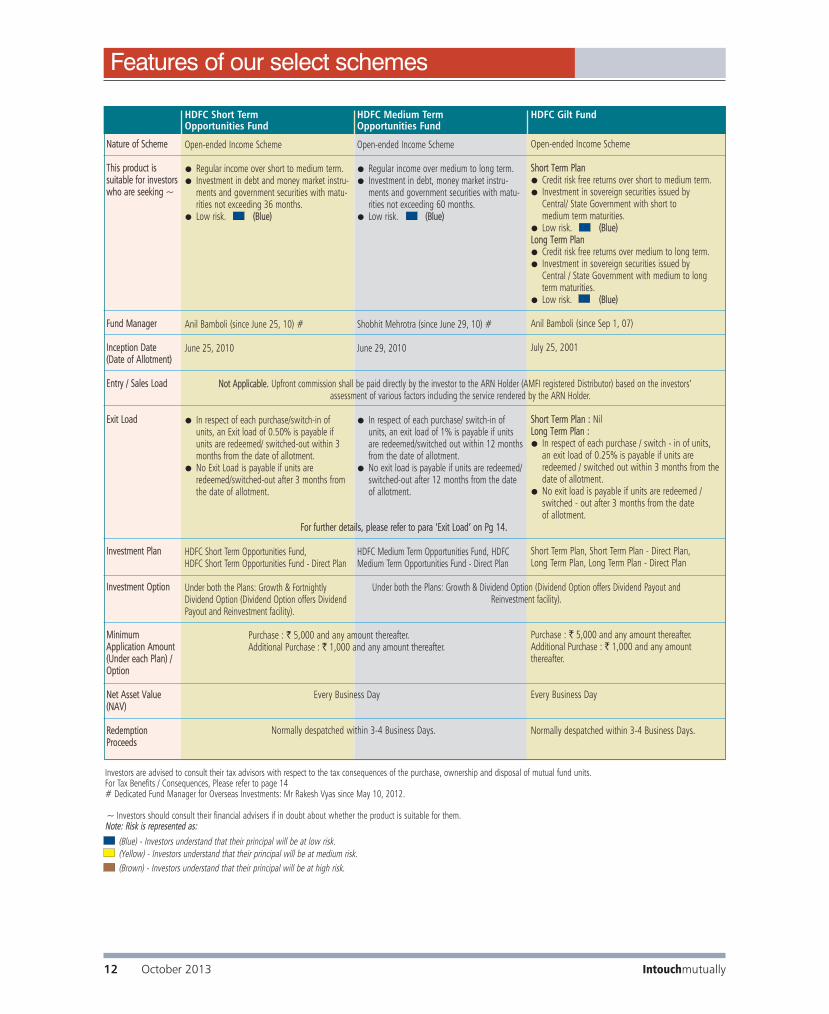
HDFC Short Term Plan
Open-ended Income Scheme
● Regular income over short to medium term.
● Investment in debt and money marketinstruments with a short to medium termmaturity (average maturity profile of 9-18 months).
● Low risk. (Blue)
Anil Bamboli (since Jan 13, 04)#
February 28, 2002
● In respect of each purchase / switch-in of Units, an Exit Load of0.75% is payable if units are redeemed/ switched-out within 9 months fromthe date of allotment.
● No Exit Load is payable if Units areredeemed / switched-out after 9 monthsfrom the date of allotment.
HDFC Short Term Plan, HDFC Short Term Plan - Direct Plan
Under both the Plans: Growth & Dividend(Dividend Option offers Payout andReinvestment facility).
Every Business Day
Normally despatched within 3-4 Business Days.
HDFC High Interest Fund (HHIF)
Open-ended Income Scheme
HDFC High Interest Fund - Dynamic Plan ● Stable returns over medium to long term.● To maximize income while maintaining the optimum balance of
yield, safety and liquidity by investing in a range of debt andmoney market instruments of various maturity dates.
● Low risk. (Blue)HDFC High Interest Fund - Short Term Plan (HHIF - STP)● Stable returns over short to medium term.● To maximize income while maintaining the optimum balance of
yield, safety and liquidity by investing in a range of debt andmoney market instruments of various maturity dates.
● Low risk. (Blue)
Anil Bamboli (HHIF - Dynamic Plan) (since Feb 16, 04)#, Shobhit Mehrotra (HHIF - STP) (since Sep 1, 07)#
HHIF - Dynamic Plan : April 28, 1997HHIF - STP : February 6, 2002
HHIF - Dynamic Plan:● In respect of each purchase / switch-in of Units, an Exit Load
of 0.50% is payable if units are redeemed / switched-outwithin 3 months from the date of allotment.
● No Exit Load is payable if Units are redeemed / switched-outafter 3 months from the date of allotment.
HHIF - STP● In respect of each purchase / switch-in of units, an Exit Load of
0.25% is payable if units are redeemed / switched-out within 1month from the date of allotment.
● No Exit Load is payable if Units are redeemed / switched-out after1 month from the date of allotment.
HHIF - Dynamic Plan, HHIF - Dynamic Plan - Direct Plan, HHIF - STP, HHIF - STP - Direct Plan
HHIF - Dynamic Plan : Under both the Plans: Growth, Quarterly, Half Yearly and Yearly Dividend Options.HHIF - STP : Under both the Plans: Growth & Dividend OptionAll Dividend Options offer Dividend Payout and Reinvestment facility.
For further details, please refer to para ‘Exit Load’ on Pg 14.
Every Business Day
Normally despatched within 3-4 Business Days.
Not Applicable. Upfront commission shall be paid directly by the investor to the ARN Holder (AMFI registered Distributor) based on the investors’ assessment of various factors including the service rendered by the ARN Holder.
Investors are advised to consult their tax advisors with respect to the tax consequences of the purchase, ownership and disposal of mutual fund units. For Tax Benefits / Consequences, Please refer to page 14# Dedicated Fund Manager for Overseas Investments: Mr Rakesh Vyas since May 10, 2012.
Purchase : ` 5,000 and any amount thereafter. Additional Purchase : ` 1,000 and any amount thereafter.
(Brown) - Investors understand that their principal will be at high risk.
(Blue) - Investors understand that their principal will be at low risk.(Yellow) - Investors understand that their principal will be at medium risk.
~ Investors should consult their financial advisers if in doubt about whether the product is suitable for them.Note: Risk is represented as:
Intouchmutually12 October 2013
Features of our select schemes
Nature of Scheme
This product is suitable for investorswho are seeking ~
Fund Manager
Inception Date(Date of Allotment)
Entry / Sales Load
Exit Load
Investment Plan
Investment Option
Minimum Application Amount (Under each Plan) /Option
Net Asset Value(NAV)
RedemptionProceeds
Investors are advised to consult their tax advisors with respect to the tax consequences of the purchase, ownership and disposal of mutual fund units. For Tax Benefits / Consequences, Please refer to page 14# Dedicated Fund Manager for Overseas Investments: Mr Rakesh Vyas since May 10, 2012.
HDFC Gilt Fund
Open-ended Income Scheme
Short Term Plan● Credit risk free returns over short to medium term. ● Investment in sovereign securities issued by
Central/ State Government with short to medium term maturities.
● Low risk. (Blue)Long Term Plan● Credit risk free returns over medium to long term.● Investment in sovereign securities issued by
Central / State Government with medium to long term maturities.
● Low risk. (Blue)
Anil Bamboli (since Sep 1, 07)
July 25, 2001
Short Term Plan : NilLong Term Plan : ● In respect of each purchase / switch - in of units,
an exit load of 0.25% is payable if units areredeemed / switched out within 3 months from thedate of allotment.
● No exit load is payable if units are redeemed /switched - out after 3 months from the date of allotment.
Short Term Plan, Short Term Plan - Direct Plan,Long Term Plan, Long Term Plan - Direct Plan
Purchase : ` 5,000 and any amount thereafter.Additional Purchase : ` 1,000 and any amount thereafter.
Every Business Day
Normally despatched within 3-4 Business Days.
HDFC Medium Term Opportunities Fund
Open-ended Income Scheme
● Regular income over medium to long term.● Investment in debt, money market instru-
ments and government securities with matu-rities not exceeding 60 months.
● Low risk. (Blue)
Shobhit Mehrotra (since June 29, 10) #
June 29, 2010
● In respect of each purchase/ switch-in ofunits, an exit load of 1% is payable if unitsare redeemed/switched out within 12 monthsfrom the date of allotment.
● No exit load is payable if units are redeemed/switched-out after 12 months from the dateof allotment.
HDFC Medium Term Opportunities Fund, HDFCMedium Term Opportunities Fund - Direct Plan
HDFC Short Term Opportunities Fund
Open-ended Income Scheme
● Regular income over short to medium term.● Investment in debt and money market instru-
ments and government securities with matu-rities not exceeding 36 months.
● Low risk. (Blue)
Anil Bamboli (since June 25, 10) #
June 25, 2010
● In respect of each purchase/switch-in ofunits, an Exit load of 0.50% is payable ifunits are redeemed/ switched-out within 3months from the date of allotment.
● No Exit Load is payable if units areredeemed/switched-out after 3 months fromthe date of allotment.
HDFC Short Term Opportunities Fund, HDFC Short Term Opportunities Fund - Direct Plan
Under both the Plans: Growth & FortnightlyDividend Option (Dividend Option offers DividendPayout and Reinvestment facility).
Not Applicable. Upfront commission shall be paid directly by the investor to the ARN Holder (AMFI registered Distributor) based on the investors’ assessment of various factors including the service rendered by the ARN Holder.
For further details, please refer to para ‘Exit Load’ on Pg 14.
Purchase : ` 5,000 and any amount thereafter.Additional Purchase : ` 1,000 and any amount thereafter.
Every Business Day
Normally despatched within 3-4 Business Days.
(Brown) - Investors understand that their principal will be at high risk.
(Blue) - Investors understand that their principal will be at low risk.(Yellow) - Investors understand that their principal will be at medium risk.
~ Investors should consult their financial advisers if in doubt about whether the product is suitable for them.Note: Risk is represented as:
Under both the Plans: Growth & Dividend Option (Dividend Option offers Dividend Payout andReinvestment facility).

HDFC Floating Rate Income Fund
Open-ended Income Scheme
Short Term Plan● Regular income over short term.● Investment in floating rate debt / money market instruments, fixed rate debt / money market
instruments swapped for floating rate returns and fixed rate debt and money market instruments of short term maturities with higher liquidity.
● Low risk. (Blue)Long Term Plan● Regular income over short to medium term.● Investment in floating rate debt / money market instruments, fixed rate debt / money market
instruments swapped for floating rate returns and fixed rate debt and money market instruments of longer term maturities.
● Low risk. (Blue)
Shobhit Mehrotra (since Feb 16, 04)#
Long Term Plan (LTP) : January 16, 2003 Short Term Plan (STP) - Wholesale Option: October 23, 2007
STP : NilLTP : ● In respect of each purchase / switch-in of Units, an Exit Load of 0.50% is payable if units are
redeemed / switched-out within 3 months from the date of allotment.● No Exit Load is payable if Units are redeemed / switched-out after 3 months from the
date of allotment.
STP - Wholesale Option, STP - Wholesale Option - Direct Plan,LTP, LTP - Direct Plan
STP – Wholesale Option : Under both the Plans: Growth and Dividend Option. The DividendOption offers Daily Dividend Option (with Reinvestment facility only) and Weekly and MonthlyDividend Option (with Payout and Reinvestment facility).LTP : Under both the Plans: Growth and Weekly Dividend Option (with Reinvestment facility only).
STP – Wholesale Option : Purchase : ` 10 lakh and any amount thereafter. Additional Purchase : ` 1 and and any amount thereafter.LTP : For Purchase : ` 5,000 and any amount thereafter.Additional Purchase : ` 1,000 and any amount thereafter.
Every Business Day
Normally despatched within 3-4 Business Days.
Nature of Scheme
This product is suitable for investorswho are seeking ~
Fund Manager
Inception Date(Date of Allotment)
Entry / Sales Load
Exit Load
Investment Plan
Investment Option
Minimum Application Amount(Under each Plan /Option)
Net Asset Value(NAV)
RedemptionProceeds
Investors are advised to consult their tax advisors with respect to the tax consequences of the purchase, ownership and disposal of mutual fund units. For Tax Benefits / Consequences, Please refer to page 14^ Calculated on all calendar days# Dedicated Fund Manager for Overseas Investments: Mr Rakesh Vyas since May 10, 2012.
HDFC Liquid Fund
Open-ended Liquid Income Scheme
● Income over short term.● Investment in debt and money market instruments.● Low risk. (Blue)
Shobhit Mehrotra (since Feb 16, 04)#
October 17, 2000
Nil
HDFC Liquid Fund, HDFC Liquid Fund - Direct Plan
Under both the Plans: Growth & Dividend Option. TheDividend Option offers Daily Dividend Option(Reinvestment facility only) and Weekly and MonthlyDividend Option (with Payout and Reinvestment facility).
Purchase ` 10,000 and any amount thereafter; Additional Purchase ` 5,000 and any amount thereafter.
Every Business Day ^
Normally despatched within 1 Business Day.
Not Applicable. Upfront commission shall be paid directly by the investor to the ARN Holder (AMFI registered Distributor) based on the investors’ assessment of various factors including the service rendered by the ARN Holder.
For further details, please refer to para ‘Exit Load’ on Pg 14.
Intouchmutually October 2013 13
Features of our select schemes
(Brown) - Investors understand that their principal will be at high risk.
(Blue) - Investors understand that their principal will be at low risk.(Yellow) - Investors understand that their principal will be at medium risk.
~ Investors should consult their financial advisers if in doubt about whether the product is suitable for them.Note: Risk is represented as:

Investors are advised to consult their tax advisors with respect to the tax consequences of the purchase, ownership and disposal of mutual fund units.^ Calculated on all calendar days # Dedicated Fund Manager for Overseas Investments: Mr Rakesh Vyas since May 10, 2012. Exit Load: (i) No exit load shall be levied for switching between Options under the same Plan within a Scheme. (ii) Switch of investments to Direct Plan within the same Scheme shall be subjectto applicable exit load, unless the investments were made without any distributor code. However, any subsequent switch-out or redemption of such investments from the Direct Plan will not besubject to any exit load.(iii) No exit load shall be levied for switch-out from Direct Plan to other Plan within the same Scheme. However, any subsequent switch-out or redemption of such investment from the other Plan shall be subject to exit load based on the original date of investment in the Direct Plan. (iv) Switch of investments between Plans under a Scheme having separate portfolios, will be subject to applicable exit load. (v) No exit load will be levied on Bonus Units and Units allotted on Dividend Re-investment.
Tax Benefits / Consequences : Income distributed by the Scheme(s) is free from Income–tax in the hands of Investors. The additional income-tax on distribution of income by a money marketmutual fund or a liquid fund to an individual / HUF shall be payable by the mutual fund at the rate of 28.325%* and at the rate of 33.99%* to any other investor. The additional income-tax ondistribution of income by any other fund (not being an equity oriented fund) to an individual / HUF shall be payable at the rate of 28.325%* and at the rate of 33.99%* on distribution ofincome to any other investor. Units of the Scheme(s) are not subject to Wealth-tax and Gift-tax. Unit holders are required to pay Securities Transaction Tax (STT) at the rate of 0.001% at the time of redemption / switch-out of units of an equity-oriented fund.* including applicable surcharge, education cess and secondary and higher education cessInvestors should be aware that the fiscal rules / tax laws may change and there can be no guarantee that the current tax position may continue indefinitely. In view of individual nature of taxconsequences, each investor is advised to consult his / her own professional tax advisor.
Prashant Jain Over 22 yearsVinay Kulkarni Over 23 yearsSrinivas Rao Ravuri Over 18 yearsChirag Setalvad Over 16 years
Shobhit Mehrotra Over 20 yearsAnil Bamboli Over 19 yearsMiten Lathia Over 13 yearsRakesh Vyas Over 9 years
Fund Manager Total Experience Fund Manager Total Experience
Nature of Scheme
This product is suitable for investorswho are seeking ~
Fund Manager
Inception Date(Date of Allotment)
Entry / Sales Load
Exit Load
Investment Plan
Investment Option
Minimum Application Amount(Under each Plan /Option)
Net Asset Value (NAV)
RedemptionProceeds
HDFC Cash Management Fund
Savings & Call Plan: Open-ended High Liquidity Income SchemeTreasury Advantage Plan: Open-ended Income Scheme
Anil Bamboli# Savings & Call Plan (since Jul 25, 12) Treasury Advantage Plan – (since Sep 1, 07)
Savings & Treasury Advantage Plan (Retail Option): November 18, 1999 Call Plan : February 6, 2002
Not Applicable. Upfront commission shall be paid directly by the investor to the ARN Holder (AMFI registered Distributor) based on the investors’ assessment of various factors including the service rendered by the ARN Holder.
Savings, Call & Treasury Advantage Plan : Nil
Savings Plan, Savings Plan - Direct Plan, Call Plan, Call Plan - Direct Plan, Treasury Advantage Plan, Treasury Advantage Plan - Direct Plan
Savings & Call Plan : Each Plan offers Growth Option & Daily Dividend Option (with Reinvestment facility only). Savings Plan also offers Weekly Dividend Option(with Payout and Reinvestment facility). Treasury Advantage Plan (Retail Option): Each Plan offers Growth and Dividend Option. Dividend Option offers Daily Dividend Option with Reinvestment facility only and Weekly and Monthly Dividend Option with Payout and Reinvestment facility.
Savings & Call Plan : Purchase ` 10,000 and any amount thereafter; Additional Purchase ` 5,000 and any amount thereafter.Treasury Advantage Plan – Retail Option: Growth, Weekly and Monthly Dividend Option : Purchase ` 5,000 and any amount thereafter.Additional Purchase: ` 1,000 and any amount thereafter. Daily Dividend Option : Purchase ` 10,000 and any amount thereafter; Additional Purchase ` 5,000 andany amount thereafter.
Savings & Call Plan: Every Business Day^ Treasury Advantage Plan: Every Business Day
Savings & Call Plan : Normally despatched within 1 Business Day.Treasury Advantage Plan: Normally despatched within 3-4 Business Days.
Savings Plan● Optimal returns over short term. ● Investment in debt and money
market instruments with maturityof upto 91 days only.
● Low risk. (Blue)
Treasury Advantage Plan● Regular income over short term.● Investment in debt and money
market instruments.● Low risk. (Blue)
Call Plan● Optimal returns over short term that may be in line with the
overnight call rates. ● Investment typically in Collateralised Borrowing & Lending
Obligations (CBLO), overnight reverse repos in Government securitiesand fixed income instruments with overnight maturity/ liquidity.
● Low risk. (Blue)
Intouchmutually14 October 2013
Features of our select schemes
(Brown) - Investors understand that their principal will be at high risk.
(Blue) - Investors understand that their principal will be at low risk.(Yellow) - Investors understand that their principal will be at medium risk.
~ Investors should consult their financial advisers if in doubt about whether the product is suitable for them.Note: Risk is represented as:

Portfolio – Top 10 Holdings
HDFCGrowth Fund
$ Sponsor
An open-ended growth scheme
HDFCEquity FundAn open-ended growth scheme
Banks 17.67
Software 13.33
Petroleum Products 10.92
Pharmaceuticals 7.69
Consumer Non Durables 7.39
Chemicals 5.36
Finance 5.02
Industrial Capital Goods 4.51
Telecom - Services 4.23
Construction 3.74
Auto 3.57
Oil 3.26
Gas 2.11
Minerals / Mining 2.06
Textile - Synthetic 1.74
Cement 1.54
Power 1.29
Construction Project 1.25
Ferrous Metals 1.12
Industrial Products 0.44
Industry Allocation of Equity Holding (% of Net Assets)
Portfolio Turnover Ratio (Last 1 Year) 23.97%
NAV NAV per Unit (`)
Growth Option 90.454Dividend Option 25.943Direct Plan - Growth Option 90.784Direct Plan - Dividend Option 26.039
Std Deviation Beta Sharpe Ratio*
Risk Ratio 5.29% 0.9273 -0.124(for the 3-yr period ended Oct 31, 13)Based on month-end NAV
Std Deviation Beta Sharpe Ratio*
Risk Ratio 6.01% 1.0094 -0.111(for the 3-yr period ended Oct 31, 13)Based on month-end NAV
NAV NAV per Unit (`)
Growth Option 287.063Dividend Option 39.801Direct Plan - Growth Option 288.657Direct Plan - Dividend Option 40.028
Portfolio – Top 10 Holdings
Portfolio Turnover Ratio (Last 1 Year) 40.93%
Banks 20.22
Software 16.04
Petroleum Products 9.70
Auto 7.13
Consumer Non Durables 6.97
Construction Project 4.96
Finance 4.45
Oil 4.11
Pharmaceuticals 4.03
Power 2.98
Auto Ancillaries 2.93
Industrial Capital Goods 2.35
Telecom - Services 2.22
Ferrous Metals 1.80
Minerals / Mining 1.63
Media And Entertainment 1.46
Cement 1.34
Transportation 1.20
Construction 1.17
Chemicals 0.96
Textile Products 0.92
Fertilisers 0.56
Industrial Products 0.28
Industry Allocation of Equity Holding (% of Net Assets)
Company Industry+ % to NAV
EQUITY & EQUITY RELATED
ICICI Bank Ltd. Banks 8.33
Infosys Ltd. Software 8.22
ITC Ltd. Consumer Non Durables 7.39
Reliance Industries Ltd. Petroleum Products 6.60
State Bank of India Banks 5.04
Housing Development Finance Corporation Ltd. $ Finance 5.02
Bharat Petroleum Corporation Ltd. Petroleum Products 4.32
Solar Industries India Ltd. Chemicals 4.19
Bharti Airtel Ltd. Telecom - Services 3.64
Tata Motors Ltd. DVR Auto 3.57
Total of Top Ten Equity & Equity Related Holdings 56.32
Total Equity & Equity Related Holdings 98.24
Cash, Cash Equivalents and Net Current Assets 1.76
Grand Total 100.00
Average AUM for the quarter ended September 30, 2013 (` In Lakhs) 99,465.41
Company Industry+ % to NAV
EQUITY & EQUITY RELATED
Infosys Ltd. Software 9.34
ICICI Bank Ltd. Banks 6.92
Larsen & Toubro Ltd. Construction Project 4.96
State Bank of India Banks 4.84
Reliance Industries Ltd. Petroleum Products 4.82
Tata Motors Ltd. DVR Auto 4.49
ITC Ltd. Consumer Non Durables 3.64
Bharat Petroleum Corporation Ltd. Petroleum Products 2.92
Tata Consultancy Services Ltd. Software 2.87
Maruti Suzuki India Ltd. Auto 2.64
Total of Top Ten Equity & Equity Related Holdings 47.44
Total Equity & Equity Related Holdings 99.41
Cash, Cash Equivalents and Net Current Assets 0.59
Grand Total 100.00
Average AUM for the quarter ended September 30, 2013 (` In Lakhs) 967,878.41
Source for Risk ratio: CRISIL Fund Analyser * Risk-free rate assumed to be 8.54% (364-day Treasury Bill yield on 31-10-13)
Face Value per Unit: ` 10 unless otherwise specified + Industry Classification as recommended by AMFI Data is as of October 31, 2013 unless otherwise specified.
Intouchmutually October 2013 15

HDFC Top 200 FundAn open-ended growth scheme
HDFCCapital Builder FundAn open-ended growth scheme
NAV NAV per Unit (`)
Growth Option 123.343Dividend Option 21.239Direct Plan - Growth Option 123.779Direct Plan - Dividend Option 21.321
NAV NAV per Unit (`)
Growth Option 226.286Dividend Option 40.353Direct Plan - Growth Option 227.352Direct Plan - Dividend Option 40.547
Company Industry+ % to NAV
EQUITY & EQUITY RELATED
Infosys Ltd. Software 8.91
ICICI Bank Ltd. Banks 7.68
Reliance Industries Ltd. Petroleum Products 5.88
ITC Ltd. Consumer Non Durables 5.26
Tata Motors Ltd. DVR Auto 5.05
Larsen & Toubro Ltd. Construction Project 4.92
State Bank of India Banks 4.78
Tata Consultancy Services Ltd. Software 3.80
HDFC Bank Ltd. Banks 3.29
Housing Development Finance Corporation Ltd. $ Finance 3.08
Total of Top Ten Equity & Equity Related Holdings 52.65
Total Equity & Equity Related Holdings 99.87
Cash margin / Earmarked cash for Futures & Options 0.03
Other Cash, Cash Equivalents and Net Current Assets 0.10
Grand Total 100.00
Average AUM for the quarter ended September 30, 2013 (` In Lakhs) 1,029,431.37
Portfolio – Top 10 Holdings Portfolio – Top 10 Holdings
Portfolio Turnover Ratio (Last 1 Year) 16.12%
Company Industry+ % to NAV
EQUITY & EQUITY RELATED
Infosys Ltd. Software 7.95
ITC Ltd. Consumer Non Durables 6.13
Reliance Industries Ltd. Petroleum Products 6.09
ICICI Bank Ltd. Banks 5.90
Tata Consultancy Services Ltd. Software 5.55
HDFC Bank Ltd. Banks 4.05
Axis Bank Ltd. Banks 3.50
MindTree Ltd. Software 3.48
Solar Industries India Ltd. Chemicals 3.28
Pidilite Industries Ltd. Chemicals 3.19
Total of Top Ten Equity & Equity Related Holdings 49.12
Total Equity & Equity Related Holdings 95.42
Cash, Cash Equivalents and Net Current Assets 4.58
Grand Total 100.00
Average AUM for the quarter ended September 30, 2013 (` In Lakhs) 40,854.67
Banks 23.09Software 13.76Petroleum Products 9.28Consumer Non Durables 7.79Auto 7.06Pharmaceuticals 5.07Construction Project 4.98Finance 4.46Oil 4.40Ferrous Metals 3.12Telecom - Services 2.86
Power 2.71Cement 2.30Industrial Capital Goods 2.19Minerals / Mining 2.13Transportation 1.21Gas 1.02Media And Entertainment 0.98Construction 0.84Non - Ferrous Metals 0.55Auto Ancillaries 0.07
Industry Allocation of Equity Holding (% of Net Assets)Banks 23.08Software 22.17Petroleum Products 8.56Consumer Non Durables 7.61Pharmaceuticals 7.24Chemicals 6.47Auto 2.96Industrial Products 2.86Construction Project 2.67
Telecom - Services 2.26Industrial Capital Goods 2.22Oil 2.17Consumer Durables 1.35Gas 1.21Power 1.12Finance 0.77Auto Ancillaries 0.70
Industry Allocation of Equity Holding (% of Net Assets)
Std Deviation Beta Sharpe Ratio*
Risk Ratio 5.87% 1.0115 -0.092(for the 3-yr period ended Oct 31, 13)Based on month-end NAV
Std Deviation Beta Sharpe Ratio*
Risk Ratio 4.90% 0.8190 -0.101(for the 3-yr period ended Oct 31, 13)Based on month-end NAV
Portfolio Turnover Ratio (Last 1 Year) 24.58%
Face Value per Unit: ` 10 unless otherwise specified + Industry Classification as recommended by AMFI Data is as of October 31, 2013 unless otherwise specified.
16 October 2013 Intouchmutually
Source for Risk ratio: CRISIL Fund Analyser * Risk-free rate assumed to be 8.54% (364-day Treasury Bill yield on 31-10-13)
$ Sponsor

An open-ended growth scheme An open-ended growth scheme
HDFCCore & Satellite Fund
Portfolio Turnover Ratio (Last 1 Year) 47.64%
Banks 27.02Software 17.06Construction Project 6.78Industrial Capital Goods 6.35Finance 6.07Power 5.49Auto 4.68Ferrous Metals 4.32Oil 3.79
Petroleum Products 3.66Minerals / Mining 3.12Consumer Non Durables 2.85Cement 2.10Media And Entertainment 2.02Telecom - Services 1.58Construction 1.08Textile - Synthetic 1.07Software 0.09
Industry Allocation of Equity Holding (% of Net Assets)
NAV NAV per Unit (`)
Growth Option 36.198Dividend Option 14.910Direct Plan - Growth Option 36.357Direct Plan - Dividend Option 15.013
NAV NAV per Unit (`)
Growth Option 26.690Dividend Option 10.733Direct Plan - Growth Option 26.804Direct Plan - Dividend Option 10.789
Banks 29.01Software 18.19Auto 6.93Construction Project 6.66Gas 5.43Finance 4.96Ferrous Metals 4.89Petroleum Products 4.20Industrial Capital Goods 3.18Consumer Non Durables 2.88
Power 2.57Minerals / Mining 1.98Oil 1.76Telecom - Services 1.41Media And Entertainment 1.32Cement 1.31Paper 1.18Consumer Durables 0.72Auto Ancillaries 0.45
Industry Allocation of Equity Holding (% of Net Assets)
Portfolio Turnover Ratio (Last 1 Year) 41.58%
HDFCPremier Multi-Cap Fund
Company Industry+ % to NAV
EQUITY & EQUITY RELATED
ICICI Bank Ltd. Banks 8.43
Infosys Ltd. Software 8.39
Tata Consultancy Services Ltd. Software 7.08
Larsen & Toubro Ltd. Construction Project 6.78
State Bank of India Banks 6.45
Tata Motors Ltd. DVR Auto 4.68
Tata Steel Ltd. Ferrous Metals 4.32
Oil India Ltd. Oil 3.79
Crompton Greaves Ltd. Industrial Capital Goods 3.33
Bharat Petroleum Corporation Ltd. Petroleum Products 3.18
Total of Top Ten Equity & Equity Related Holdings 56.43
Total Equity & Equity Related Holdings 99.13
Cash, Cash Equivalents and Net Current Assets 0.87
Grand Total 100.00
Average AUM for the quarter ended September 30, 2013 (` In Lakhs) 21,405.76
Portfolio – Top 10 Holdings
Std Deviation Beta Sharpe Ratio*
Risk Ratio 5.64% 0.9238 -0.198(for the 3-yr period ended Oct 31, 13)Based on month-end NAV
Source for Risk ratio: CRISIL Fund Analyser * Risk-free rate assumed to be 8.54% (364-day Treasury Bill yield on 31-10-13)
Std Deviation Beta Sharpe Ratio*
Risk Ratio 5.31% 0.8493 -0.191(for the 3-yr period ended Oct 31, 13)Based on month-end NAV
Large-Cap 49.61Mid-Cap 49.42
Segment-wise Break-up of Equity Holding (% of Net Assets)
Company Industry+ % to NAV
EQUITY & EQUITY RELATED
State Bank of India Banks 7.78
Infosys Ltd. Software 7.23
ICICI Bank Ltd. Banks 6.77
Larsen & Toubro Ltd. Construction Project 6.66
Tata Motors Ltd. DVR Auto 5.31
Tata Steel Ltd. Ferrous Metals 4.89
Bank of Baroda Banks 4.37
Bharat Petroleum Corporation Ltd. Petroleum Products 4.20
HDFC Bank Ltd. Banks 3.72
Tata Consultancy Services Ltd. Software 3.38
Total of Top Ten Equity & Equity Related Holdings 54.31
Total Equity & Equity Related Holdings 99.03
Cash, Cash Equivalents and Net Current Assets 0.97
Grand Total 100.00
Average AUM for the quarter ended September 30, 2013 (` In Lakhs) 25,264.50
Portfolio – Top 10 Holdings
Face Value per Unit: ` 10 unless otherwise specified + Industry Classification as recommended by AMFI Data is as of October 31, 2013 unless otherwise specified.
Intouchmutually October 2013 17

Portfolio Turnover Ratio (Last 1 Year) 23.04% Portfolio Turnover Ratio (Last 1 Year) 38.12%
HDFCMid-Cap Opportunities FundAn open-ended equity scheme
NAV NAV per Unit (`)
Growth Option 18.322Dividend Option 15.393Direct Plan - Growth Option 18.396Direct Plan - Dividend Option 15.459
Portfolio – Top 10 Holdings
Software 14.60Banks 14.59Pharmaceuticals 14.40Industrial Products 13.39Consumer Durables 8.72Auto Ancillaries 6.26Chemicals 4.77Industrial Capital Goods 3.73Consumer Non Durables 2.94
Construction 2.91Pesticides 2.69Transportation 2.19Media And Entertainment 1.84Oil 1.38Petroleum Products 1.05Construction Project 0.98Power 0.20
Industry Allocation of Equity Holding (% of Net Assets)
Large-Cap 2.57Mid-Cap 91.65Small-Cap 2.42
Segment-wise Break-up of Equity Holding (% of Net Assets)
Company Industry+ % to NAV
EQUITY & EQUITY RELATED
Supreme Industries Ltd. Industrial Products 4.55
MindTree Ltd. Software 3.91
IPCA Laboratories Ltd. Pharmaceuticals 3.57
eClerx Services Ltd. Software 3.34
Persistent Systems td. Software 3.00
Lupin Ltd. Pharmaceuticals 2.80
Bayer Cropscience Ltd Pesticides 2.69
Torrent Pharmaceuticals Ltd. Pharmaceuticals 2.68
Axis Bank Ltd. Banks 2.57
Amara Raja Batteries Ltd. Auto Ancillaries 2.52
Total of Top Ten Equity & Equity Related Holdings 31.63
Total Equity & Equity Related Holdings 96.64
Cash, Cash Equivalents and Net Current Assets 3.36
Grand Total 100.00
Average AUM for the quarter ended September 30, 2013 (` In Lakhs) 258,793.60
Std Deviation Beta Sharpe Ratio*
Risk Ratio 5.28% 0.7695 -0.061(for the 3-yr period ended Oct 31, 13)Based on month-end NAV
Source for Risk ratio: CRISIL Fund Analyser * Risk-free rate assumed to be 8.54% (364-day Treasury Bill yield on 31-10-13)
HDFC Focused Large-Cap FundAn open-ended equity scheme
Portfolio – Top 10 Holdings
NAV NAV per Unit (`)
Growth Option 16.909Dividend Option 10.837Direct Plan - Growth Option 16.984Direct Plan - Dividend Option 10.864
Company Industry+ % to NAV
EQUITY & EQUITY RELATED
ICICI Bank Ltd. Banks 8.30
Infosys Ltd. Software 8.13
Reliance Industries Ltd. Petroleum Products 7.82
ITC Ltd. Consumer Non Durables 7.23
State Bank of India Banks 5.70
Larsen & Toubro Ltd. Construction Project 4.44
HDFC Bank Ltd. Banks 4.24
Tata Consultancy Services Ltd. Software 4.20
Bharat Petroleum Corporation Ltd. Petroleum Products 3.98
Bharti Airtel Ltd. Telecom - Services 3.96
Total of Top Ten Equity & Equity Related Holdings 58.00
Total Equity & Equity Related Holdings 96.15
Cash, Cash Equivalents and Net Current Assets 3.85
Grand Total 100.00
Average AUM for the quarter ended September 30, 2013 (` In Lakhs) 38,977.07
Banks 24.20Software 15.21Petroleum Products 11.80Consumer Non Durables 7.73Oil 5.40Construction Project 4.44Minerals / Mining 4.37Auto 4.35Telecom - Services 3.96
Pharmaceuticals 3.85Cement 2.46Construction 1.92Power 1.83Ferrous Metals 1.61Transportation 1.34Finance 0.93Gas 0.75
Industry Allocation of Equity Holding (% of Net Assets)
Std Deviation Beta Sharpe Ratio*
Risk Ratio 5.71% 0.9691 -0.113(for the 3-yr period ended Oct 31, 13)Based on month-end NAV
Face Value per Unit: ` 10 unless otherwise specified + Industry Classification as recommended by AMFI Data is as of October 31, 2013 unless otherwise specified.
18 October 2013 Intouchmutually
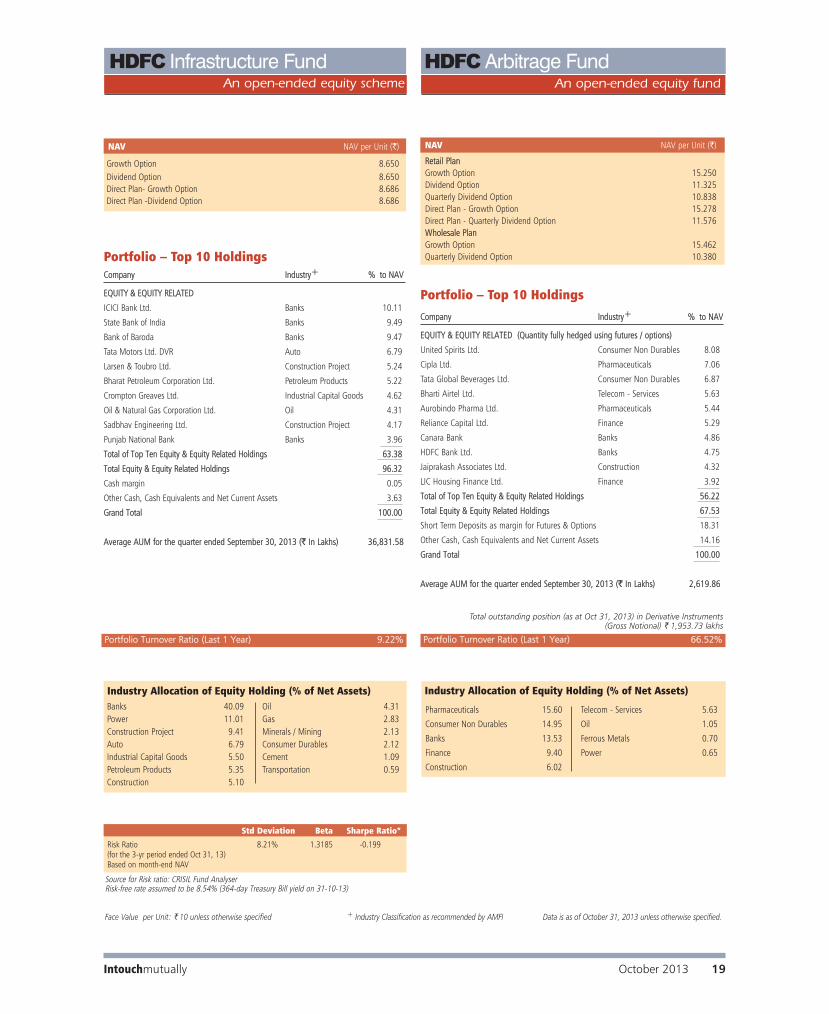
NAV NAV per Unit (`)
Retail PlanGrowth Option 15.250Dividend Option 11.325Quarterly Dividend Option 10.838Direct Plan - Growth Option 15.278Direct Plan - Quarterly Dividend Option 11.576Wholesale PlanGrowth Option 15.462Quarterly Dividend Option 10.380
An open-ended equity fund
HDFCArbitrage Fund
Pharmaceuticals 15.60
Consumer Non Durables 14.95
Banks 13.53
Finance 9.40
Construction 6.02
Telecom - Services 5.63
Oil 1.05
Ferrous Metals 0.70
Power 0.65
Industry Allocation of Equity Holding (% of Net Assets)
Company Industry+ % to NAV
EQUITY & EQUITY RELATED (Quantity fully hedged using futures / options)
United Spirits Ltd. Consumer Non Durables 8.08
Cipla Ltd. Pharmaceuticals 7.06
Tata Global Beverages Ltd. Consumer Non Durables 6.87
Bharti Airtel Ltd. Telecom - Services 5.63
Aurobindo Pharma Ltd. Pharmaceuticals 5.44
Reliance Capital Ltd. Finance 5.29
Canara Bank Banks 4.86
HDFC Bank Ltd. Banks 4.75
Jaiprakash Associates Ltd. Construction 4.32
LIC Housing Finance Ltd. Finance 3.92
Total of Top Ten Equity & Equity Related Holdings 56.22
Total Equity & Equity Related Holdings 67.53
Short Term Deposits as margin for Futures & Options 18.31
Other Cash, Cash Equivalents and Net Current Assets 14.16
Grand Total 100.00
Average AUM for the quarter ended September 30, 2013 (` In Lakhs) 2,619.86
Portfolio – Top 10 Holdings
Portfolio Turnover Ratio (Last 1 Year) 66.52%
HDFC Infrastructure FundAn open-ended equity scheme
Portfolio – Top 10 Holdings
NAV NAV per Unit (`)
Growth Option 8.650Dividend Option 8.650Direct Plan- Growth Option 8.686Direct Plan -Dividend Option 8.686
Company Industry+ % to NAV
EQUITY & EQUITY RELATED
ICICI Bank Ltd. Banks 10.11
State Bank of India Banks 9.49
Bank of Baroda Banks 9.47
Tata Motors Ltd. DVR Auto 6.79
Larsen & Toubro Ltd. Construction Project 5.24
Bharat Petroleum Corporation Ltd. Petroleum Products 5.22
Crompton Greaves Ltd. Industrial Capital Goods 4.62
Oil & Natural Gas Corporation Ltd. Oil 4.31
Sadbhav Engineering Ltd. Construction Project 4.17
Punjab National Bank Banks 3.96
Total of Top Ten Equity & Equity Related Holdings 63.38
Total Equity & Equity Related Holdings 96.32
Cash margin 0.05
Other Cash, Cash Equivalents and Net Current Assets 3.63
Grand Total 100.00
Average AUM for the quarter ended September 30, 2013 (` In Lakhs) 36,831.58
Banks 40.09Power 11.01Construction Project 9.41Auto 6.79Industrial Capital Goods 5.50Petroleum Products 5.35Construction 5.10
Oil 4.31Gas 2.83Minerals / Mining 2.13Consumer Durables 2.12Cement 1.09Transportation 0.59
Industry Allocation of Equity Holding (% of Net Assets)
Portfolio Turnover Ratio (Last 1 Year) 9.22%
Std Deviation Beta Sharpe Ratio*
Risk Ratio 8.21% 1.3185 -0.199(for the 3-yr period ended Oct 31, 13)Based on month-end NAV
Source for Risk ratio: CRISIL Fund AnalyserRisk-free rate assumed to be 8.54% (364-day Treasury Bill yield on 31-10-13)
Face Value per Unit: ` 10 unless otherwise specified + Industry Classification as recommended by AMFI Data is as of October 31, 2013 unless otherwise specified.
Intouchmutually October 2013 19
Total outstanding position (as at Oct 31, 2013) in Derivative Instruments(Gross Notional) ` 1,953.73 lakhs

HDFC Index Fund
NIFTY Plan (Face Value per Unit: ` 10.3260)
NAV NAV per Unit (`)
Growth Option 54.7448Direct Plan - Growth Option 54.8553
Company Industry+ % to NAV
EQUITY & EQUITY RELATED
ITC Ltd. Consumer Non Durables 8.86
Infosys Ltd. Software 7.74
Reliance Industries Ltd. Petroleum Products 7.23
Housing Development Finance Corporation Ltd. $ Finance 6.39
ICICI Bank Ltd. Banks 6.30
HDFC Bank Ltd. Banks 6.05
Tata Consultancy Services Ltd. Software 5.25
Larsen & Toubro Ltd. Construction Project 3.83
Tata Motors Ltd. Auto 3.29
Oil & Natural Gas Corporation Ltd. Oil 2.49
Total of Top Ten Equity & Equity Related Holdings 57.43
Total Equity & Equity Related Holdings 99.26
Cash, Cash Equivalents and Net Current Assets 0.74
Grand Total 100.00
Average AUM for the quarter ended September 30, 2013 (` In Lakhs) 5,663.14
Portfolio – Top 10 Holdings
Portfolio Turnover Ratio (Last 1 Year) 43.44%
$ Sponsor
An open-ended index linked scheme
Banks 19.62
Software 15.89
Consumer Non Durables 12.26
Auto 8.71
Petroleum Products 7.69
Finance 7.02
Pharmaceuticals 6.05
Construction Project 3.83
Oil 3.41
Cement 3.03
Power 2.84
Minerals / Mining 2.55
Telecom - Services 2.19
Ferrous Metals 1.57
Gas 0.79
Non - Ferrous Metals 0.75
Industrial Capital Goods 0.55
Construction 0.51
Industry Allocation of Equity Holding (% of Net Assets)
Tracking Error Since Inception (Annualised) 2.63%
Company Industry+ % to NAV
EQUITY & EQUITY RELATED
ITC Ltd. Consumer Non Durables 10.27
Reliance Industries Ltd. Petroleum Products 9.01
Infosys Ltd. Software 8.99
Housing Development Finance Corporation Ltd. $ Finance 7.27
ICICI Bank Ltd. Banks 7.17
HDFC Bank Ltd. Banks 7.15
Tata Consultancy Services Ltd. Software 6.88
Larsen & Toubro Ltd. Construction Project 4.48
Tata Motors Ltd. Auto 3.98
Oil & Natural Gas Corporation Ltd. Oil 3.47
Total of Top Ten Equity & Equity Related Holdings 68.67
Total Equity & Equity Related Holdings 99.53
Cash, Cash Equivalents and Net Current Assets 0.47
Grand Total 100.00
Average AUM for the quarter ended September 30, 2013 (` In Lakhs) 3,438.56
Portfolio – Top 10 Holdings
Portfolio Turnover Ratio (Last 1 Year) 35.83%
$ Sponsor
SENSEX Plan (Face Value per Unit: ` 32.1610)
NAV NAV per Unit (`)
Growth Option 178.7297Direct Plan - Growth Option 179.2872
An open-ended index linked scheme
HDFC Index Fund
Software 17.80
Banks 17.00
Consumer Non Durables 12.89
Auto 10.34
Petroleum Products 9.01
Finance 7.27
Pharmaceuticals 5.67
Construction Project 4.48
Oil 3.47
Telecom - Services 2.46
Minerals / Mining 2.44
Power 2.44
Ferrous Metals 1.79
Gas 0.97
Non - Ferrous Metals 0.84
Industrial Capital Goods 0.66
Industry Allocation of Equity Holding (% of Net Assets)
Tracking Error Since Inception (Annualised) 2.88%
+ Industry Classification as recommended by AMFI Data is as of October 31, 2013 unless otherwise specified.
20 October 2013 Intouchmutually
Company Industry+ % to NAV
EQUITY & EQUITY RELATED
ITC Ltd. Consumer Non Durables 8.59
Reliance Industries Ltd. Petroleum Products 7.41
Infosys Ltd. Software 7.41
Housing Development Finance Corporation Ltd. $ Finance 5.99
HDFC Bank Ltd. Banks 5.93
ICICI Bank Ltd. Banks 5.93
Tata Consultancy Services Ltd. Software 5.72
Larsen & Toubro Ltd. Construction Project 3.68
Axis Bank Ltd. Banks 3.64
Solar Industries India Ltd. Chemicals 3.33
Total of Top Ten Equity & Equity Related Holdings 57.63
Total Equity & Equity Related Holdings 97.62
Cash, Cash Equivalents and Net Current Assets 2.38
Grand Total 100.00
Average AUM for the quarter ended September 30, 2013 (` In Lakhs) 7,507.53
Portfolio – Top 10 Holdings
Portfolio Turnover Ratio (Last 1 Year) 43.48%
+ Industry Classification as recommended by AMFI $ Sponsor
SENSEX Plus Plan (Face Value per Unit: ` 32.1610)
NAV NAV per Unit (`)
Growth Option 263.6556Direct Plan - Growth Option 264.3788
An open-ended index linked scheme
HDFC Index Fund
Banks 21.22
Software 14.51
Consumer Non Durables 10.76
Petroleum Products 9.19
Auto 8.63
Finance 5.99
Pharmaceuticals 5.20
Chemicals 4.04
Construction Project 3.68
Oil 2.79
Telecom - Services 2.20
Minerals / Mining 2.12
Power 1.70
Ferrous Metals 1.56
Cement 1.21
Gas 0.91
Non - Ferrous Metals 0.74
Industrial Capital Goods 0.59
Industrial Products 0.58
Industry Allocation of Equity Holding (% of Net Assets)
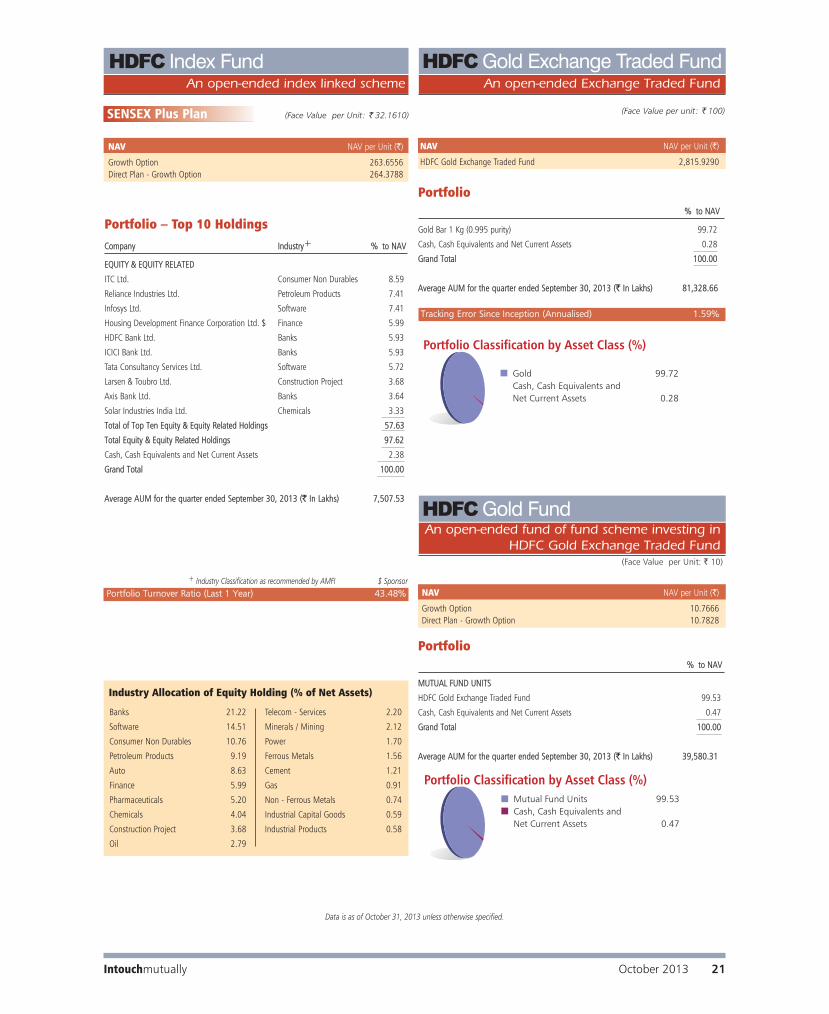
% to NAV
Gold Bar 1 Kg (0.995 purity) 99.72
Cash, Cash Equivalents and Net Current Assets 0.28
Grand Total 100.00
Average AUM for the quarter ended September 30, 2013 (` In Lakhs) 81,328.66
Portfolio
% to NAV
MUTUAL FUND UNITS
HDFC Gold Exchange Traded Fund 99.53
Cash, Cash Equivalents and Net Current Assets 0.47
Grand Total 100.00
Average AUM for the quarter ended September 30, 2013 (` In Lakhs) 39,580.31
Portfolio
NAV NAV per Unit (`)
HDFC Gold Exchange Traded Fund 2,815.9290
An open-ended Exchange Traded Fund
HDFCGold Exchange Traded Fund
An open-ended fund of fund scheme investing inHDFC Gold Exchange Traded Fund
HDFCGold Fund
(Face Value per unit: ` 100)
Mutual Fund Units 99.53Cash, Cash Equivalents andNet Current Assets 0.47
Portfolio Classification by Asset Class (%)
Tracking Error Since Inception (Annualised) 1.59%
NAV NAV per Unit (`)
Growth Option 10.7666Direct Plan - Growth Option 10.7828
Data is as of October 31, 2013 unless otherwise specified.
Gold 99.72Cash, Cash Equivalents andNet Current Assets 0.28
Portfolio Classification by Asset Class (%)
(Face Value per Unit: ` 10)
Intouchmutually October 2013 21

$ Sponsor
NAV NAV per Unit (`)
Growth Option 65.037Dividend Option 18.975Direct Plan - Growth Option 65.306Direct Plan - Dividend Option 19.054
Portfolio Turnover Ratio (Last 1 Year) 15.62% Portfolio Turnover Ratio (Last 1 Year) 33.85%
HDFCBalanced FundAn open-ended balanced scheme
HDFCPrudence FundAn open-ended balanced scheme
NAV NAV per Unit (`)
Growth Option 229.775Dividend Option 24.506Direct Plan - Growth Option 230.859Direct Plan - Dividend Option 24.627
Company / Issuer Industry+ / Rating % to NAV
EQUITY & EQUITY RELATED
Infosys Ltd. Software 3.30
MindTree Ltd. Software 3.12
ICICI Bank Ltd. Banks 3.01
Tata Consultancy Services Ltd. Software 2.93
Bayer Cropscience Ltd Pesticides 2.32
Persistent Systems Ltd. Software 2.25
eClerx Services Ltd. Software 2.22
IPCA Laboratories Ltd. Pharmaceuticals 2.22
Supreme Industries Ltd. Industrial Products 2.21
Torrent Pharmaceuticals Ltd. Pharmaceuticals 2.06
Total of Top Ten Equity & Equity Related Holdings 25.64
Total Equity & Equity Related Holdings 71.42
G-SEC, CREDIT EXPOSURE
Government Securities Sovereign 6.46
Shriram Transport Finance Co. Ltd. CARE - AA+ 3.42
LIC Housing Finance Ltd. CRISIL - AAA 3.04
Cholamandalam Investment and Finance Company Ltd. ICRA - AA 2.15
Power Finance Corporation Ltd. CRISIL - AAA 1.99
Housing Development Finance Corporation Ltd. $ CRISIL - AAA 1.99
Tata Motors Ltd. (Guaranteed by SBI) CRISIL - AAA(SO) 1.72
Tata Sons Ltd. CRISIL - AAA 0.87
State Bank of India CRISIL - AAA 0.22
Coromandel International Ltd. CRISIL - AAA 0.02
Total G-Sec, Credit Exposure 21.88
Cash, Cash Equivalents and Net Current Assets 6.70
Grand Total 100.00
Average AUM for the quarter ended September 30, 2013 (` In Lakhs) 109,917.73
Portfolio – Top 10 HoldingsCompany / Issuer Industry+ / Rating % to NAV
EQUITY & EQUITY RELATEDInfosys Ltd. Software 7.41ICICI Bank Ltd. Banks 4.93Tata Motors Ltd. DVR Auto 3.64Reliance Industries Ltd. Petroleum Products 3.05Larsen & Toubro Ltd. Construction Project 2.93State Bank of India Banks 2.68Page Industries Ltd. Textile Products 2.30Bank of Baroda Banks 2.22Procter & Gamble Hygiene and Health Care Ltd. Consumer Non Durables 1.90Oil India Ltd. Oil 1.89 Total of Top Ten Equity & Equity Related Holdings 32.95 Total Equity & Equity Related Holdings 75.30 G-SEC, CREDIT EXPOSURE Government Securities Sovereign 14.78State Bank of India CRISIL - AAA 2.15Power Finance Corporation Ltd. CRISIL - AAA 1.33Indian Railway Finance Corporation Ltd. CRISIL - AAA 1.04Tata Power Co. Ltd. CRISIL - AA 0.98Andhra Pradesh Expressway Ltd. ICRA - AAA(SO) 0.93Punjab National Bank CRISIL - AAA 0.39State Bank of Indore CRISIL - AAA 0.29Export - Import Bank of India CRISIL - AAA 0.19State Bank of Bikaner & Jaipur CRISIL - AAA 0.19 Total of Top Ten G-Sec, Credit Exposure 22.27 Total G-Sec, Credit Exposure 22.51 Cash, Cash Equivalents and Net Current Assets 2.19 Grand Total 100.00
Average AUM for the quarter ended September 30, 2013 (` In Lakhs) 515,112.69
Portfolio – Top 10 Holdings
Software 16.23
Banks 11.92
Pharmaceuticals 9.06
Industrial Products 6.63
Auto Ancillaries 4.56
Consumer Durables 4.06
Industrial Capital Goods 3.43
Pesticides 2.32
Petroleum Products 1.98
Construction Project 1.76
Chemicals 1.73
Telecom - Services 1.51
Auto 1.51
Media And Entertainment 1.23
Ferrous Metals 1.16
Consumer Non Durables 1.12
Transportation 0.84
Power 0.37
Industry Allocation of Equity Holding (% of Net Assets)
Banks 17.27Software 10.74Petroleum Products 5.71Auto 3.71Pharmaceuticals 3.21Industrial Capital Goods 3.17Textile Products 3.16Construction Project 2.93Consumer Non Durables 2.53Power 2.50Oil 2.31Auto Ancillaries 2.27Industrial Products 2.08
Ferrous Metals 1.57Finance 1.52Cement 1.51Telecom - Services 1.47Chemicals 1.41Paper 1.07Minerals / Mining 0.96Textiles - Cotton 0.87Transportation 0.83Construction 0.77Media And Entertainment 0.71Fertilisers 0.51Consumer Durables 0.51
Industry Allocation of Equity Holding (% of Net Assets)
Face Value per Unit: ` 10 unless otherwise specified + Industry Classification as recommended by AMFI Data is as of October 31, 2013 unless otherwise specified.
22 October 2013 Intouchmutually

HDFCChildren’s Gift FundAn open-ended balanced scheme
HDFCChildren’s Gift FundAn open-ended balanced scheme
Investment Plan
NAV NAV per Unit (`)
Investment Plan 53.920Investment Plan - Direct Plan 54.215
Portfolio Turnover Ratio (Last 1 Year) 15.98%
$ Sponsor
Savings Plan
NAV NAV per Unit (`)
Savings Plan 27.0052Savings Plan - Direct Plan 27.1860
Yield to Maturity * 9.14%
Modified Duration * 2.01 years
Average Maturity * 2.86 years
* Computed on the invested amount for debt portfolio
$ Sponsor
Portfolio – Top 10 HoldingsCompany / Issuer Industry+ / Rating % to NAV
EQUITY & EQUITY RELATEDInfosys Ltd. Software 1.48ICICI Bank Ltd. Banks 1.08eClerx Services Ltd. Software 0.90Supreme Industries Ltd. Industrial Products 0.86Torrent Pharmaceuticals Ltd. Pharmaceuticals 0.81AIA Engineering Ltd. Industrial Capital Goods 0.80Emami Ltd. Consumer Non Durables 0.77Solar Industries India Ltd. Chemicals 0.75State Bank of India Banks 0.74Divi's Laboratories Ltd. Pharmaceuticals 0.74Total of Top Ten Equity & Equity Related Holdings 8.93 Total Equity & Equity Related Holdings 19.08G-SEC, CREDIT EXPOSUREGovernment Securities Sovereign 17.77Housing Development Finance Corporation Ltd. $ CRISIL - AAA 8.25Tata Sons Ltd. CRISIL - AAA 6.89LIC Housing Finance Ltd. CRISIL - AAA 6.88Indian Railway Finance Corporation Ltd. CRISIL - AAA 6.87Power Finance Corporation Ltd. CRISIL - AAA 6.37Tata Motors Ltd. (Guaranteed by SBI) CRISIL - AAA(SO) 3.64State Bank of India CRISIL - AAA 3.51Bajaj Auto Ltd. CRISIL - AAA(SO) 0.03Total of G-Sec, Credit Exposure 60.21 Cash, Cash Equivalents and Net Current Assets 20.71 Grand Total 100.00
Average AUM for the quarter ended September 30, 2013 (` In Lakhs) 7,101.40
Portfolio – Top 10 Holdings
Software 13.46Pharmaceuticals 12.57Banks 9.72Industrial Products 9.49Auto Ancillaries 6.15Consumer Non Durables 3.25Petroleum Products 2.68Industrial Capital Goods 2.52Pesticides 1.96
Construction Project 1.78Media And Entertainment 1.53Construction 1.49Telecom - Services 1.34Auto 1.33Finance 1.28Ferrous Metals 1.02Fertilisers 0.54Consumer Durables 0.54
Industry Allocation of Equity Holding (% of Net Assets)
Company / Issuer Industry+ / Rating % to NAV
EQUITY & EQUITY RELATEDSun Pharmaceuticals Industries Ltd. Pharmaceuticals 4.90Infosys Ltd. Software 4.04Motherson Sumi Systems Ltd. Auto Ancillaries 3.46Reliance Industries Ltd. Petroleum Products 2.68Tata Consultancy Services Ltd. Software 2.58IPCA Laboratories Ltd. Pharmaceuticals 2.50HDFC Bank Ltd. Banks 2.33Astral Poly Technik Limited Industrial Products 2.31Persistent Systems Limited Software 2.28eClerx Services Ltd. Software 2.20 Total of Top Ten Equity & Equity Related Holdings 29.28Total Equity & Equity Related Holdings 72.65G-SEC, CREDIT EXPOSURETata Motors Ltd. (Guaranteed by SBI) CRISIL - AAA(SO) 4.20Housing Development Finance Corporation Ltd. $ CRISIL - AAA 3.90LIC Housing Finance Ltd. CRISIL - AAA 2.44Power Finance Corporation Ltd. CRISIL - AAA 2.44Indian Railway Finance Corporation Ltd. CRISIL - AAA 1.22Government Securities Sovereign 0.93Coromandel International Ltd. CRISIL - AAA 0.08Bajaj Auto Ltd. CRISIL - AAA(SO) 0.01Total G-Sec, Credit Exposure 15.22 Cash, Cash Equivalents and Net Current Assets 12.13Grand Total 100.00
Average AUM for the quarter ended September 30, 2013 (` In Lakhs) 37,076.52
Equity 19.08G-Sec 17.77Credit Exposure 42.44Cash,Cash Equivalents andNet Current Assets 20.71
Portfolio Classification by Asset Class (%)
Equity 18.41Sovereign 17.77AAA / AAA(SO) / A1+ / A1+(SO)& Equivalent 42.44AA+ & Below 0.67Cash, Cash Equivalents andNet Current Assets 20.71
Face Value per Unit: ` 10 unless otherwise specified + Industry Classification as recommended by AMFI Data is as of October 31, 2013 unless otherwise specified.
Intouchmutually October 2013 23

HDFC Long Term Advantage FundAn open-ended equity linked savings scheme with
a lock-in period of 3 years
HDFC TaxSaverAn open-ended equity linked savings scheme with
a lock-in period of 3 years
Portfolio – Top 10 Holdings
NAV NAV per Unit (`)
Growth Option 157.232Dividend Option 32.105Direct Plan - Growth Option 157.931Direct Plan - Dividend Option 32.236
$ Sponsor
Portfolio Turnover Ratio (Last 1 Year) 6.37%
Company Industry+ / Rating % to NAV
EQUITY & EQUITY RELATED
Infosys Ltd. Software 8.52
ICICI Bank Ltd. Banks 7.91
Tata Consultancy Services Ltd. Software 7.45
ITC Ltd. Consumer Non Durables 5.51
Reliance Industries Ltd. Petroleum Products 4.95
Larsen & Toubro Ltd. Construction Project 4.64
Housing Development Finance Corporation Ltd. $ Finance 4.02
Tata Motors Ltd. DVR Auto 3.98
Balkrishna Industries Ltd. Auto Ancillaries 3.75
Bharti Airtel Ltd. Telecom - Services 3.45
Total of Top Ten Equity & Equity Related Holdings 54.18
Total Equity & Equity Related Holdings 95.86
Cash, Cash Equivalents and Net Current Assets 4.14
Grand Total 100.00
Average AUM for the quarter ended September 30, 2013 (` In Lakhs) 77,649.84
NAV NAV per Unit (`)
Growth Option 244.092Dividend Option 49.230Direct Plan - Growth Option 245.432Direct Plan - Dividend Option 49.496
Portfolio – Top 10 Holdings
Portfolio Turnover Ratio (Last 1 Year) 41.57%
Software 16.19Banks 15.27Industrial Products 9.30Consumer Non Durables 7.24Auto Ancillaries 7.08Petroleum Products 7.02Pharmaceuticals 5.15Construction Project 4.64Finance 4.02
Auto 3.98Telecom - Services 3.45Oil 3.20Industrial Capital Goods 2.92Consumer Durables 2.19Chemicals 2.06Ferrous Metals 1.18Media And Entertainment 0.57
0.40
Industry Allocation of Equity Holding (% of Net Assets)
Banks 25.30Software 19.49Pharmaceuticals 6.30Auto 6.04Construction Project 5.33Consumer Non Durables 4.54Petroleum Products 3.82Industrial Capital Goods 3.56Oil 3.43Auto Ancillaries 3.37Ferrous Metals 3.33Telecom - Services 2.66
Finance 2.64Minerals / Mining 1.85Industrial Products 1.74Media And Entertainment 1.19Power 0.93Cement 0.87Transportation 0.85Chemicals 0.70Gas 0.39Paper 0.29Construction 0.09
Industry Allocation of Equity Holding (% of Net Assets)
Company Industry+ % to NAV
EQUITY & EQUITY RELATED
Infosys Ltd. Software 8.62
ICICI Bank Ltd. Banks 7.20
State Bank of India Banks 5.92
Larsen & Toubro Ltd. Construction Project 4.64
Tata Consultancy Services Ltd. Software 4.56
Tata Motors Ltd. DVR Auto 3.75
Oil India Ltd. Oil 3.43
Bharat Petroleum Corporation Ltd. Petroleum Products 3.41
Wipro Ltd. Software 3.38
HDFC Bank Ltd. Banks 3.33
Total of Top Ten Equity & Equity Related Holdings 48.24
Total Equity & Equity Related Holdings 98.71
Cash, Cash Equivalents and Net Current Assets 1.29
Grand Total 100.00
Average AUM for the quarter ended September 30, 2013 (` In Lakhs) 309,468.37
Std Deviation Beta Sharpe Ratio*
Risk Ratio 5.15% 0.8986 -0.083(for the 3-yr period ended Oct 31, 13)Based on month-end NAV
Std Deviation Beta Sharpe Ratio*
Risk Ratio 5.06% 0.8466 -0.134(for the 3-yr period ended Oct 31, 13)Based on month-end NAV
Source for Risk ratio: CRISIL Fund Analyser * Risk-free rate assumed to be 8.54% (364-day Treasury Bill yield on 31-10-13)
Face Value per Unit: ` 10 unless otherwise specified + Industry Classification as recommended by AMFI Data is as of October 31, 2013 unless otherwise specified.
24 October 2013 Intouchmutually

Benefits of Systematic Investment Plan (SIP) - SIP Performance of Select Schemes - Fund Manager-wise
Past performance may or may not be sustained in the future. # S&P BSE 200##S&P BSE SENSEX Inception Date: September 17, 2004
SIP Investments Since Inception SIP 5 Year SIP 3 Year SIP 1 Year SIP
Total Amount Invested (` ‘000) 109.00 60.00 36.00 12.00Mkt Value as on Sep 30, 13 (` ‘000) 143.66 62.07 31.00 10.67Returns (Annualised) (%) 5.95 1.34 -9.48 -19.90Benchmark Returns (Annualised) (%) # 7.67 5.85 0.94 -4.78Addl. Benchmark Ret. (Annualised) (%) ## 8.87 7.35 3.69 1.37
HDFC CORE & SATELLITE FUND - GROWTH OPTION
Past performance may or may not be sustained in the future. # CNX 500 Index ## CNX Nifty Index Inception Date: January 01, 1995
SIP Investments Since 15 year 10 year 5 Year 3 Year 1 YearInception SIP SIP SIP SIP SIP SIP
Total Amount Invested (` ‘000) 225.00 180.00 120.00 60.00 36.00 12.00Mkt Value as on Sep 30, 13 (` ‘000) 2,749.39 1,161.49 245.84 71.29 34.36 11.14Returns (Annualised) (%) 22.90 22.18 13.74 6.83 -3.00 -13.10Benchmark Returns (Annualised) (%) # 12.15 13.11 8.50 5.06 0.11 -6.57Addl. Benchmark Ret. (Annualised) (%) ## 11.71 12.84 9.84 6.62 2.49 -2.28
HDFC EQUITY FUND - GROWTH OPTION
Past performance may or may not be sustained in the future. # S&P BSE 200##S&P BSE SENSEX Inception Date: October 11, 1996
SIP Investments Since 15 year 10 year 5 Year 3 Year 1 YearInception SIP SIP SIP SIP SIP SIP
Total Amount Invested (` ‘000) 204.00 180.00 120.00 60.00 36.00 12.00Mkt Value as on Sep 30, 13 (` ‘000) $$ 1,538.73 1,053.39 250.43 71.01 35.28 11.28Returns (Annualised) (%) $$ 20.87 21.08 14.08 6.68 -1.31 -10.98Benchmark Returns (Annualised) (%) # 13.05 13.53 9.19 5.85 0.94 -4.78Addl. Benchmark Ret. (Annualised) (%) ## 12.53 13.33 10.39 7.35 3.69 1.37
HDFC TOP 200 FUND - GROWTH OPTION
Past performance may or may not be sustained in the future. # CNX 500 Index ##CNX Nifty Index Inception Date: March 10, 2008The Scheme is co-managed by Prashant Jain and Srinivas Rao Ravuri
SIP Investments Since Inception SIP 5 Year SIP 3 Year SIP 1 Year SIP
Total Amount Invested (` ‘000) 67.00 60.00 36.00 12.00Mkt Value as on Sep 30, 13 (` ‘000) 54.43 48.45 26.47 9.54Returns (Annualised) (%) -7.32 -8.37 -19.00 -35.68Benchmark Returns (Annualised) (%) # 4.72 5.06 0.11 -6.57Addl. Benchmark Ret. (Annualised)(%) ## 6.16 6.62 2.49 -2.28
HDFC INFRASTRUCTURE FUND - GROWTH OPTION
Past performance may or may not be sustained in the future. N.A. Not Available# CRISIL Balanced Fund Index ## CNX Nifty Index Inception Date: February 01, 1994
SIP Investments Since 15 year 10 year 5 Year 3 Year 1 YearInception SIP SIP SIP SIP SIP SIP
Total Amount Invested (` ‘000) 236.00 180.00 120.00 60.00 36.00 12.000Mkt Value as on Sep 30, 13 (` ‘000) $$ 2,283.40 940.98 240.17 72.39 34.84 11.07Returns (Annualised) (%) $$ 19.84 19.81 13.30 7.44 -2.12 -14.13Benchmark Returns (Annualised) (%) # N.A. N.A. 8.81 6.66 3.80 -1.29Addl. Benchmark Ret. (Annualised) (%) ##^11.28 12.84 9.84 6.62 2.49 -2.28
HDFC PRUDENCE FUND - GROWTH OPTION
Past performance may or may not be sustained in the future. # CNX 500 Index##CNX Nifty Index Inception Date: March 31, 1996
SIP Investments Since 15 year 10 year 5 Year 3 Year 1 YearInception SIP SIP SIP SIP SIP SIP
Total Amount Invested (` ‘000) 210.00 180.00 120.00 60.00 36.00 12.00Mkt Value as on Sep 30, 13 (` ‘000) $$ 2,722.90 1,183.26 234.10 70.57 34.78 11.39Returns (Annualised) (%) $$ 25.28 22.39 12.82 6.43 -2.23 -9.27Benchmark Returns (Annualised) (%) # 12.60 13.11 8.50 5.06 0.11 -6.57Addl. Benchmark Ret. (Annualised) (%) ## 12.07 12.84 9.84 6.62 2.49 -2.28
HDFC TAXSAVER - GROWTH OPTION
Past performance may or may not be sustained in the future. # CRISIL MIP Blended Index## CRISIL 10 year Gilt Index Inception Date: December 26, 2003The Scheme is co-managed by Prashant Jain (Equities) and Shobhit Mehrotra (Debt)
SIP Investments Since Inception SIP 5 Year SIP 3 Year SIP 1 Year SIP
Total Amount Invested (` ‘000) 118.00 60.00 36,000 12.00Mkt Value as on Sep 30, 13 (` ‘000) 184.93 70.76 37.83 11.71Returns (Annualised) (%) 8.85 6.54 3.25 -4.49Benchmark Returns (Annualised) (%) # 6.72 6.09 5.14 -0.56Addl. Benchmark Ret. (Annualised) (%) ##^ 5.00 3.95 3.90 -3.89
HDFC MF MIP - LONG TERM PLAN - GROWTH OPTION
Past performance may or may not be sustained in the future. # CNX 500 Index ## CNX Nifty Index Inception Date: April 06, 2005
SIP Investments Since Inception SIP 5 Year SIP 3 Year SIP 1 Year SIP
Total Amount Invested (` ‘000) 102.00 60.00 36.00 12.00Mkt Value as on Sep 30, 13 (` ‘000) 123.09 62.10 31.32 10.82Returns (Annualised) (%) 4.35 1.36 -8.85 -17.72Benchmark Returns (Annualised) (%) # 5.84 5.06 0.11 -6.57Addl. Benchmark Ret. (Annualised) (%) ## 7.42 6.62 2.49 -2.28
HDFC PREMIER MULTI-CAP FUND - GROWTH OPTION
Past performance may or may not be sustained in the future. Inception Date: July 17, 2002# S&P BSE SENSEX (Total Returns Index) ## CNX Nifty Index
SIP Investments Since 10 year 5 Year 3 Year 1 YearInception SIP SIP SIP SIP SIP
Total Amount Invested (` ‘000) 135.00 120.00 60.00 36.00 12.00Mkt Value as on Sep 30, 13 (` ‘000) 267.37 192.62 72.62 38.57 12.19Returns (Annualised) (%) 11.58 9.15 7.57 4.54 2.96Benchmark Returns (Annualised) (%) # 14.96 11.83 8.06 4.73 3.37Addl. Benchmark Ret. (Annualised) (%) ## 12.45 9.84 6.62 2.49 -2.28
HDFC INDEX FUND - SENSEX PLAN
Past performance may or may not be sustained in the future. Inception Date: July 17, 2002# CNX Nifty Index (Total Returns Index) ## S&P BSE SENSEX
SIP Investments Since 10 year 5 Year 3 Year 1 YearInception SIP SIP SIP SIP SIP
Total Amount Invested (` ‘000) 135.00 120.00 60.00 36.00 12.00Mkt Value as on Sep 30, 13 (` ‘000) 255.40 184.36 70.41 37.58 11.92Returns (Annualised) (%) 10.83 8.32 6.34 2.82 -1.30Benchmark Returns (Annualised) (%) # 14.13 11.34 8.02 3.87 -0.76Addl. Benchmark Ret. (Annualised) (%) ## 13.17 10.39 7.35 3.69 1.37
HDFC INDEX FUND - NIFTY PLAN
Past performance may or may not be sustained in the future. Inception Date: July 17, 2002# S&P BSE SENSEX (Total Returns Index) ##CNX Nifty Index
SIP Investments Since 10 year 5 Year 3 Year 1 YearInception SIP SIP SIP SIP SIP
Total Amount Invested (` ‘000) 135.00 120.00 60.00 36.00 12.00Mkt Value as on Sep 30, 13 (` ‘000) 336.81 229.19 74.05 37.73 11.80Returns (Annualised) (%) 15.34 12.43 8.35 3.08 -3.04Benchmark Returns (Annualised) (%) # 14.96 11.83 8.06 4.73 3.37Addl. Benchmark Ret. (Annualised)(%) ## 12.45 9.84 6.62 2.49 -2.28
HDFC INDEX FUND - SENSEX PLUS PLAN
The Fund offers flexible and convenient Systematic Investment Plan (SIP) facility. To illustrate the advantages of SIP investments, this is how your investments wouldhave grown if you had invested say ` 1,000 systematically on the first Business Dayof every month over a period of time.
PRASHANT JAIN
VINAY KULKARNIPast performance may or may not be sustained in the future. # CRISIL MIP Blended Index## CRISIL 10 year Gilt Index Inception Date: December 26, 2003The Scheme is co-managed by Vinay Kulkarni (Equities) and Shobhit Mehrotra (Debt)
SIP Investments Since Inception SIP 5 Year SIP 3 Year SIP 1 Year SIP
Total Amount Invested (` ‘000) 118.00 60.00 36.00 12.00Mkt Value as on Sep 30, 13 (` ‘000) 163.86 69.70 38.59 11.99Returns (Annualised) (%) 6.50 5.93 4.57 -0.09Benchmark Returns (Annualised) (%) # 6.72 6.09 5.14 -0.56Addl. Benchmark Ret. (Annualised)(%) ##^ 5.00 3.95 3.90 -3.89
HDFC MF MIP - SHORT TERM PLAN - GROWTH OPTION
$$ All dividends declared prior to the splitting of the Scheme into Dividend & Growth Options are assumed to bereinvested in the units of the Scheme at the then prevailing NAV (ex-dividend NAV).^ Scheme performance may not strictly be comparable with that of its Additional Benchmark in view of hybridnature of the schemeLoad is not taken into consideration for computation of performance. Investors are advised to refer to the performance summary table on page 36-50. Disclaimer: The above investment simulation is for illustrative purposes only and should not be construed as apromise on minimum returns and safeguard of capital. The AMC / Mutual Fund is not guaranteeing or promising or forecasting any returns. SIP does not assure a profit or guarantee protection against a loss in a declining market.Please refer SIP Enrolment Form or contact nearest ISC for SIP Load Structure and other details.
Intouchmutually October 2013 25
Benefits of Systematic Investment Plan (SIP) - SIP Performance of Select Schemes - Fund Manager-wise
Past performance may or may not be sustained in the future. #CRISIL MIP Blended Index## CRISIL 1 year T-Bill Index Inception Date: September 17, 2004The Scheme is co-managed by Vinay Kulkarni (Equities) and Anil Bamboli (Debt)
SIP Investments Since Inception SIP 5 Year SIP 3 Year SIP 1 Year SIP
Total Amount Invested (` ‘000) 109.00 60.00 36.00 12.00Mkt Value as on Sep 30, 13 (` ‘000) 162.56 73.94 39.76 12.26Returns (Annualised) (%) 8.57 8.29 6.57 4.09Benchmark Returns (Annualised) (%) # 6.68 6.09 5.14 -0.56Addl. Benchmark Ret. (Annualised)(%) ##^ 5.63 5.77 6.38 4.33
HDFC MULTIPLE YIELD FUND - GROWTH OPTION
Past performance may or may not be sustained in the future. #CRISIL MIP Blended Index## CRISIL 1 year T-Bill Index Inception Date: August 17, 2005The Scheme is co-managed by Chirag Setalvad (Equities) and Anil Bamboli (Debt)
SIP Investments Since Inception SIP 5 Year SIP 3 Year SIP 1 Year SIP
Total Amount Invested (` ‘000) 98.00 60.00 36.00 12.00Mkt Value as on Sep 30, 13 (` ‘000) 139.09 73.37 39.45 12.17Returns (Annualised) (%) 8.39 7.99 6.04 2.71Benchmark Returns (Annualised) (%) # 6.49 6.09 5.14 -0.56Addl. Benchmark Ret. (Annualised)(%) ##^ 5.67 5.77 6.38 4.33
HDFC MULTIPLE YIELD FUND - PLAN 2005 - GROWTH OPTION
Past performance may or may not be sustained in the future. #CNX Nifty Index## S&P BSE SENSEX Inception Date: February 10, 2006
SIP Investments Since Inception SIP 5 Year SIP 3 Year SIP 1 Year SIP
Total Amount Invested (` ‘000) 92.00 60.00 36.00 12.00Mkt Value as on Sep 30, 13 (` ‘000) 111.02 68.25 34.56 11.27Returns (Annualised) (%) 4.82 5.10 -2.64 -11.07Benchmark Returns (Annualised) (%) # 5.97 6.62 2.49 -2.28Addl. Benchmark Ret. (Annualised) (%) ## 6.20 7.35 3.69 1.37
HDFC FOCUSED LARGE-CAP FUND - GROWTH OPTION
Past performance may or may not be sustained in the future. # S&P BSE SENSEX## CNX Nifty Index Inception Date: January 02, 2001
SIP Investments Since 10 year 5 Year 3 Year 1 YearInception SIP SIP SIP SIP SIP
Total Amount Invested (` ‘000) 153.00 120.00 60.00 36.00 12.00Mkt Value as on Sep 30, 13 (` ‘000) 622.83 222.55 75.16 37.00 11.72Returns (Annualised) (%) 20.25 11.88 8.95 1.79 -4.38Benchmark Returns (Annualised) (%) # 13.95 10.39 7.35 3.69 1.37Addl. Benchmark Ret. (Annualised)(%) ## 13.18 9.84 6.62 2.49 -2.28
HDFC LONG TERM ADVANTAGE FUND - GROWTH OPTION
Past performance may or may not be sustained in the future. # CNX 500 Index ## CNX Nifty Index Inception Date: February 01, 1994The Scheme is co-managed by Chirag Setalvad & Miten Lathia
SIP Investments Since 15 year 10 year 5 Year 3 Year 1 YearInception SIP SIP SIP SIP SIP SIP
Total Amount Invested (` ‘000) 236.00 180.00 120.00 60.00 36.00 12.00Mkt Value as on Sep 30, 13 (` ‘000) 1,627.02 856.06 236.52 75.42 36.93 11.74 Returns (Annualised) (%) 17.08 18.74 13.02 9.09 1.66 -3.98Benchmark Returns (Annualised) (%) # 11.63 13.11 8.50 5.06 0.11 -6.57Addl. Benchmark Ret.(Annualised) (%) ## 11.28 12.84 9.84 6.62 2.49 -2.28
HDFC CAPITAL BUILDER FUND - GROWTH OPTION
Past performance may or may not be sustained in the future. N.A. Not Available # CRISIL Balanced Fund Index ## CNX Nifty Index Inception Date: September 11, 2000
SIP Investments Since 10 year 5 Year 3 Year 1 YearInception SIP SIP SIP SIP SIP
Total Amount Invested (` ‘000) 157.00 120.00 60.00 36.00 12.00Mkt Value as on Sep 30, 13 (` ‘000) 447.26 227.55 77.17 37.26 11.65Returns (Annualised) (%) 14.88 12.29 10.01 2.25 -5.42Benchmark Returns (Annualised) (%) # N.A. 8.81 6.66 3.80 -1.29Addl. Benchmark Ret. (Annualised)(%) ##^ 13.10 9.84 6.62 2.49 -2.28
HDFC BALANCED FUND - GROWTH OPTION
Past performance may or may not be sustained in the future. N.A. Not Available# CRISIL Balanced Fund Index ## CNX Nifty Index Inception Date: March 02, 2001
SIP Investments Since 10 year 5 Year 3 Year 1 YearInception SIP SIP SIP SIP SIP
Total Amount Invested (` ‘000) 151.00 120.00 60.00 36.00 12.00Mkt Value as on Sep 30, 13 (` ‘000) $ 420.78 239.75 85.59 40.13 12.22Returns (Annualised) (%) $ 15.20 13.27 14.19 7.18 3.38Benchmark Returns (Annualised) (%) # N.A. 8.81 6.66 3.80 -1.29Addl. Benchmark Ret. (Annualised)(%) ##^ 13.22 9.84 6.62 2.49 -2.28
HDFC CHILDREN’S GIFT FUND - INVESTMENT PLAN
Past performance may or may not be sustained in the future. # CRISIL MIP Blended Index## CRISIL 10 year Gilt Index N.A. Not Available Inception Date: March 02, 2001
SIP Investments Since 10 year 5 Year 3 Year 1 YearInception SIP SIP SIP SIP SIP
Total Amount Invested (` ‘000) 151.00 120.00 60.00 36.00 12.00Mkt Value as on Sep 30, 13 (` ‘000) $ 277.14 186.19 73.17 38.81 11.95Returns (Annualised) (%) $ 9.19 8.51 7.87 4.94 -0.79Benchmark Returns (Annualised) (%) # N.A. 6.73 6.09 5.14 -0.56Addl. Benchmark Ret. (Annualised)(%) ##^ N.A. 4.97 3.95 3.90 -3.89
HDFC CHILDREN’S GIFT FUND - SAVINGS PLAN
Past performance may or may not be sustained in the future. # CNX Midcap Index ## CNX Nifty Index Inception Date: June 25, 2007
SIP Investments Since Inception SIP 5 Year SIP 3 Year SIP 1 Year SIP
Total Amount Invested (` ‘000) 76.00 60.00 36.00 12.00Mkt Value as on Sep 30, 13 (` ‘000) 106.92 80.77 36.94 11.37Returns (Annualised) (%) 10.65 11.84 1.69 -9.65Benchmark Returns (Annualised) (%) # 2.21 2.74 -5.78 -16.30Addl. Benchmark Ret. (Annualised)(%) ## 5.29 6.62 2.49 -2.28
HDFC MID-CAP OPPORTUNITIES FUND - GROWTH OPTION
Past performance may or may not be sustained in the future. # S&P BSE SENSEX ## CNX Nifty Index Inception Date: September 11, 2000
SIP Investments Since 10 year 5 Year 3 Year 1 YearInception SIP SIP SIP SIP SIP
Total Amount Invested (` ‘000) 157.00 120.00 60.00 36.00 12.00Mkt Value as on Sep 30, 13 (` ‘000) 594.35 230.46 68.92 34.45 11.11Returns (Annualised) (%) 18.71 12.53 5.48 -2.84 -13.50Benchmark Returns (Annualised) (%) # 13.85 10.39 7.35 3.69 1.37Addl. Benchmark Ret. (Annualised) (%) ## 13.10 9.84 6.62 2.49 -2.28
HDFC GROWTH FUND - GROWTH OPTION
Past performance may or may not be sustained in the future. # CNX 500 Index ## CNX Nifty Index Inception Date: March 10, 2008The Scheme is co-managed by Prashant Jain and Srinivas Rao Ravuri
SIP Investments Since Inception SIP 5 Year SIP 3 Year SIP 1 Year SIP
Total Amount Invested (` ‘000) 67.00 60.00 36.00 12.00Mkt Value as on Sep 30, 13 (` ‘000) 54.43 48.45 26.47 9.54Returns (Annualised) (%) -7.32 -8.37 -19.00 -35.68Benchmark Returns (Annualised) (%) # 4.72 5.06 0.11 -6.57Addl. Benchmark Ret. (Annualised)(%) ## 6.16 6.62 2.49 -2.28
HDFC INFRASTRUCTURE FUND - GROWTH OPTION
$ Adjusted for Bonus units declared under the Scheme. ^ Scheme performance may not strictly be comparable with that of its Additional Benchmark in view of hybrid nature of the schemeLoad is not taken into consideration for computation of performance.Investors are advised to refer to the performance summary table on page 36-50. Disclaimer: The above investment simulation is for illustrative purposes only and should not be construed as a promise on minimum returns and safeguard of capital. The AMC / Mutual Fund is not guaranteeing or promising or forecasting any returns. SIP does not assure a profit or guarantee protection against a loss in a declining market.Please refer SIP Enrolment Form or contact nearest ISC for SIP Load Structure and other details.
CHIRAG SETALVAD
Past performance may or may not be sustained in the future. # CNX 500 Index ## CNX Nifty Index Inception Date: February 01, 1994The Scheme is co-managed by Chirag Setalvad & Miten Lathia
SIP Investments Since 15 year 10 year 5 Year 3 Year 1 YearInception SIP SIP SIP SIP SIP SIP
Total Amount Invested (` ‘000) 236.00 180.00 120.00 60.00 36.00 12.00Mkt Value as on Sep 30, 13 (` ‘000) 1,627.02 856.06 236.52 75.42 36.93 11.74 Returns (Annualised) (%) 17.08 18.74 13.02 9.09 1.66 -3.98Benchmark Returns (Annualised) (%) # 11.63 13.11 8.50 5.06 0.11 -6.57Addl. Benchmark Ret.(Annualised) (%) ## 11.28 12.84 9.84 6.62 2.49 -2.28
HDFC CAPITAL BUILDER FUND - GROWTH OPTION
MITEN LATHIA
SRINIVAS RAO RAVURI
Intouchmutually26 October 2013
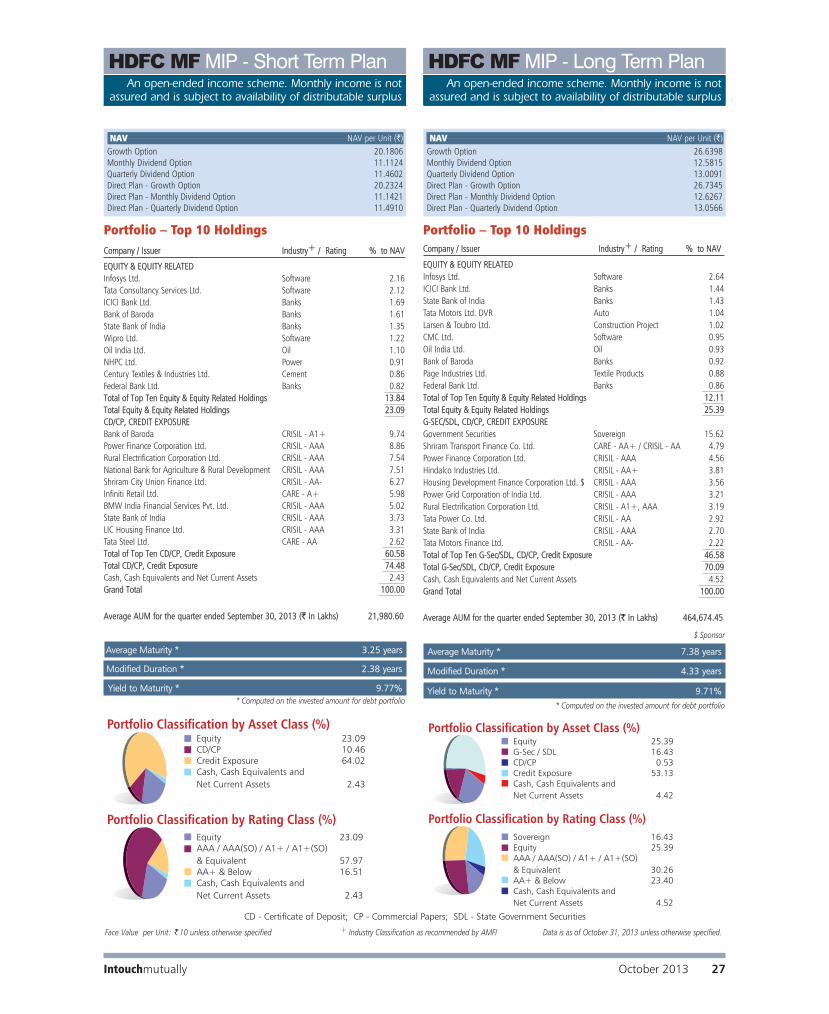
Company / Issuer Industry+ / Rating % to NAV
EQUITY & EQUITY RELATEDInfosys Ltd. Software 2.16Tata Consultancy Services Ltd. Software 2.12ICICI Bank Ltd. Banks 1.69Bank of Baroda Banks 1.61State Bank of India Banks 1.35Wipro Ltd. Software 1.22Oil India Ltd. Oil 1.10NHPC Ltd. Power 0.91Century Textiles & Industries Ltd. Cement 0.86Federal Bank Ltd. Banks 0.82Total of Top Ten Equity & Equity Related Holdings 13.84 Total Equity & Equity Related Holdings 23.09CD/CP, CREDIT EXPOSUREBank of Baroda CRISIL - A1+ 9.74Power Finance Corporation Ltd. CRISIL - AAA 8.86Rural Electrification Corporation Ltd. CRISIL - AAA 7.54National Bank for Agriculture & Rural Development CRISIL - AAA 7.51Shriram City Union Finance Ltd. CRISIL - AA- 6.27Infiniti Retail Ltd. CARE - A+ 5.98BMW India Financial Services Pvt. Ltd. CRISIL - AAA 5.02State Bank of India CRISIL - AAA 3.73LIC Housing Finance Ltd. CRISIL - AAA 3.31Tata Steel Ltd. CARE - AA 2.62 Total of Top Ten CD/CP, Credit Exposure 60.58Total CD/CP, Credit Exposure 74.48 Cash, Cash Equivalents and Net Current Assets 2.43 Grand Total 100.00
Average AUM for the quarter ended September 30, 2013 (` In Lakhs) 21,980.60
Portfolio – Top 10 Holdings
Equity 23.09CD/CP 10.46Credit Exposure 64.02Cash, Cash Equivalents andNet Current Assets 2.43
Portfolio Classification by Asset Class (%)
Equity 23.09AAA / AAA(SO) / A1+ / A1+(SO)& Equivalent 57.97AA+ & Below 16.51Cash, Cash Equivalents andNet Current Assets 2.43
Portfolio Classification by Rating Class (%)
Company / Issuer Industry+ / Rating % to NAV
EQUITY & EQUITY RELATEDInfosys Ltd. Software 2.64ICICI Bank Ltd. Banks 1.44State Bank of India Banks 1.43Tata Motors Ltd. DVR Auto 1.04Larsen & Toubro Ltd. Construction Project 1.02CMC Ltd. Software 0.95Oil India Ltd. Oil 0.93Bank of Baroda Banks 0.92Page Industries Ltd. Textile Products 0.88Federal Bank Ltd. Banks 0.86 Total of Top Ten Equity & Equity Related Holdings 12.11 Total Equity & Equity Related Holdings 25.39G-SEC/SDL, CD/CP, CREDIT EXPOSUREGovernment Securities Sovereign 15.62Shriram Transport Finance Co. Ltd. CARE - AA+ / CRISIL - AA 4.79Power Finance Corporation Ltd. CRISIL - AAA 4.56Hindalco Industries Ltd. CRISIL - AA+ 3.81Housing Development Finance Corporation Ltd. $ CRISIL - AAA 3.56Power Grid Corporation of India Ltd. CRISIL - AAA 3.21Rural Electrification Corporation Ltd. CRISIL - A1+, AAA 3.19Tata Power Co. Ltd. CRISIL - AA 2.92State Bank of India CRISIL - AAA 2.70Tata Motors Finance Ltd. CRISIL - AA- 2.22Total of Top Ten G-Sec/SDL, CD/CP, Credit Exposure 46.58Total G-Sec/SDL, CD/CP, Credit Exposure 70.09Cash, Cash Equivalents and Net Current Assets 4.52 Grand Total 100.00
Average AUM for the quarter ended September 30, 2013 (` In Lakhs) 464,674.45
Portfolio – Top 10 Holdings
* Computed on the invested amount for debt portfolio
$ Sponsor
Modified Duration * 4.33 years
Yield to Maturity * 9.71%Yield to Maturity * 9.77%
Average Maturity * 7.38 years
* Computed on the invested amount for debt portfolio
Modified Duration * 2.38 years
Average Maturity * 3.25 years
NAV NAV per Unit (`) Growth Option 20.1806Monthly Dividend Option 11.1124Quarterly Dividend Option 11.4602Direct Plan - Growth Option 20.2324Direct Plan - Monthly Dividend Option 11.1421Direct Plan - Quarterly Dividend Option 11.4910
NAV NAV per Unit (`) Growth Option 26.6398Monthly Dividend Option 12.5815Quarterly Dividend Option 13.0091Direct Plan - Growth Option 26.7345Direct Plan - Monthly Dividend Option 12.6267Direct Plan - Quarterly Dividend Option 13.0566
HDFC MF MIP - Short Term PlanAn open-ended income scheme. Monthly income is not
assured and is subject to availability of distributable surplus
HDFC MF MIP - Long Term PlanAn open-ended income scheme. Monthly income is not
assured and is subject to availability of distributable surplus
October 2013 27Intouchmutually
CD - Certificate of Deposit; CP - Commercial Papers; SDL - State Government Securities
Face Value per Unit: ` 10 unless otherwise specified + Industry Classification as recommended by AMFI Data is as of October 31, 2013 unless otherwise specified.

HDFC Multiple Yield FundAn open-ended income scheme
* Computed on the invested amount for debt portfolio * Computed on the invested amount for debt portfolio
NAV NAV per Unit (`) Growth Option 21.8854Dividend Option 11.3467Direct Plan - Growth Option 21.9481Direct Plan - Dividend Option 11.3788
NAV NAV per Unit (`) Growth Option 19.6955Dividend Option 11.1398Direct Plan - Growth Option 19.7967Direct Plan - Dividend Option 11.1953
HDFC Multiple Yield Fund - Plan 2005An open-ended income scheme
Equity 19.79CD/CP 43.57Credit Exposure 20.26Cash, Cash Equivalents andNet Current Assets 16.38
Portfolio Classification by Asset Class (%)
Equity 19.79AAA / AAA(SO) / A1+ / A1+(SO)& Equivalent 63.05AA+ & Below 0.78Cash, Cash Equivalents andNet Current Assets 16.38
Portfolio Classification by Rating Class (%)
Modified Duration * 92 days
Average Maturity * 102 days Average Maturity * 291 days
Company / Issuer Industry+ / Rating % to NAV
EQUITY & EQUITY RELATEDTata Motors Ltd. DVR Auto 1.23Grindwell Norton Ltd. Industrial Products 0.93Supreme Industries Ltd. Industrial Products 0.91Carborundum Universal Ltd. Industrial Products 0.88Fag Bearings India Ltd. Industrial Products 0.86Bajaj Finance Ltd. Finance 0.86eClerx Services Ltd. Software 0.86Suprajit Engineering Ltd. Auto Ancillaries 0.85IPCA Laboratories Ltd. Pharmaceuticals 0.84NIIT Technologies Ltd. Software 0.84Total of Top Ten Equity & Equity Related Holdings 9.06Total Equity & Equity Related Holdings 19.26CD/CP, CREDIT EXPOSURENational Housing Bank CARE - AAA 12.31Small Industries Development Bank of India [SIDBI] CARE - AAA 12.24State Bank of Patiala CRISIL - A1+ 12.14Export - Import Bank of India CRISIL - A1+ 11.41State Bank of Mysore ICRA - A1+ 11.32IDFC Ltd. ICRA - AAA 7.38Power Finance Corporation Ltd. CRISIL - AAA 7.30Vijaya Bank CARE - A1+ 2.36State Bank of Bikaner & Jaipur CRISIL - A1+ 2.27Total CD/CP, Credit Exposure 78.73 Cash, Cash Equivalents and Net Current Assets 2.01 Grand Total 100.00
Average AUM for the quarter ended September 30, 2013 (` In Lakhs) 23,357.72
Portfolio – Top 10 Holdings
Modified Duration * 257 days
Company / Issuer Industry+ / Rating % to NAV
EQUITY & EQUITY RELATED
Tata Motors Ltd. DVR Auto 1.89
Wipro Ltd. Software 1.39
Cipla Ltd. Pharmaceuticals 1.34
Britannia Industries Ltd. Consumer Non Durables 1.21
CMC Ltd. Software 1.18
Tata Consultancy Services Ltd. Software 1.10
Tata Steel Ltd. Ferrous Metals 1.09
Oil India Ltd. Oil 0.99
Bharat Petroleum Corporation Ltd. Petroleum Products 0.93
ICICI Bank Ltd. Banks 0.87
Total of Top Ten Equity & Equity Related Holdings 11.99
Total Equity & Equity Related Holdings 19.79
CD/CP, CREDIT EXPOSURE
State Bank of Travancore CRISIL - A1+ 32.04
IDFC Ltd. ICRA - AAA 13.06
Rural Electrification Corporation Ltd. CRISIL - AAA 6.42
Indian Overseas Bank ICRA - A1+ 6.38
Bank of Baroda CRISIL - A1+ 5.15
Tata Capital Housing Finance Ltd. CRISIL - AA+ 0.78
Total CD/CP, Credit Exposure 63.83
Cash, Cash Equivalents and Net Current Assets 16.38
Grand Total 100.00
Average AUM for the quarter ended September 30, 2013 (` In Lakhs) 8,406.26
Portfolio – Top 10 Holdings
Intouchmutually28 October 2013
CD - Certificate of Deposit; CP - Commercial Papers
Face Value per Unit: ` 10 unless otherwise specified + Industry Classification as recommended by AMFI Data is as of October 31, 2013 unless otherwise specified.
Yield to Maturity * 8.90% Yield to Maturity * 9.30%

NAV NAV per Unit (`)Growth Option 26.9019Dividend Option 10.7558Direct Plan - Growth Option 27.0565Direct Plan - Dividend Option 10.8194
NAV NAV per Unit (`)Growth Option 40.3112Quarterly Dividend Option 11.3158Half-Yearly Dividend Option 11.0520Yearly Dividend Option 12.1702Direct Plan - Growth Option 40.5358Direct Plan - Quarterly Dividend Option 11.3784Direct Plan - Half-Yearly Dividend Option 11.3679Direct Plan - Yearly Dividend Option 12.2412
HDFC Income FundAn open-ended income scheme
Modified Duration * 5.55 years Average Maturity * 9.29 years
Average Maturity * 9.74 years
HDFC High Interest Fund - Dynamic PlanAn open-ended income scheme
Modified Duration * 5.21 years
Issuer Rating % to NAV
G-SEC/SDL, CD/CP, CREDIT EXPOSURE
Government Securities Sovereign 38.30
Power Finance Corporation Ltd. CRISIL - AAA 10.20
Rural Electrification Corporation Ltd. CRISIL - A1+, AAA 5.00
Steel Authority of India Ltd. CARE - AAA 3.57
Union Bank of India CRISIL - AAA 3.46
Hindalco Industries Ltd. CRISIL - AA+ 3.30
Export - Import Bank of India CRISIL - AAA 2.52
State Government of Gujarat Sovereign 2.23
Oriental Bank of Commerce ICRA - AA+ 2.17
Indian Railway Finance Corporation Ltd. CRISIL - AAA 1.89
Total of Top Ten G-Sec/SDL, CD/CP, Credit Exposure 72.64
Total G-Sec/SDL, CD/CP, Credit Exposure 93.69
Cash, Cash Equivalents and Net Current Assets 6.31
Grand Total 100.00
Average AUM for the quarter ended September 30, 2013 (` In Lakhs) 506,754.81
Portfolio – Top 10 Holdings
Issuer Rating % to NAV
G-SEC/SDL, CREDIT EXPOSUREGovernment Securities Sovereign 59.24Steel Authority of India Ltd. CARE - AAA 7.30State Government of Gujarat Sovereign 6.60Power Finance Corporation Ltd. CRISIL - AAA 5.85IDFC Ltd. ICRA - AAA 3.23Power Grid Corporation of India Ltd. CRISIL - AAA 2.25Export - Import Bank of India CRISIL - AAA 1.86Indian Railway Finance Corporation Ltd. CRISIL - AAA 1.49Tata Power Co. Ltd. CRISIL - AA 0.48Neyveli Lignite Corporation Ltd. CRISIL - AAA 0.45 Total of Top Ten G-Sec/SDL, Credit Exposure 88.75 Total G-Sec/SDL, Credit Exposure 89.05 Cash, Cash Equivalents and Net Current Assets 10.95 Grand Total 100.00
Average AUM for the quarter ended September 30, 2013 (` In Lakhs) 105,151.41
Portfolio – Top Holdings
* Computed on the invested amount
* Computed on the invested amount
Total outstanding position (as at October 31, 2013) in Derivative Instruments(Interest Rate Swap) (Gross Notional) ` 500 lakhs.
Intouchmutually October 2013 29
CD - Certificate of Deposit; CP - Commercial Papers; SDL - State Government Securities
Face Value per Unit: ` 10 unless otherwise specified Data is as of October 31, 2013 unless otherwise specified.
Yield to Maturity * 8.98%
Yield to Maturity * 9.25%

NAV NAV per Unit (`)Growth Option 23.4383Dividend Option 10.3344Direct Plan - Growth Option 23.4852Direct Plan - Dividend Option 10.3349
NAV NAV per Unit (`)Growth Option 23.9403Dividend Option 10.6164Direct Plan - Growth Option 24.0199Direct Plan - Dividend Option 10.6192
HDFC Short Term PlanAn open-ended income scheme
HDFC High Interest Fund - Short Term PlanAn open-ended income scheme
Modified Duration * 1.41 years
Average Maturity * 1.76 years
Modified Duration * 1.99 years
Average Maturity * 2.58 years
Portfolio – Top 10 HoldingsIssuer Rating % to NAV
CD/CP, CREDIT EXPOSURE
Housing Development Finance Corporation Ltd. $ CRISIL - AAA 9.91
Power Finance Corporation Ltd. CRISIL - AAA 8.09
Rural Electrification Corporation Ltd. CRISIL - A1+, AAA 7.32
Tube Investments of India Ltd. CRISIL - AA 5.01
Cholamandalam Investment and Finance Co. Ltd. ICRA - AA 4.80
Export - Import Bank of India CRISIL - AAA 4.46
Volkswagen Finance Private Limited FITCH - AAA 4.27
Shriram City Union Finance Ltd. CRISIL - AA- 2.93
Shriram Transport Finance Co. Ltd. CARE - AA+ / CRISIL - AA 2.92
Airports Authority of India CRISIL - AAA 2.90
Total of Top Ten CD/CP, Credit Exposure 52.61
Total G-Sec/SDL, CD/CP, Credit Exposure 93.30
Cash, Cash Equivalents and Net Current Assets 6.70
Grand Total 100.00
Average AUM for the quarter ended September 30, 2013 (` In Lakhs) 321,339.18
Portfolio – Top 10 HoldingsIssuer Rating % to NAV
CD/CP, CREDIT EXPOSUREPower Finance Corporation Ltd. CRISIL - AAA 13.34LIC Housing Finance Ltd. CARE - AAA / CRISIL - AAA 6.03Canara Bank CRISIL - A1+ 5.82Housing Development Finance Corporation Ltd. $ CRISIL - AAA 4.48Tata Motors Ltd. # CARE - AA / CRISIL - AAA(SO) 4.38Tata Motors Finance Ltd. CARE - AA- / CRISIL - AA- 3.88Madura Garments Lifestyle Retail Co Ltd. (100% Put on ABNL) ICRA - AA+(SO) 3.82Shriram Transport Finance Co. Ltd. CARE - AA+ / CRISIL - AA 3.46Export - Import Bank of India CRISIL - AAA 3.00Rural Electrification Corporation Ltd. CRISIL - A1+, AAA 3.00Total of Top Ten CD/CP, Credit Exposure 51.21 Total SDL, T-Bills, CD/CP, Credit Exposure 96.64 Cash, Cash Equivalents and Net Current Assets 3.36 Grand Total 100.00
Average AUM for the quarter ended September 30, 2013 (` In Lakhs) 236,988.95
* Computed on the invested amount
$ Sponsor# Includes 0.23% exposure Guaranteed by SBI
* Computed on the invested amount
$ Sponsor
Intouchmutually30 October 2013
CD - Certificate of Deposit; CP - Commercial Papers; SDL - State Government Securities
Face Value per Unit: ` 10 unless otherwise specified Data is as of October 31, 2013 unless otherwise specified.
Yield to Maturity * 9.76% Yield to Maturity * 9.69%

Intouchmutually October 2013 31
Portfolio – Top 10 HoldingsIssuer Rating % to NAV
HDFC Short Term Opportunities FundAn open-ended income scheme An open-ended income scheme
HDFC Medium Term Opportunities Fund
* Computed on the invested amount
$ Sponsor$ Sponsor
# Includes 1.47% exposure Guaranteed by SBI
Average Maturity * 2.64 yearsAverage Maturity * 1.29 years
Modified Duration * 1.07 years Modified Duration * 2.08 years
Portfolio – Top HoldingsIssuer Rating % to NAV
NAV NAV per Unit (`)
Growth Option 13.2831Dividend Option 10.0967Direct Plan - Growth Option 13.2942Direct Plan - Dividend Option 10.0968
NAV NAV per Unit (`)
Growth Option 13.2106Dividend Option 10.1839Direct Plan - Growth Option 13.2189Direct Plan - Dividend Option 10.1849
CD/CP, CREDIT EXPOSURE
Power Finance Corporation Ltd. CRISIL - AAA 13.18
LIC Housing Finance Ltd. CARE - AAA / CRISIL - AAA 12.43
Housing Development Finance Corporation Ltd. $ CRISIL - AAA 8.84
Rural Electrification Corporation Ltd. CRISIL - AAA 8.63
National Bank for Agriculture & Rural Development CRISIL - AAA 7.03
Export - Import Bank of India CRISIL - AAA 6.91
Tata Sons Ltd. CRISIL - AAA 6.57
Tata Motors Ltd. CARE - AA 4.62
IDFC Ltd. ICRA - AAA 4.16
Small Industries Development Bank of India [SIDBI] CARE - AAA / CRISIL - AAA 3.74
Total of Top Ten CD/CP, Credit Exposure 76.11
Total G-Sec, CD/CP, Credit Exposure 94.34
Cash, Cash Equivalents and Net Current Assets 5.66
Grand Total 100.00
Average AUM for the quarter ended September 30, 2013 (` In Lakhs) 216,007.11
CD/CP, CREDIT EXPOSURELIC Housing Finance Ltd. CARE - AAA / CRISIL - AAA 10.39Power Finance Corporation Ltd. CRISIL - AAA 10.17Housing Development Finance Corporation Ltd. $ CRISIL - AAA 9.15Small Industries Development Bank of India [SIDBI] CARE - AAA 7.17Tata Motors Finance Ltd. CRISIL - AA- 4.01Shriram Transport Finance Co. Ltd. CARE - AA+ / CRISIL - AA 3.57National Bank for Agriculture & Rural Development CRISIL - AAA 3.49Steel Authority of India Ltd. CARE - AAA 3.11Tata Motors Ltd. # CARE - AA /
CRISIL - AAA(SO) 3.07Rural Electrification Corporation Ltd. CRISIL - AAA 2.77 Total of Top Ten CD/CP, Credit Exposure 56.90Total CD/CP, Credit Exposure 87.53 Cash, Cash Equivalents and Net Current Assets 12.47 Grand Total 100.00
Average AUM for the quarter ended September 30, 2013 (` In Lakhs) 238,924.62
Portfolio Classification by Rating Class (%)Sovereign 0.23AAA / AAA(SO) / A1+ / A1+(SO)& Equivalent 83.24AA+ & Below 10.87Cash, Cash Equivalents andNet Current Assets 5.66
Portfolio Classification by Asset Class (%)G-Sec 0.23CD/CP 1.14Credit Exposure 92.97Cash, Cash Equivalents andNet Current Assets 5.66
Portfolio Classification by Rating Class (%)AAA / AAA(SO) / A1+ / A1+(SO)& Equivalent 69.66AA+ & Below 17.87Cash, Cash Equivalents andNet Current Assets 12.47
Portfolio Classification by Asset Class (%)CD/CP 7.43Credit Exposure 80.10Cash, Cash Equivalents andNet Current Assets 12.47
CD - Certificate of Deposit; CP - Commercial Papers
* Computed on the invested amount
Face Value per Unit: ` 10 unless otherwise specified Data is as of October 31, 2013 unless otherwise specified.
Yield to Maturity * 9.49%Yield to Maturity * 9.58%

An open-ended income schemeHDFC Gilt Fund
Short Term Plan Long Term Plan
Modified Duration * 2.90 years Modified Duration * 6.25 years
Average Maturity * 4.21 years Average Maturity * 12.06 years
G-Sec 85.38Cash, Cash Equivalents andNet Current Assets 14.62
Portfolio Classification by Asset Class (%)
Portfolio Classification by Rating Class (%)
Sovereign 85.38Cash, Cash Equivalents andNet Current Assets 14.62
Issuer Rating % to NAV
G-SEC/SDL
8.07 GOI 2017 Sovereign 18.39
6.49 GOI 2015 Sovereign 15.06
7.83 GOI 2018 Sovereign 12.07
8.28 GOI 2027 Sovereign 11.83
7.28 GOI 2019 Sovereign 11.65
State Government of Punjab Sovereign 3.31
8.19 GOI 2020 Sovereign 0.10
Total G-Sec/SDL 72.41
Cash, Cash Equivalents and Net Current Assets 27.59
Grand Total 100.00
Average AUM for the quarter ended September 30, 2013 (` In Lakhs) 775.08
Portfolio – Top HoldingsIssuer Rating % to NAV
G-SEC
8.32 GOI 2032 Sovereign 27.17
8.28 GOI 2027 Sovereign 10.61
8.12 GOI 2020 Sovereign 9.50
8.33 GOI 2026 Sovereign 7.78
8.07 GOI 2017 Sovereign 5.99
9.15 GOI 2024 Sovereign 5.78
7.83 GOI 2018 Sovereign 4.46
8.20 GOI 2025 Sovereign 3.85
9.20 GOI 2030 Sovereign 3.33
8.30 GOI 2042 Sovereign 3.02
Total of Top Ten G-Sec 81.49
Total G-Sec 85.38
Cash, Cash Equivalents and Net Current Assets 14.62
Grand Total 100.00
Average AUM for the quarter ended September 30, 2013 (` In Lakhs) 32,304.76
Portfolio – Top 10 Holdings
Intouchmutually32 October 2013
Face Value per Unit: ` 10 unless otherwise specified Data is as of October 31, 2013 unless otherwise specified.
NAV NAV per Unit (`)
Growth Option 20.0495Dividend Option 11.0358Direct Plan - Growth Option 20.0976Direct Plan - Dividend Option 11.0635
NAV NAV per Unit (`)
Growth Option 23.1804Dividend Option 10.3858Direct Plan - Growth Option 23.2263Direct Plan - Dividend Option 10.4058
* Computed on the invested amount * Computed on the invested amount
Yield to Maturity * 8.86%Yield to Maturity * 8.60%
SDL - State Government Securities

Modified Duration * 87 days
Yield to Maturity * 9.54%
Short Term Plan
CD/CP, CREDIT EXPOSUREHousing Development Finance Corporation Ltd. $ CRISIL - AAA 5.56Rural Electrification Corporation Ltd. CARE - A1+ 4.52Steel Authority of India Ltd. CARE - A1+ 3.44IDFC Ltd. ICRA - A1+, AAA 3.39Corporation Bank CRISIL - A1+ 3.38Kotak Mahindra Prime Ltd. CRISIL - A1+, AA+ 3.33Syndicate Bank CARE - A1+ 2.86Piramal Enterprises Ltd. ICRA - A1+ 2.84Ranbaxy Laboratories Ltd. CRISIL - A1+ 2.80Tata Global Beverages Ltd. ICRA - AA 2.77Total of Top Ten CD/CP, Credit Exposure 34.89Total T-Bills, CD/CP, Credit Exposure 75.48Cash, Cash Equivalents and Net Current Assets 24.52Grand Total 100.00
Average AUM for the quarter ended September 30, 2013 (` In Lakhs) 479,160.45
Portfolio – Top 10 HoldingsIssuer Rating % to NAV
CD/CP
UCO Bank CRISIL - A1+ 15.18
Export - Import Bank of India CRISIL - A1+ 15.17
IDBI Bank Ltd. ICRA - A1+ 14.87
Allahabad Bank CRISIL - A1+ 12.15
ICICI Bank Ltd. ICRA - A1+ 10.62
Vijaya Bank CARE - A1+ 9.11
Dena Bank CRISIL - A1+ 9.11
Indian Bank FITCH - A1+ 6.98
Karur Vysya Bank Ltd. ICRA - A1+ 3.25
Kotak Mahindra Bank Ltd. CRISIL - A1+ 3.03
Total CD/CP 99.47
Cash, Cash Equivalents and Net Current Assets 0.53
Grand Total 100.00
Average AUM for the quarter ended September 30, 2013 (` In Lakhs) 174,598.93
Portfolio – Top 10 HoldingsIssuer Rating % to NAV
HDFC Floating Rate Income FundAn open-ended income scheme
HDFC Floating Rate Income FundAn open-ended income scheme
Long Term Plan
Modified Duration * 129 days
Yield to Maturity * 8.94%
Average Maturity * 97 days
Average Maturity * 141 days
NAV NAV per Unit (`)Retail OptionGrowth Option 20.6674Daily Dividend Reinvestment Option 10.0809Weekly Dividend Option 10.1446Monthly Dividend Option 10.1533Wholesale OptionGrowth Option 21.0832Daily Dividend Reinvestment Option 10.0809Weekly Dividend Option 10.1448Monthly Dividend Option 10.1536Direct Plan - Growth Option 21.0924Direct Plan - Daily Dividend Reinvestment Option 10.0809Direct Plan - Weekly Dividend Option 10.1449Direct Plan - Monthly Dividend Option 10.1537
NAV NAV per Unit (`)Growth Option 21.4895Weekly Dividend Reinvestment Option 10.1892Direct Plan - Growth Option 21.4972Direct Plan - Weekly Dividend Reinvestment Option 10.1892
CD/CP 99.47Cash, Cash Equivalents andNet Current Assets 0.53
Portfolio Classification by Asset Class (%)
Portfolio Classification by Rating Class (%)AAA / AAA(SO) / A1+ / A1+(SO)& Equivalent 99.47Cash, Cash Equivalents andNet Current Assets 0.53
CD - Certificate of Deposit; CP - Commercial Papers
* Computed on the invested amount
* Computed on the invested amount
Face Value per Unit: ` 10 unless otherwise specified Data is as of October 31, 2013 unless otherwise specified.
$ Sponsor
Intouchmutually October 2013 33
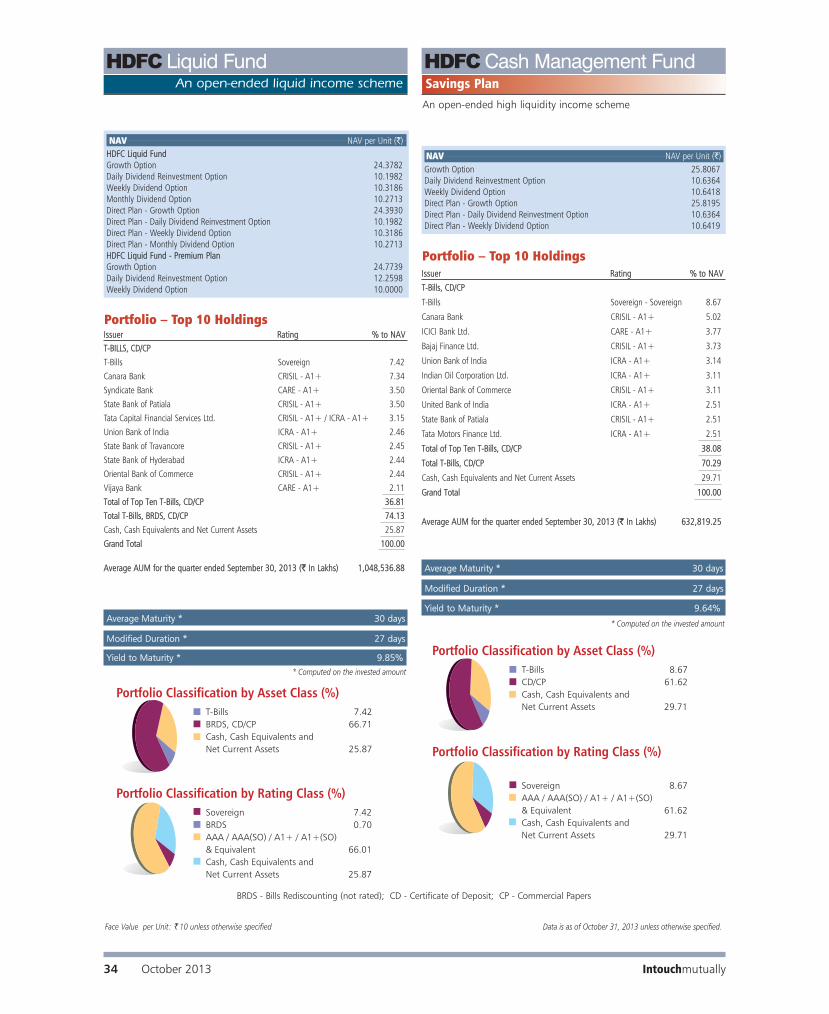
Savings PlanAn open-ended high liquidity income scheme
Portfolio – Top 10 HoldingsIssuer Rating % to NAV
HDFC Liquid FundAn open-ended liquid income scheme
HDFCCash Management Fund
* Computed on the invested amount
* Computed on the invested amount
Average Maturity * 30 days
Average Maturity * 30 days
Modified Duration * 27 days
Modified Duration * 27 days
Portfolio – Top 10 HoldingsIssuer Rating % to NAV
NAV NAV per Unit (`)Growth Option 25.8067Daily Dividend Reinvestment Option 10.6364Weekly Dividend Option 10.6418Direct Plan - Growth Option 25.8195Direct Plan - Daily Dividend Reinvestment Option 10.6364Direct Plan - Weekly Dividend Option 10.6419
NAV NAV per Unit (`)HDFC Liquid FundGrowth Option 24.3782Daily Dividend Reinvestment Option 10.1982Weekly Dividend Option 10.3186Monthly Dividend Option 10.2713Direct Plan - Growth Option 24.3930Direct Plan - Daily Dividend Reinvestment Option 10.1982Direct Plan - Weekly Dividend Option 10.3186Direct Plan - Monthly Dividend Option 10.2713HDFC Liquid Fund - Premium PlanGrowth Option 24.7739Daily Dividend Reinvestment Option 12.2598Weekly Dividend Option 10.0000 T-Bills, CD/CP
T-Bills Sovereign - Sovereign 8.67
Canara Bank CRISIL - A1+ 5.02
ICICI Bank Ltd. CARE - A1+ 3.77
Bajaj Finance Ltd. CRISIL - A1+ 3.73
Union Bank of India ICRA - A1+ 3.14
Indian Oil Corporation Ltd. ICRA - A1+ 3.11
Oriental Bank of Commerce CRISIL - A1+ 3.11
United Bank of India ICRA - A1+ 2.51
State Bank of Patiala CRISIL - A1+ 2.51
Tata Motors Finance Ltd. ICRA - A1+ 2.51
Total of Top Ten T-Bills, CD/CP 38.08
Total T-Bills, CD/CP 70.29
Cash, Cash Equivalents and Net Current Assets 29.71
Grand Total 100.00
Average AUM for the quarter ended September 30, 2013 (` In Lakhs) 632,819.25
T-BILLS, CD/CP
T-Bills Sovereign 7.42
Canara Bank CRISIL - A1+ 7.34
Syndicate Bank CARE - A1+ 3.50
State Bank of Patiala CRISIL - A1+ 3.50
Tata Capital Financial Services Ltd. CRISIL - A1+ / ICRA - A1+ 3.15
Union Bank of India ICRA - A1+ 2.46
State Bank of Travancore CRISIL - A1+ 2.45
State Bank of Hyderabad ICRA - A1+ 2.44
Oriental Bank of Commerce CRISIL - A1+ 2.44
Vijaya Bank CARE - A1+ 2.11
Total of Top Ten T-Bills, CD/CP 36.81
Total T-Bills, BRDS, CD/CP 74.13
Cash, Cash Equivalents and Net Current Assets 25.87
Grand Total 100.00
Average AUM for the quarter ended September 30, 2013 (` In Lakhs) 1,048,536.88
BRDS - Bills Rediscounting (not rated); CD - Certificate of Deposit; CP - Commercial Papers
Face Value per Unit: ` 10 unless otherwise specified Data is as of October 31, 2013 unless otherwise specified.
Intouchmutually34 October 2013
Yield to Maturity * 9.85%
Yield to Maturity * 9.64%

Portfolio – Top 10 HoldingsAverage Maturity * 1 day
Modified Duration * 1 day
HDFCCash Management Fund HDFCCash Management Fund
Note for All Aforesaid Open-Ended Schemes (as at October 31, 2013)i) Total NPAs provided for and its percentage to NAV : Nilii) Investment in ADR/GDR/Foreign Securities : Niliii) Total outstanding exposure in derivative instruments (Gross Notional)
a) Equity :HDFC Arbitrage Fund ` 1,953.73 lakhs
Total ` 1,953.73 lakhs
b) Debt : Interest Rates Swaps / Forward Rate Agreement :HDFC High Interest Fund - Dynamic Plan (Interest Rates Swaps) ` 500.00 lakhs
Total ` 500.00 lakhs
Treasury Advantage Plan Call PlanAn open-ended income scheme An open-ended high liquidity income scheme
* Computed on the invested amount
* Computed on the invested amount
Average Maturity * 164 days
Modified Duration * 145 days
Issuer Rating % to NAV
NAV NAV per Unit (`)Retail OptionGrowth Option 26.3167Daily Dividend Reinvestment Option 10.0315Weekly Dividend Option 10.0469Monthly Dividend Option 10.0595Direct Plan - Growth Option 26.4661Direct Plan - Daily Dividend Reinvestment Option 10.0315Direct Plan - Weekly Dividend Option 10.0475Direct Plan - Monthly Dividend Option 10.0600Wholesale OptionGrowth Option 27.0135Daily Dividend Reinvestment Option 10.0315Weekly Dividend Option 10.0474Monthly Dividend Option 10.0599
NAV NAV per Unit (`)Growth Option 19.6987Daily Dividend Reinvestment Option 10.4266Direct Plan - Growth Option 19.7078Direct Plan - Daily Dividend Reinvestment Option 10.4266
T-BILLS, CD/CP, CREDIT EXPOSUREHousing Development Finance Corporation Ltd. $ CRISIL - AAA 7.30Syndicate Bank CARE - A1+ 4.15Punjab National Bank FITCH - A1+ 3.55T-Bills Sovereign 3.42Rural Electrification Corporation Ltd. CARE - A1+ / CRISIL - AAA 3.37Power Finance Corporation Ltd. CRISIL - A1+, AAA 3.00Corporation Bank CRISIL - A1+ 2.89Shriram Transport Finance Co. Ltd. CARE - AA+ 2.81Piramal Enterprises Ltd. ICRA - A1+ 2.60Fullerton India Credit Company Ltd. ICRA - A1+ 2.55Total of Top Ten T-Bills, CD/CP, Credit Exposure 35.64 Total T-Bills, CD/CP, Credit Exposure 82.03Cash, Cash Equivalents and Net Current Assets 17.97Grand Total 100.00
Average AUM for the quarter ended September 30, 2013 (` In Lakhs) 828,776.89
Portfolio – HoldingsIssuer % to NAVCash, Cash Equivalents and Net Current Assets 100.00
Grand Total 100.00
Average AUM for the quarter ended September 30, 2013 (` In Lakhs) 131,157.86
CD - Certificate of Deposit CP - Commercial Papers
Face Value per Unit: ` 10 unless otherwise specified Data is as of October 31, 2013 unless otherwise specified.
Intouchmutually October 2013 35
Yield to Maturity * 9.57%
Yield to Maturity * 8.67%
$ Sponsor
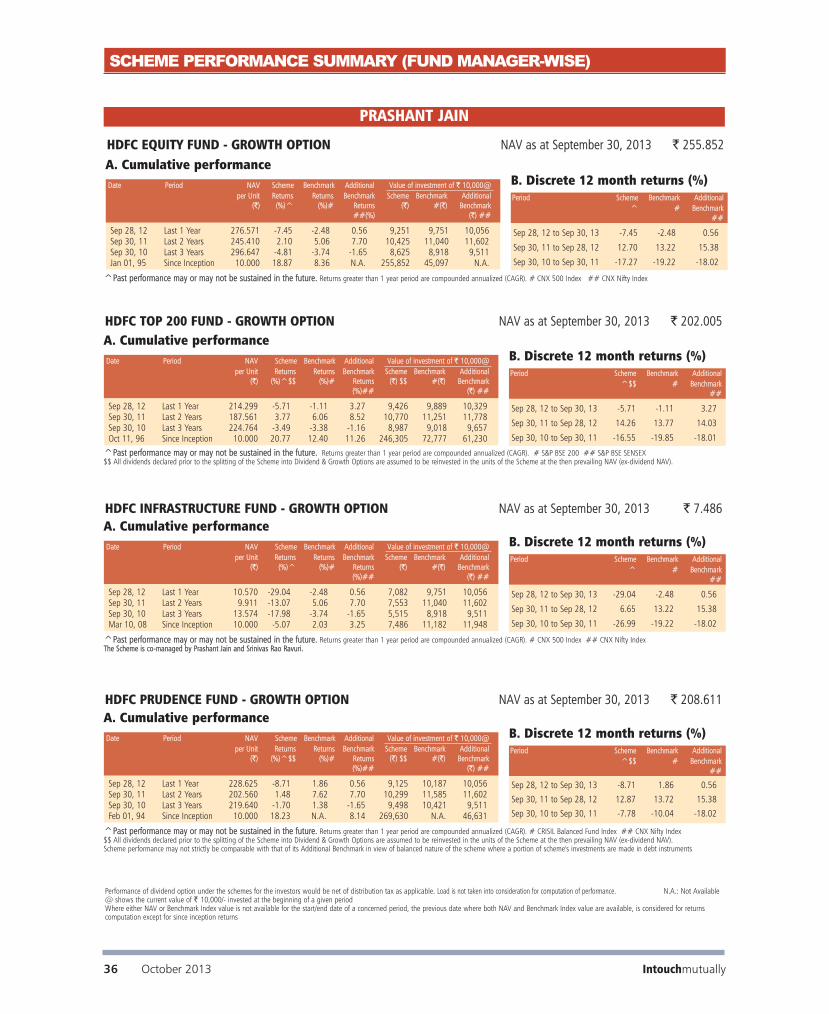
SCHEME PERFORMANCE SUMMARY (FUND MANAGER-WISE)
Date Period NAV Scheme Benchmark Additional Value of investment of ` 10,000@ per Unit Returns Returns Benchmark Scheme Benchmark Additional
(`) (%)^ (%)# Returns (`) #(`) Benchmark##(%) (`) ##
^Past performance may or may not be sustained in the future. Returns greater than 1 year period are compounded annualized (CAGR). # CNX 500 Index ## CNX Nifty Index
A. Cumulative performance
Sep 28, 12 Last 1 Year 276.571 -7.45 -2.48 0.56 9,251 9,751 10,056Sep 30, 11 Last 2 Years 245.410 2.10 5.06 7.70 10,425 11,040 11,602Sep 30, 10 Last 3 Years 296.647 -4.81 -3.74 -1.65 8,625 8,918 9,511Jan 01, 95 Since Inception 10.000 18.87 8.36 N.A. 255,852 45,097 N.A.
Period Scheme Benchmark Additional ^ # Benchmark
##
B. Discrete 12 month returns (%)
Sep 28, 12 to Sep 30, 13 -7.45 -2.48 0.56
Sep 30, 11 to Sep 28, 12 12.70 13.22 15.38
Sep 30, 10 to Sep 30, 11 -17.27 -19.22 -18.02
HDFC EQUITY FUND - GROWTH OPTION NAV as at September 30, 2013 ` 255.852
Date Period NAV Scheme Benchmark Additional Value of investment of ` 10,000@ per Unit Returns Returns Benchmark Scheme Benchmark Additional
(`) (%)^$$ (%)# Returns (`) $$ #(`) Benchmark(%)## (`) ##
^Past performance may or may not be sustained in the future. Returns greater than 1 year period are compounded annualized (CAGR). # S&P BSE 200 ## S&P BSE SENSEX$$ All dividends declared prior to the splitting of the Scheme into Dividend & Growth Options are assumed to be reinvested in the units of the Scheme at the then prevailing NAV (ex-dividend NAV).
A. Cumulative performance
Sep 28, 12 Last 1 Year 214.299 -5.71 -1.11 3.27 9,426 9,889 10,329Sep 30, 11 Last 2 Years 187.561 3.77 6.06 8.52 10,770 11,251 11,778Sep 30, 10 Last 3 Years 224.764 -3.49 -3.38 -1.16 8,987 9,018 9,657Oct 11, 96 Since Inception 10.000 20.77 12.40 11.26 246,305 72,777 61,230
Period Scheme Benchmark Additional ^$$ # Benchmark
##
B. Discrete 12 month returns (%)
Sep 28, 12 to Sep 30, 13 -5.71 -1.11 3.27
Sep 30, 11 to Sep 28, 12 14.26 13.77 14.03
Sep 30, 10 to Sep 30, 11 -16.55 -19.85 -18.01
HDFC TOP 200 FUND - GROWTH OPTION NAV as at September 30, 2013 ` 202.005
PRASHANT JAIN
Date Period NAV Scheme Benchmark Additional Value of investment of ` 10,000@ per Unit Returns Returns Benchmark Scheme Benchmark Additional
(`) (%)^ (%)# Returns (`) #(`) Benchmark(%)## (`) ##
^Past performance may or may not be sustained in the future. Returns greater than 1 year period are compounded annualized (CAGR). # CNX 500 Index ## CNX Nifty Index The Scheme is co-managed by Prashant Jain and Srinivas Rao Ravuri.
A. Cumulative performance
Sep 28, 12 Last 1 Year 10.570 -29.04 -2.48 0.56 7,082 9,751 10,056Sep 30, 11 Last 2 Years 9.911 -13.07 5.06 7.70 7,553 11,040 11,602Sep 30, 10 Last 3 Years 13.574 -17.98 -3.74 -1.65 5,515 8,918 9,511Mar 10, 08 Since Inception 10.000 -5.07 2.03 3.25 7,486 11,182 11,948
Period Scheme Benchmark Additional ^ # Benchmark
##
B. Discrete 12 month returns (%)
Sep 28, 12 to Sep 30, 13 -29.04 -2.48 0.56
Sep 30, 11 to Sep 28, 12 6.65 13.22 15.38
Sep 30, 10 to Sep 30, 11 -26.99 -19.22 -18.02
HDFC INFRASTRUCTURE FUND - GROWTH OPTION NAV as at September 30, 2013 ` 7.486
Date Period NAV Scheme Benchmark Additional Value of investment of ` 10,000@ per Unit Returns Returns Benchmark Scheme Benchmark Additional
(`) (%)^$$ (%)# Returns (`) $$ #(`) Benchmark(%)## (`) ##
^Past performance may or may not be sustained in the future. Returns greater than 1 year period are compounded annualized (CAGR). # CRISIL Balanced Fund Index ## CNX Nifty Index$$ All dividends declared prior to the splitting of the Scheme into Dividend & Growth Options are assumed to be reinvested in the units of the Scheme at the then prevailing NAV (ex-dividend NAV).Scheme performance may not strictly be comparable with that of its Additional Benchmark in view of balanced nature of the scheme where a portion of scheme's investments are made in debt instruments
A. Cumulative performance
Sep 28, 12 Last 1 Year 228.625 -8.71 1.86 0.56 9,125 10,187 10,056Sep 30, 11 Last 2 Years 202.560 1.48 7.62 7.70 10,299 11,585 11,602Sep 30, 10 Last 3 Years 219.640 -1.70 1.38 -1.65 9,498 10,421 9,511Feb 01, 94 Since Inception 10.000 18.23 N.A. 8.14 269,630 N.A. 46,631
Period Scheme Benchmark Additional ^$$ # Benchmark
##
B. Discrete 12 month returns (%)
Sep 28, 12 to Sep 30, 13 -8.71 1.86 0.56
Sep 30, 11 to Sep 28, 12 12.87 13.72 15.38
Sep 30, 10 to Sep 30, 11 -7.78 -10.04 -18.02
HDFC PRUDENCE FUND - GROWTH OPTION NAV as at September 30, 2013 ` 208.611
Performance of dividend option under the schemes for the investors would be net of distribution tax as applicable. Load is not taken into consideration for computation of performance. N.A.: Not Available@ shows the current value of ` 10,000/- invested at the beginning of a given periodWhere either NAV or Benchmark Index value is not available for the start/end date of a concerned period, the previous date where both NAV and Benchmark Index value are available, is considered for returns computation except for since inception returns
Intouchmutually36 October 2013

VINAY KULKARNI
Date Period NAV Scheme Benchmark Additional Value of investment of ` 10,000@ per Unit Returns Returns Benchmark Scheme Benchmark Additional
(`) (%)^ (%)# Returns (`) (`)# Benchmark(%)## (`) ##
^Past performance may or may not be sustained in the future. Returns greater than 1 year period are compounded annualized (CAGR). # S&P BSE SENSEX (Total Returns Index) ## CNX Nifty IndexSince inception returns are calculated on ` 32.1610 ( allotment price)
A. Cumulative performance
Sep 28, 12 Last 1 Year 156.9041 4.31 4.96 0.56 10,433 10,498 10,056Sep 30, 11 Last 2 Years 136.9204 9.33 10.47 7.70 11,956 12,206 11,602Sep 30, 10 Last 3 Years 167.7773 -0.82 -0.93 -1.65 9,757 9,725 9,511Jul 17, 02 Since Inception 32.1610 15.62 19.43 16.52 50,900 73,208 55,545
Period Scheme Benchmark Additional ^ # Benchmark
##
B. Discrete 12 month returns (%)
Sep 28, 12 to Sep 30, 13 4.31 4.96 0.56
Sep 30, 11 to Sep 28, 12 14.60 16.27 15.38
Sep 30, 10 to Sep 30, 11 -18.39 -20.33 -18.02
HDFC INDEX FUND - SENSEX PLAN - GROWTH OPTION NAV as at September 30, 2013 ` 163.7001
Date Period NAV Scheme Benchmark Additional Value of investment of ` 10,000@ per Unit Returns Returns Benchmark Scheme Benchmark Additional
(`) (%)^ (%)# Returns (`) (`)# Benchmark(%)## (`) ##
^Past performance may or may not be sustained in the future. Returns greater than 1 year period are compounded annualized (CAGR). # CNX 500 Index ## CNX Nifty Index
A. Cumulative performance
Sep 28, 12 Last 1 Year 27.685 -14.65 -2.48 0.56 8,528 9,751 10,056Sep 30, 11 Last 2 Years 26.751 -6.05 5.06 7.70 8,826 11,040 11,602Sep 30, 10 Last 3 Years 31.329 -8.99 -3.74 -1.65 7,536 8,918 9,511Apr 06, 05 Since Inception 10.000 10.65 11.03 12.76 23,610 24,306 27,716
Period Scheme Benchmark Additional ^ # Benchmark
##
B. Discrete 12 month returns (%)
Sep 28, 12 to Sep 30, 13 -14.65 -2.48 0.56
Sep 30, 11 to Sep 28, 12 3.49 13.22 15.38
Sep 30, 10 to Sep 30, 11 -14.61 -19.22 -18.02
HDFC PREMIER MULTI-CAP FUND - GROWTH OPTION NAV as at September 30, 2013 ` 23.610
Date Period NAV Scheme Benchmark Additional Value of investment of ` 10,000@ per Unit Returns Returns Benchmark Scheme Benchmark Additional
(`) (%)^ (%)# Returns (`) (`)# Benchmark(%)## (`) ##
^Past performance may or may not be sustained in the future. Returns greater than 1 year period are compounded annualized (CAGR). # S&P BSE 200 ## S&P BSE SENSEX
A. Cumulative performance
Sep 28, 12 Last 1 Year 37.734 -15.13 -1.11 3.27 8,479 9,889 10,329Sep 30, 11 Last 2 Years 35.832 -5.50 6.06 8.52 8,929 11,251 11,778Sep 30, 10 Last 3 Years 43.330 -9.61 -3.38 -1.16 7,384 9,018 9,657Sep 17, 04 Since Inception 10.000 13.73 13.53 14.81 31,995 31,485 34,848
Period Scheme Benchmark Additional ^ # Benchmark
##
B. Discrete 12 month returns (%)
Sep 28, 12 to Sep 30, 13 -15.13 -1.11 3.27
Sep 30, 11 to Sep 28, 12 5.31 13.77 14.03
Sep 30, 10 to Sep 30, 11 -17.30 -19.85 -18.01
HDFC CORE & SATELLITE FUND - GROWTH OPTION NAV as at September 30, 2013 ` 31.995
SCHEME PERFORMANCE SUMMARY (FUND MANAGER-WISE)
Date Period NAV Scheme Benchmark Additional Value of investment of ` 10,000@ per Unit Returns Returns Benchmark Scheme Benchmark Additional
(`) (%)^ (%)# Returns (`) #(`) Benchmark(%)## (`) ##
^Past performance may or may not be sustained in the future. Returns greater than 1 year period are compounded annualized (CAGR). # CRISIL MIP Blended Index ## CRISIL 10 year Gilt IndexScheme performance may not strictly be comparable with that of its Additional Benchmark in view of hybrid nature of the scheme where a portion of scheme's investments are made in equity instruments.
The Scheme is co-managed by Prashant Jain (Equities) and Shobhit Mehrotra (Debt).
A. Cumulative performance
Sep 28, 12 Last 1 Year 25.5658 -0.19 3.20 2.43 9,981 10,322 10,245Sep 29, 11 Last 2 Years 23.1615 4.95 6.72 5.19 11,017 11,393 11,067Sep 29, 10 Last 3 Years 22.7760 3.85 5.20 4.52 11,203 11,645 11,421Dec 26, 03 Since Inception 10.0000 10.06 6.69 4.16 25,517 18,825 14,893
Period Scheme Benchmark Additional ^ # Benchmark
##
B. Discrete 12 month returns (%)
Sep 28, 12 to Sep 30, 13 -0.19 3.20 2.43
Sep 29, 11 to Sep 28, 12 10.38 10.60 8.03
Sep 29, 10 to Sep 29, 11 1.69 2.10 3.18
HDFC MF MIP LONG TERM PLAN - GROWTH OPTION NAV as at September 30, 2013 ` 25.5167
PRASHANT JAIN...CONTINUED
Performance of dividend option under the schemes for the investors would be net of distribution tax as applicable. Load is not taken into consideration for computation of performance. N.A.: Not Available@ shows the current value of ` 10,000/- invested at the beginning of a given periodWhere either NAV or Benchmark Index value is not available for the start/end date of a concerned period, the previous date where both NAV and Benchmark Index value are available, is considered for returns computation except for since inception returns
Intouchmutually October 2013 37

Date Period NAV Scheme Benchmark Additional Value of investment of ` 10,000@ per Unit Returns Returns Benchmark Scheme Benchmark Additional
(`) (%)^$$ (%)# Returns (`) $$ (`)# Benchmark(%)## (`) ##
^Past performance may or may not be sustained in the future. Returns greater than 1 year period are compounded annualized (CAGR). # CNX 500 Index ## CNX Nifty Index$$ All dividends declared prior to the splitting of the Scheme into Dividend & Growth Options are assumed to be reinvested in the units of the Scheme at the then prevailing NAV (ex-dividend NAV).
A. Cumulative performance
Sep 28, 12 Last 1 Year 230.800 -5.75 -2.48 0.56 9,422 9,751 10,056Sep 30, 11 Last 2 Years 208.445 2.14 5.06 7.70 10,432 11,040 11,602Sep 30, 10 Last 3 Years 250.622 -4.62 -3.74 -1.65 8,677 8,918 9,511Mar 31, 96 Since Inception 10.000 25.69 11.06 N.A. 548,565 62,732 N.A.
Period Scheme Benchmark Additional ^$$ # Benchmark
##
B. Discrete 12 month returns (%)
Sep 28, 12 to Sep 30, 13 -5.75 -2.48 0.56
Sep 30, 11 to Sep 28, 12 10.72 13.22 15.38
Sep 30, 10 to Sep 30, 11 -16.83 -19.22 -18.02
HDFC TAXSAVER - GROWTH OPTION NAV as at September 30, 2013 ` 217.460
Date Period NAV Scheme Benchmark Additional Value of investment of ` 10,000@ per Unit Returns Returns Benchmark Scheme Benchmark Additional
(`) (%)^ (%)# Returns (`) (`)# Benchmark(%)## (`) ##
^Past performance may or may not be sustained in the future. Returns greater than 1 year period are compounded annualized (CAGR). # CRISIL MIP Blended Index ## CRISIL 10 year Gilt IndexScheme performance may not strictly be comparable with that of its Additional Benchmark in view of hybrid nature of the scheme where a portion of scheme's investments are made in equity instruments. The Scheme is co-managed by Vinay Kulkarni (Equities) and Shobhit Mehrotra (Debt).
A. Cumulative performance
Sep 28, 12 Last 1 Year 19.0357 2.26 3.20 2.43 10,227 10,322 10,245Sep 29, 11 Last 2 Years 17.4525 5.60 6.72 5.19 11,155 11,393 11,067Sep 29, 10 Last 3 Years 17.0400 4.53 5.20 4.52 11,425 11,645 11,421Dec 26, 03 Since Inception 10.0000 7.06 6.69 4.16 19,468 18,825 14,893
Period Scheme Benchmark Additional ^ # Benchmark
##
B. Discrete 12 month returns (%)
Sep 28, 12 to Sep 30, 13 2.26 3.20 2.43
Sep 29, 11 to Sep 28, 12 9.07 10.60 8.03
Sep 29, 10 to Sep 29, 11 2.42 2.10 3.18
HDFC MF MIP SHORT TERM PLAN - GROWTH OPTION NAV as at September 30, 2013 ` 19.4681
SCHEME PERFORMANCE SUMMARY (FUND MANAGER-WISE)
Performance of dividend option under the schemes for the investors would be net of distribution tax as applicable. Load is not taken into consideration for computation of performance. N.A.: Not Available@ shows the current value of ` 10,000/- invested at the beginning of a given periodWhere either NAV or Benchmark Index value is not available for the start/end date of a concerned period, the previous date where both NAV and Benchmark Index value are available, is considered for returns computation except for since inception returns
VINAY KULKARNI...CONTINUED
Performance of dividend option under the schemes for the investors would be net of distribution tax as applicable. Load is not taken into consideration for computation of performance.@ shows the current value of ` 10,000/- invested at the beginning of a given periodWhere either NAV or Benchmark Index value is not available for the start/end date of a concerned period, the previous date where both NAV and Benchmark Index value are available, is considered for returns computation except for since inception returns Please refer to page no. 51 for disclaimer for benchmark indices.
Date Period NAV Scheme Benchmark Additional Value of investment of ` 10,000@ per Unit Returns Returns Benchmark Scheme Benchmark Additional
(`) (%)^ (%)# Returns (`) (`)# Benchmark(%)## (`) ##
^Past performance may or may not be sustained in the future. Returns greater than 1 year period are compounded annualized (CAGR). # CNX Nifty Index (Total Returns Index) ## S&P BSE SENSEXSince inception returns are calculated on ` 10.3260 ( allotment price)
A. Cumulative performance
Sep 28, 12 Last 1 Year 49.3036 1.08 1.81 3.27 10,109 10,182 10,329Sep 30, 11 Last 2 Years 42.8556 7.83 9.07 8.52 11,630 11,899 11,778Sep 30, 10 Last 3 Years 52.5324 -1.74 -0.44 -1.16 9,487 9,867 9,657Jul 17, 02 Since Inception 10.3260 15.07 18.30 17.37 48,266 65,832 60,259
Period Scheme Benchmark Additional ^ # Benchmark
##
B. Discrete 12 month returns (%)
Sep 28, 12 to Sep 30, 13 1.08 1.81 3.27
Sep 30, 11 to Sep 28, 12 15.05 16.86 14.03
Sep 30, 10 to Sep 30, 11 -18.42 -17.07 -18.01
HDFC INDEX FUND - NIFTY PLAN - GROWTH OPTION NAV as at September 30, 2013 ` 49.8393
Date Period NAV Scheme Benchmark Additional Value of investment of ` 10,000@ per Unit Returns Returns Benchmark Scheme Benchmark Additional
(`) (%)^ (%)# Returns (`) (`)# Benchmark(%)## (`) ##
^Past performance may or may not be sustained in the future. Returns greater than 1 year period are compounded annualized (CAGR). # S&P BSE SENSEX (Total Returns Index) ## CNX Nifty IndexSince inception returns are calculated on ` 32.1610 ( allotment price)
A. Cumulative performance
Sep 28, 12 Last 1 Year 239.9173 0.21 4.96 0.56 10,021 10,498 10,056Sep 30, 11 Last 2 Years 206.2688 7.95 10.47 7.70 11,656 12,206 11,602Sep 30, 10 Last 3 Years 242.7425 -0.32 -0.93 -1.65 9,905 9,725 9,511Jul 17, 02 Since Inception 32.1610 19.65 19.43 16.52 74,758 73,208 55,545
Period Scheme Benchmark Additional ^ # Benchmark
##
B. Discrete 12 month returns (%)
Sep 28, 12 to Sep 30, 13 0.21 4.96 0.56
Sep 30, 11 to Sep 28, 12 16.31 16.27 15.38
Sep 30, 10 to Sep 30, 11 -15.03 -20.33 -18.02
HDFC INDEX FUND - SENSEX PLUS PLAN - GROWTH OPTION NAV as at September 30, 2013 ` 240.4296
Intouchmutually38 October 2013

SCHEME PERFORMANCE SUMMARY (FUND MANAGER-WISE)
Performance of dividend option under the schemes for the investors would be net of distribution tax as applicable. Load is not taken into consideration for computation of performance. N.A.: Not Available@ shows the current value of ` 10,000/- invested at the beginning of a given periodWhere either NAV or Benchmark Index value is not available for the start/end date of a concerned period, the previous date where both NAV and Benchmark Index value are available, is considered for returns computation except for since inception returns
Date Period NAV Scheme Benchmark Additional Value of investment of ` 10,000@ per Unit Returns Returns Benchmark Scheme Benchmark Additional
(`) (%)^ (%)# Returns (`) (`)# Benchmark(%)## (`) ##
^Past performance may or may not be sustained in the future. Returns greater than 1 year period are compounded annualized (CAGR). # CNX Midcap Index ## CNX Nifty Index
A. Cumulative performance
Sep 28, 12 Last 1 Year 17.772 -6.26 -10.69 0.56 9,370 8,925 10,056Sep 30, 11 Last 2 Years 15.123 4.93 -0.68 7.70 11,012 9,865 11,602Sep 30, 10 Last 3 Years 16.244 0.83 -8.59 -1.65 10,252 7,636 9,511Jun 25, 07 Since Inception 10.000 8.47 2.96 4.86 16,653 12,009 13,465
Period Scheme Benchmark Additional ^ # Benchmark
##
B. Discrete 12 month returns (%)
Sep 28, 12 to Sep 30, 13 -6.26 -10.69 0.56
Sep 30, 11 to Sep 28, 12 17.52 10.52 15.38
Sep 30, 10 to Sep 30, 11 -6.90 -22.59 -18.02
HDFC MID-CAP OPPORTUNITIES FUND - GROWTH OPTION NAV as at September 30, 2013 ` 16.653
CHIRAG SETALVAD
Date Period NAV Scheme Benchmark Additional Value of investment of ` 10,000@ per Unit Returns Returns Benchmark Scheme Benchmark Additional
(`) (%)^ (%)# Returns (`) (`)# Benchmark(%)## (`) ##
^Past performance may or may not be sustained in the future. Returns greater than 1 year period are compounded annualized (CAGR). # CNX 500 Index ## CNX Nifty IndexThe Scheme is co-managed by Chirag Setalvad & Miten Lathia
A. Cumulative performance
Sep 28, 12 Last 1 Year 113.969 -2.21 -2.48 0.56 9,778 9,751 10,056Sep 30, 11 Last 2 Years 99.456 5.85 5.06 7.70 11,205 11,040 11,602Sep 30, 10 Last 3 Years 117.837 -1.84 -3.74 -1.65 9,457 8,918 9,511Feb 01, 94 Since Inception 10.000 13.04 7.48 8.14 111,441 41,325 46,631
Period Scheme Benchmark Additional ^ # Benchmark
##
B. Discrete 12 month returns (%)
Sep 28, 12 to Sep 30, 13 -2.21 -2.48 0.56
Sep 30, 11 to Sep 28, 12 14.59 13.22 15.38
Sep 30, 10 to Sep 30, 11 -15.60 -19.22 -18.02
HDFC CAPITAL BUILDER FUND - GROWTH OPTION NAV as at September 30, 2013 ` 111.441
Date Period NAV Scheme Benchmark Additional Value of investment of ` 10,000@ per Unit Returns Returns Benchmark Scheme Benchmark Additional
(`) (%)^ (%)# Returns (`) (`)# Benchmark(%)## (`) ##
^Past performance may or may not be sustained in the future. Returns greater than 1 year period are compounded annualized (CAGR). # CRISIL MIP Blended Index ## CRISIL 1 year T-Bill IndexScheme performance may not strictly be comparable with that of its Additional Benchmark in view of hybrid nature of the scheme where a portion of scheme's investments are made in equity instruments. The Scheme is co-managed by Vinay Kulkarni (Equities) and Anil Bamboli (Debt).
A. Cumulative performance
Sep 28, 12 Last 1 Year 20.5099 4.04 3.20 5.66 10,406 10,322 10,570Sep 29, 11 Last 2 Years 18.5530 7.23 6.72 6.89 11,503 11,393 11,430Sep 29, 10 Last 3 Years 17.5924 6.64 5.20 6.38 12,131 11,645 12,044Sep 17, 04 Since Inception 10.0000 8.75 7.32 5.42 21,342 18,945 16,121
Period Scheme Benchmark Additional ^ # Benchmark
##
B. Discrete 12 month returns (%)
Sep 28, 12 to Sep 30, 13 4.04 3.20 5.66
Sep 29, 11 to Sep 28, 12 10.55 10.60 8.14
Sep 29, 10 to Sep 29, 11 5.46 2.10 5.36
HDFC MULTIPLE YIELD FUND - GROWTH OPTION NAV as at September 30, 2013 ` 21.3422
MITEN LATHIA
Date Period NAV Scheme Benchmark Additional Value of investment of ` 10,000@ per Unit Returns Returns Benchmark Scheme Benchmark Additional
(`) (%)^ (%)# Returns (`) (`)# Benchmark(%)## (`) ##
^Past performance may or may not be sustained in the future. Returns greater than 1 year period are compounded annualized (CAGR). # CNX 500 Index ## CNX Nifty IndexThe Scheme is co-managed by Chirag Setalvad & Miten Lathia
A. Cumulative performance
Sep 28, 12 Last 1 Year 113.969 -2.21 -2.48 0.56 9,778 9,751 10,056Sep 30, 11 Last 2 Years 99.456 5.85 5.06 7.70 11,205 11,040 11,602Sep 30, 10 Last 3 Years 117.837 -1.84 -3.74 -1.65 9,457 8,918 9,511Feb 01, 94 Since Inception 10.000 13.04 7.48 8.14 111,441 41,325 46,631
Period Scheme Benchmark Additional ^ # Benchmark
##
B. Discrete 12 month returns (%)
Sep 28, 12 to Sep 30, 13 -2.21 -2.48 0.56
Sep 30, 11 to Sep 28, 12 14.59 13.22 15.38
Sep 30, 10 to Sep 30, 11 -15.60 -19.22 -18.02
HDFC CAPITAL BUILDER FUND - GROWTH OPTION NAV as at September 30, 2013 ` 111.441
VINAY KULKARNI...CONTINUED
Intouchmutually October 2013 39
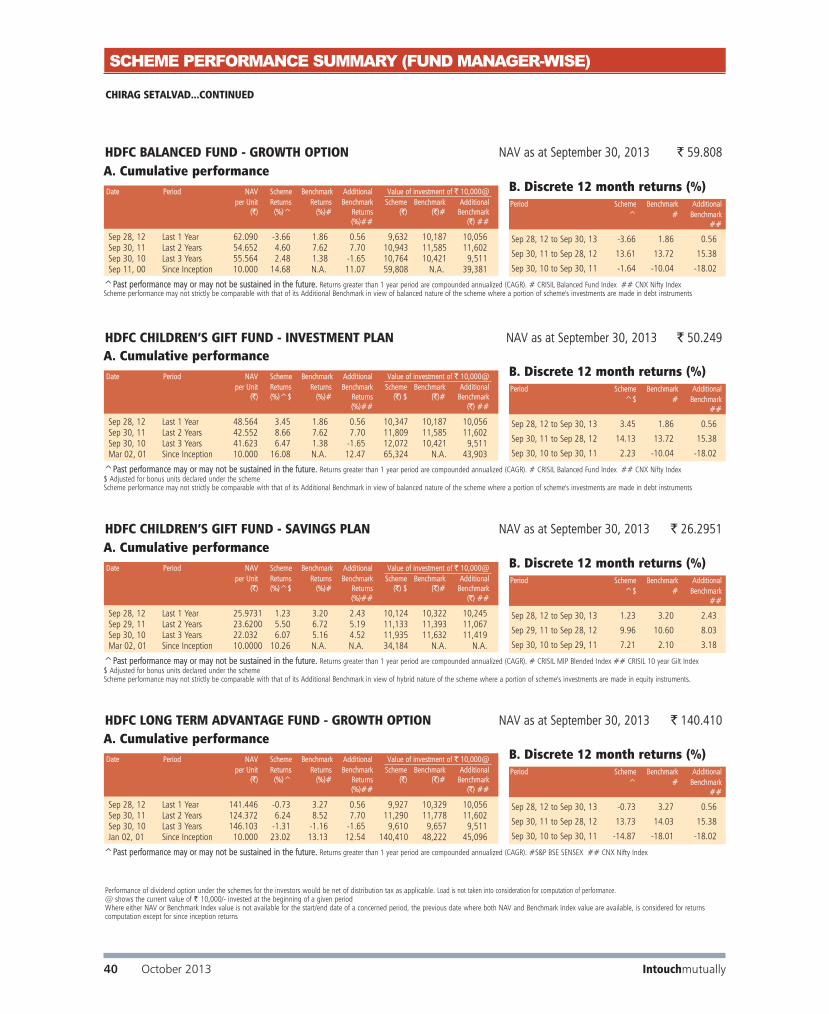
SCHEME PERFORMANCE SUMMARY (FUND MANAGER-WISE)
CHIRAG SETALVAD...CONTINUED
Performance of dividend option under the schemes for the investors would be net of distribution tax as applicable. Load is not taken into consideration for computation of performance.@ shows the current value of ` 10,000/- invested at the beginning of a given periodWhere either NAV or Benchmark Index value is not available for the start/end date of a concerned period, the previous date where both NAV and Benchmark Index value are available, is considered for returns computation except for since inception returns
Date Period NAV Scheme Benchmark Additional Value of investment of ` 10,000@ per Unit Returns Returns Benchmark Scheme Benchmark Additional
(`) (%)^ (%)# Returns (`) (`)# Benchmark(%)## (`) ##
^Past performance may or may not be sustained in the future. Returns greater than 1 year period are compounded annualized (CAGR). #S&P BSE SENSEX ## CNX Nifty Index
A. Cumulative performance
Sep 28, 12 Last 1 Year 141.446 -0.73 3.27 0.56 9,927 10,329 10,056Sep 30, 11 Last 2 Years 124.372 6.24 8.52 7.70 11,290 11,778 11,602Sep 30, 10 Last 3 Years 146.103 -1.31 -1.16 -1.65 9,610 9,657 9,511Jan 02, 01 Since Inception 10.000 23.02 13.13 12.54 140,410 48,222 45,096
Period Scheme Benchmark Additional ^ # Benchmark
##
B. Discrete 12 month returns (%)
Sep 28, 12 to Sep 30, 13 -0.73 3.27 0.56
Sep 30, 11 to Sep 28, 12 13.73 14.03 15.38
Sep 30, 10 to Sep 30, 11 -14.87 -18.01 -18.02
HDFC LONG TERM ADVANTAGE FUND - GROWTH OPTION NAV as at September 30, 2013 ` 140.410
Date Period NAV Scheme Benchmark Additional Value of investment of ` 10,000@ per Unit Returns Returns Benchmark Scheme Benchmark Additional
(`) (%)^ (%)# Returns (`) (`)# Benchmark(%)## (`) ##
^Past performance may or may not be sustained in the future. Returns greater than 1 year period are compounded annualized (CAGR). # CRISIL Balanced Fund Index ## CNX Nifty IndexScheme performance may not strictly be comparable with that of its Additional Benchmark in view of balanced nature of the scheme where a portion of scheme's investments are made in debt instruments
A. Cumulative performance
Sep 28, 12 Last 1 Year 62.090 -3.66 1.86 0.56 9,632 10,187 10,056Sep 30, 11 Last 2 Years 54.652 4.60 7.62 7.70 10,943 11,585 11,602Sep 30, 10 Last 3 Years 55.564 2.48 1.38 -1.65 10,764 10,421 9,511Sep 11, 00 Since Inception 10.000 14.68 N.A. 11.07 59,808 N.A. 39,381
Period Scheme Benchmark Additional ^ # Benchmark
##
B. Discrete 12 month returns (%)
Sep 28, 12 to Sep 30, 13 -3.66 1.86 0.56
Sep 30, 11 to Sep 28, 12 13.61 13.72 15.38
Sep 30, 10 to Sep 30, 11 -1.64 -10.04 -18.02
HDFC BALANCED FUND - GROWTH OPTION NAV as at September 30, 2013 ` 59.808
Date Period NAV Scheme Benchmark Additional Value of investment of ` 10,000@ per Unit Returns Returns Benchmark Scheme Benchmark Additional
(`) (%)^$ (%)# Returns (`) $ (`)# Benchmark(%)## (`) ##
^Past performance may or may not be sustained in the future. Returns greater than 1 year period are compounded annualized (CAGR). # CRISIL Balanced Fund Index ## CNX Nifty Index$ Adjusted for bonus units declared under the schemeScheme performance may not strictly be comparable with that of its Additional Benchmark in view of balanced nature of the scheme where a portion of scheme's investments are made in debt instruments
A. Cumulative performance
Sep 28, 12 Last 1 Year 48.564 3.45 1.86 0.56 10,347 10,187 10,056Sep 30, 11 Last 2 Years 42.552 8.66 7.62 7.70 11,809 11,585 11,602Sep 30, 10 Last 3 Years 41.623 6.47 1.38 -1.65 12,072 10,421 9,511Mar 02, 01 Since Inception 10.000 16.08 N.A. 12.47 65,324 N.A. 43,903
Period Scheme Benchmark Additional ^$ # Benchmark
##
B. Discrete 12 month returns (%)
Sep 28, 12 to Sep 30, 13 3.45 1.86 0.56
Sep 30, 11 to Sep 28, 12 14.13 13.72 15.38
Sep 30, 10 to Sep 30, 11 2.23 -10.04 -18.02
HDFC CHILDREN’S GIFT FUND - INVESTMENT PLAN NAV as at September 30, 2013 ` 50.249
Date Period NAV Scheme Benchmark Additional Value of investment of ` 10,000@ per Unit Returns Returns Benchmark Scheme Benchmark Additional
(`) (%)^$ (%)# Returns (`) $ (`)# Benchmark(%)## (`) ##
^Past performance may or may not be sustained in the future. Returns greater than 1 year period are compounded annualized (CAGR). # CRISIL MIP Blended Index ## CRISIL 10 year Gilt Index$ Adjusted for bonus units declared under the schemeScheme performance may not strictly be comparable with that of its Additional Benchmark in view of hybrid nature of the scheme where a portion of scheme's investments are made in equity instruments.
A. Cumulative performance
Sep 28, 12 Last 1 Year 25.9731 1.23 3.20 2.43 10,124 10,322 10,245Sep 29, 11 Last 2 Years 23.6200 5.50 6.72 5.19 11,133 11,393 11,067Sep 30, 10 Last 3 Years 22.032 6.07 5.16 4.52 11,935 11,632 11,419Mar 02, 01 Since Inception 10.0000 10.26 N.A. N.A. 34,184 N.A. N.A.
Period Scheme Benchmark Additional ^$ # Benchmark
##
B. Discrete 12 month returns (%)
Sep 28, 12 to Sep 30, 13 1.23 3.20 2.43
Sep 29, 11 to Sep 28, 12 9.96 10.60 8.03
Sep 30, 10 to Sep 29, 11 7.21 2.10 3.18
HDFC CHILDREN’S GIFT FUND - SAVINGS PLAN NAV as at September 30, 2013 ` 26.2951
Intouchmutually40 October 2013

SCHEME PERFORMANCE SUMMARY (FUND MANAGER-WISE)
Performance of dividend option under the schemes for the investors would be net of distribution tax as applicable. Load is not taken into consideration for computation of performance.@ shows the current value of ` 10,000/- invested at the beginning of a given periodWhere either NAV or Benchmark Index value is not available for the start/end date of a concerned period, the previous date where both NAV and Benchmark Index value are available, is considered for returns computation except for since inception returns
Date Period NAV Scheme Benchmark Additional Value of investment of ` 10,000@ per Unit Returns Returns Benchmark Scheme Benchmark Additional
(`) (%)^ (%)# Returns (`) (`)# Benchmark(%)## (`) ##
^Past performance may or may not be sustained in the future. Returns greater than 1 year period are compounded annualized (CAGR). # CRISIL MIP Blended Index ## CRISIL 1 year T-Bill IndexScheme performance may not strictly be comparable with that of its Additional Benchmark in view of hybrid nature of the scheme where a portion of scheme's investments are made in equity instruments. The Scheme is co-managed by Chirag Setalvad (Equities) and Anil Bamboli (Debt).
A. Cumulative performance
Sep 28, 12 Last 1 Year 18.6330 3.33 3.20 5.66 10,335 10,322 10,570Sep 29, 11 Last 2 Years 17.0039 6.40 6.72 6.89 11,325 11,393 11,430Sep 29, 10 Last 3 Years 15.9145 6.55 5.20 6.38 12,101 11,645 12,044Aug 17, 05 Since Inception 10.0000 8.40 7.08 5.48 19,258 17,431 15,432
Period Scheme Benchmark Additional ^ # Benchmark
##
B. Discrete 12 month returns (%)
Sep 28, 12 to Sep 30, 13 3.33 3.20 5.66
Sep 29, 11 to Sep 28, 12 9.58 10.60 8.14
Sep 29, 10 to Sep 29, 11 6.85 2.10 5.36
HDFC MULTIPLE YIELD FUND - PLAN 2005 - GROWTH OPTION NAV as at September 30, 2013 ` 19.2577
Date Period NAV Scheme Benchmark Additional Value of investment of ` 10,000@ per Unit Returns Returns Benchmark Scheme Benchmark Additional
(`) (%)^ (%)# Returns (`) (`)# Benchmark(%)## (`) ##
^Past performance may or may not be sustained in the future. Returns greater than 1 year period are compounded annualized (CAGR). # CNX Nifty Index ## S&P BSE SENSEX
A. Cumulative performance
Sep 28, 12 Last 1 Year 16.489 -7.50 0.56 3.27 9,246 10,056 10,329Sep 30, 11 Last 2 Years 14.780 1.56 7.70 8.52 10,315 11,602 11,778Sep 30, 10 Last 3 Years 17.321 -4.16 -1.65 -1.16 8,801 9,511 9,657Feb 10, 06 Since Inception 10.000 5.67 8.72 8.89 15,245 18,944 19,167
Period Scheme Benchmark Additional ^ # Benchmark
##
B. Discrete 12 month returns (%)
Sep 28, 12 to Sep 30, 13 -7.51 0.56 3.27
Sep 30, 11 to Sep 28, 12 11.56 15.38 14.03
Sep 30, 10 to Sep 30, 11 -14.67 -18.02 -18.01
HDFC FOCUSED LARGE-CAP FUND - GROWTH OPTION NAV as at September 30, 2013 ` 15.245
Date Period NAV Scheme Benchmark Additional Value of investment of ` 10,000@ per Unit Returns Returns Benchmark Scheme Benchmark Additional
(`) (%)^ (%)# Returns (`) (`) # Benchmark(%)## (`) ##
^Past performance may or may not be sustained in the future. Returns greater than 1 year period are compounded annualized (CAGR). # CNX 500 Index ## CNX Nifty IndexThe Scheme is co-managed by Prashant Jain and Srinivas Rao Ravuri.
A. Cumulative performance
Sep 28, 12 Last 1 Year 10.570 -29.04 -2.48 0.56 7,082 9,751 10,056Sep 30, 11 Last 2 Years 9.911 -13.07 5.06 7.70 7,553 11,040 11,602Sep 30, 10 Last 3 Years 13.574 -17.98 -3.74 -1.65 5,515 8,918 9,511Mar 10, 08 Since Inception 10.000 -5.07 2.03 3.25 7,486 11,182 11,948
Period Scheme Benchmark Additional ^ # Benchmark
##
B. Discrete 12 month returns (%)
Sep 28, 12 to Sep 30, 13 -29.04 -2.48 0.56
Sep 30, 11 to Sep 28, 12 6.65 13.22 15.38
Sep 30, 10 to Sep 30, 11 -26.99 -19.22 -18.02
HDFC INFRASTRUCTURE FUND - GROWTH OPTION NAV as at September 30, 2013 ` 7.486
SRINIVAS RAO RAVURI
Date Period NAV Scheme Benchmark Additional Value of investment of ` 10,000@ per Unit Returns Returns Benchmark Scheme Benchmark Additional
(`) (%)^ (%)# Returns (`) (`)# Benchmark(%)## (`) ##
^Past performance may or may not be sustained in the future. Returns greater than 1 year period are compounded annualized (CAGR). # S&P BSE SENSEX ## CNX Nifty Index
A. Cumulative performance
Sep 28, 12 Last 1 Year 90.739 -9.29 3.27 0.56 9,066 10,329 10,056Sep 30, 11 Last 2 Years 79.427 1.77 8.52 7.70 10,357 11,778 11,602Sep 30, 10 Last 3 Years 93.228 -4.08 -1.16 -1.65 8,824 9,657 9,511Sep 11, 00 Since Inception 10.000 17.51 11.46 11.07 82,261 41,263 39,381
Period Scheme Benchmark Additional ^ # Benchmark
##
B. Discrete 12 month returns (%)
Sep 28, 12 to Sep 30, 13 -9.29 3.27 0.56
Sep 30, 11 to Sep 28, 12 14.24 14.03 15.38
Sep 30, 10 to Sep 30, 11 -14.80 -18.01 -18.02
HDFC GROWTH FUND - GROWTH OPTION NAV as at September 30, 2013 ` 82.261
CHIRAG SETALVAD...CONTINUED
Intouchmutually October 2013 41

SHOBHIT MEHROTRA
Date Period NAV Scheme Benchmark Additional Value of investment of ` 10,000@ per Unit Returns Returns Benchmark Scheme Benchmark Additional
(`) (%)^ (%)# Returns (`) (`)# Benchmark(%)## (`) ##
^Past performance may or may not be sustained in the future. Returns greater than 1 year period are compounded annualized (CAGR). # CRISIL MIP Blended Index ## CRISIL 10 year Gilt IndexScheme performance may not strictly be comparable with that of its Additional Benchmark in view of hybrid nature of the scheme where a portion of scheme's investments are made in equity instruments.
The Scheme is co-managed by Prashant Jain (Equities) and Shobhit Mehrotra (Debt).
A. Cumulative performance
Sep 28, 12 Last 1 Year 25.5658 -0.19 3.20 2.43 9,981 10,322 10,245Sep 29, 11 Last 2 Years 23.1615 4.95 6.72 5.19 11,017 11,393 11,067Sep 29, 10 Last 3 Years 22.7760 3.85 5.20 4.52 11,203 11,645 11,421Dec 26, 03 Since Inception 10.0000 10.06 6.69 4.16 25,517 18,825 14,893
Period Scheme Benchmark Additional ^ # Benchmark
##
B. Discrete 12 month returns (%)
Sep 28, 12 to Sep 30, 13 -0.19 3.20 2.43
Sep 29, 11 to Sep 28, 12 10.38 10.60 8.03
Sep 29, 10 to Sep 29, 11 1.69 2.10 3.18
HDFC MF MIP LONG TERM PLAN - GROWTH OPTION NAV as at September 30, 2013 ` 25.5167
Date Period NAV Scheme Benchmark Additional Value of investment of ` 10,000@ per Unit Returns Returns Benchmark Scheme Benchmark Additional
(`) (%)^ (%)# Returns (`) (`)# Benchmark(%)## (`) ##
^Past performance may or may not be sustained in the future. Returns greater than 1 year period are compounded annualized (CAGR). # CRISIL MIP Blended Index ## CRISIL 10 year Gilt IndexScheme performance may not strictly be comparable with that of its Additional Benchmark in view of hybrid nature of the scheme where a portion of scheme's investments are made in equity instruments.
The Scheme is co-managed by Vinay Kulkarni (Equities) and Shobhit Mehrotra (Debt).
A. Cumulative performance
Sep 28, 12 Last 1 Year 19.0357 2.26 3.20 2.43 10,227 10,322 10,245Sep 29, 11 Last 2 Years 17.4525 5.60 6.72 5.19 11,155 11,393 11,067Sep 29, 10 Last 3 Years 17.0400 4.53 5.20 4.52 11,425 11,645 11,421Dec 26, 03 Since Inception 10.0000 7.06 6.69 4.16 19,468 18,825 14,893
Period Scheme Benchmark Additional ^ # Benchmark
##
B. Discrete 12 month returns (%)
Sep 28, 12 to Sep 30, 13 2.26 3.20 2.43
Sep 29, 11 to Sep 28, 12 9.07 10.60 8.03
Sep 29, 10 to Sep 29, 11 2.42 2.10 3.18
HDFC MF MIP SHORT TERM PLAN - GROWTH OPTION NAV as at September 30, 2013 ` 19.4681
Date Period NAV Scheme Benchmark Additional Value of investment of ` 10,000@ per Unit Returns Returns Benchmark Scheme Benchmark Additional
(`) (%)^ (%)# Returns (`) (`)# Benchmark(%)## (`) ##
^Past performance may or may not be sustained in the future. Returns greater than 1 year period are compounded annualized (CAGR). # CRISIL Composite Bond Fund Index ## CRISIL 10 year Gilt Index
A. Cumulative performance
Sep 28, 12 Last 1 Year 25.7485 2.27 3.48 2.43 10,228 10,349 10,245Sep 29, 11 Last 2 Years 23.3821 6.11 6.45 5.19 11,263 11,335 11,067Sep 29, 10 Last 3 Years 22.2149 5.82 6.16 4.52 11,855 11,968 11,421Sep 11, 00 Since Inception 10.0000 7.70 N.A. N.A. 26,336 N.A. N.A.
Period Scheme Benchmark Additional ^ # Benchmark
##
B. Discrete 12 month returns (%)
Sep 28, 12 to Sep 30, 13 2.27 3.48 2.43
Sep 29, 11 to Sep 28, 12 10.12 9.53 8.03
Sep 29, 10 to Sep 29, 11 5.25 5.56 3.18
HDFC INCOME FUND - GROWTH OPTION NAV as at September 30, 2013 ` 26.3356
Date Period NAV Scheme Benchmark Additional Value of investment of ` 10,000@ per Unit Returns Returns Benchmark Scheme Benchmark Additional
(`) (%)^ (%)# Returns (`) (`)# Benchmark(%)## (`)##
^Past performance may or may not be sustained in the future. Returns greater than 1 year period are compounded annualized (CAGR). # CRISIL Short Term Bond Fund Index ## CRISIL 1 year T-Bill Index
A. Cumulative performance
Sep 28, 12 Last 1 Year 22.1828 6.37 7.73 5.66 10,640 10,778 10,570Sep 29, 11 Last 2 Years 20.1583 8.18 8.47 6.89 11,709 11,770 11,430Sep 29, 10 Last 3 Years 18.8983 7.68 7.91 6.38 12,490 12,571 12,044Feb 06, 02 Since Inception 10.0000 7.65 N.A. 5.41 23,603 N.A. 18,477
Period Scheme Benchmark Additional ^ # Benchmark
##
B. Discrete 12 month returns (%)
Sep 28, 12 to Sep 30, 13 6.33 7.73 5.66
Sep 29, 11 to Sep 28, 12 10.04 9.21 8.14
Sep 29, 10 to Sep 29, 11 6.67 6.78 5.36
HDFC HIGH INTEREST FUND - STP - GROWTH OPTION NAV as at September 30, 2013 ` 23.6032
Performance of dividend option under the schemes for the investors would be net of distribution tax as applicable. Load is not taken into consideration for computation of performance. N.A.: Not Available@ shows the current value of ` 10,000/- invested at the beginning of a given periodWhere either NAV or Benchmark Index value is not available for the start/end date of a concerned period, the previous date where both NAV and Benchmark Index value are available, is considered for returns computation except for since inception returns
SCHEME PERFORMANCE SUMMARY (FUND MANAGER-WISE)
Intouchmutually42 October 2013
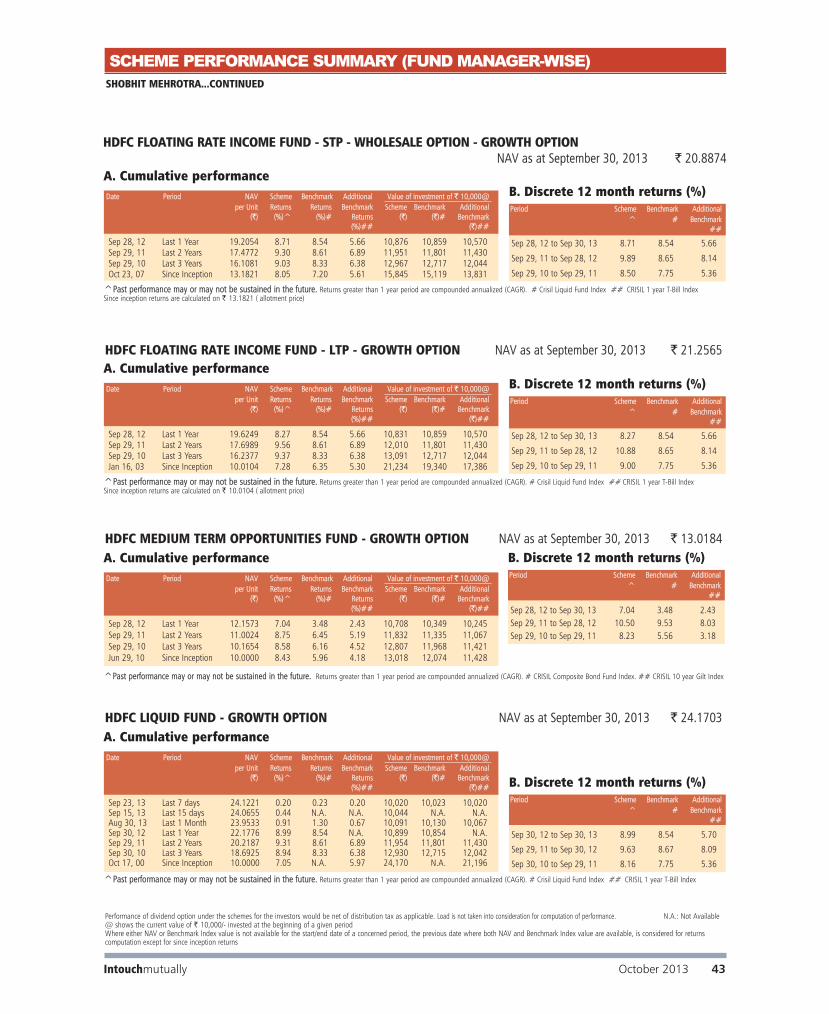
Date Period NAV Scheme Benchmark Additional Value of investment of ` 10,000@ per Unit Returns Returns Benchmark Scheme Benchmark Additional
(`) (%)^ (%)# Returns (`) (`)# Benchmark(%)## (`)##
^Past performance may or may not be sustained in the future. Returns greater than 1 year period are compounded annualized (CAGR). # Crisil Liquid Fund Index ## CRISIL 1 year T-Bill Index
A. Cumulative performance
Sep 23, 13 Last 7 days 24.1221 0.20 0.23 0.20 10,020 10,023 10,020Sep 15, 13 Last 15 days 24.0655 0.44 N.A. N.A. 10,044 N.A. N.A.Aug 30, 13 Last 1 Month 23.9533 0.91 1.30 0.67 10,091 10,130 10,067Sep 30, 12 Last 1 Year 22.1776 8.99 8.54 N.A. 10,899 10,854 N.A.Sep 29, 11 Last 2 Years 20.2187 9.31 8.61 6.89 11,954 11,801 11,430Sep 30, 10 Last 3 Years 18.6925 8.94 8.33 6.38 12,930 12,715 12,042Oct 17, 00 Since Inception 10.0000 7.05 N.A. 5.97 24,170 N.A. 21,196
Period Scheme Benchmark Additional ^ # Benchmark
##
B. Discrete 12 month returns (%)
Sep 30, 12 to Sep 30, 13 8.99 8.54 5.70
Sep 29, 11 to Sep 30, 12 9.63 8.67 8.09
Sep 30, 10 to Sep 29, 11 8.16 7.75 5.36
HDFC LIQUID FUND - GROWTH OPTION NAV as at September 30, 2013 ` 24.1703
Performance of dividend option under the schemes for the investors would be net of distribution tax as applicable. Load is not taken into consideration for computation of performance. N.A.: Not Available@ shows the current value of ` 10,000/- invested at the beginning of a given periodWhere either NAV or Benchmark Index value is not available for the start/end date of a concerned period, the previous date where both NAV and Benchmark Index value are available, is considered for returns computation except for since inception returns
SHOBHIT MEHROTRA...CONTINUED
Date Period NAV Scheme Benchmark Additional Value of investment of ` 10,000@ per Unit Returns Returns Benchmark Scheme Benchmark Additional
(`) (%)^ (%)# Returns (`) (`)# Benchmark(%)## (`)##
^Past performance may or may not be sustained in the future. Returns greater than 1 year period are compounded annualized (CAGR). # Crisil Liquid Fund Index ## CRISIL 1 year T-Bill IndexSince inception returns are calculated on ` 10.0104 ( allotment price)
A. Cumulative performance
Sep 28, 12 Last 1 Year 19.6249 8.27 8.54 5.66 10,831 10,859 10,570Sep 29, 11 Last 2 Years 17.6989 9.56 8.61 6.89 12,010 11,801 11,430Sep 29, 10 Last 3 Years 16.2377 9.37 8.33 6.38 13,091 12,717 12,044Jan 16, 03 Since Inception 10.0104 7.28 6.35 5.30 21,234 19,340 17,386
Period Scheme Benchmark Additional ^ # Benchmark
##
B. Discrete 12 month returns (%)
Sep 28, 12 to Sep 30, 13 8.27 8.54 5.66
Sep 29, 11 to Sep 28, 12 10.88 8.65 8.14
Sep 29, 10 to Sep 29, 11 9.00 7.75 5.36
HDFC FLOATING RATE INCOME FUND - LTP - GROWTH OPTION NAV as at September 30, 2013 ` 21.2565
Date Period NAV Scheme Benchmark Additional Value of investment of ` 10,000@ per Unit Returns Returns Benchmark Scheme Benchmark Additional
(`) (%)^ (%)# Returns (`) (`)# Benchmark(%)## (`)##
^Past performance may or may not be sustained in the future. Returns greater than 1 year period are compounded annualized (CAGR). # Crisil Liquid Fund Index ## CRISIL 1 year T-Bill IndexSince inception returns are calculated on ` 13.1821 ( allotment price)
A. Cumulative performance
Sep 28, 12 Last 1 Year 19.2054 8.71 8.54 5.66 10,876 10,859 10,570Sep 29, 11 Last 2 Years 17.4772 9.30 8.61 6.89 11,951 11,801 11,430Sep 29, 10 Last 3 Years 16.1081 9.03 8.33 6.38 12,967 12,717 12,044Oct 23, 07 Since Inception 13.1821 8.05 7.20 5.61 15,845 15,119 13,831
Period Scheme Benchmark Additional ^ # Benchmark
##
B. Discrete 12 month returns (%)
Sep 28, 12 to Sep 30, 13 8.71 8.54 5.66
Sep 29, 11 to Sep 28, 12 9.89 8.65 8.14
Sep 29, 10 to Sep 29, 11 8.50 7.75 5.36
HDFC FLOATING RATE INCOME FUND - STP - WHOLESALE OPTION - GROWTH OPTION NAV as at September 30, 2013 ` 20.8874
Date Period NAV Scheme Benchmark Additional Value of investment of ` 10,000@ per Unit Returns Returns Benchmark Scheme Benchmark Additional
(`) (%)^ (%)# Returns (`) (`)# Benchmark(%)## (`)##
^Past performance may or may not be sustained in the future. Returns greater than 1 year period are compounded annualized (CAGR). # CRISIL Composite Bond Fund Index. ## CRISIL 10 year Gilt Index
A. Cumulative performance
Sep 28, 12 Last 1 Year 12.1573 7.04 3.48 2.43 10,708 10,349 10,245Sep 29, 11 Last 2 Years 11.0024 8.75 6.45 5.19 11,832 11,335 11,067Sep 29, 10 Last 3 Years 10.1654 8.58 6.16 4.52 12,807 11,968 11,421Jun 29, 10 Since Inception 10.0000 8.43 5.96 4.18 13,018 12,074 11,428
HDFC MEDIUM TERM OPPORTUNITIES FUND - GROWTH OPTION NAV as at September 30, 2013 ` 13.0184
Period Scheme Benchmark Additional ^ # Benchmark
##
B. Discrete 12 month returns (%)
Sep 28, 12 to Sep 30, 13 7.04 3.48 2.43Sep 29, 11 to Sep 28, 12 10.50 9.53 8.03Sep 29, 10 to Sep 29, 11 8.23 5.56 3.18
SCHEME PERFORMANCE SUMMARY (FUND MANAGER-WISE)
Intouchmutually October 2013 43
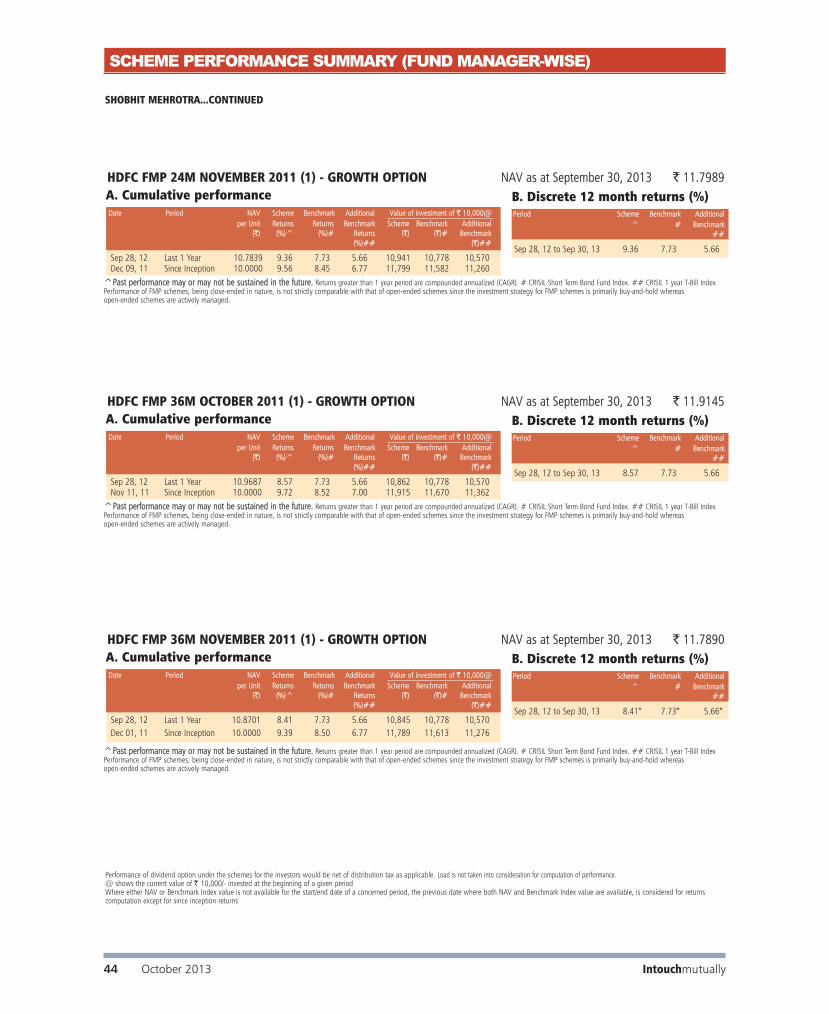
Performance of dividend option under the schemes for the investors would be net of distribution tax as applicable. Load is not taken into consideration for computation of performance.@ shows the current value of ` 10,000/- invested at the beginning of a given periodWhere either NAV or Benchmark Index value is not available for the start/end date of a concerned period, the previous date where both NAV and Benchmark Index value are available, is considered for returns computation except for since inception returns
SHOBHIT MEHROTRA...CONTINUED
Date Period NAV Scheme Benchmark Additional Value of investment of ` 10,000@ per Unit Returns Returns Benchmark Scheme Benchmark Additional
(`) (%)^ (%)# Returns (`) (`)# Benchmark(%)## (`)##
^Past performance may or may not be sustained in the future. Returns greater than 1 year period are compounded annualized (CAGR). # CRISIL Short Term Bond Fund Index. ## CRISIL 1 year T-Bill Index Performance of FMP schemes, being close-ended in nature, is not strictly comparable with that of open-ended schemes since the investment strategy for FMP schemes is primarily buy-and-hold whereas open-ended schemes are actively managed.
A. Cumulative performance
Sep 28, 12 Last 1 Year 10.7839 9.36 7.73 5.66 10,941 10,778 10,570Dec 09, 11 Since Inception 10.0000 9.56 8.45 6.77 11,799 11,582 11,260
HDFC FMP 24M NOVEMBER 2011 (1) - GROWTH OPTION NAV as at September 30, 2013 ` 11.7989
Period Scheme Benchmark Additional ^ # Benchmark
##
B. Discrete 12 month returns (%)
Sep 28, 12 to Sep 30, 13 9.36 7.73 5.66
Date Period NAV Scheme Benchmark Additional Value of investment of ` 10,000@ per Unit Returns Returns Benchmark Scheme Benchmark Additional
(`) (%)^ (%)# Returns (`) (`)# Benchmark(%)## (`)##
^Past performance may or may not be sustained in the future. Returns greater than 1 year period are compounded annualized (CAGR). # CRISIL Short Term Bond Fund Index. ## CRISIL 1 year T-Bill IndexPerformance of FMP schemes, being close-ended in nature, is not strictly comparable with that of open-ended schemes since the investment strategy for FMP schemes is primarily buy-and-hold whereas open-ended schemes are actively managed.
A. Cumulative performance
Sep 28, 12 Last 1 Year 10.8701 8.41 7.73 5.66 10,845 10,778 10,570Dec 01, 11 Since Inception 10.0000 9.39 8.50 6.77 11,789 11,613 11,276
HDFC FMP 36M NOVEMBER 2011 (1) - GROWTH OPTION NAV as at September 30, 2013 ` 11.7890
Period Scheme Benchmark Additional ^ # Benchmark
##
B. Discrete 12 month returns (%)
Sep 28, 12 to Sep 30, 13 8.41* 7.73* 5.66*
Date Period NAV Scheme Benchmark Additional Value of investment of ` 10,000@ per Unit Returns Returns Benchmark Scheme Benchmark Additional
(`) (%)^ (%)# Returns (`) (`)# Benchmark(%)## (`)##
^Past performance may or may not be sustained in the future. Returns greater than 1 year period are compounded annualized (CAGR). # CRISIL Short Term Bond Fund Index. ## CRISIL 1 year T-Bill IndexPerformance of FMP schemes, being close-ended in nature, is not strictly comparable with that of open-ended schemes since the investment strategy for FMP schemes is primarily buy-and-hold whereas open-ended schemes are actively managed.
A. Cumulative performance
Sep 28, 12 Last 1 Year 10.9687 8.57 7.73 5.66 10,862 10,778 10,570Nov 11, 11 Since Inception 10.0000 9.72 8.52 7.00 11,915 11,670 11,362
HDFC FMP 36M OCTOBER 2011 (1) - GROWTH OPTION NAV as at September 30, 2013 ` 11.9145
Period Scheme Benchmark Additional ^ # Benchmark
##
B. Discrete 12 month returns (%)
Sep 28, 12 to Sep 30, 13 8.57 7.73 5.66
SCHEME PERFORMANCE SUMMARY (FUND MANAGER-WISE)
Intouchmutually44 October 2013

Date Period NAV Scheme Benchmark Additional Value of investment of ` 10,000@ per Unit Returns Returns Benchmark Scheme Benchmark Additional
(`) (%)^ (%)# Returns (`) (`)# Benchmark(%)## (`)##
^Past performance may or may not be sustained in the future. Returns greater than 1 year period are compounded annualized (CAGR). # CRISIL Short Term Bond Fund Index. ## CRISIL 1 year T-Bill IndexPerformance of FMP schemes, being close-ended in nature, is not strictly comparable with that of open-ended schemes since the investment strategy for FMP schemes is primarily buy-and-hold whereas open-ended schemes are actively managed.
A. Cumulative performance
Sep 28, 12 Last 1 Year 10.6048 8.81 7.73 5.66 10,886 10,778 10,570
Feb 08, 12 Since Inception 10.0000 9.13 8.36 6.75 11,545 11,412 11,134
HDFC FMP 846D JANUARY 2012 (1) - GROWTH OPTION NAV as at September 30, 2013 ` 11.5449
Period Scheme Benchmark Additional ^ # Benchmark
##
B. Discrete 12 month returns (%)
Sep 28, 12 to Sep 30, 13 8.81 7.73 5.66
Date Period NAV Scheme Benchmark Additional Value of investment of ` 10,000@ per Unit Returns Returns Benchmark Scheme Benchmark Additional
(`) (%)^ (%)# Returns (`) (`)# Benchmark(%)## (`)##
^Past performance may or may not be sustained in the future. Returns greater than 1 year period are compounded annualized (CAGR). # CRISIL Composite Bond Fund Index. ## CRISIL 1 year T-Bill IndexPerformance of FMP schemes, being close-ended in nature, is not strictly comparable with that of open-ended schemes since the investment strategy for FMP schemes is primarily buy-and-hold whereas open-ended schemes are actively managed.
A. Cumulative performance
Sep 28, 12 Last 1 Year 10.5241 8.14 3.48 5.66 10,819 10,349 10,570
Feb 15, 12 Since Inception 10.0000 8.32 5.53 6.68 11,386 10,914 11,108
HDFC FMP 1203D JANUARY 2012 (1) - GROWTH OPTION NAV as at September 30, 2013 ` 11.3859
Period Scheme Benchmark Additional ^ # Benchmark
##
B. Discrete 12 month returns (%)
Sep 28, 12 to Sep 30, 13 8.14 3.48 5.66
Date Period NAV Scheme Benchmark Additional Value of investment of ` 10,000@ per Unit Returns Returns Benchmark Scheme Benchmark Additional
(`) (%)^ (%)# Returns (`) (`)# Benchmark(%)## (`)##
^Past performance may or may not be sustained in the future. Returns greater than 1 year period are compounded annualized (CAGR). # CRISIL Short Term Bond Fund Index. ## CRISIL 1 year T-Bill IndexPerformance of FMP schemes, being close-ended in nature, is not strictly comparable with that of open-ended schemes since the investment strategy for FMP schemes is primarily buy-and-hold whereas open-ended schemes are actively managed.
A. Cumulative performance
Sep 28, 12 Last 1 Year 10.5227 8.71 7.73 5.66 10,876 10,778 10,570
Mar 20, 12 Since Inception 10.0000 9.21 8.49 6.66 11,444 11,329 11,038
HDFC FMP 772D MARCH 2012 (1) - GROWTH OPTION NAV as at September 30, 2013 ` 11.4441
Period Scheme Benchmark Additional ^ # Benchmark
##
B. Discrete 12 month returns (%)
Sep 28, 12 to Sep 30, 13 8.71 7.73 5.66
SHOBHIT MEHROTRA...CONTINUED
Performance of dividend option under the schemes for the investors would be net of distribution tax as applicable. Load is not taken into consideration for computation of performance.@ shows the current value of ` 10,000/- invested at the beginning of a given periodWhere either NAV or Benchmark Index value is not available for the start/end date of a concerned period, the previous date where both NAV and Benchmark Index value are available, is considered for returns computation except for since inception returns
SCHEME PERFORMANCE SUMMARY (FUND MANAGER-WISE)
Intouchmutually October 2013 45

SCHEME PERFORMANCE SUMMARY (FUND MANAGER-WISE)
Date Period NAV Scheme Benchmark Additional Value of investment of ` 10,000@ per Unit Returns Returns Benchmark Scheme Benchmark Additional
(`) (%)^ (%)# Returns (`) (`)# Benchmark(%)## (`)##
^Past performance may or may not be sustained in the future. Returns greater than 1 year period are compounded annualized (CAGR). # CRISIL Short Term Bond Fund Index. ## CRISIL 1 year T-Bill IndexPerformance of FMP schemes, being close-ended in nature, is not strictly comparable with that of open-ended schemes since the investment strategy for FMP schemes is primarily buy-and-hold whereas open-ended schemes are actively managed.
A. Cumulative performance
Sep 28, 12 Last 1 Year 10.4101 8.54 7.73 5.66 10,859 10,778 10,570
May 09, 12 Since Inception 10.0000 9.19 8.32 6.35 11,304 11,179 10,897
HDFC FMP 24M APRIL 2012 (1) - GROWTH OPTION NAV as at September 30, 2013 ` 11.3043
Period Scheme Benchmark Additional ^ # Benchmark
##
B. Discrete 12 month returns (%)
Sep 28, 12 to Sep 30, 13 8.54 7.73 5.66
Date Period NAV Scheme Benchmark Additional Value of investment of ` 10,000@ per Unit Returns Returns Benchmark Scheme Benchmark Additional
(`) (%)^ (%)# Returns (`) (`)# Benchmark(%)## (`)##
^Past performance may or may not be sustained in the future. Returns greater than 1 year period are compounded annualized (CAGR). # CRISIL Composite Bond Fund Index. ## CRISIL 1 year T-Bill IndexPerformance of FMP schemes, being close-ended in nature, is not strictly comparable with that of open-ended schemes since the investment strategy for FMP schemes is primarily buy-and-hold whereas open-ended schemes are actively managed.
A. Cumulative performance
Sep 28, 12 Last 1 Year 10.3708 7.20 3.48 5.66 10,724 10,349 10,570
Jun 20, 12 Since Inception 10.0000 8.66 4.98 6.19 11,122 10,641 10,798
HDFC FMP 1120D JUNE 2012 (1) - GROWTH OPTION NAV as at September 30, 2013 ` 11.1217
Period Scheme Benchmark Additional ^ # Benchmark
##
B. Discrete 12 month returns (%)
Sep 28, 12 to Sep 30, 13 7.20 3.48 5.66
SHOBHIT MEHROTRA...CONTINUED
Date Period NAV Scheme Benchmark Additional Value of investment of ` 10,000@ per Unit Returns Returns Benchmark Scheme Benchmark Additional
(`) (%)^ (%)# Returns (`) (`)# Benchmark(%)## (`) ##
^Past performance may or may not be sustained in the future. Returns greater than 1 year period are compounded annualized (CAGR). # CRISIL MIP Blended Index ## CRISIL 1 year T-Bill IndexScheme performance may not strictly be comparable with that of its Additional Benchmark in view of hybrid nature of the scheme where a portion of scheme's investments are made in equity instruments. The Scheme is co-managed by Vinay Kulkarni (Equities) and Anil Bamboli (Debt).
A. Cumulative performance
Sep 28, 12 Last 1 Year 20.5099 4.04 3.20 5.66 10,406 10,322 10,570Sep 29, 11 Last 2 Years 18.5530 7.23 6.72 6.89 11,503 11,393 11,430Sep 29, 10 Last 3 Years 17.5924 6.64 5.20 6.38 12,131 11,645 12,044Sep 17, 04 Since Inception 10.0000 8.75 7.32 5.42 21,342 18,945 16,121
Period Scheme Benchmark Additional ^ # Benchmark
##
B. Discrete 12 month returns (%)
Sep 28, 12 to Sep 30, 13 4.04 3.20 5.66
Sep 29, 11 to Sep 28, 12 10.55 10.60 8.14
Sep 29, 10 to Sep 29, 11 5.46 2.10 5.36
HDFC MULTIPLE YIELD FUND - GROWTH OPTION NAV as at September 30, 2013 ` 21.3422
ANIL BAMBOLI
Date Period NAV Scheme Benchmark Additional Value of investment of ` 10,000@ per Unit Returns Returns Benchmark Scheme Benchmark Additional
(`) (%)^ (%)# Returns (`) (`)# Benchmark(%)## (`) ##
^Past performance may or may not be sustained in the future. Returns greater than 1 year period are compounded annualized (CAGR). # CRISIL Liquid Fund Index ## CNX Nifty IndexScheme performance is not strictly comparable with that of its Additional Benchmark since the scheme does not take directional call in equity markets but is limited to availing arbitrage opportunities, etc.
A. Cumulative performance
Sep 28, 12 Last 1 Year 14.038 7.81 8.54 0.56 10,786 10,859 10,056Sep 30, 11 Last 2 Years 12.918 8.25 8.61 7.70 11,721 11,798 11,602Sep 30, 10 Last 3 Years 11.970 8.14 8.33 -1.65 12,649 12,715 9,511Oct 23, 07 Since Inception 10.000 7.23 7.20 0.79 15,141 15,119 10,478
Period Scheme Benchmark Additional ^ # Benchmark
##
B. Discrete 12 month returns (%)
Sep 28, 12 to Sep 30, 13 7.81 8.54 0.56
Sep 30, 11 to Sep 28, 12 8.67 8.65 15.38
Sep 30, 10 to Sep 30, 11 7.92 7.77 -18.02
HDFC ARBITRAGE FUND - RETAIL PLAN - GROWTH OPTION NAV as at September 30, 2013 ` 15.141
Performance of dividend option under the schemes for the investors would be net of distribution tax as applicable. Load is not taken into consideration for computation of performance. N.A.: Not Available@ shows the current value of ` 10,000/- invested at the beginning of a given periodWhere either NAV or Benchmark Index value is not available for the start/end date of a concerned period, the previous date where both NAV and Benchmark Index value are available, is considered for returns computation except for since inception returns
Intouchmutually46 October 2013

Performance of dividend option under the schemes for the investors would be net of distribution tax as applicable. Load is not taken into consideration for computation of performance. N.A.: Not Available@ shows the current value of ` 10,000/- invested at the beginning of a given periodWhere either NAV or Benchmark Index value is not available for the start/end date of a concerned period, the previous date where both NAV and Benchmark Index value are available, is considered for returns computation except for since inception returns
Date Period NAV Scheme Benchmark Additional Value of investment of ` 10,000@ per Unit Returns Returns Benchmark Scheme Benchmark Additional
(`) (%)^ (%)# Returns (`) (`)# Benchmark(%)## (`) ##
^Past performance may or may not be sustained in the future. Returns greater than 1 year period are compounded annualized (CAGR). # CRISIL MIP Blended Index ## CRISIL 1 year T-Bill IndexScheme performance may not strictly be comparable with that of its Additional Benchmark in view of hybrid nature of the scheme where a portion of scheme's investments are made in equity instruments. The Scheme is co-managed by Chirag Setalvad (Equities) and Anil Bamboli (Debt).
A. Cumulative performance
Sep 28, 12 Last 1 Year 18.6330 3.33 3.20 5.66 10,335 10,322 10,570Sep 29, 11 Last 2 Years 17.0039 6.40 6.72 6.89 11,325 11,393 11,430Sep 29, 10 Last 3 Years 15.9145 6.55 5.20 6.38 12,101 11,645 12,044Aug 17, 05 Since Inception 10.0000 8.40 7.08 5.48 19,258 17,431 15,432
Period Scheme Benchmark Additional ^ # Benchmark
##
B. Discrete 12 month returns (%)
Sep 28, 12 to Sep 30, 13 3.33 3.20 5.66
Sep 29, 11 to Sep 28, 12 9.58 10.60 8.14
Sep 29, 10 to Sep 29, 11 6.85 2.10 5.36
HDFC MULTIPLE YIELD FUND - PLAN 2005 - GROWTH OPTION NAV as at September 30, 2013 ` 19.2577
Date Period NAV Scheme Benchmark Additional Value of investment of ` 10,000@ per Unit Returns Returns Benchmark Scheme Benchmark Additional
(`) (%)^ (%)# Returns (`) (`)# Benchmark(%)## (`) ##
^Past performance may or may not be sustained in the future. Returns greater than 1 year period are compounded annualized (CAGR). # CRISIL Composite Bond Fund Index ## CRISIL 10 year Gilt Index
A. Cumulative performance
Sep 28, 12 Last 1 Year 37.3927 5.50 3.48 2.43 10,553 10,349 10,245Sep 29, 11 Last 2 Years 34.0333 7.66 6.45 5.19 11,594 11,335 11,067Sep 29, 10 Last 3 Years 32.2367 6.96 6.16 4.52 12,241 11,968 11,421Apr 28, 97 Since Inception 10.0000 8.71 N.A. N.A. 39,460 N.A. N.A.
Period Scheme Benchmark Additional ^ # Benchmark
##
B. Discrete 12 month returns (%)
Sep 28, 12 to Sep 30, 13 5.50 3.48 2.43
Sep 29, 11 to Sep 28, 12 9.87 9.53 8.03
Sep 29, 10 to Sep 29, 11 5.57 5.56 3.18
HDFC HIGH INTEREST FUND - DYNAMIC PLAN - GROWTH OPTION NAV as at September 30, 2013 ` 39.4596
SCHEME PERFORMANCE SUMMARY (FUND MANAGER-WISE)
ANIL BAMBOLI...CONTINUED
Date Period NAV Scheme Benchmark Additional Value of investment of ` 10,000@ per Unit Returns Returns Benchmark Scheme Benchmark Additional
(`) (%)^ (%)# Returns (`) (`)# Benchmark(%)## (`)##
^Past performance may or may not be sustained in the future. Returns greater than 1 year period are compounded annualized (CAGR). # CRISIL Short Term Bond Fund Index ## CRISIL 1 year T-Bill Index
A. Cumulative performance
Sep 28, 12 Last 1 Year 21.7087 6.58 7.73 5.66 10,661 10,778 10,570Sep 29, 11 Last 2 Years 19.7665 8.19 8.47 6.89 11,709 11,770 11,430Sep 29, 10 Last 3 Years 18.4569 7.82 7.91 6.38 12,540 12,571 12,044Feb 28, 02 Since Inception 10.0000 7.51 N.A. 5.40 23,145 N.A. 18,405
Period Scheme Benchmark Additional ^ # Benchmark
##
B. Discrete 12 month returns (%)
Sep 28, 12 to Sep 30, 13 6.58 7.73 5.66
Sep 29, 11 to Sep 28, 12 9.83 9.21 8.14
Sep 29, 10 to Sep 29, 11 7.10 6.78 5.36
HDFC SHORT TERM PLAN - GROWTH OPTION NAV as at September 30, 2013 ` 23.1447
Intouchmutually October 2013 47

Performance of dividend option under the schemes for the investors would be net of distribution tax as applicable. Load is not taken into consideration for computation of performance. N.A.: Not Available@ shows the current value of ` 10,000/- invested at the beginning of a given periodWhere either NAV or Benchmark Index value is not available for the start/end date of a concerned period, the previous date where both NAV and Benchmark Index value are available, is considered for returns computation except for since inception returns
ANIL BAMBOLI...CONTINUED
Date Period NAV Scheme Benchmark Additional Value of investment of ` 10,000@ per Unit Returns Returns Benchmark Scheme Benchmark Additional
(`) (%)^ (%)# Returns (`) (`)# Benchmark(%)## (`) ##
^Past performance may or may not be sustained in the future. Returns greater than 1 year period are compounded annualized (CAGR). # I-Sec Li-Bex ## CRISIL 10 year Gilt Index
A. Cumulative performance
Sep 28, 12 Last 1 Year 22.1924 1.89 2.94 2.43 10,191 10,296 10,245Sep 29, 11 Last 2 Years 20.2573 5.64 6.56 5.19 11,164 11,358 11,067Sep 29, 10 Last 3 Years 19.3086 5.40 6.65 4.52 11,713 12,135 11,421Jul 25, 01 Since Inception 10.0000 6.92 N.A. N.A. 22,615 N.A. N.A.
Period Scheme Benchmark Additional ^ # Benchmark
##
B. Discrete 12 month returns (%)
Sep 28, 12 to Sep 30, 13 1.89 2.94 2.43
Sep 29, 11 to Sep 28, 12 9.55 10.32 8.03
Sep 29, 10 to Sep 29, 11 4.91 6.82 3.18
HDFC GILT FUND - LONG TERM PLAN - GROWTH OPTION NAV as at September 30, 2013 ` 22.6152
Date Period NAV Scheme Benchmark Additional Value of investment of ` 10,000@ per Unit Returns Returns Benchmark Scheme Benchmark Additional
(`) (%)^ (%)# Returns (`) (`)# Benchmark(%)## (`) ##
^Past performance may or may not be sustained in the future. Returns greater than 1 year period are compounded annualized (CAGR). # I-Sec Si-Bex ## CRISIL 1 year T-Bill Index
A. Cumulative performance
Sep 28, 12 Last 1 Year 18.6044 5.98 7.11 5.66 10,601 10,715 10,570Sep 29, 11 Last 2 Years 17.1438 7.24 8.33 6.89 11,504 11,740 11,430Sep 29, 10 Last 3 Years 16.1550 6.86 7.49 6.38 12,208 12,426 12,044Jul 25, 01 Since Inception 10.0000 5.73 N.A. 5.59 19,722 N.A. 19,414
Period Scheme Benchmark Additional ^ # Benchmark
##
B. Discrete 12 month returns (%)
Sep 28, 12 to Sep 30, 13 5.98 7.11 5.66
Sep 29, 11 to Sep 28, 12 8.52 9.57 8.14
Sep 29, 10 to Sep 29, 11 6.12 5.82 5.36
HDFC GILT FUND - SHORT TERM PLAN - GROWTH OPTION NAV as at September 30, 2013 ` 19.7224
Date Period NAV Scheme Benchmark Additional Value of investment of ` 10,000@ per Unit Returns Returns Benchmark Scheme Benchmark Additional
(`) (%)^ (%)# Returns (`) (`)# Benchmark(%)## (`) ##
^Past performance may or may not be sustained in the future. Returns greater than 1 year period are compounded annualized (CAGR). # Crisil Liquid Fund Index ## CRISIL 1 year T-Bill Index
A. Cumulative performance
Sep 28, 12 Last 1 Year 24.1754 7.81 8.54 5.66 10,785 10,859 10,570Sep 29, 11 Last 2 Years 22.1660 8.43 8.61 6.89 11,763 11,801 11,430Sep 29, 10 Last 3 Years 20.4990 8.33 8.33 6.38 12,720 12,717 12,044Nov 18, 99 Since Inception 10.0000 7.15 N.A. 6.12 26,074 N.A. 22,811
Period Scheme Benchmark Additional ^ # Benchmark
##
B. Discrete 12 month returns (%)
Sep 28, 12 to Sep 30, 13 7.81 8.54 5.66
Sep 29, 11 to Sep 28, 12 9.07 8.67 8.14
Sep 29, 10 to Sep 29, 11 8.13 7.75 5.36
HDFC CASH MANAGEMENT FUND - TREASURY ADVANTAGE PLAN - RETAIL OPTION - GROWTH OPTIONNAV as at September 30, 2013 ` 26.0738
SCHEME PERFORMANCE SUMMARY (FUND MANAGER-WISE)
Period Scheme Benchmark Additional ^ # Benchmark
##
B. Discrete 12 month returns (%)
Sep 28, 12 to Sep 30, 13 7.82 7.73 5.66Sep 29, 11 to Sep 28, 12 10.06 9.21 8.14Sep 29, 10 to Sep 29, 11 8.76 6.78 5.36
Date Period NAV Scheme Benchmark Additional Value of investment of ` 10,000@ per Unit Returns Returns Benchmark Scheme Benchmark Additional
(`) (%)^ (%)# Returns (`) (`)# Benchmark(%)## (`) ##
^Past performance may or may not be sustained in the future. Returns greater than 1 year period are compounded annualized (CAGR). # CRISIL Short-Term Bond Fund Index. ## CRISIL 1 year T-Bill Index
A. Cumulative performance
Sep 28, 12 Last 1 Year 12.1658 7.82 7.73 5.66 10,786 10,778 10,570Sep 29, 11 Last 2 Years 11.0538 8.93 8.47 6.89 11,871 11,770 11,430Sep 29, 10 Last 3 Years 10.1633 8.87 7.91 6.38 12,912 12,571 12,044Jun 25, 10 Since Inception 10.0000 8.67 7.59 6.05 13,122 12,700 12,115
HDFC SHORT TERM OPPORTUNITIES FUND - GROWTH OPTION NAV as at September 30, 2013 ` 13.1224
Intouchmutually48 October 2013

Performance of dividend option under the schemes for the investors would be net of distribution tax as applicable. Load is not taken into consideration for computation of performance. N.A.: Not Available@ shows the current value of ` 10,000/- invested at the beginning of a given periodWhere either NAV or Benchmark Index value is not available for the start/end date of a concerned period, the previous date where both NAV and Benchmark Index value are available, is considered for returns computation except for since inception returns
Period Scheme Benchmark^ #
B. Discrete 12 month returns (%)
Sep 28, 12 to Sep 30, 13 -6.13 -5.17Sep 30, 11 to Sep 28, 12 20.02 21.26Sep 30, 10 to Sep 30, 11 33.05 34.01
Date Period NAV Scheme Benchmark Value of investment of ` 10,000@ per Unit Returns Returns Scheme Benchmark
(`) (%)^ (%)# (`) (`)#
^Past performance may or may not be sustained in the future. Returns greater than 1 year period are compounded annualized (CAGR). # Domestic Price of Physical GoldSince inception returns are calculated on ` 1800.3288 (allotment price)
A. Cumulative performance
Sep 28, 12 Last 1 Year 3068.6080 -6.13 -5.17 9,383 9,481Sep 30, 11 Last 2 Years 2556.6449 6.12 7.21 11,262 11,497Sep 30, 10 Last 3 Years 1921.4959 14.42 15.69 14,985 15,490Aug 13, 10 Since Inception 1800.3288 16.16 16.43 15,994 16,107
HDFC GOLD EXCHANGE TRADED FUND NAV as at September 30, 2013 ` 2879.4155
Period Scheme Benchmark Additional ^ # Benchmark
##
B. Discrete 12 month returns (%)
Sep 28, 12 to Sep 30, 13 7.29 7.73 5.66Sep 29, 11 to Sep 28, 12 9.59 9.21 8.14
Date Period NAV Scheme Benchmark Additional Value of investment of ` 10,000@ per Unit Returns Returns Benchmark Scheme Benchmark Additional
(`) (%)^ (%)# Returns (`) (`)# Benchmark(%)## (`) ##
^Past performance may or may not be sustained in the future. Returns greater than 1 year period are compounded annualized (CAGR). # CRISIL Short-Term Bond Fund Index. ## CRISIL 1 year T-Bill IndexReturns of HDFC Debt Fund For Cancer Cure are computed based on NAV of Dividend Option and all dividends (after statutory levy) are assumed to be reinvested in the units of the scheme at the then prevailing NAV (ex-dividend NAV).
A. Cumulative performance
Sep 28, 12 Last 1 Year 10.0844 7.29 7.73 5.66 10,733 10,778 10,570Sep 29, 11 Last 2 Years 9.9990 8.43 8.47 6.89 11,763 11,770 11,430Mar 11, 11 Since Inception 10.0000 8.57 8.43 6.57 12,341 12,301 11,767
HDFC DEBT FUND FOR CANCER CURE - DIVIDEND OPTION NAV as at September 30, 2013 ` 10.0164
Period Scheme Benchmark^ #
B. Discrete 12 month returns (%)
Sep 28, 12 to Sep 30, 13 -6.28 -5.17
Date Period NAV Scheme Benchmark Value of investment of ` 10,000@ per Unit Returns Returns Scheme Benchmark
(`) (%)^ (%)# (`) (`)#
^Past performance may or may not be sustained in the future. Returns greater than 1 year period are compounded annualized (CAGR). # Domestic Price of Physical Gold
A. Cumulative performance
Sep 28, 12 Last 1 Year 11.3481 -6.28 -5.17 9,369 9,481Nov 01, 11 Since Inception 10.0000 3.25 4.98 10,632 10,976
HDFC GOLD FUND NAV as at September 30, 2013 ` 10.6322
SCHEME PERFORMANCE SUMMARY (FUND MANAGER-WISE)
Date Period NAV Scheme Benchmark Additional Value of investment of ` 10,000@ per Unit Returns Returns Benchmark Scheme Benchmark Additional
(`) (%)^$$ (%)# Returns (`) $$ (`)# Benchmark(%)## (`)##
^Past performance may or may not be sustained in the future. Returns greater than 1 year period are compounded annualized (CAGR). # Crisil Liquid Fund Index ## CRISIL 1 year T-Bill Index$$ All dividends declared prior to the splitting of the Scheme into Dividend & Growth Options are assumed to be reinvested in the units of the Scheme at the then prevailing NAV (ex-dividend NAV).
A. Cumulative performance
Sep 23, 13 Last 7 days 25.5358 0.20 0.23 0.20 10,020 10,023 10,020Sep 15, 13 Last 15 days 25.4741 0.44 N.A. N.A. 10,044 N.A. N.A.Aug 30, 13 Last 1 Month 25.3554 0.91 1.30 0.67 10,091 10,130 10,067Sep 30, 12 Last 1 Year 23.4924 8.92 8.54 N.A. 10,892 10,854 N.A.Sep 29, 11 Last 2 Years 21.3857 9.36 8.61 6.89 11,965 11,801 11,430Sep 30, 10 Last 3 Years 19.7493 9.01 8.33 6.38 12,956 12,715 12,042Nov 18, 99 Since Inception 10.0000 7.03 N.A. 6.12 25,674 N.A. 22,811
Period Scheme Benchmark Additional ^$$ # Benchmark
##
B. Discrete 12 month returns (%)
Sep 30, 12 to Sep 30, 13 8.92 8.54 5.70
Sep 29, 11 to Sep 30, 12 9.79 8.67 8.09
Sep 30, 10 to Sep 29, 11 8.29 7.75 5.36
HDFC CASH MANAGEMENT FUND - SAVINGS PLAN - GROWTH OPTION NAV as at September 30, 2013 ` 25.5870
ANIL BAMBOLI...CONTINUED
Intouchmutually October 2013 49

Date Period NAV Scheme Benchmark Additional Value of investment of ` 10,000@ per Unit Returns Returns Benchmark Scheme Benchmark Additional
(`) (%)^ (%)# Returns (`) (`)# Benchmark(%)## (`) ##
^Past performance may or may not be sustained in the future. Returns greater than 1 year period are compounded annualized (CAGR). # CRISIL Liquid Fund Index ## CRISIL 1 year T-Bill IndexScheme performance may not strictly be comparable with that of its Additional Benchmark as the Scheme can invest only in instruments having maturity upto the opening of the immediately following specified transaction period, which is at quarterly intervals.
A. Cumulative performance
Sep 28, 12 Last 1 Year 15.2864 9.13 8.54 5.66 10,918 10,859 10,570Sep 29, 11 Last 2 Years 13.9498 9.36 8.61 6.89 11,964 11,801 11,430Sep 29, 10 Last 3 Years 12.8309 9.14 8.33 6.38 13,008 12,717 12,044May 15, 07 Since Inception 10.0000 8.36 7.18 5.67 16,690 15,571 14,221
Period Scheme Benchmark Additional ^ # Benchmark
##
B. Discrete 12 month returns (%)
Sep 28, 12 to Sep 30, 13 9.13 8.54 5.66Sep 29, 11 to Sep 28, 12 9.58 8.67 8.14Sep 29, 10 to Sep 29, 11 8.72 7.75 5.36
HDFC QUARTERLY INTERVAL FUND - PLAN C - RETAIL PLAN - GROWTH OPTIONNAV as at September 30, 2013 ` 16.6902
ANIL BAMBOLI...CONTINUED
SCHEME PERFORMANCE SUMMARY (FUND MANAGER-WISE)
Returns of the Wholesale Plans under HDFC Quarterly Interval Fund – Plans A, B & C cannot be computed, as there have been periods since the launch of the Scheme / Plans when there were no unit holders underthe Plans. Performance of dividend option under the schemes for the investors would be net of distribution tax as applicable. Load is not taken into consideration for computation of performance. N.A.: Not Available@ shows the current value of ` 10,000/- invested at the beginning of a given periodWhere either NAV or Benchmark Index value is not available for the start/end date of a concerned period, the previous date where both NAV and Benchmark Index value are available, is considered for returns computation except for since inception returns
Date Period NAV Scheme Benchmark Additional Value of investment of ` 10,000@ per Unit Returns Returns Benchmark Scheme Benchmark Additional
(`) (%)^ (%)# Returns (`) (`)# Benchmark(%)## (`)##
^Past performance may or may not be sustained in the future. Returns greater than 1 year period are compounded annualized (CAGR). # Crisil Liquid Fund Index ## CRISIL 1 year T-Bill Index
A. Cumulative performance
Sep 23, 13 Last 7 days 19.5208 0.18 0.23 0.20 10,018 10,023 10,020Sep 15, 13 Last 15 days 19.4799 0.39 N.A. N.A. 10,039 N.A. N.A.Aug 30, 13 Last 1 Month 19.3958 0.82 1.30 0.67 10,082 10,130 10,067Sep 30, 12 Last 1 Year 18.0926 8.09 8.54 N.A. 10,809 10,854 N.A.Sep 29, 11 Last 2 Years 16.6937 8.21 8.61 6.89 11,714 11,801 11,430Sep 30, 10 Last 3 Years 15.6205 7.77 8.33 6.38 12,519 12,715 12,042Feb 06, 02 Since Inception 10.0000 5.92 N.A. 5.41 19,555 N.A. 18,477
Period Scheme Benchmark Additional ^ # Benchmark
##
B. Discrete 12 month returns (%)
Sep 30, 12 to Sep 30, 13 8.09 8.54 5.70
Sep 29, 11 to Sep 30, 12 8.33 8.67 8.09
Sep 30, 10 to Sep 29, 11 6.87 7.75 5.36
HDFC CASH MANAGEMENT FUND - CALL PLAN - GROWTH OPTION NAV as at September 30, 2013 ` 19.5554
Date Period NAV Scheme Benchmark Additional Value of investment of ` 10,000@ per Unit Returns Returns Benchmark Scheme Benchmark Additional
(`) (%)^ (%)# Returns (`) (`)# Benchmark(%)## (`) ##
^Past performance may or may not be sustained in the future. Returns greater than 1 year period are compounded annualized (CAGR). # Crisil Liquid Fund Index ## CRISIL 1 year T-Bill IndexScheme performance may not strictly be comparable with that of its Additional Benchmark as the Scheme can invest only in instruments having maturity upto the opening of the immediately following specified transaction period, which is at quarterly intervals.
A. Cumulative performance
Sep 28, 12 Last 1 Year 15.7150 8.87 8.54 5.66 10,892 10,859 10,570Sep 29, 11 Last 2 Years 14.2822 9.45 8.61 6.89 11,985 11,801 11,430Sep 29, 10 Last 3 Years 13.1161 9.26 8.33 6.38 13,051 12,717 12,044Mar 30, 07 Since Inception 10.0000 8.61 7.28 5.76 17,117 15,800 14,395
Period Scheme Benchmark Additional ^ # Benchmark
##
B. Discrete 12 month returns (%)
Sep 28, 12 to Sep 30, 13 8.87 8.54 5.66
Sep 29, 11 to Sep 28, 12 10.03 8.67 8.14
Sep 29, 10 to Sep 29, 11 8.89 7.75 5.36
HDFC QUARTERLY INTERVAL FUND - PLAN A - RETAIL PLAN - GROWTH OPTIONNAV as at September 30, 2013 ` 17.1173
Date Period NAV Scheme Benchmark Additional Value of investment of ` 10,000@ per Unit Returns Returns Benchmark Scheme Benchmark Additional
(`) (%)^ (%)# Returns (`) (`)# Benchmark(%)## (`) ##
^Past performance may or may not be sustained in the future. Returns greater than 1 year period are compounded annualized (CAGR). # CRISIL Liquid Fund Index ## CRISIL 1 year T-Bill IndexScheme performance may not strictly be comparable with that of its Additional Benchmark as the Scheme can invest only in instruments having maturity upto the opening of the immediately following specified transaction period, which is at quarterly intervals.
A. Cumulative performance
Sep 28, 12 Last 1 Year 15.3371 8.62 8.54 5.66 10,867 10,859 10,570Sep 29, 11 Last 2 Years 13.986 9.14 8.61 6.89 11,916 11,801 11,430Sep 29, 10 Last 3 Years 12.9023 8.89 8.33 6.38 12,917 12,717 12,044Apr 18, 07 Since Inception 10.0000 8.23 7.21 5.67 16,666 15,676 14,278
Period Scheme Benchmark Additional ^ # Benchmark
##
B. Discrete 12 month returns (%)
Sep 28, 12 to Sep 30, 13 8.62 8.54 5.66
Sep 29, 11 to Sep 28, 12 9.66 8.67 8.14
Sep 29, 10 to Sep 29, 11 8.40 7.75 5.36
HDFC QUARTERLY INTERVAL FUND - PLAN B - RETAIL PLAN - GROWTH OPTIONNAV as at September 30, 2013 ` 16.6662
Intouchmutually50 October 2013

Mar 22, 11 49.043 4.00 4.00Mar 23, 12 43.951 4.00 4.00Mar 21, 13 41.388 4.00 4.00
Direct PlanMar 21, 13 41.447 4.00 4.00
Record Cum Div Dividend Per unit (`) For Date NAV (`) Individuals & HUF Others
Record Cum Div Dividend Per unit (`) For Date NAV (`) Individuals & HUF Others
HDFC Equity Fund (Past 3 years)
Mar 10, 11 48.000 4.00 4.00Mar 07, 12 42.778 4.00 4.00Mar 07, 13 43.247 4.00 4.00
Direct PlanMar 07, 13 43.293 4.00 4.00
Record Cum Div Dividend Per unit (`) For Date NAV (`) Individuals & HUF Others
Record Cum Div Dividend Per unit (`) For Date NAV (`) Individuals & HUF Others
HDFC Top 200 Fund (Past 3 years)
Feb 24, 11 24.791 2.50 2.50Mar 07, 12 22.595 2.50 2.50Feb 21, 13 22.391 2.50 2.50
Record Cum Div Dividend Per unit (`) For Date NAV (`) Individuals & HUF Others
HDFC Capital Builder Fund (Past 3 years)
Feb 24, 11 31.392 3.00 3.00Feb 23, 12 30.629 3.00 3.00Feb 21, 13 29.331 3.00 3.00
Direct PlanFeb 21, 13 29.352 3.00 3.00
Record Cum Div Dividend Per unit (`) For Date NAV (`) Individuals & HUF Others
HDFC Growth Fund
Record Cum Div Dividend Per unit (`) For Date NAV (`) Individuals & HUF Others
Direct PlanFeb 21, 13 22.408 2.50 2.50
HDFC Balanced Fund (Past 3 years)
Record Cum Div Dividend Per unit (`) For Date NAV (`) Individuals & HUF Others
Mar 03, 11 20.785 2.25 2.25Mar 01, 12 20.353 2.25 2.25Feb 27, 13 19.322 1.25 1.25
Record Cum Div Dividend Per unit (`) For Date NAV (`) Individuals & HUF Others
Direct PlanFeb 27, 13 19.339 1.25 1.25
Mar 17, 11 31.286 3.50 3.50Mar 15, 12 29.516 3.50 3.50Feb 27, 13 27.526 3.00 3.00
Direct PlanFeb 27, 13 27.552 3.00 3.00
Record Cum Div Dividend Per unit (`) For Date NAV (`) Individuals & HUF Others
Record Cum Div Dividend Per unit (`) For Date NAV (`) Individuals & HUF Others
HDFC Prudence Fund (Past 3 years)
Record Cum Div Dividend Per unit (`) For Date NAV (`) Individuals & HUF Others
Dividend Option
Dividend Option
Dividend Option
Dividend Option
Feb 17, 11 25.562 2.00 2.00Feb 16, 12 19.647 2.00 2.00Feb 14, 13 17.613 2.00 2.00
Record Cum Div Dividend Per unit (`) For Date NAV (`) Individuals & HUF Others
HDFC Core & Satellite Fund ((Past 3 years))
Record Cum Div Dividend Per unit (`) For Date NAV (`) Individuals & HUF Others
Direct PlanFeb 14, 13 17.602 2.00 2.00
Dividend Option
Feb 10, 11 15.046 1.50 1.50Feb 09, 12 13.912 1.50 1.50Feb 07, 13 12.762 1.50 1.50
Record Cum Div Dividend Per unit (`) For Date NAV (`) Individuals & HUF Others
HDFC Premier Multi-Cap Fund ((Past 3 years))
Record Cum Div Dividend Per unit (`) For Date NAV (`) Individuals & HUF Others
Direct PlanFeb 07, 13 12.769 1.50 1.50
Dividend Option
Dividend Option
Dividend Option
(Past 3 years)
Feb 10, 11 37.085 4.00 4.00Feb 09, 12 34.468 4.00 4.00Feb 07, 13 34.167 4.00 4.00
Direct PlanFeb 07, 13 34.186 4.00 4.00
Record Cum Div Dividend Per unit (`) For Date NAV (`) Individuals & HUF Others
HDFC Long Term Advantage Fund (Past 3 years)
(An open-ended equity linked savings scheme with a lock-in period of 3 years)
Record Cum Div Dividend Per unit (`) For Date NAV (`) Individuals & HUF Others
Dividend Option
Mar 03, 11 62.686 6.00 6.00Mar 01, 12 56.738 6.00 6.00Mar 14, 13 53.602 6.00 6.00
Direct PlanMar 14, 13 53.675 6.00 6.00
Record Cum Div Dividend Per unit (`) For Date NAV (`) Individuals & HUF Others
Record Cum Div Dividend Per unit (`) For Date NAV (`) Individuals & HUF Others
HDFC TaxSaver (Past 3 years)
(An open-ended equity linked savings scheme with a lock-in period of 3 years)Dividend Option
Retail PlanMar 25, 13 11.036 0.677 0.677
Wholesale PlanMar 23, 13 10.487 0.207 0.207Jun 25, 13 10.471 0.191 0.191Sep 25, 13 10.466 0.187 0.187
Record Cum Div Dividend Per unit (`) For Date NAV (`) Individuals & HUF Others
Record Cum Div Dividend Per unit (`) For Date NAV (`) Individuals & HUF Others
Quarterly (Dividend Option) (Past 3 quarters)
HDFC Arbitrage Fund
Dividend History ^
Mar 22, 11 13.017 1.00 1.00Mar 23, 12 12.024 1.00 1.00Mar 14, 13 11.7670 1.00 1.00
Direct PlanMar 14, 13 11.7780 1.00 1.00
Record Cum Div Dividend Per unit (`) For Date NAV (`) Individuals & HUF Others
Record Cum Div Dividend Per unit (`) For Date NAV (`) Individuals & HUF Others
HDFC Focused Large-Cap Fund (Past 3 years)
(erstwhile HDFC Long Term Equity Fund) Dividend Option
Feb 23, 12 16.058 1.50 1.50Feb 27, 13 15.980 1.15 1.15
Direct PlanFeb 27, 13 15.994 1.15 1.15
Record Cum Div Dividend Per unit (`) For Date NAV (`) Individuals & HUF Others
Record Cum Div Dividend Per unit (`) For Date NAV (`) Individuals & HUF Others
HDFC Mid-Cap Opportunities Fund (Past 3 years)Dividend Option
^ Past performance may or may not be sustained in the future. All dividends are on face value of `10 per Unit. After payment of the dividend, the per Unit NAV fallsto the extent of the payout and statutory levy, if any.
October 2013 51Intouchmutually
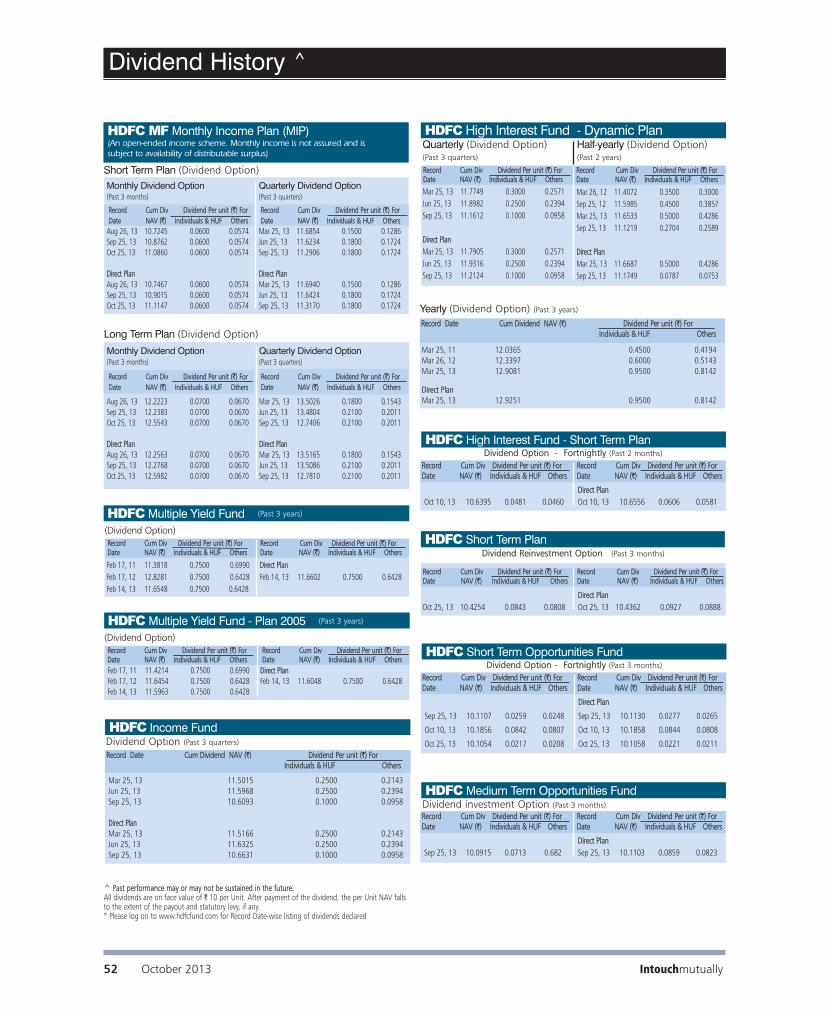
^ Past performance may or may not be sustained in the future. All dividends are on face value of ` 10 per Unit. After payment of the dividend, the per Unit NAV fallsto the extent of the payout and statutory levy, if any.* Please log on to www.hdfcfund.com for Record Date-wise listing of dividends declared
Monthly Dividend Option(Past 3 months)
Record Cum Div Dividend Per unit (`) For Date NAV (`) Individuals & HUF Others
Aug 26, 13 10.7245 0.0600 0.0574Sep 25, 13 10.8762 0.0600 0.0574Oct 25, 13 11.0860 0.0600 0.0574
Direct Plan Aug 26, 13 10.7467 0.0600 0.0574Sep 25, 13 10.9015 0.0600 0.0574Oct 25, 13 11.1147 0.0600 0.0574
Quarterly Dividend Option(Past 3 quarters)
Record Cum Div Dividend Per unit (`) For Date NAV (`) Individuals & HUF Others
Mar 25, 13 11.6854 0.1500 0.1286Jun 25, 13 11.6234 0.1800 0.1724Sep 25, 13 11.2906 0.1800 0.1724
Direct Plan Mar 25, 13 11.6940 0.1500 0.1286Jun 25, 13 11.6424 0.1800 0.1724Sep 25, 13 11.3170 0.1800 0.1724
HDFC High Interest Fund - Dynamic Plan
Mar 25, 13 11.7749 0.3000 0.2571Jun 25, 13 11.8982 0.2500 0.2394Sep 25, 13 11.1612 0.1000 0.0958
Direct PlanMar 25, 13 11.7905 0.3000 0.2571Jun 25, 13 11.9316 0.2500 0.2394Sep 25, 13 11.2124 0.1000 0.0958
Mar 26, 12 11.4072 0.3500 0.3000Sep 25, 12 11.5985 0.4500 0.3857Mar 25, 13 11.6533 0.5000 0.4286Sep 25, 13 11.1219 0.2704 0.2589
Direct PlanMar 25, 13 11.6687 0.5000 0.4286Sep 25, 13 11.1749 0.0787 0.0753
Record Cum Div Dividend Per unit (`) For Date NAV (`) Individuals & HUF Others
Record Cum Div Dividend Per unit (`) For Date NAV (`) Individuals & HUF Others
Quarterly (Dividend Option)(Past 3 quarters)
Half-yearly (Dividend Option)(Past 2 years)
Yearly (Dividend Option) (Past 3 years)
Mar 25, 13 11.5015 0.2500 0.2143Jun 25, 13 11.5968 0.2500 0.2394Sep 25, 13 10.6093 0.1000 0.0958
Direct PlanMar 25, 13 11.5166 0.2500 0.2143Jun 25, 13 11.6325 0.2500 0.2394Sep 25, 13 10.6631 0.1000 0.0958
Record Date Cum Dividend NAV (`) Dividend Per unit (`) For Individuals & HUF Others
Dividend Option (Past 3 quarters)
Mar 25, 11 12.0365 0.4500 0.4194Mar 26, 12 12.3397 0.6000 0.5143Mar 25, 13 12.9081 0.9500 0.8142
Direct PlanMar 25, 13 12.9251 0.9500 0.8142
Record Date Cum Dividend NAV (`) Dividend Per unit (`) For Individuals & HUF Others
HDFC Income Fund
Short Term Plan (Dividend Option)
Dividend History ^
HDFC MF Monthly Income Plan (MIP)(An open-ended income scheme. Monthly income is not assured and is subject to availability of distributable surplus)
Long Term Plan (Dividend Option)
Monthly Dividend Option(Past 3 months)
Record Cum Div Dividend Per unit (`) For Date NAV (`) Individuals & HUF Others
Aug 26, 13 12.2223 0.0700 0.0670Sep 25, 13 12.2383 0.0700 0.0670Oct 25, 13 12.5543 0.0700 0.0670
Direct PlanAug 26, 13 12.2563 0.0700 0.0670Sep 25, 13 12.2768 0.0700 0.0670Oct 25, 13 12.5982 0.0700 0.0670
Quarterly Dividend Option(Past 3 quarters)
Record Cum Div Dividend Per unit (`) For Date NAV (`) Individuals & HUF Others
Mar 25, 13 13.5026 0.1800 0.1543Jun 25, 13 13.4804 0.2100 0.2011Sep 25, 13 12.7406 0.2100 0.2011
Direct Plan Mar 25, 13 13.5165 0.1800 0.1543Jun 25, 13 13.5086 0.2100 0.2011Sep 25, 13 12.7810 0.2100 0.2011
HDFC Multiple Yield Fund (Past 3 years)
Feb 17, 11 11.3818 0.7500 0.6990Feb 17, 12 12.8281 0.7500 0.6428Feb 14, 13 11.6548 0.7500 0.6428
Direct PlanFeb 14, 13 11.6602 0.7500 0.6428
Record Cum Div Dividend Per unit (`) For Date NAV (`) Individuals & HUF Others
Record Cum Div Dividend Per unit (`) For Date NAV (`) Individuals & HUF Others
(Dividend Option)
HDFC Multiple Yield Fund - Plan 2005 (Past 3 years)
Feb 17, 11 11.4214 0.7500 0.6990Feb 17, 12 11.6454 0.7500 0.6428Feb 14, 13 11.5963 0.7500 0.6428
Direct PlanFeb 14, 13 11.6048 0.7500 0.6428
Record Cum Div Dividend Per unit (`) For Date NAV (`) Individuals & HUF Others
Record Cum Div Dividend Per unit (`) For Date NAV (`) Individuals & HUF Others
(Dividend Option)
HDFC Short Term PlanDividend Reinvestment Option (Past 3 months)
Record Cum Div Dividend Per unit (`) For Date NAV (`) Individuals & HUF Others
Record Cum Div Dividend Per unit (`) For Date NAV (`) Individuals & HUF Others
Oct 25, 13 10.4254 0.0843 0.0808Direct PlanOct 25, 13 10.4362 0.0927 0.0888
Sep 25, 13 10.1107 0.0259 0.0248
Oct 10, 13 10.1856 0.0842 0.0807
Oct 25, 13 10.1054 0.0217 0.0208
Direct Plan
Sep 25, 13 10.1130 0.0277 0.0265
Oct 10, 13 10.1858 0.0844 0.0808
Oct 25, 13 10.1058 0.0221 0.0211
Record Cum Div Dividend Per unit (`) For Date NAV (`) Individuals & HUF Others
Record Cum Div Dividend Per unit (`) For Date NAV (`) Individuals & HUF Others
Dividend Option - Fortnightly (Past 3 months)HDFC Short Term Opportunities Fund
Sep 25, 13 10.0915 0.0713 0.682Direct PlanSep 25, 13 10.1103 0.0859 0.0823
Record Cum Div Dividend Per unit (`) For Date NAV (`) Individuals & HUF Others
Record Cum Div Dividend Per unit (`) For Date NAV (`) Individuals & HUF Others
Dividend investment Option (Past 3 months)
HDFC Medium Term Opportunities Fund
52 October 2013 Intouchmutually
Oct 10, 13 10.6395 0.0481 0.0460Direct PlanOct 10, 13 10.6556 0.0606 0.0581
Record Cum Div Dividend Per unit (`) For Date NAV (`) Individuals & HUF Others
Record Cum Div Dividend Per unit (`) For Date NAV (`) Individuals & HUF Others
Dividend Option - Fortnightly (Past 2 months)HDFC High Interest Fund - Short Term Plan

^ Past performance may or may not be sustained in the future. All dividends are on face value of ` 10 per Unit. After payment of the dividend, the per Unit NAV fallsto the extent of the payout and statutory levy, if any.* Please log on to www.hdfcfund.com for Record Date-wise listing of dividends declared
Dividend History ^
Weekly Dividend Option (Past 1 month)
Record Cum Div Dividend Per unit (`) For Record Cum Div Dividend Per unit (`) For Date NAV (`) Individuals & HUF Others Date NAV (`) Individuals & HUF Others
Oct 07, 13 10.3311 0.0162 0.0155
Oct 14, 13 10.3306 0.0158 0.0152
Oct 21, 13 10.3299 0.0153 0.0146
Oct 28, 13 10.3297 0.0151 0.0145
Direct Plan
Oct 07, 13 10.3312 0.0163 0.0156
Oct 14, 13 10.3307 0.0159 0.0152
Oct 21, 13 10.3300 0.0154 0.0147
Oct 28, 13 10.3298 0.0152 0.0146
Aug 26, 13 10.3441 0.0632 0.0605Sep 30, 13 10.3679 0.0817 0.0783Oct 28, 13 10.3430 0.0623 0.0597
Direct PlanAug 26, 13 10.3445 0.0635 0.0608Sep 30, 13 10.3684 0.0821 0.0787Oct 28, 13 10.3433 0.0626 0.0599
Record Date Cum Dividend NAV (`) Dividend Per unit (`) For Individuals & HUF Others
Monthly Dividend Option (Past 3 months)
August 2013 Daily 10.1982 0.0691 0.0661September 2013 Daily 10.1982 0.0696 0.0666October 2013 Daily 10.1982 0.0679 0.0649
Direct PlanAugust 2013 Daily 10.1982 0.0696 0.0665September 2013 Daily 10.1982 0.0698 0.0669October 2013 Daily 10.1982 0.0683 0.0653
Month Record Date Ex-dividend NAV per Unit (`) Aggregate Dividend Per Unit (`) for the month Individuals & HUF Others
Daily Dividend Reinvestment Option* (Past 3 months)
HDFC Liquid Fund
Wholesale Option
Oct 07, 13 10.1604 0.0195 0.0187
Oct 14, 13 10.1599 0.0191 0.0183
Oct 21, 13 10.1534 0.0140 0.0134
Oct 28, 13 10.1532 0.0139 0.0133
Wholesale Option - Direct Plan
Oct 07, 13 10.1605 0.0195 0.0187
Oct 14, 13 10.1600 0.0192 0.0184
Oct 21, 13 10.1535 0.0141 0.0135
Oct 28, 13 10.1533 0.0139 0.0133
Record Cum Div Dividend Per unit (`) For Date NAV (`) Individuals & HUF Others
Record Cum Div Dividend Per unit (`) For Date NAV (`) Individuals & HUF Others
(Weekly Dividend Option) (Past 1 month)
Oct 07, 13 10.2087 0.0243 0.0233
Oct 14, 13 10.2066 0.0226 0.0217
Oct 21, 13 10.1976 0.0157 0.0150
Oct 28, 13 10.1966 0.0149 0.0143
Direct Plan
Oct 07, 13 10.2088 0.0244 0.0244
Oct 14, 13 10.2065 0.0226 0.0216
Oct 21, 13 10.1977 0.0157 0.0151
Oct 28, 13 10.1967 0.0150 0.0143
Record Cum Div Dividend Per unit (`) For Date NAV (`) Individuals & HUF Others
Record Cum Div Dividend Per unit (`) For Date NAV (`) Individuals & HUF Others
(Weekly Dividend Reinvestment Option) (Past 1 month)
HDFC Floating Rate Income Fund - Long Term Plan
Wholesale OptionAug 26, 13 10.2122 0.0531 0.0509Sep 30, 13 10.2823 0.1077 0.1031Oct 28, 13 10.2297 0.0667 0.0639
Wholesale Option - Direct PlanAug 26, 13 10.2127 0.0535 0.0512Sep 30, 13 10.2828 0.1081 0.1035Oct 28, 13 10.2301 0.0670 0.0642
Record Date Cum Dividend NAV (`) Dividend Per unit (`) For Individuals & HUF Others
Monthly Dividend Option (Past 3 months)
Wholesale OptionAugust 2013 Daily 10.0794 0.0266 0.0256September 2013 Daily 10.0809 0.0984 0.0943October 2013 Daily 10.0809 0.0716 0.0686
Wholesale Option - Direct PlanAugust 2013 Daily 10.0794 0.0271 0.0260September 2013 Daily 10.0809 0.0987 0.0946October 2013 Daily 10.0809 0.0719 0.0690
Month Record Date Ex-dividend NAV per Unit (`) Aggregate Dividend Per Unit (`) for the month Individuals & HUF Others
Daily Dividend Reinvestment Option* (Past 3 months)
HDFC Floating Rate Income Fund - Short Term Plan
HDFC Gilt Fund (Past 3 quarters)
Mar 25, 13 11.3687 0.2500 0.2143Jun 25, 13 11.4393 0.2000 0.1915Sep 25, 13 10.9625 0.1000 0.0958
Direct PlanMar 25, 13 11.3774 0.2500 0.2143Jun 25, 13 11.4565 0.2000 0.1915Sep 25, 13 10.9868 0.1000 0.0958
Mar 25, 13 11.1403 0.3000 0.2571Jun 25, 13 11.2653 0.2500 0.2394
Direct PlanMar 25, 13 11.1463 0.3000 0.2571Jun 25, 13 11.2777 0.2500 0.2394
Record Cum Div Dividend Per unit (`) For Date NAV (`) Individuals & HUF Others
Record Cum Div Dividend Per unit (`) For Date NAV (`) Individuals & HUF Others
Short Term Plan (Dividend Option) Long Term Plan (Dividend Option)
October 2013 53Intouchmutually

Disclaimer:
The information contained herein should not be altered in any way, transmitted to, copiedor distributed, in part or in whole, to any other person or to the media or reproduced in anyform, without prior written consent of HDFC Asset Management Company Limited (HDFC AMC)or the relevant owner of the intellectual property, as the case may be. All Intellectual propertyand intellectual property rights belong to the relevant owner of the intellectual property, and“Intouch Mutually” is a trademark of HDFC AMC.
Any information herein contained does not constitute and shall be deemed not to consti-tute an advice, an offer to sell/ purchase or as an invitation or solicitation to do so for any secu-rities of any entity, and further, HDFC AMC / its subsidiaries / affiliates / sponsors / trustee (HDFCAMC Group) or their officers, employees, personnel, directors may be associated in a commer-cial, professional or personal capacity or may have a commercial interest including as propri-etary traders in or with the securities and/ or companies or issues or matters as contained in thispublication and such commercial capacity or interest whether or not differing with or conflictingwith this publication, shall not make or render (HDFC AMC Group) liable in any manner what-soever & (HDFC AMC Group) or any of their officers, employees, personnel, directors shall notbe liable for any loss, damage, liability whatsoever for any direct or indirect loss arising from theuse or access of any information that may be displayed in this publication from time to time.Recipients of the information contained herein should exercise due care and caution and readthe Scheme Information Document(s) and Statement of Additional Information (including if nec-essary, obtaining the advice of tax / legal / accounting / financial / other professionals) prior totaking of any decision, acting or omitting to act, on the basis of the information contained here-in. The printing and mailing cost of this newsletter is charged to the respective schemes subjectto Securities & Exchange Board of India (Mutual Funds) Regulations, 1996.
The author’s opinions, beliefs and viewpoints published in Intouch Mutually (Page No. 4)are his own views and not of HDFC AMC Group, or any of their officers, employees, personneland directors. HDFC AMC Group or any of their officers, employees, personnel, directors do notaccept responsibility for the author’s content and make no representation as to the accuracy,completeness or reliability of the author’s content and hereby disclaim any liability with regardto the same.
MUTUAL FUND INVESTMENTS ARE SUBJECT TO MARKETRISKS, READ ALL SCHEME RELATED DOCUMENTS CAREFULLY.
HDFC Cash Management Fund - Treasury Advantage Plan
Retail OptionOct 07, 13 10.0651 0.0215 0.0206Oct 14, 13 10.0631 0.0200 0.0191Oct 21, 13 10.0526 0.0118 0.0113Oct 28, 13 10.0530 0.0121 0.0116
Retail Option - Direct PlanOct 07, 13 10.0664 0.0225 0.0216Oct 14, 13 10.0644 0.0209 0.0201Oct 21, 13 10.0539 0.0128 0.0123Oct 28, 13 10.0542 0.0130 0.0125
Wholesale OptionOct 07, 13 10.0662 0.0224 0.0214Oct 14, 13 10.0642 0.0208 0.0199
Oct 21, 13 10.0539 0.0128 0.0123Oct 28, 13 10.0541 0.0130 0.0124
Record Cum Div Dividend Per unit (`) For Date NAV (`) Individuals & HUF Others
Record Cum Div Dividend Per unit (`) For Date NAV (`) Individuals & HUF Others
Weekly Dividend Option (Past 1 month)
Monthly Dividend Option (Past 3 months)
Daily Dividend Reinvestment Option* (Past 3 months)
HDFC Cash Management Fund - Call Plan
Month Record Date Ex-dividend NAV per Unit (`) Aggregate Dividend Per Unit (`) for the month Individuals & HUF Others
Retail OptionAugust 2013 Daily 10.0245 0.0005 0.0005September 2013 Daily 10.0315 0.1024 0.0980October 2013 Daily 10.0315 0.0704 0.0674
Retail Option - Direct PlanAugust 2013 Daily 10.0314 0.0063 0.0060September 2013 Daily 10.0315 0.1063 0.1020October 2013 Daily 10.0315 0.0747 0.0717
August 2013 Daily 10.4266 0.0657 0.0631September 2013 Daily 10.4266 0.0642 0.0616October 2013 Daily 10.4266 0.0590 0.0569
Direct PlanAugust 2013 Daily 10.4266 0.0660 0.0634September 2013 Daily 10.4266 0.0646 0.0620October 2013 Daily 10.4266 0.0596 0.0571
Month Record Date Ex-dividend NAV per Unit (`) Aggregate Dividend Per Unit (`) for the month Individuals & HUF Others
Record Cum Div Dividend Per unit (`) For Date NAV (`) Individuals & HUF Others
Retail OptionAug 26, 13 10.0952 0.0442 0.0424Sep 30, 13 10.1897 0.1089 0.1043Oct 28, 13 10.1342 0.0656 0.0628
Retail Option - Direct PlanAug 26, 13 10.1067 0.0352 0.0337Sep 30, 13 10.1961 0.1138 0.1090Oct 28, 13 10.1394 0.0697 0.0667
Wholesale OptionAug 26, 13 10.1056 0.0433 0.0415Sep 30, 13 10.1956 0.1135 0.1087Oct 28, 13 10.1389 0.0693 0.0663
Daily Dividend Reinvestment Option* (Past 3 months)
HDFC Cash Management Fund - Savings PlanDaily Dividend Reinvestment Option* (Past 3 months)
Month Record Date Ex-dividend NAV per Unit (`) Aggregate Dividend Per Unit (`) for the month Individuals & HUF Others
Weekly Dividend Option (Past 1 month)
Oct 04, 13 10.6463 0.0169 0.0162Oct 11, 13 10.6457 0.0164 0.0157Oct 18, 13 10.6450 0.0158 0.0151Oct 25, 13 10.6446 0.0155 0.0149
Direct PlanOct 04, 13 10.6465 0.0170 0.0163Oct 11, 13 10.6458 0.0165 0.0157Oct 18, 13 10.6451 0.0159 0.0152Oct 25, 13 10.6448 0.0156 0.0150
Record Cum Div Dividend Per unit (`) For Date NAV (`) Individuals & HUF Others
Record Cum Div Dividend Per unit (`) For Date NAV (`) Individuals & HUF Others
August 2013 Daily 10.6364 0.0740 0.0709September 2013 Daily 10.6364 0.0732 0.0703October 2013 Daily 10.6364 0.0704 0.0675
Direct PlanAugust 2013 Daily 10.6364 0.0743 0.0712September 2013 Daily 10.6364 0.0736 0.0706October 2013 Daily 10.6364 0.0708 0.0679
Dividend History ^
^ Past performance may or may not be sustained in the future. All dividends are on face value of ` 10 per Unit. After payment of the dividend, the per Unit NAV fallsto the extent of the payout and statutory levy, if any.* Please log on to www.hdfcfund.com for Record Date-wise listing of dividends declared
54 October 2013 Intouchmutually

October 2013 55Intouchmutually
INVESTOR SERVICE CENTRES (ISCs)ANDHRA PRADESHHDFC AMC Ltd., 6-3-883/7, IInd Floor, Saphire Square, Somajiguda, Hyderabad - 500 282.Tel.: (040) 23417401 / 02 / 03 / 04 / 05, Fax: (040) 23417407. HDFC AMC Ltd., 18-2-299/B, 1st Floor, Leela MahalCircle, Tirumala Bypass Road, Tirupati - 517 507. Tel: (0877) 2222 871 / 872 / 873 / 874, Fax: (0877) 2222689. HDFC AMC Ltd., 2nd Floor, Centurion Bank Complex,Near Benz Circle, M. G. Road, Vijayawada - 520 010. Tel. No: (0866) 3988029. HDFC AMC Ltd., First Floor, Saigopal Arcade, WaltairMain Road, Siripuram, Visakhapatnam - 530 003. Tel: (0891) 2769636, 6450306 / 9685 / 7584, Fax. No.: (0891) 2738728. HDFC AMC Ltd., 2-5-83/84, 1st Floor, MitralaxmiNarayana Arcade, Nakkala Gutta, Hanmakonda,Warangal - 506 002. Tel: (0870) 2566 005 / 006/ 007/ 008/ 009, Fax: (0870) 2566010. ASSAMHDFC AMC Ltd., Premises- 1C, 1st Floor, GanpatiEnclave, G.S.Road, Guwahati - 781 007. Tel: (0361) 2464759/60. Fax: (0361) 2464758. BIHARHDFC AMC Ltd., Ishwari Complex, 1st Floor, Dr. Rajendra Prasad Road, Bhagalpur - 812 002. Tel: (0641) 2300 390, Fax: (0641) 2300391. HDFC AMC Ltd., Ravi Market, 1st Floor, JawaharlalRoad, Muzaffarpur – 842001.Tel: (0621) 2245036/37, Fax: (0621) 2245037. HDFC AMC Ltd., C/o Hera Enclave (Above TATADocomo Office), 1st Floor, New Dak Bunglow Road,Patna - 800 001. Tel: (0612) 6457554/6457557/3201439, Telefax: (0612) 2200747. CHHATTISGARHHDFC AMC Ltd., Shop No 1, Ground Floor, Old Sada Office Block, Nehru Nagar East, Bhilai - 490020. Tel: (0788) 4092948, 4092846, Fax: (0788) 4092901. HDFC AMC Ltd., 2nd Floor, Rama Trade Centre,Opposite Rajiv Plaza, Near Bus stand, Bilaspur – 495 001. Tel: (07752) 400305/ 06. Fax: (07752) 400307. HDFC AMC Ltd., Ground Floor, Chawla Complex,Devendra Nagar, Sai Nagar Road, Near VanijyaBhawan, Near Indhira Gandhi Square, Raipur - 492 001. Tel: (0771) 4020 167 / 168. DELHIHDFC AMC Ltd., Ground Floor - 2 & 3 and First Floor,Prakashdeep Building, 7, Tolstoy Marg, ConnaughtPlace, New Delhi - 110 001. Tel: (011) 6632 4000,Fax: (011) 23351317 /18. HDFC AMC Ltd. Unit Nos. 402, 404, 406, 4th floor, Mahatta Tower, 54 B-1 Block, Community Center , Janakpuri, New Delhi – 110 058. Fax: (011) 41082131 GOAHDFC AMC Ltd., Ground Floor, G3 & G4, Jivottam,Minguel Miranda Road, Off. Abade Faria Road,Margao - 403 601. Salcete. Tel: (0832) 2737410 / 11.Fax: (0832) 2736477. HDFC AMC Ltd., S1, Second Floor, Above Axis Bank,Edcon Centre, Angod, Mapusa - 403 507, Bardez, Goa. Tel: (0832) 2253 460 / 461, Fax: (0832) 2253465. HDFC AMC Ltd., A-3, First Floor, Krishna Building, Opp. Education Department, Behind SusheelaBuilding, G. P. Road, Panaji - 403 001. Tel: 0832 - 2425609, 2425610, Fax: 0832 - 2425614. HDFC AMC Ltd., 6, Ground Floor, Pereira Chambers,Padre Jose Vaz Road, Vasco - 403 802, Mormugao. Tel: (0832) 2513 402 / 406, Fax: (0832) 2513448. GUJARATHDFC AMC Ltd., 2nd Floor, Megha House, BesidesGRUH House, Mithakhali Six Roads, Ahmedabad - 380 009. Tel.: 079 – 40220099/00, Fax: 079 - 40050506. HDFC AMC Ltd., Maruti Sharanam, No.117, 1st Floor, Anand-Vidhyanagar Road, Opposite Nandbhumi PartyPlot, Anand - 388 001. Tel: (02692) - 398200, Fax: (02692) - 398222. HDFC AMC Ltd., 3rd Floor, Shreemangalam Complex,Above IDBI Bank, Patel Society Road, Ward No. 1,Kasak Circle, Bharuch - 392 012. Tel: (0264) 2227205, Fax: (0264) 2227206. HDFC AMC Ltd., 2nd Floor, Gangotri Plaza, Opposite
Daxinamurty School, Waghawadi Road, Bhavnagar - 364 001. Tel: (0278) - 3988029, Fax: (0278) - 3984039. HDFC AMC Ltd., 1st Floor, B Wing, Katira Complex,RTO Circle, Bhuj - 370 001. Tel: (02832) 223 223, Fax: (02832) 251. 946 HDFC AMC Ltd., 2nd Floor, Keshav Complex, P N Marg, Opposite Dhanvantry, Jamnagar - 361 001.Tel: (0288) - 3988029, Fax: (0288) - 3982426. HDFC AMC Ltd., 1st Floor, Nos. 104 – 105, MaryGold-2 Complex, Opp. Bahhaudin College,College Road, Junagadh - 362001. Tel: (0285) 2670622/23, Fax: (0285) 2670624. HDFC AMC Ltd., 2nd Floor, Rajendra Estate, State Highway, Mehsana - 384 002. Tel: (02762) 302000. Fax: (02762) 302020. HDFC AMC Ltd., 1st Floor, Nandini Complex, Above HDFC Bank, Opp. Daboo Hospital, Station Road, Navsari- 396445. Tel: (02637) 252681/82/83, Fax: (02637) 252684. HDFC AMC Ltd., 2nd Floor, Shiv Darshan, Dr. Radha Krishnan Road, 5, Jagnath, Plot Corner,Rajkot - 360 001. Tel: 0281- 6624881 / 82, Fax: 0281 - 6624883. HDFC AMC Ltd., U1 - U3, Jolly Plaza, Opp. AthwaGate Police Station, Athwa Gate, Surat - 395 001. Tel: 0261 – 2460082 / 83, Fax: 0261 - 2460091. HDFC AMC Ltd., Upper Ground Floor, Gokulesh, R. C. Dutt Road, Vadodara - 390 007. Tel: 0265 - 6621110 / 20, Fax: 0265 - 6621150. HDFC AMC Ltd., 5-B, 2nd Floor, Sapphire Building,Daulatnagar, Chala-Vapi Road, Vapi - 396 191. Tel: (0260) 3983900, Fax: (0260) 3983908. HARYANAHDFC AMC Ltd., 1st Floor, Sudarshan Tower, CrossRoad # 1, Nicholson Road, Ambala Cantt -133 001. Tel: (0171) 2631995/6, Fax: (0171) 2631994. HDFC AMC Ltd., TA - 12A, 15-18, Third Floor, Crown Plaza, Sector 15A, Mathura Road, Faridabad - 121 001. Tel: (0124) 2221 338 / 339 /341 / 342 / 343, Fax: (0129) 2221340. HDFC AMC Ltd., Premises 105, 106 & 107, 1st Floor, Vipul Agora Building, MG Road, Gurgaon - 122 002. Tel: (0124) 2560 450/ 51, Fax: (0124) 2560455. HDFC AMC Ltd., 1175 B Royal 1, 1st Floor, AdjoiningGurudawara, G.T Road, Panipat - 132 103. Tel: (0180) 3985400/ 01, Fax: (0180) 3985403. HIMACHAL PRADESHHDFC AMC Ltd., 2nd Floor, Opposite Town Hall, 30,The Mall, Shimla – 171 001. Tel: (0177) 2816861. JAMMU & KASHMIRHDFC AMC Ltd., Hall No-102 A/2, South Block, Bahu Plaza, Gandhi Nagar, Jammu - 180 012. Tel: (0191)-2477911/12/13 / (0191) 2474297/98/99. JHARKHANDHDFC AMC Ltd., Vardhan Complex, 1st Floor, Opp. Woodland Showroom, Bank More, Dhanbad - 826 001. Tel: (0326) 3205352, 2300552,Fax: (0326) 2301756. HDFC AMC Ltd., Gayatri Enclave, 2nd Floor, "K Road", Bistupur, Jamshedpur - 831 001. Tel: (0657) 2249691, Telefax: (0657) 2249730. HDFC AMC Ltd., Pradhan Towers, 1st Floor, 5, Main Road, Ranchi - 834 001. Tel: (0651) 6003358, 3242077. Fax: (0651) 3988029. KARNATAKAHDFC AMC Ltd., Nitesh Broadway, No. 9/3, 1-A, Ground Floor, M. G. Road, Opposite Trinity Metro Station, Bangalore – 560001. Tel: 080-66205300, Fax: 080-41125255. HDFC AMC Ltd., # 493, 1st Floor, 4th Cross, 2nd Main, Sampige Road, Malleshwaram, Bangalore - 560 003. HDFC AMC Ltd., Garla Garnet No. 119/A/36, 9th Main, 4th Block, Jayanagar, Bangalore – 560011. Tel No: (080) 41460260/61/62, Fax No: (080) 41460263. HDFC AMC Ltd., # 145, 1st Floor, 60 ft Road, 5th Block, Koramangala, Bangalore - 560 034. HDFC AMC Ltd., Premises No. 4830 / B, First Floor, Dr. Ambedkar Road, Opp. Civil Medical College, Belgaum - 590 002. Tel: (0831) 4206 915 / 916 / 918, Fax: (0831) 4206919. HDFC AMC Ltd., Office No. 39 (Old No - 41), GroundFloor, Behind Maremma Temple, Opposite HDFC Bank,Kappagal Road, Bellary – 583103. Tel: 08392-256577. Fax: 08392-256575.
HDFC AMC Ltd., 190/3, 1st Floor, S.V.C. Plaza, Opposite Mothi Talkies, Gandhi Circle, Davangere - 577 002. Tel: (08192) 250 240 / 241 /242, Fax: (08192) 250243. HDFC AMC Ltd., No. 1, First Floor, Revankar Comforts,Vivekanand Road, Court Circle, Hubli - 580 029. Tel: (0836) 4252 294 / 95. Fax: (0836) 4252 290. HDFC AMC Ltd., UG-II, 6 & 7, Upper Ground Floor, Maximus Commercial Complex, Light House Hill Road, Opp. KMC, Mangalore - 575 001. Tel. 0824 – 6620667/668, Fax: 0824 – 6620666. HDFC AMC Ltd., No. 2918, CH 51 / 1 B, 1st Floor, Patel Mansion, Kantharaj Urs Road, Saraswathipuram, Mysore - 570 009. Tel: (0821) 4000 530, Fax: (0821) 4000 535. KERALAHDFC AMC Ltd., 3rd Floor, City Mall, Opposite YMCA, Kannur Road, Calicut - 673 001. Tel: (0495) - 4099222 / 333, 3982310, Fax: (0495) - 3982330. HDFC AMC Ltd., Ground Floor, Cinema cumCommercial Complex, Behind Ravipuram Bus Stop, M. G. Road, Kochi - 682 016. Tel: 0484 - 2357707 /8, 3243058 / 59, Fax: 0484 - 2358462. HDFC AMC Ltd., 14/868, Ground Floor, Sri KrishnaComplex, Coimbatore Road, Palghat - 678 001. Tel: (0491) 2548300/302, 6452188, Fax: (0491) 2548303. HDFC AMC Ltd., 2nd Floor, E-Town Shopping, College Road, East Fort, Thrissur - 680 005. Tel: (0487) 2441976. Telefax: (0487) 2422925. HDFC AMC Ltd., 1st Floor, Kaniamparambil Arcade, G S Junction, Shastri Road, Kottayam - 686 001. Tel: (0481) 3018392/93. Fax: (0481) 3018397. HDFC AMC Ltd., Ground Floor, Bhadra Tower, Cotton Hill Road, Vazhuthacaud, Thycaud P.O.,Trivandrum – 695 014. Tel: (0471) 3983 730 / 731 /732 Fax: (0471) 3983738. MADHYA PRADESHHDFC AMC Ltd., 1st Floor, Ranjeet Tower, 8, Zone-II, M. P. Nagar, Bhopal - 462 011. Tel: 0755 - 4285385, 4246995, Fax: 0755 - 4058890. HDFC AMC Ltd., M1, M2 & M3, Mezzanine Floor, Sterling Arcade,15 / 3, Race Course Road, Indore - 452 001. Tel: 0731 - 4022241 / 42. Fax: 0731 - 4245436. HDFC AMC Ltd., First Floor, Muthye UdyogBhawan,1039, Wright Town, Opp. TelephoneExchange, Jabalpur - 482 002. Tel: (0761) - 4049800,3988029 Fax: (0761) - 4068814. HDFC AMC Ltd., First Floor, Alakhnanda Towers, Shrimant Madhav Rao Scindia Marg, City Centre, Gwalior - 474 001. Tel: (0751) - 4066060, 3988029 Fax: (0751) – 3982803. MAHARASHTRAHDFC AMC Ltd., 1st Floor, Amar Arcade - 2, Opp. Rajapeth Police Station, Raja Peth, Amravati - 444 601. Tel: (0721) 2562 112 / 113 Fax: (0721) 2564115. HDFC AMC Ltd., 2nd Floor, Renuka CommercialComplex, Samarth Nagar, Nirala Bazar, NageshwarWadi Road, Aurangabad - 431 001. Tel: (0240) 3988029, Fax: (0240) 3982068. HDFC AMC Ltd., 138, Ground Floor, Kavya RatnavaliChowk, Omkareshwar Road, Jalgaon – 425 002. Tel: (0257) 3982100/ 01. Fax: (0257) 3982114. HDFC AMC Ltd., Royal Prestige, C1/C9, 1st Floor, E - Ward, Sykes Extension, Rajarampuri Road,Kolhapur - 416 008. Tel: (0231) - 3988029, Fax: (0231) - 3982060. HDFC AMC Ltd.**, Premises Nos.. F1, 2, 3 & 4, 1st Floor, “Center Square”, S.V. Road, Andheri (W),Mumbai – 400 058. Tel: (022) 26708239 / 26285389.Fax: (022) 26241131. HDFC AMC Ltd.** Shop # 7, Abhilasha Building,Punjabi Lane, Borivali (W), Mumbai - 400 092. Tel: (022) 28952702/ 28901497, Fax: (022) 28949392. HDFC AMC Ltd.,* HUL House, 2nd floor, H.T. ParekhMarg, 165-166 Backbay Reclamation, Churchgate,Mumbai – 400 020 Tel: (022) 66316333, Fax: (022) 66580200. HDFC AMC Ltd., Mistry Bhavan, 2nd Floor, 122, Backbay Reclamation, Dinsha Vachha Road,Churchgate, Mumbai - 400 020. Tel: (022) 60006767, Fax: (022) 66580211.
(Continued on next page)

Intouchmutually, October 2013, RNI Regd. No. MAHENG/2003/10804
Registered Office: HUL House, 2nd floor, H.T. Parekh Marg, 165-166 Backbay Reclamation, Churchgate, Mumbai – 400 020.
Published and printed by Shailendra Sharad Kalelkar for and on behalf of Business Standard Limited from H4, Paragon Condominium, Opposite Century Mills, P B Marg, Worli, Mumbai 400013, and printed at Print House India Private Limited, 6, Datta Mandir Road, Bhandup (W), Mumbai 400 078. Editor: Rajiv Shirali.
HDFC AMC Ltd.**, Shop No. 1 & 2, Ground Floor, Atlantic Tower, R B Mehta Road, Near Railway Station,Ghatkopar (East), Mumbai - 400 077. Tel: (022) 6525 3409/08/06/21, Fax: (022) 2511 6805. HDFC AMC Ltd.**, Unit No. 101, 1st Floor, Landmark Building, 136 Hill Road,Opp. St. PetersChurch, Bandra (West), Mumbai - 400 050. Tel: (022) 2643 4760 / 762 / 763 / 764, Fax: (022) 2643 4768. HDFC AMC Ltd.**, Shop no. 1 & 2, Ground floor,Gurangi Chambers, Opp. Damani Chambers, Near Teen Haath Naka, LBS Marg, Thane (West) - 400 602. Tel: (022) 2538 5659, 2539 1125, 2538 6848, 6502 0205, 6536 5246,6536 5245, 6414 2389, Fax: (022) 25301125. HDFC AMC Ltd., 106-110, 2nd Floor, Shriram ShyamTowers, Near NIT Building, Kingsway, Sadar, Nagpur - 440 001. Tel: (0712) 663 0301/02/04, Fax: (0712) 663 0206. HDFC AMC Ltd. G- 1 & G-2, "Suyojit Heights", Opp.Rajiv Gandhi Bhavan, Sharanpur Road, Nashik - 422 002. Tel: (0253) 6611831 / 32. Fax: (0253) 6611836. HDFC AMC Ltd., 6, Chetana Apartment, 2423, East Street, Pune Camp, Pune - 411 001. Tel.: (020) 41223301/02, Fax: (020) 41223310. HDFC AMC Ltd., Ground Floor, City Mall, University Circle, Ganeshkhind Road, Pune - 411 007.Tel: (020) 66073301, Fax: (020) 66073310. HDFC AMC Ltd.**, BSE 1, Tech Building, 109, A Wing, 1st Floor, Opposite Vashi Railway Station, Sector 30, Vashi - 400 703. Tel: (022) 39880299. HDFC AMC Ltd.**, 1st Floor, Anant Kuti (BibikarBldg.), Manpada Road, Opp. Muncipal CorporationBldg., Dombivli (East), Mumbai - 421 201. Tel: (0251) 2860 648 / 649 / 645 / 656, Fax: (0251) 2863953. ORISSAHDFC AMC Ltd., Sri Jagannath Complex, 1st Floor, Opposite Hari - Omm Bhawan, Barbil - 758 035. Tel: 09238106515 / 09238106525, Fax: (06767) 275565. HDFC AMC Ltd., Vinayak, 2nd Floor, 96, Janpath, Bhubaneswar - 751 001. Tel: (0674) 6450502 / 1502, Fax: 0674 - 2531483. HDFC AMC Ltd., 1st Floor, Plot No. 2690 (P),Bajrakabati Road, Ranihat, Cuttack – 753 001. Tel: (0671) 2323724/ 725, Fax: (0671) 2324741. HDFC AMC Ltd., Praful Tower, 1st Floor, PanposhRoad, Rourkela - 769 004. Tel: (0661) 3988029,3982060/70, Fax: (0661) 3982068. HDFC AMC Ltd., Kadambari Complex, 1st Floor, Unit - 4, Nayapara, Golbazar, Sambalpur - 768 001. Tel: (0663) 2400 323 / 339, Fax: (0663) 2400324. PONDICHERRYHDFC AMC Ltd., No.17, I Floor, Sree VelayudhamComplex, Near Indhira Gandhi Square, Natesan Nagar, Pondicherry - 605 005. Tel: (0413) 3043 293 / 500 /600. Fax: (0413) 2206776. PUNJABHDFC AMC Ltd., SCO-28, 1st Floor, Taneja Towers, District Shopping Complex, Ranjit Avenue, Amritsar -143 001. Tel: (0183) 3988028 /29/ 2570,Fax: (0183) 3982599. HDFC AMC Ltd., Ground Floor, Liberty Chowk, Corner Building, Municipal No. 83 - B, 3A, Bhatinda - 151 001. Tel.: (0164) 5001982,
Fax: (0164) 5191283. HDFC AMC Ltd., 1st Floor, SCO- 2909- 2910, Sector - 22-C, Opp. Hotel J W Marriot, Chandigarh - 160 022. Tel: (0172) 5050888, Fax: (0172) 277 1219. HDFC AMC Ltd., 2nd Floor, Above ING Vysya Bank, Adjacent to Sekhon Grand Hotel, Namdev Chowk, G T Road, Jalandhar City - 144 001. Tel: (0181) 3988029 / 970, Fax: (0181) 3982966. HDFC AMC Ltd., SCO 122, Feroze Gandhi Market, Ludhiana - 141 001. Tel.: (0161) 277 4321 / 5014321. Fax: (0161) 3013838. RAJASTHANHDFC AMC Ltd., 4th Floor, K.C. Complex, Opp. Daulat Bagh, Ajmer - 305 001. Tel: (0145) 3099000.Fax: (0145) 3099001. HDFC AMC Ltd., “Moondhra Bhavan”, 3-Ajmer Road, Jaipur - 302 001. Tel: (0141) 511 6681/ 82 , 237 4968, Fax: (0141) 5111126. HDFC AMC Ltd., Gulab Singh Bhavan, 11, Chopasni Road, Jodhpur - 342 003. Tel: (0291) 510 1927, 510 1937, Fax: (0291) 510 5919. HDFC AMC Ltd., 1st Floor, Gowardhan Plaza, 25, Trench Colony, Opposite Lok Kalamandal, Udaipur - 313 001. Tel: (0294) 3988029, Fax: (0294) 3982000. TAMIL NADUHDFC AMC Ltd., ITC Centre, 1st Floor, 760, Anna Salai, Chennai - 600 002. Tel: (044) 43979797 /43979716, Fax: (044) 28415855. HDFC AMC Ltd., 1371A, Ground Floor, Nadar Building, Trichy Road, Coimbatore - 641 018. Tel: (0422) 4391861/62/63. Fax: (0422) 4391714. HDFC AMC Ltd., 127 C/3 East Veli Street, Madurai - 625 001. TeleFax: (0452) 3988029. HDFC AMC Ltd., 1st Floor, No1 Bhimsena GardenStreet, Royapettah High Road, Mylapore, Chennai – 600 004. Tel: (044) 30913060, Fax: (044) 30913082. HDFC AMC Ltd., 1st floor, Ram Complex, No. 454/3, Meyanoor Main Road, Salem - 636 009. HDFC AMC Ltd., 1st floor, No. 142/7, Sri Balaji Arcade, Opp. Alagar Jewellery, Trivandrum Road, Palayamkottai, Tirunelveli - 627 002.Tel: (0462) 2576174, Fax: (0462) 2576173. Tel: (0427) 3982680/700. Fax: (0427) 2333617. HDFC AMC Ltd., No. 60, Sri Krishna Arcade, First Floor, Tennur High Road, Tennur, Trichy - 620 017.Tel: (0431) 3982830, Fax: (0431) 3982835. HDFC AMC Ltd., Premises No.73, 1st Floor Door No. 73/19, Thiyagarjapuram Officer’sLine Officer’s Line, Vellore - 632 001, Tel: (0416) 2214670/2. Fax: (0416) 2214671. UTTARAKHANDHDFC AMC Ltd., 76, Rajpur Road, Near RTO, Dehradun - 248 001. Tel: (0135) 3988029 / 7434, Fax: (0135) 3987444. HDFC AMC Ltd., Plot No. 1, 1st Floor, Durga City Centre, Bhotia Parao, Nainital Road,Haldwani - 263 139. Tel: (05946) 285286 Fax: (05946) 285290.HDFC AMC Ltd., 1st Floor, Kumar Complex, Chandracharya Chowk, Haridwar - 249407 Tel: (01334) 222406/7 Fax: (01334) 222410. UTTAR PRADESHHDFC AMC Ltd., B2, 1st Floor, 9/4, Shankar Point,Sanjay Place, Agra - 282 002. Tel: (0562) 3984761-73, Fax: (0562) 3984777. HDFC AMC Ltd., 3/260-A, Arena Complex,
Laxmibai Marg, Marris Road, Aligarh - 202 001. Tel: (0571) 2740 770 / 771 / 772, Fax: (0571) 2740772. HDFC AMC Ltd., 3rd Floor, Agarwal Arcade, Hyundai Motors Showroom, 4 Sardar Patel Marg, Civil Lines, Allahabad - 211 001. Tel: (0532) 2561 035/036/038, Fax: (0532) 2561035. HDFC AMC Ltd., 146 Civil Lines, 1st Floor, Gupta Complex, Near Circuit House Chouraha, Bareilly - 243 001. Tel: (0581) 2510 749 / 759, Fax: (0581) 2510709. HDFC AMC Ltd., D-2, 1st Floor, Raj Nagar DistrictCentre, Raj Nagar, Gaziabad - 201 010. Tel: (0120)301 0635, Fax: (0120) 3010636. HDFC AMC Ltd., 4th Floor, A.D. Tower Compound,Bank Road, Gorakhpur -273 001, Tel. No: (0551) 6060011/2/3. HDFC AMC Ltd., 101 & 201, Sai Arcade, 16/34 Bhargava Estate, Civil Lines, Kanpur - 208 001. Tel: (0512) 3935592/93/94, Fax: (0512) 3935596. HDFC AMC Ltd., 1st Floor, Narain Ford Building, 4 Shah Najaf Road, Hazratganj, Lucknow - 226 001. Tel: (0522) 4155500/ 01, Fax: (0522) 4155555. HDFC AMC Ltd., 143/145/1, Ganpati Plaza, GroundFloor, Magal Pandey Nagar, Meerut - 250 005. Tel: (0121) 2602 380 / 2601 965, Fax: (0121) 2602380. HDFC AMC Ltd., Parsvnath Plaza-II, UGF Hall No.4,Delhi Road, Moradabad - 244 001. Tel: (0591) 3988029 / 3982131. Fax: (0591) 3982137. HDFC AMC Ltd., K-24/25, First Floor, Pearl Plaza Building, Sector-18, Noida - 204 301. Tel: (0120) 432 5757/ 5959. Fax: (0120) 423 4349. HDFC AMC Ltd., D-64/127, 4th Floor, ArihantComplex, Sigra, Varanasi - 221 010. Tel: (0542) 6450711/ 6450712. WEST BENGALHDFC AMC Ltd., 2nd Floor, Chatterjee Plaza, 69/101,GT Road, Rambandhutala, Asansol - 713 303. Tel: (0341) 2221220, Fax: (0341) 2221219. HDFC AMC Ltd., City Plaza, City Centre, 1st Floor, Durgapur - 713 216. Tel: (0343) 3982150, Fax: (0343) 3982153. HDFC AMC Ltd., Krishna Enclave, 2nd Floor, 2/1, Bhajanlal Lohia Lane, Opposite Howrah A.C. Market, Howrah - 711 101, Phone: (033) 33546150/163, Fax: (033) 33546157. HDFC AMC Ltd., Menaka Estate, 1st Floor, 3 Red Cross Place, Kolkata - 700 001. Tel: (033) 22312875, 22312876, Fax: (033) 22439582. HDFC AMC Ltd., Gitanjali Complex, 2nd Floor, AboveCorporation Bank, Sevoke Road, Siliguri - 734 001. Tel: (0353) 6453474. Fax: (0353) 2545270.
* This is not an Investor Service Centre for HDFCMutual Fund. However, this is an official point of acceptance for acceptance of all on-going transactions from Institutional Investors only, i.e.broadly covering all entities other than resident / non resident individuals. Institutional Investors are free to lodge their applications at any other officialpoints of acceptance also.** Official points of acceptance of transactions forschemes of HDFC Mutual Fund except purchase transactions of Liquid Schemes / Plans viz. HDFC Liquid Fund, HDFC Liquid Fund - Premium Planand HDFC Cash Management Fund - Savings Plan &Call Plan.
WANT TO HAVE THE LATEST INFORMATION ABOUT US ?
Toll-free number : 1800 3010 6767
e-mail For any query or suggestions:-
Investors may contact us at: [email protected]
Distributors may contact us at: [email protected]
SMS: HDFCMF to 56767
Telephone Services
Visit us at www.hdfcfund.com
(Continued from previous page)
INVESTOR SERVICE CENTRES (ISCs)