volatility and co-movement in commodity prices: new evidence · emerging market economies (led by...
TRANSCRIPT

Volatility and Co-movement in Commodity Prices: New Evidence
Mthuli Ncube Dawit B. Tessema
Daniel Zerfu Gurara
No 205 – July 2014

Correct citation: Ncube, M., Tessema, D.B., and Gurara, D. Z. (2014). Volatility and Co-movement in
Commodity Prices: New Evidence. Working Paper Series N° 205, African Development Bank, Tunis,
Tunisia.
Steve Kayizzi-Mugerwa (Chair) Anyanwu, John C. Faye, Issa Ngaruko, Floribert Shimeles, Abebe Salami, Adeleke Verdier-Chouchane, Audrey
Coordinator
Working Papers are available online at
http:/www.afdb.org/
Copyright © 2013
African Development Bank
Angle de l’avenue du Ghana et des rues
Pierre de Coubertin et Hédi Nouira
BP 323 -1002 TUNIS Belvédère (Tunisia)
Tel: +216 71 333 511
Fax: +216 71 351 933
E-mail: [email protected]
Salami, Adeleke
Editorial Committee Rights and Permissions
All rights reserved.
The text and data in this publication may be
reproduced as long as the source is cited.
Reproduction for commercial purposes is
forbidden.
The Working Paper Series (WPS) is produced
by the Development Research Department
of the African Development Bank. The WPS
disseminates the findings of work in progress,
preliminary research results, and development
experience and lessons, to encourage the
exchange of ideas and innovative thinking
among researchers, development
practitioners, policy makers, and donors. The
findings, interpretations, and conclusions
expressed in the Bank’s WPS are entirely
those of the author(s) and do not necessarily
represent the view of the African Development
Bank, its Board of Directors, or the countries
they represent.

Volatility and Co-movement in Commodity Prices: New
Evidence
Mthuli Ncube*
Dawit B. Tessema**
Daniel Zerfu Gurara**
* Mthuli Ncube (Chief Economist and Vice President, AfDB).
** Dawit B. Tessema (Consultant, AfDB) and Daniel Zerfu Gurara (Principal Research Economist, AfDB). We thank an
anonymous referee for the careful reading of our manuscript and the valuable comments.
AFRICAN DEVELOPMENT BANK GROUP
Working Paper No. 205 July 2014
Office of the Chief Economist
Abstract
In this paper we show that commodity price co-movements between petroleum and other commodities, although infrequent, are not unique to recent periods, as alluded to in the current literature. We find that much of the volatility in commodity prices over long time spans is caused by economic fundamentals. Conditional covariances of unrelated commodities are very small in ordinary circumstances, as expected. After accounting for economic fundamentals, we find no evidence of excess co-movement between groups of commodity pairs. In a framework where commodity prices are influenced by common macroeconomic variables that determine the supply and demand for commodities, we show that conditional covariances of pairs of unrelated commodities are, as expected, stable and small with infrequent periods of uncharacteristic spikes. We hypothesized that these infrequent spurts are associated with sharp expected declines in asset prices associated with the
probability of economic downturns and financial leverage (credit stress). The probability of a downturn is likely to be associated with expectations of lower short term interest rates and falling marginal costs of holding inventory (larger convenience yields) which in turn spur simultaneous demand for speculative or anticipatory commodity inventories. Likewise, excessive financial leverage is associated with rising risk of defaults and declining asset values. This is likely to lead to periods of deleveraging and lower economic activity. As a rational response to declining asset prices, risk neutral speculators are likely to shore up commodity inventories in search of arbitrage opportunities as a. We tested this hypothesis by looking at the relationship between pair-wise conditional covariances of the commodity pairs and indicators of uncertainty. The likelihood of recessions and financial leverage were found to be positively related to spurts of joint commodity price movement.
Keywords: Volatility, GARCH, Co-movement, commodities, recession, credit crunch
(JEL Classification: C22, C22, G11, 013)

1
1. Introduction
Erratic commodity price (co)-movement during the great financial crisis of the 2000s rekindled
interest in understanding the driving forces behind serial dependence and price co-movements across
commodities. Recent contributions to the literature include; Fan (2012); Harri et. al. (2009); Nazlioglu
and Soytas (2011, 2012, 2013).
Unlike the established literature on commodity price dynamics, recent works focused on the impact
of fluctuations in the prices of strategic commodities- such as crude oil- on the prices of other
commodity counterparts. The older literature, which included seminal contributions from Cooper
and Lawrence (1975), Van Duyne (1979), Deaton and Laroque (1989 & 1996), and Pindyck and
Rotemberg (1990), explored the impact of macroeconomic stimuli on commodity price co-movement.
In the current literature, very little effort is devoted to explaining joint commodity price movements.
Even so, the change of focus did not spell the declining importance of common aggregate factors in explaining joint price movements. Of the major hypotheses floated to explain the co-movement of commodity prices in the new millennium, three macroeconomic explanations captured the center stage. The first hypothesis emphasized robust growth in emerging market economies (led by China and India) and its role in stimulating demand for commodities –a view prominently reflected in the works of Caballero, Farhi and Gourinchas (2008) and Kilian and Hicks (2013). The second hypothesis focused on the role of speculation/’financialization’ of commodities traded on exchanges as futures or in physical form (Kilian and Lee, 2014; Kilian and Murphy, 2014). Finally, the third hypothesis attributed commodity price co-movements to monetary growth (Frankel, 2006; Barsky and Kilian, 2004). In this paper two issues are simultaneously explored. First, we analyze whether there is substantial co-movement between crude oil and two groups of commodities that fails to be explained by key macroeconomic fundamentals. This is done using monthly data spanning 1980-2014 for the following commodity groups (group 1: coffee, cotton, cocoa; group 2: wheat, corn, and palm-oil). We use multivariate GARCH techniques to account for economic fundamentals and explore remaining co-movements (or lack thereof) between commodity pairs. Second, after computing the joint movement of prices in the GARCH framework, we analyze the stability of these joint movements during periods of economic downturn. Stability of these conditional covariances would imply that macroeconomic variables determine common trends in general supply, demand and commodity inventories. Our results show that much of joint movement in commodity prices is explained by common macroeconomic variables. Pair-wise conditional covariances1 of unrelated2 commodities are stable - with the exception of periods of economic downturn. Overall, after accounting for economic fundamentals, we find no evidence of ‘excess co-movement’ between group 1 and 2 commodity pairs against crude oil.
1 E {Cov (dlogP1, dlogP2|Ω)} = Cov (dlogP1, dlogP2) – Cov (E (dlogP1|Ω), E (dlogP2|Ω). P1 and P2 represent unrelated commodity
price pairs, while Ω represents common macroeconomic variables. The conditional covariance captures the joint movement of prices attributable to common macroeconomic variables 2 ‘Unrelated’ in this context refers to commodities that are not co-produced.

2
This paper makes two interrelated contributions to the literature. First, it shows that macroeconomic fundamentals play a key role in explaining commodity price variability in line with the established literature. Second, in exceptional circumstances where recessions are likely, the simultaneous buildup of commodity inventories explains transient spurts of co-movement in commodity prices. The probability of economic downturns is likely to be associated with expectations of low short term interest rates and low costs of storing commodities and therefore is likely to induce demand for commodity inventories. Rising demand for inventories creates simultaneous price pressures by inducing commodities to be kept in storage rather than made available to markets. Similarly, during a recession, expectations of countercyclical monetary shocks can lead to an upward revision of inflationary expectations inducing simultaneous inventory buildup. As a result, short spurts of covariance in unrelated commodity prices are likely. The remainder of the paper is structured as follows. Section 2 examines competing theories of commodity price covariance with emphasis on the relationship between crude oil and other commodities. Section 3 summarizes data and methodology, Section 4 provides results and Section 5 concludes. 2. Competing narratives on commodity price co-movement
Since the early 2000s, the world has experienced multiple commodity price booms. Between 2005m1-
2010m1 the price of cocoa more than doubled, while the price of coffee and cotton tripled and
quadrupled between 2005m1 and 2011m4, respectively. This simultaneous upward trend in prices
was explained in different ways. Kilian (2009) attributed it to growth in emerging market economies
prior to 2008, while Trostle et al. (2011) emphasized the role of adverse weather shocks on crop
production. Others have attributed the phenomenon to the ‘financialization’ of commodity markets
and the increased appeal of commodity derivatives (Greer, 2000; Erb and Harvey, 2006; Kilian and
Murphy, 2014).
The literature features contrasting views on the causes of commodity price co-movements. The lack of consensus on the empirical front is largely due to competing theoretical frameworks and differences in empirical methodology. A wide variety of studies have employed vector error correction (VEC) models to analyze these co-movements. Contrastingly, an equally diverse number of studies have adopted ARCH models to capture the same relationships. For instance, Nazilioglu and Soytas (2012 examine co-movement between the prices of twenty four commodities and crude using monthly data from 1980 to 2010. They estimate cointegration equations using fully modified OLS and dynamic-OLS applied to a panel of agricultural commodities (individual commodities are treated as cross-sectional units). The authors report the strong impact of crude oil price changes and a weak dollar on agricultural commodity prices both for the individual commodities and the panel. Nevertheless, Nazilioglu and Soytas (2012) leave a number of methodological issues unanswered. First, their characterization of commodity price series as nonstationary over such a long horizon is debatable. This is tied to the absence of an organizing theoretical framework to their approach. For instance, with the standard competitive model of commodity price formation with storage, serial correlation in commodity prices derives out of the short-run inflexibility of supply. For speculative arbitrageurs to hold inventories,

3
expected price growth must match interest and cost of storage. But since supply is relatively flexible in the long run, stocks adjust relatively quicker guaranteeing the stationarity of prices. Second, it is well documented that standard tests of stationarity used in the study perform poorly in the presence of strong conditional heteroskedasticity. The variance-ratio and Wald-Wolfowitz tests perform better in the presence of conditional heteroskedasticity. In a follow up to their earlier contributions, Nazlioglu, Erdem and Soytas (2013) examined volatility transmission from crude oil to selected agricultural commodity prices (wheat, corn, sugar, and soybean). The study applied impulse response techniques and causality in variance by dividing daily data from January 1986 to March 2011 into two periods: pre-crisis (January 1986 – December 2005) and post-crisis (January 2006-March 2011). The study shows that there are no visible shock transmissions from crude oil prices to the selected commodities during the crisis period. Contrastingly, shock transmission in the post-crisis period has been high for all commodities-with the exception of sugar. Similar to Chang and Su (2010) and Serra et al. (2011), the study claims that interdependence between energy and agricultural markets has increased in recent years. These are a few of a long list of studies that associate the demand for alternative energy sources to the joint movement of crude oil and food prices. Other studies in the group include, Harri et al. (2009), and Nazlioglu and Soytas (2011). Regrettably, none of the studies took to the task of explaining the co-movement of prices of food and non-food items that are not used in bio-energy production during the same period. Other studies attributed recent co-movements of petroleum and non-energy commodity prices to coincidental commodity-specific consumption and production shocks rather than singularly to bio-fuel demand (as it is the case in the studies cited above). For instance, Trostle et al. (2011) attributed the 2007-08 commodity price co-movements to adverse global weather shocks that affected crop production in many parts of the world. Elsewhere, Killian (2009) ascribes these co-movements to growth in global demand for commodities and specifically in emerging market economies of China and India. Alternatively, Caballero, Farhi and Gourinchas (2008) highlight the connection between commodity price co-movements during the same period and the partial re-creation of bubbles in commodities as a result of global asset shortage. More recently, Alquist and Coibion (2014), using a simple macroeconomic model, show that commodity specific shocks play a limited role in global business cycle fluctuations. They argue that much of the rise in commodity prices since 2003 can be accounted for shocks to aggregate productivity and labor supply. The subsequent joint decline in prices between October 2008 and March 2009 is attributed to direct commodity shocks affecting supply and demand. Their decomposition shows that endogenous non-commodity shocks explain much of historical commodity price movements through their influence on global economic activity. However, there have been major episodes in which direct supply and demand shocks to commodity markets have played important roles, including during the second commodity price boom of the 1970s, the run-up in commodity prices from 2003 to 2008 and their subsequent decline in 2008 and 2009. In this paper we use a theoretical framework developed by Pindyck and Rotemberg (1990) to evaluate the presence of price co-movements unexplained by common the macroeconomic

4
fundamentals responsible for supply and demand conditions. The vast majority of recent studies detects direct price-correlations between petroleum and other commodities and ascribes these joint movements to shifts in commodity specific attributes. In this group of studies, the role of macroeconomic fundamentals determining common supply and demand forces is blurred. We argue that economic fundamentals play a key role in determining commodity price variability (i.e. the covariance of unrelated real commodity prices is small and stable in ‘unexceptional’ periods). However, in exceptional circumstances where economic downturns are likely, expectations of lower short term interest rates reduce the costs of storing commodities and therefore trigger demand for inventories. Rising demand for inventories create simultaneous price pressures by inducing commodities to be kept in storage rather than made available to markets. As the odds of a recession increase, expectations of countercyclical monetary shocks is likely to lead to an upward revision of inflationary expectations lowering real short term interest rates inducing simultaneous inventory buildup. The brief spurt of covariance in unrelated commodity prices during downturns is a rational response to declining asset prices. 3. Methodology and Data
The theoretical framework is extensively explained in Pindyck and Rotemberg (1990) and the empirical exposition of the theoretical model is presented in Deb, Trivedi and Varangis (1996). Two premises serve as fundamental building block of the model. First, commodity supply and demand are directly influenced by macroeconomic variables. For example, growth in industrial production increases demand for non-industrial commodities as a result of the increases in income. Second, the storability of commodities implies that demand for inventories depend on expectations of future market conditions that are determined by the same set of macroeconomic variables. For instance, low real interest rates imply low costs of storage. Favorable convenience yields create opportunities for inventory demand for commodities and profit making through inter-temporal arbitrage. Under the assumption that risk-neural speculators maximize expected profits, they arrive at the following reduced form that allows for serial dependence. Therefore, ∑
[1]
is the logarithm of price of the ith commodity; xt-m is a vector of current and past values of a vector of macroeconomic variables: 1-year US nominal Treasury Rate TR; industrial production (for the OECD) ‘I’; US Money supply ‘M2’; Real Trade Weighted U.S. Dollar Index3 X; and stock index-S&P500 ‘S’. Similar to Deb, Trivedi and Varagis (1996), we estimate the model using Engel and Kroner’s (1995) BEKK extension of the multivariate GARCH model which imposes positive definiteness on the error sum of squares.
3 The real trade weighted index is a weighted average of the U.S. dollar against a broad index of currencies that circulate
widely outside the country of issue. Major currencies index includes the Euro Area, Canada, Japan, United Kingdom,
Switzerland, Australia, and Sweden.

5
Suppose that { } is a sequence of ( ) i.i.d random vector with the following properties: ; ; such that [2]
√ ; ;
is a multivariate GARCH (1,1) modeled as a function of lagged squares and cross-products of and itself. Imposing N=2, for the sake of exposition, the scalar and vector forms of ht, and Ht take the following forms.
∑
∑
[3]
The A and B matrices are diagonalized to ensure covariance stationarity (see Engel and Kroner, 1995). Diagonialization guarantees that our test of implies zero
covariance between commodity price pairs considered (in our case the price of petroleum vis-à-vis other commodities). The Data We select two groups of commodities- six commodities in total composed of tree crops and food items. Group 1 comprises of coffee, cocoa, cotton while wheat, maize and palm oil make up group 2. The analysis can be readily extended to incorporate other commodities. We use monthly commodity prices for the period 1980m1-2014m1 from the International Monetary Fund’s commodity prices series. Monthly data on industrial production (for the OECD) ‘I’; Smoothed Recession Probabilities for the US ‘R’, money supply ‘M2’; the 1-month nominal Treasury Rate ‘TR’; Real Trade Weighted U.S. Dollar Index ‘X’; Chicago Fed National Financial Conditions Credit Sub-index ‘F’; and S&P 500 index ‘S’ are from the US Federal Reserve System. ‘R’ is obtained from a dynamic factor markov-switching model applied to four monthly variables: non-farm payroll employment, index of industrial production, real personal income, and real manufacturing and trade sales (developed by Chauvet, 1998). ‘F’ measures household leverage as household mortgage and consumer debt relative to residential investment and personal consumption of durable goods. Expressed in this way, the variable measures the level of credit stress much like credit-GDP ratios. But ‘F’ focuses on non-financial business leverage and amplifies the relationship between rising household and non-financial business leverage and credit stress. Therefore, ‘F’ is our preferred measure of credit stress.
Table 1 summarizes the descriptive statistics of the series. Macroeconomic variables and price series exhibit strong volatility clustering. The ARCH (1-10) is chi-squared under the null hypothesis of no ARCH effects (volatility clustering). An equally valid test –the Box-Pierce statistic (not reported) identifies serial correlation in the squared series confirming the volatility clustering hypothesis. All of the series have non-normal distributions. Maize, smoothed recession probabilities and the credit stress variable exhibit fat-tails. Prices of maize and cocoa, the stock index, and US Money supply are peculiarly bimodal. The price series display similar levels of variance, which are generally lower than the dispersion exhibited by some of the macroeconomic variables.
Columns 7 and 8 provide alternative tests of the random walk hypothesis. The Lo-R/S is a variance-ratio test designed to detect mean reversion in series that have strong ARCH effects (Lo and MacKinlay, 1988). The Lo-R/S test rejects the null of no mean reversion in each series. However, Lo-R/S has two main drawbacks. First, the power of the test is influenced by the

6
presence of GARCH effects. Second, the assumption of a constant conditional variance implicit in the test is not valid in most time series. The alternative test by Fama (1965) is the RUNS test that evaluates the same hypothesis in a sequence without imposing a parametric structure or stationarity. The Runs tests also reject the null of a martingale difference in the series. Therefore the past history of the series can be used to predict current and future values of the time series. Table 1 Descriptive statistics
Variable #obs min mean max std.dev ARCH Lo R/S test (q=1)=2.09
RUNS
KPSS Excess Kurtosis
K
Coco 409 7.00 7.81 9.10 0.42 [0.00]*** 5.60 -19.03 5.71*** -0.24
Coffee 409 4.14 4.14 6.23 0.48 [0.00]*** 4.98 -18.77 5.56*** -0.87
Cotton 409 3.82 4.62 5.59 0.40 [0.00]*** 5.23 -19.18 7.76*** -0.68
Maize 409 4.55 5.19 5.94 0.34 [0.00]*** 5.13 -18.46 3.34*** -0.91
Oil 409 2.63 3.79 4.88 0.54 [0.00]*** 6.42 -19.48 3.68*** -1.22
P.Oil 409 5.44 6.44 7.41 0.39 [0.00]*** 5.03 -18.29 1.74*** -0.49
Wheat 409 4.89 5.48 6.21 0.30 [0.00]*** 4.99 -18.08 3.64*** -0.66
I 408 4.01 8.29 4.69 0.21 [0.00]*** 6.37 -20.17 13.29*** -1.27
TR 410 -0.95 4.61 16.30 3.95 [0.00]*** 5.32 -19.18 10.75*** 0.11
S 409 4.63 6.34 7.51 0.85 [0.00]*** 6.39 -20.17 12.6*** -1.15
M2 409 8.29 8.70 9.24 0.25 [0.00]*** 6.10 -20.17 12.38*** -0.76
X 409 4.45 4.62 4.97 0.12 [0.00]*** 3.49 -18.56 2.43*** -0.26
F 409 -1.12 0.02 3.65 1.00 [0.00]*** 4.01 -18.05 3.06** 2.8
R 409 0.00 0.11 1.00 0.26 [0.00]*** 2.83 -18.25 0.41 4.31
*** p<0.01, ** p<0.05, * p<0.1 Lo R/S is the Lo-MacKinlay (1988) variance ratio test. The null hypothesis tests no long term dependence in the series. Critical Values 99%: [0.721, 2.098]. RUNS is Fama’s (1965) test of the random-walk hypothesis (RWH). The test rejects RWH at the 5% level if |k|>1.96,
where
is a normalization of the runs variable ‘c’. ‘C’ represents a sequence of adjacent equal elements that
alternate randomly. All prices are in natural logs. Macroeconomic variables are in natural logs with the exception of interest rates.
4. Results and discussion
We estimated equation 1 for the two commodity groups. Annex II II reports the GARCH estimation results for group1 and group2 commodities. In these specifications, the second order moments of commodity prices are jointly estimated together with macroeconomic variables in a multivariate modeling framework. The macroeconomic fundamentals considered include an industrial production index (OECD); 1 year US treasury rates; a stock index; broad money supply M2 and the US$ index against major internationally traded currencies.

7
Among the MGARCH frameworks we chose the BEEK model for two of its appealing attributes. First, it does not impose constant conditional correlations among variables through time. Second, it differentiates between direct volatility spill-over (captured by conditional variances) and indirect spill-over (captured by conditional covariances). The estimated coefficients a1.ii, capture the effects of past shocks on current volatility in the price of the specific commodity. Correspondingly, b1.jj gauges the persistence of past volatility of prices on current. The estimated coefficients (a1.ii, b1,jj) are statistically significant at the 1 percent significance level. As shown in Annex II, the relatively small a1.ii indicates that commodity specific shocks do not produce large volatility in the respective variances of commodities. However, the large b1.jj in both groups of commodities shows that past conditional variances have substantial effect on current variances. The simple and standardized residuals from the GARCH (1, 1) regressions are used to determine if there is an excess co-movement between the price of crude oil and commodities within the specified groups using the full sample. Next, we divide the periods of analysis into periods of high perceived co-movement (the 2000s) and low periods of perceived co-movement (before the 2000s) to test the presence (absence) of distinct patterns of excess co-movement. Next we test whether the residuals of the GARCH equations exhibit contemporaneous correlation. We are particularly interested in the pair-wise correlations of residuals from the crude oil equation and group 1 commodities in order to determine whether there are other factors explaining the co-movement of commodity prices (herd behavior in Pindyck and Rotemberg, 1990). First, we compare two periods- period 1 (1980m1-1999m12) and period 2 (2000m1-2014m1) to determine if there are distinct patterns of ‘excess co-movement’. Second, we determine if the scaled/unscaled residuals are correlated with periods of credit stress as measured by the Chicago Fed National Financial Conditions Credit Sub-index and smoothed recession probabilities. Unlike in Pindyck and Rotemberg (1990), the residuals are based on quasi-maximum likelihood estimate of a GARCH process. We use two procedures to test contemporaneous residual covariance. The first procedure is a likelihood ratio test based on pair-wise exclusion of the variables of interest in our original multivariate GARCH model. We test for zero
conditional covariance of the [un]scaled residuals ( ) . The quasi-maximum
likelihood estimator of the BEKK-GARCH (1, 1) is consistent and jointly asymptotically normal and therefore ensures the validity of the LRT test (see Compte and Liberman, 2003, and van der Weide, 2002). The second procedure is Rao’s score test based on pair-wise IGARCH (1, 1) models of the scaled multivariate GARCH residuals. We test for zero
unconditional covariance of the scaled residuals ( ) . The LM statistic converges
to a chi-square with 1 degree of freedom and is asymptotically consistent.

8
Table 2: Likelihood Ratio Test (LRT) of excess co-movement based on unscaled residuals ( )
Full Sample
1980m1-2014m1 Period 1
1980m1-1999m12 Period 2
2000m1-2014m1
Cocoa-Oil
χ2(2) = 0.33(0.85) χ2(2)=0.33(0.85) χ2(2)= 0.32(0.85)
Coffee-Oil χ2(2)=0.30(0.86) χ2(2)=0.29(0.86) χ2(2)= 0.32(0.85)
Cotton-Oil χ2(2)= 0.35(0.84) χ2(2)= 0.37(0.83) χ2(2)= 0.33(0.85)
*** p<0.01, ** p<0.05, * p<0.1
Table 2 reports results of the likelihood ratio test based on regressions of the unscaled residuals (see eq. 2). None of the commodity pairs exhibit excess co-movement in the specified periods. The above implies that commodity price variability is mainly explained by the trajectories of macroeconomic fundamentals and has little to do with spontaneous herd behavior in financial markets. . The LM alternative is a likelihood ratio test based on IGARCH (1, 1) models of pair-wise scaled residuals and looks for patters of co-movement unexplained within the model. Again, we apply a slightly different variant of the test proposed by Deb, Trevedi and Varagis (1996).
The score test proposed by Deb, Trevedi and Varagis (1996) involved testing Ho: ( )
by extending the LM test of the covariance matrix in a multivariate normal regression (SUR). Instead, we estimate pair-wise IGARCH (1, 1) by the QMLE, compute the uncentered R2, and multiply it with the number of observations. Table 3 reports results of the LM-test based on regressions of the scaled residuals. Likewise, the scaled residuals do not exhibit any form of co-movement except marginally in the cotton-crude oil pair attesting to the absence of herd behavior in the commodity pairs. Table 3: LM Test of excess co-movement based on pair-wise univariate GARCH models of
scaled residuals: Ho: ( ) Full Sample
1980m1-2014m1 Period 1
1980m1-1999m12 Period 2
2000m1-2014m1
Cocoa-Oil
χ2(1) = 0.132 [0.716] χ2(1 = 1.308 [0.253] χ2(1 = 0.379 [0.538]
Coffee-Oil χ2(1 = 0.057 [0.811] χ2(1 = 0.0496 [0.824] χ2(1 = 1.087 [0.297]
Cotton-Oil χ2(1 = 1.539 [0.215] χ2(1 = 4.066 [0.048] * χ2(1 = 0.0702 [0.79]
*** p<0.01, ** p<0.05, * p<0.1, r2 represents the square of pair-wise correlations
We replicate the procedures in commodity group2. We separately estimate the MGARCH model for the two commodity groups for two reasons. One, within group commodity price co-movements are more plausible because of the nature of the commodities (e.g. group1 is composed of tree crops that are likely to exhibit longer periods of adjustment to shocks). Two, the dual structure makes it more convenient to estimate the models since it conserves on degrees of freedom. Table 6 summarizes the results of the MGARCH estimates for commodity group2. The results of the pair-wise residual covariances of group 2 commodities and crude oil

9
resembles the result for group 1 commodities indicating the absence of extraneous sources of volatility. Table 4 and 5 summarize the LRT and LM tests of ‘excess co-movement’ based on the pair-wise residual covariances from the commodity and crude oil equations. Similar to commodity group1, the LRT based on the unscaled residual pairs of crude oil and other commodities exhibit no ‘excess co-movement’ in all three periods. The absence of co-movements is robust to the use of the LM test based on univariate GARCH estimates of pair-wise scaled residuals. Both tests provide no evidence of excess co-movement between crude oil and group 2 commodities. Table 4: Likelihood ratio Test of excess co-movement based on unscaled residuals ( )
Full Sample
1980m1-2014m1 Period 1
1980m1-1999m12 Period 2
2000m1-2014m1
Corn-Oil
Chi^2(2)= 0.35[0.84] Chi^2(2)=0.36[0.83] Chi^2(2)=0.34[0.85]
Wheat-Oil Chi^2(2)= 0.36[0.83] Chi^2(2)=0.37[0.83] Chi^2(2)= 0.33[0.85]
P. Oil-Oil Chi^2(2)= 0.30[0.87] Chi^2(2)= 0.29[0.87]
Chi^2(2)=0.31[0.87]
*** p<0.01, ** p<0.05, * p<0.1
Table 5: LM test of excess co-movement based on pair-wise univariate GARCH models of scaled
residuals
Ho: ( ) Full Sample
1980m1-2014m1 Period 1
1980m1-1999m12 Period 2
2000m1-2014m1
Corn-Oil
χ2(1) = 0.02 [0.91] χ2(1) = 0.40 [0.52] χ2(1) = 0.52 [0.47]
Wheat-Oil χ2(1) = 0.05 [0.82] χ2(1) = 0.38 [0.54] χ2(1) = 0.13 [0.72]
P. Oil-Oil χ2(1) = 0.43 [0.51] χ2(1) = 1.12 [0.29] χ2(1) = 0.003 [0.96]
*** p<0.01, ** p<0.05, * p<0.1, r2 represents the square of pair-wise correlations
Financial Crises and commodity price movements Most macroeconomic and financial fundamentals exhibit pro-cyclical behavior during economic downturns. These often tally with periods of credit contraction and decline in asset prices. For instance, Claessens et. al. (2008) show that a typical credit crunch lasts 10 quarters and results in a 20 percent decline in credit coinciding with equity price busts of equivalent length and declines in real value of equities of around 50 percent. Furthermore, Shiller (2000), Tetlock (2007), and García (2012) show shocks to printed news during recessions change the conditional average return on a host of financial assets frequently. Shewert (1989) provides further evidence that production growth rates, short-term bond rates, and equity returns tend to show greater fluctuation during recessions. In such downturns, investors are exposed to sharp stock market losses and require large premiums to be induced to hold equities. Forestalling these losses require some form of anticipatory hedging often involving simultaneous speculative storage of commodities. Risk-neutral firms and investors that anticipate short-lived recessions could expand precautionary/transactions demand and/or speculative demand for inventories, respectively, if they anticipate the price of commodity inputs will recover with the end of recessions.

10
Therefore, commodity prices can exhibit significant covariance during economic downturns as a result of anticipatory hedging or speculative storage. To test this hypothesis, we use a VAR model of the pair-wise conditional commodity price covariances from our MGARCH regressions and two indicators of uncertainty (we estimate two unrestricted VARs for the two groups of commodities). The first uncertainty measure is the Chicago Fed national financial conditions credit sub-index ‘F’. It measures non-financial business leverage. As such it amplifies the relationship between rising household and non-financial business leverage and credit stress. Therefore, ‘F’ is our preferred measure of credit stress. Positive values of the index indicate financial conditions are tighter than average, while negative values indicate loose financial conditions. The second measure is a monthly smoothed recession probability for the US ‘R’ built based on a dynamic-factor markov-switching model applied to indices of industrial production; employment; real manufacturing and trade sales. We estimate a prototype VAR (for each commodity group) ; Where
Cov(dlzt ,dlyt) Cov(dlxt,dlzt)… Ft Rt), and y & z represent commodity pairs in groups 1, and 2) The impulse responses summarized in Annex IV provide some support for the simultaneous commodity storage hypothesis. In the first standard form VAR system featuring the conditional covariances of group 1 commodities, the orthogonal responses of these covariances to a recession probability impulse are similar to the responses from the credit stress impulses. For instance, a 0.25 point impulse to the probability of a recession (R) produces a 5 percent spurt in the covariance between the percentage price changes of cocoa and crude oil after a period of two quarters. The responses of the coffee-crude oil and cotton crude oil pair are similar in direction but half the magnitude. The responses to the recession impulse occur with a lag. Initially, recessionary pressure and the lull in final goods demand generates corresponding decline in demand for commodities which is likely to lead to downward adjustments of the pair-wise covariances. Once the likelihood of a recession builds into expectations, relative inventory demand for commodities ensues and initial decline in joint-movement is reversed (see annex VI). Similar tendencies are observed in the covariance responses of group 2 commodities to recession probability impulses. A quarter point impulse to the probability of a recession increases the covariance of corn and crude oil price-changes by over 2 percent in a period of two quarters and its effect tapers off after four quarters. We observe the same pattern in the palm-oil-crude oil and wheat-crude oil pairs. Covariance responses to credit stress impulses are similar within and across commodity groups and convey the same message as recession probability impulses. Half a point increase in the credit stress index (F) induces over 2 percent increases in the covariances of the cocoa-cotton and cocoa-crude oil pairs. The same impulses produce a 5 percent and 10 percent increase in the covariances of the coffee-crude oil and cotton-crude oil price pairs. The results are similar for group2 commodity pairs. A credit stress impulse signals rising household and non-financial business leverage. This increase in financial leverage is

11
associated with rising risk of default and declining asset values. This is likely to lead to periods of deleveraging and lower economic activity. As a rational response to declining asset prices, risk neutral speculators are likely to shore up commodity inventories in search of arbitrage opportunities. The speculative storage model seems to fit these joint commodity price movements. The volatility of equity returns during economic downturns, the decline in real rates and the contrasting rise in the convenience yield play an important role in spurring speculative demand for commodity inventories and explain the simultaneous rise in commodity prices. Speculative storage of commodities is viable during such periods since, often, the supply of physical commodities cannot be readily expanded. 5. Conclusion
In this paper, we show that much of the volatility in commodity prices over long time spans is caused by economic fundamentals. In a framework where commodity prices are influenced by common macroeconomic variables that determine the supply and demand for commodities, we show that conditional covariances of pairs of unrelated commodities are, as expected, stable and small with infrequent periods of uncharacteristic spikes. We argued that these infrequent spurts are associated with sharp expected declines in asset prices associated with the probability of economic downturns and credit stress (leverage). The probability of a downturn is likely to be associated with expectations of lower short term interest rates and falling marginal costs of holding inventory (larger convenience yields) which in turn spur simultaneous demand for speculative or anticipatory commodity inventories. We provided supporting evidence by looking at the relationship between pair-wise conditional covariances of the commodity pairs and indicators of uncertainty. The likelihood of recessions and credit stress were found to be positively related to spurts of conditional covariance of commodity price pairs. These are likely to have been caused by simultaneous increase in demand for inventory in search of arbitrage opportunities as a rational response to declining asset prices. Indeed much of the rise in commodity prices during the 2000s is due to an increase in global demand. This growth in demand and supply related shocks resulted in the decline in stocks of several commodities. The FAO reported sharp declines in stocks of cereals in 2006 reaching historic lows in 2008. Similarly, according to WEO (2011), stock-to-use ratios of base metals like copper and aluminium declined during 2005-2009. This decline in physical stocks made it difficult to draw down on inventories to stabilize prices. Fortuitously, this period coincided with the great recession bringing with it periods of low interest rates that made it possible to re-build dwindling inventories. The subsequent decline in commodity prices is evidence that storage rebuilding may have played a part in rising prices and their subsequent fall. Our analysis would have been more direct had there been monthly data on global inventories for the commodities in the analysis. In spite of this, we show that current volatility of prices (variance conditional on the set of macroeconomic variables considered) is dependent on past volatility and less so on the persistence of past commodity specific shocks.

12
In other words, macroeconomic fundamentals play a critical role in explaining the volatility in commodity prices. Second, we show that the contemporaneous covariance between the MGARCH residuals is not statistically different from zero. This reinforces our argument that ‘herd behaviour’ is not responsible for commodity price movements. Thirdly, we show that even though joint price movements of unrelated commodities (explained by macroeconomic variables) are ordinarily stable, sharp jumps (and drops) are observed during recessions/periods of credit stress. We argue that the decline in interest rates observed during periods of deleveraging following credit stress and sharp decline in asset prices lower convenience yields and encourage brief periods of commodity storage followed by periods of lower prices once inventories return back to normal levels. References Alquist, R., & Coibion, O. (2014). Commodity-Price Co-movement and Global Economic
Activity. NBER Working Paper, 20003. doi: http://dx.doi.org/10.3386/w20003
Barsky, R. B., & Kilian, L. (2004). Oil and the Macroeconomy Since the 1970s. Journal of Economic Perspectives, 18(4), 115-134. doi: 10.1257/0895330042632708
Caballero, R. J., Farhi, E., & Gourinchas, P.O. (2008). Financial Crash, Commodity Prices, and Global Imbalances. Brookings Papers on Economic Activity, 2008(Fall), 1-55. doi: 10.2307/27720394
Cashin, P., Liang, H., & McDermott, C. J. (2000). How Persistent Are Shocks to World Commodity Prices? IMF Staff Papers, 47(2), 177-217.
Chambers, R. G., & Lopez, R. E. (1984). A General, Dynamic, Supply-Response Model. Northeastern Journal of Agricultural and Resource Economics, 13(2), 142-154.
Chang, T.-H., & Su, H.-M. (2010). The substitutive effect of biofuels on fossil fuels in the lower and higher crude oil price periods. Energy, 35(7), 2807-2813. doi: http://dx.doi.org/10.1016/j.energy.2010.03.006
Chauvet, M. (1998). An Econometric Characterization of Business Cycle Dynamics with Factor Structure and Regime Switching. International Economic Review, 39(4), 969-996. doi: 10.2307/2527348
Claessens, S., Kose, M. A., & Terrones, M. E. (2009). What happens during recessions, crunches and busts? Economic Policy, 24(60), 653-700. doi: 10.1111/j.1468-0327.2009.00231.x
Comte, F., & Lieberman, O. (2003). Asymptotic theory for multivariate GARCH processes. Journal of Multivariate Analysis, 84(1), 61-84. Cooper, R. N., Lawrence, R. Z., Bosworth, B., & Houthakker, H. S. (1975). The 1972-75 Commodity Boom. Brookings Papers on Economic Activity, 1975(3), 671-723. doi: 10.2307/2534151
Davis, S. J., & Haltiwanger, J. (1992). Gross Job Creation, Gross Job Destruction, and Employment Reallocation. The Quarterly Journal of Economics, 107(3), 819-863. doi: 10.2307/2118365
Deaton, A., & Laroque, G. (1991). Estimating the Commodity Price Model. Woodrow Wilson School Discussion Paper, 154.

13
Deaton, A., & Laroque, G. (1992). On the Behaviour of Commodity Prices. Review of Economic Studies, 59(1), 1-23.
Deaton, A., & Laroque, G. (2003). A model of commodity prices after Sir Arthur Lewis. Journal of Development Economics, 71(2), 289-310. doi: http://dx.doi.org/10.1016/S0304-3878(03)00030-0
Deb, P., Trivedi, P. K., & Varangis, P. (1996). The excess co-movement of commodity prices reconsidered. Journal of Applied Econometrics, 11(3), 275-291.
Engle, R. F., & Kroner, K. F. (1995). Multivariate Simultaneous Generalized ARCH. Econometric Theory, 11(1), 122-150. doi: 10.2307/3532933
Erb, C. B., & Harvey, C. R. (2006). The Strategic and Tactical Value of Commodity Futures. Financial Analysts Journal, 62(2), 69-97.
Frankel, J. A. (1984). Commodity Prices and Money: Lessons from International Finance. American Journal of Agricultural Economics, 66(5), 560-566.
Frankel, J. A. (1986). Expectations and Commodity Price Dynamics: The Overshooting Model. American Journal of Agricultural Economics, 68(2), 344-348. doi: 10.2307/1241436
Frankel, J. A. (2006). The Effect of Monetary Policy on Real Commodity Prices. NBER Working Paper W12713.
Frankel, J. A. (2014). Effects of speculation and interest rates in a “carry trade” model of commodity prices. Journal of International Money and Finance, 42(0), 88-112. doi: http://dx.doi.org/10.1016/j.jimonfin.2013.08.006
Garcia, D. (2013). Sentiment during Recessions. The Journal of Finance, 68(3), 1267-1300. doi: 10.1111/jofi.12027
Greer, R. J. (2000). The Nature of Commodity Index Returns. The Journal of Alternative Investments, 3(1), 45-52. doi: DOI: 10.3905/jai.2000.318924
Hanson, K., Robinson, S., & Schluter, G. E. (1993). Sectoral Effects of a World Oil Price Shock: Economy wide Linkages to the Agricultural Sector. Journal of Agricultural and Resource Economics, 18(1), 96-116.
Harri, A., Nalley, L. L., & Hudson, D. (2009). The Relationship between Oil, Exchange Rates, and Commodity Prices. Journal of Agricultural and Applied Economics, 41(2), 501-510.
Kilian, L. (2009). Oil Price Shocks, Monetary Policy and Stagflation. CEPR Discussion Papers, 7324.
Kilian, L., & Hicks, B. (2013). Did Unexpectedly Strong Economic Growth Cause the Oil Price Shock of 2003–2008? Journal of Forecasting, 32(5), 385-394. doi: 10.1002/for.2243
Kilian, L., & Lee, T. K. (2014). Quantifying the speculative component in the real price of oil: The role of global oil inventories. Journal of International Money and Finance, 42(0), 71-87. doi: http://dx.doi.org/10.1016/j.jimonfin.2013.08.005
Kilian, L., & Murphy, D. P. (2014). The Role of Inventories and Speculative Trading in the Global Market for Crude Oil. Journal of Applied Econometrics, 29(3), 454-478. doi: 10.1002/jae.2322
Nazlioglu, S., Erdem, C., & Soytas, U. (2013). Volatility spillover between oil and agricultural commodity markets. Energy Economics, 36(0), 658-665. doi: http://dx.doi.org/10.1016/j.eneco.2012.11.009
Nazlioglu, S., & Soytas, U. (2012). Oil price, agricultural commodity prices, and the dollar: A panel cointegration and causality analysis. Energy Economics, 34(4), 1098-1104. doi: http://dx.doi.org/10.1016/j.eneco.2011.09.008
Pindyck, R. S., & Rotemberg, J. J. (1990). The Excess Co-Movement of Commodity Prices. The Economic Journal, 100(403), 1173-1189. doi: 10.2307/2233966

14
Schnepf, R. (2008). High Agricultural Commodity Prices: What Are the Issues? Hauppauge NY: Nova Science Pub Inc.
Schwert, G. W. (1989). Why Does Stock Market Volatility Change Over Time? The Journal of Finance, 44(5), 1115-1153. doi: 10.1111/j.1540-6261.1989.tb02647.x
Serra, T., Zilberman, D., Gil, J. M., & Goodwin, B. K. (2011). Nonlinearities in the U.S. corn-ethanol-oil-gasoline price system. Agricultural Economics, 42(1), 35-45. doi: 10.1111/j.1574-0862.2010.00464.x
Shiller, R. J. (2000). Irrational Exuberance. Princeton: Princeton University Press. Tetlock, P. C. (2007). Giving Content to Investor Sentiment: The Role of Media in the Stock
Market. The Journal of Finance, 62(3), 1139-1168. doi: 10.1111/j.1540-6261.2007.01232.x Trostle, R. (2008). Global Agricultural Supply and Demand: Factors Contributing to the
Recent Increase in Food Commodity Prices. Washington, DC: Economic Research Service, United States Department of Agriculture.
van der Weide, R. (2002). GO-GARCH: a multivariate generalized orthogonal GARCH model. Journal of Applied Econometrics, 17(5), 549-564. doi: 10.1002/jae.688
Van Duyne, C. (1979). The macroeconomic effects of commodity market disruptions in open economies. Journal of International Economics, 9(4), 559-582. doi: http://dx.doi.org/10.1016/0022-1996(79)90023-0
Yang, F. (2013). Investment shocks and the commodity basis spread. Journal of Financial Economics, 110(1), 164-184. doi: http://dx.doi.org/10.1016/j.jfineco.2013.04.012

15
Annex I. Distributions of commodity prices

16
Annex II.
M GARCH (1, 1) (1980m1-2014m1), (Commodity group 1, vis-à-vis economic fundamentals)
VARIABLES Cocoa Coffee
Cotton
Crude dl(I) dl(TR) dl(M2) dl(SP) dl(X)
Cst -0.003 -0.007* -0.005* 0.006* 0.002*** -0.008 0.002*** 0.01*** 0.0007
(0.003) (0.004) (0.003) (0.004) (0.0003) (0.01) (0.0003) (0.002) (0.001)
b1.11 0.97***
(0.01)
b1.22 0.67***
(0.23)
b1.33 0.81***
B (0.08)
b1.44 0.80***
(0.13)
b1.55 0.85***
(0.04)
b1.66 0.93***
(0.02)
b1.77 0.18
(0.2)
b1.88 0.88***
(0.05)
b1.99 0.98***
(0.02) a1.11 0.12***
(0.03) a1.22 0.37***
(0.07) a1.33 0.40***
(0.07) A a1.44 0.36***
(0.08) a1.55 0.32***
(0.06) a1.66 0.34***
(0.04) a1.77 0.59***
(0.05) a1.88 0.33***
(0.06) a1.99 0.15***
(0.03) Log-likelihood 7279.11 Obs. 409 V Norm χ2(18) (.00)*** Schwarz -35.27
Diagonal BEKK form where A and B are diagonal matrices with
eigenvalues on the diagonal. ( ) , ( ) and is the intercept matrix.
Standard errors in parentheses, *** p<0.01, ** p<0.05, * p<0.1
Note: All commodity prices are in first difference form. dl(I) – log first difference of industrial production (OECD); dl(TR) – log first difference 1 year US treasury rate; dl(M2)-log first difference of US money supply; dl(X)-log first difference of real trade weighted U.S. Dollar index M GARCH (1, 1) (1980m1-2014m1), (group 2, vis-à-vis economic fundamentals) VARIABLES Maize Wheat
P. Oil
Crude dl(I) dl(TR) dl(M2) dl(SP) dl(X)

17
Cst -0.0005 -0.004 0.0005 0.005* 0.001*** -0.006 0.002*** 0.01*** 0.0009
(0.0028) (0.003) (0.004) (0.003) (0.0003) (0.011) (0.0003) (0.002) (0.001)
b1.11 0.85***
(0.09)
b1.22 0.80***
(0.07)
b1.33 0.68***
B (0.08)
b1.44 0.86***
(0.075)
b1.55 0.11***
(0.38)
b1.66 0.90***
(0.02)
b1.77 0.85***
(0.05)
b1.88 0.85***
(0.09)
b1.99 0.97***
(0.03) a1.11 0.24***
(0.06) a1.22 0.34***
(0.06) a1.33 0.26***
(0.11) A a1.44 0.29***
(0.08) a1.55 0.58***
(0.05) a1.66 0.41***
(0.04) a1.77 0.31***
(0.07) a1.88 0.34***
(0.08) a1.99 0.17***
(0.04) Log-likelihood 7279.11 Hosking(20)= 1711.6 [0.03] V Norm χ2(18) (.00)*** Hosking(50)= 3434.3 [0.68] Schwarz -35.5
Index and prices are in natural logs (except for treasury rates). Std. errors in parentheses *** p<0.01, ** p<0.05, * p<0.1
Note: All commodity prices are in first difference form. dl(I) – log first difference of industrial production (OECD); dl(TR) – log first difference 1 year US treasury rate; dl(M2)-log first difference of US money supply; dl(X)-log first difference of real trade weighted U.S. Dollar index
Diagonal BEKK form where A and B are diagonal matrices with eigenvalues on the
diagonal. ( ) , ( ) and is the intercept matrix.

18
Annex III. Linear relationships between US 1-year real Treasury bill rates
COCO (log, real price) 1yr TR ( Right )
7
8
9
0
10
1980 1990 2000 2010
COCO (log, real price) 1yr TR ( Right ) COFFEE (log, real price) 1yr TR (Right)
5
6
0
10
1980 1990 2000 2010
COFFEE (log, real price) 1yr TR (Right)
COTTON (log, real price) 1yr TR (Right)
4
5
6
0
10
1980 1990 2000 2010
COTTON (log, real price) 1yr TR (Right) MAIZE (log, real price) 1yr TR (Right)
5.0
5.5
6.0
0
10
1980 1990 2000 2010
MAIZE (log, real price) 1yr TR (Right)
WHEAT (log, real price) 1yr TR (Right)
5.0
5.5
6.0
6.5
0
10
1980 1990 2000 2010
WHEAT (log, real price) 1yr TR (Right) CRUDE (log, real price) 1yr TR (Right)
3
4
5
0
10
1980 1990 2000 2010
CRUDE (log, real price) 1yr TR (Right)

19
Annex IV.
Impulse responses
Recession probability (R) (R: impulse =0.25): Impulse responses (group 1 commodities)
Credit ease index (F) (F impulse =0.5): Impulse responses (group 1 commodities)
COV (dlPCOCO, dlpPCOTTON) (R: impulse +0.25)
0 20 40 60 80
-5e-5
0
5e-5
COV (dlPCOCO, dlpPCOTTON) (R: impulse +0.25) COV (dlPCOCO, dlPOIL) (R: impulse +0.25)
0 20 40 60 80
-5e-5
0
5e-5
COV (dlPCOCO, dlPOIL) (R: impulse +0.25)
COV(dlPCOFFEE, dlPOIL) (R: imp +0.25)
0 20 40 60 80
0.0001
0.0002
COV(dlPCOFFEE, dlPOIL) (R: imp +0.25) COV(dlPCOTTON, dlPOIL) (R: impulse +0.25)
0 20 40 60 80
0.0000
0.0002
COV(dlPCOTTON, dlPOIL) (R: impulse +0.25)

20
Recession probability (R) (R: impulse =0.25): Impulse responses (group 2 commodities)
Credit ease index (F) (F impulse =0.5): Impulse responses (group 2 commodities)
COV(dlPMAIZMT, dlPOIL) (R: imp +0.25)
0 20 40 60 80
0.0000
0.0002
COV(dlPMAIZMT, dlPOIL) (R: imp +0.25) COV(dlPWHEAMT, dlPPOIL) (R: imp +0.25)
0 20 40 60 80
0.0000
0.0002
COV(dlPWHEAMT, dlPPOIL) (R: imp +0.25)
COV(dlPWHEAMT, dlPOIL) (R: imp +0.25)
0 20 40 60 80
-0.0002
0.0000
0.0002
COV(dlPWHEAMT, dlPOIL) (R: imp +0.25)
COV(dlPPOIL, dlPOIL) (R: imp +0.25)
0 20 40 60 80
0.0000
0.0002
COV(dlPPOIL, dlPOIL) (R: imp +0.25)
COV(dlPMAIZE, dlPOIL) (F: imp +0.5)
0 20 40 60 80
0.00025
0.00050
COV(dlPMAIZE, dlPOIL) (F: imp +0.5) COV(dlPWHEAMT, dlPP.OIL) (F: imp +0.5)
0 20 40 60 80
0.0000
0.0002
0.0004
COV(dlPWHEAMT, dlPP.OIL) (F: imp +0.5)
COV(dlPWHEAMT, dlPOIL) (F: imp +0.5)
0 20 40 60 80
0.00025
0.00050
0.00075 COV(dlPWHEAMT, dlPOIL) (F: imp +0.5) COV(dlPPOIL, dlPOIL) (F: imp +0.5)
0 20 40 60 80
0.00025
0.00050
0.00075
COV(dlPPOIL, dlPOIL) (F: imp +0.5)
21
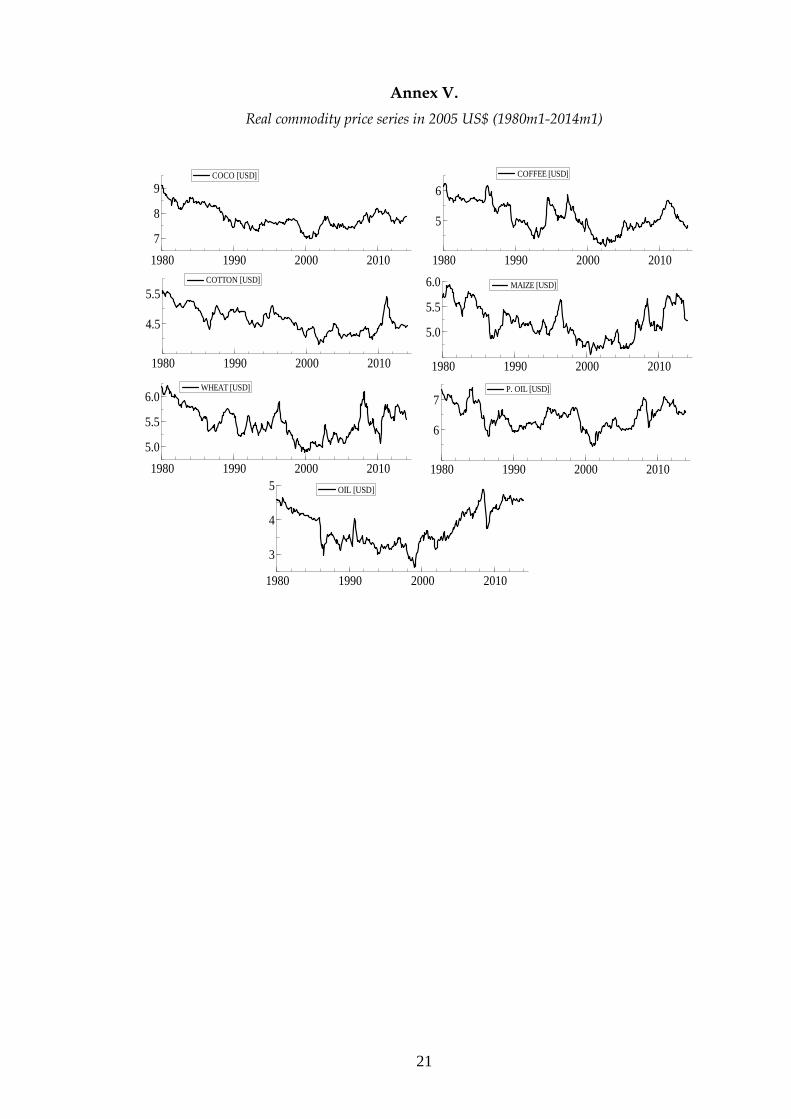
Annex V.
Real commodity price series in 2005 US$ (1980m1-2014m1)
COCO [USD]
1980 1990 2000 2010
7
8
9COCO [USD] COFFEE [USD]
1980 1990 2000 2010
5
6
COFFEE [USD]
COTTON [USD]
1980 1990 2000 2010
4.5
5.5
COTTON [USD] MAIZE [USD]
1980 1990 2000 2010
5.0
5.5
6.0 MAIZE [USD]
WHEAT [USD]
1980 1990 2000 2010
5.0
5.5
6.0WHEAT [USD] P. OIL [USD]
1980 1990 2000 2010
6
7P. OIL [USD]
OIL [USD]
1980 1990 2000 2010
3
4
5 OIL [USD]

22
Annex VI.
Pair-wise conditional covariances against 1 year real treasury rate (US)
0.0
0.5
0
10
1980 1990 2000 2010
NBER Recessions 1yr Real Treasury Rate (US) (Right) COV (dlpCOCO, dlpOIL)
0.00
0.25
0.50
0.75
0
5
10
15
1980 1990 2000 2010
NBER Recessions 1yr Real Treasury Rate (US) (Right ) COV(dlpWHEAMT, dlpOIL)
0.00
0.25
0.50
0.75
0
5
10
15
1980 1990 2000 2010
NBER Recessions 1yr Real Treasury Rate (US) (Right) COV(dlpMAIZE, dlpOIL)
NBER Recessions 1yr Real Treasury Rates (US) (Right) COV(dlpCOTTON, dlpOIL)
0.0
0.5
0
10
1980 1990 2000 2010
NBER Recessions 1yr Real Treasury Rates (US) (Right) COV(dlpCOTTON, dlpOIL)

23
Recent Publications in the Series
nº Year Author(s) Title
204 2014 Mthuli Ncube, Zuzana Brixiová, and
Thierry Kangoye
Skills and Youth Entrepreneurship in Africa :Analysis
with Evidence from Swaziland
203 2014 Ousman Gajigo and Audrey Verdier-
Chouchane
Immigrants, Skills and Wages in The Gambian Labor
Market
202 2014
Jacob Oduor, Moses Muse Sichei,
Samuel Kiplangat Tiriongo and
Chris Shimba
Segmentation and efficiency of the interbank market
and their implication for the conduct of monetary policy
201 2014 John C. Anyanwu Does Intra-African Trade Reduce Youth Unemployment
In Africa?
200 2014 Nadège Désirée Yaméogo
Analysis of Household Expenditures and the Impact of
Remittances and Migration using a latent class model:
the Case of Burkina Faso
199 2014 Emmanuel Mutisya and Masaru
Yarime
Microcredit for the Development of the Bottom of the
Pyramid Segment: Impact of Access to Financial
Services on Microcredit Clients, Institutions and Urban
Sustainability
198 2014 Mthuli Ncube, Zuzana Brixiova, and
Quigwei Meng
Can Intra-Regional Trade Act As a Global Shock
Absorber in Africa?
197 2014 Mthuli Ncube, Basil Jones, and
Zorobabel Bicaba Estimating the Economic Cost of Fragility in Africa
196 2014 Guy Blaise Nkamleu and Bernadette
Dia Kamgnia
Uses and Abuses of Per-diems in Africa: A Political
Economy of Travel Allowances
195 2013 Mthuli Ncube, John Anyanwu and
Kjell Hausken
Inequality, Economic Growth, and Poverty in the Middle
East and North Africa (MENA)
194 2013 Amadou B. Diallo The Impact of Community Development Works
Programs (CWP) on Households’ Wellbeing in Albania
193 2013 Issa Faye, Ousman Gajigo, and
Emelly Mutambatsere
Large Scale Agribusiness Investments and Implications
in Africa: Development Finance Institutions'
Perspectives
24