volcanic risk and insurance - scor.com · fertile soils, abundant mineral resources, and a source...
TRANSCRIPT

1NP SCOR P&C - TECHNICAL NEWSLETTER #40 - JULY 2017SCOR P&C - TECHNICAL NEWSLETTER #40 - JULY 2017
TECHNICAL NEWSLETTER
#40 - July 2017
OVERVIEW
Fertile soils, abundant mineral resources, and a source of geothermal energy makes settlement in the vicinity of a volcano an attractive option. Blessed with access to such resources, economies have grown and prospered and popu-lations have multiplied. Today, there are over 800 million people who live within 100km of an active volcano, which equates to over a tenth of the worlds’ population (Brown et al. 2015). Accordingly, some major world cities are at risk from volcanic hazards, and with continued population growth and city expansion, the risk is increasing. Example scenarios include the potential eruption of Mount Fuji, just 50km from Tokyo, or an eruption of Mount Vesuvius affecting Naples. Lesser-known volcanoes include Popocatepetl 40km from Mexico City: a giant that could devastate one of the densest urban conurbations in the world. Furthermore, the 1.3 million inhabitants of Auckland, New Zealand, live in a city built on top of an active volcanic field.
Figure 1 displays the major population centres which lie within proximity to an active volcano, and this indicates that there are 422 active volcanoes where a population of
greater than 100,000 live within a 30km radius. This clearly shows that large concentrations of risk have developed around volcanoes globally. Yet since extremely large eruptions have not occurred around major exposure centres in recent history, experience is lacking, and culturally we remain severely under-aware and under-prepared for such an event. Instances such as the 1995 eruption of Soufrière Hills, Montserrat expose this lack of awareness – according to scholars, the majority of the population of Montserrat had no knowledge that they were living in proximity to a volcano before the eruption devastated over half of the island (Donovan and Oppenheimer, 2013). However even when areas have had a history of volcanism, memories are short and our willingness to inhabit and develop eco-nomically in volcanically at-risk areas exemplifies a societal disconnect with volcanic hazard.
In the 21st century, volcanic risk must be viewed through a lens that is not confined to local impacts. Volcanoes can also have climatological repercussions thousands of kilometres from the source as the chemical composition of volcanic emissions wreak havoc with atmospheric properties. The eruptions of Tambora, Indonesia in 1815 and Laki, Iceland in 1783 for example both had overwhelming impacts on European weather and climate, leading to extensive agri-cultural damage. Taking a more recent example however, the modest April 2010 eruption of Eyjafjallajökull reiterates that one need not be located in the immediate vicinity of an eruption in order be affected by one. Over 100,000 flights were grounded, causing an impact of USD 4.7 billion on global GDP as widespread economic and supply chain disruption was felt across Europe (Alexander, 2013; Oxford Economics, 2010). Although insured losses were low overall, totalling approximately USD 100 million, as we continue to increasingly rely on vast supply chains and networks across a rapidly globalizing world, future disruption has the potential to be large.
Given this, SCOR has produced this technical newsletter with the aim of outlining the major areas at risk from volcanoes with a specific insurance focus in mind.
VOLCANIC RISK AND INSURANCEPast, present and future scenarios
FIGURE 1: MAP SHOWING ACTIVE VOLCANOES WITH > 100,000 PEOPLE LIVING WITHIN A 30KM RADIUS
Source: created using Smithsonian Volcano Database

32 SCOR P&C - TECHNICAL NEWSLETTER #40 - JULY 2017SCOR P&C - TECHNICAL NEWSLETTER #40 - JULY 2017
TAMBORA 1815
1 Recorded history begins about 6,000 years ago, with the Egyptian Pharaohs.
The largest known eruption in recorded history1. was the eruption of Tambora, Indonesia in 1815. Ranked as a Volcanic Explosivity Index 7 (VEI 7) eruption according to the Volcanic Explosivity Index (figure. 2), the eruption plunged the surrounding region into complete darkness as a gigantic ash cloud spread over an area of 1 million square kilometres, a land area more than 1.5 times the total land area of France. Areas within a 600km radius remained pitch-black for over 24 hours (Oppenheimer, 2011). At the same time, the island of Sumbawa was overwhelmed by devastat-ing pyroclastic flows cascading down the volcano’s flanks, and the discharge of material into the oceans generated tsunami waves that enveloped the Sanggar peninsular and parts of eastern Java with waves of up to 4m. The damage was unimaginable, leaving empty villages, and estimates of human tragedy across the Indonesian islands reach as high as 117,000 (Petroeschevsky, 1949).
In the meantime, the 50 million tonnes of sulphur dioxide contained within the 43km high eruption plume was beginning to have impacts on a global scale. The explosive reach of powerful volcanic eruptions means that eruption plumes have the potential to reach tens of kilometres up into the air and this allows volcanic emissions to rise and impact atmospheric dynamics. Principally, when sulphur dioxide is released in the cocktail of gases that the volcano emits, it reacts with water vapour in the atmosphere to form sulphuric acid particulates. When significant concen-trations of these particulates collect in the atmosphere
they bind together creating sulphuric aerosol, and since these particulates are large, they block sunlight in a process termed ‘backscattering’ and reduce the transmission of solar radiation to the Earth’s surface. A reduction in solar radiation thereby promotes cooling and subsequently this can lead to unusual climate anomalies.
Importantly, the explosivity of the eruption is vital in deter-mining the extent of sulphuric aerosol created. To have the greatest effect on backscattering solar radiation, sulphur must reach the upper levels of the atmosphere (Figure 3), and this only occurs if the plume height is large enough, as was the case with Tambora. However, if the eruption column is only a couple of kilometres high, the sulphuric aerosol may only reach the lowest level of the atmosphere: the troposphere, and as a result be rapidly mitigated by deposition from rain. Therefore higher eruption plumes from more explosive eruptions allow the gaseous mixture to reach higher layers of the atmosphere such as the strato-sphere. At this level the aerosol is able to remain aloft for a sufficient time to have an impact on radiative forcing, as well as being more susceptible to spreading and transport around the globe.
STRATOSPHERE (more stable)
TROPOSPHERE (less stable)
Ash and other gaseswashed out by rain
Deposition
Sunlight reaching troposphereSmall scaleeruptionSO2 HCI
Ash
STRATOSPHERE (more stable)
TROPOSPHERE (less stable)
Cooling
Reduced sunlight reaching troposphere
Remove processes
Strongeruption
SO2
Absorption of solar radiation
HCI
Ash
(Sulphate aerosol)SO2 H2SO4
Water + Sunlight
Increased albedo
FIGURE 2: VEI SCALEadapted from Newhall and Self (1982)
VEI/Description Plume Height Volume Classification Frequency Example
0 Non-explosive <100m 1,000m³ Hawaiian Daily Kilauea, Hawaii
1 Gentle 100-1,000m 10,000m³Hawaiian/Strombolian
Daily Stromboli, Italy
2 Explosive 1-5km 1,000,000m³Strombolian/Vulcanian
WeeklySinabung, Indonesia (2010)
3 Severe 3-15km 10,000,000m³ Vulcanian YearlySoufrière Hills, Montserrat (1995)
4 Cataclysmic 10-25km 100,000,000m³Vulcanian/Plinian
10 yearsEyjafjallajökull, Icleand (2010)
5 Paroxysmal >25km 1km³ Plinian 100 yearsMount St Helens, USA (1980)
6 Colossal >25km 10km³Plinian/Ultra-Plinian
100 yearsKrakatoa, Indonesia (1883)
7 Supercolossal >25km 100km³ Ultra-Plinian 1,000 yearsTambora, Indonesia (1815)
8 Megacolossal >25km 1000km³ Ultra-Plinian 10,000 yearsToba, Indonesia (74,000 BC) FIGURE 3: CLIMATOLOGICAL EFFECTS OF VOLCANIC ERUPTIONS
source: Hong Kong Observatory
32 SCOR P&C - TECHNICAL NEWSLETTER #40 - JULY 2017SCOR P&C - TECHNICAL NEWSLETTER #40 - JULY 2017
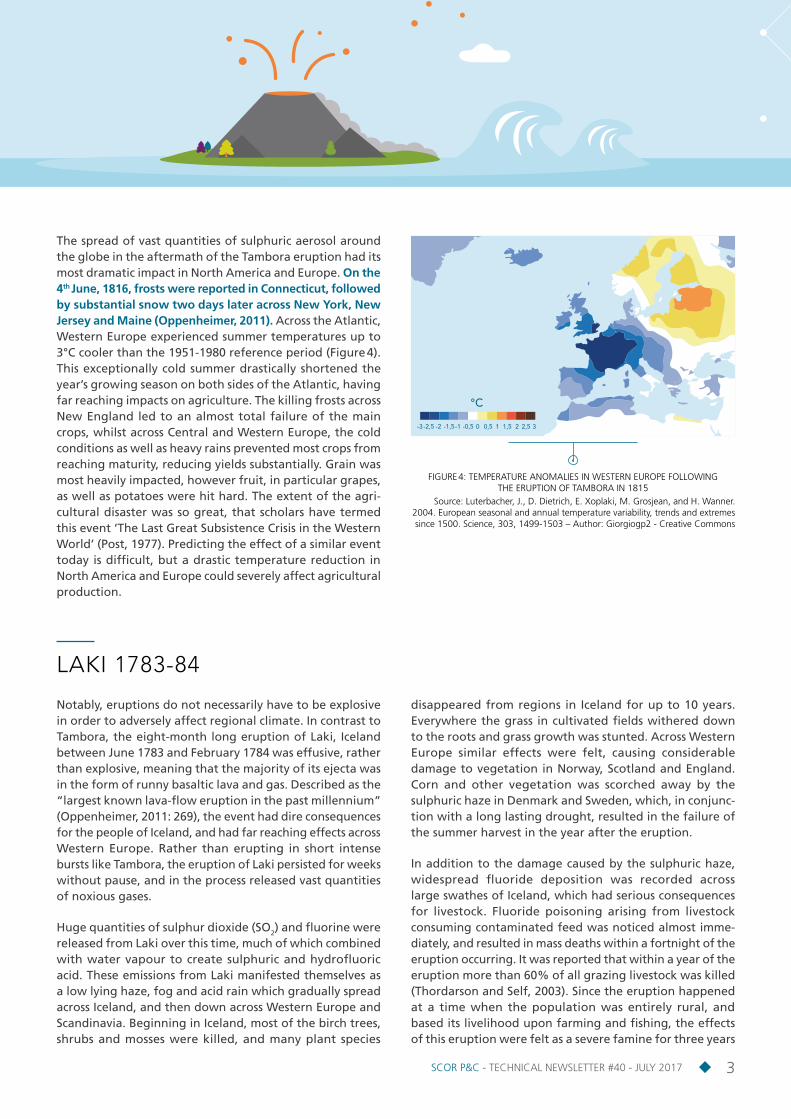
The spread of vast quantities of sulphuric aerosol around the globe in the aftermath of the Tambora eruption had its most dramatic impact in North America and Europe. On the 4th June, 1816, frosts were reported in Connecticut, followed by substantial snow two days later across New York, New Jersey and Maine (Oppenheimer, 2011). Across the Atlantic, Western Europe experienced summer temperatures up to 3°C cooler than the 1951-1980 reference period (Figure 4). This exceptionally cold summer drastically shortened the year’s growing season on both sides of the Atlantic, having far reaching impacts on agriculture. The killing frosts across New England led to an almost total failure of the main crops, whilst across Central and Western Europe, the cold conditions as well as heavy rains prevented most crops from reaching maturity, reducing yields substantially. Grain was most heavily impacted, however fruit, in particular grapes, as well as potatoes were hit hard. The extent of the agri-cultural disaster was so great, that scholars have termed this event ‘The Last Great Subsistence Crisis in the Western World’ (Post, 1977). Predicting the effect of a similar event today is difficult, but a drastic temperature reduction in North America and Europe could severely affect agricultural production.
LAKI 1783-84
Notably, eruptions do not necessarily have to be explosive in order to adversely affect regional climate. In contrast to Tambora, the eight-month long eruption of Laki, Iceland between June 1783 and February 1784 was effusive, rather than explosive, meaning that the majority of its ejecta was in the form of runny basaltic lava and gas. Described as the “largest known lava-flow eruption in the past millennium” (Oppenheimer, 2011: 269), the event had dire consequences for the people of Iceland, and had far reaching effects across Western Europe. Rather than erupting in short intense bursts like Tambora, the eruption of Laki persisted for weeks without pause, and in the process released vast quantities of noxious gases.
Huge quantities of sulphur dioxide (SO2) and fluorine were released from Laki over this time, much of which combined with water vapour to create sulphuric and hydrofluoric acid. These emissions from Laki manifested themselves as a low lying haze, fog and acid rain which gradually spread across Iceland, and then down across Western Europe and Scandinavia. Beginning in Iceland, most of the birch trees, shrubs and mosses were killed, and many plant species
disappeared from regions in Iceland for up to 10 years. Everywhere the grass in cultivated fields withered down to the roots and grass growth was stunted. Across Western Europe similar effects were felt, causing considerable damage to vegetation in Norway, Scotland and England. Corn and other vegetation was scorched away by the sulphuric haze in Denmark and Sweden, which, in conjunc-tion with a long lasting drought, resulted in the failure of the summer harvest in the year after the eruption.
In addition to the damage caused by the sulphuric haze, widespread fluoride deposition was recorded across large swathes of Iceland, which had serious consequences for livestock. Fluoride poisoning arising from livestock consuming contaminated feed was noticed almost imme-diately, and resulted in mass deaths within a fortnight of the eruption occurring. It was reported that within a year of the eruption more than 60% of all grazing livestock was killed (Thordarson and Self, 2003). Since the eruption happened at a time when the population was entirely rural, and based its livelihood upon farming and fishing, the effects of this eruption were felt as a severe famine for three years
-3 -2,5 -2 -1,5-1 -0,5 0 0,5 1 1,5 2 2,5 3
°C
FIGURE 4: TEMPERATURE ANOMALIES IN WESTERN EUROPE FOLLOWING THE ERUPTION OF TAMBORA IN 1815
Source: Luterbacher, J., D. Dietrich, E. Xoplaki, M. Grosjean, and H. Wanner. 2004. European seasonal and annual temperature variability, trends and extremes since 1500. Science, 303, 1499-1503 – Author: Giorgiogp2 - Creative Commons

54 SCOR P&C - TECHNICAL NEWSLETTER #40 - JULY 2017SCOR P&C - TECHNICAL NEWSLETTER #40 - JULY 2017
following the event. Estimates say that approximately 20% of the Icelandic population died.
The eruption started in June 1783, and the following months were climatically anomalous. The winter after the eruption was one of the most severe winters ever recorded in Europe and North America, and this winter began extremely early, with temperatures dropping as prematurely as September. Thordarson and Self (2003) state that the aerosols emitted from the Laki eruption disrupted the thermal balance of the Arctic regions, leading to a mean annual surface cooling across North America and Europe of -1.3 degrees Celsius. As a result, the severe winter led to very poor harvests across these continents. The lemon crop in Italy was completely destroyed by a particularly severe frost on
New Year’s Day, and similar reports of killing frosts were reported across Munich, Prague, and parts of Romania and Moldova (Thordarson and Self, 2003). In tandem, the cold temperatures led to a widespread freezing of waterways and the accumulation of vast amounts of snow in many places. Then in the spring, a series of sudden thawing events led to widespread flooding in many European cities, including Vienna, Paris, Dresden, Bratislava and Prague (Oppenheimer, 2011). The River Vltava in Prague rose by four metres in the space of 12 hours, and the city suffered the most catastrophic flood ever recorded. Moreover, the flooding of the Elbe in Dresden destroyed over a hundred ships that were under construction at the time (Thordarson and Self, 2003).
HISTORICAL LOSSES AND RELATIVE INTENSITIES
The events described above both happened a little over 200 years ago, and therefore data on insured losses is non-existent. However, the extent of their impacts were so large compared to experiences of contemporary eruptions that an as-if loss today would surely be significant. As a guide, it is instructive to compare the intensities of Tambora and Laki with those of the eruptions we have experienced over recent history. Figure 5 lists the 10 costliest eruptions that have occurred over the last 40 years, and clearly insured losses have been low, in particular when compared to losses from other perils such as hurricanes and earthquakes, where insured losses frequently reach into the billions. Nonetheless, when comparing the VEIs of the eruptions in the table, in general (with the exception of Pinatubo), such events are modest in comparison to the events of Tambora and Laki. The majority of events over the last 40 years have been in the range of VEI 3-4, and therefore experience is lacking when it comes to larger VEI events. Significantly, the Volcanic Explosivity Index is based on a logarithmic scale, and each unit therefore represents a ten-fold increase in magnitude. Hence an analogue of Tambora today would be 1000 times more powerful than the eruption of Eyjafjallajökull in 2010. Since the magnitude of these events are many times larger than most of those experienced over the past 40 years, if a VEI 6 or 7 event were to occur in close proximity to a large exposure centre we can be almost certain that insured losses would be significant. Consequently, it should be of interest for insurers to quantify the likelihood of such an event happening in the near future.
Since 1968 the Smithsonian Institution has been helping to advance our knowledge of historical eruptive activity through the ‘Global Volcanism Program’ (GVP). This initiative, in collaboration with the United States Geological Survey (USGS), has produced a comprehensive database of global volcanic activity, which now dates back 10,000 years. Plotting the number of eruptions from this database by VEI category allows us to visualise this frequency-severity relationship, yet also gives an indication of approximate
FIGURE 5: TOP 10 COSTLIEST VOLCANIC ERUPTIONS 1980 - 2010 (USD MILLIONS)
Source: Oxford Economics, EM-DAT, Munich Re, Smithsonian Institution, USGS, Smolka and Käser 2015, Daniell, 2011
VEI Year EruptionOverall Losses (original values)
Insured Losses (original values)
Fatalities
4 2010 Eyjafjallajökull, Iceland 4,700 97 n/a
1 1991 Unzen, Japan 1,500 130 43
5 1980 Mount St Helens, USA 860-1,000 27-31 57
6 1991 Pinatubo, Philippines 750 70 847
3 1995 Soufriere Hills, Montserrat 330-400 100 19
4 2010 Merapi, Indonesia 380 n/a 353
4 1994Rabaul, Papua New Guinea
300 66 5
3 1985Nevado del Ruiz, Colombia
230 n/a 20,000
3 1983 Gamalama, Indonesia 150 n/a n/a
3 2006 Tungurahua, Ecuador 150 n/a 6
7 1815 Tambora Unknown Unknown > 71,000
6 1783 Laki Unknown Unknown > 30,000

54 SCOR P&C - TECHNICAL NEWSLETTER #40 - JULY 2017SCOR P&C - TECHNICAL NEWSLETTER #40 - JULY 2017
recurrence interval for these particular events. Based on the last 10,000 years of eruptive history then, we can see
that VEI 4 events such as Eyjafjalljökull occur approximately every 20 years, whereas very large eruptions at the VEI 6 level occur approximately every 200 years.
WHERE WILL THE NEXT BIG EVENT BE?
EUROPE
With 1 million inhabitants located just 5.6 miles east of Mount Vesuvius, the city of Naples, Italy is cited as Europe’s most at-risk city from a volcanic eruption. Historically famous for the eruption in 79AD which destroyed the cities of Pompeii and Herculaneum, the level of risk that scientists attempt to communicate does not seem to resonate in the minds of the inhabitants today. A local study of volcanic risk perception in the area demonstrated that several other social, economic and security-related issues ranked as higher concerns in people’s minds when compared to volcanic risk, since conceptually such a catastrophic event is hard to envisage (Barberi et al., 2008). Yet studies argue that even a modest eruption of Mount Vesuvius could result in extensive economic loss. For instance, the Willis Research Network estimates that losses could reach approximately USD 24 billion, with insured loss making up a significant proportion of this (Spence et al., 2010). Two thirds of this would be attributed to residential property damage, with the rest coming from non-residential property, business, agriculture, motor, aviation, as well as anticipated long term health care costs.
Notably, Mount Vesuvius is not the only volcanic threat to the population of Naples. Bordering Naples on the western side is the Campi Flegrei, a large volcanic complex spanning 7 miles in diameter. In contrast to the towering mountain of Vesuvius, Campi Flegrei directly translates as ‘volcanic fields’, and respectively the area consists of numerous craters and volcanic edifices pockmarking the landscape. Scholars know that the area is capable of producing extremely large eruptions, for instance, 200,000 years ago, Campi Flegrei was responsible for a super eruption thought to be the largest volcanic episode Europe has ever experienced, and more recently an eruption around 40,000 years ago has been put forward as causal factor behind the extinction of the Neanderthals (Golovanova et al. 2009). Concerning scientists now are the signs of potential re-activity which have been ongoing since the 1950s. Frequent small tremors, significant episodes of ground uplift (up to 3 metres in some areas), and visible gas emissions all point towards movement of magma under the surface. A study from 2016 argues that Campi Flegrei may be reaching ‘critical degassing pressure’, a threshold which once passed could culminate in an explosive and devastating eruption (Chiodini, 2016).
VEI No. of eruptions globally Historic frequency (years)
VEI 2 3718 3
VEI 3 1106 9
VEI 4 502 20
VEI 5 178 56
VEI 6 52 192
VEI 7 8 1250
VEI 8 0 n/aVEI 2 VEI 3 VEI 4 VEI 5 VEI 6 VEI 7 VEI
1500
2000
2500
3000
3500
4000
No. of eruptions globally
3718
1106
502
17852 8 0
1000
500
0
FIGURE 6: GRAPH AND TABLE SHOWING FREQUENCY AND INTENSITY OF VOLCANIC ERUPTIONS OVER THE LAST 10,000 YEARSSource: created using Smithsonian Volcano Database
76 SCOR P&C - TECHNICAL NEWSLETTER #40 - JULY 2017SCOR P&C - TECHNICAL NEWSLETTER #40 - JULY 2017
ASIA
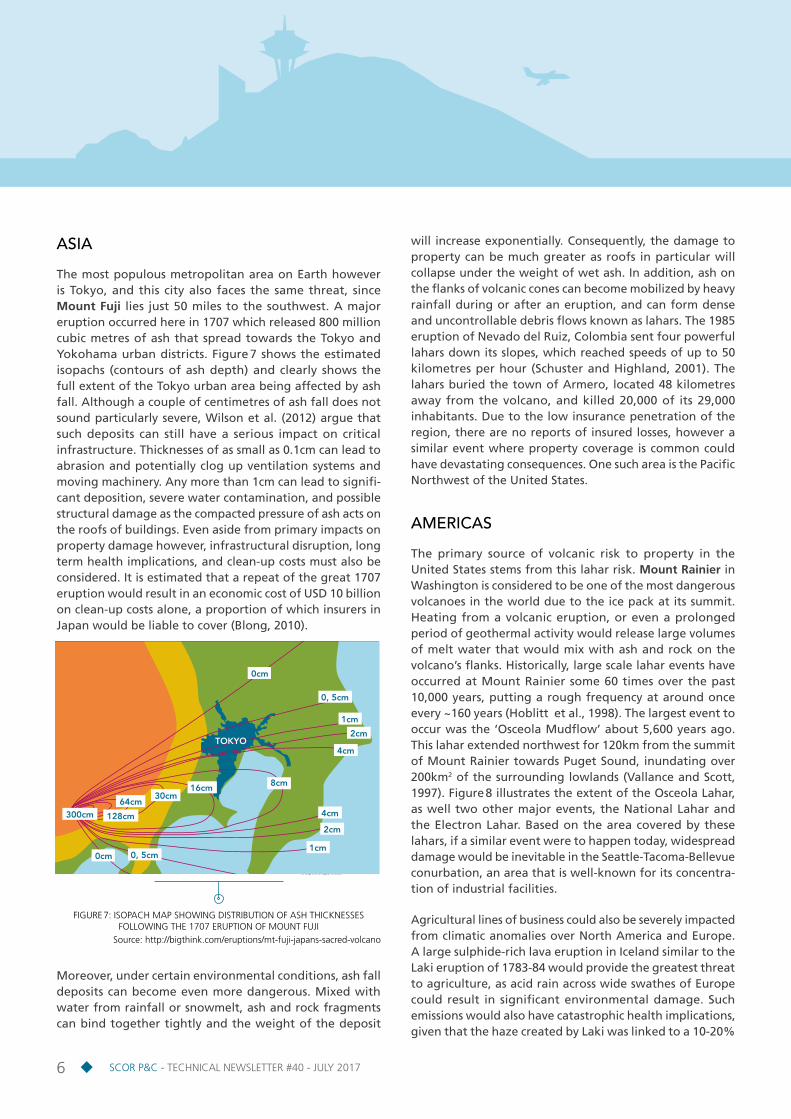
The most populous metropolitan area on Earth however is Tokyo, and this city also faces the same threat, since Mount Fuji lies just 50 miles to the southwest. A major eruption occurred here in 1707 which released 800 million cubic metres of ash that spread towards the Tokyo and Yokohama urban districts. Figure 7 shows the estimated isopachs (contours of ash depth) and clearly shows the full extent of the Tokyo urban area being affected by ash fall. Although a couple of centimetres of ash fall does not sound particularly severe, Wilson et al. (2012) argue that such deposits can still have a serious impact on critical infrastructure. Thicknesses of as small as 0.1cm can lead to abrasion and potentially clog up ventilation systems and moving machinery. Any more than 1cm can lead to signifi-cant deposition, severe water contamination, and possible structural damage as the compacted pressure of ash acts on the roofs of buildings. Even aside from primary impacts on property damage however, infrastructural disruption, long term health implications, and clean-up costs must also be considered. It is estimated that a repeat of the great 1707 eruption would result in an economic cost of USD 10 billion on clean-up costs alone, a proportion of which insurers in Japan would be liable to cover (Blong, 2010).
Moreover, under certain environmental conditions, ash fall deposits can become even more dangerous. Mixed with water from rainfall or snowmelt, ash and rock fragments can bind together tightly and the weight of the deposit
will increase exponentially. Consequently, the damage to property can be much greater as roofs in particular will collapse under the weight of wet ash. In addition, ash on the flanks of volcanic cones can become mobilized by heavy rainfall during or after an eruption, and can form dense and uncontrollable debris flows known as lahars. The 1985 eruption of Nevado del Ruiz, Colombia sent four powerful lahars down its slopes, which reached speeds of up to 50 kilometres per hour (Schuster and Highland, 2001). The lahars buried the town of Armero, located 48 kilometres away from the volcano, and killed 20,000 of its 29,000 inhabitants. Due to the low insurance penetration of the region, there are no reports of insured losses, however a similar event where property coverage is common could have devastating consequences. One such area is the Pacific Northwest of the United States.
AMERICAS
The primary source of volcanic risk to property in the United States stems from this lahar risk. Mount Rainier in Washington is considered to be one of the most dangerous volcanoes in the world due to the ice pack at its summit. Heating from a volcanic eruption, or even a prolonged period of geothermal activity would release large volumes of melt water that would mix with ash and rock on the volcano’s flanks. Historically, large scale lahar events have occurred at Mount Rainier some 60 times over the past 10,000 years, putting a rough frequency at around once every ~160 years (Hoblitt et al., 1998). The largest event to occur was the ‘Osceola Mudflow’ about 5,600 years ago. This lahar extended northwest for 120km from the summit of Mount Rainier towards Puget Sound, inundating over 200km2 of the surrounding lowlands (Vallance and Scott, 1997). Figure 8 illustrates the extent of the Osceola Lahar, as well two other major events, the National Lahar and the Electron Lahar. Based on the area covered by these lahars, if a similar event were to happen today, widespread damage would be inevitable in the Seattle-Tacoma-Bellevue conurbation, an area that is well-known for its concentra-tion of industrial facilities.
Agricultural lines of business could also be severely impacted from climatic anomalies over North America and Europe. A large sulphide-rich lava eruption in Iceland similar to the Laki eruption of 1783-84 would provide the greatest threat to agriculture, as acid rain across wide swathes of Europe could result in significant environmental damage. Such emissions would also have catastrophic health implications, given that the haze created by Laki was linked to a 10-20%
0cm
0cm
0, 5cm
0, 5cm
16cm30cm
64cm
128cm300cm
1cm
1cm
2cm
2cm
4cm
8cm
4cm
TOKYO
FIGURE 7: ISOPACH MAP SHOWING DISTRIBUTION OF ASH THICKNESSES FOLLOWING THE 1707 ERUPTION OF MOUNT FUJI
Source: http://bigthink.com/eruptions/mt-fuji-japans-sacred-volcano

76 SCOR P&C - TECHNICAL NEWSLETTER #40 - JULY 2017SCOR P&C - TECHNICAL NEWSLETTER #40 - JULY 2017
increase in mortality rates across Europe at the time. High levels of sulphuric acid ingestion can cause serious respira-tory difficulties, and researchers today forecast that a similar injection of pollutants would result in an additional 142,000 deaths from cardiopulmonary problems alone (Schmidt et al. 2011). Compounding the health implications would be the injection of ash into the troposphere. The last eruption of Eyjafjallajökull before 2010 lasted from December 1821 until January 1823, adding volcanic ash to the troposphere for well over a year. Had a similar magnitude event happened in 2010, flight routes over Europe and North America would have disrupted for 13 months rather than 7 days, causing supply chain disruption on an unimaginable scale (Sammonds et al., 2010). Consequently, it is clear that the 2010 Eyjafjallajökull eruption was just an indication of what Icelandic volcanism is capable of (Oppenheimer, 2011).
SPECIFIC INSURANCE ISSUES
Volcanic eruptions are a multi-hazard peril, meaning that just one eruption can give rise to multiple cascading events, often over an extended time span. Examples include volcanic ash, pyroclastic flows, harmonic tremors (small earthquakes), flank collapses, lahars, tsunamis, gas emissions and regional or even global climate anomalies. Eruption styles can also differ greatly depending on the chemical properties of the magma and the intensity of the eruption in question. This was highlighted by the greatly differing characteristics of Tambora (silica rich ‘sticky’ magma) and Laki (silica poor, runny magma), which were explosive and effusive respec-tively. Consequently there is no ‘standard’ type of volcano with one clear and expected set of hazard parameters. This makes volcanoes unusual in comparison to other perils like hurricanes and earthquakes where the associated hazards are much easier to quantify.
Classification can cause issues when trying to determine the driver of loss. Volcanic eruptions can give rise to multiple hazard events, i.e. by erupting multiple times over a period months or even years; and giving rise to ash fall, lahars and then climate anomalies; all of which can produce economic damage and (potentially) insured loss. Complexities may also arise over excess of loss reinsurance contracts with specific hours clauses. Moreover, Blong et al. (2017) identified that for contracts that do specify volcano coverage, policy wordings can often be inconsistent. Clauses including ‘volcanic activity’, ‘volcanic eruption’ and ‘losses
caused by volcano’ for example, can each be interpreted in different ways. Despite these complications however, insurance coverage for volcanic eruptions does exist and is often included as an add-on to earthquake/other natural catastrophe peril policies for residential lines. Volcanic perils are also covered under Property/ Industrial All Risks primary policies.
Within SCOR a survey was conducted in order to determine the extent to which volcanic eruptions were included as standard coverage across different regions of the business. Based on this investigation it became clear that the inclusion of volcanic eruption as part of a standard property/fire policy is region specific. In the majority of cases, such as in France, Japan, the United States, the Caribbean, and Central America, volcanic eruption is included as part of a standard Nat Cat coverage. On the other hand, locations where greater awareness of volcanic risk by industry exists, such as Italy, the coverage is not included as standard and indeed is difficult to secure for residential lines. A volcanic perils extension to the earthquake coverage can be purchased for both industrial and commercial lines. For areas where coverage is available, there was however no distinction between the near-field (such as heavy ash fall, pyroclastic flows and lahars) and far-field (lighter ash fall, climatic consequences) impacts that are attributable to volcanic eruptions.
FIGURE 8: MAP SHOWING EXTENT OF LAHARS FROM MOUNT RAINIER Source: USGS
En cours
Green river
Puyallup RiverWhite R.
Car bon R iver
White River
Cowlitz River
Nisqually River
Kent
Tacoma
Auburn Osceola Lahar
Puyallup
Summer Enumclaw
Buckley Greenwater
Mount Rainier14,410 ft
Orting
PugetSound
Puget Sound Lowland
Puget Sound Lowland RANGE
CASCADE
Sunrise
National
National Lahar
Electron Lahar
Inlets of Puget Sound
Source of Osceola Lahar
Cone of Mount Rainer
Margin of PugetSound lowland
Green river
Puyallup River
White R.
Car bon R iver
White River
Cowlitz River
Nisqually River
Kent
Tacoma
Auburn Osceola Lahar
Puyallup
Summer Enumclaw
Buckley Greenwater
Mount Rainier14,410 ft
Orting
PugetSound
Puget Sound Lowland
Puget Sound Lowland RANGE
CASCADE
Sunrise
National
National Lahar
Electron Lahar
Inlets of Puget Sound
Source of Osceola Lahar
Cone of Mount Rainer
Margin of PugetSound lowland

8SCOR P&C - TECHNICAL NEWSLETTER #40 - JULY 2017
GEORGE COOPERCatastrophe Risk AnalystSCOR Global P&C
This article is written by :
For more information, please contact our team:
Dr. Nigel Winspear, Head of Model Development & Evaluation
Dr. Cameron Rye, Senior Analyst - Model Development & Evaluation
Thanks also to:
Phil Holt, Senior Manager, Catastrophe Risk Modelling
for his kind review of prior versions and to
Henry Bovy, Head of Risk Modelling and Pricing
for his input on global insurance coverage.
Main author:
PAUL NUNNHead of Cat Risk Modelling SCOR Global P&C
PLEASE FEEL FREE TO VISIT US AT SCOR.COM
SCOR P&C5, avenue Kléber - 75795 Paris Cedex 16 [email protected]
TO GET THE FULL RANGE OF TECHNICAL NEWSLETTERS, PLEASE CONTACT [email protected]
Editor: SCOR P&C Strategy & Development ISSN: 1967-2136
No part of this publication may be reproduced in any form without the prior permission of the publisher. SCOR has made all reasonable efforts to ensure that information provided through its publications is accurate at the time of inclusion and accepts no liability for inaccuracies or omissions.
© July 2017 - Design and production: Periscope
CONCLUSION
It is clear from the case studies discussed above that a major volcanic eruption close to a large population centre has the potential to cause significant damage and cleanup costs, a significant proportion of which in certain cases may be insured and reinsured. Losses can arise not only from property damage but also from lines of business such as aviation and agriculture that are not directly exposed to the local effects of the eruption. Nonetheless, the lack of a substantial historical record of insured losses in the past two centuries provides very little obvious incentive for research and development in this area in most countries.
We need to remember, however, that two very significant eruptions occurred only 233 years ago (Laki, 1783-4) and 202 years ago (Tambora, 1815), with major respective regional and global impacts. Oppenheimer (2015) states that “the future will undoubtedly see eruptions as large as Tambora, and a good bit larger still”. Will the insurance and reinsur-ance industry will be prepared for the losses that will result when the next major event happens?