voltage sag analysis and determination of the...
TRANSCRIPT
3
VOLTAGE SAG ANALYSIS AND DETERMINATION OF THE SOURCE OF
DISTURBANCE IN INDUSTRIAL SECTOR
FARALYNA AISYAH BINTI ABDUL RASID
A project report submitted in partial fulfilment of the
requirements for the award of the degree of
Master of Electrical (Power)
Faculty of Electrical Engineering
Universiti Teknologi Malaysia
JANUARY 2014
4
To my beloved mother and father

5
ACKNOWLEDGEMENT
In the name of ALLAH S.W.T., the Most Compassionate, the Most Merciful.
I am indebted to so many people for the completed the final year project report. My first
gratitude goes to my supervisor, Dr. Dalila binti Mat Said for her kind introduction to
how this Master project report will be, also for her support, guidance, encouragement,
critics and friendship throughout the year. Without her continuous support, this thesis
will not be able to be the same as presented here.
I also indebted to postgraduate friends, classmate and everyone for their kind
word of encouragement and professional advice on many of the chapter of this final
Master project report. A special thanks to the librarians at Universiti Teknologi Malaysia
(UTM) and the National Library of Malaysia for their assistance in supplying relevant
literature.
Lastly, my special gratitude goes to a group of special people who kindness and
emotional support we have often taken for granted: our parents, siblings and the whole
clan whose overflowing love we have greatly benefited from. Thank you.

6
ABSTRACT
Power quality analysis has become one of the main objective of study in electric
power systems. Voltage sag is a phenomena where voltage decrease to 90% to 10% of
the rated voltage, with a typical duration of 0.5 to 30 cycle. The purpose of this study is
to analyze the voltage sag events in order to identify the source and the cause of voltage
sag. Voltage sag is a power quality problem that seldom occurred, but once it occur, it
will cause severe problems, such as industrial processes malfunction, producing great
economic losses and reduce the power quality. To improve power quality, it is important
to identify the source of disturbance. The analysis performed by using the data of
voltage sag event shows that the major source of the voltage sag is because of the
external factor, while the cause of the voltage sag are mainly by the short circuit. The
mitigation technique shall be propose along the analysis, because the effect of the
voltage sag can be reduce when applying the mitigation technique such as by using an
Uninterruptable Power Supply (UPS) and Voltage Stabilizer at both utility and customer
side.

7
ABSTRAK
Analisis kualiti kuasa menjadi salah satu objektif penting dalam pembelajaran
sistem kuasa elektrik.. Voltan lendut ialah suatu fenomena di mana nilai voltan jatuh
kepada 90% sehingga 10% daripada nilai sebenar voltan, dengan masa biasa berlaku
voltan lendut adalah dalam tempoh 0.5 sehingga 30 kitaran. Tujuan kajian ini
dilaksanakan adalah untuk mengkaji tentang aktiviti voltan lendut, supaya dapat
mengenal pasti bahan penyebab dan punca berlakunya voltan lendut tersebut. Voltan
lendut adalah masalah kualiti kuasa yang jarang berlaku, tetapi, apabila ianya berlaku, ia
akan menyebabkan beberapa masalah, seperti operasi di industri tidak dapat berfungsi,
ini menyebabkan kerugian besar ekonomi dan mengurangkan kualiti kuasa. Untuk
memperbaiki masalah kualiti kuasa, adalah sangat penting untuk mengenalpasti
penyebab kepada gangguan tersebut. Analisis yang dilaksanakan dengan menggunakan
data voltan lendut menunjukkan bahawa faktor luaran merupakan penyebeb utama
kepada gangguan kuasa, manakala punca utama berlakunya voltan lendut ini adalah
kerana litar pintas. Kaedah pencegahan voltan lendut perlu diperkenalkan seiring dengan
analisis yang dilakukan, kerana kesan daripada aktiviti voltan lendut dapat dikurangkan
apabila teknik pemulihan seperti pengunaan Uninterruptable Voltage Supply (UPS
system) dan penstabil voltan (Voltage Stabilizer) digunakan di kedua-dua bahagian iaitu
pada pembekal kuasa dan pengguna kuasa.
8
TABLE OF CONTENTS
CHAPTER TITLE PAGE
DECLARATION ii
DEDICATION iii
ACKNOWLEDGEMENT iv
ABSTRACT v
ABSTRAK vi
TABLE OF CONTENTS vii
LIST OF TABLES xii
LIST OF FIGURES xiv
1 INTRODUCTION 1
1.1 Introduction 1
1.2 Project background 4
1.3 Problem Statement 5
1.4 Objectives 6
1.5 Scope of Work/Limitation 6
2 LITERATURE REVIEW 7
2.1 Introduction 7
2.2 Voltage tolerance curve 8
2.2.1 ITIC curve 8
2.2.2 CBEMA curve 10
2.2.3 SEMI F47 11
2.2.4 IEC 61000-4-34 12
2.3 Common cause of the voltage sags 14

9
2.3.1 Due to the short circuit 14
2.3.2 Due to the transformer energizing 15
2.3.3 Due to the induction motor starting 15
2.4 Summary of the past works 16
2.5 Losses cause by voltage sag problem 17
2.5.1 Lost in term of cost (RM) 18
3 METHODOLOGY 20
3.1 Introduction 20
3.2 Flow of methodology 21
3.2.1 Literature review/background of study 21
3.2.2 Data collection 22
3.2.3 Data analysis 22
3.3 Cause of voltage sag : Detection Method 25
4 RESULTS 28
4.1 Introduction 28
4.1.1 External factor and internal factor 29
4.2 Voltage sag analysis 30
4.2.1 Company A 30
4.2.1.1 Event number : 25 31
4.2.1.2 Event number : 28 33
4.2.1.3 Event number : 31 35
4.2.2 Company B 38
4.2.2.1 Event number : 3 39
4.2.2.2 Event number : 7 42
4.2.2.3 Event number : 9 45
4.2.2.4 Event number : 11 47
4.2.2.5 Event number : 12 50
4.2.3 Company C 53
4.2.3.1 Event number : 1 54
4.2.3.2 Event number : 4 57
4.2.4 Company D 60
4.2.4.1 Event number : 1 61
10
4.2.4.2 Event number : 2 64
4.2.4.3 Event number : 137 66
4.2.4.4 Event number : 138 69
4.2.4.5 Event number : 139 71
4.3 Classification table for source and cause of
voltage sag
74
4.4 Voltage Sag mitigation technique 80
4.4.1 Uninterruptable power supply (UPS) 80
4.4.2 Voltage stabilizers 82
5 CONCLUSION 84
5.1 Conclusion 84
5.2 Future work 85
REFERENCES 87
LIST OF TABLES

11
TABLE NO. TITLE PAGE
1.1 Short duration variations for voltage sags 3
2.1 Test level and duration for voltage sags 13
2.2 Losses at KTHP in 2007 & 2008 due to voltage sag 18
2.3 Losses at Silterra Malaysia from 2007 until 2010 19
3.1 Detection method based on RMS voltage 31
4.1 Voltage sags events is various industry 29
4.2 Data for event number 25 31
4.3 Test level for voltage sags event number 25 32
4.4 Data for event number 28 33
4.5 Test level for voltage sags event number 28 34
4.6 Data for event number 31 35
4.7 Test level for voltage sags event number 31 37
4.8 Data for event number 3 39
4.9 Test level for voltage sags event number 3 41
4.10 Data for event number 7 42
4.11 Test level for voltage sags event number 7 44
4.12 Data for event number 9 45
4.13 Test level for voltage sags event number 46
4.14 Data for event number 11 47
4.15 Test level for voltage sags event number 11 49
4.16 Data for event number 12 50
4.17 Test level for voltage sags event number 12 52
4.18 Data for event number 1 54
4.19 Test level for voltage sags event number 1 56
4.20 Data for event number 4 57
4.21 Test level for voltage sags event number 4 59
4.22 Data for event number 1 61
4.23 Test level for voltage sags event number 1 63
4.24 Data for event number 2 64

12
4.25 Test level for voltage sags event number 2 66
4.26 Data for event number 137 66
4.27 Test level for voltage sags event number 137 68
4.28 Data for event number 138 69
4.29 Test level for voltage sags event number 138 71
4.30 Data for event number 139 71
4.31 Test level for voltage sags event number 139 73
4.32 Classification table for source and cause of voltage
sag
74
LIST OF FIGURES

13
FIGURE NO. TITLE PAGE
1.1 Definition of voltage sag disturbances (IEEE
1159:1995)
2
1.2 A voltage sag - Voltage sag in one phase in a
time domain
2
2.1 ITIC curve 8
2.2 ITIC curve (revised curve-2000) 9
2.3 CBEMA curve 10
2.4 SEMI F47 11
2.5 IEC 61000-4-34 12
2.6 Commonly occurred power quality problem 17
3.1 Series of methodology flow 21
3.2. Power Analyzer software 23
3.3 Example of the curve. 24
3.4 Custom Voltage Tolerance Curve Selection 24
3.5 Flowchart of the detection method based on
RMS voltage
27
4.1 Percentage of voltage sags event at Company A 30
4.2 Event number 25 - Triggered Phase B 31
4.3 Event number 25 according to IEC
61000-4-34
32
4.4 Event number 28 - Triggered Phase B 33
4.5 Event number 28 according to IEC 61000-4-34 34
4.6 (a) Event number 31 - Triggered Phase A 36
4.6 (b) Event number 31 - Triggered Phase B 36
4.6 (c) Event number 31 - Triggered Phase C 36
4.7 Event number 31 according to IEC 61000-4-34 37
4.8 Percentage of voltage sags event at Company B 38

14
4.9 (a) Event number 3 - Triggered Phase A 39
4.9 (b) Event number 3 - Triggered Phase B 40
4.9 (c) Event number 3 - Triggered Phase C 40
4.10 Event number 3 according to IEC 61000-4-34 41
4.11 (a) Event number 7 - Triggered Phase A 43
4.11 (b) Event number 7 - Triggered Phase B 43
4.11 (c) Event number 7 - Triggered Phase C 43
4.12 Event number 7 according to IEC 61000-4-34 44
4.13 Event number 9 - Triggered Phase B 45
4.14 Event number 9 according to IEC 61000-4-34 46
4.15 (a) Event number 11 - Triggered Phase A 47
4.15 (b) Event number 11 - Triggered Phase B 48
4.15 (c) Event number 11 - Triggered Phase C 48
4.16 Event number 11 according to IEC 61000-4-34 49
4.17 (a) Event number 12 - Triggered Phase A 50
4.17 (b) Event number 12 - Triggered Phase B 51
4.18 Event number 12 according to IEC 61000-4-34 51
4.19 Percentage of voltage sags event at Company C 53
4.20 (a) Event number 1 - Triggered Phase A 54
4.20 (b) Event number 1 - Triggered Phase B 55
4.20 (c) Event number 1 - Triggered Phase C 55
4.21 Event number 1 according to IEC 61000-4-34 56
4.22 (a) Event number 4 - Triggered Phase B 57
4.22 (b) Event number 4 - Triggered Phase C 58
4.23 Event number 4 according to IEC 61000-4-34 58
4.24 Percentage of voltage sags event at Company D 60
4.25 (a) Event number 1 - Triggered Phase A 61
4.25 (b) Event number 1 - Triggered Phase B 62
4.25 (c) Event number 1 - Triggered Phase C 62

15
4.26 Event number 1 according to IEC 61000-4-34 63
4.27 (a) Event number 2 - Triggered Phase B 64
4.27 (b) Event number 2 - Triggered Phase C 65
4.28 Event number 2 according to IEC 61000-4-34 65
4.29 (a) Event number 137 - Triggered Phase B 67
4.29 (b) Event number 137 - Triggered Phase C 67
4.30 Event number 137 according to IEC 61000-4-
34
68
4.31 (a) Event number 138 - Triggered Phase A 69
4.31 (b) Event number 138 - Triggered Phase C 70
4.32 Event number 138 according to IEC 61000-4-
34
70
4.33 (a) Event number 139- Triggered Phase B 72
4.33 (b) Event number 139 - Triggered Phase C 72
4.34 Event number 139 according to IEC 61000-4-
34
73
4.35 Percentage of the source of event 79
4. 36 Percentage of the cause of event 79
4.37 Block diagram for UPS 80
4.38 Voltage stabilizers 82
16
CHAPTER 1
INTRODUCTION
1.1 Introduction
In this modern year, a sophisticated and technologically based electronics were
widely used among the customer’s facility. Recently, the power quality problems have
become a greatest concern among the utilities, manufacturers and the consumers as it
will cause a huge loss in the production in term of maintaining, cost and time. In fact,
the common denominator of any kind of power quality problems is cost. Power quality
is also be known as a dirty power, which define as a power which has a distorted
sinusoidal in the currents or voltages, or operates beyond their designated current or
voltage limits / tolerance.
There are various kinds of power quality problems such as voltage sags (dips),
harmonics, voltage swell, under voltages, voltage unbalance, electrical noises
interruption and also voltage fluctuations. Among all these types of power quality
problems, there are two major concerns for both utilities and the consumers, which are
voltage sags and harmonics. This research will be focusing more on the voltage sags.
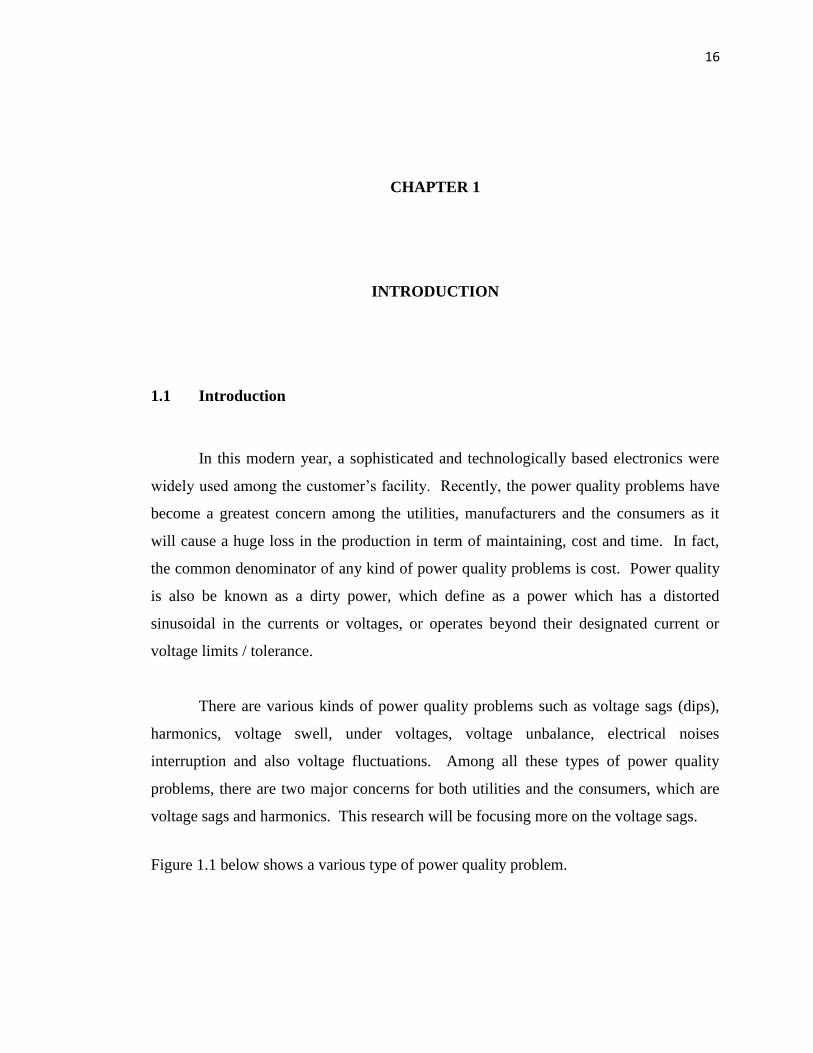
Figure 1.1 below shows a various type of power quality problem.
17
Figure 1.1: Definition of voltage disturbances (IEEE 1159:1995) [1]
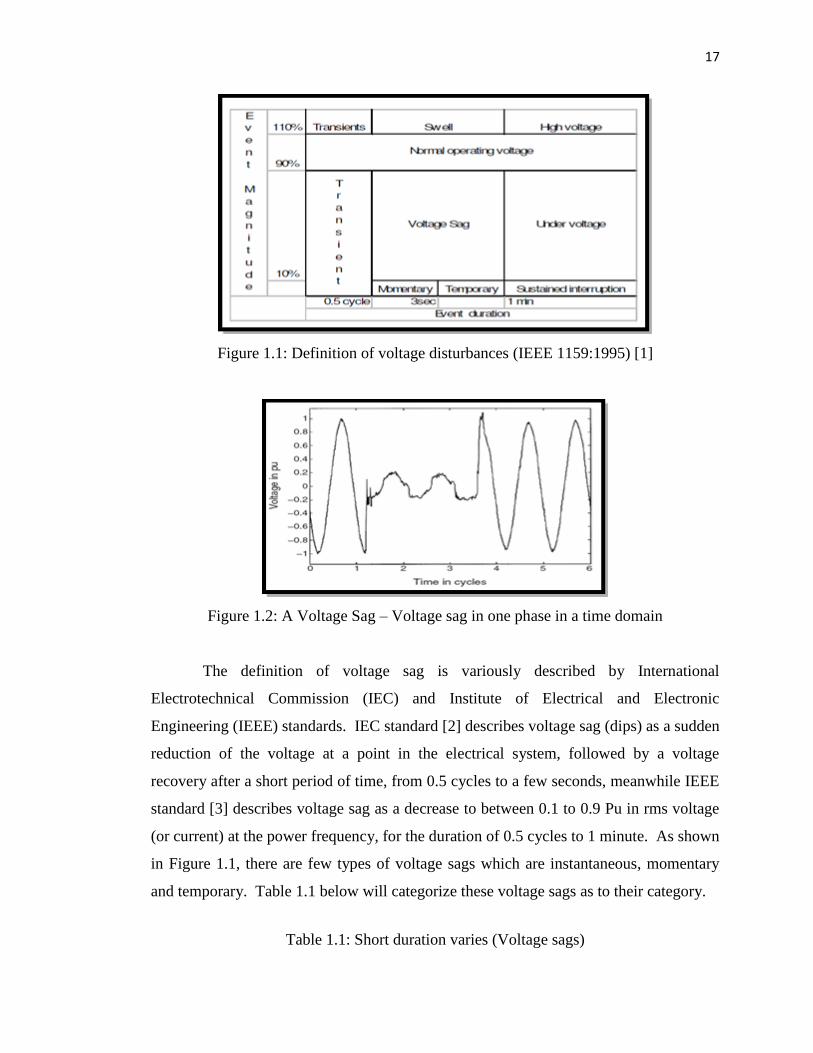
Figure 1.2: A Voltage Sag – Voltage sag in one phase in a time domain
The definition of voltage sag is variously described by International
Electrotechnical Commission (IEC) and Institute of Electrical and Electronic
Engineering (IEEE) standards. IEC standard [2] describes voltage sag (dips) as a sudden
reduction of the voltage at a point in the electrical system, followed by a voltage
recovery after a short period of time, from 0.5 cycles to a few seconds, meanwhile IEEE
standard [3] describes voltage sag as a decrease to between 0.1 to 0.9 Pu in rms voltage
(or current) at the power frequency, for the duration of 0.5 cycles to 1 minute. As shown
in Figure 1.1, there are few types of voltage sags which are instantaneous, momentary
and temporary. Table 1.1 below will categorize these voltage sags as to their category.
Table 1.1: Short duration varies (Voltage sags)

18
Short duration varies (Voltage sags)
No. Category Duration of sag Voltage magnitude in
per unit
1 Instantaneous 0.5 – 30 cycles 0.1 – 0.9 pu
2 Momentary 30 cycles – 3s 0.1 – 0.9 Pu
3 Temporary 3s – 1 minute 0.1 – 0.9 pu
The common causes of voltage sags are identified to be; [1] the starting of large
motor loads, faults on other branches of the supply network and faults in the internal
supply scheme of the customer’s installation. Although the utility side has done their
best to provide a clean voltage to the customers, but the external factors that can cause a
fault to occur, such as lightning, crane encroachment, tree encroachment and birds are
beyond their control. Some of the electronic equipment, especially, are very sensitive
towards the voltage sags. These equipment will trip or malfunction whenever the rms
voltage drops to below 90% of their nominal voltage for the duration of longer than 1 or
2 cycles.
This is why the voltage tolerance curve, which set the immunity area for a safely
operate equipment were needed in the case involving a sensitive equipment. There are
few voltage tolerance curves which are widely used by the utilities, manufacturers and
customers as their references. These voltage tolerance curves include Information
Technology Industry Council (ITIC) curve; which formerly known as Computer and
Business Equipment Manufacturers’ Association (CBEMA) curve, Semiconductor
Equipment and Materials International (SEMI) F47 and MS IEC 61000-4-34 (input
current less than 16 A) / MS IEC 61000-4-11 (input current more than 16 A).
1.2 Project background

19
The seldom occurrence, yet having a greater effect of voltage sags in Malaysia is
a major concern to the company and the utility companies. This project is to analyze the
voltage sags event mainly in term of the depth sags, the source of the voltage sags and
the cause of voltage sags. Since there are mitigation techniques that can be applied to
the equipment for both customer and utility side, few suggestions of the mitigation
technique will be discussed in this report. The analysis of the events is being done by
the Power Analyzer software.
1.3 Problem statement
Voltage sags is one of a kind of problem in power quality. It can cause large
losses in a production cost even though it is a reduction in voltage for a very short time.
The utility may have tried their best in supplying the best power to the consumer, but the
fact that voltage sags might occur with a certain cause cannot be avoided. To conduct a
good research on voltage sags, one has to know about voltage sags, such as:
What are voltage sags?
What are the cause and effect of voltage sags?
Usually when the voltage sags occur?
What is the source of disturbance in industrial sector?
Whose fault it is when this kind of event (voltage sag) occurs?
Where does the voltage usually occur?
What is the characteristic of voltage sag?
Who contribute to the voltage sag events? There are widespread beliefs among
the utility customers that the voltage sag is problem that only originated from the utility
system [1]. It is actually caused either by the customers or the utilities. So, between the
customer and the utilities, which side contribute more on the voltage sag occurrence in
Malaysia?

20
1.4 Objectives
There are few objectives of this research:
1. To study and identify the main causes of the voltage sag events.
2. To determine the source of disturbances in industrial sector.
3. To analyze voltage dips event using Power Analyzer Software.
4. To suggest a suitable mitigation technique for each type of cause of voltage sag
involved.
1.5 Scope of Work / Limitation
1. Study and analyzing the voltage sags event in low and medium industry.
2. Reviewing the standards of voltage sag and ensure that the equipment involve
comply with the standards (ITIC curve (formerly known as CBEMA curve),
SEMI F47, IEC 61000 4-34 / IEC 61000 4-11, ANSI curve and so on)
107
REFERENCES
[1] TNB Power Quality Guide Books
[2] IEC 1000-2-1 – 1990 – Part 2: Environment – Section 1: “Description of the
environment – Electromagnetic environment for low-frequency conducted
disturbances and signaling in public low-voltage power supply system”
[3] IEEE p1346 “ Recommended Practice for Evaluating Electric Power Systems
Compatibility with Electronic Equipment – Working Group Electric Power System
Compatibility with industrial process equipment –pt1- Voltage Sag’s” Industrial &
Commercial Power System of May 1994 (Draft)
[4] Standards and Guideline Referring to Power Quality.
[5] Mario Fabiano Alves, Tatiana Nesralla Ribeiro, ‘Voltage Sag: An Overview of
IEC and IEEE Standards and Application Criteria’
[6] Voltage Sag Immunity Standards – Semi F47 and F42-
[7] Surya Hardi, Ismail Daut, ‘Sensitivity of Low Voltage Consumer Equipment to
Voltage Sags’.
[8] Bakri Sawir (TNB), Mohd Ruddin Ab. Ghani, Abdullah Asuhaimi Mohd Zin,
Abdul Halim Mohd Yatim(UTM Skudai), Hashim Shaibon Shaibon(Akademi
Tentera KL), Kwok Lun Lo(University of Strathclyde Glasgow, UK), ‘Voltage Sag :
Malaysian’s Experience’.

108
[9] John Horak, ‘Power Quality: Measurements of Sags and Interruptions’.
[10] Dong-Jun Won, Seon-Ju Ahn, II-Yop Chung, Joong-Moon Kim, Seung-II
Moon, ‘A New Definition of Voltage Sag Duration Considering the Voltage
Tolerance Curve’.
[11] Jeff Lamoree, Dave Mueller, Paul Vinett, William Jones, ‘Voltage Sag Analysis
Case Studies’.
[12] G. Alonso Orcajo, J. M. Cano R., C.H. Rojas G., M.G. Melero, M.F. Cabanas,
F.Pedrayes, ‘Voltage Sags in Industrial System’.
[13] Ding Ning, Cai Wei, Suo Juan, Wang Jianwei, Xu Yonghai, “Voltage Sag
Disturbance Detection Based on RMS Voltage Method”, 2009, IEEE.
[14] Mark Sthephens, “Power Quality Standards : CBEMA, ITIC, SEMI F47, IEC
61000-4-11/34”, Electric Power Research Institute.
[ Available online : industrial.sceg.com]
[15] M. Manjula, A.V.R.S. Sarma, Sukumar Mishra, “ Detection and Classification
of Voltage Sag Causes based on Empirical Mode Decomposition”, IEEE.
[16] Alexis Poycarpou, “ Voltage Sag Indices in Electrical System : Standard and
Development”,2009.