volume 1: executive summary - vectren appendix d... · study and action plan volume 1: executive...
TRANSCRIPT
ELECTRIC DEMAND SIDE MANAGEMENT: MARKET POTENTIAL STUDY AND ACTION PLAN Volume 1: Executive Summary
Report Number 1432
EnerNOC Utility Solutions Consulting 500 Ygnacio Valley Road Suite 450 Walnut Creek, CA 94596
925.482.2000 www.enernoc.com
Prepared for: Vectren Energy Delivery of Indiana
Project Director: Ingrid Rohmund
April 22, 2013


EnerNOC Utility Solutions Consulting iii
This report was prepared by
EnerNOC Utility Solutions Consulting 500 Ygnacio Valley Blvd., Suite 450 Walnut Creek, CA 94596
Project Director: I. Rohmund Project Manager: D. Costenaro

EnerNOC Utility Solutions Consulting v
CONTENTS
1 INTRODUCTION .................................................................................................... 1-1 Background ................................................................................................................ 1-1 Report Organization ..................................................................................................... 1-1 Definitions of Potential ................................................................................................. 1-1
2 ANALYSIS APPROACH AND DATA DEVELOPMENT ................................................ 2-1 Analysis Approach ....................................................................................................... 2-1 Data Development ....................................................................................................... 2-2
3 MARKET CHARACTERIZATION AND MARKET PROFILES ...................................... 3-1 Energy Use Summary .................................................................................................. 3-1 Residential Sector ........................................................................................................ 3-1 Commercial Sector ...................................................................................................... 3-3 Industrial Sector .......................................................................................................... 3-4
4 BASELINE FORECAST ............................................................................................ 4-1 Residential Sector ........................................................................................................ 4-1 Commercial Sector ...................................................................................................... 4-2 Industrial Sector .......................................................................................................... 4-3 Baseline Forecast Summary .......................................................................................... 4-4
5 ENERGY EFFICIENCY MEASURES .......................................................................... 5-1
6 MEASURE-LEVEL ENERGY EFFICIENCY POTENTIAL ............................................. 6-1 Overview of Measure-Level Energy Efficiency Potential by Sector ..................................... 6-2
7 MEASURE-LEVEL ENERGY EFFICIENCY POTENTIAL BY SECTOR .......................... 7-1 Residential Electricity Potential ..................................................................................... 7-1 Commercial Electricity Potential .................................................................................... 7-3 Industrial Electricity Potential ....................................................................................... 7-5
8 PROGRAM POTENTIAL AND ACTION PLAN ........................................................... 8-1 Programmatic Framework ............................................................................................ 8-1 Using Achievable High and Achievable Low as Guidelines ................................................ 8-2 Recommended Program Action Plan .............................................................................. 8-4 Cost Effectiveness ....................................................................................................... 8-7
9 CONCLUSIONS AND RECOMMENDATIONS ........................................................... 9-1 General Recommendations ........................................................................................... 9-1 Residential Recommendations ...................................................................................... 9-2 Commercial & Industrial Recommendations ................................................................... 9-2

EnerNOC Utility Solutions Consulting vii
LIST OF FIGURES
Figure 2-1 Overview of Analysis Approach ............................................................................ 2-2 Figure 3-1 Sector-Level Electricity Use, 2011 ........................................................................ 3-1 Figure 3-2 Residential Electricity by End Use (2011), All Homes .............................................. 3-2 Figure 3-3 Residential Electricity Intensity by End Use and Segment (kWh/household, 2011) .... 3-2 Figure 3-4 Commercial Electricity Consumption by End Use (2011), All Building Types ............. 3-3 Figure 4-1 Residential Electricity Baseline Forecast by End Use ............................................... 4-1 Figure 4-2 Commercial Electricity Baseline Forecast by End Use ............................................. 4-2 Figure 4-3 Industrial Electricity Baseline Forecast by End Use................................................. 4-3 Figure 4-4 Electricity Baseline Forecast Summary (GWh) ....................................................... 4-4

EnerNOC Utility Solutions Consulting ix
LIST OF TABLES
Table 4-1 Electricity Baseline Forecast Summary (GWh) ....................................................... 4-4 Table 5-1 Number of Measures Evaluated ........................................................................... 5-1 Table 6-1 Overall Measure-Level Electricity Efficiency Potential ............................................. 6-1 Table 6-2 Electric Achievable Potential by Sector (GWh) ....................................................... 6-2 Table 8-1 Portfolio of Energy Efficiency Programs Included in Action Plan .............................. 8-1 Table 8-2 Indiana State Goals, Gross Incremental Electricity Savings as % of Baseline ....... 8-2 Table 8-3 Vectren Recommended Electric Energy Efficiency Portfolio Summary ...................... 8-5 Table 8-4 Vectren Recommended Action Plan Cost Effectiveness summary ............................ 8-7

EnerNOC Utility Solutions Consulting 1-1
INTRODUCTION
Background Energy efficiency (EE) efforts are increasing in magnitude and gaining traction in Indiana, building on the momentum of recently established statewide electric energy efficiency targets. Vectren Energy Delivery of Indiana (Vectren) is investigating the electric energy efficiency potential for their service territory. The findings of this investigation will lead directly into the development of a portfolio of energy efficiency programs to be delivered to customers over the time period 2015 to 2019.
Toward this end, Vectren has contracted with EnerNOC Utility Solutions (EnerNOC) to conduct a Market Potential Study and assemble an Action Plan that considers all metered electric customers in the residential, commercial, and industrial sectors for this time period.
EnerNOC conducted a detailed, bottom-up assessment of the Vectren market in the Evansville metropolitan area to deliver a projection of baseline electric energy use, forecasts of the energy savings achievable through efficiency measures, and program designs and strategies to optimally deliver those savings. This report describes the study approach and results.
Report Organization This report is presented in 4 volumes as outlined below. This document is Volume 1: Executive Summary.
Volume 1, Executive Summary
Volume 2, Market Potential and Action Plan Report
Volume 3, Detailed Appendices: Market Potential Study
Volume 4, Detailed Appendices: Action Plan & Program Write-ups
Definitions of Potential In this study, we estimate the potential for energy efficiency savings. The savings estimates represent net savings1 developed into three types of potential: technical potential, economic potential, and achievable potential. Technical and economic potential are both theoretical limits to efficiency savings. Achievable potential embodies a set of assumptions about the decisions consumers make regarding the efficiency of the equipment they purchase, the maintenance activities they undertake, the controls they use for energy-consuming equipment, and the elements of building construction. Because estimating achievable potential involves the inherent uncertainty of predicting human behaviors and responses to market conditions, we developed low and high achievable potential as boundaries for a likely range. The various levels are described below.
Technical potential is defined as the theoretical upper limit of energy efficiency potential. It assumes that customers adopt all feasible measures regardless of their cost. At the time of existing equipment failure, customers replace their equipment with the most efficient option available. In new construction, customers and developers also choose the most efficient
1 Savings in “net” terms instead of “gross” means that the baseline forecast includes naturally occurring efficiency. In other words, the baseline assumes that natural early adopters continue to make purchases of equipment and measures at efficiency levels higher than the minimum standard.
CHAPTER 1
Introduction
1-2 www.enernoc.com
equipment option. Examples of measures that make up technical potential for electricity in the residential sector include:
o Ductless mini-split air conditioners with variable refrigerant flow
o Ground source (or geothermal) heat pumps
o LED lighting
Technical potential also assumes the adoption of every other available measure, where applicable. For example, it includes installation of high-efficiency windows in all new construction opportunities and furnace maintenance in all existing buildings with furnace systems. These retrofit measures are phased in over a number of years, which is longer for higher-cost and complex measures.
Economic potential represents the adoption of all cost-effective energy efficiency measures. In this analysis, the cost effectiveness is measured by the total resource cost (TRC) test, which compares lifetime energy and capacity benefits to the incremental cost of the measure. If the benefits outweigh the costs (that is, if the TRC ratio is greater than 1.0), a given measure is considered in the economic potential. Customers are then assumed to purchase the most cost-effective option applicable to them at any decision juncture.
Achievable High potential estimates customer adoption of economic measures when delivered through efficiency programs under ideal market, implementation, and customer preference conditions. Information channels are assumed to be established and efficient for marketing, educating consumers, and coordinating with trade allies and delivery partners. Achievable High potential establishes a maximum target for the EE savings that an administrator can hope to achieve through its EE programs and involves incentives that represent a substantial portion of the incremental cost combined with high administrative and marketing costs.
Achievable Low potential reflects expected program participation given significant barriers to customer acceptance, non-ideal implementation conditions, and limited program budgets. This represents a lower bound on achievable potential.
EnerNOC Utility Solutions Consulting 2-1
ANALYSIS APPROACH AND DATA DEVELOPMENT
This section describes the analysis approach taken for the study and the data sources used to develop the potential estimates.
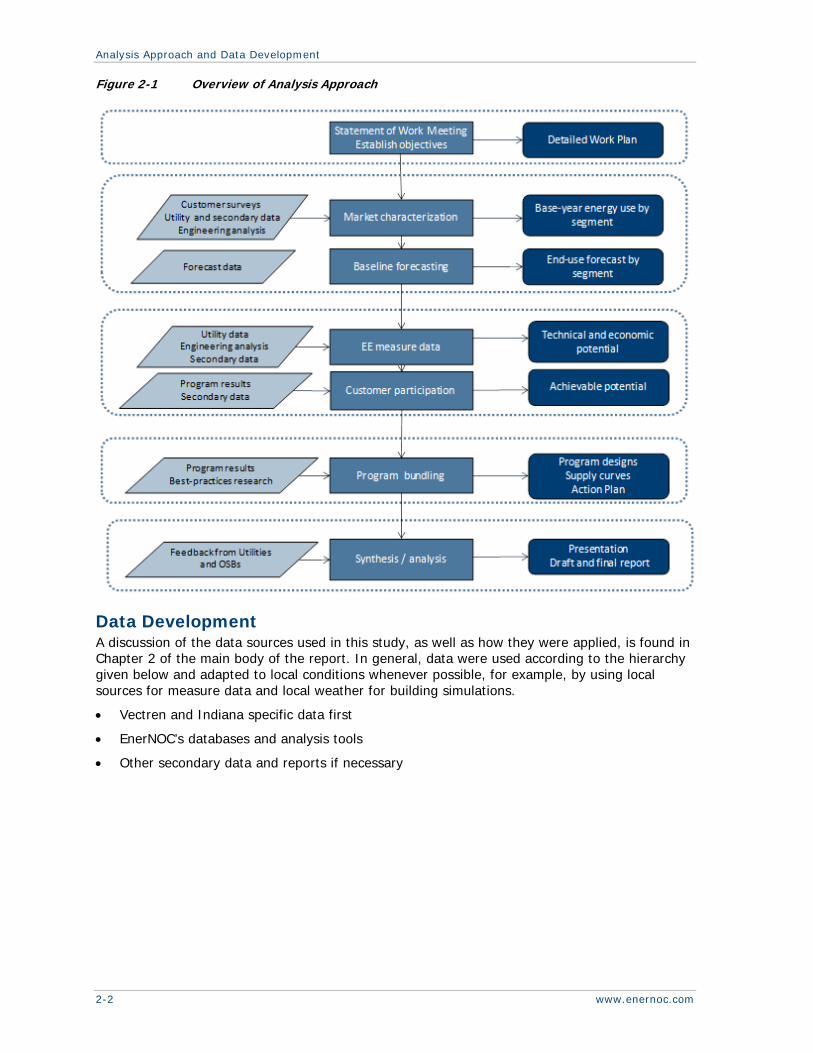
Analysis Approach To perform the energy efficiency analysis, EnerNOC used a bottom-up analysis approach as shown in Figure 2-1. This involved the following steps.
1. Held a meeting with the client project team to refine the objectives of the project in detail. This resulted in a work plan for the study.
2. Conducted onsite energy consumption surveys with 30 of Vectren’s largest commercial and industrial customers in order to provide data and guidance for these market sectors that had not formerly received focused DSM program efforts.
3. Performed a market characterization to describe sector-level electricity use for the residential, commercial, and industrial sectors for the base year, 2011. This included using existing information contained in prior Vectren and Indiana studies, new information from the aforementioned onsite surveys with large customers, EnerNOC’s own databases and tools, and other secondary data sources such as the American Community Survey (ACS) and the Energy Information Administration (EIA).
4. Developed a baseline electricity forecast by sector, segment, and end use for 2011 through 2023. Results presented in this volume focus on the upcoming implementation years of 2015 through 2019. Results beyond 2019 are available in the Appendices.
5. Identified several hundred measures and estimated their effects in four tiers of measure-level energy efficiency potential: Technical, Economic, Achievable High, and Achievable Low.
6. Reviewed the current programs offered by Vectren in light of the study findings to make strategic program recommendations for achieving savings.
7. Created detailed program designs and action plans through 2019 representing the program potential for Vectren, basing them on the potential analysis and strategic recommendations developed in the previous steps.
The analysis approach for all these steps is described in further detail throughout the remainder of this chapter.
CHAPTER 2
Analysis Approach and Data Development
2-2 www.enernoc.com
Figure 2-1 Overview of Analysis Approach
Data Development A discussion of the data sources used in this study, as well as how they were applied, is found in Chapter 2 of the main body of the report. In general, data were used according to the hierarchy given below and adapted to local conditions whenever possible, for example, by using local sources for measure data and local weather for building simulations.
Vectren and Indiana specific data first
EnerNOC’s databases and analysis tools
Other secondary data and reports if necessary
EnerNOC Utility Solutions Consulting 3-1
MARKET CHARACTERIZATION AND MARKET PROFILES
In this section, we describe how customers in the Vectren service territory use electricity in the base year of the study, 2011. It begins with a high-level summary of energy use by sector and then delves into each sector in detail.
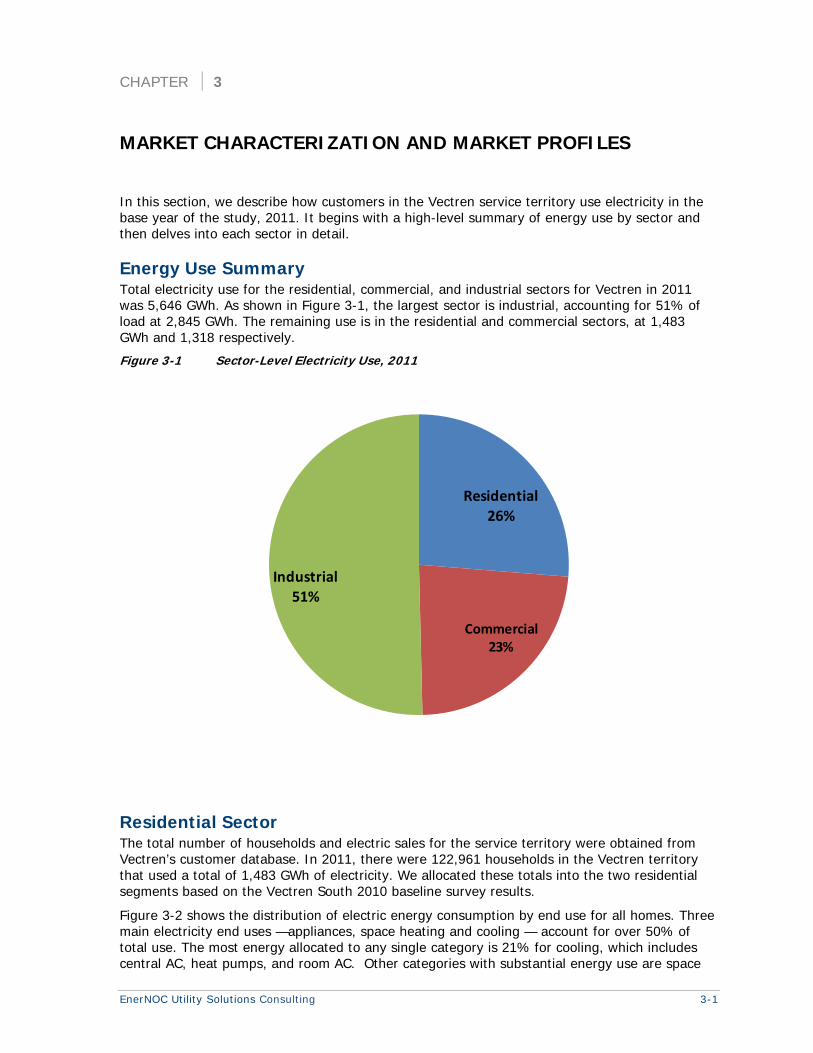
Energy Use Summary Total electricity use for the residential, commercial, and industrial sectors for Vectren in 2011 was 5,646 GWh. As shown in Figure 3-1, the largest sector is industrial, accounting for 51% of load at 2,845 GWh. The remaining use is in the residential and commercial sectors, at 1,483 GWh and 1,318 respectively.
Figure 3-1 Sector-Level Electricity Use, 2011
Residential Sector The total number of households and electric sales for the service territory were obtained from Vectren’s customer database. In 2011, there were 122,961 households in the Vectren territory that used a total of 1,483 GWh of electricity. We allocated these totals into the two residential segments based on the Vectren South 2010 baseline survey results.
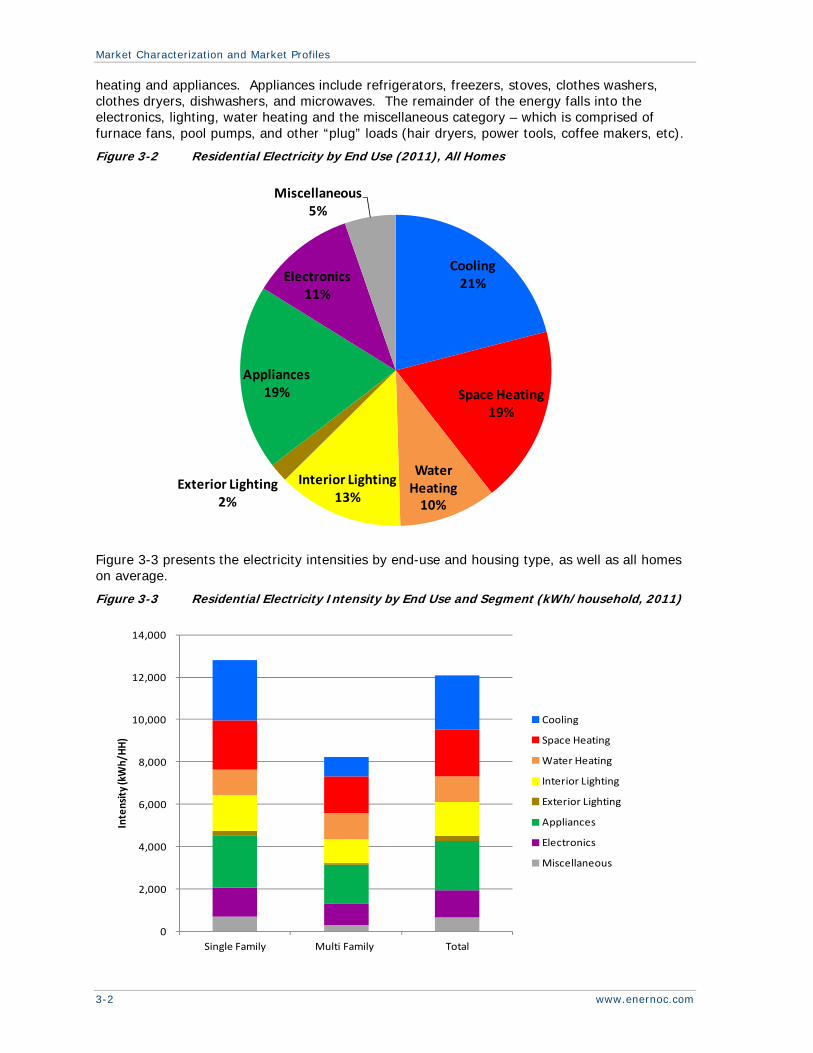
Figure 3-2 shows the distribution of electric energy consumption by end use for all homes. Three main electricity end uses —appliances, space heating and cooling — account for over 50% of total use. The most energy allocated to any single category is 21% for cooling, which includes central AC, heat pumps, and room AC. Other categories with substantial energy use are space
Residential26%
Commercial23%
Industrial51%
CHAPTER 3
Market Characterization and Market Profiles
3-2 www.enernoc.com
heating and appliances. Appliances include refrigerators, freezers, stoves, clothes washers, clothes dryers, dishwashers, and microwaves. The remainder of the energy falls into the electronics, lighting, water heating and the miscellaneous category – which is comprised of furnace fans, pool pumps, and other “plug” loads (hair dryers, power tools, coffee makers, etc).
Figure 3-2 Residential Electricity by End Use (2011), All Homes
Figure 3-3 presents the electricity intensities by end-use and housing type, as well as all homes on average.
Figure 3-3 Residential Electricity Intensity by End Use and Segment (kWh/household, 2011)
Cooling21%
Space Heating19%
Water Heating10%
Interior Lighting13%
Exterior Lighting2%
Appliances19%
Electronics11%
Miscellaneous5%
0
2,000
4,000
6,000
8,000
10,000
12,000
14,000
Single Family Multi Family Total
Intensity (kWh/H
H)
Cooling
Space Heating
Water Heating
Interior Lighting
Exterior Lighting
Appliances
Electronics
Miscellaneous
Market Characterization and Market Profiles
EnerNOC Utility Solutions Consulting 3-3
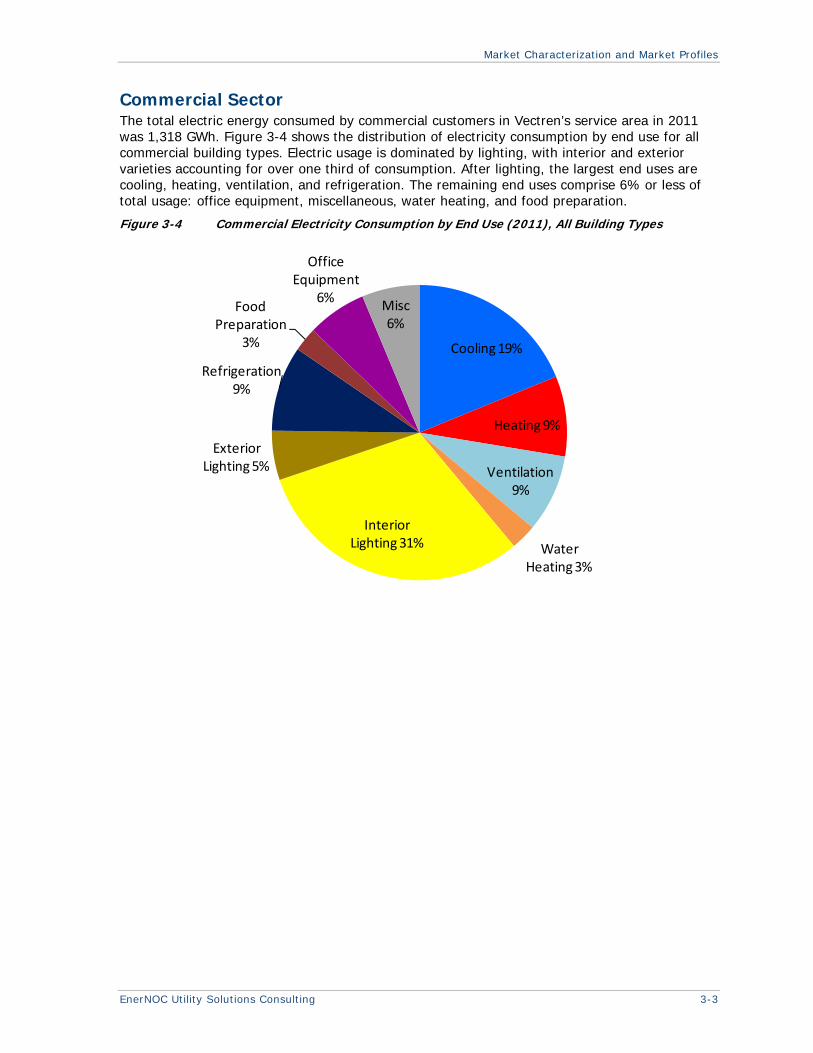
Commercial Sector The total electric energy consumed by commercial customers in Vectren’s service area in 2011 was 1,318 GWh. Figure 3-4 shows the distribution of electricity consumption by end use for all commercial building types. Electric usage is dominated by lighting, with interior and exterior varieties accounting for over one third of consumption. After lighting, the largest end uses are cooling, heating, ventilation, and refrigeration. The remaining end uses comprise 6% or less of total usage: office equipment, miscellaneous, water heating, and food preparation.
Figure 3-4 Commercial Electricity Consumption by End Use (2011), All Building Types
Cooling 19%
Heating 9%
Ventilation 9%
Water Heating 3%
Interior Lighting 31%
Exterior Lighting 5%
Refrigeration 9%
Food Preparation
3%
Office Equipment
6%Misc 6%
Market Characterization and Market Profiles
3-4 www.enernoc.com
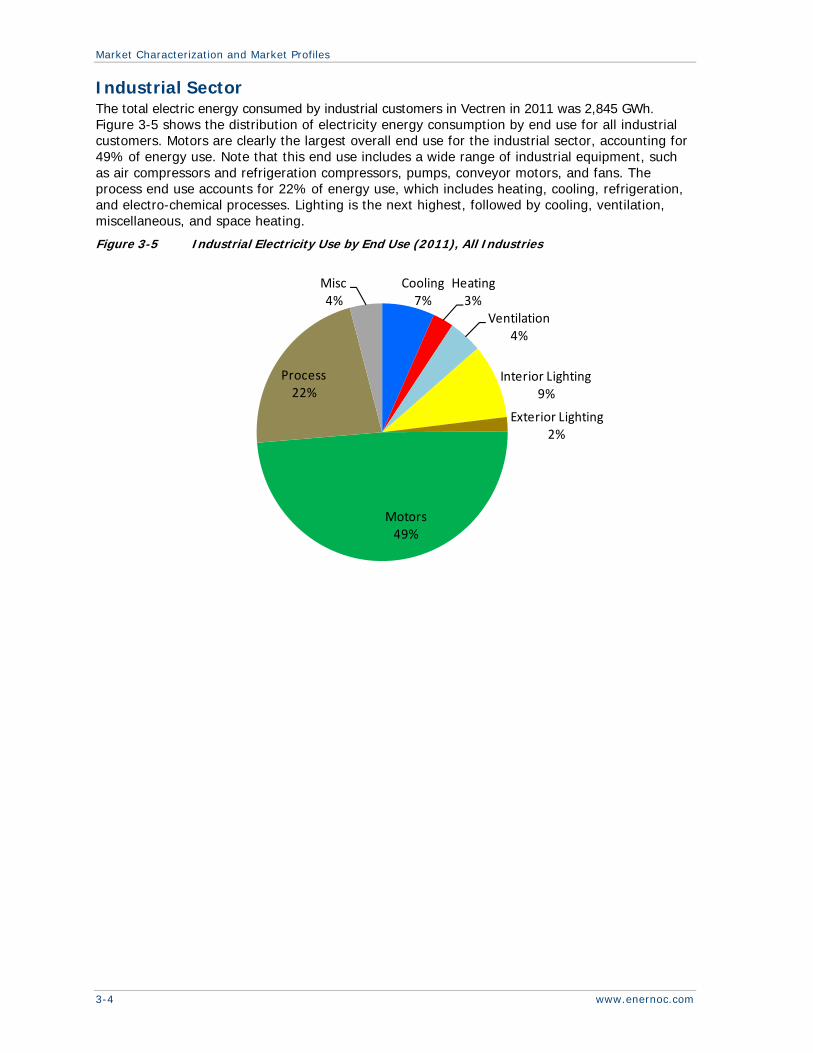
Industrial Sector The total electric energy consumed by industrial customers in Vectren in 2011 was 2,845 GWh. Figure 3-5 shows the distribution of electricity energy consumption by end use for all industrial customers. Motors are clearly the largest overall end use for the industrial sector, accounting for 49% of energy use. Note that this end use includes a wide range of industrial equipment, such as air compressors and refrigeration compressors, pumps, conveyor motors, and fans. The process end use accounts for 22% of energy use, which includes heating, cooling, refrigeration, and electro-chemical processes. Lighting is the next highest, followed by cooling, ventilation, miscellaneous, and space heating.
Figure 3-5 Industrial Electricity Use by End Use (2011), All Industries
Cooling7%
Heating3%
Ventilation4%
Interior Lighting9%
Exterior Lighting2%
Motors49%
Process22%
Misc4%
EnerNOC Utility Solutions Consulting 4-1
BASELINE FORECAST
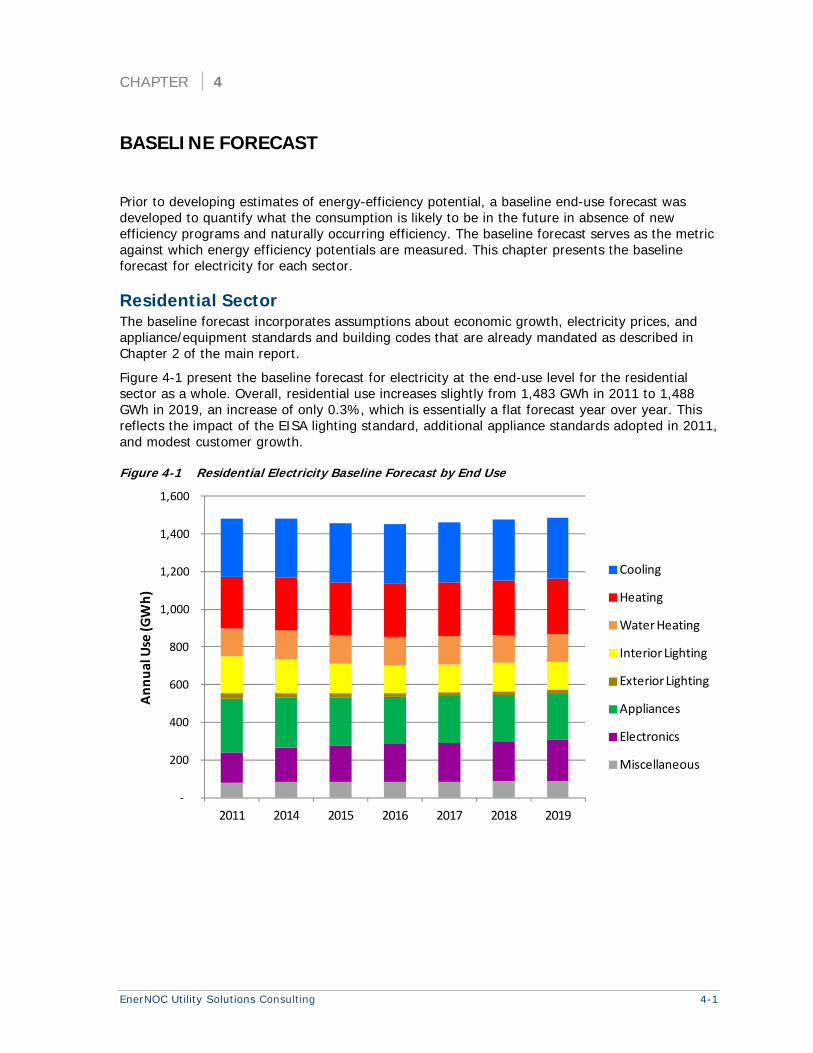
Prior to developing estimates of energy-efficiency potential, a baseline end-use forecast was developed to quantify what the consumption is likely to be in the future in absence of new efficiency programs and naturally occurring efficiency. The baseline forecast serves as the metric against which energy efficiency potentials are measured. This chapter presents the baseline forecast for electricity for each sector.
Residential Sector The baseline forecast incorporates assumptions about economic growth, electricity prices, and appliance/equipment standards and building codes that are already mandated as described in Chapter 2 of the main report.
Figure 4-1 present the baseline forecast for electricity at the end-use level for the residential sector as a whole. Overall, residential use increases slightly from 1,483 GWh in 2011 to 1,488 GWh in 2019, an increase of only 0.3%, which is essentially a flat forecast year over year. This reflects the impact of the EISA lighting standard, additional appliance standards adopted in 2011, and modest customer growth.
Figure 4-1 Residential Electricity Baseline Forecast by End Use
‐
200
400
600
800
1,000
1,200
1,400
1,600
2011 2014 2015 2016 2017 2018 2019
Annual Use (G
Wh)
Cooling
Heating
Water Heating
Interior Lighting
Exterior Lighting
Appliances
Electronics
Miscellaneous
CHAPTER 4
Baseline Forecast
4-2 www.enernoc.com
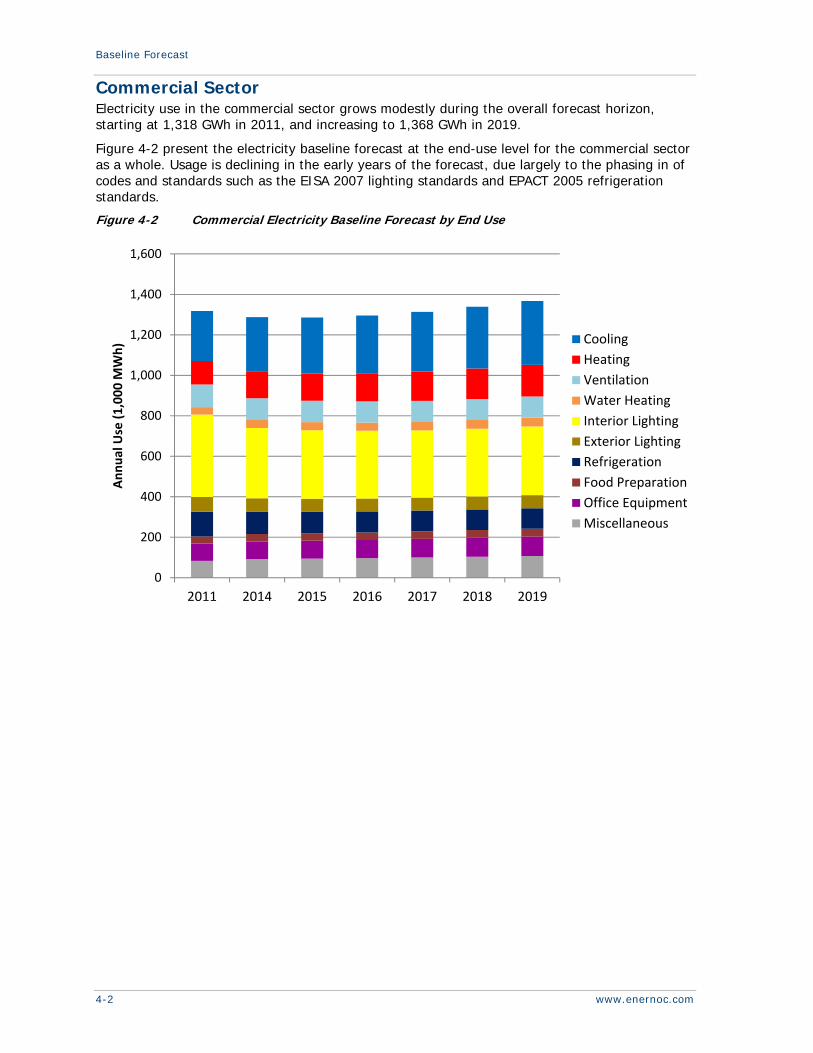
Commercial Sector Electricity use in the commercial sector grows modestly during the overall forecast horizon, starting at 1,318 GWh in 2011, and increasing to 1,368 GWh in 2019.
Figure 4-2 present the electricity baseline forecast at the end-use level for the commercial sector as a whole. Usage is declining in the early years of the forecast, due largely to the phasing in of codes and standards such as the EISA 2007 lighting standards and EPACT 2005 refrigeration standards.
Figure 4-2 Commercial Electricity Baseline Forecast by End Use
0
200
400
600
800
1,000
1,200
1,400
1,600
2011 2014 2015 2016 2017 2018 2019
Annual Use (1,000 M
Wh) Cooling
Heating
Ventilation
Water Heating
Interior Lighting
Exterior Lighting
Refrigeration
Food Preparation
Office Equipment
Miscellaneous
Baseline Forecast
EnerNOC Utility Solutions Consulting 4-3
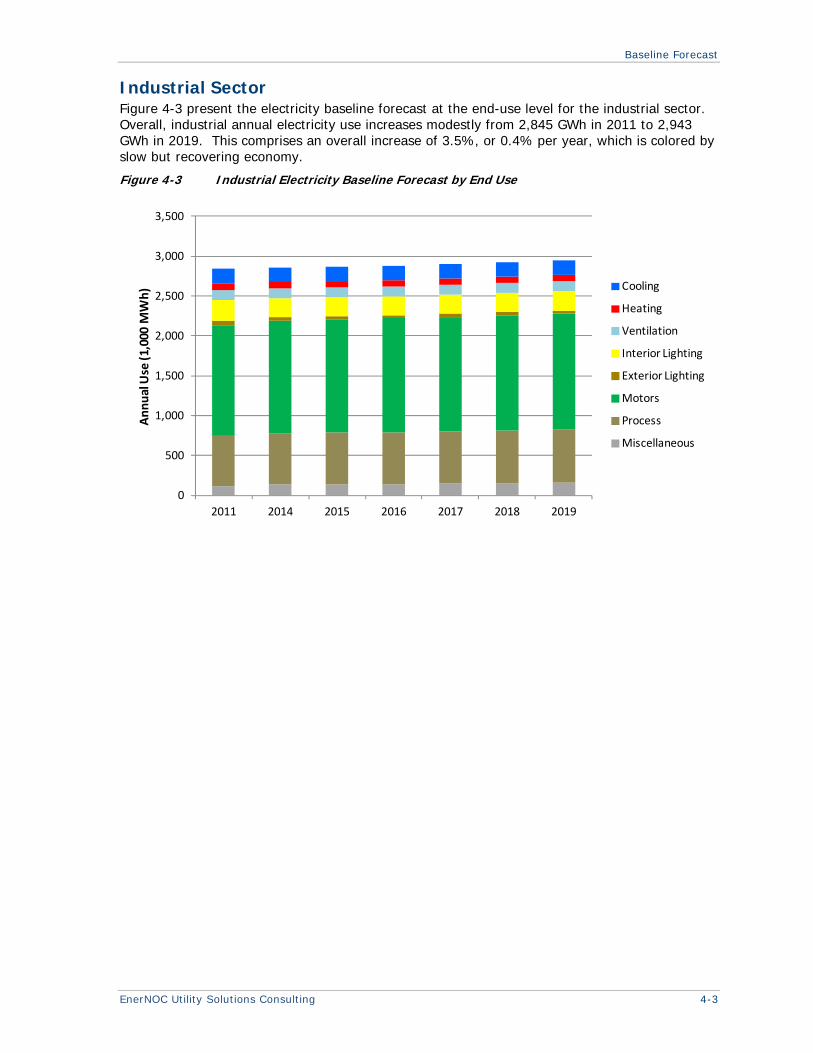
Industrial Sector Figure 4-3 present the electricity baseline forecast at the end-use level for the industrial sector. Overall, industrial annual electricity use increases modestly from 2,845 GWh in 2011 to 2,943 GWh in 2019. This comprises an overall increase of 3.5%, or 0.4% per year, which is colored by slow but recovering economy.
Figure 4-3 Industrial Electricity Baseline Forecast by End Use
0
500
1,000
1,500
2,000
2,500
3,000
3,500
2011 2014 2015 2016 2017 2018 2019
Annual Use (1,000 M
Wh) Cooling
Heating
Ventilation
Interior Lighting
Exterior Lighting
Motors
Process
Miscellaneous
Baseline Forecast
4-4 www.enernoc.com
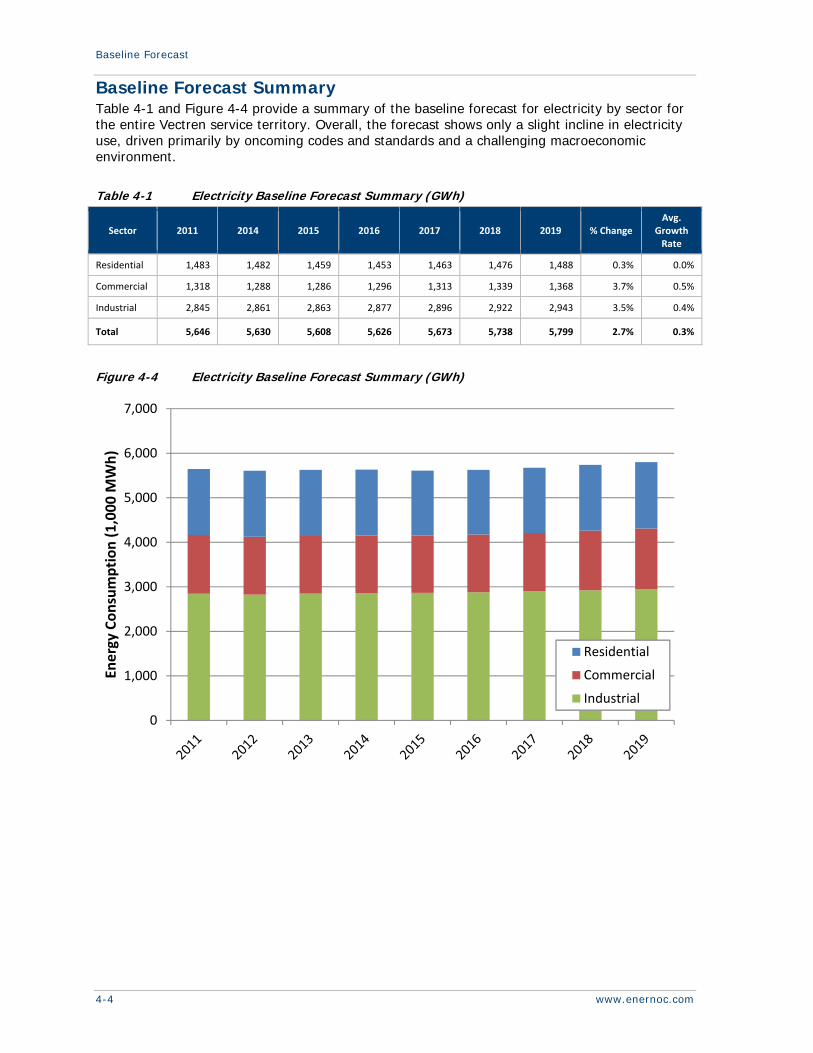
Baseline Forecast Summary Table 4-1 and Figure 4-4 provide a summary of the baseline forecast for electricity by sector for the entire Vectren service territory. Overall, the forecast shows only a slight incline in electricity use, driven primarily by oncoming codes and standards and a challenging macroeconomic environment.
Table 4-1 Electricity Baseline Forecast Summary (GWh)
Sector 2011 2014 2015 2016 2017 2018 2019 % Change Avg.
Growth Rate
Residential 1,483 1,482 1,459 1,453 1,463 1,476 1,488 0.3% 0.0%
Commercial 1,318 1,288 1,286 1,296 1,313 1,339 1,368 3.7% 0.5%
Industrial 2,845 2,861 2,863 2,877 2,896 2,922 2,943 3.5% 0.4%
Total 5,646 5,630 5,608 5,626 5,673 5,738 5,799 2.7% 0.3%
Figure 4-4 Electricity Baseline Forecast Summary (GWh)
0
1,000
2,000
3,000
4,000
5,000
6,000
7,000
Energy Consumption (1,000 M
Wh)
Residential
Commercial
Industrial
EnerNOC Utility Solutions Consulting 5-1
CHAPTER 5
ENERGY EFFICIENCY MEASURES
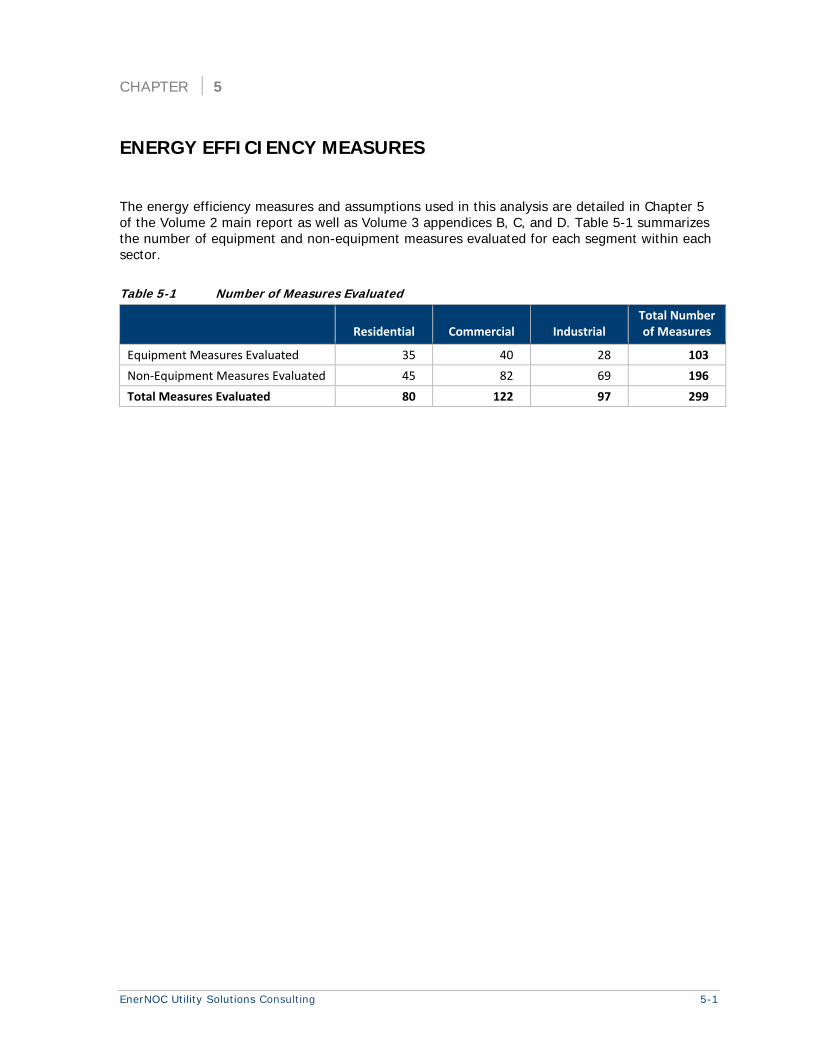
The energy efficiency measures and assumptions used in this analysis are detailed in Chapter 5 of the Volume 2 main report as well as Volume 3 appendices B, C, and D. Table 5-1 summarizes the number of equipment and non-equipment measures evaluated for each segment within each sector.
Table 5-1 Number of Measures Evaluated
Residential Commercial Industrial Total Number of Measures
Equipment Measures Evaluated 35 40 28 103
Non‐Equipment Measures Evaluated 45 82 69 196
Total Measures Evaluated 80 122 97 299


EnerNOC Utility Solutions Consulting 6-1
CHAPTER 6
MEASURE-LEVEL ENERGY EFFICIENCY POTENTIAL
Table 6-1 and Figure 6-1 summarize the electric energy-efficiency savings for all measures at the different levels of potential relative to the baseline forecast. Note that the subsequent steps of measure bundling, program design and program delivery will hone and refine these results later in Chapter 8.2
Table 6-1 Overall Measure-Level Electricity Efficiency Potential
2015 2016 2017 2018 2019
Baseline Forecast (GWh) 5,608 5,626 5,673 5,738 5,799
Cumulative Savings (GWh)
Achievable Low Potential 32 63 100 151 203
Achievable High Potential 67 125 192 277 357
Economic Potential 112 191 274 377 478
Technical Potential 142 251 366 504 640
Energy Savings (% of Baseline)
Achievable Low Potential 0.6% 1.0% 1.8% 2.6% 3.5%
Achievable High Potential 1.2% 2.2% 3.4% 4.8% 6.2%
Economic Potential 2.0% 3.4% 4.8% 6.6% 8.2%
Technical Potential 2.5% 4.5% 6.5% 8.8% 11.0%
Figure 6-1 Overall Measure-Level Electricity Efficiency Potential
2 Utilities typically have a small subset of large commercial and industrial customers that comprise a disproportionate share of load and demand. In Vectren’s case, there is one particular industrial customer that comprises a full 24% of the C&I load. If this customer were not to participate in EE programs, the savings potential would drop commensurately in the C&I sectors, which would remove approximately 15% from the overall savings potential in all sectors.
0%
2%
4%
6%
8%
10%
12%
2015 2016 2017 2018 2019
Energy Savings
(% of Baselin
e Forecast)
Achievable Potential Low
Achievable Potential High
Economic Potential
Technical Potential

Measure-Level Energy Efficiency Potential
6-2 www.enernoc.com
Overview of Measure-Level Energy Efficiency Potential by Sector Table 6-2, summarize the range of electric achievable potential by sector. The commercial sector accounts for the largest portion of the savings, followed by residential, and then industrial.
Table 6-2 Electric Achievable Potential by Sector (GWh)
2015 2016 2017 2018 2019
Achievable Low Cumulative Savings (GWh)
Residential 9.4 15.7 22.1 32.4 43.4
Commercial 12.1 22.8 36.0 53.0 71.8
Industrial 10.7 24.3 42.2 65.4 87.4
Total 32.2 62.7 100.3 150.9 202.6
Achievable High Cumulative Savings (GWh)
Residential 20.4 32.0 43.8 60.9 76.8
Commercial 25.3 45.7 69.2 97.9 127.1
Industrial 21.7 47.2 79.4 118.7 152.7
Total 67.3 124.9 192.5 277.4 356.7
EnerNOC Utility Solutions Consulting 7-1
CHAPTER 7
MEASURE-LEVEL ENERGY EFFICIENCY POTENTIAL BY SECTOR
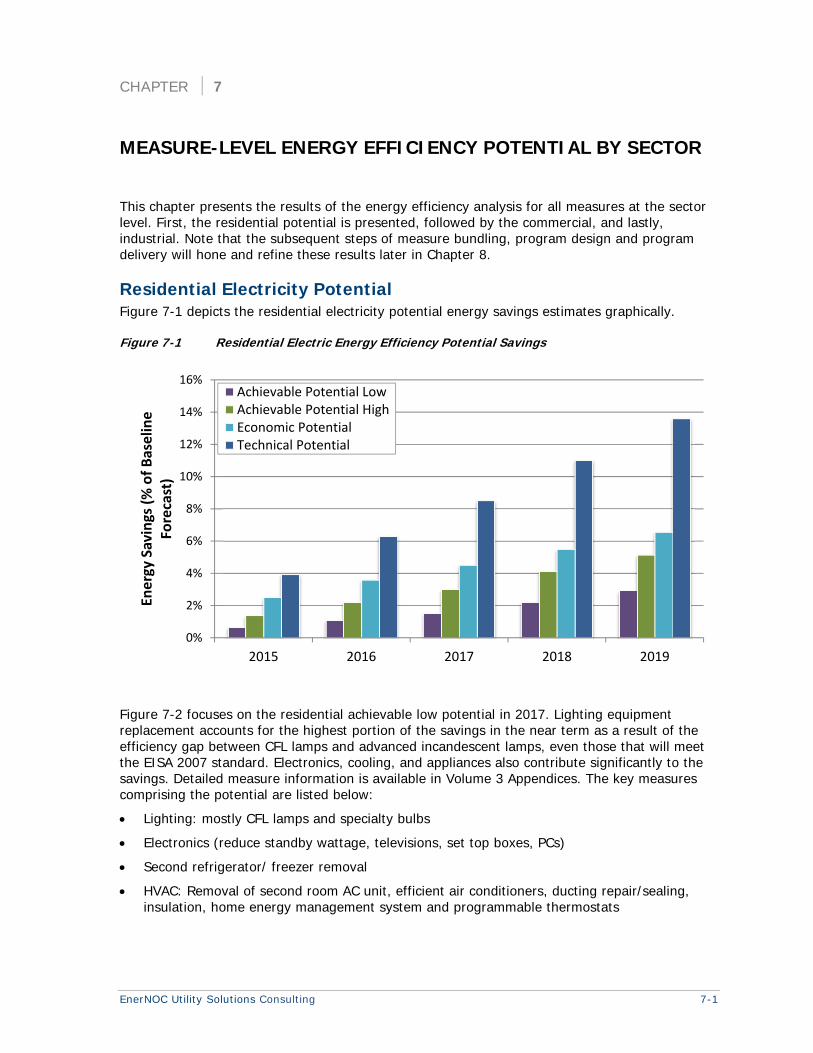
This chapter presents the results of the energy efficiency analysis for all measures at the sector level. First, the residential potential is presented, followed by the commercial, and lastly, industrial. Note that the subsequent steps of measure bundling, program design and program delivery will hone and refine these results later in Chapter 8.
Residential Electricity Potential Figure 7-1 depicts the residential electricity potential energy savings estimates graphically.
Figure 7-1 Residential Electric Energy Efficiency Potential Savings
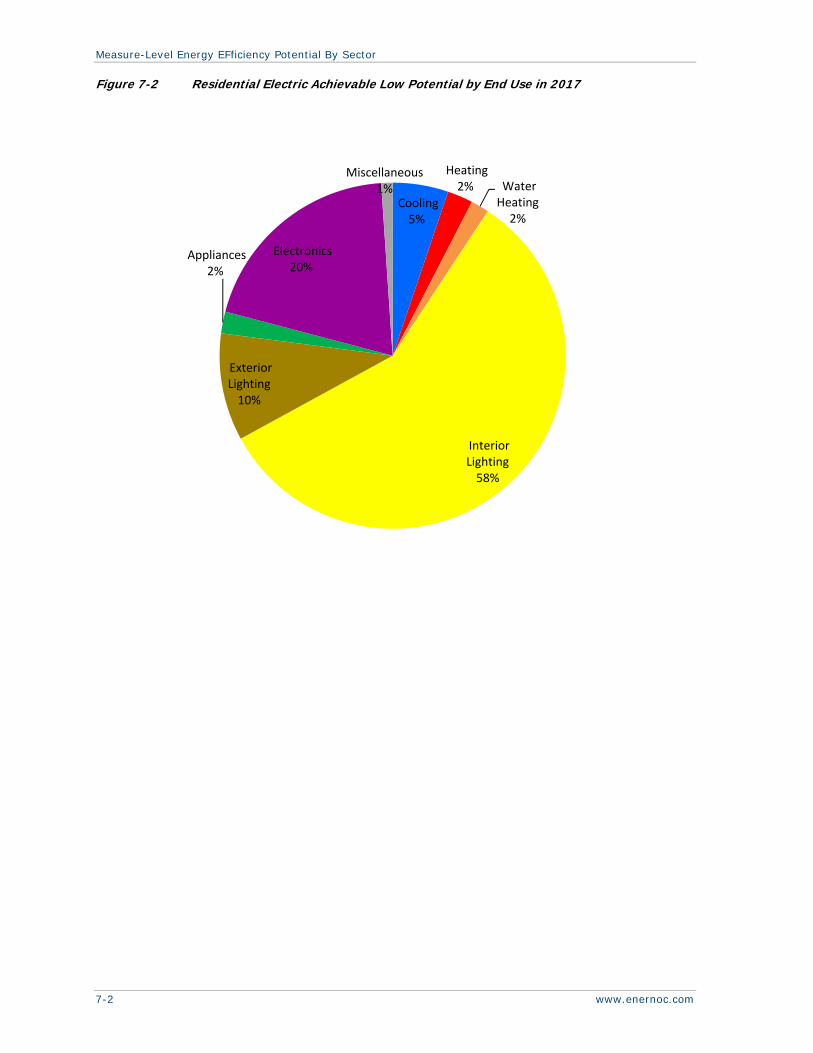
Figure 7-2 focuses on the residential achievable low potential in 2017. Lighting equipment replacement accounts for the highest portion of the savings in the near term as a result of the efficiency gap between CFL lamps and advanced incandescent lamps, even those that will meet the EISA 2007 standard. Electronics, cooling, and appliances also contribute significantly to the savings. Detailed measure information is available in Volume 3 Appendices. The key measures comprising the potential are listed below:
Lighting: mostly CFL lamps and specialty bulbs
Electronics (reduce standby wattage, televisions, set top boxes, PCs)
Second refrigerator/ freezer removal
HVAC: Removal of second room AC unit, efficient air conditioners, ducting repair/sealing, insulation, home energy management system and programmable thermostats
0%
2%
4%
6%
8%
10%
12%
14%
16%
2015 2016 2017 2018 2019
Energy Savings (% of Baselin
e
Forecast)
Achievable Potential LowAchievable Potential HighEconomic PotentialTechnical Potential
Measure-Level Energy EFficiency Potential By Sector
7-2 www.enernoc.com
Figure 7-2 Residential Electric Achievable Low Potential by End Use in 2017
Cooling 5%
Heating 2% Water
Heating 2%
Interior Lighting 58%
Exterior Lighting 10%
Appliances 2%
Electronics 20%
Miscellaneous 1%
Measure-Level Energy EFficiency Potential By Sector
EnerNOC Utility Solutions Consulting 7-3
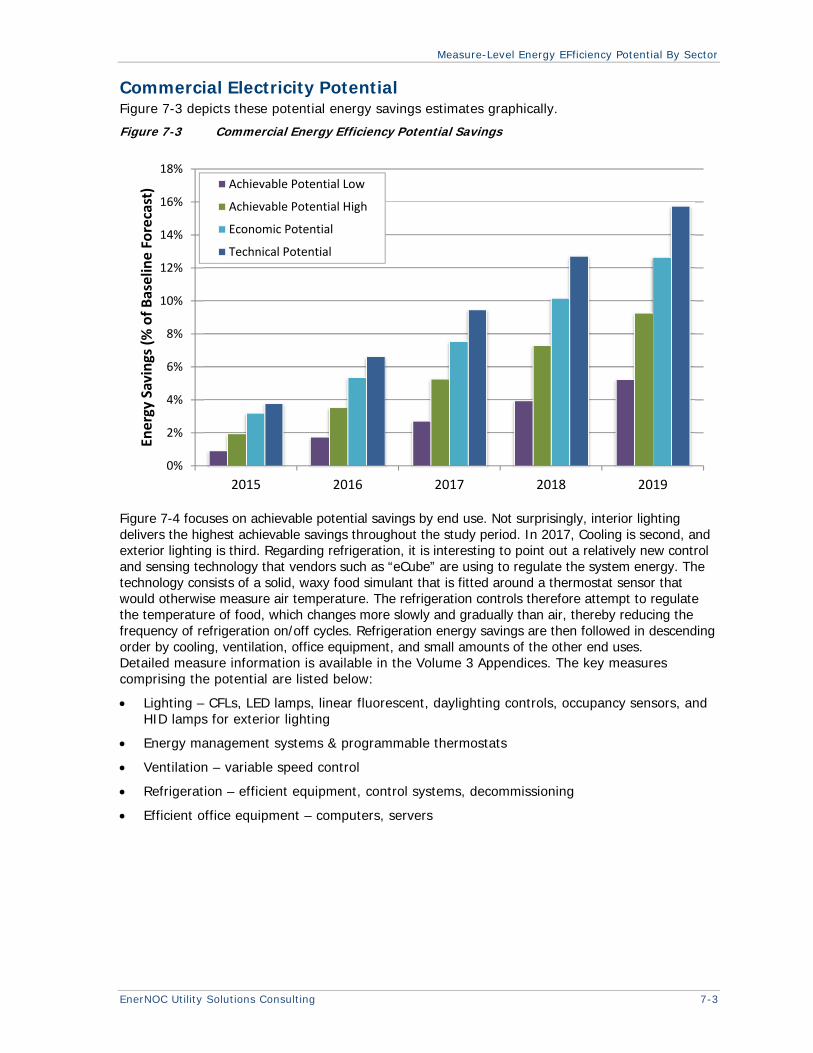
Commercial Electricity Potential Figure 7-3 depicts these potential energy savings estimates graphically.
Figure 7-3 Commercial Energy Efficiency Potential Savings
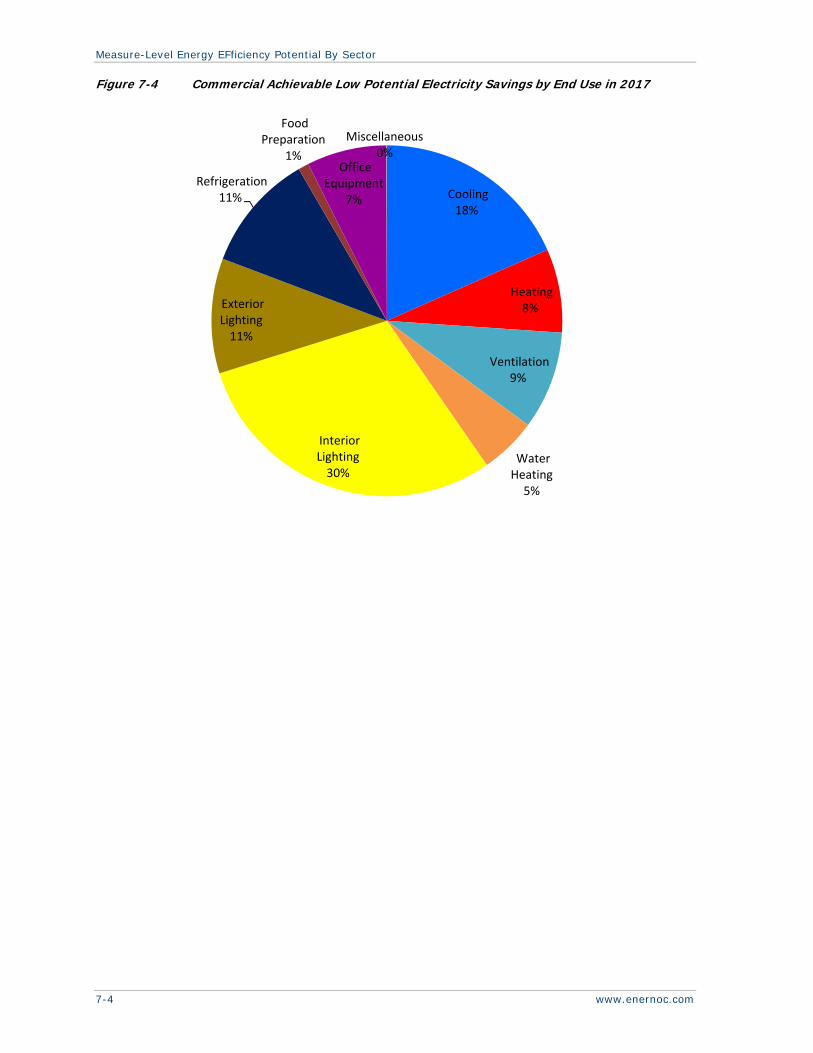
Figure 7-4 focuses on achievable potential savings by end use. Not surprisingly, interior lighting delivers the highest achievable savings throughout the study period. In 2017, Cooling is second, and exterior lighting is third. Regarding refrigeration, it is interesting to point out a relatively new control and sensing technology that vendors such as “eCube” are using to regulate the system energy. The technology consists of a solid, waxy food simulant that is fitted around a thermostat sensor that would otherwise measure air temperature. The refrigeration controls therefore attempt to regulate the temperature of food, which changes more slowly and gradually than air, thereby reducing the frequency of refrigeration on/off cycles. Refrigeration energy savings are then followed in descending order by cooling, ventilation, office equipment, and small amounts of the other end uses. Detailed measure information is available in the Volume 3 Appendices. The key measures comprising the potential are listed below:
Lighting – CFLs, LED lamps, linear fluorescent, daylighting controls, occupancy sensors, and HID lamps for exterior lighting
Energy management systems & programmable thermostats
Ventilation – variable speed control
Refrigeration – efficient equipment, control systems, decommissioning
Efficient office equipment – computers, servers
0%
2%
4%
6%
8%
10%
12%
14%
16%
18%
2015 2016 2017 2018 2019
Energy Savings (% of Baselin
e Forecast) Achievable Potential Low
Achievable Potential High
Economic Potential
Technical Potential
Measure-Level Energy EFficiency Potential By Sector
7-4 www.enernoc.com
Figure 7-4 Commercial Achievable Low Potential Electricity Savings by End Use in 2017
Cooling 18%
Heating 8%
Ventilation 9%
Water Heating 5%
Interior Lighting 30%
Exterior Lighting 11%
Refrigeration 11%
Food Preparation
1%Office
Equipment 7%
Miscellaneous 0%
Measure-Level Energy EFficiency Potential By Sector
EnerNOC Utility Solutions Consulting 7-5
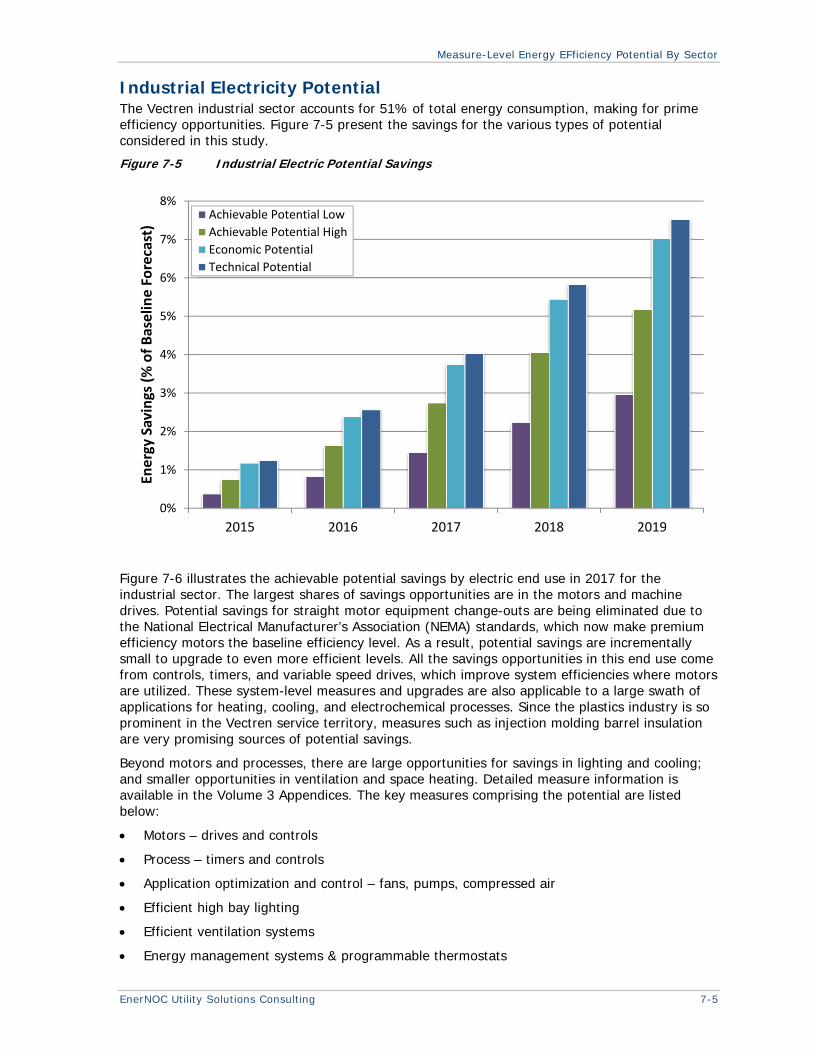
Industrial Electricity Potential The Vectren industrial sector accounts for 51% of total energy consumption, making for prime efficiency opportunities. Figure 7-5 present the savings for the various types of potential considered in this study.
Figure 7-5 Industrial Electric Potential Savings
Figure 7-6 illustrates the achievable potential savings by electric end use in 2017 for the industrial sector. The largest shares of savings opportunities are in the motors and machine drives. Potential savings for straight motor equipment change-outs are being eliminated due to the National Electrical Manufacturer’s Association (NEMA) standards, which now make premium efficiency motors the baseline efficiency level. As a result, potential savings are incrementally small to upgrade to even more efficient levels. All the savings opportunities in this end use come from controls, timers, and variable speed drives, which improve system efficiencies where motors are utilized. These system-level measures and upgrades are also applicable to a large swath of applications for heating, cooling, and electrochemical processes. Since the plastics industry is so prominent in the Vectren service territory, measures such as injection molding barrel insulation are very promising sources of potential savings.
Beyond motors and processes, there are large opportunities for savings in lighting and cooling; and smaller opportunities in ventilation and space heating. Detailed measure information is available in the Volume 3 Appendices. The key measures comprising the potential are listed below:
Motors – drives and controls
Process – timers and controls
Application optimization and control – fans, pumps, compressed air
Efficient high bay lighting
Efficient ventilation systems
Energy management systems & programmable thermostats
0%
1%
2%
3%
4%
5%
6%
7%
8%
2015 2016 2017 2018 2019
Energy Savings (% of Baselin
e Forecast)
Achievable Potential Low
Achievable Potential High
Economic Potential
Technical Potential

Measure-Level Energy EFficiency Potential By Sector
7-6 www.enernoc.com
Figure 7-6 Industrial Achievable Low Electricity Potential Savings by End Use in 2017
Cooling 11%
Heating 2%
Ventilation 2%
Interior Lighting 21%
Exterior Lighting 1%
Motors 51%
Process 12%
Misc.0%

EnerNOC Utility Solutions Consulting 8-1
CHAPTER 8
PROGRAM POTENTIAL AND ACTION PLAN
The Action Plan is the heart of the study. This is where the multitude of energy efficiency measures covered in previous chapters get bundled into delivery mechanisms to take on the form of specific energy efficiency programs. Several changes and adjustments occur in the translation from the market potential assessment to the program designs in the Action Plan, as the measure mix may change due to program delivery considerations. Table 8-1 below lists the distinct programs that emerge from this exercise to deliver an effective and balanced portfolio of energy savings opportunities across all customer segments.
Table 8-1 Portfolio of Energy Efficiency Programs Included in Action Plan
Residential Programs Commercial & Industrial Programs
Lighting Prescriptive
Efficient Products Custom Incentives
Income Qualified Weatherization (IQW) Schools Program
IQW Plus Strategic Energy Management (SEM)
New Construction Business & Multi Family New Construction
Multi Family Direct Install Small Business Direct Install
Home Energy Assessment
School Kit
Whole House Plus
Appliance Recycling
Behavioral Feedback Tools
Programmatic Framework Each program contemplates and outlines a programmatic framework for administrators and implementers. The items considered and developed for this framework include those listed below. Detailed write-ups delve into the specific recommendations for each program in Volume 4 of this report.
Target market
Implementation strategy, including delivery channels, marketing, education and outreach
Program issues, risks and risk management strategies
Eligible measures and incentives
Evaluation, measurement and verification requirements and guidance
Administrative requirements
Estimated participation
Program budget
Program energy savings and demand reduction
Cost effectiveness
Program Potential and Action Plan
8-2 www.enernoc.com
The state of Indiana has mandated efficiency targets for regulated electric utilities, specifying that they reach certain levels of savings by implementing a required set of programs, known as Core programs, and that they should make up any shortfall between the targets and the Core program savings with a flexible or optional set of Core Plus programs, which can be designed to suit each utility. The Residential Lighting, Income Qualified Weatherization, Home Energy Assessment, School Kit, and Business Prescriptive programs are Core programs; and the remainder are Core Plus. These distinctions are outlined later in the program highlights and descriptions.
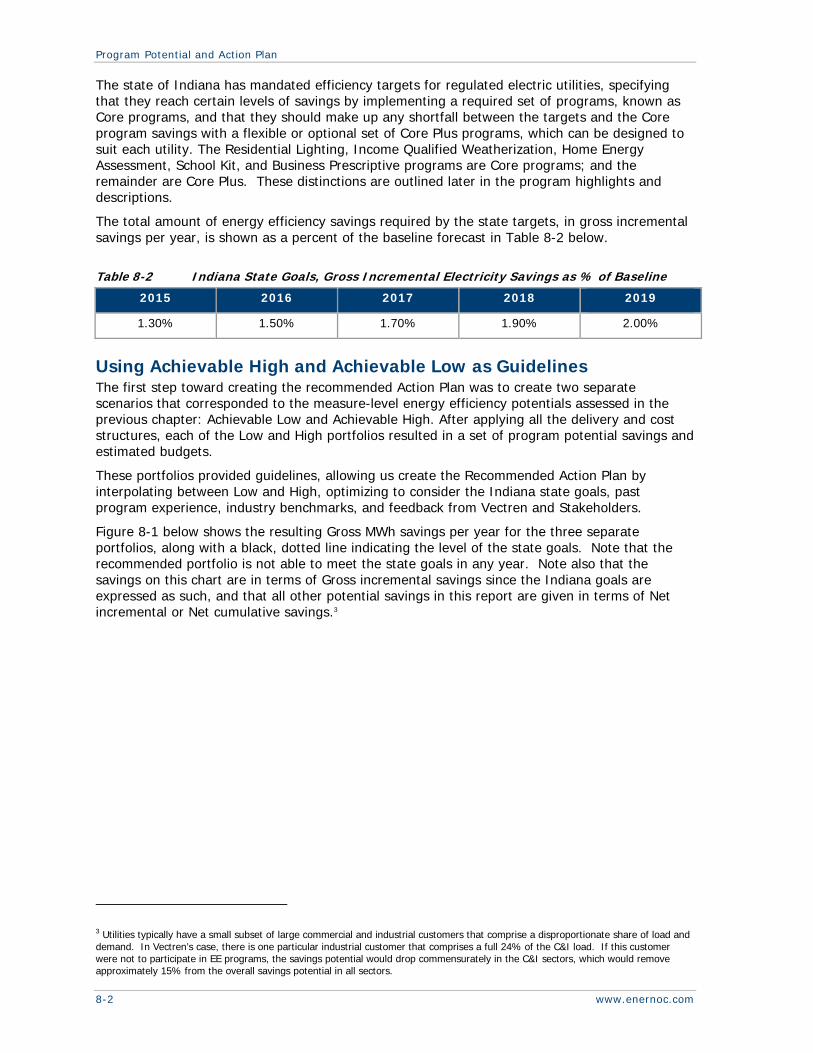
The total amount of energy efficiency savings required by the state targets, in gross incremental savings per year, is shown as a percent of the baseline forecast in Table 8-2 below.
Table 8-2 Indiana State Goals, Gross Incremental Electricity Savings as % of Baseline
2015 2016 2017 2018 2019
1.30% 1.50% 1.70% 1.90% 2.00%
Using Achievable High and Achievable Low as Guidelines The first step toward creating the recommended Action Plan was to create two separate scenarios that corresponded to the measure-level energy efficiency potentials assessed in the previous chapter: Achievable Low and Achievable High. After applying all the delivery and cost structures, each of the Low and High portfolios resulted in a set of program potential savings and estimated budgets.
These portfolios provided guidelines, allowing us create the Recommended Action Plan by interpolating between Low and High, optimizing to consider the Indiana state goals, past program experience, industry benchmarks, and feedback from Vectren and Stakeholders.
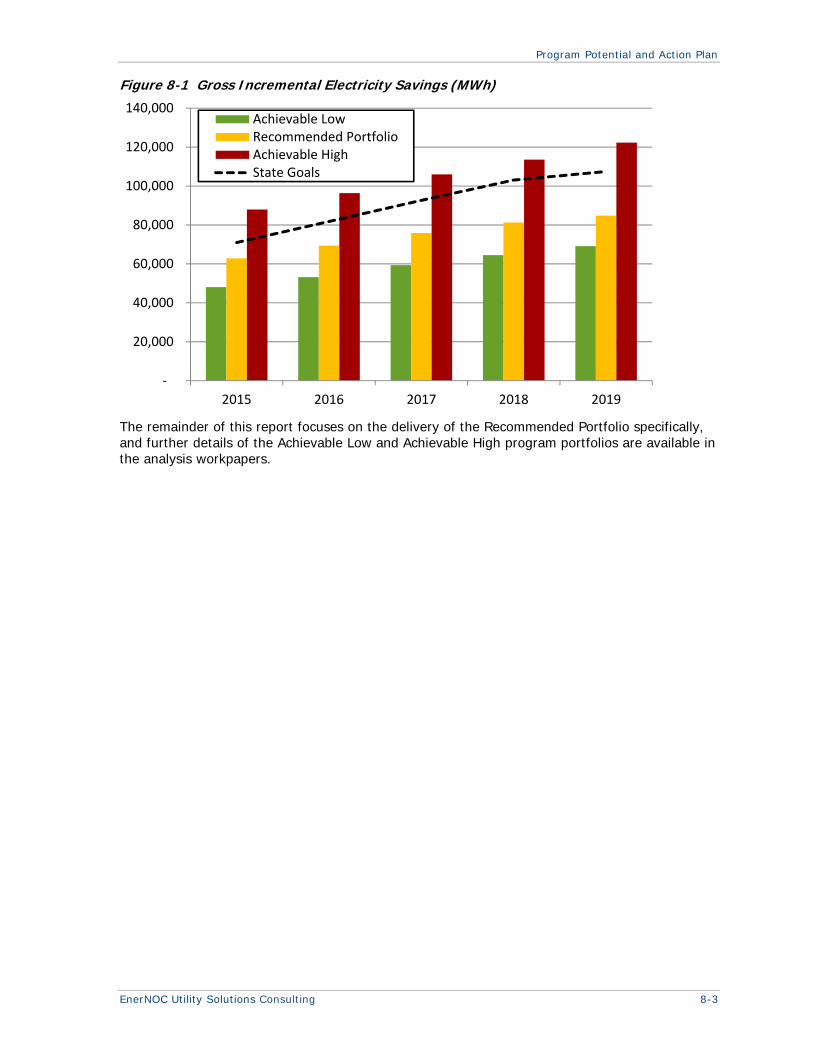
Figure 8-1 below shows the resulting Gross MWh savings per year for the three separate portfolios, along with a black, dotted line indicating the level of the state goals. Note that the recommended portfolio is not able to meet the state goals in any year. Note also that the savings on this chart are in terms of Gross incremental savings since the Indiana goals are expressed as such, and that all other potential savings in this report are given in terms of Net incremental or Net cumulative savings.3
3 Utilities typically have a small subset of large commercial and industrial customers that comprise a disproportionate share of load and demand. In Vectren’s case, there is one particular industrial customer that comprises a full 24% of the C&I load. If this customer were not to participate in EE programs, the savings potential would drop commensurately in the C&I sectors, which would remove approximately 15% from the overall savings potential in all sectors.
Program Potential and Action Plan
EnerNOC Utility Solutions Consulting 8-3
Figure 8-1 Gross Incremental Electricity Savings (MWh)
The remainder of this report focuses on the delivery of the Recommended Portfolio specifically, and further details of the Achievable Low and Achievable High program portfolios are available in the analysis workpapers.
‐
20,000
40,000
60,000
80,000
100,000
120,000
140,000
2015 2016 2017 2018 2019
Achievable LowRecommended PortfolioAchievable HighState Goals
Program Potential and Action Plan
8-4 www.enernoc.com
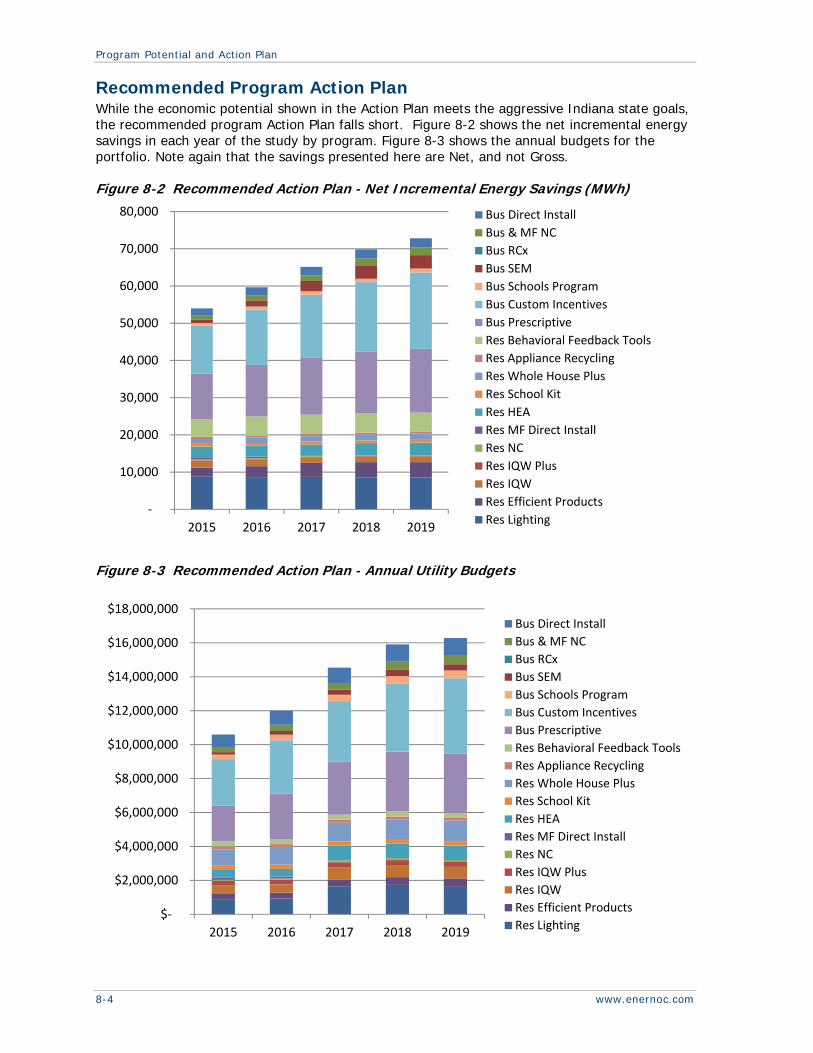
Recommended Program Action Plan While the economic potential shown in the Action Plan meets the aggressive Indiana state goals, the recommended program Action Plan falls short. Figure 8-2 shows the net incremental energy savings in each year of the study by program. Figure 8-3 shows the annual budgets for the portfolio. Note again that the savings presented here are Net, and not Gross.
Figure 8-2 Recommended Action Plan - Net Incremental Energy Savings (MWh)
Figure 8-3 Recommended Action Plan - Annual Utility Budgets
‐
10,000
20,000
30,000
40,000
50,000
60,000
70,000
80,000
2015 2016 2017 2018 2019
Bus Direct Install
Bus & MF NC
Bus RCx
Bus SEM
Bus Schools Program
Bus Custom Incentives
Bus Prescriptive
Res Behavioral Feedback Tools
Res Appliance Recycling
Res Whole House Plus
Res School Kit
Res HEA
Res MF Direct Install
Res NC
Res IQW Plus
Res IQW
Res Efficient Products
Res Lighting
$‐
$2,000,000
$4,000,000
$6,000,000
$8,000,000
$10,000,000
$12,000,000
$14,000,000
$16,000,000
$18,000,000
2015 2016 2017 2018 2019
Bus Direct Install
Bus & MF NC
Bus RCx
Bus SEM
Bus Schools Program
Bus Custom Incentives
Bus Prescriptive
Res Behavioral Feedback Tools
Res Appliance Recycling
Res Whole House Plus
Res School Kit
Res HEA
Res MF Direct Install
Res NC
Res IQW Plus
Res IQW
Res Efficient Products
Res Lighting
Program Potential and Action Plan
EnerNOC Utility Solutions Consulting 8-5
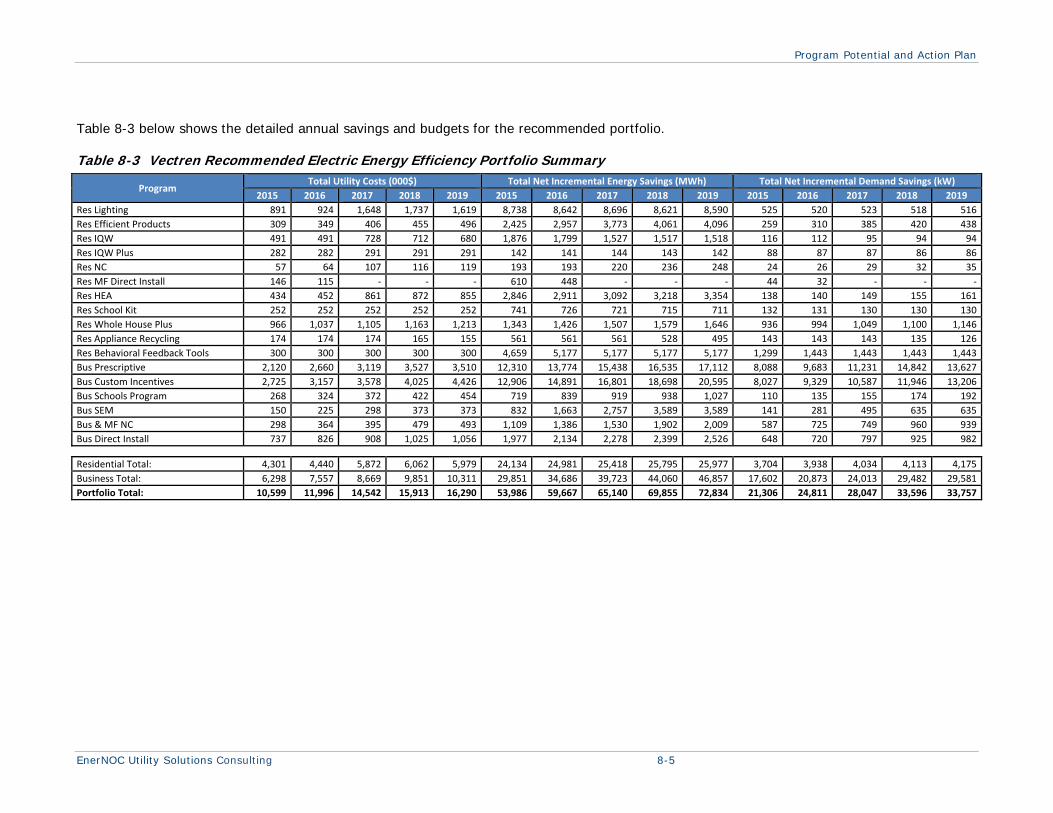
Table 8-3 below shows the detailed annual savings and budgets for the recommended portfolio.
Table 8-3 Vectren Recommended Electric Energy Efficiency Portfolio Summary
Program Total Utility Costs (000$) Total Net Incremental Energy Savings (MWh) Total Net Incremental Demand Savings (kW)
2015 2016 2017 2018 2019 2015 2016 2017 2018 2019 2015 2016 2017 2018 2019
Res Lighting 891 924 1,648 1,737 1,619 8,738 8,642 8,696 8,621 8,590 525 520 523 518 516
Res Efficient Products 309 349 406 455 496 2,425 2,957 3,773 4,061 4,096 259 310 385 420 438
Res IQW 491 491 728 712 680 1,876 1,799 1,527 1,517 1,518 116 112 95 94 94
Res IQW Plus 282 282 291 291 291 142 141 144 143 142 88 87 87 86 86
Res NC 57 64 107 116 119 193 193 220 236 248 24 26 29 32 35
Res MF Direct Install 146 115 ‐ ‐ ‐ 610 448 ‐ ‐ ‐ 44 32 ‐ ‐ ‐
Res HEA 434 452 861 872 855 2,846 2,911 3,092 3,218 3,354 138 140 149 155 161
Res School Kit 252 252 252 252 252 741 726 721 715 711 132 131 130 130 130
Res Whole House Plus 966 1,037 1,105 1,163 1,213 1,343 1,426 1,507 1,579 1,646 936 994 1,049 1,100 1,146
Res Appliance Recycling 174 174 174 165 155 561 561 561 528 495 143 143 143 135 126
Res Behavioral Feedback Tools 300 300 300 300 300 4,659 5,177 5,177 5,177 5,177 1,299 1,443 1,443 1,443 1,443
Bus Prescriptive 2,120 2,660 3,119 3,527 3,510 12,310 13,774 15,438 16,535 17,112 8,088 9,683 11,231 14,842 13,627
Bus Custom Incentives 2,725 3,157 3,578 4,025 4,426 12,906 14,891 16,801 18,698 20,595 8,027 9,329 10,587 11,946 13,206
Bus Schools Program 268 324 372 422 454 719 839 919 938 1,027 110 135 155 174 192
Bus SEM 150 225 298 373 373 832 1,663 2,757 3,589 3,589 141 281 495 635 635
Bus & MF NC 298 364 395 479 493 1,109 1,386 1,530 1,902 2,009 587 725 749 960 939
Bus Direct Install 737 826 908 1,025 1,056 1,977 2,134 2,278 2,399 2,526 648 720 797 925 982
Residential Total: 4,301 4,440 5,872 6,062 5,979 24,134 24,981 25,418 25,795 25,977 3,704 3,938 4,034 4,113 4,175
Business Total: 6,298 7,557 8,669 9,851 10,311 29,851 34,686 39,723 44,060 46,857 17,602 20,873 24,013 29,482 29,581
Portfolio Total: 10,599 11,996 14,542 15,913 16,290 53,986 59,667 65,140 69,855 72,834 21,306 24,811 28,047 33,596 33,757


Program Potential and Action Plan
EnerNOC Utility Solutions Consulting 8-7
Cost Effectiveness With the program savings and budgets, we perform the industry standard cost-effectiveness tests to gauge the economic merits of the portfolio. Each test compares the benefits of the EE programs to their costs – using its own unique perspectives and definitions – all defined in terms of net present value of future cash flows. The definitions for the four standard tests most commonly used in EE program design are described below.
Total Resource Cost test (TRC). The benefits in this test are the lifetime avoided energy costs and avoided capacity costs. The costs in this test are the incremental measure costs plus all administrative costs spent by the program administrator.
Utility Cost Test (UCT). The benefits in this test are the lifetime avoided energy costs and avoided capacity costs, the same as the TRC benefits. The costs in this test are the program administrator’s incentive costs and administrative costs.
Participant Cost Test (PCT). The benefits in this test are the lifetime value of retail rate savings (which is another way of saying “lost utility revenues”). The costs in this test are those seen by the participant; in other words: the incremental measure costs minus the value of incentives paid out.
Rate Impact Measure test (RIM). The benefits of the RIM test are the same as the TRC benefits. The RIM costs are the same as the UCT, except for the addition of lost revenue. This test attempts to show the effects that EE programs will have on rates, which is almost always to raise them on a per unit basis. Thus, costs typically outweigh benefits from the point of view of this test, but the assumption is that absolute energy use decreases to a greater extent than per-unit rates are increased — resulting in lower average utility bills.
The cost effectiveness results for the Vectren Recommended Portfolio are shown in Table 8-4, sporting lifetime TRC benefits of $177 million dollars and costs of $92 million dollars for a robust TRC ratio of 1.92.
Table 8-4 Vectren Recommended Action Plan Cost Effectiveness summary TRC Ratio TRC Benefits TRC Costs UCT Ratio PCT Ratio RIM Ratio
Res Lighting 1.47 $12,729,504 $8,638,583 2.33 7.39 0.44
Res Efficient Products 2.31 $5,767,547 $2,494,058 3.55 11.18 0.51
Res IQW 0.99 $2,475,435 $2,503,149 0.99 ‐ 0.35
Res IQW Plus 0.56 $650,864 $1,166,742 0.56 ‐ 0.35
Res NC 1.02 $453,989 $443,548 1.23 9.82 0.42
Res MF Direct Install 1.47 $383,335 $260,561 1.69 20.72 0.41
Res HEA 1.90 $5,286,017 $2,783,242 1.90 ‐ 0.42
Res School Kit 1.14 $1,165,755 $1,024,230 1.14 ‐ 0.38
Res Whole House Plus 1.07 $8,212,627 $7,653,155 1.85 2.47 0.66
Res Appliance Recycling 1.05 $723,032 $686,727 1.05 ‐ 0.40
Res Behavioral Feedback Tools 1.18 $1,442,788 $1,220,290 1.18 ‐ 0.42
Bus Prescriptive 2.06 $50,575,254 $24,584,518 4.21 3.91 0.83
Bus Custom Incentives 2.52 $70,292,200 $27,918,583 4.87 5.25 0.82
Bus Schools Program 0.69 $2,168,631 $3,155,364 1.46 1.96 0.45
Bus SEM 1.61 $1,821,203 $1,133,881 1.61 ‐ 0.43
Bus & MF NC 2.06 $5,972,921 $2,896,189 3.66 5.04 0.75
Bus Direct Install 1.85 $6,808,569 $3,675,085 1.85 ‐ 0.56
Residential Total: 1.36 $39,290,894 $28,874,285 1.83 8.54 0.47
Business Total: 2.17 $137,638,778 $63,363,620 4.00 4.87 0.78
Portfolio Total: 1.92 $176,929,672 $92,237,905 3.17 5.61 0.68

EnerNOC Utility Solutions Consulting 9-1
CHAPTER 9
CONCLUSIONS AND RECOMMENDATIONS
The results of this study reveal that significant energy efficiency opportunities exist for Vectren in Southern Indiana, despite aggressive appliance and efficiency standards and a challenging macroeconomic environment.
Our program analysis shows that Vectren can achieve Net incremental electric energy savings of 53,986 MWh in 2015, increasing to 72,834 MWh in 2019. This equates to Gross incremental savings of 62,818 MWh in 2015 and 84,809 MWh in 2019, all by implementing the programs and measures presented in this report.
Vectren’s energy-efficiency programs are relatively young compared to other programs in the nation, but have made significant impacts already and are building appreciable market momentum. Based on our market potential assessment and program design analysis, EnerNOC provides the following high-level recommendations for the portfolio. We fully expect that Vectren, the stakeholders, and the implementers will consider the plans and recommendations in this report now, at the outset of the forthcoming implementation cycle; and that they will adopt the elements that are appropriate, adjust the elements that fit differently when translated into the trenches and front lines of program delivery, and continue to revisit the report as a reference throughout the next years as situations and markets continue to change and evolve.
General Recommendations Increase focus on non-residential programs: Our study shows that a large portion of
the program savings from energy efficiency efforts will come from the commercial and industrial sectors. Vectren has already begun to shift budget and focus toward the C&I sectors, as evidenced by budgeting trends in 2013 and 2014 as well as the primary market research conducted on large C&I customers as part of this study. Increasing program efforts in the C&I sectors will not only lead to harvesting larger EE savings, but to increased business competitiveness and decreased operating costs for customers. Additionally, these sectors offer larger projects, which can be attained and bundled more readily and efficiently.
Continued collaboration among stakeholders: The discourse and information sharing between stakeholders, utilities, and EnerNOC on this study has been effective and transparent. Continuing this trend is of paramount importance to the future success of programs. It is essential to cultivate a mutual understanding of the dynamic nature of the energy efficiency industry due to its intrinsic linkage with human behavior and the customer mind. Ongoing interactions should be marked by an understanding of collaboration, flexibility, and continuous improvement.
Deliver electric and natural gas programs jointly when possible: Vectren also has a broad array of natural gas energy efficiency programs to help its natural gas customers save on their gas bills. Administrative efficiencies and economies of scale can be reached with dual fuel program offerings in applicable programs like HEA and IQW, where both electric and gas savings can be obtained without creating duplicative, administrative cost structures. Further, Indiana’s concept of a statewide Therm Bank provides an excellent platform to deliver joint electric and natural gas programs on a straightforward and highly cost-effective basis. In this paradigm, if it proves feasible and appropriate to management and to stakeholders, Vectren could share costs across its electric and gas programs to extend their reach and effectiveness.
Conclusions and Recommendations
9-2 www.enernoc.com
Residential Recommendations Focus on lighting: The largest share of achievable energy efficiency potential in the
residential sector continues to come from CFLs. This is in spite of the forthcoming EISA standards that will reduce their per-unit savings compared to the new baseline. Also, Vectren should focus strong attention on specialty lamps, as they are not affected by the EISA standard, and prepare for the entrance of LED lamps into their programs in the later years of the portfolio.
Implement and monitor behavioral feedback programs: The behavioral modification program to be implemented by OPower is shown in the program plans to comprise a significant amount of Vectren’s portfolio savings. This initiative was added at the program design stage, and was not included in our bottom-up, measure level potential analysis. This is due to the fact that it is not a specific action or piece of equipment, per se, as well as the fact that it does not go through the typical customer-adoption model that other measures encounter. The program is simply delivered to as many participants as the planners deem appropriate, and produces a statistically measured energy reduction effect in a treatment group (vs. a control group that does not receive the program treatment). It should be monitored carefully, however, as it is a new and emerging opportunity. Relatively little is known about the specific actions that customers perform to reduce their energy usage in this program, and it may undergo meaningful change in customer responsiveness and evaluation paradigms in the coming years. Additionally, savings under this program will not persist after the program is ended, and must be continually renewed each year with additional cost and effort, whereas the savings from a capital equipment measure can last 10 to 20 years.
Develop deeper, follow-on measures in existing programs: Some current Vectren program delivery structures are pursuing low-cost measures through rapid customer touches with direct-install components only. We have recommended the addition of more deep, involved measures to capitalize on customer touches as much as possible. While you are in the home of a customer, it makes better sense to cross-sell these other measures and harvest as many energy savings as you can. This would include major equipment replacements and shell measures such as duct sealing and insulation.
Consider social media avenues for targeted program delivery: As internet social media paradigms become the norm in today’s wired society, companies like Groupon, Amazon Local Deals, and Living Social have assembled a nationwide network of businesses into a well-oiled, rebate-issuing machine. Vectren should consider if there are opportunities to link their energy efficiency trade ally network to one of these companies to facilitate the target marketing, processing, and delivery of rebates. These vendors have sophisticated tracking systems and databases that may facilitate EM&V reporting on the back end as well.
Commercial & Industrial Recommendations Aggressively pursue lighting savings: The commercial sector in particular has significant
savings potential in lighting equipment, both interior and exterior. Notably, LED lamps are showing as cost effective in the commercial sector due to aggressive forecasts of cost reductions, as well as higher hours of operation than their non-economic counterparts in residential settings. Savings are also available through occupancy sensors, timers, and energy management systems. Vectren should strongly pursue lighting savings to accelerate the phase out of T12 fluorescent lighting. In particular, program efforts can help intercept building operators before they make purchase and stocking decisions that could lead to the hoarding of T12 lamps.
Focus industrial program efforts on motor controls and system optimizations: The savings for the industrial sector are all about control and optimization of motors and processes. Low-cost retrofits can often have significant energy impacts with minimal disruption of (and often times improvement of) business processes.
Conclusions and Recommendations
EnerNOC Utility Solutions Consulting 9-3
Target niches with segment specific programs: There are specific business segments that offer considerable savings potential, but will not typically be reached by standard rebates and generic business programs. Consider initiating specifically targeted sub-programs within business standard and custom for areas such as: hotels and lodging, food preparation equipment in restaurants, and refrigeration equipment in grocery stores.
Implement new programs: We have identified additional programs that show promise to expand Vectren’s portfolio of programs to address Indiana’s aggressive statewide savings goals. These programs are as follows:
1. Strategic Energy Management. For large customers, SEM initiatives can deliver substantial savings over long time horizons. This means coming alongside the larger customers to create a customized, multi-year plan, identify metrics, set goals, and provide technical assistance and attention from dedicated account executives or energy coaches.
2. Business and Multifamily New Construction. A program to encourage more rapid adoption of efficient building design practices is a very relevant addition to the Vectren portfolio.

EnerNOC Utility Solutions Consulting 500 Ygnacio Valley Road, Suite 450 Walnut Creek, CA 94596
P: 925.482.2000 F: 925.284.3147
About EnerNOC EnerNOC’s Utility Solutions Consulting team is part of EnerNOC’s Utility Solutions, which provides a comprehensive suite of demand-side management (DSM) services to utilities and grid operators worldwide. Hundreds of utilities have leveraged our technology, our people, and our proven processes to make their energy efficiency (EE) and demand response (DR) initiatives a success. Utilities trust EnerNOC to work with them at every stage of the DSM program lifecycle – assessing market potential, designing effective programs, implementing those programs, and measuring program results.
EnerNOC’s Utility Solutions deliver value to our utility clients through two separate practice areas – Implementation and Consulting.
• Our Implementation team leverages EnerNOC’s deep “behind-the-meter expertise” and world-class technology platform to help utilities create and manage DR and EE programs that deliver reliable and cost-effective energy savings. We focus exclusively on the commercial and industrial (C&I) customer segments, with a track record of successful partnerships that spans more than a decade. Through a focus on high quality, measurable savings, EnerNOC has successfully delivered hundreds of thousands of MWh of energy efficiency for our utility clients, and we have thousands of MW of demand response capacity under management.
• The Consulting team provides expertise and analysis to support a broad range of utility DSM activities, including: potential assessments; end-use forecasts; integrated resource planning; EE, DR, and smart grid pilot and program design and administration; load research; technology assessments and demonstrations; evaluation, measurement and verification; and regulatory support.
The team has decades of combined experience in the utility DSM industry. The staff is comprised of professional electrical, mechanical, chemical, civil, industrial, and environmental engineers as well as economists, business planners, project managers, market researchers, load research professionals, and statisticians. Utilities view EnerNOC’s experts as trusted advisors, and we work together collaboratively to make any DSM initiative a success.