volume 1 number 1 january-march 2013 issnmujournal.mewaruniversity.org/journalpdf/jir final with...
TRANSCRIPT

Volume 1, No.1, January-March, 2013 1
ISSN :Volume 1 Number 1 January-March 2013

2 Journal of Indian Research
Journal of Indian ResearchA Quarterly Journal of Multidisciplinary Research
Volume 1 Number 1 January- March , 2013
Editorial Board
CA Ashok Kumar Gadiya, Chairperson, Mewar UniversityDr. Mahesh Chandra Sharma, ex-Member of ParliamentRam Bahadur Rai, Senior JournalistDr. Pankaj Chandna, President, Mewar UniversityDr. Ram Chandra, Dr. D.B. OjhaDr. K.K. Vashisth, Dr. V.P. Singh
Editor (H.)Niraj Kumar
Book Review EditorPankaj K.Deo
Contact UsEditor, Journal of Indian ResearchMewar UniversitySector-4C, Vasundhara, Delhi-Gzb. Link Road, Ghaziabad-201012(U.P.)E-mail: [email protected] number: 0120-4758300
Abstracts and Indexinghttp//nkrc.niscair.res.in/
Journal set by
Y.K. Saini
Copyright© Authors. All rights reserved. Authors are responsible for obtaining permission to reproducecopyright material from other sources. The Publisher assumes no responsibility for any statement of fact oropinion or copyright violations in the published papers. The views expressed by authors do not necessarilyrepresent the view-point of the Journal.

Volume 1, No.1, January-March, 2013 3
Journal of Indian ResearchA Quarterly Journal of Multidisciplinary Research
Volume 1 Number 1 January-March, 2013
TABLE OF CONTENTS
Message from Chairperson 5
Editorial 6Niraj Kumar
ArticlesAsia in Post-West Age 8Niraj Kumar
Constraints of China’s Emergence as a Political Alternative to the Western World 31Dr. Binod Singh
Contemplating the Image of Bhairava- A Study of Kshemarâja’s Bhairavânukaranastava 42Dr. Sthaneshwar Timalshina
Basel-3 and Its Impact on Indian Banking System 53Mamta Shah
Internal Maketing Practices in Publishing Industries: A Case study of Saraswati House PVT. LTD. 59Mukta Goyal, Dr. Lokesh Jindal
A Literature Review on Business Practices of Marwari Business Houses in India 69Yash Kumawat, Dr. Narayan Baser
Design Secure Object Oriented Software 73M.U. Bokhari, Mahtab Alam, Prashant Johri
Multi-Stage Software Project Efforts Estimation 85Chetan Nagar & Dr. Anurag Dixit
Establishing Trust in Cloud Computing 91Shweta Agrawal
Parenting and Adolescent Behavior: Feedback from the Classroom 96Dr. Raju Narayan Swamy
Pedagogy of Mathematics 105Ashish Kumar Mittal, Dr. Neetu Chawla

4 Journal of Indian Research
Revamping Teacher Education: Curriculum in the Context of Inclusive Education 111Seema Sharma, Dr. Satveer S. Barwal
Right to Education & Schooling 118Dr. V.P. Singh,
Hindu Festivals: Hazards to Environment & Ecology 136V.S.Khan
Sensuality – A Catalyst in The God of Small Things 142
Rakhi Sharma, Dr. Pradeep Kumar Talan
Book ReviewSchool Education, Pluralism and Marginality: Comparative Perspectives by Christine Sleeter, 146Shashi Bhushan Upadhyay, ArvindK.Mishra, Sanjay Kumar (2012)Pankaj K. Deo

Volume 1, No.1, January-March, 2013 5
CHAIRPERSON’S MESSAGE
Moving into the second decade of the 21st century, we can assert with a sense of pride that India has madegiant strides of progress, be it the field of science and technology, trade, industry or education. It will be noexaggeration to say that the 21st century belongs to us, and we Indians need to project ourselves as the newtorch bearer of the human race.
We need to present our own perspective on new discoveries and innovation in the field of science andtechnology and our own insight on new theories being propounded in the field of humanities and socialsciences.
Mewar University has taken a small step in this direction by launching Journal of Indian Research, whichintends to serve as a new forum of its own kind, bringing together academia and industry and expanding thehorizon for all those who are engaged in research. Mewar University has been working hard to forge amutually beneficial relationship between industry and academia as well as to encourage interdisciplinaryapproach to research. I believe one day this small step of the university will prove to be a quantum leap, andthe journal will become the breeding ground for new ideas and innovation in every field of research.
I request everyone engaged in research in India as well as abroad to send their innovative and path breakingresearch articles and papers for publication in our journal.
I congratulate the editorial team and wish them good luck.
CA Ashok Kumar Gadiya

6 Journal of Indian Research
EDITORIAL
The Journal of Indian Research(JIR) has been founded by Mewar Education Society under the aegis ofMewar University. This is the journal’s inaugural issue. The JIR will be published quarterly. As part of theinaugural edition of the quarterly publication schedule, the JIR editors take this opportunity to reflect over thejournal’s objectives and to offer some thoughts on the way forward.
The JIR has since its inception received tremendous support from the research scholars and Mewar University.The JIR intends to establish itself as one of Asia’s pioneering, peer-reviewed journal. The JIR researcharticles will present theoretically sound and factually dense arguments for illuminating the readers. The JIRaims to maintain high research standards and seek submissions from scholars working at best universities andinstitutions in India and around the world.
The JIR is multi-disciplinary in its scope. This is the only outcome in an interconnected, digital age. Spanishphilosopher Rosa María Rodríguez Magda (1953-2010) who propounded the idea of Trans-modernism arguedin her work, Transmodernidad (2004) that “Our mode of thinking should become, just as our social reality,“trans -border”, fluid, interconnected and unstable. A risk-type thinking for a global risk society.Following the national comes the post-national and, at a later stage, the trans-national. Trans is theprefix that should guide the new digital form of Reason in a reality that is virtual and fluctuating.”
We have entered into a Post-western age. Our mode of thinking must reflect gigantic epistemological shift.The world is polycentric and networked , inter-connected whole. Asian thinking emphasizes synthetic approachrather than analytic tradition of the western world. In Asian thinking , there is a constant flow of signs, matter,energy across Man-Nature continuum. In the analytic tradition of the West, knowledge is sliced, packaged andtransmitted into packets called disciplines. The disciplines were based on ‘‘exclusion”. The academic boundarieswere enumerated and tightly regulated . The knowledge achieved maximum quantization. Asian thought movesin the continuous aspect like a wave, flowing and ebbing at constant interval. Knowledge is beyond excludeddisciplines.
In this age of massive transformation, everything functions as long as it is interconnected. Earlier, variousacademic disciplines were like individual boats sailing alone in the high sea of knowledge. But, the great waveof transformation under the impact of globalization has reduced academic disciplines into cabin of a commonship of knowledge. Colombian philosopher mathematician, Fernando Zalamea terms this synthetic turn as“sheaffing paradigm” where focus has shifted back to re-integration. There is continuous attempt to integrateman and machine. The cyborg model is making trans-human future possible. Is it possible to bring together thesynthetic tradition of the East and the analytic tradition of the West under a common roof that can create thepossibility of integrating respective continuum, nature-man and man-machine, feasible?
The multi-disciplinary nature of this journal aims to address this possibility. The research scholars fromdifferent streams must receive simultaneous knowledge about the new issues and challenges in differentstreams. It is no longer possible to compartmentalize knowledge.
JIR editors are looking for manuscript submissions in three main areas of research. The first is on cutting-edgetechnology and theoretical contributions to basic sciences. The second area of interest is that of the theoreticalcontributions in social sciences and the third is the literature and aesthetics.
The current issue examines the myriad possibilities springing up from the great transformation. The ‘powershift’ from the West to the East has been examined by Niraj Kumar in the article ,’Asia in Post-western Age”.Dr. Binod Singh argues about the domestic weakness in China which might thwart its emergence as analternative to the western world order in his extensive examination, ‘Constraints of China’s Emergence as a

Volume 1, No.1, January-March, 2013 7
Political Alternative to the Western World”. Prof. Sthaneshwar Timalsina has translated Bhairavanukaranstava,a 11th century text of Kashmiri Shaivism. Mamta Shah discusses the regulatory system upon global financialsystem under Basel-3 and its impact on Indian banking System.Yash Kumawat et al. has contributed on thebusiness practices of India’s most successful trading community, Marwari, in their excellent article, “ALiterature Review on Business practices of Marwari Business Houses in India.” Mukta Goyal has excavatednon-monetary incentives as the motivating factor and stability of the employees in her study of Management ofSaraswati Publishing House. M.U. Bokhari et al. has discussed on latest trend in the security of software in anelaborate piece, “Design secured Object Oriented Software”. Chetan Nagar & Dr Anurag Dxit has contributedanother piece on software security, “Multi-stage Software project Efforts Estimation”.
Dr. Raju Narayn Swamy conducted study of parenting and adolescent behavior in classroom and discussedthe result in his article, “Parenting and Adolescent Behavior - Feedback from the Classroom”. Ashish KumarMittal & Dr. Neetu Chawla elucidates effective ways for teaching mathematics in classroom in their article,“Pedagogy of Mathematics”.
Dr. V.P. Singh conducted a study of schooling under the NCERT . The study Report, “Right to Education &Schooling” is being published. V.S. Khan writes about impact of commercialization and consequent environmentaldegradation caused by the immersion of idols in water bodies or fire crackers during various Hindu festivitiesin his article, “Hindu Festival: Hazards to Environment & Ecology”. Rakhi Sharma has done a thoroughexamination of evocation of sensuality in Arundhati Roy’s celebrated work, the God of Small Things.
Our book review editor Pankaj Deo has reviewed Sanjay Kumar,Christine Sleeter et al. edited work on schooleducation , “School Education, Pluralism and Marginality: Comparative Perspectives”.
We have taken the first step towards renaissance of synthetic approach towards the world at large . We wishto continue with our endeavour and seek the co-operation of our readers and research scholars to transformthis little step into an ever-growing movement. To grow is the inherent propensity of every creation. May thisJournal as cornucopia of sign overflow with wisdom!

8 Journal of Indian Research
Journal of Indian Research, Volume 1 No. 1, 2013, 8-30
International Relation
ASIA IN POST-WESTERN AGE
Niraj Kumar*
ABSTRACT
The Asian age has arrived. The uninterrupted growth story has been fuelled by new paradigmof growth and intra-regional cooperation and networking. The countries like Australia and Turkeywhich are on Asian periphery are hankering to be part of Asian growth story. China will soon surpassthe US in terms of GDP. Indonesia, India and Japan are the major players of the resurgence story.Though, the US has launched the Asia as Pivot strategy to perpetuate the hegemony, Asian nations arecutting the cord of the global hegemony. The dollar has been replaced from the East Asian region asthe dominant reference currency and the Asianization of Middle east oil trade is further replacing therole of dollar from intra-Asian trade. The world is moving towards a tripolar global monetary system.The rise of Asia is multi-dimensional. Asia is fast catching the US in research and technology. Thepaper examines the multifarious dimension of this complex change and elucidates how the post-westernage would be more peaceful and discourage emergence of any belligerent hegemon.
Keyword: Asia, dollar hegemony, OPEC, Asianization, renminbi bloc, G-20, ADB, virtual economy,steel production, centre of gravity, Wealth Report, urbanization, WIPO, Patents, High-tech industry,Bancor, MENA, ASEAN, China, Carter Doctrine, fracking, Oil-dollar regime(ODR)
The world has entered Post-Western Age. The demise was drumbeated vigorously by the western masses inanticipation of the apocalypse. The best of the minds got afflicted with the dystopic vision. The Mayancalendar was made the reference point. It was the history coming full circle. Only the Spanish conquest of theNew America and decimation of the native Indians fuelled the industrial revolution in Europe and subsequentascendancy of the West as the new territory offered capital in the form of bullion and land for cash cropplantation to bypass the payment crisis. Now, the visions of those “lost natives” turned into a meme for thedeclining West. The World did end on 21st December, 2012. But, it was the Western world-vision. Coincidingwith the event, dozens of intelligence agencies based in the US prepared a strategic vision for the future underthe aegis of the National Intelligence Council , Global Trends 2030: Alternative Worlds.1 This Reportpublicly accepted the fact that the “unipolar moment” is over and “Pax Americana-the era of Americanascendancy in international politics that began in 1945-is fast winding down.”2 Another major thinktank, Atlantic Council based in the US topped up the NIC assessment with a companion for perpetuating thelimping hegemony in the post-western world, “Envisioning 2030: US Strategy for a post-Western World”.3
Kishore Mahbubani, Asianist scholar-diplomat from Singapore has come up with his bird’s eye view of thechanging power shift from the West to Asia and convergence of material aspirations world across at a timewhen he foresees China as the world’s largest economy within this decade and the United States turned downfrom the world’s sole superpower to a Number 2 position in his new book, “The Great Convergence: Asia,the West, and the Logic of One World” 4
On the other hand, there is plethora of writings by the American experts devising devious ways to perpetuatehegemony through art of offshore-balancing, or instigating turmoil in domestic political system in the developingAsia in the name of liberal democracy. The foremost American exponent of geopolitical (dis)ordering, Zbigniew
* Niraj Kumar is the editor of Journal of Indian Research and author of Arise, Asia! (2002)

Volume 1, No.1, January-March, 2013 9
Brzezinski is rancouring again with his new book, Strategic Vision: America and the Crisis of GlobalPower(2012)5. Brzezinski explores following major questions of the new global reality:
1. What are the implications of the changing distribution of global power from the West to the East,and how is it being affected by the new reality of a politically awakened humanity?
2. Why is America’s global appeal waning, what are the symptoms of America’s domestic and internationaldecline, and how did America waste the unique global opportunity offered by the peaceful end ofthe Cold War? Conversely, what are America’s recuperative strengths and what geopoliticalreorientation is necessary to revitalize America’s world role?
3. What would be the likely geopolitical consequences if America declined from its globally preeminentposition, who would be the almost-immediate geopolitical victims of such a decline, what effectswould it have on the global scale problems of the twenty-first century, and could China assumeAmerica’s central role in world affairs by 2025?6
The clamor for renewing the Western primacy under the American hegemony is growing wild. The Return toAsia strategy announced by the US under which 60% of all naval assets are to be shifted to the Asia-Pacificregion (APR) by 2020 A.D. springs from this imperial hubris. But, geopolitical ordering of 19th or 20th centuryis a wide and far-flung idea in this age when the power has decisively shifted back to the Asian pivot. Asia’srise is irreversible. Asia has returned to its position of the pole star and the post-Western world is straddledwith everyday news of Asia’s home coming as numero uno in tangible and intangible things .
There is a concerted attempt to amputate Asia of its Islamic colour and valour. Asia has been downsized inwestern discourse to a region encompassing upto India only. The terrain of Asia keep on shifting in westernimagination. Only few months back, ‘Asia” was limited merely to South East and East Asia. India was part ofSouth Asia. US government statistics have devised another category, Asia-8 comprising Asia-Pacific nationsexcluding China and Japan. Samuel P. Huntington in his paradigm of “Clash of Civilization” had reduced Asiainto four competing civilizations-Islamic, Hindu, Confucian and Japanese (1993).7 Asia in spite of geographicalunity, common belief system in human-nature continuum, and unity of purpose in the ethos of ‘peaceful rise”through ‘harmonious , inclusive development commensurate with cultural sensibility” is represented as aheterogeneous land-physically, socially and politically. While on the other hand, the ‘West” is pitted as anessentialist category encompassing separated geographies extending as far as Australia, New Zealand, NorthAmerica and the northern Europe.8
In fact, Australia has rafted back into Asia. Australia is part of Asia. The same was echoed by the Chinesethinkers like Liang Ch’chao who promoted the view of Yellow Australia through the fortnightly influentialjournal, Xinmin Congbao(The New People’s Journal) which continued publication till 1907. 9 Australian PrimeMinister Julia Gillard has realized the imperative to be part of Asia. She commissioned Australia in the AsianCentury Implementation Task Force under the Department of the Prime Minister and Cabinet to prepare aWhite paper on Australia in the Asian Century. The task force in its report Australia in the Asian Century10 hasaffirmed that the country’s destiny is tied to its geography. Since the West fades out of eminence, Australia isrooting for space in the Asian pivot. Gillard has launched a plan to teach every Australian student a key Asianlanguage and to make every school have a sister-school in Asia. Singapore’s Asianist proponent KishoreMahbubani has welcomed Australia into comity of Asia and argues that “by the logic of geography, thecontinent of Australia should have been populated with Asians. Instead, by an accident of history,Australia has been predominantly populated with Westerners”, but “the logic of cultural identity cannot”indefinitely “trump hard geopolitical considerations” Mahbubabni declared that historical accident is nowcoming to an end.11

10 Journal of Indian Research
Turkey, too, is part of Asia. Turkey’s bid to join EU since 2005 was stalled on one or another pretext. Turkeyhas realized that it remained the distant “Orient’ in Western imagination. French president Nicolas Sarkozyhumiliated by taking a dig at Turkey that “Turkey has no place inside the European Union …..I want tosay that Europe must give itself borders, that not all countries have a vocation to become members ofEurope, beginning with Turkey which has no place inside the European Union.12 But, now EU is on theventilation, while Turkey is booming with growth. Turkey is now back to Asian co-prosperity sphere. It iswooing out Arab countries. Turkey is consistently taking up the issue of the plight of the Palestinians and theirrights to statehood in the United Nations.
Asia is the world’s largest and most populous continent continues to grow even in geography. It covers 29.9%of the earth’s land area and is the land of more than 60% of the world’s current population. Asia is themesocosm in the hierarchical nesting of the universe. Scientists squiggle that seventy percent of the Universeis dark energy. Similarly, seventy percent of the earth’s surface consists of water and seventy percent ofhuman body contains water. In cosmic nesting of matter, nearly thirty percent of matter has the centrality andremaining act as the connecting space. Asia’s centrality fits neatly into the cosmic scheme. In fact, the politicaltheorists find Nested Hierarchy model as the most apt way to understand the complex security architecture inAsia13. Asia is expanding like the spider web, producing, consuming, weaving, growing benignly unlike malignantgrowth of the Western powers, which had to succumb to the overstretch and overgrowth.
Asia’s rise is not merely a cliché. The recovery of lost dynamism which was caused by the manipulation ofcolonialism and imperialism by the west fuels this multifarious balanced and sustained growth. But, theexamination must proceed from the measurement of the most tangible product- steel. Steel production is avery important marker of tangible economic activity of a nation. The virtual economy trumps over tangibleeconomy in the GDP calculations as the virtual economy is assumed to be value-added. But, sign-economy isnot a substitute for the physical economy. The infrastructure , machine production, automobile industry, housingsector, railway line, ship—each requires persistent supply of steel. Let us compare the figures of steelproduction in Asia vis-à-vis other regions.(Table :1)
Table:1
Steel Production (million tonne,Mt)
Rank Country 2007 2008 2009 2012
1 Peoples Rep. China 494.9 500.5 567.8 716.5
2. EU 209.7 198 139.1 169.4
3. Japan 120.2 118.7 87.5 107.2
4. Russia 72.4 68.5 59.9 70.6
5. USA 98.1 91.4 58.1 88.6
6. India 53.1 55.2 56.6 76.7
7. South Korea 51.5 53.6 48.6 69.3
8. Germany 48.6 45.8 32.7 42.7
9. World 1351.3 1326.5 1219.7 1547.8
Source: World Steel Association, 22 January,201314
Asia’s share grew from 598.1 million tonne in 2005 to 1012.7 million tonne in 2012 i.e. by 414 .6Mt.. Worldproduction has gone down except Asia in same period. World production grew from 1146.5 Mt to 1547.8 Mt.between 2005 -2012, growth of mere 401.3 Mt, whole of which can be attributed to production in Asia. In the

Volume 1, No.1, January-March, 2013 11
world, ‘Other than Asia”, production is either stagnant or have declined. Europe, North America and Africa,have been in the latter category.
Asia’s share of world steel production has increased slightly from 64.5% in 2011 to 65.4% in 2012. It iscommensurate with the population share of Asia in the world population. China’s crude steel production in2012 reached record 716.5 Mt. Only China’s share is hopping 46.3% in 2012. Within a couple of years, Chinaand South Korea would surpass US in steel production.
The figure clearly indicates the status of “hard” economic activity in the US. China is now producing 46% ofglobal steel while the US produces less than 6%. But, this staggering difference is not revealed in the GDPfigure. Similar situation exists all across the economic spectrum. US produced 5.7 million vehicles in2009, China produced 18 million. Printed circuit board(PCB) production in US went down to $4 billion in 2008while the value of PCB produced in China was $16 billion for same period. In 2009, US produced machinetools worth $2.3 billion, while China’s corresponding figure is $15 billion.15 If one takes up the number orweight (currency-free parameters or money-neutral measurement criteria) to compare the manufacturingoutput between the US & China, the US invariably falls behind China in most of the items. The US is stilltouted as the biggest economy and according to the IMF’s latest estimates for 2010, the value of total USGDP was $14.6 trillion while that of China was $5.7 trillion and China’s GDP can surpass US in PPP termsonly in 2016. 16 Though, some economist like Arvind Subramanian of Peterson Institute for InternationalEconomics has been arguing that Chinese economy had surpassed the US economy sometimes in 2010 withtotal output of &14.8 trillion. His calculations are based on new estimates of GDP published by the PennWorld Tables (PWT) under the University of Pennsylvania. 17
How much is Asia’s projected share in world GDP?
In the din of arguments focusing on US-China competition for ‘hegemony” or “Wang”(humane authority), thenarrative of Asian resilience receives reduced attention. Asian share in world GDP is growing fast. AngusMaddison( 1926-2010), the leading economist of the OECD , calculated that Asia’s share of world GDP grewto 40.5% in 2003. This is stupendous feat of Asian genius and hard labour . Asia’s share after the end of thesecond World War was 14.9% in 1950. Asians took off in a baton relay mode.
Japan led the resurgence soon to be joined by the neighboring countries and cities termed as Newly IndustrializedEconomies(NIEs)- South Korea, Singapore, Taiwan and Hong Kong. Then , this growth zone began to expandfast. From Malaysia and Thailand, it reached the shores of China. India, Indonesia and Viet Nam have joinedthe fray. Between 2000 and 2006, around a million people were lifted out of poverty every week in East Asiaalone.18 Japan, the Republic of Korea (South Korea), Singapore and, more recently, China and India doubledtheir income per person within a decade. Some went on to repeat this achievement two or three times. To putthis into perspective, it took the United Kingdom over 50 years to double its income per person during theepoch-defining Industrial Revolution.19
The causes of growth is being discerned by the economist. A common pattern is apparent. All these growingeconomies “set out to support prosperity by investing in people, building capital and undertaking institutionalchange, including expanding the role of markets. With the benefits of a good education and employment-creating reforms, large numbers of young people have become productively employed as they reached primeworking age, while a global system of rules has promoted stability and interdependence.” 20
There have been enormous competition to project the future shape of global economic system. Asia’s currentshare in global GDP is set to increase since the US is still battling the Fiscal cliff under which a $7 trillionprogram of automatic tax increases and spending to reduce the fiscal deficit and the public debt cuts cannot bepostponed indefinitely . This might cause fiscal contraction of the US . On the other hand, Euro zone is battlinghard to tackle debt crisis. The ray of hope and growth is emanating from Asia alone.

12 Journal of Indian Research
Angus Maddison estimated that by 2030 A.D. , Asia (including Middle east) will grow to 53.4% of global GDP(Table:2). Since in 2030, Asia’s share of world population will be 58.6%, (Asian population is projected to growto 4.79 billion out of projected world population of 8.17 billion), the population-GDP optimization can berealized.
Table:2
Share of World GDP,1820-2030
1820 1950 1973 2003 2030
Western Europe 23 26.2 25.6 19.2 13.0
USA 1.8 27.3 22.1 20.7 17.3
Western Offshoots* 0.1 3.4 3.3 3.1 2.5
Japan 3.0 3.0 7.8 6.6 3.6
China 32.9 4.6 4.6 15.1 23.8
India 16.0 4.2 3.1 5.5 10.4
Other Asia 7.4 6.8 8.7 13.2 15.4
Eastern Europe 3.6 3.5 3.4 1.9 1.3
Former USSR 5.4 9.6 9.4 3.8 3.4
Latin America 2.1 7.8 8.7 7.7 6.3
Africa 4.5 3.8 3.4 3.2 3.0
Asia as % of World 59.3 14.9 24.2 40.5 53.5
Source: Shares of the Rich and the Rest in the World Economy: Income Divergence between Nations,1820-2030 21
Maddison estimates that by 2030, 9 Asian nations will be among the top 20 largest GDP. The list will includeChina(Rank 1), India(Rank 3), Japan (Rank 4), Indonesia( Rank 9), South Korea( rank 12), Turkey(Rank 15),Thailand (Rank 17), Iran (Rank 18), Taiwan(Rank 20). By including Australia among the comity of Asiannations, the number would grow to 10.
The projections of different teams converge on the list. The Citigroup projects the world economy to growuntil 2050 .The global real GDP at PPP exchange rates would rise from $73 trillion in 2010 to about $377trillion in 2050. They estimate Asia’s share in the global GDP(in PPP terms) to rise from 38.1% in 2010(IncludesMiddle east) to 51% in 2030 and further zooming to 56% in 2050 A.D.22 (Table:3) The analysts with the CitiInvestment Research and Analysis, William Buiter & Ebrahim Rahbari , has coined the concept of 3G- GlobalGrowth Generators. 23 These are the countries selected on the basis of their average real per –capita GDPgrowth over the period 2010-50 to be 5% or higher at PPP exchange rates. There are only 11 such countriesin the 3G list and nine out of those are in Asia. These are- Bangladesh, China, India, Indonesia, Iraq, Mongolia,Philippines, Sri Lanka, and Vietnam. Only Egypt and Nigeria represent the Other- than Asia(OTA).
In their estimate ,China will overtake the US to become the largest economy in the world by 2020 (at PPPexchange rates).India will overtake China by 2050. By 2025, four of the 10 largest economies in the world willbe in Asia—China (Rank 1), India (Rank 3), Japan (Rank 4) and Indonesia (Rank 10).

Volume 1, No.1, January-March, 2013 13
Table:3
Note: GDP measured in 2009 PPP USD.Composition of World GDP
2010 2030 2050
Africa 4 7 12
Developing Asia 28 44 49
Japan 6.1 3 2
Aus &Nz 1 1 1
CEE 3 3 2
CIS 4 4 3
Latin America 9 8 8
Middle east 4 4 5
North America 22 15 11
West Europe 19 11 7
Willem H. Buiter and Ebrahim Rahbari: Global growth generators: Moving beyond emerging marketsand BRICs
In another recent report of the United Overseas Bank, Singapore prepared by Alvin Liew 24, it has beenestimated that by 2020 A.D. Four Asian economies will be among the global top 10 in terms of GDP. Indonesiawith 3 trillion dollar economy at market price will join the top league. China will surpass US with its 24 trilliondollar economy(Table:4). This will be a remarkable gain for Asia since in 1990 , China could manage a placein the top league just by whisker and its GDP was less than Brazil and Spain. In 2011, India joins at tenth spot.But, within next decade, it will surpass Japan to become third biggest economy in market price.
Table:4In trillion US $
Rank. 1990 2000 2011 2020
1 US 5.8 US 10 US 15.1 China 24
2 Japan 3 Japan 4.7 China 7.3 US 23.5
3 Germany 1.5 Germany 1.9 Japan 5.9 India 9
4 France 1.2 UK 1.5 Germany 3.6 Japan 6
5 Italy 1.1 France 1.3 France 2.8 Germany 5
6 UK 1.0 China 1.2 Brazil 2.5 Brazil 4.5
7 Canada 0.6 Italy 1.1 UK 2.4 France 3.5
8 Spain 0.5 Canada 0.7 Italy 2.2 Russia 3.2
9 Brazil 0.5 Brazil 0.6 Russia 1.9 UK 3.1
10 China 0.4 Mexico 0.6 India 0.4 Indonesia 3Source: “The Rise of Intra-Regional Trade in Asia” United Overseas bank, Singapore, Nov. 2012, AlvinLiew based on IMF,UOB Economic-Treasury Research Estimate

14 Journal of Indian Research
In fact, the centre of gravity of the global economy has decisively shifted to Asia. Danny Quah, a well-knownLSE economist calculated the planet’s centre of gravity of economic activity measured by GDP generatedacross 700 identifiable locations on the earth’s surface. He discovered that the world’s economic centre ofgravity (WECG) located in 1980 was at a point in the middle of the Atlantic Ocean. By 2008 , WECG driftedto a location east of Helsinki and Bucharest. The WECG is projected to locate, between India and China in2050. The WECG has finally come back home after meandering for two centuries across oceans and themountains.25
Image source: Danny Quah, The Global Economy’s Shifting Centre of Gravity
What will fuel Asia’s growth in risky & uncertain future?
The US and Eurozone are battling with their indebted economy. There is less prospect of renewing growth inEurope after Europe has lost the demographic dividend and the motivation for the productivity. Europe lies likea cold neutron star, emptied of steam for growth. Asian growth is attributed to export-led strategy, high savingrates and the resulting capital accumulation. The skeptics raise doubt about the sustainability of this strategyfor enough growth since the two markets viz. US & Europe can no longer act as the sink for Asianmanufacturing in current scenario.
But, Asian growth is no longer tied to the Eur-American market. At the time when the US was engaged withdeleveraging its economy in the wake of series of mega-collapse in 2008, Asian economies turned to decouplefrom the western markets. The growth will be fuelled by internal demand and growing consumption.
Asia is urbanizing fast. The urbanization spur growth as cities are the centre of major economic activity.NIC’s Global Trends 2030 report estimates that Urban centres are engines of productivity, generating roughly80 per cent of economic growth. 26 Cities breed middle class which are the consumers. The size of Asianmiddle class far surpass the western middle class. The shift from export-led growth strategy to consumption-based strategy in turn will deepen Asian regionalism.
Let us survey the tectonic shift in Asian urbanization. In 2010, 3.5 billion of the world’s 7.1 billion people livein urban centers. The UN estimates bring out this gigantic shift. By 2030, 4.9 billion of the world’s projected8.3 billion will be living in the cities. 27 In 1800 A.D., the urbanization was merely 3%. It took 150 years toclimb to the level of 30%. But, another 30% jump will be achieved within 80 years. 28 The global landscape hascompletely changed from largely agrarian to urbanized centres. The UN further estimates that between 2011and 2030, there will be an additional urban population of 276 million in China and 218 million in India which willtogether account for 37 per cent of the total increase for urban population in 2030.

Volume 1, No.1, January-March, 2013 15
CITI PRIVATE BANK has released its annual Wealth Report, 2012, “A Global Perspective on PrimeProperty and Wealth” 29 in which it rely on forecasts that suggest China to have around 130 cities with overone million inhabitants by 2020. This will be more than the US and Europe combined. Of those, around 90 areexpected to have over ûve million people, while eight will be home to more than 10 million. Shanghai will be aSuper mega city with over 50 million population and may turn into the global financial centre. In contrast, NewYork is the only US city that has a population of more than ûve million (8.2 million in 2010). China’s urbanpopulation has now surpassed that that of rural area . The country’s urbanization rate jumped to fifty percentin 2011 from mere 39.1 percent in 2002. China has 690.79 million people living in urban areas at the end of2011, compared with 656.56 million in the countryside. The 18th CPC National Congress has formulatedstrategy to increase urbanization to 70% in next decade. This accelerated urbanization is intended to boostdomestic demand through housing demand and further investment growth, infrastructure development andpublic utilities.
The pace of urbanization has picked up all across developing Asia. It is not only Beijing, Shanghai, Singaporeand Hong Kong , but even cities like Surat and Nagpur which are rising into megacities. As of now, Citi privateBank’s Wealth Report,2012 calculate, nine of the top 10 cities in the world in GDP growth are in China whilethe top 20 are all in China or India. And except for Doha, Lagos, Panama City, and Lima, the top 30 are all inthe Asia-Paciûc region.30
The growing urbanization foster higher consumption by the growing middle class . The insatiable demandboosts growth. The Asian middle class has become the main driver of Asia’s economic growth(Table:5).Centennial Group projects this veritable explosion in Asian Middle class.
Table:5
Growth of Asian Middle Class
2030 2050
PRC 1120 1240
India 1190 1400
Indonesia 220 250
Japan 100 60
Republic of Korea 30 10
Vietnam 80 100
US 185 120
Germany 50 25
World 4990 5900
Source: Centennial Group projections, 201131.
Upper
(The middle class is defined to include those living in households spending between $10 and $100 aday in purchasing power parity terms.)While middle class will be shrinking in the advanced economies after 2030, Asia’s middle tier countries willcontinue to prosper with swelling of this consumer base. In fact, Asia is also creating ultra-wealthy High NetWorth individuals (HNWI) at an accelerated pace. According to The Wealth Report,2012,there are now63,000 people worldwide with $100m or more in assets. The report indicates the shifting emphasis from the
16 Journal of Indian Research
West to the East. There are now 18,000 centa-millionaires in the region covering South-East Asia, China andJapan. North America has 17000 and Western Europe has 14,000. It is anticipated that by 2016, only thisregion will have extended its lead, with 26,000 centamillionaires, compared with 21,000 in North America and15,000 in Western Europe. 32 The Report mentions that “South-East Asian deca-millionaires (those with $10mor more in assets) already outnumber those in Europe, and are expected to overtake those in the US” soon. 33
The Report notes that there is exponential growth in luxury items in Asia’s dynamic region suggesting how theaffluence boosts consumption.
There is discernible structural shifts in the pattern of global demand. Asia’s growth is being fuelled increasinglyon the Asian markets. The export-led strategy with the Western market as the sink has been relegated intopast. Asian middle class consumers have emerged as the substitute for those in western markets. Soon, Asiancountries will become major exporters to each other boosting intra-Asian trade and demand for Pan-Asianinfrastructure for integrated market. The trend is clearly visible. There is an uncanny commonality of interestamong Asian countries in boosting intra-Asian trade.
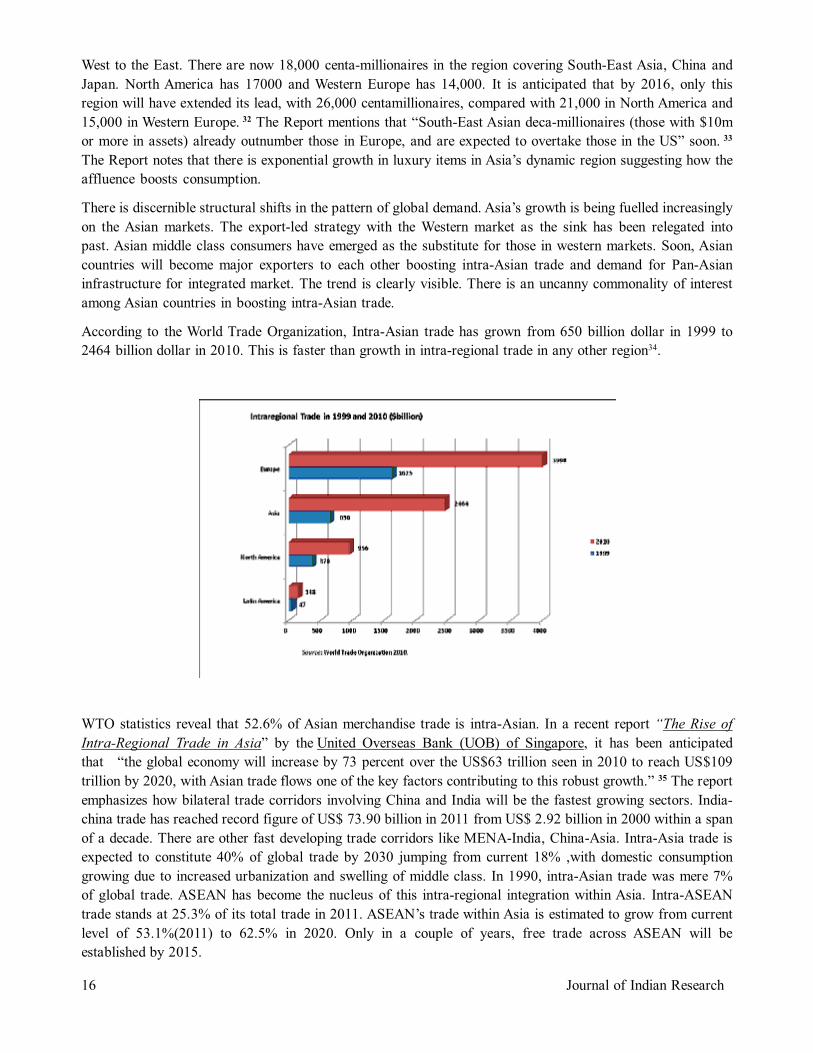
According to the World Trade Organization, Intra-Asian trade has grown from 650 billion dollar in 1999 to2464 billion dollar in 2010. This is faster than growth in intra-regional trade in any other region34.
WTO statistics reveal that 52.6% of Asian merchandise trade is intra-Asian. In a recent report “The Rise ofIntra-Regional Trade in Asia” by the United Overseas Bank (UOB) of Singapore, it has been anticipatedthat “the global economy will increase by 73 percent over the US$63 trillion seen in 2010 to reach US$109trillion by 2020, with Asian trade flows one of the key factors contributing to this robust growth.” 35 The reportemphasizes how bilateral trade corridors involving China and India will be the fastest growing sectors. India-china trade has reached record figure of US$ 73.90 billion in 2011 from US$ 2.92 billion in 2000 within a spanof a decade. There are other fast developing trade corridors like MENA-India, China-Asia. Intra-Asia trade isexpected to constitute 40% of global trade by 2030 jumping from current 18% ,with domestic consumptiongrowing due to increased urbanization and swelling of middle class. In 1990, intra-Asian trade was mere 7%of global trade. ASEAN has become the nucleus of this intra-regional integration within Asia. Intra-ASEANtrade stands at 25.3% of its total trade in 2011. ASEAN’s trade within Asia is estimated to grow from currentlevel of 53.1%(2011) to 62.5% in 2020. Only in a couple of years, free trade across ASEAN will beestablished by 2015.
Volume 1, No.1, January-March, 2013 17
ASEAN can act as the glue between India and China. ASEAN can also boost intra-regional connectivity forintegrating markets further. China and ASEAN is connected through new railway link, Mengzhi railway. Thereare proposals under consideration to link ASEAN and India with railway lines. Such spurt in connectivity willbe boon for intra-Asian trade. Asia is also home to the maximum number of Free Trade Agreements beingsigned. The FTAs will create gridlocks and reduce the chances of mutual anatagonism as the prosperity visiontrumps over now narrow- enumerated nationalism. Kishore Mahbubani rightly points in his new book thatthere is direct correlation between the decline in the number of wars and the rise in the number of FTAsamong states. 36
The Trade rebalancing is occurring all across Asia after the crisis has hit US and Western Europe . China haslaunched rebalancing of trade drive vigorously. We are witnessing asianization of Asian production andconsumption. The opening of economies and reducing trade barriers under the impetus of globalization has ledto greater regionalization. Asian nations are thus grid locking their commercial interest and through unmanifestsense of conciliation, pursuing pan-Asian integration agenda. This is in sharp contrast to the imperial rivalryamong various European powers who fought for offshore empires and pursued the ‘balance of power’strategy for its survival. Eur-America indulged in the two World Wars over imperial and commercial interests.Asian countries are pursuing institutionalization and greater integration to resolve their differences.
Is rise of Asia quantitative?
Asia is picking up growth in traditional low technology items as well as high tech economy. While the UnitedStates and Europe are the world leaders in science and research, Asia is cornering the application part inproduction. It is this innovation that has added to the dimension of productivity growth. Asian technology levelsare catching up with the best in the world. There are select pockets of excellence concentrated in Japan andNIEs. But, such nodes are multiplying and it would not be oversimplification in saying that the mantle ofscience and technology leadership will lie with Asia.
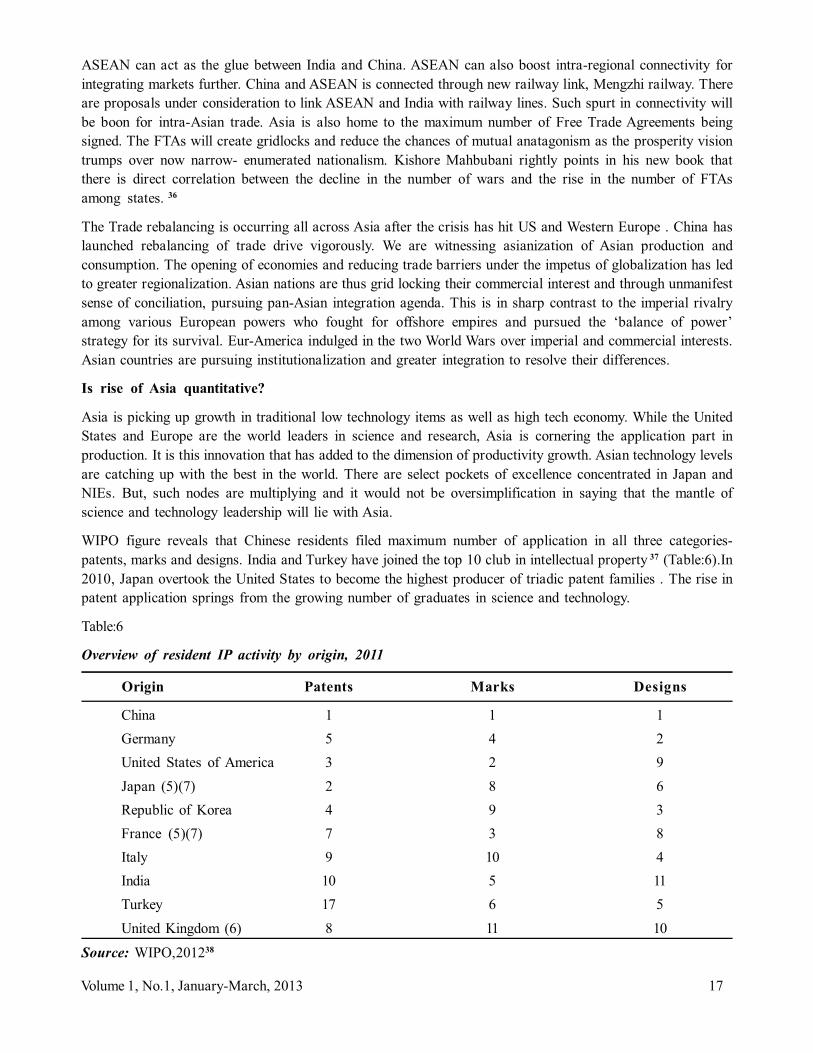
WIPO figure reveals that Chinese residents filed maximum number of application in all three categories-patents, marks and designs. India and Turkey have joined the top 10 club in intellectual property 37 (Table:6).In2010, Japan overtook the United States to become the highest producer of triadic patent families . The rise inpatent application springs from the growing number of graduates in science and technology.
Table:6
Overview of resident IP activity by origin, 2011
Origin Patents Marks Designs
China 1 1 1 Germany 5 4 2 United States of America 3 2 9 Japan (5)(7) 2 8 6 Republic of Korea 4 9 3 France (5)(7) 7 3 8 Italy 9 10 4 India 10 5 11 Turkey 17 6 5 United Kingdom (6) 8 11 10
Source: WIPO,201238

18 Journal of Indian Research
64.5%, 63.2% and 64 % respectively. Contrast this share with US or EU’s corresponding share. US share insemiconductor industry was meager 19.3% and in communication equipment 19.6. China earned trade surpluson high- tech trade in 2010, while the US again had trade deficit.
Asia is though still way behind the west in fundamental research and the aircraft and spacecraft. But, theburgeoning engineers and scientists with high sense of confidence and pride in the post-western world canmatch up to the west before 2030 A.D.
Complex Monetary Regime for US hegemony in a nutshell!
How does the US maintain hegemony? The key lies in the paper-feudalism orchestrated by the Americanpolicy makers in the wake of collapse of the Bretton Woods Agreement in 1973 and the Arab-Israel war. TheSecond World War put America on the forefront of global system. America was the largest producer ofoil. The USA orchestrated weakling European powers at San Francisco and Bretton Woods. Dollar becamethe international reserve and transaction currency on the precondition of dollar-gold convertibility as prescribedby Harry J.White. John Maynard Keynes’ proposal for an international body to issue bank note, bancor, wasturned down. At this juncture, USA ran a trade surplus and accumulated 60% of world’s central bank goldwith its Federal Reserve System that guaranteed the stability of Bretton Woods system. By the early 1960s,USA began to run massive balance of payment deficit and budget deficit due to domestic tax cuts, domesticspending under Great socity program and military expenditure in Vietnam War. French President Charles deGaulle put up a European vision to challenge America. De Gaulle asked the US to convert Eurodollars forgold as the U.S. dollar’s fixed value against gold( $35 per ounce of gold) was seen as overvalued. On 15th
August 1971, U.S. President Richard Nixon suspended the dollar’s convertibility into gold . 40 By March 1973the major currencies began to float against each other. paving way for a flexible exchange rate system, alsoknown as Bretton Woods II system . Once the fixed exchange rate system was discarded, global trade incurrencies accelerated. Capital became mobile and capitalism developed disjunctive spheres within as financecapitalism slowly got delinked from productive sphere.
In 1973, OPEC countries hiked oil price several times in the wake of Arab – Israel war. America’s oilproduction had peaked. It needed new source for increasing demand of oil at home. Henry Kissinger enteredinto secret negotiation with the OPEC leader, Saudi Arabia in 1974 to denominate oil bills in dollar only and toinvest their surplus oil proceeds in US debt securities. The United States-Saudi Arabian Joint Commission onEconomic Cooperation was established and it would facilitate annual meetings between Finance officials fromSaudi Arabia and US Treasury officials. US extended security guarantee to the Oil producers in MENA.This was the beginning of Petrodollar and its recycling system. The emergence of oil-dollar axisallowed America to widen its primacy internationally. Oil substituted gold as the bedrock of dollareconomics. Every oil-importing nation require dollar. Global artificial demand for dollar kept on soaring since oilis the necessary requirement for economic growth. Dollar can be obtained only in two ways – either as loanfrom the US and US controlled multilateral bodies or by exporting more and more goods as well as services tothe USA.
It is no coincidence that neoliberal philosophy of economic growth emphasizes export- led growth. Economictheories have been manipulated to show currency devaluation as a measure to boost export. Rest of theworld, particularly developing world, enters into competitive devaluation vis-à-vis dollar to increase its marketshare in the USA. As a result, the US became the biggest consumer of goods at the cheapest price thatbrought consumer revolution there. Half of the world’s exports are priced in dollar. Apart from being thetransaction currency, dollar also acquires the role of reserve currency since that assures the nations theundisrupted supply of oil to grease national economies.

Volume 1, No.1, January-March, 2013 19
When petrodollar is recycled into American bond market, US derive three kinds of benefit from thisrecycling. First, American current account deficit is balanced. Second, the surplus capital is loaned to correctbalance of payment deficit of those developing countries which face instability in its economy due to mobilenature of capital. Third, share indices and asset prices in the US are kept at maximum which reflectserroneously strong fundamentals in the American economy. These factors make dollar stable. Devaluation ofother currencies vis-à-vis dollar maintains a strong dollar, hence, its primacy continues unabated.
US does not want this system to go . Only this system sustains a spendthrift government and consumeristsociety. The US pays merely a fiat currency i.e. dollar in lieu of ‘real physical goods’ as dollar can be printedwithout any limit after the collapse of dollar – gold convertibility in 1971. In the US, the Federal reserve printdollar against debt. The debt ceiling keep on raising and as on 31st December,2012; is at the level of $16.4trillion. The profligate government pursue huge military and social sector expenditure through deficit financing.The excess dollar is pumped out through disrupting the Oil market. One can discern the pattern in the overtlymilitaristic policy of the US after the 2008 economic crisis hit major American banks. The US is pursuing hitand scoot policy in the MENA , merely to disrupt the oil market. This causes increase in oil prices andheightens artificial demand for dollar. The excess dollar which is being pumped in the US economy againstraising of debt limit and fiscal deficit is pumped out offshore. The developing world gets scared with thedevaluation of dollar fearing the dip in their export if their currencies strengthen. To protect their currenciesfrom appreciation vis-à-vis dollar, their central banks intervene in forex market openly by buying up dollars. Thesedollar reserve is recycled into buying T-bonds in US. The reserve accumulation leads to excessive moneysupply in domestic economy, which if not sterilized through various market stabilization bonds, will cause highrate of inflation.
The US finances its deficit at low interest rate and keeps on accumulating debt by raising up debt ceilingthrough the Congress. It is not afraid of roll over or debt default as its currency, dollar, is the world’s reservecurrency and can be printed at will without any ‘gold’ or ‘material’ backup .Since the Plaza Accord in 1985,the US is the biggest debtor, but its foreign debt is denominated in its own currency under this complexrecycling process backed up by the OIL-Dollar Regime(ODR). The US need not produce anything to payback its debt but merely fiat dollar which can be printed at no cost. Therefore, the US aims at a monetarypolicy that keeps low interest rate, low inflation and strong dollar so that it’s T-securities and bonds can be soldinternationally with confidence. But, the system is on verge of being dismantled. The post-Western World willbe agape with the news of demise of this complex, tributary regime. The last vestiges of the Western imperialdomination is crumbling.
Imminent Demise of Dollar Hegemony
The global monetary machination is under stress. It is an unintended consequence of the US strategy todiversify its energy source. OPEC no longer is major supplier of oil to the US. The US is increasingly shiftingback to Western Hemisphere as destination of its oil imports. OPEC supplied 20.82% of its total crude to theUS in 2011, while the American share of the total export from Middle East has dwindled to mere 12.21%.41
This has to do with technical breakthrough to extract oil from non-conventional source like shale and sand.The US has emerged as the world’s largest producer of the natural gas. The latest estimate suggest that UShas a 100-year supply of natural gas. Production of oil after deploying the fracking (hydraulic fracturing) hastremendously improved the oil extraction in the US and Canada. In 2011, the United States became a netexporter of petroleum products for the first time since 1949, thanks to industry investment in domestic oil andnatural gas production and refinery upgrades. 42 Total domestic production of liquid fuel is expected to be11.4mb/d this year in the US. API report mentions that increases in production in shale areas have increaseddomestic oil production by 25 percent since 2008. and U.S. output from eight tight oil prospects alone isexpected to grow to 4.5 million barrels per day by 2020, up from 2 million barrels per day in 2012.Two of the

20 Journal of Indian Research
most prolific tight oil prospects are responsible for much of this production—the Bakken Shale, located inwestern North Dakota and eastern Montana, and the Eagle Ford Shale in Texas.”43 Apart from shale and sandoil, the increased production of ethanol from the biofuel and the hybrid technology to use artificial photosynthesisthrough nanotechnology to produce ethanol as the fuel for the vehicles are redrawing the contour of futureenergy import. It is estimated that by 2035, the United States will be importing just 6 million barrels of oil perday (bpd). The corresponding figure for the year 2000 was almost 11 million b/d in 2000. Brazil and Mexicohas emerged as major producer of oil (Table:7), U.S. oil imports is estimated to be halved in next 20 years.The energy independence from the MENA is touted as the biggest achievement by the US administration. TheCarter Doctrine under which the security of the Middle East was considered the prime objective for thesustenance of the US stands abdicated. The table clearly indicates that Canada and Mexico outstrip SaudiArabia as source of oil import. With the production picking up in Brazil , the US can relieve itself from theMiddle east oil import. Even now, US’s import dependence on Middle East has reduced to 22% and that onOPEC to 39.6%. In fact, the US expects astronomical increase in oil production from its investment inexploration and non-conventional drilling in Brazil and has already begun to woo Brazil away from the BRICS.
Table:7
Source of Import of Crude Oil to the US(1000 b/d)
2006 2007 2008 2009 2010 2011
All Countries 13,707 13,468 12,915 11,691 11,793 11,504
Persian Gulf 2,211 2,163 2,370 1,689 1,711 1,861
OPEC* 5,517 5,980 5,954 4,776 4,906 4,555
Algeria 657 670 548 493 510 358
Angola 534 508 513 460 393 346
Ecuador 278 203 221 185 212 206
Iran - - - - - -
Iraq 553 484 627 450 415 459
Kuwait 185 181 210 182 197 191
Libya 87 117 103 79 70 15
Nigeria 1,114 1,134 988 809 1,023 818
Qatar 2 2 0 10 1 6
Saudi Arabia 1,463 1,485 1,529 1,004 1,096 1,195
United Arab Emirates 9 10 4 40 2 10
Venezuela 1,419 1,361 1,189 1,063 988 951
NonOPEC 8,190 7,489 6,961 6,915 6,887 6,948
Brazil 193 200 258 309 272 253
Canada 2,353 2,455 2,493 2,479 2,535 2,796
Colombia 155 155 200 276 365 433
Congo 35 65 68 65 72 53
Equatorial Guinea 60 59 78 89 58 23
Mexico 1,705 1,532 1,302 1,210 1,284 1,206
Volume 1, No.1, January-March, 2013 21
Russia 369 414 465 563 612 624
Thailand 10 16 14 23 13 18
Trinidad &Tobago 117 100 63 84 73 77
United Kingdom 272 277 236 245 256 159
Virgin Island(US) 328 346 320 277 253 186
Source: US EIA,27.9.201244
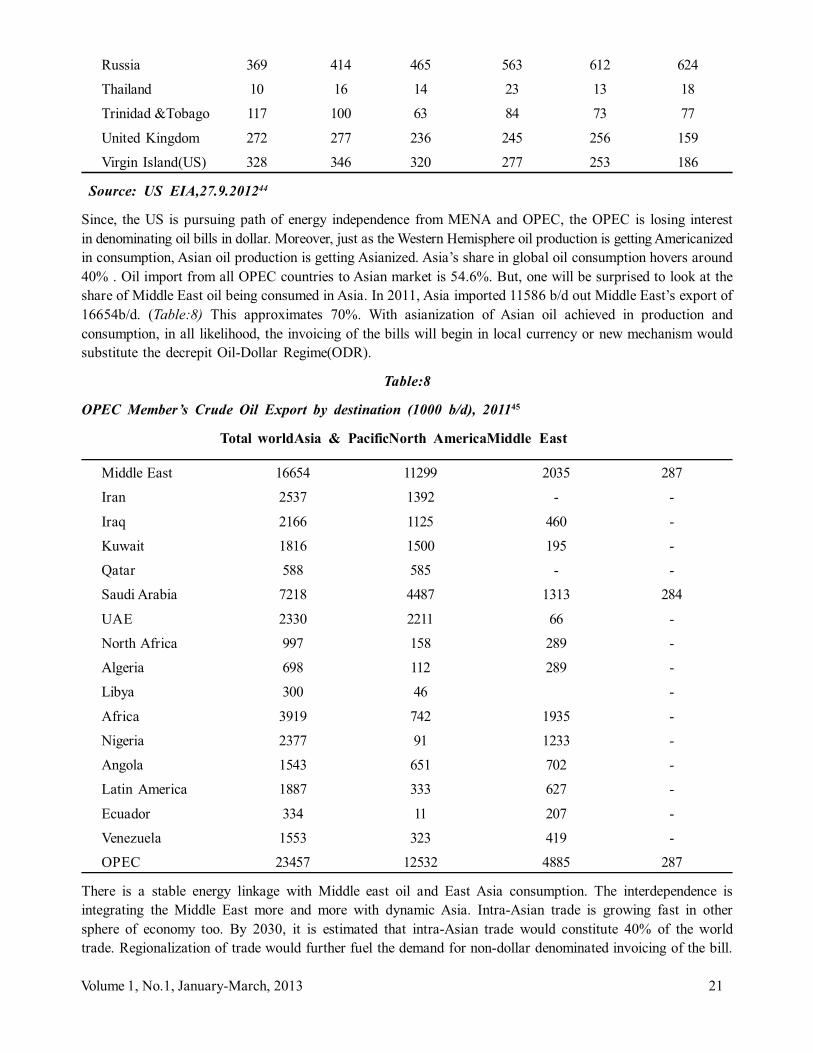
Since, the US is pursuing path of energy independence from MENA and OPEC, the OPEC is losing interestin denominating oil bills in dollar. Moreover, just as the Western Hemisphere oil production is getting Americanizedin consumption, Asian oil production is getting Asianized. Asia’s share in global oil consumption hovers around40% . Oil import from all OPEC countries to Asian market is 54.6%. But, one will be surprised to look at theshare of Middle East oil being consumed in Asia. In 2011, Asia imported 11586 b/d out Middle East’s export of16654b/d. (Table:8) This approximates 70%. With asianization of Asian oil achieved in production andconsumption, in all likelihood, the invoicing of the bills will begin in local currency or new mechanism wouldsubstitute the decrepit Oil-Dollar Regime(ODR).
Table:8
OPEC Member’s Crude Oil Export by destination (1000 b/d), 201145
Total worldAsia & PacificNorth AmericaMiddle East
Middle East 16654 11299 2035 287
Iran 2537 1392 - -
Iraq 2166 1125 460 -
Kuwait 1816 1500 195 -
Qatar 588 585 - -
Saudi Arabia 7218 4487 1313 284
UAE 2330 2211 66 -
North Africa 997 158 289 -
Algeria 698 112 289 -
Libya 300 46 -
Africa 3919 742 1935 -
Nigeria 2377 91 1233 -
Angola 1543 651 702 -
Latin America 1887 333 627 -
Ecuador 334 11 207 -
Venezuela 1553 323 419 -
OPEC 23457 12532 4885 287
There is a stable energy linkage with Middle east oil and East Asia consumption. The interdependence isintegrating the Middle East more and more with dynamic Asia. Intra-Asian trade is growing fast in othersphere of economy too. By 2030, it is estimated that intra-Asian trade would constitute 40% of the worldtrade. Regionalization of trade would further fuel the demand for non-dollar denominated invoicing of the bill.

22 Journal of Indian Research
This is already happening with series of swap agreements which China, Japan, south Korea have signed. Theartificial demand for dollar is naturally dying. With the Asian economic strategy shifting from the export-ledgrowth to consumption-led growth , further pressure will pile up against dollar. The lowering of demand ofdollar in both oil sector and export market as well as growing fiscal deficit will cause devaluation of dollar. TheAsian Central Banks have lost the appetite for accumulating dollar in their kitty. Though Saudi Arabia is buyingdollar to stimulate dollar’s primacy, with more than $620 billion in its kitty, it will soon loose the appetite else thecost of maintaining the reserve would drag its economy during turbulent times. If dollar further devalues, therewill be pressure on OPEC to move pricing from dollar since oil is priced in U.S. dollars on the world market,and the dollars depreciation contributes to rise in crude prices and also erodes the value of their dollarreserves.
The pressure to dismantle Oil-Dollar Regime(ODR) is already building up. Iran is OPEC’s second-largestproducer and it has already ended conducting oil transactions in U.S. dollars in 2012. Iran has offered toconduct oil transaction in non-dollar currencies. Iran’s oil transaction is conducted in euro, yuan, rupee andyen. China is the biggest buyer of Iranian oil and increasing import of Iranian oil.
Iran is not only puncturing the ODR, but also encouraging the other OPEC members to shift from dollar-pricing.
Iranian President Mahmoud Ahmadinejad called the depreciating dollar a “worthless piece of paper” onNovember 19,2007 at OPEC summit in Saudi Arabia and urged OPEC to “disconnect oil and dollar”. 46
Initially, it was Iran which gave a twist to the end of unipolarity of global currency . In 2003, Iran began pricingits oil exports in Euro . Further Iran opened oil bourse on 17 February, 2008 on the island of Kish in the PersianGulf for trading oil in Euro and other currencies. 47 This led to the rise of share of euro in forex reserveglobally.
The Gulf Cooperation Council (GCC) is also pitting to went off dollar billing of oil. GCC consists of nationslike Saudi Arabia, Kuwait, Qatar, UAE. Many of the GCC countries had unofficial pegs to the US dollar- 3.8riyal per dollar in Saudi Arabia ; 3.7 dirham per dollar in UAE; 0.3 dinar per dollar in Kuwait; 3.6 riyal perdollar in Qatar. But, UAE and Bahrain opposed a currency union, Khaleej dinar only because the newcurrency was to be pegged to dollar. The dollar peg of these currencies are causing higher inflation in thesecountries as the US economy continue to be mired in recession. Moreover the US is pursuing deliberate policyof Quantitative Easing under which trillion of dollars have been pumped into domestic financial markets topush down the value of the dollar. This is the US implicit indulgence in the ‘Beg Thy Neighbour Policy”. Thecompetitive devaluation of dollar is dragging down the gulf currencies tied to dollar and building huge inflationarypressure in these countries.
Since, these countries have high food-import dependency. In the wake up of the Arab Spring, the high cost offood prices have become threat to their stability. The GCC states are loosening their peg to the US dollar andslowly shifting their reserves out of dollars.
Venezuela, another OPEC country which too has its currency Bolívar to dollar(4.3 Bolivar per dollar) is nowpitting for SDR and Yuan. The Arab springs has paved way for anti-American groups gripping power in theregion. With the US’s intent to pursue energy independence and shift to “Pivot of Asia’ strategy to build aTrans-Pacific Partnership(TPP), the oil-producing Gulf states are relentlessly working to wriggle out of dollarstrangulation.
But, the unipolarity of dollar in global monetary system is being replaced by a new post-western monetarysystem due to reckless policy of the American administration. The US is projecting itself as a victim of theglobal monetary system by putting up Triffin Paradox argument ( Belgian economist Robert Triffin (1912-1993) argued that in an international monetary system, if the reserve currency is foreign currency, the issuer ofthe reserve currency has to run the current account deficit to fulfill the responsibility to supply the world with

Volume 1, No.1, January-March, 2013 23
risk-free asset. By doing so, the Central country becomes more and more indebted to foreigners until the risk-free asset ceases to be risk-free). The US is that it has earned foreign debt of $4 trillion as of now only tofacilitate global trade. This is the ultimate victimhood parried by a decadent hegemonic power. The US iscreating a brouhaha against alleged ‘currency manipulators”, but no longer intends to radically alter its owndomestic policy and overtly militaristic foreign policy.
The U.S. government has borrowed trillions of dollars from foreign banks and governments to help financeIraq & Afghan wars and to bloat and overstretch its hard military power to secure its interests. The US alsokept on encouraging domestic consumption at the cheapest import price to keep the population away frompolitical engagement and questioning the administrations moves world across. Further, when the US was hit bybanking crisis in 2008, it heavily borrowed to stimulate economy and rescue these huge financial institutionswith bail out packages. In last five years, estimate for only the present year is below $ 1 trillion.
Recent US Federal Deficit Numbers
Deficits during Obama’s Presidency Deficits during Bush’s Presidency
FY 2013*: $845 billion FY 2009†: $1,413 billion
FY 2012: $1,089 billion FY 2008: $459 billion
FY 2011: $1,300 billion FY 2007: $161 billion
FY 2010: $1,293 billion
* CBO Projection48
The federal government has already reached debt limit of $16.39 trillion on 31st December 2012. There is nonew borrowing authority from the Congress and the US government will have to handle possible default oninterest payment or even payment of salary to employees by early March ,2013. The Congressional budgetOffice further project fiscal deficits of $7.0 trillion for the 2014–2023 period, . Federal debt would remainabove 73 percent of GDP—far higher than the 39 percent average seen over the past four decades. (Asrecently as the end of 2007, federal debt equaled just 36 percent of GDP.) 49
Federal debt held by public stands at $11.28 trillion or 72.5% of US GDP at the end of 2012.The CBO projectsthat this figure would boom to $19.94 trillion in 2023(77% of the then GDP). Gross federal debt that consistsof debt held by the public and debt issued to government accounts is projected to reach $26.1 trillion by 2023.50
The increase in debt will also increase the expenditure towards interest payment on the debt. Interest rateswhich is bottomed at almost zero will increase as the US cannot continue to maintain artificially near zerointerest rate and attract investment. The CBO projects that, under current law, the government’s yearly netinterest spending will double as a share of GDP—from 1.5 percent in 2014 to 3.3 percent in 2023.

24 Journal of Indian Research
While fiscal deficit and debt is skyrocketing, neither the taxpayers nor the administration are ready to tightenthe belt . The public uproar led to the postponement of fiscal cliff under which sharp decline in the budgetdeficit had to occur beginning the FY 2013 due to increased taxes and reduced spending. But, the fiscal cliffwas eliminated by the passage of the American Taxpayer Relief Act of 2012 (Public Law 112-240), wasenacted on January 2, 2013 that permanently extended some lower tax rates and other tax provisions thatexpired at the end of FY 2012 . But, this will add $4.0 trillion to federal deficits over the 2013–2022 period51
The US, rather than tightening its consumption binge, is indulging in “beggar-thy neighbour” policy by pursuingthe Quantitative easing under the Fed’s macroprudential approach. This is aimed to dupe and disrupt the globalfinancial system. The Fed creates credit, and uses it to buy mortgage-backed securities(MBS) and Treasuriesfrom American banks. The banks take off old debt off from balance sheet and extend further credit to makemore loans. The increase in money supply devalues dollar. The US intends to make its export cheaper as wellas to export its own inflation. Since oil is denominated in dollar, the oil prices soar up due to dollar devaluation.This impacts the dynamic economies which are oil-dependent like India , Japan and China, the troika of Asianpowers which are expected to be among the top four global economic powers within a decade. The artificialhike in oil prices is then blamed over growing appetite of Asian nations. There is an artificial demand for dollar.These nations hoard the dollar for energy security as well as to protect its export to the global consumptionsink, the US. The Fed pumps this excess dollar into global financial system to maintain low level of interestrate and inflation within USA which safeguards the strength and stability of dollar. The draining out of dollaris also achieved through currency traders via the ‘dollar carry trade”. The US is maintaining lowest possibleinterest rate in spite of huge turbulence in economy. The Fed fund rate till 2015 is zero. It helps the nation intwo ways. The interest payment amount on the public debt is kept at minimum. Secondly, the emergingeconomies which maintain higher rate than the US, became destination for hot money through carry trade indollar. The dollar gluts the world economy. This enters stock markets and raises the indices. Asset bubbles arecreated in these growing economies and then high inflation builds up. With huge amount of dollar, there is panicamong exporters in other countries, since the domestic currencies are expected to rise in strength. There is acacophony to devalue currencies to maintain the cheap export to the US. US dollar retains the strength sinceother currencies enter into competitive devaluation.
Asian Central Banks intervene in the market and pile up dollar in forex reserve and inject correspondingamount of money in domestic economy which fuels inflation. Through this way, the US can continue to expanddebt base and export inflation. China has piled about &3.3. trillion in reserves by October 2012. Japan isnumber two with $1.2 trillion in its kitty. (Table:9) On the other hand, US which is the world’s largesteconomy has mere $52 billion in forex reserve in comparison with the standard requirement of three month ofimport, which in US case should be $666 billion.
Table:9
Foreign Currency Reserve Accumulation: Major holders
October 2012(reserves &million)
China 3,285,095Japan 1,196,844Saudi Arabia 613,373Russia 476,380Switzerland 456,124Taiwan 399,216Brazil 369,212Korea 314,255

Volume 1, No.1, January-March, 2013 25
Hong Kong 291,210India 260,465
(Latest data are for September for China, Saudi Arabia, Russia, Brazil, Hong Kong
Saudi Arabia is the only major economy for which the pace of reserve accumulation has been increasing,reflecting rising oil prices. India’s foreign currency reserve has fallen since July 2011.52
Under this process, the US is gleeful that with each bout of devaluation of dollar, the value of the substantialdollar assets in forex reseves of these Asian econmies get driven down. Realizing the baneful effect of gettingcaught in this endless cycle of financing US debt and loosing hard earned wealth, ACBs have stopped furtherpiling dollar. The US has managed the Saudi Arabia to purchase dollar so that the latest round of the QE policydoes not fuel domestic inflation. But, inspite of the QE policy, the trade deficit in the US is widening. The USTrade balance deteriorated from 645.1 billion trade deficit in 2010 to 738.4 billion in 2011.53 This also points tothe need for the US to engage in domestic tightening and not to create imbalance in global monetary system.
The mischievous strategies are getting thumbs down from various quarters. The credit rating agencies like S&P are downgrading the US economy and it is further exacerbating the negative confidence effect among theglobal business community for the dollar as a transaction currency.
The US finds itself at the fag end of monetary unipolarity as the nations have begun to shun dollar after theregular bouts of devaluation and the American economy in doldrums. C. Fred Bergsten and Joseph E. Gagnonof Peterson institute for International economics have argued in their recent policy brief, “Currency Manipulation,the US Economy, and the Global economic order”, 54 argues for the end of dollar’s international role:
“ With respect to the international role of the dollar, it is now clear that the United States pays aconsiderable price and might be better off without it. The dollar’s role makes it easier for othercountries to set the exchange rate of the US currency and more difficult for the United States itself todo so. Moreover “deficit without tears” that other countries have jealously criticized for so long haveturned out to be a poisoned chalice for the United States itself. By depressing demand for US output,currency manipulation has simultaneously driven the United States to larger fiscal deficit and made thefinancing of those deficits easier. The net result is an unsustainable path of national and externaldebt.” 55
Bergsten & Gagnon plots the evolution of a multiple reserve currency system with multiple internationalfinancial centres and argues that the other countries would not be forced to use the dollar or US financialassets, and thus the US can achieve autonomy to contemplate dollar policies. Their prescription for the UnitedStates is to “gracefully accept the steady, and most likely continued slow, decline of the dollar’sinternational role and react with equanimity when the inevitable day arrives that it will no longer benumber one on one or another of the relevant criteria.” 56
The end of dollar hegemony will deprive the US from the multiple advantages that sustained hegemony. Theforemost of which was to indefinitely and exponentially feed on foreign debt and foreign oil , both denominatedin their national currency, dollar, which could be printed at will without any tangible backing. But, will the USallow peacefully to let a new global monetary system emerge in the post-western world or will it destabilizeglobal monetary system in a game of brinkmanship?
Tripolar Global Monetary System
China has surpassed the US in 2012 to become the world’s biggest trading nation. While US exports andimports totaled $3.82 trillion, China’s total trade amounted to $ 3.87 trillion. 57 The biggest trading nation hasincentive to promote the use of its own currency for smooth flow of trade. China has embarked uponinternationalizing yuan through swap agreements. Bilateral swap agreements lead to short-term liquidity and

26 Journal of Indian Research
ease trade conditions It has already signed 18 currency swap agreements with a total of 1.6 trillion yuaninvolving such diverse countries like South Korea, Japan, Phillipines,Brazil, Australia, Indonesia, Belarus,UAE,Turkey. 58 The deal between China and Japan is a deal between world’s second and third largest economy. China is already Japan’s largest trading partner with bilateral annual trade exceeding $340 billion. Similarly,China is the biggest trade partner of Germany now and a similar swap agreement is being negotiated. Indiaand Japan have agreed to enhance the amount of currency swap agreement from $ 3 billion to a tune of $15billion on December 4,201259 .Such swap agreement reduces the dollar role in international transaction.
Moreover, Japan has been allowed to buy yuan denominated bonds issued inside China. . China is also workingto develop yuan offshore market. Apart from Singapore and Hong Kong, London and Taiwan has becomeoffshore yuan trading centre. Now, all over the world, the financial centres are competing to emerge as themajor centre for yuan transaction. has become the clearing centre for yuan market. China has now officiallydeclared to pursue Yuan internationalization on market –oriented basis.60 A report in China Daily estimates that“in 2012, cross-border trade settlement in the yuan rose 41 percent to 2.94 trillion yuan, while investmentsettled in the currency rose by 153 percent to more than 280 billion yuan61 . The bankers project that withinnext two years , yuan would be adopted as a reserve currency. Thus by multiplying bilateral swap agreements,China is aiming to make yuan as a global reserve currency and an alternative to the dollar.
The clamour for replacing dollar as reserve currency is growing manifold .Russian President Dmitri Medvedevtold an economic forum in St. Petersburg in June,2010 that American financial policy had made the dollar anundesirable currency for reserves held by central banks. Russian Finance Minister Alexi Kudrin suggestedmaking China’s renminbi as a world reserve currency after it becomes fully convertible in about next tenyears. Following such bonhomie, from November, 2010;Russia and China began to use their own nationalcurrencies for bilateral trade, instead of the U.S. dollar. The yuan started trading against the ruble in theChinese bank market in Shanghai, and in December 2010, began trading on the Moscow Interbank CurrencyExchange.
Yekaterinburg Summit(2009) of BRIC nation & Pittsburgh Summit of G-20 nations same year witnessedclampdown against dollar’s over bloated role. China led the creation of Chiang Mai Initiative in 2010 for anAsian Monetary Fund- kind of institution with 10-member ASEAN and China, Japan, South Korea as signatories.This created a $120 billion regional currency swap fund with objective to bail out member nations in times ofilliquidity or balance of payment shortfall. Now, the members are considering doubling the fund in response tothe perceived increasing threat of global instability.
Such initiative has encouraged the institution like the ADB to visualize a Pan-Asian Integration scenario. In itsreport, ASIA-2050:Realizing the Asian Century, ADB chalks out the future of global monetary system:
There are four possible paths to the future Global Reserve Currency System. The first is the status quo,if Asia remains non-convergent, fragmented and subject to economic setbacks and internal conflict.The second is a single dominant Asian currency that then contends for the dominant position in theGlobal Reserve Currency System. This has a low probability, because it would be quite difficult for asingle Asian economy to achieve Asian dominance or global dominance on its own. The third path is anintermediate Asian Monetary System before negotiating to join the Global Reserve Currency System. 62
Emboldened with dollar’s diminishing role, the G-20 nations have sought a stable and resilient internationalMonetary system and aims to review the developments afresh in 2015.
In the 6th Summit of G-20 nations in Cannes, France held in the year 2011 ; the G-20 countries agreed toaccept the emergence of new international currencies. The relevant paragraph of the Agreement is reproducedbelow:

Volume 1, No.1, January-March, 2013 27
“Reflecting the changing economic equilibrium and the emergence of new international currencies
12. We affirm our commitment to move more rapidly toward more market-determined exchange ratesystems and enhance exchange rate flexibility to reflect underlying economic fundamentals, avoidpersistent exchange rate misalignments and refrain from competitive devaluation of currencies. We aredetermined to act on our commitments to exchange rate reform articulated in our Action plan forGrowth and Jobs to address short term vulnerabilities, restore financial stability and strengthen themedium-term foundations for growth. Our actions will help address the challenges created bydevelopments in global liquidity and capital flows volatility, thus facilitating further progress on exchangerate reforms and reducing excessive accumulation of reserves.
13. We agreed that the SDR basket composition should continue to reflect the role of currencies in theglobal trading and financial system and be adjusted over time to reflect currencies’ changing role andcharacteristics. The SDR composition assessment should be based on existing criteria, and we ask theIMF to further clarify them. A broader SDR basket will be an important determinant of its attractiveness,and in turn influence its role as a global reserve asset. This will serve as a reference for appropriatereforms. We look forward to reviewing the composition of the SDR basket in 2015, and earlier ifwarranted, as currencies meet the criteria, and call for further analytical work of the IMF in thisregard, including on potential evolution. We will continue our work on the role of the SDR.” 63
But, 2015 may be far distant in time. The economists have confirmed that in East Asia, dollar bloc haseffectively been replaced by a yuan bloc. Arvind Subramanian and Martin Kessler of the Peterson institute forInternational Economics have come out with their study, “ The Renminbi Bloc is Here: Asia Down, Rest of theWorld to Go?” 64. They find that the renminbi has increasingly become a reference currency (meaningemerging market exchange rates move closely with it).Since June 2010 when the renminbi resumed floating,the number of currencies tracking it has increased while the number tracking the euro and the dollar havedeclined.
They have studied this tracking and find how East Asia is already a renminbi bloc because the currencies ofseven out of 10 countries in the region – including South Korea, Indonesia, Taiwan, Malaysia, Singapore andThailand – track the renminbi more closely than the US dollar. Only three economies in the group – HongKong, Vietnam and Mongolia –have currencies following the dollar more closely than the renminbi. But thesethree economies does not have high GDP.
The shift emanates from China’s rise in the share of east Asian countries’ manufacturing trade . East Asiancountries that sell to the growing Chinese market or are locked in supply chains centered on China maintain astable exchange rate against the renminbi.
The economists have also tracked the rise of the renminbi outside East Asia. Even the currencies of India,Chile, Israel, South Africa and Turkey now follow the renminbi closer than dollar. Subramanian & Kesslerhave projected that in 2037, the global renminbi currency bloc may emerge. 65
The multipolarity of global monetary regime will virtually end the tottering American hegemony. The Post-Western world will no longer be marred by the world wars and imperialism. Asian nations have pursued thepath of integration in contrast to the halcyon days of the west when the nation-states pursued the policy ofbalance of power and Beggar Thy Neighbor policy. Asian resilience and reliance on conciliation rather thanpower politics will help create a stable and peaceful global environment. The international hegemon, in suchconditions, will have to pursue a benign approach. It will be a networked and nested global system and not thehierarchic system. Harmony and rule of law will extend sway over international system. The post-westernworld will have many more positive surprises for the citizens world across. Asia-centric global civilization willemanate peace and prosperity and facilitate the great leap in mankind’s quest for a rational ,moral andaesthetically soothing social and political order.

28 Journal of Indian Research
References:
1 Report of National Intelligence Council, Global Trends 2030: Alternative Worlds, December 2012,NIC 2012-001 avai lable at www.dni.gov/nic/globaltrends last accessed on 18.2.2013
2 Ibid. p.x
3 Robert A. Manning, Principal Drafter, Envisioning 2030: US Strategy for a Post-Western World-A Report of the Strategic Foresight Initiative at the Brett Scowcroft Centre on InternationalSecurity, Atlantic Council,2012
4 Kishore Mahbubani, “The Great Convergence: Asia, the West, and the Logic of One World” ,Public Affairs. 2013. Also Is the US Ready to be Number Two? Yaleglobal, 11 February,2013Source: http://yaleglobal.yale.edu/content/us-ready-be-number-two Last accessed on 18th
February,2013
5 Zbigniew Brzezinski Strategic Vision: America and the Crisis of Global Power(2012)
6 Ibid. p.2
7 Niraj Kamal, Arise Asia: Respond to White Peril, 2002 ,p.15
8 Ibid.,pp.24-29
9 Ibid., p.172
10 Government of Australia, Australia in the Asian Century White Paper, October,2012. available at http://asiancentury.dpmc.gov.au/white-paper last accessed on 19.2.2013
11 Kishore Mahbubani, Australia’s Destiny in the Asian Century, The Jakarta Post, September 7,2012.
12 Lucia Kubosova, Sarkozy launches presidential bid with anti-Turkey stance, EUObserver.com, 15.1.2007available at http://euobserver.com/political/23251
13 George J. Gilboy, Eric Heginbotham; Chinese and Indian Strategic Behaviors: Growing Power andAlarm, Cambridge University Press,2012,pp.273-277
14 Press Release of World Steel Association, World crude steel output increases by 1.2% in 2012; 22January,2013 available at http://www.worldsteel.org/media-centre/press-releases/2012/12-2012-crude-steel.html
15 Peter Marsh, US manufacturing crown slips, Financial Times, June 20,2010 available at http://www.ft.com/intl/cms/s/0/af2219cc-7c86-11df-8b74 00144feabdc0.html#axzz2LF1yJAl3. Also see, RichardMcCormack,ed. Manufacturing- A Better Future for America, Alliance for American Manufacturing,2009
16 Mark Weisbrot, 2016: When China overtakes the US; guardian.co.uk, 27 April, 2011 available at http://www.guardian.co.uk/commentisfree/cifamerica/2011/apr/27/china-imf-economy-2016
17 Arvind Subramanian; Is China Already Number One? New GDP Estimates ; Peterson Institute forInternational Economics Real Time Economic Issues Watch, Jan. 13, 2011 available at http://www.piie.com/blogs/realtime/?p=1935)
18 Indermit Gill & Homi Kharas;”An East Asian Renaissance,” World Bank, 2007,p.61
19 Angus Maddison, Contours of the world Economy, IMF World Economic Outlook, October, 2010

Volume 1, No.1, January-March, 2013 29
20 Asian Development Bank, Asia- 2050, Realizing Asian Century,2012.
21 Angus Maddison, Shares of the Rich and the Rest in the World Economy: Income Divergence betweenNations, 1820-2030 Asian Economic Policy Review 3(1) ,2008,pp. 67-82
22 Willem Buiter Ebrahim Rahbari, Global growth generators: Moving beyond emerging markets and BRICs,21 February 2011; Citi Investment Research & Analysis, a division of Citigroup Global Markets Inc,Centre for economic Policy Research, Policy Insight No.55
23 ibid.
24 Alvin Liew, “The Rise of Intra-Regional Trade in Asia” ,UOB Economic-Treasury Research Estimate,Singapore, 29th Nov. 2012, available at http://www.media-server.com/m/p/w32xt45v
25 Danny Quah , The Global Economy’s Shifting Centre of Gravity , Global Policy 2( 1),. January2011
26 n.1, p.29
27 UN, Department of Economic & Social Affairs, Population Division : World Urbanization Prospects: The2005 Revision.,2006 . Also see, UN’s Report on Population Distribution, Urbanization, Internal Migrationand Development: An International Perspective;2011
28 Šlaus, Ivo; Jacobs, Garry. “Human Capital and Sustainability, sustainability 3(1),2011, pp.97-154 Available at http://www.mdpi.com/2071-1050/3/1/97/
29 Knight Frank Research,The Wealth report 2012:A Global Perspective on Prime Property and Wealth,Knight Frank & Citi Private Bank,2012
30 Ibid. pp.16-17
31 cited in n.20, p.24
32 n.29, p.10
33 Ibid.
34 WTO, International Trade Statistics, 2011, p.21
35 n.24
36 Manik Mehta, Southeast Asia, Once Described As Asia’s Balkan, Is Today A Peaceful Community, 7February,2013 available at www.bernama.com/bernama/v6/bm/newsworld.php?id=926819
37 WIPO , World Intellectual Property Indicators,2012,p.28 available at http://www.wipo.int/ipstats/en/wipi/figures.html
38 Ibid. ,p.38
39 National Science Board,NSF, Science and Engineering Indicators 2012 available at http://www.nsf.gov/statistics/seind12/pdf/seind12.pdf,p.O-7
40 Niraj Kumar, Primacy of Dollar and Global Inequality, Otherside, May,2008
41 OPEC Annual Statistics Bulletin,2012
42 American Petroleum Institute, The State of American Energy,2013,p.7
43 Ibid.,p.9

30 Journal of Indian Research
44 US Energy Information Administration,US Net Import by Country, release date 27.9.2012 available athttp://www.eia.gov/dnav/pet/pet_move_neti_a_ep00_imn_mbblpd_a.htm
45 n.41, p.47
46 BBC News, Iran Leader dismisses US Currency, 18 November, 2007 available at http://news.bbc.co.uk/2/hi/7101050.stm
47 Press TV, Oil Bourse opens in Iran’s Kish Island, 17 February,2008
48 Congressional Budget office, The Budget and Economic Outlook: Fiscal Years 2013 to 2023, February5,2013 available at http://www.cbo.gov/publication/43907
49 Ibid.
50 Ibid.,p.9
51 Ibid.,p.12
52 US Department of the Treasury, office of International affairs, Report to Congress on InternationalEconomic and Exchange Rate Policies, , November 27,2012, p. 8
53 US Bureau of Economic Analysis, US International Trade in Goods and Services, December,2012;Released on February 8,2013. Also available at http://www.census.gov/foreign-trade/Press-Release/current_press_release/ft900.pdf
54 C. Fred Bergsten and Joseph E. Gagnon ;Currency Manipulation, the US Economy, and the GlobalEconomic Order, Peterson Institute of International Economics, Policy Brief No. PB 12-25, December,2012
55 Ibid. p.23
56 Ibid.
57 Bloomberg News, China eclipses US as Biggest Trading Nation, February 10,2013
58 Sudeshna Sarkar, Currency swaps to take on Bigger Role, China Daily, 28th November, 2012. alsoavailable at http://www.chinadaily.com.cn/cndy/2012-11/28/content_15965069.htm
59 The Financial Express, India, Japan ink $15 billion currency swap arrangement , 4th December, 2012available at http://www.financialexpress.com/news/india-japan-ink-15-billion-currency-swap-arrangement/1040334
60 Xinhua News Agency, Challenges ahead to make Yuan a global currency; January 27, 2013
61 Wang Xiaotian, Global Use of yuan to see “major leap” in 2013, China Daily, 17.1.2013
62 n.20, p.57
63 Full Text-G-20 Cannes summit Communiqué, available at http://www.reuters.com/article/2011/11/04/g20-communique-idUSP6E7K902Z20111104
64 Arvind Subramanian & Martin Kessler ;The Renminbi Bloc is Here: Asia Down, rest of the World toGo?” Peterson Institute of International Economics, Working Paper Series WP 12-19 , October,2012
65 Ibid. p.15

Volume 1, No.1, January-March, 2013 31
Journal of Indian Research, Volume 1 No. 1, 2013, 31-41
International Relation
CONSTRAINTS OF CHINA’S EMERGENCE AS A POLITICALALTERNATIVE TO THE WESTERN WORLD
Dr. Binod Singh*
ABSTRACTWith the end of western era, the ideological dominance of the West is under challenge. The new
breed of intellectuals are rooted in own tradition and yet not antagonistic to the logic of universalizationof categories. China , after having arrived at the world stage as the economic power house, is strivingto build an alternative to the Western world order based on Confucian tradition. The paper reviews thecurrent Chinese domestic political situation and attempt to predict its impact on the emergence of Chinaas an alternative to the Western World order.
Keywords : Confucian values, CCP, Central Committee, Beijing Consensus, Daniel Bell, Deng Xiaoping, taoguang yang hui
INTRODUCTION
In the 21st Century, when the world enters into the “Post-Western World order” we encounter a growingdebate among the prevailing political theory to explain this political and ideological transition. The old worldorder is collapsing and it’s giving way to a new world order which is perceived to be multipolar.1 In our owngeneration we have witnessed the rise and fall of communism, and mused over Francis Fukuyama’s clarioncall of the end of the history. Now we are witnessing the end of capitalism as some of the main torch bearersof capitalism are enmeshed in financial mess and sooner or later they will succumb to the nemesis of their ownmaking. The Western world is also facing moral crisis and taking disastrous steps in insanity such as militaryintervention in Afghanistan, Iraq, Libya, and now Syria and Mali. Ideologically also, the Western intellectualshave started looking towards the East for their continued survival.
At the same time we have seen the rise of the Rest, especially the rise of the East. India and China hasoccupied the center stage of the world as they continue to become more dynamic and vibrant both economicallyand politically. China, after winning over the world market2 has now launched a new campaign to challengethe Western hegemony and Western values in order to create an alternative to the Western Capitalism. Butthere have been different voices with regard to Chinese emergence as an alternative to current domination ofwestern world order. Economic success does not directly imply a country to take over the role of a worldsuperpower. China has to set some clear examples in domestic and external governance so that its ideas andinstitutions find appeal among countries outside its region. In the following sections, we review the currentChinese domestic political situation and attempt to predict its impact on the emergence of China as analternative to the Western World order.
The Current Political SetupEvery political system is made of its own historical discourse and developmental process, and whether it canbe exported as a packaged ideology to outside its boundary is a question solely to be decided by the importer(the searcher) of the ideology. The Chinese Communist Party (CCP) has ruled China since 1949 and we donot see any greater challenge to its rule in the near future. The party is in the full grip of the power and there
*Dr. Binod Singh is the Assistant Professor in Peking University, China and Vice President of the Society for AsianIntegration.

32 Journal of Indian Research
is hardly any strong oppositions group organized to challenge its supremacy, except some individuals andintellectuals who have challenged the legitimacy of the party to rule the country. There has been some minimalpolitical reform in the early 1980s when Deng Xiaoping took control of the party. In the late 1980s and 1990sChina witnessed the introduction of greater political checks and balances at the top leadership under theinitiative of Deng Xiaoping. But even today the party continues to be Marxists Leninist in its hierarchicalstructure. The highest formal organ of power is the Politburo Standing Committee (PSC) consisting of sevenmembers, currently headed by the General Secretary of the CCP. Other important institutions are the StateCouncil, led by the Premier, Wen Jiabao, and the National People’s Congress (NPC), a largely rubber-stampparliament. The PLA is the armed instrument of the Chinese Communist Party (CCP) and organizationally,subordinate to the Party apparatus. Career military officers are CCP members, and units at the company leveland above have political officers responsible for personnel decisions, propaganda, and counterintelligence.Major decisions at all levels are made by CCP committees, and also led by the political officers andcommanders. The PLA’s highest decision-making body, the Central Military Commission (CMC), is technicallya department of the CCP Central Committee, but is staffed primarily by military officers. The Chairman is acivilian, usually the General Secretary of the CCP and the President. Other members include the commandersof the service arms and the four general headquarters departments, and a number of Vice Chairmen. VicePresident Xi Jinping, the chosen successor to the PRC President Hu Jintao, is already the Chairman and theonly other civilian on the CMC.3
Current Leadership Transition and Challenges
China has seen a power transition from the fourth generation (Hu Jintao-Wen Jiabao system) to the fifth (XiJinping-Li Keqiang system) after the 18th National Congress of the Communist Party of China on December15, 2012. The previous generations of China’s leaders were focused on growing the country’s economy.However, now that China has emerged as an economic superpower—the second largest economy in theworld—policy changes made by the new generation of leadership will have broader implications for China andthe world. In the current period of political transition, the party is faced with the need to balance, on the onehand, the domestic expectations of a burgeoning middle class who are pressing for social, political andeconomic change and, on the other, the conservative views of elderly statesmen and military commanders.The hard handling of ‘Bo Xilai incident’ sends a clear signal to all stakeholders that the party will not tolerateany open factionalism and indiscipline.
The Western version of opinion, that China, since ruled by one party (the CPC) is unstable in long run might beover exaggerated. But the ruling party is facing severe challenges which can hinder its prospect of emergingas an alternative to western liberal democratic order. The ruling communist party continues to command thehold of its power across the length and breadth of the world’s third largest territory and the most populousnation on this planet. Chinese citizens enjoy only limited rights and their right to freedom of speech is restrictedby various conditions. The current Chinese political system limits the free flow of information, lacks the self-correcting mechanisms of democracy, and hence stifles creativity. Its problems are daunting. Income inequalityis growing. Inflation is a threat. The country is rapidly aging. The divide between urban and rural quality of lifeis vast. Corruption is widespread (Zakaria, 2009). The rising Gini-index and wealth gap among the rich and thepoor has emerged as a major social and political destabilizing force in the country. The rich and poor in Chinacannot live in harmony with each other as the officials are alleged to have favored their kith and kin in gettingrich first.
In 2010, China has emerged to be the world’s largest economy overtaking Japan and also the largest tradingnation in the world. The year, 2011 also marked the Tenth anniversary of China’s joining of WTO. Despite allthe above achievements, China is emerging as one of the most unequal society in terms of the gap betweenrural and urban areas. Deng, who was the chief architect of the Chinese economic reform, then said that “to

Volume 1, No.1, January-March, 2013 33
grow rich is glorious” and allowed the theory of “let a few pockets of country get rich first”. The sametheory is now haunting back the country. Although the Chinese government shifts its policy away from aninsular focus on economic expansion and moves to pursue sustainable development, the working-age population(ages 15-59) begins to decline in 2014, and by 2020 the percentage of the population over 60 will reach 17%.Therefore China will experience a large generational shift between 2020 and 2030. This decade will mark thefirst time that those born and raised as single children under the “one-child” law will acquire positions of powerand it is difficult to predict exactly what effects this development will have on Chinese society.
In 2012, there was less number of coal mine accidents compared to the last year. But the environmental costof the pollution caused by chemical industry has been claiming the lives of average citizens. It was in Dalian,in October that thousands of citizens took to road in order to demand the closure of a chemical plant, amidstfears of a toxic leak. Government has to finally shut down the plant on the assurance of relocating it to otherregion. Later in the same area, an oil spill which was for long concealed by the authorities, but whendiscovered by the public and spread on Weibo, the Government was forced to take actions. As the time goeson, and number of cancer patients rises in the country, the cost of China emerging as World’s factory seemsto be very high. There were similar protests in thousands across China demanding shut down of pollutingplants and other scandals. The Government officials especially from the National Development ReformCommission have been trying hard to ensure the consumer rights and reign into the food adultery but with littlesuccess. The Chinese mothers distrust the local milk food and rely mainly upon imported quality. There weresimilar scandals which exposed the farce of rule of law in the country. As the use of Social media grows inChina, it will be further difficult for the party to continue its propaganda.
As per the reports in domestic media, the incidents of school bus accidents exposed that how Chinese societyis still vulnerable to poverty and underdevelopment despite China emerging as the second largest economy.4
The social security system in the country is still in complete jeopardy and the health care is unaffordable tomajority of its citizens. China will be facing an aging society in the coming years when there will be muchmore dependent people than the number of working population. Social unrest in China is mainly rooted in theuneven distribution of the wealth among its different regions; especially the gap between the coastal andWestern reason is rising. Chinese villages are getting deserted and all the young people are moving to cities. Atthe same time many party officials are alleged to have sent their families abroad and transfer illegal wealth tothem. There has been growing trend among many private entrepreneurs in China to move abroad and acquireforeign nationality. Like in India, the life of common Chinese is getting harder due to rising food inflationwithout relative increment in their salaries. Inflation did occupy most of the working time of Chinese PremierWen Jiabao, but it was reigned into with limited success. The realty sector for the first time in a decade sawa fall of 5-10 percent in price. Majority of the Chinese people cannot afford to buy one sweet home as theratio of their income to the housing price is quite disproportional. Nevertheless, although China surpassesJapan to become the world’s second largest economy in GDP terms, per-capita income and social infrastructureremain at levels on par with an undeveloped nation. Decades of rapid economic growth may come to an endbefore income disparities and the gap between the urban and rural areas are corrected and those Chinese whoare yet to benefit from economic development will remain be left behind.5 The frustration and discontent withthe Communist Party felt by those who have had their lives and health ruined by worsening environmentalproblems reaches its peak. Popular demonstrations and riots that had until this point remained more-or-lessisolated expand across regional borders, and becoming far more organized in the process. The CommunistParty, overwhelmed by the massive riots now occurring throughout the country, attempts to maintain socialorder by force and is showered with criticism from international society. Economic growth grinds to a halt andChina descends into chaos. (PHP Report, 2008)
Another looming crisis the Chinese government will be facing in 2013 is the huge bad loans concurred by itsstate owned banks. As Dr. Subramianum Swamy has predicted in his research paper6 and also other media

34 Journal of Indian Research
has reported that the Local governments have borrowed huge amount of loan from these banks which needsto be bailed out sooner or later. However, the government denies this banking crisis, and argues that there is norisk to Chinese financial system as China enjoys a huge foreign currency reserves which can be utilized to bailout these banks. However, if it goes the other way around, then a financial crisis is in waiting and the housingbubble burst (ghost townships) can send China into chaos.
But at the same time ,the party has started a crackdown against the corrupt officials and it is supposed to becleaned and purified in the coming years. This has won the sympathy of most of its citizens and hence thelegitimacy of the party will be maintained. The top party leaders have already signaled for political reform andestablishment of the rule of law. But all this will not materialize into an early holding of popular elections inChina. China will continue to be ruled by Communist party. Nowadays, in mainland China or outside, no publicintellectual will desist from using the “D” word7 in their formal or informal talk or lectures. It has become anaccepted norm that China is developing towards a democratic society as well as polity on its own pace. Thecensorship on discussion of this topic in the open space no longer holds under the articulate public intellectualsat Chinese Universities as well as millions of bloggers.
Prospects for Democracy
What are the prospects for democracy in contemporary China? The students of liberal-democracy will becertainly disappointed with the progress of the democratic institutions building in the recent history of CommunistChina. It seems that “Democracy” is normally an ideal to be achieved for China in the coming years. But itseems that, in the coming decade, the CCP does not seem to be serious about launching China into democraticmode of governance. China calls itself a government of democratic parties that are led by the communistparty. One of the other parties is the China Democratic League (Minmeng) which has more than 100,000members, who are mostly educated intellectuals. On the other hand, the All-China Federation of Industry andCommerce (ACFIC) is far larger than any of the democratic parties. It is made of the mostly rich privateentrepreneurs who are adopted by the party.
But whether China will become a democratic country based on popular elections and civil rights with freedomof speech have raised doubts among its longtime observers. If one is well versed in Mandarin, then he can findseveral websites which have listed extensive articles and papers on rural democratic construction in China.These intellectuals are playing safe by not questioning the legitimacy of the party and at the same timeembracing certain values of Western Liberal democracy. Therefore some commentators conclude that theyare not committed to the goal of democracy in China. In their recent writings and pamphlets, even they haveattempted to redefine the concept of democracy in a Chinese context. Some Western Scholars, such as DanielBell, who teaches Philosophy at Tsinghua University have also joined this chorus by publishing few works infavor of East Asian illiberal tradition of democracy based on Confucian ethics.8 These scholars have questionedthe Western values and Human Rights which may not be perceived in East Asia in the same way.9
Improvements in the standard of living stimulate a desire among the Chinese people to actively participate inthe political process and this eventually evolves into a democracy movement. While there remain concernsthat rapid democratization will foment political instability, a shared awareness spreads throughout society thatprogress toward political democratization and the realization of a “harmonious society” are necessary tomaintain economic development. Particularly those young Party members who majored in law, economics, andother similar fields and were educated overseas begin to champion gradual democratization. China’s politicaland social development gradually catches up with its economic development.
The paradox of the Chinese society today is that at one hand they are longing for a clean, accountable andpopular government based on democratic values, but they are also scared to disturb the current stability in thecountry, which has been propagated to be major factor behind China’s continued prosperity. The people inpower argue that demand for democracy and liberty is limited to a section of intellectuals who have studied or

Volume 1, No.1, January-March, 2013 35
being trained in the Western Countries, and the majority of Chinese people continue to believe in the might ofthe communist Party in leading their nation. But the fact is that the Chinese are scared of power vacuumwhich will be created, if legitimacy of the communist party is questioned, and an alternative form of governmentbased on Western Liberal system is proposed. At the same time, the grassroots democracy is taking place inthe country in a very controlled way. Village level elections as well as local elections in the cities are gettingpopular, but still more than 80% of the elected candidates are party members. If this is the pace of democratizationin the country, then it may take another century for China to join the mainstream of nation-states. Transition toDemocracy in China seems to be a mirage.
Hence, the future of the Chinese Communist party seems to be full of challenges as the growing demands forfree speech and accountability steps up in the coming years. The areas resided by minorities such as Tibet andXinjiang continue to be under constant police patrolling, and there has been heavy crackdown in these regionsdue to growing activities of terrorism and secessionist activities. In the last two months, several bomb blasthave occurred in shopping malls of the city of Xi An and Wu Han without any trace of conspirators. But toany regular visitor who comes to China, it appears to be a normal country with stable polity and dynamiceconomy. It is up to the Party leaders who may either chose to liberalize their control on media and the civilsociety or further tighten their grip in panic. The consequences of each of the two actions will be unpredictable.Currently, the biggest threat to the ruling party in China is corruption, and if, it is not reigned into in time, therecould be lasting political and social instability in this country.
The policies of the next administration are unlikely to depart significantly from those of Hu Jintao. But therehave been some gestures of political reform from new leader Xi Jinping who have openly talked aboutreforming the party and carrying out long-awaited political reforms. He recognized that official corruption hasbecome the Achilles heel of the entire system and hence started a cleanup campaign across the partyorganization and country’s administration. More than thousand officials are being tried and there has been anew revelation of corruption on the social media almost every day.
Will China emerge as a Political Alternative to the West?
On the other hand, Chinese scholars have reinvigorated the debate on whether China should adopt a Westernstyle political system or should carve out its own socialist democratic model. In the social media as well asamong the serious academicians, the Chinese intellectuals have launched a countrywide debate focused on thepros and cons of Western democracy. They are also joined by some China watchers from the West such asProfessor Daniel Bell who recently published an article expressing the view that Chinese Meritocracy hasseveral advantages over Western capitalist institutions.
This is the second wave of Confucian challenge to Western political and economic ideas and institutions. Thefirst was in the early 1990s, when the four East Asian countries (and regions also known as four little dragonsincluding Singapore, Hong Kong, Taiwan and S. Korea) achieved miraculous success in their economic growthand attributed it to their Confucian ethics. A huge debate was generated among economists and policy makerson the issue of Confucian collectivism vs. Western Individualism. Singaporean leader Lee Kuan-Yew preachedAmericans about his country’s achievement guided by Confucian society and Authoritarian state. But it fadedaway once these Asian economies faced a severe currency crisis in the late 1997-98.
Now the same thing is being advised by the Chinese policy makers to their Western counterparts in US andEuropean who are in deep financial mess since the unfolding of Subprime mortgage crisis in 2007-08. Chineseeconomists find their own economic system superior to that of Western capitalism and hence came out withthe idea of “Beijing Consensus” (A term coined by a Latin American Scholar Joshua Cooper Ramo). Butthere have been differences with regard to the concept of Asian Values, and Indian scholars have neversupported these kinds of perceptions. Many overseas scholars of Indian origin such as Dr. Amartya Sen have

36 Journal of Indian Research
argued that democracy is a universal value, hence it is misguided for East Asian leaders to advocate Asianvalues or an Asian development model.10 Chinese Confucianism has found its main constituency among theAfrican countries as well as the Arab world. Most of these countries are victim of American propaganda ofpromoting democracy.
In its long history Chinese conception of political rights has evolved from various sources such as Confucianism,Chinese Republicanism, and lately Marxism. Some Chinese intellectuals like David Kang have propagated thatin East Asia ,China should restore its historical Sino-centric tributary system of world order which is quite anodd idea to the current popular Euro-centric capitalist-world system.11 Scholarship on Chinese legalism hasbeen scanty, especially in contrast to that on Confucianism. But recent works of Prof. Yan Xuetong ofTsinghua University has brought this school in perspective along with prevailing Confucianism. Legalism hasbeen criticized for its totalitarian philosophy by other commentators, as Communist China has been watchedfor its totalitarian politics.12
There is no doubt that China will democratize at its own pace, but what kind of democracy it will have andhow it will be different form the Western liberal democracy is yet not clear. There has been no partydocument except some references in the 18th Party congress with regard to political reform, which clearlyunderlines the fact that China will carve out its own course of political institutions which will suit its nationalconditions and not introduce western style popular elections to elect its top leaders.13 In fact, China is no morea communist country apart from retaining all the communist and Stalinist nomenclature. The Chinese societyas well as the Chinese State has practiced pragmatic socialism and has adopted most of the economic andsocial reforms which were mainly practiced by Capitalist countries. As China‘s economic development bringsgreater standards of living to greater number of the population, concern for environmental degradation isexpected to increase and demands for a greener development path are expected to grow ever louder.14
Therefore the new left in the country holds the view that China’s present leaders have turned their back uponrevolutionary solutions to the problems of socialism. In an interview in 1980, Deng Xiaoping upheld socialism butrefused to predict if it would prevail in the future.
Predicting Future
It is an impossible task to predict the future of Chinese course in the coming years. The China collapse theoryhas been propagated since the 1980s, but on the contrary, the country has been growing stronger and stronger,and has come up to challenge the worlds’ sole Super power, the United States. Brimming with confidenceconsequent to its economic success and social stability, China, now with extensive experience of workingthrough maze of multilateral institutions, seeks to play a role in international society as a responsible power.Now it is evident that, while the US was busy fighting the War on Terror, China managed to achieve severalmilestones and emerged as the most formidable challenger to American supremacy. Beyond doubt, China willbe the most important country to be watched in 2013, for her economic, military and foreign policy maneuvers.China has rapidly re-emerged as a major regional power in East Asia. Although this represents a return to along-established historical pattern, the ability of China’s political elites to reassure nervous neighbors about theimplications of its rise will be a major test of its evolving and increasingly sophisticated foreign policies. ForIndia, the military rise of communist China will continue to be the foremost challenge in her foreign policymaking. India will find it difficult to reconcile r national interest with that of giant northern neighbor.
On the external front, it was stated in the 2008 and 2010 PRC Defence White Papers that, “China will neverseek hegemony…no matter how developed it becomes”.15 Furthermore, Zheng Bijian the former ViceChairman of the Central Party School stated that “China will not follow the path of….Germany and Japanleading up to World War II, when these countries violently plundered resources and pursued hegemony.”Further, speaking at Cambridge University in February 2009, Premier Wen proclaimed: “The idea that astrong country must be a hegemon does not sit well with China. Hegemonism is at odds with our

Volume 1, No.1, January-March, 2013 37
cultural tradition, and it runs counter to the wishes of the Chinese people. China’s development harmsno one, nor does it threaten anyone. China wants to be a great country of peace, a great country oflearning, a great country of cooperation, and China exerts effort on building a harmonious world.”16
In order to maintain growth, the Chinese leadership desires a peaceful international environment and thepossibility that it would initiate large-scale military conflict remains extremely small. Outside its borders, Chinadoes adopt policies to limit American hegemony, but avoids direct confrontation, choosing instead to maintain acooperative relationship with the United States.17 By quietly carrying out military and intelligence exchangeswith the United States, Japan, and other neighboring countries and making a sincere effort to see that itsdefense expenditures and strategic intentions are made as transparent as possible, China contributes toconfidence-building in the region. Rather than impatiently forcing a solution to the Taiwan issue, China adoptsa posture that maintains the status quo and stresses a solution through dialogue. However, the danger that theTaiwan issue or territorial disputes in the South and East China Sea could result in an unplanned military clashremains.
China continues to face a number of domestic contradictions and societal problems and, even after itseconomy stalls for a brief period of time, it will irresistibly evolve into a political and economic global power.While the global economy faced recession in 2011, Chinese economy grew at the rate of above 9%, whichwas possible mainly by huge investment in infrastructure sector. The current system will work as long as theChinese economy continues to achieve high growth and the government could earn ample money through taxrevenues. However, when the bubble economy will burst; China will suffer hard landing with possibility ofmajor social instability and change of regime. But the party may continue to rein if there is no strong and viableopposition group to challenge its legitimacy. The party control is still quite strong and the Chinese capitalismlurks forward as the morphed form of planned socialism.
Footnote1 However, some continue to argue that the world is still dominated by US hegemony and China is emergingto play an important role in the world governance. On the eve of US President Obama’s visit to China in 2009,the Chinese media was overwhelmed with the view of New World order emerging in the 21st century to whichthey put the label of G-2 (although the term was first used by an American itself). The G-2 which is China andAmerica (Niall Ferguson of Harvard University has coined Chimerica to represent the symbiosis of twopowers), was coined by Zbigniew Brzezinski, who said that the two countries will be at the driver’s seat of thenew global governance. Obama had also said in his Town Hall speech that China is such an important countrythat no global issue can be resolved without her cooperation. This single remark clearly puts China at par withthe United State in terms of global influence. But it also appears that Obama is playing a double card byasserting the USA to be a Pacific nation and therefore seeking for the US an important role in the peace andstability of this region2 The emergence of China as the most important player in the Asia-Pacific region is a fact now. There is nodoubt that the Asia Pacific region is now at the center of the global politics and it has subdued the importanceof Atlantic region. The Chinese economy overtook the Japanese economy in 2010 and became the secondlargest after the USA. It is expected to surpass the US GDP sometime around 2020 (World Bank, 2010). It isbelieved that, China’s rise represents the key driver in the evolving security landscape in Asia. China is nowattracting regional states with its economic power and is offering competing vision to the U.S.-centric “huband spoke” system of alliances. China’s increasing economic, diplomatic, and military strength is compellingcountries to rethink existing security arrangements and take initial steps that may lead to the formation ofregional groupings of nations with common interests and values.3 China’s Ministry of National Defense is a relatively small office specializing in military-related tasks that arethe responsibility of the civilian government rather than the armed forces, including foreign military relations,mobilization, recruitment, and civil support to military operations. The Minister of Defense is a uniformed

38 Journal of Indian Research
military officer and CMC member. The PLA currently has less representation in key party decision-makingbodies than in the mid-1990s or even the mid-2000s. With the passing of China’s revolutionary generation,fewer national leaders hail from a military background. However, PLA leaders are increasingly inclined tovoice their thoughts and opinions on international affairs in the public domain. For further details related withChinese Decision making on national security see http://www.defense.gov/pubs/pdfs/2011_CMPR_Final.pdf
4 Despite the tall claim (also supported by WB economists) that 500 million people have been brought out ofpoverty, ADB report said that millions of them are on periphery and if the economy slowdowns then thesepeople will be pushed back into poverty. The Chinese Society is currently witnessing widening economic andsocial disparity. As a result, the contrast between urban prosperity and rural depopulation has become sharper,which is a major problem for Chinese society.5 The Chinese government maintains the quadrupling of per-capita GDP in the two decades between 2000 and2020 as official government policy. It successfully shifts from fast-paced growth to sustainable development,implements adjustments to the industrial structure, and achieves its objective. Labor-intensive industries aretransferred to the mid-west and people in rural areas also receive the blessings of economic development.(PHP, 2008)6 See Subramanian Swamy, (2005), Financial System Constraints in China and India-A Comparative Perspective,SCMS Journal of Indian Management, Vol.2(4).7 “D” for Democracy.8 Joanne R. Bauer and Daniel A. Bell, editors. The East Asian Challenge for Human Rights. Cambridge:Cambridge University Press, 1999.Also see: Daniel A. Bell. East Meets West: Human Rights and Democracyin East Asia. Princeton: Princeton University Press, 2000.9 The 1993 Bangkok Declaration constituted the most serious challenge to the movement in its short life bycalling into question the universality of its normative claims. Increasingly self-assured as a result of tremendouseconomic growth, Asian governments started to champion their own Asian values. They also began todenounce what they considered to be self-righteous preaching by Western states that in many cases wereresponsible for a colonial legacy of rights abuses in the Asian countries over which they now sat in judgment,and in any event had human rights problems of their own, back at home. Although Asian leaders stopped shortof denying outright the universality of human rights, their assertion that human rights must reflect the particularcircumstances of particular country at particular time smacked of a cultural relativism that threatened to erodethe seeming consensus on human rights that had developed over the previous five decades. The BangkokDeclaration along with the statements of Asian governments at the Vienna World Conference on HumanRights in 1993 plus the Asia-Pacific Non-Governmental Organizations’ response to the Bangkok Declarationcan be found in James T. H. Tang, ed., Human Rights and International Relations in the Asia-Pacific Region(New York: St. Martin’s Press, 1995).10 Amartya Sen, “Democracy as a Universal Value,” Journal of Democracy 10, no. 3 (1999):15.11 China is only the latest name of the Middle Kingdom which has remained isolated and closed for millenniums.Most of the Chinese still think local and behave in a narrow setup of the “Tianxia” (or the Chinese World)mindset which tells them that they are at the helm of world affairs. Japanese think tank (PHP) research havepredicted that, the most probable scenario for “China in 2020” is that of “China as an immature power,” not a“mature power.” The report also professed that the like-minded Asian countries such as Japan and Indiashould work together to avoid the scenario of “China as a hegemonic power,” or “China as an unstablepower,” and “total collapse.” The report warned about China’s hard landing after a long period of spectaculargrowth (civil unrest).

Volume 1, No.1, January-March, 2013 39
12 For a concise recapitulation of this legalist view in contrast to the Confucian position, see A. C. Graham,“The Place of Reason in Ancient Chinese Philosophical Tradition,” in Chunshu Chang, ed., The Making ofChina: Main Themes in Premodern Chinese History (Englewood Cliffs, New Jersey: Prentice-Hall, 1975), pp.72-84. Liang Qichao analyzes in sociological terms the legalist focus on the concentration of power as anecessary stage in historical development (History of Chinese Political Thought, p.125).13 The 18th Party Congress report is available at http:// www.chinadaily.com.cn/china/2012cpc/2012-11/18/content_15939493.htm.14 China has thus far permitted the establishment of environmental NGOs to appease foreign audiences andprovide useful information regarding the state of the country‘s environment and popular opinion in that regard.But the standard it follows for environmental reporting are quite different than practiced in other countries.The US embassy comes out with its own pmi level with regard to the air quality in Beijing.15 China began publishing defense white papers in 1998, partly as a means of increasing transparency inresponse to regional concerns about the growing capabilities and actions of the People’s Liberation Army(PLA). See Information Office of the State Council…,‘China’s National Defense in 2008:I The SecuritySituation’;16 See “China in the Light of Her Development,” Speech by Premier of the State Council of the People’sRepublic of China, Wen Jiabao, Cambridge University, United Kingdom, February 2, 2009.17 Following Deng Xiaoping’s advice to focus on building national strength and avoid conflict with other powers(ì—IQ{Qfftao guang yang hui), China continues to promote an “omni-directional foreign policy” in order toensure continued economic development and, despite openly protesting America’s unipolar domination of theinternational system, makes every effort to avoid direct confrontation. China not only attempts to establishleadership in Asia, but also actively works to expand its diplomacy with states in Africa and Latin America inorder to guarantee access to energy resources.
References:
Aaron L. Friedberg, ‘‘Ripe for Rivalry: Prospects for Peace in a Multipolar Asia,’’ International Security,Winter 1993/94, pp. 5-33.
Aaron L. Friedberg, ‘‘Europe’s Past, Asia’s Future,’’ SAIS Policy Forum Series (October 1998, No. 3)
Akio Takahara, “A Japanese Perspective on China’s Rise and the East Asian Other.” in Robert Ross and ZhuFeng. eds. “China’s Ascent”, Ithaca: Cornell University Press, 2008.
Amartya Sen, “Democracy as a Universal Value,” Journal of Democracy 10, no. 3 (1999):15.
Angus Maddison, Contours of the World Economy 1-2030 AD. Oxford: Oxford University Press, 2007.
Bijan Zheng, China’s Peaceful Rise to Great-Power Status; 84 Foreign Aff. 18 (2005)
Conrad Totman, A History of Japan. Malden: Blackwell Publishing, 2005.
David Shambaugh, ed., Power Shift: China and Asia’s New Dynamics (Berkeley, CA: University of CaliforniaPress, 2005), p. 13.
David M. Lampton, The Three Faces of Chinese Power: Might, Money, and Minds (Berkeley, CA: Universityof California Press, 2008),
Daniel A. Bell. East Meets West: Human Rights and Democracy in East Asia. Princeton: PrincetonUniversity Press, 2000.

40 Journal of Indian Research
David S. Landes, The Wealth and Poverty of Nations: Why Some Are So Rich and Some So Poor. NewYork: W.W. Norton, 1998.
Friedman, Edward. “Preventing War Between China and Japan,” In What if China Doesn’t Democratize?Implications for War and Peace, ed. Edward Friedman and Barrett L. McCormick. Armonk: M.E. Sharpe,2000.
Gregor Benton and Alan Hunter, editors. Wild Lily, Prairie Fire: China’s Road to Democracy, Yan’an toTiananmen. Princeton: Princeton University Press, 1995.
Hugh White, ‘‘Why War in Asia Remains Thinkable,’’ Survival: Global Politics and Strategy, Dec. 2008-Jan.2009, p. 6, pp. 85-103.
Jian Zhang, “The Influence of Chinese Nationalism on Sino-Japanese Relations.” In China-Japan Relations inthe Twenty-First Century: Creating a Future Past? edited by Michael Heazle and Nick Knight. Northampton:Edward Elgar, 2007.
Joanne R. Bauer and Daniel A. Bell, editors. The East Asian Challenge for Human Rights. Cambridge:Cambridge University Press, 1999.
John J. Mearsheimer, The Tragedy of Great Power Politics (New York: W. W.Norton, 2001);
Kindleberger, Charles P. World Economic Primacy: 1500-1990. Oxford: Oxford University Press, 1996.
Kishore Mahbubani, The New Asian Hemisphere: The Irresistible Shift of Global Power to the East (NewYork: Public Affairs, 2008).
Kurt M. Campbell, Nirav Patel and Vikram J. Singh, The Power of Balance: America in Asia (WashingtonDC: Center for a New American Security, June 2008), pp. 14-15.
Liang Qichao, History of Chinese Political Thought during the Early Tsin Period, trans. L. T. Chen (NewYork: Harcourt, Brace, 1930), p. 115.
Mancur Olson,. The Rise and Decline of Nations: Economic Growth, Stagflation, and Social Rigidities.New Haven: Yale University Press, 1982.
Mark R. Peattie, “The Poisoned Well: Fifty Years of Sino-Japanese Animosity.” InCross Currents. Stanford:Walter H. Shorenstein Asia-Pacific Research Center, 2007.
Mearsheimer, John J. Why Leaders Lie. New York: Oxford University Press, 2010.
Martin Jacques, When China Rules the World: The End of the Western World and the Birth of a NewGlobal Order, Penguin Group US, 2009.
Michael J. Green, ‘‘Asia in the Debate on American Grand Strategy’’ Naval War College Review, Winter2009, pp. 15-30.
Ministry of Foreign Affairs of the People’s Republic of China. “Some Sensitive Issues.” www.fmprc.gov.cn/eng/wjb/zzjg/yzs/gjlb/2721/2722/t15974.htm (accessed February 15, 2013).
Niall Ferguson, ‘‘The G2: Are America and China Headed for a Divorce?’’ New Perspectives Quarterly, vol.27.1 (Winter 2010) pp. 35-38;
Paul. Kennedy, The Rise and Fall of the Great Powers: Economic Change and Military Conflict From1500 to 2000. New York: Random House, 1987.
Peter Worthing, A Military History of Modern China. Westport: Praeger Security International, 2007.

Volume 1, No.1, January-March, 2013 41
PRC White Paper on National Defense, December 2008, 2010.
R. D. Putnam, “Diplomacy and Domestic Politics: The Logic of Two-Level Games.” InternationalOrganization,1998,vol. 42(3)pp. 427-460.
Robyn Lim, The Geopolitics of East Asia: The Search for Equilibrium (London: Routledge, 2003);
Saul Bernard Cohen, Geopolitics: The Geography of International Relations (2nd ed., Lanham, MD: Rowmanand Littlefield, 2009), Chs. 8-11.
Takashi Yoshida, The Making of the “Rape of Nanking”: History and Memory in Japan, China, and the UnitedStates. New York: Oxford University Press, 2006.
Zha Jianying. China Pop: How Soap Operas, Tabloids, and Bestsellers Are Transforming a Culture.New York: The New Press, 1995. 210 pp.
Zbigniew Brzezinski, The Choice: Global Domination or Global Leadership (New York: Basic Books, 2004), p.107.
Zbigniew Brzezinski, The Grand Chessboard: American Primacy and its Geostrategic Imperatives (New York:Basic Books, 1997), c. 5.
Zhu Feng, ‘‘China’s Rise Will Be Peaceful: How Unipolarity Matters,’’ in Robert S. Ross and Zhu Feng, eds.,China’s Ascent: Power, Security, and the Future of International Politics (Ithaca, NY: Cornell University Press,2008), pp. 34-54.

42 Journal of Indian Research
Journal of Indian Research, Volume 1 No. 1, 2013, 42-52
Philosophy
CONTEMPLATING THE IMAGE OF BHAIRAVA1 : A STUDY OFKSHEMARÂJA’S BHAIRAVÂNUKARANASTAVA
Sthaneshwar Timalsina*
ABSTRACT
The cult of Bhairava appears around the 6th Century. Though, the genealogy can be traced to theearlier extant Kapalika tradition, the advent of Trika Saivism in Kashmir during the 9th-10th centuries,provided impetus to the spread of the cult of Bhairava. This paper examines one image of Bhairava, theSvacchandabhairava, as detailed in a text by the Kashmiri Tantric theologian and philosopherKshemarâja (11th C.), disciple of the Abhinavagupta credited with synthesizing Indian culture. The textnarrates the process of absorption (samâvesha) wherein the yogin experiences himself as Bhairava.The practice of visualization in the imagery of Bhairava induces experience of non-duality where theself is experienced as identical to the totality of manifestation and also with the Bhairava deity.
Key Words: Bhairava, tantra, Kâpâlika,Trika, dhyâna, pratyabhijñâ,consciousness, mandala, ritual
INTRODUCTION
Bhairava is the central deity of Kaula Tantrism. In medieval Tantras, Bhairava is considered to be the centraldeity of sixty-four Âgamas, and while separate Tantric texts are attributed to goddesses such as Kubjikâ,Bhairava resides at the center of the deity mandala in many of these traditions. The peculiarity of Bhairava ascarrying a skull cup, as well as other weapons such as a staff or a trident, helps to relate this deity to theKâpâlikas. The shrines of Bhairava located nearby the cremation grounds (most often near the shrines ofYoginî, Châmunda, or Kâlî), or the deity shown with a dog as his ride further confirm his Kâpâlika association.Bhairava, however, is not merely worshipped by the Tantrics in their esoteric rituals, as the deity is widelyrevered throughout the pan-Indian continent, with shrines dedicated to him widely distributed in Kathmanduvalley, Varanasi, Rajasthan, Karnataka, and Tamil Nadu. While the earliest imagery of Bhairava appearsaround the 6th Century, this deity comes to prominence with the rise of the distinctive philosophical school ofTrika in Kashmir during the 9th-10th centuries. The objective of this paper is to examine one image of Bhairava,the Svacchandabhairava, as detailed in a text by the Kashmiri Tantric theologian and philosopher Kcemarâja(11th C.), disciple of the prominent Kashmiri philosopher Abhinavagupta.
With the development of the Tantric Kaula and Trika systems in Kashmir during 9th–11th centuries, Bhairavaemerged in a prominent position. Texts dedicated to one or another emanation of Bhairava were written, andprominent scholars such as Abhinavagupta composed their texts with Bhairava at the center of their liturgy.The available myths and ritual texts relate Bhairava to shiva, depicting him as immanent, oriented towardsworld with his wide open gaze. Like the many depictions of shiva begging for alms, Bhairava is clearly arenunciant, wandering with his skull cup (kap a la). Following one myth, Bhairava is the manifestation of Shivaafter he severed one of Brahmâ’s heads and had to beg to redeem himself from the sins of Brahmanicide.This identification of Bhairava with Shiva has, while making Shaivism esoteric, brought Bhairava to wideracceptance.
*Sthaneshwar Timalsina is Professor of Religion and Philosophy, San Diego Univerisity, USA

Volume 1, No.1, January-March, 2013 43
The above-mentioned myth of Bhairava lends support to the interpretation of central motifs associated withhim, that the skull he carries is the head of Brahma, and that he has turned dark due to the sins he collectedin severing the head of Brahmâ. Although the description found in this myth is widely distributed in Purânicand Âgamic literature, the popular imagination of Bhairava does not address Bhairava as the central deity thatembodies emotions. If we analyze some of the names associated with this deity, Bhairava embodies time anddeath in his emanation of Kâla; becomes a ferocious deity called Chanda; is in fury, as his name Krodhasuggests; is aroused, as the name Unmatta describes; generates fear, as the name Bhîshana suggests; andembodies destructive characteristics, portrayed by the name Samhâra.
The centrality of Bhairava in theological discourse is clearly seen in Abhinava’s Tantrâloka or Kshemarâja’scommentary on Svacchandatantra. The image of Bhairava as depicted in these texts, however, is not of adeity begging in penance or playing the part of destruction. These texts depict Bhairava as the almighty,carrying out all the roles through different emanations. Bhairava, in this depiction, is at the center of mandala,with the deities surrounding his mandala carrying out his command. The origins of this tradition, as Sanderson(1988: 699-701) suggests, are associated with the early cremation ground practices of the Kâpâlikas. Theimage of Svacchanda Bhairava as presented by Kshemarâja in his Bhairavânukaranastava (BAS) transcendsearlier depictions of this deity. In the non-dual Trika paradigm, Bhairava is the supreme reality, embracing allthat exists, and is identical to the self. The image of Bhairava in this shifted paradigm becomes emblematic ofthe yogis and one’s experience of oneself, as ‘Bhairava’ is no longer just the name of a deity in this context buta concept to depict the highest state of cosmic awakening, the surge of bliss and consciousness that embodiesthe totality.2
The objective of this paper is to decipher the imagery of Bhairava as described in BAS by Kshemarâja.According to the Trika tradition that Kshemarâja upholds, Bhairava stands for both the supreme deity and thestate of experience of a yogin in the state of highest absorption (samâvesha) wherein the yogin experienceshimself as Bhairava. This experience is the culmination of the practice of visualization in the imagery ofBhairava. The experience of non-duality where the self is experienced as identical to the totality of manifestationand also with the deity is cultivated in this visualizing process. This process, thus, is an active gaze uponBhairava imagery, relating specific gestures and weapons of Bhairava with the central tenets of the Trikadoctrine. Accordingly, the focus on Bhairava’s imagery is no longer a mere observation of it, but a consciousand creative gaze where the consciousness of the aspirant is oriented towards non-dual experience whilefocusing upon the image of the deity as support.
The Image of Bhairava
The focus of this paper, as mentioned above, is the image of Bhairava detailed in a small treatise,Bhairavânukaranastava (BAS) of Kshemarâja.3 By bringing to light this work of Kshemarâja, this paperaims to initiate a reading of Tantric visual culture in relation to its literary culture. Tantric images provide ampleexamples that support the claim that a society’s literary culture at any given time defines and describes thevisual culture. In the absence of a proper awareness of Tantric literature, interpreting these images and evenexperiencing their aesthetic modes can be compromised. Historically, an image over time accretes meaningsthat are found in different systems, and any interpretation needs to keep these integral cultural processeswithin the conceptual framework. This awareness allows a viewer to enter the heart of the artist and acquirehis refined gaze. The interpretive enterprise is not isolated within philosophical texts, with liturgical texts andthe manuals for architecture providing a glimpse of the meaning of images as well. By focusing on a singleTantric image that is prototypical of many other images, the objective here is to investigate the philosophicalfoundation of Tantric visual culture.

44 Journal of Indian Research
While the argument that Tantric images are embedded within an inherent system of signs and can beunderstood only in light of Tantras in particular and the layered philosophical perspectives in general has itsown validity, a question begs for an answer: have any of the classical philosophers applied these perspectivesto deciphering images? This paper intends to provide textual support for the claim that Tantric images havebeen the repository of meaning since classical times and the process of deciphering meaning has remainedintegral to ritual visualization (dhyâna), essential to Tantric practice. BAS is significant in that this concisetreatise reveals the philosophical scaffolding necessary for understanding the central Tantric deity, Bhairava.4
Kshemarâja, the foremost disciple of Abhinavagupta (950-1020 CE), contributed greatly to the development ofthe Trika system. That Kshemarâja has a particular relation to Bhairava is explicit in his commentarialwritings.5 What is evident in BAS is that Kshemarâja treats the image as a text and endeavors to read it inlight of Trika philosophy. This reading or process of visualization is for him a means to access self-realization(pratyabhijñâ).6 In light of this, Kshemarâja considers weapons, gestures, and other physical characteristicsas meaningful elements of the Trika text.
The text begins with the identification of the self with Bhairava, ascribing to him aspects of self-awareness. Inlight of this, the physical gestures, posture, and ornaments are deciphered as instances of cognition andspecific feelings. Seeing the body of Bhairava, for Kshemarâja, is recognizing the self or consciousnessactively engaged through the senses in grasping the externals and returning back to the self. For him, thehighest realization does not isolate the self from its engagement in the world. The ever-enfolding and unfoldingentity, Bhairava or the self, is described here as simultaneously transcendent and immanent. While theessential nature of Bhairava is beyond the triad of cognized object, the process of cognition, and the cognizingsubject, at the same time, he also embodies this triad. The image of Bhairava is thus the intermediary groundof form and the formless. Bhairava, following this understanding, is the latent force in all manifestation,comparable to the lines that constitute alphabets or images.
This Bhairava-awareness is recognized in the heart, with the aspirant seeking identity between his body andthat of the deity. Pleasing Bhairava thus results in nourishing one’s own senses. As the limbs of Bhairavaparallel those of the practitioner, the attributes of the deity reflect specific modes of the subject engaged invisualization. Kshemarâja interprets the skull of Brahmâ as the fivefold power of awareness, bliss, will,knowledge, and action (BAS 9). These five energies are visualized as the five pretas, and stand for the firstfive principles (tattvas) in the process of emanation, identified as the ‘pure path’ (shuddhâdhvan). Kshemarâjainterprets the heart, head, tuft, shield, eyes, and weapons of Bhairava as six divine attributes, includingomnipotence, omniscience, pervasiveness, and so forth (BAS 10).
That Bhairava embodies paradoxes is vivid in all his gestures and aspects. For instance, the fire and waterelements signify poison and ambrosia, death and life. Visualized as his attributes, these contradictory elementsreside in harmony within Bhairava (BAS 12). It is noteworthy that the distinctive gesture called ‘Bhairavî’ isthe gaze that looks outward while remaining fixed within, revealing the nature of Bhairava in which paradoxesresolve. This gaze is frequently found in the images of Bhairava, indicative of awareness melded togetherinside and out, harmonizing the external world with intrinsic bliss and awareness. Bhairava is pure awarenesseternally free from duality, while remaining vibrant within and as the world, enjoying objects of the senses.According to Kshemarâja, in holding a skull cup filled with blood, Bhairava metaphorically enjoins the practitionerto likewise imbibe the fluids of life in an embrace of sensory pleasure (BAS 31). Bhairava drinks blood, ametaphor for the self enjoying life, recognizing sensory pleasure as a valid means for entering into the heart ofreality. Bhairava, as uninterrupted self-awareness, is ever-present, even when the senses are fully engaged

Volume 1, No.1, January-March, 2013 45
with the world (BAS 37). The supreme reality, although eternally free, assumes the form of Bhairava todemonstrate that one who knows reality is free, even though duality may appear within the phenomenal realm(BAS 40). The cremation ground, where Bhairava resides, is populated with ghosts and goblins. This, accordingto Kshemarâja, signifies awareness-in-itself as free from modifications, even while appearing in the form ofsegmented cognitive modes signified by the surrounding beings (BAS 41). Bhairava is the essential nature ofawareness-in-itself and the deities surrounding him in his mandala express the mantras, or words that revealawareness in all its glory (BAS 43). The central deity and the deities in the periphery can be compared withthe self and the body, with the senses allowing the self to embrace the reality that is externalized.
Kshemarâja interprets the garland made of hands and heads as the collection of individual selves that dissolveinto Bhairava’s nature of bliss and awareness (BAS 13). Bhairava thus is the image of singular self-awareness, where the phenomenal selves are subordinated and become mere objects of ornamentation.Following BAS 14, the entrails that Bhairava wears and grotesquely displays highlight the bondage of the body.Both what Bhairava wears and how he appears as demonstrate specific modes of the self being engaged inthe world. For instance, the lion’s skin that Bhairava wears or stretches taut signifies an illusory and stainedstate that does not exist in consciousness, devoid of all forms (BAS 15).
Bhairava’s weapons symbolize the powers that sever bondage and allow the self to manifest in its true nature.The sword of Bhairava cuts through the haze of mental agitation that gives rise to instances of cognition (BAS16). The shield the deity wields similarly demonstrates that that the devotees of Bhairava, armed with hisprotection, may free themselves from fear (BAS 17).
According to Kshemarâja, the rope signifies time, and since Bhairava, the deity or self-awareness incarnate,carries it, time is in his grip (BAS 18). The hook signifies the reabsorbing aspect of Bhairava that dissolvesdifference (BAS 19), leading to the solitary nature of Bhairava-awareness. Deities such as Brahmâ andVishnu refer to the divinity manifest within the realm of causation and bound in terms of time. Bhairava’s bowand arrow demonstrate the reabsorption of the deities that allow the world to manifest (BAS 20). The gesturesof boon and fearlessness, along the same lines, demonstrate the liberating nature of Bhairava, granting releasefrom suffering in the world (BAS 21-22).
By carrying the freshly chopped head that signifies illusion, Bhairava demonstrates his mastery over it (BAS23). The skull-staff of Bhairava signifies that the self is the foundation of creation (BAS 24). As the staff ofBhairava bears skulls, consciousness, likewise, holds the world manifest in the form of multiple subjects.Another gesture of Bhairava, carrying freshly-chopped heads by their tufts of hair, confirms this same aspect:awareness in terms of I-sense is manifest in manifoldness (BAS 32).
Kshemarâja interprets the musical instruments of Bhairava as mental modifications. The lute, bell, and drumthus refer to three varieties of mental constructions and Bhairava, the enlightened self-awareness, demonstrateshis control over them (BAS 25). In Kshemarâja’s terms, the strand of beads that Bhairava holds refers to hispulsating nature that maintains the world through emission and reabsorption by opening and closing the sensoryorifices (BAS 34). The trident refers to the triadic divinities, Parâ, Parâparâ, and Aparâ, who comprise thefundamental nature of Bhairava (BAS 26). The bolt, with six spokes, demonstrates the all-pervasive, divinenature that permeates the three different modes of awareness in the form of subject, object, and cognition(BAS 27). Other weapons, such as the stick that Bhairava wields, demonstrate his control over the world(BAS 28), while the club and axe signify the power that shatters difference (BAS 29). By holding a citron(bîjapûra), Bhairava identifies consciousness as the seminal nature of the cognized world (BAS 33).

46 Journal of Indian Research
Bhairava wears severed hands and bones smeared with blood, demonstrating that the world is nonethelesspure, because even the most impure elements are fundamentally of the nature of Brahman (BAS 35).Bhairava’s nudity, along these lines, stands for his eternally free nature that never undergoes suffering causedby limitation (BAS 38). The dark-blue color of Bhairava’s body refers to his all-reabsorbing nature (BAS 39),dissolving all light and manifestation into his deep hue. Bhairava’s third eye shows that those who are mergedwithin the bliss of self-awareness perceive that the pleasure obtained through sensory objects is futile, asexternal objects are momentary, like bubbles on the surface (BAS 36). In Kshemarâja’s cosmology, Bhairava’simage itself is ‘the seal,’ an unmistakable symbol that grants the bliss of self-awareness and liberates theaspirant from the notion of difference that is rooted in the world (BAS 44-45).
Kshemarâja concludes the BAS by highlighting that this visualization results in self-realization even whensenses are engaged with their particular objects (BAS 47). The purpose of this hymn is thus to experience thisshimmering self-awareness even when difference appears in terms of cognized objects and instances ofmental modification (BAS 48). Following this depiction, Bhairava realization is the most exalted Tantricexperience, as it embraces the world while experiencing non-duality.
Visualization of Bhairava is thus a means to recognize the self that in essence is awareness itself. Encounteringan image, along these lines, is in itself the liberating experience where what is seen and the perceiver becomeone. Since Bhairava is identical to his manifestation, the world, being in the world becomes a metaphor for thedivine presence. The hymns of BAS are thus the image of Bhairava. The words describe an image and theimage is deciphered through language. The speech, found in the form of prayer, culminates in deciphering thedivine image or that which is real, and thus is able to touch upon reality and not merely the mental constructs.In the non-dual gaze of Bhairava, the manifest world in terms of language and meaning depicts two modes ofthe same awareness assuming embodiment.
What is the significance of the image of Bhairava? The above description has portrayed Bhairava as theessence of Trika doctrine, an embodiment of self-realization. However, if we dissociate the philosophicalfoundations of Kshemarâja, is there an independent meaning to the image? This is a thorny question andrequires a different treatment, as the question requires further clarification of ‘meaning.’ One truism can beasserted, that any conscious act generates and embodies meaning. Things perceived in the background, apassive perception, may not have any meaning associated with it, but the moment we bring an entity to ourawareness, we constitute meaning. Kcemarâja consciously utilizes this meaning-making aspect of consciousnessfor transforming his vision towards the world, the divine, and the self.
The objective of this visualization, as summed up by Muller-Ortega (2002) is ‘becoming Bhairava.’ Whilebeing aware of the body and the cosmos and thus retaining the gesture identified as Bhairavî, the aspirantseeks to find his self-awareness as merged within the cosmic experience of Bhairava. Bringing an image tomind, or the ritual of visualization, thus culminates in transforming experience, where the subject shifts thenotion regarding the self from a bound and suffering individual to the one at the center of the wheel of shaktis,simultaneously transcendent and immanent, enjoying the worldly presence while retaining awareness of theabsolute. Kshemarâja’s approach of deciphering the imagery is merely one step towards retaining this experience.

Volume 1, No.1, January-March, 2013 47
BHAIRAVÂNUKARANASTAVA7: HYMNS IN IMITATION OF BHAIRAVA
Salutations to Bhairava of the nature of consciousness
1
Manifesting [the highest wisdom] to those filled with devotion [with the instruction], “Those of you takingrefuge in the foundation of consciousness! Rest on the glory of consciousness [and] do not wander in vain;”victorious is Shiva, skilled in bestowing grace.
2
I bow to Shiva, the supreme Bhairava of the character of consciousness, solitary, of the form of supremenectar, radiant, [and] who has devoured the entire [existence] with the realm of senses streaming out [to theircorresponding objects].
3
There exists nothing here that is distinguished as the [deity] that is prayed, the subject that prays, and theprayer. In whichever form one mentally touches, this [Bhairava-awareness] manifests in that form, since [it is]of the form of awareness [itself].
4
Lord, I bow your image that is in imitation of your true nature of the form of bliss and the [formless] void ofconsciousness, which, although the essence of all differences, in truth, is devoid of all differences.
5
Supreme self! [Just] as a sketch of a person suggests [the real] person, [and] the lines indicating alphabetsidentify the real phonemes, in the same way, the image manifests you having innumerable forms.
6
The supreme reality is not at all the object of imagination. We experience whatever [we do] having enteredyour essential nature of consciousness that is devoid of mental constructions.
7-8
I extol the supreme lord while experiencing my very self, the mass of consciousness alone, with the collectionof ties dissolved by assuming the effulgence of the self as the goddess of speech [Sarasvati] and havingworshipped [her] by assuming the objects [of experience] as the flowers [to offer], having bowed to thepreceptor, the first flash [of awareness], [and] having entered the heart.
9

48 Journal of Indian Research
The omnipresent one! Victorious are [your] powers called awareness, bliss, will, cognition, and action [thatare] distinguished as the heads of Brahmâ, having assumed the faces with the distinction of subtle and gross[forms].
10
Lord! The heart [and so forth] that corresponds to omnipresence and so forth are your six limbs. Since all[entities] up to Sadâshiva are of the character of the dead [or within the realm of death, and so constitute]your seat.
11
Lord! The goddess Parâ is the power of reflection [of the self] that has the body of the supreme light [orconsciousness]. All the goddesses such as Brâhmî are the emanations of herself.
12
By carrying fire and water, or [by] the flow of nectar and poison, you instruct that, although the world is[comprised of] conflicting [natures], this world (etat) does not conflict in me, [being] of the nature of being andconsciousness [alone].
13
Lord! You as if show us by wearing the rosary of hands and heads that this mass of cognizing subjectsthreaded into awareness is devoid of essence [in itself].
14
You appear to be telling us, by the gesture of wearing entrails, that ‘look, look, I have removed these bonds(pâsha) which are hard to break.
15
Lord! By carrying an elephant hide covered with blood on your head, you tell [us] that the garment of illusionaccompanied with passion [and other emotions] is expelled from the supreme void [of consciousness].
16
By the sword, you demonstrate the inner sword of power, which cuts [the illusion of] creation. Victorious arethose who have embraced the entire world by the glory of one’s own power.
17
Our lord! In displaying the shield making sound striking on the arms, you instruct [us] that “fear not, I am yourassistance, I am the destroyer of the fear of transmigration (bhava).”
18
In carrying a rope, you who subdue even death or time (kâlakâla), show us that time or death (kâla) that issurrounded by the bondage of its own powers is constrained by you with your body of [pure] consciousness.
19
By carrying a hook, our supreme Bhairava reveals that He dispels with His own powers all of this comprisedof distinctions in order to dissolve them [in the essential nature of the self].

Volume 1, No.1, January-March, 2013 49
20
[You suggest] by displaying an arrow taut within the bow that you with your [infinite] power slay the creatorbeasts, Brahmâ, Vishnu, Rudra, Ishvara, and Sadâshiva.
21
With [your] hand [displaying the gesture] of boons, you play the role of bestowing prosperity on the world.One abiding in the supreme reality cannot be touched by the defilements of coming into being [birth].
22
Your hand [gesture] of fearlessness constantly displays your nature of showering [grace] upon the world byhaving obliterated the fear of coming into being.
23
In clutching a head that signifies illusion, you show that this head [referring to limited Pramâtra] here is afragmented part of illusion, uneven and of the character of not revealing the real nature (akhyâti) [that iscarried by] supreme realization.
24
With the stance of wielding the skull staff, you declare that the sustenance of the world whose entire essencehas been dissolved is within you, the mass of consciousness alone.
25
In playing a lute, bell, and a loud drum, you show that you are resting [while] listening to the sound divided intothree distinct forms of mental modifications (vrtti) [of the forms of waking, dreaming, and dreamless states].
26
Moreover, by the external gesture of carrying a trident, you constantly imitate the supreme Shakti [who is]decorated [with a wheel] with the spokes comprised of three Shaktis including Parâ.
27
You hold your own supreme power comprised of the bolt that has six spokes [or aspects] that has the lowerthree objects of senses manifest by [three energies] beginning with will which are the powers of the self.
28
Our Bhairava of the nature of awareness! You demonstrate by wielding a stick that the entire sustenance ofthe whole world rests within the control of your power.
29
Lord! You demonstrate your orientation towards shattering difference by carrying a hammer and axe thatimitate the drop (bindu) and sound (nâda).
30
Lord! While assuming different forms [to accommodate] differences in [people’s] viewpoints, you manifestyour abode of the nature of Bhairava comprised of supreme awareness in all [of these forms].

50 Journal of Indian Research
31
In holding the human skull cup filled with blood, you suggest in my heart that you as if always drink theessences [of the world] found in the middle of the cosmic Shakti-egg.
32
Mahâkâla! You carry the lotus [upside down by its stalk] like a heads [held] by its tuft [of hair], demonstratingas if [it is] the materialized bondage [of mâyâ and karma] accompanied by the limited ego [Anava mala] thathave been eradicated.
33
Lord! Ocean of awareness! You demonstrate the seminal form of the entire world in its primordial [state] bythe gesture of holding citron fruit with your hand.
34
Although you are of ferocious [Bhairava] form, you nonetheless carry counting beads. With this (tat), youchange the entire world by engaging all the senses outwards.
35
Lord! By wearing bones and the rosary made of hands and heads, and shining with the human blood, youinstruct that the world is pure because it is of the nature of Brahman.
36
You instruct by opening wide (prath) the eye on your forehead of the nature of fire that incinerates the lord ofdesire that, for those who are enjoying [their] own [limited] self, although the bubbles of these objects areuneven, nonetheless, are of no significance.
37
As you always have your attention fixed within, even when the senses are spread out, you demonstrate thatyour self-nature is of the character of awareness, free from afflictions (moha) and limiting adjuncts (kalâ) inall the states.
38
Lord! Your [acceptance of] the sky as raiment speaks of the nature of the self, free from limitations. Howcould the rays of supreme Brahman be veiled by illusion?
39
You demonstrate by the body of the hue of the cloudless autumn sky that you, the dark foundation, are thedestroyer of all [celestial bodies] such as the sun.
40
Lord! As you are of the nature of supreme Brahman but still assume the form of Bhairava, you demonstratethat one who knows the reality is liberated even when there is difference.
41
Having been surrounded by the goblins in the circle of cremation grounds, you demonstrate that you are theBhairava of the nature of consciousness, abiding at the center of consciousness streaming towards objects.
42

Volume 1, No.1, January-March, 2013 51
Lord! You are endowed with the flow of nectar of the form of supreme power, [and] you are the highestamong the cognizing selves (pramâtra), and so you appear in our heart that you are the life of the [entire]world.
43
Bhairava! There are external [circles of] family in every group of eight [phonemes] of your body comprised ofthe mass of phonemes, with an initial Lokeœvara following the distinction of the transcendent, subtle, and[gross] forms.
44-45
Lord! Your image is considered the seal for the reasons that [1] it affirms all the visible world (etat) bytranscending the entire forms, [2] it delights the circle of devotees having bliss as their abode (gati), [3] itliberates from the net of bondage and dissolves differences, and [4] seals the wealth of gold in the form ofvarious modes of consciousness.
46
Victorious is this [image of yours (mûrtti)] that is the lower ground for the stage of the supreme reality. Letthis [image of yours] purify the defilements of the heart by vividly manifesting the reality.
47
Supreme Lord! The entire world manifests underneath within the consciousness that arises in every moment.Those engaged in the [inner] sacrifice realize that [this entire manifestation is] of the essence of the glory ofShiva and Shakti.
48
Bhairava, of the nature of consciousness! The self of all the beings! You always appear to me in this way.[And due to this,] all [the rituals starting from] your worship to the recitation of the mantras has beenaccomplished without any effort.
Thus completes the hymns in imitation of Bhairava composed by Mahâmaheshvara Kshemarâja.
Notes:1 I am thankful to Dr. Phyllis Granoff, Dr. Jürgen Hanneder, and Mrs. Mary Hicks for
reading the earlier drafts, and Mr. Jason Schwartz for the library support2 For the gradual stages of self-realization in Svacchandatantra, see Goudriaan 1992, 139-1743 The Bhairavânukaranastava of Kshemarâja. See Gnoli 1957.4 The most extensive study update on Bhairava is the analytical translation of the Manthânabhairavatantra(Dyczkowski 2009). For studies on Bhairava, see Pandey 1963; White 1996; Muller-Ortega in Harper andBrown 2002, 213-230; Chalier-Visuvalingam in Hiltebeitel 1989, 157-229.
A small treatise in ten verses by Abhinavagupta, Bhairavastava, (see Pandey 1963, 951-52) is anothernoteworthy text in understanding the significance of Bhairava in the Trika lineage of Abhinavagupta-Kcemarâja.5 For instance, see his commentaries on Svacchandatantra and Vijñânabhairavatantra.

52 Journal of Indian Research
6 Kshemarâja also authored texts entirely dedicated to the philosophical system of pratyabhijñâ, such as thePratyabhijñâh[daya.7 This translation relies on Gnoli’s (1958) reading of the manuscript, except as indicated
in the footnotes.8 Gnoli has read the text as, ‘mâyâ mundam.’9 I have read âkriti instead of ârhiti.
References:
Dyczkowski, Mark. (2009). Manthânabhairavatantram: New Delhi: Indira Gandhi National Center for theArts.
Gnoli, Raniero. [ed.] (1958). “Bhairavânukaranastava,” ‘Miscellanea Indica,’ East and West 9, 215–226.
Harper, Katherine and Robert Brown. 2002. The Roots of Tantra. Albany: State University of New YorkPress.
Hiltebitel, Alf. 1989. Criminal Gods and Demon Devotees: Essays on the Guardians of Popular Hinduism.Albany: State University of New York Press.
Pandey, K.C. 1963. Abhinavagupta: An Historical and Philosophical Study. Varanasi: ChowkhambaSanskrit Series Office.
White, David Gordon. 1996. The Alchemical Body: Siddha Traditions in Medieval India. Chicago: TheUniversity of Chicago Press

Volume 1, No.1, January-March, 2013 53
Journal of Indian Research, Volume 1 No. 1, 2013, 53-58
Economics
BASEL-3 AND ITS IMPACT ON INDIAN BANKING SECTOR
Ms Mamta Shah*
ABSTRACT
Indian banking industry is considered as a blooming and sustainable sector in the global financialsystem. This paper deals with the banking sector reforms in India and the ways designed to manage the risks associated with huge banking sector. An evaluation of Basel Norms and their impact on economicgrowth of the country has been done pursuant to the globalization of the industry. Emergence ofBASEl-3 and its impact on banking in India has been explored. Since economic reforms of 1991,most of the traditional and outdated concepts, practices, procedures and methods of banking havesignificantly changed. Competition among financial intermediaries has gradually helped the interestrates to decline significantly. Deregulation has been achieved. The real interest rate has been effectively maintained at moderate rate. The borrowers did not pay high price while depositors had incentives tosave. Such condition are atypical of bank failure, if not properly managed. The banks had toformulate strategies to manage their risk by proper provisioning. The introduction of Basel- Norms isone of the various initiatives towards that objective. Reforms in the financial and the banking sectorshave enabled better financial products. This has allowed financial viability of the banks and help toboost the economic growth.
Keywords: Banking Sector, Reforms, Economy, Inflation, Growth, BASEL, Risk-weighted assets, commonequity, Liquidity Coverage Ratio (LCR) and Net Stable Funding Ratio (NSFR)
Introduction- Indian banking sector has undergone major changes and reforms during economic reforms.Though it was a part of overall economic reforms, it has changed the very functioning of Indian banks. Thisreform has not only influenced the productivity and efficiency of many of the Indian Banks, but has lefteverlasting footprints on the working of the banking sector in India. The efficient, dynamic and effectivebanking sector plays a decisive role in accelerating the rate of economic growth in any economy. TheGovernment of India introduced economic and financial sector reforms in 1991 and banking sector reformswere part and parcel of financial sector reforms. These were initiated in 1991 to make Indian banking sectormore efficient, strong and dynamic. Almost 80% of the business are still controlled by Public Sector Banks(PSBs). PSBs are still dominating the commercial banking system. Shares of the leading PSBs are listed onthe stock exchanges. The RBI has given licenses to new private sector banks as part of the liberalisationprocess. The RBI has also been granting licenses to industrial houses. Many banks are successfully running inthe retail and consumer segments but are yet to deliver services to industrial finance, retail trade, smallbusiness and agricultural finance
The PSBs will play an important role in the industry due to its number of branches and foreign banks facingthe constraint of limited number of branches. Hence, in order to achieve an efficient banking system, the onusis on the Government to encourage the PSBs to be run on professional lines. This chapter focuses on India’sbanking sector, which has been attracting increasing attention since 1991 when a financial reform programmewas launched. It assesses whether the reform programme has been successful so far in restructuring public-sector banks.
* Ms. Mamta Shah is Research Scholar of Mewar University and Faculty at GNIM , Punjabi Bagh, New Delhi

54 Journal of Indian Research
Role of BASEL-The objective of the Basel Committee’s reform package is to improve the banking sector’sability to absorb shocks arising from financial and economic stress, whatever the source, thus reducing the riskof spillover from the financial sector to the real economy. A strong and resilient banking system is thefoundation for sustainable economic growth, as banks are at the centre of the credit intermediation processbetween savers and investors. Moreover, banks provide critical services to consumers, small and medium-sized enterprises, large corporate firms and governments who rely on them to conduct their daily business,both at a domestic and international level. To address the market failures revealed by the crisis, the BASELCommittee is introducing a number of fundamental reforms to the international regulatory framework. Thereforms strengthen bank-level, or micro prudential, regulation, which will help raise the resilience of individualbanking institutions during periods of stress. The reforms also have a macro prudential focus, addressingsystem wide risks that can build up across the banking sector as well as the procyclical amplification of theserisks over time. Clearly these two micro and macroprudential approaches to supervision are interrelated, asgreater resilience at the individual bank level reduces the risk of system wide shocks.
About BASEL Norms - The Basel Committee on Banking Supervision provides a forum for regular cooperationon banking supervisory matters. Its objective is to enhance understanding of key supervisory issues andimprove the quality of banking supervision worldwide. It seeks to do so by exchanging information on nationalsupervisory issues, approaches and techniques, with a view to promoting common understanding. The Committee’sSecretariat is located at the Bank for International Settlements (BIS) in Basel, Switzerland. The committeedrafted a first document to set up an international ‘minimum’ amount of capital that banks should hold. Thisminimum is a percentage of the total capital of a bank, which is also called the minimum risk-based capitaladequacy. In 1988, the Basel I Capital Accord (agreement) was created. In 1988, BCBS(Basel committee forBanking Supervision) introduced capital measurement system called Basel capital accord, also called asBasel 1. Basel I define capital based on two tiers:
Tier 1 (Core Capital): Tier 1 capital includes stock issues (or share holders equity) and declared reserves,such as loan loss reserves set aside to cushion future losses or for smoothing out income variations. It focusedalmost entirely on credit risk.
Tier 2 (Supplementary Capital): Tier 2 capital includes all other capital such as gains on investment assets,long-term debt with maturity greater than five years and hidden reserves (i.e. excess allowance for losses onloans and leases). However, short-term unsecured debts (or debts without guarantees), are not included in thedefinition of capital.
BASEL-1, defined capital and structure of risk weights for banks. The minimum capital requirement wasfixed at 8% of risk weighted assets (RWA). RWA means assets with different risk profiles. A portfolioapproach was taken to the measure of risk, with assets classified into four buckets (0%, 20%, 50% and 100%)according to the debtor category. For example, an asset backed by collateral would carry lesser risks ascompared to personal loans, which have no collateral. India adopted Basel 1 guidelines in the year 1999.
BASEL-1was the first international instrument assessing the importance of risk in relation to capital andproved to be a milestone in the finance and banking history. Some loopholes continued to prey upon the risk-sensitive sector. Fixation of 8% capital ratio to protect banks from credit risk was recommended. But, norecognition was given to risk associated with maturity of credit, risk associated with different currencies andmacroeconomics risk. Due to these limitations BASEL Committee decided to propose a more risk-sensitiveframework in June, 1999 which was signed as BASEL-II accord.

Volume 1, No.1, January-March, 2013 55
BASEL-II- The objective of BASEl-II was to “promote safety and soundness in the financial system; enhance competitive equality; constitute a more comprehensive approach to addressing risks; and todevelop approaches to capital adequacy that are appropriately sensitive to the degree of risk involvedin a banks’ positions and activities”. The Basel II capital accord is a three-pillared framework consisting of Minimum Capital Requirement, Supervisory Review Process and Market Discipline. Minimum CapitalRequirement is based upon certain calculations at which minimum capital requirement has to be maintained. Under the Supervisory Review Process, the Central Bank (RBI in India) of the concerned country has toensure that each bank has an adequate capital to adopt better management techniques. The Market Disciplinemandates strict disclosure on risk management practices with transparency.
Basel II provides three approaches of increasing sophistication to the calculation of credit risk capital:- theStandardised Approach (SA), the Foundation Internal Ratings Based Approach(FIRBA) and the AdvancedInternal Ratings Based Approach (AIRB). Basel II also introduced capital requirements for operational risk(OR) for the first time.
Implementation in India- The process of implementing Basel II norms in India was planned to be carriedout in phases. Phase I was for foreign banks operating in India and Indian banks having operational presenceoutside India with effect from March 31,2008. In phase II, all other scheduled commercial banks (exceptLocal Area Banks and RRBs) were to adhere to Basel II guidelines by March 31, 2009. With the deadline ofMarch 31, 2009 for full implementation of Basel II norms fast approaching, banks are looking to maintain acushion in their respective capital reserves. The minimum capital to risk-weighted asset ratio (CRAR) in Indiawas placed at 9%, one percentage point above the Basel II requirement. All the banks have their Capital toRisk Weighted Assets Ratio (CRAR) above the stipulated requirement of Basel guidelines (8%) and RBIguidelines (9%). As per Basel II norms, Indian banks should maintain tier I capital of at least 6%.
The hurdles which were faced by India for implementation of BASEL-II were that first of all, there is a needfor improved risk management and measurement. It aims to give impetus to the use of internal rating systemby the international banks. Second requirement is to arrange risk capital requirement by the banks. Also, BaselII gives some scope to extend the rating of issues to issuers, this would only be an approximation and it wouldbe necessary for the system to move to ratings of issuers. Encouraging ratings of issuers would be achallenge.
But, the accelerating financial globalization made it necessary to evolve new strategies to reduce financialrisks associated with the banking sectors.
BASEL-III- Basel III released in December, 2010 is the third in the series of Basel Accords. Basel III is acomprehensive set of reform measures, developed by the Basel Committee on Banking Supervision, tostrengthen the regulation, supervision and risk management of the banking sector. Its aim is to improve thebanking sector’s ability to absorb shocks arising from financial and economic stress, improve risk managementand governance, strengthen banks’ transparency and disclosures.
The Basel III which is to be implemented by banks in India as per the guidelines issued by RBI from time totime, will be challenging task not only for the banks but also for GOI. It is estimated that Indian banks will berequired to raise Rs 6,00,000 crores in external capital in next nine years or so i.e. by 2020. Basel III is acomprehensive set of reform measures, developed by the Basel Committee on Banking Supervision tostrengthen the “regulation, supervision and risk management of the banking sector”. These measures aim toimprove the banking sector’s ability to absorb shocks arising from financial and economic stress, whatever thesource improve risk management and governance strengthen banks’ transparency and disclosures.

56 Journal of Indian Research
Features of BASL-III The features of BASEL-III, which make it more stringent than BASEL-I and II areas follows.
1. Basel III aims to introduce much stricter definition of capital. Better quality capital means the higherloss-absorbing capacity. This in turn will mean that banks will be stronger, allowing them to betterwithstand periods of stress.
2. By introduction of Basel III ,banks will be required to hold a capital conservation buffer of 2.5%. The aimof asking to build conservation buffer is to ensure that banks maintain a cushion of capital that can be usedto absorb losses during periods of financial and economic stress.
3. The countercyclical buffer has been introduced with the objective to increase capital requirements in goodtimes and decrease the same in bad times. The buffer will slow banking activity when it overheats andwill encourage lending when times are tough i.e. in bad times. The buffer will range from 0% to 2.5%,consisting of common equity or other fully loss-absorbing capital.
4. The minimum requirement for common equity, the highest form of loss-absorbing capital, has been raisedunder Basel III from 2% to 4.5% of total risk-weighted assets. The overall Tier 1 capital requirement,consisting of not only common equity but also other qualifying financial instruments, will also increase fromthe current minimum of 4% to 6%. Although the minimum total capital requirement will remain at thecurrent 8% level, yet the required total capital will increase to 10.5% when combined with the conservationbuffer.
5. Under Basel III, a framework for liquidity risk management will be created. A new Liquidity CoverageRatio (LCR) and Net Stable Funding Ratio (NSFR) are to be introduced in 2015 and 2018, respectively.
Comparison of Basel-II and Basel-III
Requirements Under Basel II Under Basel III
Minimum Ratio of Total Capital To RWAs 8% 10.50%
Minimum Ratio of Common Equity to RWAs 2% 4.50% to 7.00%
Tier I capital to RWAs 4% 6.00%
Core Tier I capital to RWAs 2% 5.00%
Capital Conservation Buffers to RWAs None 2.50%
Leverage Ratio None 3.00%
Countercyclical Buffer None 0% to 2.50%
Minimum Liquidity Coverage Ratio None TBD1 (2015)
Minimum Net Stable Funding Ratio None TBD1 (2018)
Systemically important Financial Institutions Charge None TBD1 (2011)
(TBD-To be Determined)1
Literature Review- Several previous studies describe the reform effort and the inefficiency of the banks.IMF (2004 and 2005) provides an overview of the most recent reforms and Barnett (2004) reviews thestructure and recent developments in the banking sector. For a review of previous banking system reforms,since the mid-1990s, (Karacadag ,2003). Strengthening financial systems has been one of the central issuesfacing emerging markets and developing economies. This is because sound financial systems serve as an

Volume 1, No.1, January-March, 2013 57
important channel for achieving economic growth through the mobilization of financial savings, putting them toproductive use and transforming various risks (Beck, Levin and Loayza 1999; King and Levin 1993; Rajanand Zingales 1998; Demirgüç-Kunt, Asli and Maksimovic 1998; Jayaratne and Strahan 1996). Manycountries including India adopted a series of financial sector liberalization measures in the late 1980s and early1990s that included interest rate liberalization, entry deregulations, reduction of reserve requirements andremoval of credit allocation. It has been argued by a number of economists that a well-developed financialsystem enables smooth flow of savings and investments and hence, supports economic growth (King andLevine, 1993, Goldsmith, 1969). A healthy financial system can help achieve efficient allocation of resourcesacross time and space by reducing inefficiencies arising out of market frictions and other socio-economicfactors.
Analysis of BASEL-III in Indian Context- Presently, a bank’s capital comprises Tier 1 and Tier 2 capitalwith a restriction that Tier 2 capital cannot be more than 100% of Tier 1 capital. Within Tier 1 capital,innovative instruments are limited to 15% of Tier 1 capital. Further, Perpetual Non-Cumulative Preference Shares along with Innovative Tier 1 instruments should not exceed 40% of total Tier 1 capital at any point oftime. Within Tier 2 capital, subordinated debt is limited to a maximum of 50% of Tier 1 capital. However, underBasel III, with a view to improving the quality of capital, the Tier 1 capital will predominantly consist ofCommon Equity. At present, the regulatory adjustments (i.e. deductions and prudential filters) to capital varyacross jurisdictions. A revised version of this document was issued in June 2011, generally applied to total Tier1 capital or to a combination of Tier 1 and Tier 2 capital. They are not generally applied to the Common Equitycomponent of Tier 1 capital. With a view to improving the quality of Common Equity and also consistency ofregulatory adjustments across jurisdictions, most of the adjustments under Basel III will be made fromCommon Equity. The qualifying criteria for instruments to be included in Additional Tier 1 capital outside theCommon Equity element as well as Tier 2 capital will be strengthened. This requirement will improve themarket discipline under Pillar 3 of the Basel II framework. The minimum Common Equity, Tier 1 and TotalCapital requirements will be phased-in between January 1, 2013 and January 1, 2015, as indicated below:
As a percentage of risk weighted January 1,2013 January 1,2014 January 1,2015assets(RWA)
Minimum Common equity Tier-1 Capital 3.5% 4% 4.5%
Minimum Tier-1 Capital 4.5% 5.5% 6%
Minimum total Tier-1 Capital 8% 8% 8%
Recently RBI Governor, D. Subbarao declared that “Implementation of Basel III is expected to result in adecline in Indian banks’ ROE [return on equity] in the short term,” .The global Basel III requirements,which require all banks to hold top quality capital equal to 7 per cent of their assets, adjusted for risk, areaimed at improving financial stability and avoiding a repeat of the American crisis of 2008. But the sharplyhigher capital requirements have drawn warnings from analysts and financiers about their impact on bankinglending rates and wider economic growth across the developing world.
Conclusion- By implementation of the Basel III norms, the capital of many banks will reduce by around60% because of the phased removal of certain components of capital from Tier 1. In addition, the riskweightings are expected to grow by nearly 200%. The twin impact of these two stipulations will greatly reducethe ROE and the profitability of banks. The proposed shift from short-term to long-term liquidity will increasethe cost of funds for the banking system. This will further squeeze the banks’ profit margins. One of the basictenets of prudent banking is to borrow long and lend short. There must be a match between the duration of

58 Journal of Indian Research
liabilities and the duration of assets, which is at the heart of asset-liability management. Long duration assetswere acquired with short duration funding. However, it is a known fact that illiquid banks will soon becomeinsolvent.
The leverage ratio of Indian banks is moderate, and hence, not a cause for concern. However, with capitaldilution, increased risk weightings and ceilings on derivative trading, the new leverage ratio will impact thelending capability of the banks. As India is a developing economy, the shrinkage of bank credit can set inrecessionary trends. Further, the developmental agenda of the Indian banks will take a backseat in such asituation. While systemic stability is welcome, it cannot be at the cost of the larger economic goals of povertyalleviation, employment generation, priority sector lending and balanced regional growth.
Therefore, it is opined that the new regime of prudential regulations will result in greater stability of thebanking industry in various countries. Exercising controls on the capital, liquidity and leveraging of banks willensure that they have the ability to withstand crises.
References:
• Asian Policy Forum, 2000. Policy Recommendations for Preventing Another Capital Account Crisis.
• Barth, James, Gerard Caprio and Ross Levine, 2001a. ”Banking systems around the globe:Do regulationand ownership affect performance and stability”? Forthcoming in Frederic Mishkin, ed., PrudentialRegulation and Supervision: Why it is Important and What are the Issues (Cambridge, Mass., NationalBureau of Economic Research).
• Santos, Joao A.C., 1998. ”Commercial banks in the securities business: a review”, Bank for InternationalSettlements Working Papers No. 56.
• Chaitanya, V Krishna (2004). Causes of Non-performing Assets in Public Sector Banks. Economic Research, 17 (1): 16-30.
• Chakravarty, S (1985). Report of the Committee to Review the Working of the Monetary System.Mumbai: Reserve Bank of India.
• Das ,Abhiman (2002). Risk and Productivity Change of Public Sector Banks. Economic and Political Weekly, 37 (5): 437-48.

Volume 1, No.1, January-March, 2013 59
Journal of Indian Research, Volume 1 No. 1, 2013, 59-68
Management
INTERNAL MARKETING PRACTICES IN PUBLISHING INDUSTRIES: A CASE STUDYOF SARASWATI HOUSE PVT. LTD.
Mukta Gupta*, Dr. Lokesh Jindal**
ABSTRACT
Internal Marketing (IM) is a new and emerging discipline. It is meant to align, motivate and empoweremployees at all functions and levels to consistently deliver positive customer experiences that arealigned with firm’s organizational goals. This paper discusses findings from an exploratory studyconcerning internal marketing in the publishing industry. This study demonstrates to what extent non-monetary incentives are utilized in the public sector and applies the principle to study the impact ofsuch non-monetary incentives in the Saraswati House Pvt. Ltd . The study also focuses on gender-wiseeffect of non-monetary benefits.
Keywords: internal marketing, monetary benefits, non-monetary benefits, motivation,gender
INTRODUCTION
Internal marketing is all about the relationship an employer forms with its employees. It is said that staffshould be seen as internal customers and their needs should be met, as well as external customers. Part ofinternal marketing pertains to communication and making sure the staff share the overall vision and goals ofthe firm or similar systems like the intranet and staff newsletters aid in sharing these common values.
The concept of Internal Marketing originally emerged from the services marketing Literature (Berry andParasuraman, 1992). As consumers, we use service every day. Turning on a light, listening to the radio,talking on the telephone, taking a bus, getting haircut are all examples of service consumption at the individuallevel. Unfortunately consumers are not always happy with the quality and value of the service they receive.
Suppliers of services, who often face stiff competition, sometimes appear to have a very different set ofconcerns, many owners and managers complain about how difficult it is to make a profit, to find skilled andmotivated employees or to please customers.
Fortunately, some suppliers know how to please their customers while also running a productive, profitableoperation, staffed by pleasant and competitive employees.
Service Marketing involves 3 types of marketing (Fig.1):a. External Marketing: “Setting the promise”, marketing to end-users.b. Internal Marketing: “Enabling the promise”, marketing to employees, Involves training, motivational and
teamwork. Programs and all communication with employees. Performed to enable employees to performthe service. Effectively and keep up the promise made to the customer.
c. Interactive Marketing: Moment of Truth, Service Encounter
*Mukta Gupta is Research Scholar, Mewar University** Dr. Lokesh Jindal is Associate Professor in Maharaja Agrasen Institute of Technology,GGSIP University

60 Journal of Indian Research
Fig.1 Service Marketing
1. INTERNAL MARKETING
Internal marketing (IM) is a process that occurs within a company or organization whereby the functionalprocess aligns, motivates and empowers employees at all management levels to deliver a satisfying customerexperience. Over recent years internal marketing has increasingly been integrated with employer branding andemployer brand management which strives to build stronger links between the employee brand experience andcustomer brand experience.
According to Burkett and Zealley, “the challenge for internal marketing is not only to get the rightmessages across, but to embed them in such a way that they both change and reinforce employeebehavior”.
A growing body of research amply demonstrates there is a link between internal marketing and profitability.The 2006 Internal Marketing Best Practices study identified the six key characteristics that drive successfulinternal marketing programs. Conducted by graduate students of the Integrated Marketing Communicationsdepartment at Northwestern University, the study shed light on strategies and tactics that align motivate andempower employees — at all functions and levels — to consistently deliver a company’s “brand promise,”which, in turn, helps businesses reach their goals.
The six common characteristics of highly effective internal marketing programs are: (1) senior managementparticipation, (2) integrated organizational structure, (3) strategic marketing approach, (4) human resourcespartnership, (5) focus on employee engagement and (6) internal brand communication.
Internal marketing is inward facing marketing. Internal marketing is used by marketers to motivate allfunctions to satisfy customers. With internal marketing, the marketer is really extending and developing thefoundations of marketing such as the marketing concept , the exchange process and customer to internalcustomers.
Internal customers would be anybody involved in delivering value to the final customer. This will includeinternal functions within business with which marketing people interact including research and development,production/operations/Logistics, human resources, IT and customer services. A BNET Editorial raises theissue emphatically:
“Why is internal marketing important? Although external marketing remains the most important businessdevelopment task, it is essential to sell inwardly toward a company’s people. When employees understand

Volume 1, No.1, January-March, 2013 61
and commit to the value proposition of the company and its brands, external marketing becomes moreeffective, because the employees become product champions.”
Key concepts of internal marketing include:
• Internal Marketing functioning as a continual internal “up skilling process”.
• Alignment of the organization’s purpose with employee behavior.
• Motivation, reframing, empowerment of employee attitude.
• Employees, reframing and empowerment of employee attitude.
• Inside-out management approach.
Companies at the forefront of internal marketing share particular beliefs regarding the role of employees inachieving business success and improve the efficiency of the company’s employees.
Importance of Internal marketing
Internal marketing concept is increasingly being deployed world across by various firms as such practices:
• Encourages the internal market (employees) to perform better.
• Empowers employees and give them accountability and responsibility.
• Periodic evaluation of employee performance.
• Integrates business culture, structure, human resource management, vision and strategy with the employee:
Fig 2: Internal Marketing

62 Journal of Indian Research
The 2012 Workplace Benefits Report found that nine out of 10 employers believe that financial benefits —which include 401(k) plans, health savings accounts (HSA) and financial advice and education — are equallyor more important to potential hires today than five years ago, with half believing such benefits are moreimportant than ever.
Employee benefits go beyond the individual. Family benefits are important to potential employees whenchoosing where they will work. Laws such as the FMLA help individuals when it comes to being there forthemselves and their families.
Direct compensation refers to monetary benefits offered and provided to employees in return of the servicesthey provide to the organization. The monetary benefits include basic salary, house rent allowance, conveyance,leave travel allowance, medical reimbursements, special allowances, bonus, PF/Gratuity, etc. They are given ata regular interval at a definite time.
Fig 3: Direct Compensation
When recruiting employees, it’s easy to fall into the trap of thinking that money is what brings in the best andthe brightest. After all, employees tend to receive paychecks a bit beefier than other professionals with similarlevels of experience and education. But at the end of the day, it is often the non-financial rewards that attractthe top employees— and that are almost always what keeps them on staff. Here are some ways to entice andhold onto first-class employee talent. Non-monetary compensation can equal 20-60% of the value of the cashcompensation that an employee receives. For the current job seeker, starting salaries have barely increased,frozen or actually dropped. To find non-monetary benefits in an offer can be essential when an employeeevaluates it. These added perks can sweeten (and seal) the deal.
There are a host of benefits that companies can offer to attract and retain top talent. Here is a list of a fewfor employers to consider.
• On-site childcare
• Flex-time schedules
• Free or discounted parking
• Free or discounted food and drinks

Volume 1, No.1, January-March, 2013 63
• Gym membership discounts
• In-office massage or yoga
• Casual Fridays
• Mentoring programs for career advancement
• Free or discounted educational and training opportunities
• Work opportunities in multiple locations
• Cross-training in other areas of the business
• Annual or quarterly company parties
Rahul Sharma, Senior Vice President (Human resources), India Info line Ltd explains,
“Monetary rewards have very short-term benefits as opposed to non-monetary ones. Also, it’sbeen observed that employees often complain after receiving monetary gains and usually aren’tsatisfied with the benefit given. Therefore, it is better to move from monetary forms of benefits tointangible ones,”
Saraswati House Pvt. Ltd is an innovative, vibrant, creative and energetic organization where each one of theemployee strives wholeheartedly to serve students and make every learning moment a joyful, effective andmeaningful one. Their objective is to create and distribute exceptional publishing material, that’s instantlyrecognizable, with creativity and valuable information. This paper discusses findings from an exploratory studyconcerning internal marketing in the Company in order to enhance efficiency and provide motivation toemployees. The purpose of this study is to demonstrate to what extent non-monetary incentives are utilized inthe publication house and whether non-monetary incentives have the potential to increase the motivation ofemployees as much as the monetary incentives. Incentives is any means that makes an employee desire to dobetter, try harder and expand more energy. Non-monetary incentives such as participation in decision-makingverbal or written recognition of good work etc. are the kinds of incentives that do not in value direct paymentof cash.
2. LITERATURE REVIEW
A concept of Internal marketing (IM) is a new management philosophy that organizations regard itsorganization member as internal customers (Berry, 1981), as it should be internal marketing is also subject todevelopment of customer-oriented employees (Gronroos, 1985). According to Johnson, Scheuing andGaida (1986), internal marketing is to allow employees within organizations to be aware of mission, objectivesand vision of organization and to achieve the expectation of the organization through education training,incentives and performance evaluation for employees. According to Parasuraman, Berry, & Zeithaml (1991)internal marketing is attracting, developing and retaining qualified employees through job(products) that satisfystaff needs. It is also the philosophy of treating employees as customers and it is the strategy of shaping job(products) to fit human needs. Over the last years researchers began to recognize that Internal Marketingcould help an enterprise to implement its strategy. Thus, it is presented as a mechanism for reducing departmentalisolation and inter-departmental frictions as well as overcoming resistance to change.
As it emerged from the above definitions, some researchers conceive the Internal Marketing as a concept,while others as a philosophy and others as a management practice [George (1990), Wilson (1991)]. Moreover,some relate it to human resources management to service or to change management.

64 Journal of Indian Research
However, researchers agree that Internal Marketing could contribute in the improvement of quality providedfrom service business [George (1990), Berry and Parasuraman (1991),Piercy (1995)]. This justified theinitial stance of Gummesson (1987) who proposed the Internal Marketing as a solution for high quality ofservices provided to the customers in a continuous base. Greene et al, (1994) support that Internal Marketingis important to all Industries but it is even more important to services.
Some scholars suggest alternative classification of internal marketing. Bekkers and Van Maastricht (1993)identify three approaches to Internal Marketing: hierarchical exchange Process, internal supplies and exchangeprocess organization/employee. In addition Money and Foreman (1996) provide a matrix that presents fourdifferent aspects of the concept of Internal Marketing depending on who is the customer and who is themarketer:
Type 1: the marketer is a department and the customer is another department
Type 2: the marketer is the organization and the customer is the department
Type 3: the marketer is a department and the customer is the organization
Type 4: the organization is both the marketer and the customer.
This paper deals with the fourth type where the organization is both the marketer and the customer andInternal Marketing helps business to keep both markets (internal and external) satisfied.
Motivation Theories
Many theories of motivation implicitly assume that effort, while a function of many things, is positivelycorrelated with the predicted utility of the award earned for that effort. For example, expectancy theories holdthat effort exerted in pursuit of a reward is positively related to the value of the reward offered forperformance (Bandura, 1986, 1997; Porter & Lawler, 1968; Vroom, 1964). Consistent with this and manyother valence based theories of motivation, the propositions put forward in this paper will assume thatemployees exert effort to maximize their “expected utility” (Naylor, Pritchert, & Ilgen, 1980). There hasbeen extensive research in both economics and management regarding different types of incentives. Much ofthis work concerns whether the use of an extrinsic reward will reduce intrinsic motivation to perform a task(Banker, Lee, Potter, & Srinivasan, 1996; Bloom & Milkovich, 1998; Deci 1971; Deci & Ryan 1985;Deci, Koestner, & Ryan 1999; Eisenberger, Rhoades, & Cameron, 1999; Gerhart & Trevor, 1996;Jordan, 1986; Kruglanski, 1975). Research has also been done on how extrinsic rewards interact withother motivational tools such as goals (Jessup & Staehlski, 1999; London & Oldham, 1976; Tolchinsky &King1980), job design (Futrell, 1979; Gallagher & Einhorn, 1976; Kelly, 1992), and job challenge(Radhakrishnan & Ronen 1999). In addition to work on extrinsic incentives and performance, a large bodyof research exists on psychological interventions and their impact on performance (See Guzzo, 1985 for areview). Economists would claim that money is always better (or at least no worse) than any non-monetaryincentive of equal market value because cash has option value (List & Shogren, 1998; Waldfogel, 1993,1996). The economic argument continues by stating that if a firm were to choose a non-cash incentive, itcould do no better than matching exactly what a person would have chosen for himself or herself. Understandingwhy and when to use tangible non-monetary incentives is an important endeavor, since U.S. firms spent over$20 billion on tangible non-monetary incentives in 1999 (Incentive Federation, 2000). According to Nelson(2001), positive reinforcement is most effective when it is ‘directly reinforcing of the desired behavior’, ‘isimmediate’, ‘is valued’ by the individual and is ‘frequent’. Recognition is one such positive reinforce whichwhen used on the lines of reinforcement theory, increases the frequency of desired behavior.

Volume 1, No.1, January-March, 2013 65
1. Varey and Lewis (2000) indicate that internal marketing was “invented” in the 1970s, as a managerialapproach to build and inculcate service delivery competence. At the context of the manufacturing industrythe operations management as long ago as the 1950s (Ishikawa, 1985).
2. David (2003) mentioned that the internal marketing in knowledge-based era should be defined as strategyfor relationship development that organizations would like to achieve knowledge renewal on his “mediumtheory that effects internal marketing”.
3. Increasingly, organizations look for ways to improve their marketing orientation and effectiveness throughinternal marketing, which is part of the Holistic Marketing Concept (Kotler, 2008, p.10, 24; Little &Little, 2009). Some companies are focusing on marketing orientation because they want to increaseservice quality (Little & Little, 2009). Ultimately, all companies want to gain competitive advantage,which research has shown is closely linked to being marketing oriented (Schlosser & McNaughton,2007)
Kotler’s (2008) internal marketing theory, which is part of the ‘Holistic Marketing Concept’, was used asthe basis for understanding the internal marketing concept. Kotler writes:
“ Holistic marketing incorporates internal marketing, ensuring that everyone in the organizationembraces appropriate marketing principles, especially senior management. Internal marketingis the task of hiring, training, and motivating able employees who want to serve customers well. Smart marketers recognize that marketing activities within the company can be as important asor even more important than marketing activities directed outside the company. It makes nosense to promise excellent service before the company’s staff is ready to provide it “ (Kotler,2008, p.24).
Kotler’s theory on internal marketing has been broken down to look at the four components more closely (aslisted below). It has to be kept in mind while considering the mechanism of Internal Marketing that hiring,training and motivating employees could be considered as three separate components themselves, but for thepurpose of this report these have been bundled as human resources activities and looked through differentperspective. Herein is the four compnents in Kotler’s conception:
1. Hiring, training and motivating employees;
2. All marketing functions must work together and be coordinated from the customer’s point of view;
3. There must be vertical alignment with senior management and employees.
4. Horizontal alignment with other departments.
According to Mosley (2007), service-mindedness and customer-oriented behaviors focusing staff attention onthe internal activities that need to changed in order to enhance market place performance and creatingmotivated and customer-oriented. Gaunaris (2008) indicates that “marketing has an additional, internal,role that is to ensure that service employees are customer conscious and also satisfied with their job”.Mcclure (2010) mentioned that the internal marketing through improving innovative and supportive culturehave direct influence on marketing effectiveness.
Brand is the incorporation of all impressions received by consumers which will lead to a distinctive position intheir mind based on perceived emotional functional benefits (Raj and Jyothi, 2011)
3. RESEARCH METHODOLOGY
3.1 Statement of Research Problem

66 Journal of Indian Research
Whenever we look into any Publication house, the Turnover Ratio always appear very high. But SaraswatiHouse Pvt. Ltd has a low turnover . Inspite of this constraint, the employee retention period is quite prolongedwhich calls for elaborate reasons to explain seemingly peculiar circumstance.
3.2 Objectives of the present study
The present study aims to demonstrate to what extent non-monetary incentives are utilized in the publicationhouse and whether they have the potential to motivate employees as much as monetary incentives.
The term internal marketing is defined as the policy of treating employees as internal customers of theorganization, responding to employee’s needs or wants and promoting the organization and its policies to theemployees. Customer Service is one of the most crucial aspects of an organization’s competitive advantageand it is the critical element which internal marketing influences. The retention in Saraswati House Pvt. Ltd. isvery high and the turnover ratio is very low. One is required to explore and understand the perspectives ofboth the employees and the employer to understand this unique positioning. The study has been conducted toseek out the ways employer deploy to motivate his employees and make them comfortable in the company forprolonged period.
The main objective of our research is to:
• To understand employer’s perspective
• To understand employee’s perspective
• To identify best practices in the industry
• To identify reasons for employee’s satisfaction level as the retention in company is very high.
3.3 The scope of the present study:
This research has been carried out in the company related to Publication house .
3.4 MEHTODOLOGY
• Research Design
A research design is a framework or blueprint for conducting the marketing research project. ResearchDesigns may be broadly classified as exploratory or descriptive research. My Research work is descriptive innature as we are studying the current practices in company. Sample is large and representative. Data analysisis qualitative. There are 3 types of Research Design:
• Exploratory Design
• Descriptive Design
• Causal Design
My research in descriptive in nature as the research work is qualitative. As we want to know the employee’ssatisfaction level and their efficiency through monetary and non-monetary benefits given by employer and thecompany, we can get this information through the qualitative work rendered by employees in the company.
• Sample Design
There are 2 types of Sample Design:
• Probability sampling
• Non-Probability sampling

Volume 1, No.1, January-March, 2013 67
Sampling is one of the components of Research Design. A Sampling Frame is a representation of the elementof the target population. We have used probability Sampling as the population is finite.
• Sample Technique
My research is based on Stratified Random Sampling because we are covering the hierarchy in the organization.The Sample Size is 80.
Data collection strategy:
Primary: We will be using Survey Method through questionnaire
Secondary: Journals, Books, E-journals: DELNET, EBSCO
3.5 Limitations of the present study:
We are limiting ourselves to only Delhi branch (NCT) of the company. The employees surveyed in the studycompleted the questionnaire accurately and honestly. In order to get the reliable information regarding theefficiency in internal marketing interview schedule of survey method is being used as a main tool of study. Thequestionnaire is framed which would clearly indicate their meaning to the respondents, relevant to the objectivesof the study.
4. FINDINGS AND RESULTS
The research incorporated interactive variables between non-monetary benefits and major occupation level ofthe employee. Satisfactory working conditions are associated with a slightly improvement in productivity inthree occupation level: senior officials and managers; middle level professions; technicians and elementaryoccupation level (bottom most). These findings are consistent with several possible interpretations. First,satisfactory non-monetary benefits may be associated with an improvement in productivity among workers inthe three occupations mentioned.
Second, employers may selectively guarantee better non-monetary working conditions to their more productiveemployees in those occupations. Third, the association between productivity and non-monetary workingconditions may be positive across all occupations.
For the sample of men (Sample size = 47), the table exhibits significantly variable values of coefficients (in thescale of 1-5 indicating 1 for “strongly disagree” and 5 for “strongly agree”) for three level of job profile. For

68 Journal of Indian Research
the sample of women (sample size = 33), all interactive variables (except top level service workers) aresignificant and positive. Thus, we find wide and distinct gender-based effects of non-monetary work benefits.The findings suggest a clear cut distinction of females falling into the consideration of non monetary benefits ata lower and middle level of occupation thus making these benefits an important factor and value drivers in theorganization.
5. CONCLUSIONS
Although non-monetary measures are increasingly important in decision-making and performance evaluation,companies should not simply copy results and measures used by others. The choice of measures as well asbenefits must be linked to factors such as corporate strategy, value drivers, organizational objectives and thecompetitive environment. In addition, companies should remember that performance measurement choice is adynamic process - measures may be appropriate today, but the system needs to be continually reassessed asnon monetary strategies and competitive advantages evolve. The philosophy of internal marketing is thatemployees of an organization constitute its internal market, which has customers and suppliers and as a result,a chain of value if formed inside the organization which must be intended to supply the needs of both theinternal and external customers. When the internal customers of an organization are satisfied they will performbetter and maintain better interaction with the customers. As a result, the customers will get more satisfied,which will bring about their faithfulness in the long run and ultimately a competitive advantage will be obtainedfrom the internal customers. Internal marketing influences the customers’ understanding of the quality ofservices. On the other hand, Internal marketing can also influence both the quality of services and thecustomers’ satisfaction.
References
• Forum for People Performance Management and Measurement, Internal Marketing Best PracticeStudy(2008).
• Christopher Lovelock, Jochen Wirpz ,Jayanta Chatterjee(2006)”Services Marketing “ Pearson edu,5th ed.
• Hugh Burkitt and John Zealley (2006) “Marketing Excellence:Winning Companies reveal the secrets oftheir success”, John Wiley & Sons ltd..p.295.
• Irit Nitzan & Boraklibai (2011),”Social effects on Customer Retention”
• Kanter, R.M. (1983), “The change Masters” Simon and Schuster, New York NY.
• Kuo-Songlu (2012), “Brilliant intelligence and internet marketing Effect on organizational citizenship Behavior-study of employee in high Technology Industry”.
• Naresh K Malhotra,Satya Bhushan Dash (2010) ,“Marketing research :An applied orientation” Pearson,6th ed.
• Nilay Yavuz (2004) ,“The use of non-monetary incentives as a motivational tool: A survey study in a PublicOrganization in Turkey.
• Pervaiz K. Ahmed , Mohammed Rafiq (2004), “Internal Marketing : tools and concepts of or customerfocused Management”, Elsevier.
• Philip J. Kitchen (2004) , Internal Marketing in UK Banks: Conceptual Legitimacy or window dressing.” Hull University,pp. 421-452.
• Valarie A Zeithaml,Mary Jo Bitner,Dwayne D Gremler,Ajay Pandit(2006) “Services Marketing”Mc Graw-Hill Co,4th ed.

Volume 1, No.1, January-March, 2013 69
Journal of Indian Research, Volume 1 No. 1, 2013, 69-72
Management
A LITRETURE REVIEW ON BUSINESS PRACTICES OF MARWARIBUSINESS HOUSES IN INDIA
Mr. Yash Kumawat*, Dr. Narayan Baser**
ABSTRACT
Business practices of different business houses in India are undergoing massive transformation.Sound business practices of various business houses in India, including Marwaris, have instilledfocus, discipline, and structure within the current organization and lead it to the expected level ofgrowth. This paper primarily focuses on review of various literatures on business practices of Marwaribusiness houses in India. The reasons for spread of Marwari community’s diaspora across the countryand their success in commercial activities has been explored .
Keywords: Business Community, Business practices, Marwari houses,
INTRODUCTION
A literature review corresponds to a systematic review of texts that aims to discuss critical issues ofcurrent knowledge as well as its finding on a particular topic. Literature review are secondary source for anyfurther research. Most often this term is associated with preliminary activity of the particular research. Theultimate goal of such exercise is to update reader about the current literature on a topic and form the basis foranother goal. A well structured review leads towards real goal of any research. In the absence of wellstructured review, the research might get deviated from actual goal.
India is a large country with a diverse population, tackling numerous socio-economic and political challengesthroughout history and experiencing growth and development while facing economic and fiscal pressure in acontext of regional inequalities in terms of various different business houses. Business practices of thesedifferent business houses in India are undergoing massive transformation. Sound business practices of variousbusiness houses in India have instilled focus, discipline, and structure within the current organization and leadit to the expected level of growth. This paper primarily focuses on review of various literature on “Businesspractices of Marwari Business houses in India”
Several authors, scholar, and academician contributed significantly in this area. They were confined with thehistorical review, autobiographies, and articles. Thomas A. Timberg “The Marwaris From Trader To Industrialist”and Dr. D. K. Taknet “Industrial Entrepreneurship Of Shekhawati” have contributed fundamentally on thebusiness practices of this community. Apart from this some autobiographies, articles and few research paperswere also published on this area with varied time frame. Thomas A. Timberg (1979) published a very famousbook ‘The Marwaris From Trader To Industrialist’ in which he emphasized on macro level research on theMarwaris living in the important cities and some Indian provinces. Dr. D. K. Taknet (1986) has published abook on ‘Industrial Entrepreneurship Of Shekhawati’ which focuses on pre- independence contribution andpost- independence contribution of Marwaris in India. In this study, Dr. Taknet reveals the secret of Marwaribusiness like practical training in business, enterprises skill, cooperative system of banking, partnership andgood will, philanthropy, support to British government and interest of politics. They gradually adopted Britishtechniques in their accounts and they also started correspondence in English. He finally concluded this study
*Mr. Yash Kumawat is Research Scholar, Mewar University, Chittorgarh
**Dr. Narayan Baser is Associate Professor, NICM SJPI, Gandhinagar

70 Journal of Indian Research
by the wording” Community had followed eleven major ideals that are training, experience, organizing,risk taking ability, achievement motivation, thrift, diligence, community cooperation, intimacy, confidence,charity, simplicity, innovation.” Gita Piramal (1996) in her contribution called “Business Maharajas”, hasmentioned about vast business empire and the most powerful man who control sales to the tune of Rs. 550billion through over 5000 companies and that directly employed 6,50,000 people. In this study, she focused onthe businessmen who are different and varied. Some of them were college topper, in contrast some merelycollege drop-out. In this study, she also described about what they do, how they think, how they react oninfluence on general economy and how they operate their business. She focused mainly on the notablemarwaries like Bajaj, Birla, Goenka, Khaitan. This book separately focuses on the development of variousbusiness groups, their critical phases, joint ventures. Ms. Piramal exquisitely narrated on Rahul Bajaj, AdityaVikram Birla, R.P. Goenka, and Khaitan as Marwari business leaders. Narayan Chandra Shah (2003) in hisstudy on ‘The Marwari Community in Eastern India’ studied Marwari groups mainly based of North Bengal’sthree districts of Cooch Bihar, Darjeeling, Jalpaiguri. The work focus on Calcutta’s early history of theMarwari community and its social, economic, religious, caste and cultural identities. This community migratedfrom their original place of birth. He studied the factors that were behind this migration. He also focusses onthe way Marwari community emerged as a strong business community in North Bengal. He also elaborates inhis study about their switching principal business from money lenders to money investors. He also threw lighton the commercial ventures of Marwari business in eastern Calcutta. The narration covers the history ofchange from agrarian economy to a market oriented and surplus generating economy, the commodities andcash crops like paddy, sugarcane, tobacco, coffee and tea. Finally, Shah examined the influence of adaptabilityto local conditions and amiable temperament which helped them to set up business in far away places fromtheir home in Rajasthan. Shah concluded the study in following words:
“Marwaries business starts with very humble beginning. In beginning they started with hawkers ortraders. With the passage of time Marwari moved in all business area. Today there is not a single fieldin which Marwaris are not found. They made notable contribution in community apart from profitmaking in the concern region. They opened the schools, colleges in the respective areas, publishedmagazines, dailies and journals for dissemination of the information and knowledge. Significant socialcultural activities were performed by marwaries. Marwari Yuva Munch which came in to existence in1977 with main aims of National integration, implementation of welfare programmes for the handicapped, Medical services, relief work during natural calamities and even fight against social evils. They made‘Dharmashalas’ for tourists and visitors in all three northern districts that provide services on veryeconomical rates. Marwaries also encouraged a bit for urbanization. They provide large donation forconstruction of Hospitals, Power house in Jalpaiguri district. Finally they moved in public life andpolitical arena.”(Shah,2003)
Marwaries always live as integral part of the society. They befriend all communities and maintain harmoniousrelationship. Marwari have played effective role as rural money-lenders. They also conducted large-scalecredit transaction in urban and semi urban area in absence of financial institution in the area. These thingsconferred them strong financial position. Seldom surplus property of peasant would become property of moneylenders. But there is no record of tensions between local peasant and Marwari money lenders. Sample studyof Shah does not indicate that marwaries have been solely responsible for any fundamental or revolutionary,social economic change in the area. At present, marwaries are captain of North Bengal Trade. AnneHardgrove (2005) in his study on ‘Community and public Culture, The Marwaris in Calcutta, 1887-1997’discussed historical facts about marwaries such as their migration from Rajasthan to various part of India, theireconomic activities, custom or rituals. He emphasised over the structure, nature and reasons for the successof the Marwari business organizations. Antoinette Schoar, Raj Kamal Iyer, Sandya Kumar (2008) in theirresearch named “Importance of Ethnic Networks for Business Transactions of the Small Enterprises” focusedto understand the effect of ethnicity across business transactions of the business communities Andhra,

Volume 1, No.1, January-March, 2013 71
Tamilian & Marwari. They used an “Audit study methodology” to collect field data and “Randomizationtechnique” to have an unbiased allocation of shops to the auditors. The auditors entered into contracts with thewholesaler with a predetermined script and the observations helped them to investigate the nature of thebusiness transactions and variation in contract terms because of ethnicity of Tamilian & Marwari communities.It also gave the researchers an insight into the “entrepreneurial instinct of a specific Marwari community.” Itwas also revealed that a match in the ethnicity of wholesaler and auditor does not help alleviate the hold-upproblem. However, the team found that “when traders of the same ethnicity meet they offer lower prices.”The study suggest that all business transactions in the SME sector have a combination of formal and informalcontracting and the ethnicity of the parties plays an important role in determining the features of the contract.Ajai Singhal & Mohd. Wamique Hisam (2009) in their study “Nature And Characteristic Of Marwari’sBusiness: A Brief History From 16th To Early 20th Century” explained how Marwari community achieved theheights of the success. Their paper focuses on the development of the Marwari business houses in early 18th
century to 20th century. Initial part of the paper mentioned the introduction and their migration trend which wasstarted in early 16th century. They settled their business mainly in the West Bengal. The nature of the businessorganization was very simple. It was controlled by the family members.
The Marwari business organizations have following characteristics:
Family controlled: Traditionally, they followed family firm institution. Business is mainly controlled by familymembers. This tradition of family firms pass on their business generations after generations. Banking, tradingin commodities, Hundis, Futures, Broking, and Manufacturing Industries were their prominent business interests.
Centralized control and Accounting: As Marwari business organizations were managed and owned by thefamily,the centralization of power was the key feature of the business organization. In a large business firmwith several branches, they have centralized book keeping. They moved one branch to another branch forchecking accounts which was maintained be the clerks. Time to time family member would meet for accountingpurpose.
Proper liasioning with the Government: Marawaries maintained exceptionally healthy relationship with thegovernment (Nawab, Britishers, Rulers of Princely state). The history indicates that whenever the ruler gotinto crisis, marwaris always backed them to get rid from financial crisis. It can be summarized that from 16th
century to early 20th century, marwaris entered from one business to another depending upon the opportunityand the nature of their businesses. The business can be summed up in four categories. First category is tradingand banking which dominated almost all the marwaris up to 18th century. Second category is that of bania orbrokership in which marwaris took the role of middlemen to the European firms. The third category isspeculation in which many marwaris entered from late 19th century to early 20th century and made hugemoney. And the last category is manufacturing in which many marwaris entered after the end of First WorldWar. Ashok Som (2010) in his article “Emerging trends of human resources practices at Aditya Birla”described the emerging trends of human resources practices at Aditya Birla group and strategic redesigning ofthe whole organization from 1995 to 2006. This article also focused on business economy like India, and thenature of HR practices needed to new capabilities to beat the global complexities of the business. It focusedmainly on two issues; (1)the peculiarities or defining characteristics of HR models unique to India and (2) themain factors that shape people, management policies and practices.
Conclusion
After reviewing available literature, it is observed that Marwari community’s Diaspora spread throughout thecountry and their success in commercial activities could be attributed to their knack of grabbing the businessopportunities whenever it came, their willingness to move to any place which offered them opportunity, andcreating a strong and continuously growing commercial network of fellow community members which provided

72 Journal of Indian Research
a platform to any Marwari who wanted to enter into a commercial activity anywhere in the country. Alongwith that, they always ensured the government patronage which helped them in running their businessorganizations without any interference and retaining the autonomy. Marwaris were successful in developingsuch a strong financial network that even government started depending upon this community in financialdifficulties and this network also helped in grabbing many businesses from local community and other businesscommunities across different parts of the country.
References
• Dr. D.K. Takent (1986) “Entrepreneurship of Shekhawati”, p. 175, p. 165
• Gita Piramal(1996), “Business Maharajas”, pp. 9-10
• Narayan Chandra Shah (2003), “The Marwari Community in Eastern India”, Chapter 9
• Ashok Som (2010), “Emerging Trends of Human Resources Practices at Aditya Birla”
• Ajai Singhal & Mohd. Wamique Hisam (2009), “Nature And Characteristic Of Marwari’s Business : ABrief History From 16th To Early 20th Century”
• Antoinette Schoar, Raj Kamal Iyer, Sandya Kumar (2008), “Importance of Ethnic Networks for BusinessTransactions of the Small Enterprises”
• Anne Hardgrove (2005), “Community and public Culture, The Marwaris in Calcutta, 1887-1997”

Volume 1, No.1, January-March, 2013 73
Journal of Indian Research, Volume 1 No. 1, 2013, 73-84
Computer Science
DESIGN SECURE OBJECT ORIENTED SOFTWARE
M.U. Bokhari*, Mahtab Alam**, Prashant Johri***
ABSTRACT
The paper discusses joint work by scholars from three centres to develop a security mechanism forsoftware development and maintenance. Security is an integral part of the widely distributed modernsoftware systems. But, the software development process does not give primacy to this attribute. Generally,Security mechanisms are added to the existing systems as an afterthought, with all the consequentproblems of insufficient security requirements, integration difficulties and mismatches between runningsystem and the design models. We propose to integrate the design of security early into the system’sdevelopment process. Object oriented software development is a new approach, which is gainingcurrency among developers. The standard language for modeling the design of Object-oriented systemsis Unified Modeling Language (UML). The paper focuses on the security aspects of such an Object-oriented software in early design phase.
Keywords: Vulnerability, Threats, Unified Modeling Language, Object Oriented Software, Risk Assessment,Encapsulation, Polymorphism.
INTRODUCTION
Object Oriented Design (OOD) process is meant to design the classes identified at the requirement andanalysis phase. During this phase ,the system is viewed as collection of objects and the operation of theseclasses are performed by the interaction of these objects through messages.At the design phase, a systemmust present unified security design that takes into account security principles. Many security propertiescannot be verified by test activity alone; however verification through analyses and modeling at the designstage can increase the confidence that the specification provides a sound basis for developing a secureprogram [1]. There are several reasons for the lack of support of security engineering. Two most pertinentreasons include (i) security requirements are generally difficult to analyze and model and (ii) the lack ofdeveloper acceptance and expertise for secure software development. Security issues that must be addressedduring design and development phases are not restricted to avoiding software vulnerabilities, such as bufferoverflow errors, and meeting security requirements that were explicitly expressed at the beginning of thedevelopment process, but it also includes the Unified Modeling Language (UML). In recent years, UML hasbecome a standard for object oriented modeling in the field of software engineering. Specification of thesecurity policies using UML will ease the understanding of security requirements, so the developer acceptancefor security aspects will grow. In this way, security problems will be earlier detected in the system developmentprocess, which reduces the costs and effort. Recent research concerns the integration of security engineeringinto the software development process [2][3].
* M.U. Bokhari is Chairman and Professor, Dept. of Computer Science, Aligarh Muslim University, Aligarh,Email:[email protected]** Mahtab Alam is Research Scholar, Computer Science, Mewar University, Chittorgarh, Mewar,Email:[email protected]
*** Prashant Johri is Professor, Dept. of Computer Science, Galgotia University, Greater Noida,Email:[email protected]

74 Journal of Indian Research
SOFTWARE SECURITY
Security is a measure of the system’s ability to resist unauthorized usage while still providing its services tolegitimate users. An attempt to breach security is called an attack and can take a number of forms [4].Security is fast becoming one of the most important quality attribute in Software Engineering. Critical informationand transactions need to be safeguarded against malicious users and attackers. Copyright protected CommercialOff-the Shelf Components (COTS) may be used in software development. Due to the inaccessibility of sourcecode, these components act as black boxes, whose credibility against various security attacks is not wellestablished. Another common source of attacks is the people within an organization. Security Engineering isthe multi-disciplinary technical field addressing such security issues. Security Engineering deals with thesecurity and integrity of real-world systems. It deals with the development, integration, operation, administration,maintenance, and evolution of systems and applications as well as the development, delivery, and evolution ofproducts. Security concerns must be addressed in the definition, management, and re-engineering of enterprisesand business processes. Thereupon, Security engineering is delivered in a system, in a product, or as a service.Capability Maturity Models (CMMs) have been successful in setting standards and in maturing the softwareengineering processes. One of the main aims of Software Engineering Institute (SEI) has been to enableorganizations to improve their software capability [5].
“Systems Security Engineering Capability Maturity Model Version 3.0” of the Software EngineeringInstitute, lists the goals of Security Engineering as follows:
• Gain understanding of the security risks associated with a software.
• Establish a balanced set of security needs in accordance with identified risks
• Transform security needs into security guidance to be integrated into the activities of other disciplinesemployed on a project and into descriptions of a system configuration or operation.
• Establish confidence or assurance in the correctness and effectiveness of security mechanisms
• Determine that operational impacts due to residual security vulnerabilities in a system or its operation aretolerable (acceptable risks).
• Integrate the efforts of all engineering disciplines and specialties into a combined understanding of thetrustworthiness of a system .Security Engineering activities are practiced during all life cycle stages, suchas Requirement stage, design stage, development stage, maintenance stage and testing stage.OBJECTORIENTED SOFTWARE DESIGN
The Software design is the step in the software development process prior to construction. It is the step tothink and plan holistically about the heuristic design to be built, and requirements for the tools or the rebuiltcomponents needed to realize the goal . Moreover the selection of proper components and the process toproperly fit those together is essential. The amount of time spent on the design of the software depends on thecomplexity of the software. The change in the programming paradigm from structure programming to object-oriented technology has spread to several application areas. Nowadays, object-oriented software design is thebest programming paradigm, because it reduces problems to smaller and more manageable scale.
The Object Oriented Design consists of three big concepts, encapsulation, polymorphism, and inheritance, butthe text “Fundamentals of Object-Oriented Design in UML” specifies that the following criteria are necessaryfor a language to be considered object oriented.
1. Encapsulation - the grouping of related ideas into unit. Encapsulating attributes and behaviors.
2. Inheritance : a class can inherit its behavior from a super class (parent class) that it extends.

Volume 1, No.1, January-March, 2013 75
3. Polymorphism : literally means “many forms”.4. Information/implementation hiding : the use of encapsulation to keep implementation details from being
externally visible.5. State retention : the set of values an object holds.6. Object identity : an object can be identified and treated as a distinct entity.7. Message passing : the ability to send messages from one object to another.8. Classes : the templates/blueprints from which objects are created.9. Genericity : the construction of a class so that one or more of the classes it uses internally is supplied only
at run time.10. Test here11. More testing here
SECURITY AT DESIGN PHASE
Security needs to be considered at the onset of a design rather than as an afterthought. One needs to knowrisks which come with awareness and knowing adversaries and their capabilities. Mitigating risks will involvebuilding controls and security mechanisms that will impact policies, environment, and coding. If there are anyweaknesses in the implementation, security becomes ineffective. Security need not be complex but failing tounderstand the impact of choices will obscure the difference between what is secure and what is just. Theproper approach to designing a solution is one that meets business objects and that protects the confidentiality,integrity, and availability against identified risks with controls that are transparent to the user. Before digginginto development and implementation, one needs to have some understanding of the requirements for securitymechanisms.
Chenxi Wang [6] and William of University of Virginia, states in their work, “Towards a Framework forSecurity Measurement” that,
“Quantifying security is a difficult problem. The difficulties lie in that “computer security” isnot a crisply defined term. Moreover, as computing systems grow larger and more complex, it isincreasingly more difficult to make statements about any system-wide properties, even thosebetter understood than security.”
Cristian Oancea [7], in their document “Integrating Security Policy Design in the Software Design”statethat
“There are at least two reasons for the lack of support for security engineering. The firstreason is that security requirements are generally difficult to analyze and model. A secondimportant reason is the lack of developer acceptance and expertise for secure softwaredevelopment. Acceptance is a problem because for software developers, security interferes withfeatures and with time to market. Expertise is a problem because security policies are generallyspecified in terms of highly specialized security models that are not integrated with generalsoftware engineering models. This lack of integration is also detrimental to developer acceptance.”
PRINCIPLES OF SECURE SOFTWARE DEVELOPMENT
While principles alone are not sufficient for secure software development, principles can help guide securesoftware development practices. Some of the earliest secure software development principles were proposedby Saltzer and Schroeder in 1974 [8]. These eight principles apply even today and are reproduced herein:

76 Journal of Indian Research
• Economy of mechanism
• Keep the design as simple and small as possible
• Fail-safe defaults: Base access decisions on permission rather than exclusion.
• Complete mediation: Every access to every object must be checked for authority.
• Open design: The design should not be secret.
• Separation of privilege: Where feasible, a protection mechanism that requires two keys to unlock itis more robust and flexible than one that allows access to the presenter of only a single key.
• Least privilege: Every program and every user of the system should operate using the least set ofprivileges necessary to complete the job.
• Least common mechanism: Minimize the amount of mechanism common to more than one user anddepended on by all users.
• Psychological acceptability: It is essential that the human interface be designed for ease of use, sothat users routinely and automatically apply the protection mechanisms correctly. [4]
BEST PRACTICES FOR SECURE DESIGN
The collection of best practices to guide software design have been summarized after reviewing variousdocuments [4][24][7][20][22][23]. Some are listed as below:
(a) Perform Threat Analysis: Threat modeling is an engineering technique used to describe threats to thesoftware application. Threat models are methodically developed in order to understand the risk to a systemfrom malicious users or applications. Threat modeling allows development teams to anticipate attacks byunderstanding how an adversary chooses targets (assets), locates entry points and conducts an attack. A well-implemented threat model will profile the assets that need to be protected, how the threats to these assets, theattacks that could be used to realize a threat, and the conditions under which the attack may be successful. Athreat model shows how adversaries view the system, its components, and where they are likely to attempt itsexploitation. Not only is this important for identifying potential threats, but also in understanding what application,defenses must be defeated in order for a threat or series of threats to be realized. For example, an e-commerce system may have the following threat, “A malicious user is able to gain an undeserved credit ontheir account.” A threat model would specify this as:
• Threat: A malicious user is able to gain an undeserved credit on their account
• Attack: User sets item price field to a negative value
• Conditions: Server-side validation doesn’t exist on item price field or server-side validation is non-existent.
A threat model will consist of multiple threats each of which can have multiple attacks. Each attack can thenhave multiple conditions. The conditions indicate how to defend against the threat in the design, and can beused during testing to generate security test cases.
(b) Identify Components Essential to Security: Designing the overall component structure of a system isa key activity in the design phase. Each component identified in the design must be carefully analyzed for itssecurity needs. Some components will require protection. Other components will provide protection in the formof input validation, authentication, or cryptographic routines. These latter components must be the focus ofextra attention from security engineers. For every component that implements a security function, engineersmust carefully consider how that function is going to be implemented, reviewed and tested. Test planning for

Volume 1, No.1, January-March, 2013 77
security components is a crucial task that needs to be given attention as early as possible in the SDLC.Planning tests only after a component is implemented may be too late and multiply additional risk to theprocess.
(c) Artifacts of Secured Design Phase: The design phase builds upon the work done in the requirementphase by detailing initial conceptual solution, which is identified and prioritized business problems. There arethree artifacts that come out of the design phase-Software Architecture, UML Object Model and DesignPattern [9].
(d) UML Object Model: UML Object Model in design phase is used by the developer in order to show thekey structural and behavioral parts of the application. UML Object Model fills the gap between requirementphase and implementation. In requirement phase, use case diagram are used in order to define a requirement,and UML Object Model consider each and every entity as an object (real world object). Thus, it also helps incoding. Breaking the application into separate slice that represents structural and intersections view is useful todrive pattern and visualized the application for review purpose [9]. Reviewing object model is a good way forsecurity team to find areas of interest to focus on application, for example:
• State Changes: There are many security implication to consider when state changes. When the state ofsensitive data is changed then it should be recorded in audit log.
• Context Change Trust Relationship Chain: when application transfer data from one server to anotherthen it is very critical from the point of view of security, as data can be stolen or modified during thisprocess.
• Persistence: The data not only stored securely by application but also by other programs that deals withit, like domain controlled by DBA and System Admin.
• Access points/Privileges Change Requirements: Access points, authentication and authorizationevents are visible in design models. these provide a point of reference for the security to make sure thatthe security assumptions are made in the analysis phase requiring access levels for functionality usage areimplemented in the design phase.
• Identified Inputs: In object model, the place of data input is well defined so that security team can getidea of placing input validation on data.
• Understand Exception Scenarios: Exceptions are the unavoidable part of every application but with theuse of object model, exception handling is quite easy as it give clear understanding to the security teamabout probable exception conditions and a blueprint to fit in data flows in those conditions
UMLSEC
Given the widespread use of UML, it is important to include explicitly the security characteristics of a systemwithin UML diagrams in a formalized manner. Such additional information can be added using stereotypes andattributes in the easiest case or by means of UML extensions if necessary [10]. When design models (UML)are annotated with security related information, it is possible to carry on automatic verification of the design.Such tools enable the identification of defects and security threats as early as possible in the life cycle, thusreducing the cost of their correction. SecureUML is a proposal for a UML profile for security; morespecifically, SecureUML extends UML to support authorization constraints [10]. The capability of specifyingsignificant information related to access control, and of deriving complete access control infrastructures (usingEJB components), is presented [13]. Basically, SecureUML defines a set of stereotypes and uses them toautomatically produce the code that controls how users can access the different parts of the application.These stereotypes only consider the static parts of UML; dynamic ones are part of the future work.

78 Journal of Indian Research
A more ambitious UML profile is UMLsec [11]. In this case, the approach is quite different: it extends state-charts and component diagrams to enforce the following security requirements: fair exchange, secrecy/confidentiality, secure information flow, and secure communication link. The author describes the notationwith a formal semantics based on Abstract State Machines language, to precisely analyze designed models.The main goals of UMLsec are [12]:
• Evaluate UML specifications for vulnerabilities in design.
• Encapsulate established rules of security engineering.
• Make available to developers not specialized in security a simpler way to check UML models.
• Consider security from early design phases.
• Make verification cost-effective.
UMLsec offers mostly-used security requirements as stereotypes with tags (secrecy, integrity, etc…); it usesassociated constraints to evaluate specifications and indicate possible vulnerabilities; it ensures that statedsecurity requirements enforce given security policy and that UML specification satisfies the defined requirements.Among the mandatory requirements, UMLsec provides basic security requirements such as secrecy andintegrity and it allows considering different threat scenarios depending on adversary strengths. Moreover itallows including important security concepts and mechanisms (e.g. access control) and it provides securityprimitives (e.g. (a)symmetric encryption).The main goal of UMLsec is to automatically check security propertieson an extended UML model, stored in XMI standard format; then this model can be checked by a formal tool[14] to verify security requirements.
DESIGN PATTERNS
Design patterns are based on real world architecture. In the book “Design Patterns” [21], the author definesthree types of patterns, which occur in the applications:
• Creational Patters: are responsible for constructing objects, creating their initial instance, and managingthe lifespan of the object.
• Structural Patterns: defines objects composition in terms of its interfaces, structure and relationships.
• Behavioral Patterns: describe the ways that the object communicate process logic, handle state andinteract with other objects.
The security team can utilize the design pattern format to develop its own security design pattern. They candesign a pattern for access control where they can control authentication, authorization etc. The patternapproach is another tool that is already used in much organization and can be a boon to security team. Thechallenge to the security team is to find the balance between specificity, which helps developer deliver qualityon time and reusability, which reaches across enterprise. The design of secured application is not an easy task;it requires deep understanding of various aspects of security, like security measurement, security categories,security policies etc. Effective management of any process requires quantification, measurement, and modeling.Metrics provide a quantitative basis for the development and validation of models of in overall process ofsoftware development. Metrics can be used to improve software productivity and quality. Quantifying security,however, is a difficult problem. The difficulties lie in that “computer security” is not a crisply defined term. Wetend to know approximately what we mean by “security” and what we want it to do, but we seldom clearlystate what security really means to us and how secure is “secure enough”. Moreover, as computing systemsgrow larger and more complex, it is increasingly more difficult to make statements about any system-wideproperties, even those better understood than security. Despite these problems, we believe it is a worthy effortto explore ways to measure attributes that are most important for secure application development. In thisframework we are focusing on metrics and measurement of security in order to assess the security in

Volume 1, No.1, January-March, 2013 79
software development process and thus making our software development process secured. As object orientedprogramming languages are becoming more and more widely used, metrics are required that are specificallydesigned for object oriented software security. In recent years there has been an explosion of new, objectoriented software metrics proposed in the literature. Unfortunately, many or most of the proposed metricshave not been sufficiently validated to measure what they suppose to measure and also there was no securityconsideration. An analysis of some of these metrics shows that they do not always satisfy basic properties ofmeasurement theory. Our approach includes identification of threats; attacks and risk of design phase in objectoriented software development, then identification of commonly accepted set of software security attributes,and then establishing a relationship between these attributes, so that we would be able to measure security atthis phase of SDLC.
QUANTIFICATION OF SECURITY DESIGN
“What is not measurable, make measurable” — Galileo Galilei(1564 - 1642).
One cannot predict and control what one cannot measure [11]. With no certain way currently known todirectly measure the security of a software product, identifying one or more surrogate measures may bepossible. A surrogate measure of a product or process would produce data that correlates with the securityproperties of the products produced with the process[4].Measurement is necessary as it verifies that theproduct developers are capable of consistently and correctly using the process, that the process instructorsproperly train the developers to consistently and accurately use the process, that the correct process wasproperly used to develop the product, and that the process consistently produces secure software products. Inaddition to measuring all of the product work, measures are also required of all security-relevant productcharacteristics and properties. To perform in this way, software organizations must work to defined softwareengineering, security, and management goals and they must precisely measure and track their work throughoutthe product’s lifetime. These measures must provide the data needed to estimate and plan the work, toestablish team and personal goals, to assess project status, to report project progress to management, to verifythe quality of all phases of the work, to assess the quality of all products produced, and to identify troublesomeproduct characteristics and elements.
Such measures must also show how well the process was used and where and when corrective actions areneeded. These measures can also be used to assess the quality of the training and coaching provided to thedevelopers and their teams. Without such measures, it would be impossible to verify the consistent and properuse of the process or of the methods and practices it supports [15].
(a) Selection of Units and Scales: Units and scale types determine how measurements can be achieved.For example, if we define the unit for availability as “requests served per hour”, we effectively state that themeasure of availability is to be derived from dividing the number of requests by a specified time frame. Inchoosing appropriate units and scale types, the following issues must be considered :
• Plausibility: The richer the scale type, the more information the measures represent. However, sometimesit is simply not possible to use a rich scale. For example, if sufficient information or measurement tools arenot available, a less ambitious scale may be more appropriate.
• Accuracy: Accuracy is an important criterion in selecting a unit and a scale type. Sometimes a goodreason to choose one unit or scale type over others is the potential measurement errors caused by onemeasure as opposed to others. [6]
In the case of computer security, direct measurements of the end-to-end security properties are madeimpossible because of the scopes and structures of the modern computing systems. In these systems, securityattributes are no longer functions of a single entity. They are more often functions of a host of objects andtheir interactions. To approximate the security strength of large systems, an estimation method must be used.There may be many estimation methods. For example, one can estimate system- reliability by sampling thehistory of the entire system or by doing so on each component and integrate them in some manner. What onerequires is a model to relate the high-level security attributes to that of the low-level, more measurable

80 Journal of Indian Research
components [6]. This methodology uses a decomposition method to develop such models — starting with high-level security properties of the system, work our way down to the basic components of the system and theirinteractions [6].
(b) Software Measures and Measures of Secure Design: Following the specification of security relatedrequirements, measurement objectives may be formulated that will provide insight into the satisfaction of thesecurity requirements. Examples of measurement objectives include the following :
• What vulnerabilities have been detected in our products? Are our current development practices adequateto prevent the recurrence of the vulnerabilities?
• What process points are most vulnerable to the introduction of security-related risks (e.g., injecting reusedcode/modules into programs—where the variables could go unchecked, etc.)?
• What proportion of defects relate to security concerns and requirements? Do defect classification schemesinclude security categories?
• To what extent do practitioners comply with security-related processes and procedures?
• To what extent are security concerns addressed in the intermediate work products (requirements, design,etc.)? Have measures associated with security requirements and their implementation been defined andplanned?
• What are the critical and vulnerable modules? Have vulnerabilities been identified and addressed? [24]
Threat modeling or the attempt to identify likely types/sources of attack, can also form a significant guidingrequirement to the development processes. A recent thesis by Stuart E. Schechter at Harvard’s Department ofComputer Science attempts to utilize economic models for valuing the discovery of vulnerabilities duringdevelopment. His measurement of security strength depends most on threat scenarios to assign values tovulnerabilities in an effort to extend a market approach to the development process. Many risk and threatmethodologies are available publicly, and Microsoft has published extensive materials that delineate the company’sapproach in analyzing and mitigating threat risks during the SDLC.
(c) Threat, Vulnerability and Risk identification: In order to start the process of security assessment,there is a need to identify common threat, vulnerability and risk in the software. In the figure 1.1 relationshipsbetween threat, vulnerability and risk is shown.
Figure-1, Relationship between Assets, threat, vulnerability and risk analysis

Volume 1, No.1, January-March, 2013 81
(d) Threats: Software threats can be general problems or an attack by one or more types of maliciousprograms [16][17].
• A threat is the possibility of a real attack which exploits a vulnerability [17]
• A threat entails the risk of an attack [17]
• Usually we cannot eliminate the threats, But we can lower the risk [17]
• We have to rate the risk of a threat to become a successful attack [17]
(e) Threats Categories: Types of common security threats that our application face, are as follows; thesethreats are often referred to by the acronym STRIDE. These include:
1. Spoofing identity: an unauthorized user impersonating a valid user of the application.
2. Tampering with data: an attacker illegally changing or destroying data.
3. Repudiability: the ability of a user to deny that he or she performed an action.
4. Information disclosure: Sensitive data released to users or to locations that should not have accessto it.
5. Denial of service: Acts of sabotage that make applications unavailable to users.
6. Elevation of privilege: A user illegally gaining an unacceptably high level of access to the application.[3][4][17][9].
(f) Threat Modeling: Threat modeling is a security analysis methodology that can be used to identify risks,and guide subsequent design, coding, and testing decisions [4][24]. The methodology is mainly used in theearliest phases of a project, using specifications, architectural views, data flow diagrams, activity diagrams,etc. But it can also be used with detailed design documents and code. Threat modeling addresses thosethreats with the potential of causing the maximum damage to an application. Overall, threat modelinginvolves identifying the key assets of an application, decomposing the application, identifying and categorizingthe threats to each asset or component, rating the threats based on a risk ranking, and then developingthreat mitigation strategies that are then implemented in designs, code, and test cases. Microsoft hasdefined a structured method for threat modeling, consisting of the following steps to identify assets
1. Create an architecture overview
2. Decompose the application
3. Identify the threats
4. Categorize the threats using the STRIDE model (Spoofing, Tampering, Repudiation, Informationdisclosure, Denial of service, and Elevation of privilege)
5. Rank the threats using the DREAD categories (Damage potential, Reproducibility, Exploitability, Affectedusers, and Discoverability).
6. Develop threat mitigation strategies for the highest ranking threats [5] [9][4][20].
7. Other structured methods for threat modeling are available as well [8]. Although some anecdotalevidence exists for the effectiveness of threat modeling in reducing security vulnerabilities, no empiricalevidence is readily available.
(g) Limitation of Threat Model: There is no way through which we can discover all types of threats, usingthreat modeling.
• New technologies or attack strategies can result in new threat scenarios, or may uncover threats thathad long been present but not discovered.

82 Journal of Indian Research
• Even when all the basic threats are known, there is no way to ensure that all of a node’s wildscenarios have been discovered. If the scenario of interest has been modelled with existing threatdiagrams we may find assurance in knowing these diagrams have stood the test of time. However,there is always the possibility that new attacks will appear [24].
• Finally, countermeasures are not always implemented correctly and even those that are act only toreduce threats not eliminate them. Keys may be guessed, well screened employees may be bribed,and components that functioned during a million consecutive tests may fail the next time they areused[24].
(h) Commonly Accepted Set of Security Attributes: The commonly accepted set of security attributes isas follows
• Confidentiality : The information requires protection from unauthorized disclosure.
• Integrity : The information must be protected from unauthorized, unanticipated, or unintentionalmodification.
• Authenticity : A third party must be able to verify that the content of a message has not been changedin transit.
• Non-repudiation : The origin or the receipt of a specific message must be verifiable by a third party.
• Accountability : A security goal that generates the requirement for actions of an entity to be traceduniquely to that entity.
• Availability : The information technology resource (system or data) must be available on a timely basisto meet mission requirements or to avoid substantial losses. Availability also includes ensuring thatresources are used only for intended purposes. :[20][2][18][19][22]
(i) Relationship between Threat Type and Security Attributes: Strong authentication helps mitigateidentity spoofing [3]. Use of authorization techniques prevents data tampering and information disclosurethreats [3]. A checking of record of both authorized and unauthorized operations [Auditing] reducesrepudiability [3]. By proper availability of service, the denial of service can be avoided, and elevation ofprivileges can be controlled by proper techniques of confidentiality. The overall relationship between threatcategories and their mitigations attributes are represented in Table-1.
Threat Category Controlled by (Security Attributes)
Spoofing identity Authentication, Authorization
Tempering with data Integrity, Authorization
Repudiability Auditing
Information disclosure Integrity, Confidentiality
Denial of service Availability
Elevation of privileges Confidentiality, Integrity
Table-1 Threat categories and Security Attributes.
CONCLUSION
Software Design phase provides the blue print of the software application upon which the entire softwaredepends. The full-proof success of secure software completely depends upon the secure design of the

Volume 1, No.1, January-March, 2013 83
software. Threat modeling is one of the best method techniques to assess the secure design. A lot of work isgoing on threat modeling approach. This paper presents such an approach to discover the threat related to thesystem and categorize them according to their consequences. A STRIDE System has been developed toassess post-categorization ranking.
REFERENCES
[1] David P. Gilliam, John D. Powell, “Development of a Software Security Assessment Instrument toReduce Software Security Risk”.2001. This is the result of a joint work of Jet Propulsion Laboratory,California University and NASA. http//:www. trs-new.jpl.nasa.gov/dspace/bitstream/2014/12810/1/01-1121.pdf
[2] J. Jurjens. “UMLsec: Extending UML for Secure Systems Development”. In Proc. of UML 2002,Number 2460 in LNCS, pp.412–425.Springer, 2002.
[3] T. Lodderstedt, D. Basin, and J. Doser. “SecureUML:A UML-Based Modeling Language for Model-Driven Security”. In Proc. of 5th Int.Conf. on the Unified Modeling Language, Number 2460 inLNCS.Springer, 2002.
[4] P Clements Bass, R Kazman. “Software Architecture in Practice”,Second Edition, SEI Series inSoftware Engineering.
[5] http://www.indusintelligence.com/IIP_SecThreats.aspx
[6] Chenxi Wang, William A. Wulf. “Towards A Framework For Security Measurement”, Department ofcomputer science University of Virginia.
[7] Cristian Oancea , “Integrating Security Policy Design in the Software Design”. www.inf.fu-berlin.de/inst/instpub/exposeDok/exposeOancea.pdf,2003 last accessed on 1.12.2012
[8] Jerry Saltzer and Mike Schroeder. “The Protection of Information in Computer Systems”, Proceedingsof the IEEE. Vol. 63, No. 9 (September 1975), pp. 1278-1308.
[9] Collaboration in Secured development process part2. Information Security Bulletin, July 2004.
[10] Paolo Falcarin and Maurizio Morisio. “Developing Secure Software and Systems”, Control and ComputerEngineering Dept.Corso Duca degli Abruzzi, 24I-10129.
[11] ISO/IEC. ISO/IEC 13335: Information Technology- Guidelines for management of IT Security, 2001.
[12] Jan Jurjens. “Secure Systems Development with UML”,2005.
[13] Tool for automatic J2EE deployment of secure UML, http://www.iosoftware. com/products/data/mda_security_factsheet_020902.pdf
[14] Ministry of Defence. Defence Standard 00{56 issue 2: Safety Management Requirements for DefenceSystems, 1996.
[15] Improving Security across SDLC ,Task Force Report 2004
[16] Computer Knowledge: http://www.cknow.com/vtutor/SoftwareThreats.html
[17] Steven F Burns.Threat Modeling: A Process To Ensure Application Security, January 2005,http://www.sans.org/rr/whitepapers/securecode/1646.php
[18] Dr. Daniel Guinier. Object-oriented software for auditing information systems security following amethodology for IS risk analysis and optimization per level

84 Journal of Indian Research
[19] Marianne Swanson. Security Self-Assessment Guide for Information Technology Systems. NIST.Nov2001
[20] A. S. Sodiya, S. A. Onashoga, and O. B. Ajayi. “Towards Building Secure Software Systems”,University of Agriculture, Abeokuta, Nigeria.
[21] Erich Gamma, Richard Helm, Ralph Johnson, John Vlissides. “Design patterns: Elements of ReusableObject oriented Software”, Additon –Wesley 1995
[22] Tim Grance,Joan Hash,Marc Stevens. Recommendations of the National Institute of Standards andTechnology. NIST(National Institute of Standard and Technology)
[23] Improving Security Across Software Development Life Cycle. Task Force Report April 1 2004.
[24] James H Stock and Mark W. Watson. Introduction to Econometrics. Pearson Education, Boston, MA,2003.

Volume 1, No.1, January-March, 2013 85
Journal of Indian Research, Volume 1 No. 1, 2013, 85-90
Computer Science
MULTI STAGE SOFTWARE PROJECT EFFORTS ESTIMATION
Chetan Nagar*, Dr Anurag Dixit**
ABSTRACT
The staff resources or effort required for a software project are notoriously difficult to estimate inadvance. Accurate effort estimation is essential for the success of a software project. In practice; manyindustries still use ad hoc methods for efforts estimation. Efforts estimation is an activity performed inanalysis phase of software development. All the requirements are not exactly known in this phase,because user exactly does not know what he wants and developer does not know what is to be built.Lot of changes take place in latter phases of development, due to this reason effort estimation failed.Unclear requirement is a measure problem in efforts estimation. This paper aims to suggest a newapproach of multistage efforts estimation. We intend to perform efforts estimation in more than one stepof software development and check the difference to establish optimal level of manpower required for aproject.
Keywords: KLOC (Kilo Line of Code), UCP (Use Case Point), FP (Function Point), . Software Effortsestimation, Person-month, Man-Hours
INTRODUCTION
In examining the assumptions and construction of typical cost estimation methods, two factors are often themajor constraints for software project to meet the success criteria, i.e. on time, within budget, and withoriginally-specified functionalities. Effort estimation in practice usually rely on human domain experts, whooffer estimations based on their experiences with similar projects in past, and estimation quality thus dependson personal experiences and subjective judgments, which tend to result in unstable or even poor estimationaccuracy[1].
Various methods are followed in SDLC for software development and design with different phases. Braude, J.E., (2010) [8], Conger, Sue. (2008) [9], Sommerville, Ian., (2009) [10], Hoffer et al (2009) [11] had discussedthe software development life cycle in detail. But the major phase identified common to all these methods are:Planning, Analyzing, Designing, Testing and Implementing and Maintenance. In analysis phase, the userrequirements, system requirements, domain requirements, cost requirements and various other requirements ofdeveloping and designing software are studied and analyzed.
METHODS FOR ESTIMATION
In general following methods are more popular for efforts estimation.
A. COCOMO Model [4][5].
B. Function Point Based Estimation [5][1].
*Chetan Nagar is Ph.D scholar in Mewar University (Gangrar) Chittodgarh Rajasthan India([email protected])
**Dr Anurag Dixit is Dean-Professor (CS/IT) BRCM CET,Bahal Bhiwani ( e-mail: [email protected])

86 Journal of Indian Research
C. Use Case Point Based Estimation [6][14].
D. Expert Judgment. [7].
E. Estimation by Analogy [7].
F. Parkinson’s principle
G. Software Efforts Estimation using Soft Computing Techniques.
H. Software efforts estimation using Neural Network Techniques.
There are lot of methods which can be use for efforts estimation, but an industry wants a simple and accurateway of efforts estimation. We must use more calculative method as compare than more predictive approach.COCOMO and Use Case Point are more calculative approach which is covering many factors that mayaffect the cost. But Expert judgment and Analogy based estimation is more predictive approach, in whichmuch experience is required. A rich set of old data is required for better estimation.
A. COCOMO (Cost Construction Model)
COCOMO is one of the popular and old models of efforts estimation. In this model we have to estimate theline of code. Counting of line of code is one of the difficult tasks when project is complex and new to us. Insuch situation we have to divide that project in module and divide that module into sub module to makeproblem less complex. Most senior person of your team should take responsibility to count KLOC, because weneed to estimate KLOC before writing it. We can use old data to predict KLOC, but no project will completelysame with previous project, so some intelligence and experience will be required for a better estimation. Herewe will use advance COCOMO for estimation.
Efforts = a*(KLOC)b *EAF
Here a and b are complexity factor.
TABLE I
COMPLEXITY FACTOR
Model A B
Organic (simple in terms of size and complexity 3.2 1.05
Semi-ditched ( average in terms of size and complexity) 3.0 1.12
Embedded ( Complex) 2.8 1.20
In Intermediate COCOMO only 17 EAF are used, but in advance COCOMO we are using 22 EAF. Typicalvalues for EAF range from 0.9 to 1.4.
B. Function Point based Estimation
The steps for counting function points are as following:
1. Identify data functions (External Interface files and Internal Logical Files) and rate them.
2. Identify transaction functions (External Input, External Output and External Inquiry) and determine thecomplexity.

Volume 1, No.1, January-March, 2013 87
3. Compute unadjusted function points. Number of EI, EO, EQ, ILF and EIF for each complexity level(Simple, Average and Nominal) is obtained and the corresponding weight for each complexity level ismultiplied with the count to finally get the unadjusted function point count. Details of function point countare available in appendices.
4. Determine the ratings of 14 general system characteristics.
5. Calculate value adjustment factor (VAF).
VAF = (TDI * 0.01) + 0.65
Where, TDI = Total Degree of Influence obtained by multiplying the ratings of general system characteristics.
6. Compute function point counts.
C. Use Case Point Approach
It is another popular and efficient method of efforts estimation. Here we will calculate use case and actors
UUCP=Use cases + Actors
Where UUCP stands for Unadjusted Use Case Point Using the following table1 we can calculate Use Caseused in a project
TABLE II
USE CASE CALCULATION
Use case type Description Quantity Weight Factor Sub total
Simple 3 or fewer transaction 1
Average 5 to 7 transaction 5
Complex Greater than7 transaction 10
TOTAL
By using the following table2, we can estimate actors used in a project
TABLE III
ACTOR CALCULATION
Use case type Description Quantity Weight Factor Sub total
Simple 3 or fewer transaction 1
Average 5 to 7 transaction 2
Complex Greater than 7 transaction 3
TOTAL
UCP=UUCP*TCF*EF
TCF is Technical Complexity Factor, which is sum of 13 complexity parameters; each factor is range from 1to 5 and multiplied by weight.

88 Journal of Indian Research
EF is Experience Factor, which is sum of 08 complexity parameters; each factor is range from 1 to 5 andmultiplied by weight.
Effort = UCP *ER (Efforts will be in man hours)
Finally, the UCP is multiplied by a historically collected data representing productivity, such as a factor of 20-staff hours per use case point, to arrive at a project estimate. The result is an estimate of the total number ofperson hours required to complete the project. Karner provided a detailed table describing how each factorwas determined and what value was assigned at each step [18].
D. Expert Judgment
This method involves consulting one or more experts. The experts provide estimates using their own methodsand experience. Expert-consensus mechanisms such as Delphi technique or PERT will be used to resolve theinconsistencies in the estimates.
E. Estimation by Analogy
This method requires one or more completed projects that are similar to the new project and derives theestimation through reasoning by analogy using the actual costs of previous projects. Estimation by analogy canbe done either at the total project level or at subsystem level. The total project level has the advantage that allcost components of the system will be considered while the subsystem level has the advantage of providing amore detailed assessment of the similarities and differences between the new project and the completedprojects. The strength of this method is that the estimate is based on actual project experience. However, it isnot clear to what extend the previous project is actually representative of the constraints, environment andfunctions to be performed by the new system
F. Parkinson’s Principal
Using Parkinson’s principle “work expands to fill the available volume” [3], the cost is determined (notestimated) by the available resources rather than based on an objective assessment. If the software has to bedelivered in 12 months and 5 people are available, the efforts estimated to be 60 person-months. Although itsometimes gives good estimation, this method is not recommended as it may provide very unrealistic estimates.Also, this method does not promote good software engineering practice.
MULTISTAGE EFFORTS ESTIMATION
The first step of software development is requirement analysis. In this phase we have to collect the requirementsfrom the user, after completion of requirements analysis we have to estimate the efforts required to build theproject. Efforts estimation provides basis for the other software development activities like planning, Schedulingetc .As we know that efforts estimation is not an exact science, it is just a prediction. After completion ofproject we can exactly determine the efforts were required to build the project. Before that it is just aprediction, but as phases of the developments are passes accuracy of our prediction is increases .In the latterphase of development we can better estimate as compare than early phases of development.
In our approach first time we perform efforts estimation in analysis phase and second time after completion ofdesign and check the difference, if difference is more, than we have to adjust it in remaining developmenttime.
Every phase of software development required some amount of efforts to complete it. CSBSG data analysisshows a waterfall-based phase distribution scheme as: 16.14% for plans and requirements phase, 14.88% fordesign phase, 40.36% for code phase, 21.57% for test phase, and the other 7.06% for transition phase [13]. Inround figure we can write as 16% for plans and requirements phase, 15% for design phase, 40% for codephase, 22% for test phase, and the other 7% for transition phase

Volume 1, No.1, January-March, 2013 89
Consider an example. We performed efforts estimation for a project A in analysis phase and found 1000 man-hours required to build that project and we have divided it according to CSBSG 160 Man-Hours for plans andrequirements phase, 150 Man-Hours for design phase, 400 Man-Hours for code phase, 220 Man-Hours fortest phase, and the other 70 Man-Hours for transition phase.
Subsequently,we move for design phase. After completion of design, we again perform efforts estimation andfound that 1200 man-hours are required for building that project. At that time ,we have completed analysis anddesign phase. That means ,we have spent 372 Man-Hours instead of 310 Man-Hours.
Now we have to accommodate 828 Man-Hours into 690 Man-Hours. We can not increase the main hoursbecause in early estimation we had anticipated for 1000 Man Hours and we quoted the cost according to1000 Man Hours.Therefore, we have to reduce the loss by compensating 828 Man-Hours into 690Man Hours.
Logically, it not possible to accommodate 828 Man-hours into 690 Man-Hours .Following actions can be takento adjust these man-hours:
1. Increase working time of development team.
2. Increase team size.
3. Outsource some component.
RESULTS
In this paper, we have tried to throw a new concept to test and debate. Although, it is open to criticism thatwhy did we have to perform efforts estimation multiple times, but in works by R S Pressman, it is suggestedfor better estimation, delay efforts estimation until it is possible. Actually it is not possible, so the multistageefforts estimation can work as a substitute for it. We have applied this concept on some projects of a smallsoftware industry. First, we had estimated the effort after requirement analysis and then again estimated afterdesigning and we have found some difference. Company was not ready to display their result,the completedata is not being dispalyed .
CONCLUSION
Success of project (complete on time within budget) is dependant on various parameters like first clear andcomplete requirements, Use of a mature process for estimation and some strong monitoring policy.
This paper does not suggest any new model or method for the estimation. We are just giving one conceptwhich can allow professionals to complete the project on the time. Every model or method in the effortsestimation is based on the prediction .As the time goes by and we move towards completion of the project,our prediction becomes more accurate, because now we are familiar with most of the facts. This approachwill help us to complete the project on time. Although in this approach we have to perform estimation twotimes. But multiple time efforts estimation is much better than project slippage or failure
References:
[1] Bingchiang Jengi, Dowmimg Yeh, Deron Wang, Shu-Lan Chu. “A Specific Effort Estimation MethodUsing Function Point” Journal Of Information Science And Engineering, Vol.27, 1363-1376 (2011)
[2] Anda, B., Benestad, H.C., Hove, S.E. “A multiple case study of Effort Estimation based on UseCase Points”, Empirical Software Engineering, 2005.
[3] G.N. Parkinson, Parkinson’s Law and Other Studies in Administration, Houghton-Miffin, Boston,1957

90 Journal of Indian Research
[4] Roger E Masse “An Analysis of the Evolution of COCOMO and Function Points”. University ofMaryland, July, 1997
[5] Basavaraj M.J, Dr. K.C Shet “Empirical validation of Software development Effort multipliers ofIntermediate COCOMO Model” Journal of Software, Vol. 3, No. 5, May 2008.
[6] Anda, B., Benestad, H.C., Hove, S.E.: “A multiple case study of Effort Estimation based on Use CasePoints” Empirical Software Engineering, 2005
[7] http://www.scribd.com/doc/51198168/45/Expert-Judgment-Method
[8] Braude, J. E., Software Engineering – An Object Oriented Perspective – Wiley (2010)
[9] Conger, Sue., The New Software Engineering – Global Text (2008)
[10] Sommerville, Ian., Software Engineering – 8e – Pearson Education (2009)
[11] Hoffer, J. A., George, J. F., Valacich, J.S., – Modern Systems Analysis and Design – 5e – PearsonEducation (2009)
[12] As Karner G.. “Metrics for Objectory”. Diploma thesis, University of Linköping Sweden. No.LiTH-IDA-Ex-9344:21, December 1993
[13] Phase Distribution of Software Development Effort
[14] Clemmons R.: Project Estimation With Use Case Points, The Journal of Defense SoftwareEngineering, 2006
[15] Chetan Nagar and Dr Anurag Dixit, “Software Project Management with Control Based Monitoring”International Journal of Advances in Science & Technology, volume 3 No 4.October-2011

Volume 1, No.1, January-March, 2013 91
Journal of Indian Research, Volume 1 No. 1, 2013, 91-97
Computer Science
ESTABLISHING TRUST IN CLOUD COMPUTING
Shweta Agrawal*
ABSTRACT
Cloud computing delivers IT capabilities as services-on-demand. This scalable and plastic model providesadvantages like faster time-to-market, no capex and pay-per-use business model. While there areseveral such benefits, there are challenges in adopting public clouds because of dependency oninfrastructure that is not completely controlled internally and rather shared with outsiders. Severalenterprises, especially large ones that have already invested in their own infrastructure over the yearsare looking at setting up private clouds within their organizational boundaries to reap the benefits ofcloud computing technologies leveraging such investments. This paper describes the different optionsavailable, highlighting the key advantages and challenges posed by each and the approach enterprisesshould be taking in adopting cloud computing with minimal risk. In this article, we discuss the need forasking critical questions about the security implications of cloud computing. Answers to our questionsare not readily apparent, even though viewing computing as a utility, similar to that of providing wateror electricity on a for-fee basis, dates back to at least the 1960s.
Keywords:
DOD - Department of Defence
DISA RACE - Defense Information Systems Agency’s Rapid Access Computing Environment.
VoIP - Voice over Internet Protocol
DHS - Department of Homeland Security
CSA - Cloud Security Alliance
1. INTRODUCTION
In the aptly titled article, “Cloud Assurance Still Missing,” Allan Carey wrote, “The security problems thatorganizations face related to cloud computing are the same as those related to virtualization—but even moreso.” [1] He goes on to say, “Information assurance practitioners already have most of what is needed to makean informed set of decisions about cloud computing.” [2] We would argue that the security problems go wellbeyond the use of virtualization in distributed systems. In this article, we discuss the need for asking criticalquestions about the security implications of cloud computing. Answers to our questions are not readilyapparent, even though viewing computing as a utility, similar to that of providing water or electricity on a for-fee basis, dates back to at least the 1960s. [3]
A recent technical report published by the University of California, Berkeley, states that there is no commonlyagreed upon definition of cloud computing. [5] Instead, a definition is emerging as the various organizationsthat are developing cloud service evolve their offerings. In addition, there are many shades of cloud computing,each of which can be mapped into a multidimensional space with the dimensions being characteristics, servicemodels, and deployment models. [6]

92 Journal of Indian Research
*Shweta Agrawal, Asst. Professor, Northern Indian Engineering College, FC-26, Shastri Park, New Delhi-110053, (Mobile)-9312699993, (Home)-0120-4554846, [email protected]
Cloud computing is a metaphor for giving Internet users a growing collection of computer system resourcesand associated software architectures to provide application services. [7] The applications include processingand application integration, storage, and communications services. Cloud services are typically available ondemand and are charged on a usage basis. Often, what the user sees is an application instead of a particularcomputer.
The services are commonly described as:
• PaaS (Platform as a Service)—the cloud provides hardware resources, typically virtual machines, whichcan be loaded with the users, operating system and software;
• IaaS (Infrastructure as a Service)—the cloud provides an infrastructure including (virtual) platforms,networking, etc. on which applications can be placed;
• SaaS (Software as a Service)—the cloud provides software applications.
Amazon’s Elastic Compute Cloud (EC2) is an example of these services. [8] Google also provides enterprise-level integrated application services such as email, appointment calendars, text processing and spreadsheets. [9]
The claimed advantages for an enterprise are that it does not require an investment in computer resources,infrastructure, administration, etc.: the purveyor of the cloud provides these resources. The user or enterpriseonly pays for the resources “consumed.” In the Department of Defense (DoD), we have seen the introductionof infrastructure services on demand provided by the Defense Information Systems Agency’s Rapid AccessComputing Environment (DISA RACE). [10] Where available, the cost of developing and maintaining specializedapplications can be shared among the users of that application. In theory, there is an advantage in havinglarge-scale resources shared among a large class of users.
However, this has yet to be borne out. [11] There are, of course, applications that require a large number ofresources. Google Search is one such example. It appears that Google, Amazon, and others are attempting toleverage their ability to construct such a system into other environments.
We can argue that it is not a matter of whether cloud computing will become ubiquitous but rather what wecan do to improve our ability to provide cloud computing users with assurance that the cloud services andinfrastructure provide appropriate security functionality. Cloud computing providers should supply their customerswith an appropriate level of security transparency to alleviate customers’ reservations about the security andprivacy afforded by the cloud. [12] How much transparency is enough? How do we provide for transparencyof cloud resources (i.e. determining the cloud in which customer data resides)? Is there a tipping point atwhich additional levels of transparency would only serve to help malefactor’s compromise services and datacenters?

Volume 1, No.1, January-March, 2013 93
Fig : 1 Process for Integrating Security into the Cloud
In addition, as users and developers find new ways of applying cloud technologies, there will be newexpectations about security and privacy. For instance, Twisted Pair Solutions of Seattle proposes to providecloud computing resources for state and local agencies to link up disparate public safety radio systems (e.g.,police, fire, or ambulances)—a novel but difficult-to-predict usage of cloud computing, but also a usage thatmakes the cloud part of mission- and safety-critical systems. [13] The expectations for security, privacy,reliability, and quality of service and so on will be different in some respects for Voice over Internet Protocol(VoIP) radio systems than for the cloud’s social networking aspects. This raises the question: how do wemanage risk when we do not fully understand what we are trying to protect or guard against?
The fluid nature of cloud computing makes it a moving target, even when trying to determine the questions weshould be asking to improve the security and privacy clouds afford. However, we can ask fundamentalquestions like: are the current architectures adequate for building trusted clouds? If not, what types ofsoftware system architectures do we need? Consider, for instance, the possibility that an organization mightopt to fully outsource its computing infrastructure and data center to the cloud, retaining only thin clients withinthe organization. How do we make the thin client user terminals and the communications infrastructuresecure?
2. DOD ENTERPRISE COMPUTING
What is our motivation for jumping feet first into asking hard questions about cloud computing? The growingimportance of cloud computing makes it increasingly imperative that security, privacy, reliability, and safetycommunities grapple with the meaning of trust in the cloud and how the customer, provider, and society ingeneral gain that trust. Consider the initiative of the DoD Enterprise Services & Integration Directorate tomake the DoD Storefront Project a reality. The Storefront consists of a cloud-based set of core and specializedapplications that users can discover through an application marketplace and which share an identity managementframework. How will DoD provide security for the Storefront? It is more than a matter of having an identitymanagement framework. The obvious security concerns include data integrity, data availability, and protectionof personally identifiable information, data protection, data destruction, and communications security.
Moving beyond the Storefront concept, as the federal government migrates its data and applications to thecloud, issues regarding cross-domain resource sharing will arise within the cloud. For instance, how will DoDlink its clouds to those of other agencies? Will a DoD user, authenticated to enter the DoD cloud sphere, betrusted to access services owned by the Department of Homeland Security (DHS)? Is there a need for afederal-wide cloud infrastructure and common set of security services? How will data be shared among thevarious different types of cloud?
3. INFORMATION ASSURANCE
At the Naval Postgraduate School, a major thrust of research on cloud computing is to investigate the securitypolicies, models, and appropriate architectures to provide security for entities/users of cloud computing resources.Although cloud computing may appear to provide reasonably well understood operating system and applicationresources, cloud resources are distributed in space, time, and scale in ways that were never envisioned in theoperating-system world. The current architectural approaches, especially those concerning security, may notscale to the much larger cloud computing approaches. In addition, the approaches for assuring operatingsystem security functionality are not necessarily appropriate. It is unclear whether the current set of servicesis sufficiently secure and reliable for use in sensitive government environments. Current security claims aresomewhat limited.

94 Journal of Indian Research
One of the fundamental problems with adopting cloud computing is providing not only security resources butalso assurances that those resources are correctly implemented and maintained within the cloud. Severalvendors have formed the Cloud Security Alliance (CSA). [14]
In the report titled Security Guidance for Critical Areas of Focus in Cloud Computing V2.1, CSAprovides its take on some of the security issues related to cloud computing. [15] In the report, securityproperties are described as essentially the same set of properties that a user expects to see with a self-hostedsystem. These include the usual:
• Identification• Authentication• Privacy• Integrity• Provision of Service.
They view assurance as an audit of the function’s implementation, that is, the cloud systems’ administratorsand implementers have used ‘best practices’. Other than the notion that encryption is used to protect the data,there is little information that defines ‘best practices.’ There is, however, some form of key managementincluded that provides potentially strong identification/authentication, as well as some form of data integrity/recovery facility.
The security architecture proposed is essentially a layered operating system application. It consists of anetwork layer interposed between application programming interfaces (APIs) and the underlying operatingsystem infrastructures. ‘Trusted computing’ is only mentioned at the hardware/operating system level. Additionally,the CSA paper enumerates several security issues that should be addressed by the cloud-style serviceprovider, but does not provide any insight on security policies/models, interfaces or potential solutions.
To provide an example of some of the potential issues, Google supports “Google Apps.” [16] Google Appsapplies the usual discretionary access controls to the resources it provides – files, calendars, address lists, etc.To make life easier, Google provides tools that integrate their identification and authentication systems into theenterprise providing single sign-on; the enterprise user need only log onto their home system. Once logged on,the enterprise user can automatically access the users’ files and services on Google without an additional login.Although convenient, this functionality increases the security exposure to not only the weakness of theenterprise system, but also to the weakness of Google’s infrastructure. If, for example, Google’s infrastructurehas a security flaw, then it may be possible for someone in one enterprise to access accounts from anotherenterprise.
On the other hand, security flaws in the enterprise system may lead to weaknesses in the access controls ofthe information managed by Google Apps. Additionally, connected applications may provide unintended connectionsamong users, as was demonstrated with the introduction of Google Buzz. [17]
When each enterprise maintains its own infrastructure, a failure in one enterprise may cause failures acrossthe cloud. Unless an enterprise uses a single cloud from a single vendor, integrating the various applications,infrastructures, and policies among many different clouds and cloud vendors will be a significant challenge. Infact, it will be a challenge to ensure that the different policies do not contradict and potentially permit accessthat should not be allowed at the system level.
Ultimately, the proof is in the pudding. Will the cloud vendors be willing to stand behind the security of theirsystems? In the case of Amazon’s EC2 and Simple Storage Services (S3) services, Amazon suggests thattheir EC2 and S3 infrastructure not be used for systems that must satisfy the Payment Card Industry SecurityStandards [18], although it has published a paper on how Amazon Web Services can be used in a HealthInsurance Portability and Accountability Act (HIPAA) compliant environment. [19]

Volume 1, No.1, January-March, 2013 95
In the HIPAA paper, Amazon essentially places almost all the requirements on the “user/enterprise”to encryptall the data stored and to manage its keys. Amazon provides services to log safely into its systems and providesome data recovery and integrity.
In the realm of reliability, prior to the breakup, AT&T was required to build systems that had an up-timereliability of “five nines” (about 5.2 min/yr downtime). Part of the reason for this was to ensure services incase of national emergency. Current cloud based systems are advertised as providing “three nines” (almost 9hrs/yr downtime). [20]
4. DETERMINING WHERE TRUST SHOULD BE PLACED
Clearly, there are many challenging security issues related to cloud computing. In our research, we areworking on a formal, structured, possibly mathematical approach that will give users and cloud-developersdeeper insight into what should be done, how it might be achieved, and where the trust should be placed. Thisresearch includes the investigation of implementation structures and assurance provisions for “security” incloud-based systems. To do this, we will attempt to provide security architectures and models that satisfy thefollowing: Awareness of the amorphous nature and scale of the cloud computing paradigm, inclusion ofmathematical models of the security properties that can be used to help analyze those properties, provision ofthe underpinnings on which applications/enterprise/user level security policies/properties can be implemented.and provision of the foundations on which the implementation assurances can be ascertained.
Our hope is that the results of the research will provide a framework that can be at least partially applied tothe current cloud architectures and may lead to new architectures with better defined, more assured security.
Over the past 30-plus years in the operating system security world, a lot of work has been done to providehighly assured components with trustworthy systems. Unfortunately, the commercial world has ignored a lot ofthis work. Recent efforts have focused on the use of separation kernels. For example, Green Hills hasrecently received a National Information Assurance Partnership (NIAP) certificate for its Integrity 178BSeparation Kernel. [21] Separation kernels provide a minimal set of operating system services on which othertrusted services and applications could be built. These may be thought of as slightly more functional than aVirtual Machine Monitor (VMM), although Green Hills and others are looking to implement high assuranceVMMs using their technology.
Our approach to the problem involves separation of ‘virtual’ resources. This approach constructs an infrastructurethat establishes (or reconstructs where appropriate) resources, identifies and authenticates users, and thencontrols access to the resources. Our focus is to provide a model and a security architecture that provides theinfrastructure that will accomplish these goals.
4.1 An Example
For instance, consider PaaS. An enterprise might wish to run its own applications. These applications may onlyrun on an intermittent basis and/or require a large number of resources. One way to achieve this is to use acloud PaaS.
We use the term ‘enterprise’ to describe the organization requiring the platform and ‘provider’ for theorganization providing the cloud platform resources. The PaaS provider would provide ‘platforms,’ either ‘real’as part of a virtual environment (a means for downloading an operating system and for managing theplatforms), or as a possible network interface(s) on the platform(s). The enterprise loads operating systems,applications, etc., onto the platform(s) and manages all the interfaces and resources provided. The examplebelow assumes that multiple platforms will be used.
The security policy visible to the user includes:
• Identification—A set of platform names issued by the provider (unique to the enterprise)

96 Journal of Indian Research
• Authentication—A secure channel that can be used to load the operating system(s) onto the platforms—the provider is trusted to ensure that the only communication with the platforms is from or to theenterprise.
• Integrity— The provider should guarantee that the resources are “empty” on first use and that none ofthe platform resources are modifiable by any party other than the enterprise. This includes any managementfunctions; it is up to the enterprise to ensure that any network interfaces are appropriately protected.
• Privacy—The provider should guarantee that there is no third party access to the platform processor,memory, and/or disk files.
• Provision of Service—The provider should provide access to the resources on demand, per any servicelevel agreements between the enterprise and the provider.
4.2 With at least two models of this kind of service
1. Resources are provided on an ad hoc, intermittent basis. In this version, there is no connection betweenconsecutive uses of the resources. The enterprise uses the resources once. During subsequent uses, theenterprise assumes that all the previous data does not exist or has been erased by the provider. The onlyconnection between the two usages is that the enterprise uses the “same identifiers” to access newinstances of the resources. There is no guarantee that the same physical resources will be used for eachrun of the platform(s).
2. The enterprise ‘turns off’ the platform, but in subsequent use after turning it back on, finds the platformresources in the same state they were in after being turned off. As expected, the enterprise might paymore for this service. In this case, the provider must protect the information in the resources between runsfrom both modification and access by third parties. There is no guarantee that the same physical resourceswill be used in each run of the platform.
(Note that in both cases, the provider provides access to platforms and associated data. Theplatforms are available to others when the enterprise is not using them. Any provider configurationdata about the platforms must be protected from modification and, in the second case above,any enterprise information that will be reused must also be protected)
Informally, a portion of the model might then take the form of:
• VPlatform—The set of names of virtual platforms that will be provided to enterprises
• VPlatformType—Whether the VPlatform resources are persistent (type 2 above) or not
• VPlatformResource—The set of resources associated with a VPlatform
• Enterprise—The set of enterprises that use VPlatforms
• Allocation—An association of an Enterprise with a Platform, VPlatformType and VPlatformResources.The same Enterprise may have multiple VPlatforms, and VPlatformResources associated with it
• PlatformCloud—A sequence of sets of Allocations.
The security properties then become statements about the resources and platforms.
For example:
No pair of allocations shares any common VPlatforms or VPlatform Resources. As depicted in Figure 1, thesecurity properties can be modeled on a collection of the statements above. Each of the statements shouldmap back to some aspect of the system’s user-visible security property. We could use our statements aboutthe relationships of the entities (sets) we describe to prove additional properties of the system.

Volume 1, No.1, January-March, 2013 97
Following the security model’s construction, a high-level execution model should be constructed and validatedmathematically to determine that it satisfies our security model. Next, it is necessary to map our high-levelmodel to varied cloud aspect implementations as documented by the vendors.
5. CONCLUSION
Cloud security is an ill-defined, little-understood area of distributed computing. However, we believe thatprogress can be made to provide a level of assurance that accommodates the resources needed to supportgovernment’s information processing requirements.
6. References
1. IA Newsletter, vol. 13, no. 1, winter 2010, p. 34.
2. Ibid.
3. M. Campbell-Kelly. “The Rise, Fall, and Resurrection of Software as a Service: A Look at the VolatileHistory of Remote Computing and Online Software,” Communications of the ACM, vol. 52, no. 5, pp. 28–30, May 2009.
4. B. Michael. “In Clouds Shall We Trust,” IEEE Security & Privacy, vol. 7, no. 5, p. 3, September/October2009.
5. M. Armbrust, A. Fox, R. Griffith, A. D. Joseph, R. H. Katz, A. Konwinski, G. Lee, D. A. Patterson, A.Rabkin, I. Stoica, and M. Zaharia. “Above the Clouds: A Berkeley View of Cloud Computing, “ EECSDepartment California, Berkeley. Technical University.
6. P. Mell and T. Grance, “The NIST Definition of Cloud Computing,” Version 15, 7 October 2009, http://csrc.nist.gov/groups/SNS/cloud-computing/cloud-def-v15.doc.
7. http://en.wikipedia.org/wiki/Cloud_computing.
8. http://aws.amazon.com.
9. http://docs.google.com.
10. http://www.disa.mil/race.
11. H. G. Miller and J. Veiga. “Cloud Computing: Will Commodity Services Benefit Users Long Term? IEEEITPro, vol. 11, no. 6, p. 67-69, November/December 2009.
12. http://www.opencloudmanifesto.org.
13. http://www.fcw.com/Articles/2009/04/16/Cloud-computing-moving-into-public-safety-realm.aspx.
14. http://www.cloudsecurityalliance.org.
15. http://www.cloudsecurityalliance.org/csaguide.pdf.
16. http://www.google.com/apps.
17. http://www.nytimes.com/2010/02/15/technology/internet/15google.html.
18. http://www.mckeay.net/2009/08/14/cannot-achieve-pci-compliance-with-amazon-ec2s3.
19. http://awsmedia.s3.amazonaws.com/AWS_HIPAA_Whitepaper_Final.pdf.
20. http://www.google.com/apps/intl/en/business/infrastructure_security.html.
21. http://www.niap-ccevs.org/cc-scheme/st/vid10119/maint200

98 Journal of Indian Research
Journal of Indian Research, Volume 1 No. 1, 2013, 98-104
Psychology
PARENTING AND ADOLESCENT BEHAVIOUR : FEEDBACK FROM THE CLASSROOM
Dr. Raju Narayana Swamy*
ABSTRACT
The foremost task of parenting is adequate socialization of children. The functions of parentinggreatly control how children grow up and mature. This task requires parental expectations and guidancethat change with the development of the child to support positive child outcomes. Among the mostpowerful predictors of mental health problems among adolescents are poor family relationships. Sincethe early nineties, quantitative empirical studies have been performed to assess the level of parents’involvement. Knowing what motivates some children with behaviour problems in the classrooms canhelp educators and parents deal with the situation and move towards a positive outcome. This studyuses qualitative measures for parent involvement analysis. In general, the results of the current studydid not support that the authoritative parenting style would be negatively related to children’s intrinsicmotivation. Adolescents from disengaged homes were less interested in studies and less successful inschool.
Keywords: parenting, mental health, children, adolescent, behavioural problems
INTRODUCTION
Parents are defined here broadly to encompass all those adults vested with the responsibility of raisingchildren, whatever be their biological relationships to the children, including immediate and extended familymembers or kin, step-parents, guardians, foster parents and tribe and clan members (Simpson, Rae, 2001).There is considerable steadiness across studies about the basic correlation between parent-child relationshipquality and child outcomes. Meta analysis and conceptual reviews of the literature have reached a similarview. There are indications that certain dimensions may play an especially important role in some outcomes,such as over protective parenting for anxiety or monitoring/control for misbehaviour (O’ Connor Thomas G.,& Stephen B.C. Scott (2007). Parent-child relationship quality is related with a striking assortment ofdifferent child outcomes. Behavioural/Emotional outcomes have attracted much of the attention, but there isalso strong evidence concerning multiple aspects of psychological, social, educational, intellectual and physicalhealth. It is profitable for basic and applied research to undertake the assessment of the variety of outcomesamong the children.
PARENTING
Parenting is a multifaceted activity that includes many specific behaviours that work individually andjointly to influence child outcomes. The primary role of all parents is to influence, teach and control theirchildren. Parenting style is meant to describe ordinary variations in parenting. For most children aged 10 to 16years, the family remains the proximal background of development inspite of the increased salience of schools,peers and communities. They want to feel accepted by their parents and to be able to share with them theproblems and issues in their lives (Richardson, A. Rhonda, 2004). There are several parenting techniques
* Dr. Raju Narayana Swamy is an IAS officer from Kerala cadre. He is the winner of the Kerala Sahitya Akademi awardfor his travelogue, Santhimantram Muzhangunna Thazvarayi.

Volume 1, No.1, January-March, 2013 99
that have a greater impact on a child’s behaviour. The largest is parental support. In multiple studies, it hasbeen found that the support from parents bonds the adolescents with institutions and builds their self-control(Baenes et al 2006)
CONSEQUENCES FOR CHILDREN
Adolescence is a special developmental period that is considered more difficult for both parents and adolescentsdue to multiple changes (Arnett, 1999). During this period, children experience biological, cognitive, social, andschool changes, in addition to the relational changes between parents and adolescents (Xiong, Zha Blong &others, 2008). Parenting style has been found to predict children’s well-being in the domains of socialcompetence, academic performance, psychosocial development and problem behaviours. A major issueconcerning adolescence is the influence of parents on their development. The research based on parentinterviews, child reports and parent observations consistently finds:
• Children and adolescents, whose parents are authoritative, rate themselves and are rated by objectivemeasures as more socially and instrumentally competent than those whose parents are non-authoritative.
• Children and adolescents, whose parents are uninvolved, perform most poorly in all domains (Darling,Nancy).
In general, parental response predicts social competence and psycho-social functioning, while parental demandingis associated with instrumental competence and behavioural control (i.e., academic performance and deviance).The above findings indicate: “Children and adolescents from authoritarian families are more likely to beinvolved in problem behaviour and perform less well in schools.” Adolescence problem behaviours areassociated with a host of negative social outcomes. Poor social skills, academic under-achievement, lack ofparental guidance have been identified as risk factors for problem behaviour (Hawkins and Weis, 1985;Steiberg, 1990). Adolescents, whose parents are involved and supportive, are at a lower risk of engaging inproblem behaviour than adolescents whose parents are uninvolved and unsupportive (Baumrind, 1991;Steinberg, 1990).
Odebumi’s (2007) study has shown that a large percentage of problem behaviour come from homes thatlacked normal parental love and care. Attention, love and warmth go a long way in assisting the child’semotional development and adjustment. Children at adolescence need parental love, care, affection and seriousconsideration to adjust sufficiently, in the environment in which he/she lives. Parents have foremost roles toplay in the tuning process of a teenager. The behavioural problems are mostly rooted in their homes (Onyechiand Okere, 2007). Otuadah (2006) found that when the relationship between the parents and the adolescentis tepid, it creates a strong background for the progress of children. The ignored adolescent slowly becomes ahardened criminal, violent, agitated, or a cultist. Ukoha (2003), Onyewadume (2004) and Otuadah (2006)observe that parents spend little or no time at home to assist in the upbringing of the children. The childreninvariably fall into evil associations.
METHOD AND PROCEDURE
Since the early nineties, quantitative empirical studies have been conducted to assess the level of parents’involvement. The main objective of this study is to determine the relationship between parenting and adolescents’problem behaviour in schools. The hypotheses tested includes “Of the different variables like negativeparenting, peer group influence and school atmosphere, child problem behaviour is an outcome ofneglect from parents and poor performance of teachers in the class rooms” and “Children from poorparenting families show problem behaviours in schools”. The above study uses qualitative measures forparent involvement analysis. The sample of the study consisted of 100 teachers who were drawn from three

100 Journal of Indian Research
schools (CBSE) from Thiruvananthapuram district, Kerala. The teachers are teaching in higher secondaryclasses. Data collection was done through simple random sampling technique. The Behaviour ProblemQuestionnaire was developed by the researcher for data collection. Personal data of the students werecollected from concerned class teachers. The items of the questionnaire were generated through review ofsome studies on behaviour problems and pilot study. Interviews of students on behaviour problems of childrenwere also included.
DATA COLLECTION
Copies of the questionnaire were distributed for completion. Analyses were carried out by scoring 4,3,2,1 for“Strongly agree”, “Somewhat agree”, “Somewhat disagree” and “Strongly disagree”, respectively. Thefocus of most contemporary developmental researchers, however, is on how parents and peers jointly influenceadolescents. In this study, we examined how parenting is related to behavioural problems among adolescents.Children in classrooms can misbehave in many ways, with common outbursts involving unnecessary noisemaking, fighting or using abusive languages against others. Such behaviours disturb smooth learning, whichreduces the gain from classrooms. Serious signs of behaviour problems in the classroom include destructiveness,lack of understanding or accountability, and disregard for classroom rules. These signs may point to behaviouralchaos that requires association of both the parent and the teacher to add to the remedial process to hold upand direct the child.
Table 1: Behavioural problems of children identified
Sl. Response Strongly agree Somewhat agree Somewhat disagree Strongly disagree Total
No. (Value-4) (Value-3) (Value-2) (Value-1)
1. Noise making
Frequencies 83 7 10 0 100
Mean 3.73
2. Fighting/using abusive languages in SchoolsFrequencies 10 22 60 8 100
Mean 2.56
3. Lateness to schoolFrequencies 7 3 81 9 100
Mean 3.57
4. LyingFrequencies 80 7 10 3 100
Mean 3.64
5. Using low-rise trouser
Frequencies 83 10 7 0 100
Mean 3.76
6. Absenteeism
Frequencies 13 27 60 0 100

Volume 1, No.1, January-March, 2013 101
Mean 2.53
7. Changing of exam marks
Frequencies 73 27 0 0 100
Mean 3.73
8. Changing of seats while teaching
Frequencies 73 27 0 0 100
Mean 3.73
9. Disobedience to teachers
Frequencies 93 7 0 0 100
Mean 3.93
10. Using cigar/pan/liquor
Frequencies 37 12 51 0 100
Mean 2.86
11. Wilful disturbance in class/school assembly
Frequencies 79 21 0 0 100
Mean 3.79
12. Sex-related issues
Frequencies 22 7 71 0 100
Mean 2.51
Source: Field Survey N=100
Hirschi’s social bonding theory examined attachment to parents and to peers, finding inverse relationshipsbetween both measures and misbehaviour. If the weakening of the bond is seen as a releasing mechanismallowing for deviant behaviour, Hirschi (1969) indicated that those adolescents with affective ties to healthypeers as well as parents should be less likely to commit deviant acts. From Table 1, those issues with meanvalue >3 were identified as serious behavioural problems. The most frequently occurring issues are changingof seats while teaching, changing of exam marks, noise making and low waist trouser. One of the problemsthat school officials have with boys is that of exposure due to wearing low-rise pants. There is no way to sitdown when wearing deeply dipping pants, which will not expose the derriere almost entirely. Boys sitting inclass with exposed backsides are certainly a distraction for other students - especially girls. Problems can alsooccur when a boy bends down to pick something up off the floor or even to tie a shoe. These pants also havea tendency to slide down and must frequently be pulled up. All in all, they are not comfortable to wear. Theschool authorities have strictly indicated that no one will be allowed to wear pants that expose underwear. Butour study reveals that a low-rise pant is one of the serious behavioural problems shown by the boys.
The finding, such as noise-making/changing seats while teaching was rated the highest, among the 12 behaviourproblems. It suggests that students may either not be adequately engaged in both curricular and extra-curricular activities in school or that they lack interest in class work. Teachers should be adequately trainedand motivated to meet the challenges posed by the education of students at the higher secondary level. Fromthe above analysis, the first hypothesis: “Of the different variables like negative parenting, peer groupinfluence and school atmosphere, child problem behaviour is an outcome of neglect from parents andpoor performance of teachers in the class rooms” is accepted.

102 Journal of Indian Research
The behavioural problems perceived by teachers as “not frequently” occurring include sex-related issues,absenteeism, using cigar/pan/liquor, fights in schools, etc. There is a strong and well-established link betweenadolescent’s association with deviant peers and externalising problems such as drug use and delinquency(Galambos, L., Nancy & others, 2003). The mean value for bad peer influence as rated by the teachers inTable 2 strongly agrees with the above. Without a strong attachment with parents, an adolescent will begin toassociate in deviant peers. Such peers pressure the adolescents to begin or continue involving in deviantactivities.
The perceived causes of behaviour problems among children were also identified from the teachers. Most ofthe issues highlighted include broken home, bad peer influence; neglect by parents, over-caring and neglects ofbad behaviour of their children (Table 2). The mean responses of the teachers ranged from 2.21 to 3.93. Theranking of the perceived causes of behaviour problems revealed that broken home, neglect by parents and badpeer influence are among the most common perceived causes of behavioural problems.
Table 2: Problems identified by the teachers
Sl. Response Strongly agree Somewhat agree Somewhat disagree Strongly disagree TotalNo. (Value-4) (Value-3) (Value-2) (Value-1)
1. Broken home
Frequencies 83 12 5 0 100
Mean 3.78
2. Bad Peer influence
Frequencies 80 7 10 3 100
Mean 3.64
3. Neglect by parents
Frequencies 93 7 0 0 100
Mean 3.93
4. Neglecting the issues created by children
Frequencies 74 12 4 10 100
Mean 3.5
5. Non-cooperative attitude of parents
Frequencies 60 23 7 10 100
Mean 3.73
6. Poor school environment
Frequencies 23 7 38 32 100
Mean 2.21
Source: Field Survey N=100
From the above analysis, we find that teachers and parents play complementary roles. Parents should beregularly reminded of their role in the development of their children. Parental monitoring has proven one of thestrongest deterrents to adolescent association in almost any problem behaviour. The quality of parenting andfamily relationships was strongly associated with children’s behaviour. Indifferent parenting reduces the

Volume 1, No.1, January-March, 2013 103
availability of parental values to adolescents because it provides no clear standards and expectations fromwhich to infer parental values (Knefo, Ariel, & Shalom, H. Schwartz, 2003). Hence we could say thatindifferent parenting underlines accurate perception. From the above analysis in Table 2, the second hypothesiswhich states that “Children from poor parenting families show problem behaviours in schools” appearstrue. To prevent problem behaviour from appearing, parents must use effective discipline, monitoring andproblem solving techniques. Parents, who do not support positive behaviour and punish problem behaviour, aremore likely to experience weak bonds with their children.
CONCLUSION
The findings of the present study highlight significant relationships between parenting styles and children’sbehavioural problems. The present study supports the findings of various researchers which have shown therelationship between parenting and children’s behavioural problems. Parents affect their adolescent’s problembehaviours. Two factors have been identified that have the ability to aid in decreasing the problem behaviourrates. These include family/parents at one end of the spectrum and the school on the other, with an overallfactor of parenting. When there is no proper monitoring and adequate support from family, adolescents aremore likely to fall into behavioural problem. It can be deduced from the study that we need to re-examinebehavioural problems of children and develop proper approaches for their management. The parents shouldencourage and support the schools in maintaining the requisite discipline for effective learning. Much isrequired to be done at home as well as the school if we want adolescents to be sufficient in being self-controlled and properly accustomed in the social milieu.
References
Ariel, Knefo, & Shalom, H. Schwartz, (2003), ‘Parenting and Adolescents Accuracy in Perceiving ParentalValues’, Blackwell Publishing and Society for Research in Child Development, 74(2).
Arnett, J.J. (1999), ‘Adolescent Storm and Stress, reconsidered’, American Psychologists, 54(5)
Baenes, Grace M. & others (2006), ‘Effects of Parental Monitoring and Peer Deviance on Substance Useand Delinquency’, Journal of Marriage and Family, 68(4).
Baumrind, D. (1991) ‘Effective parenting during the early adolescent transition’, in Cowan, P. E. andHetherington, E. M. (eds), Advances in Family Research. Erlbaum, Hillsdale, NJ, pp. 111–163.
Hawkins, J. D. and Weis, J. G. (1985), ‘The social development model: an integrated approach to delinquencyprevention’, Journal of Primary Prevention, 6.
Nancy, Darling, ‘Parenting Style and its Correlates’, www.kidneeds.com, Accessed on September 23rd 2012.
Nancy, Galambos, L., & others, (2003), ‘’Parents Do Mater: Trajectories of Change in Externalizing andInternalizing Problems in Early Adolescence’, Child Development, 74(2).
Odebunmi, A. (2007), ‘Parenting: A Cross-Cultural and Psychological Perspective’, Abuja, (Afabunmi NigeriaLimited)
Onyewadime, M. A (2004), ‘Parents, Involvement of Housemaid in Home Reading in an African Setting:Current Trends and Implications’I.A. Nwazuoke, O. Bamgbose & O. A. Morokola (eds.), Ibadan OmoadePrinting Press.
Otuadah, C. E. (2006),’Parental Behaviour and Peer Group Influence as Correlates of Delinquent Behaviouramong Secondary School Students in Warri Metropolis’. Unpublished M.Ed Thesis of Delsu, Abraka.

104 Journal of Indian Research
Rae, Simpson, (2001), ‘Raising Teens’, Centre for Health Communications, Harvard School of PublicHealth.
Rhonda, Richardson, A. (2004), ‘Early Adolescence Talking Points: Questions That Middle School StudentsWant to Ask: Their Parents’, Family Relations, 53(1).
Steinberg, L. (1990), ‘Autonomy, conflicts, and harmony in the family relationship’, in Feldman, S. S. andElliot, G. R. (eds), At the Threshold: The Developing Adolescent. Harvard University Press, Cambridge,pp. 431–456.
Thomas G. O’ Connor & Stephen B.C. Scott (2007), ‘Parenting and Outcomes for Children’, JosephRowntree Foundation, York Publishing Services Ltd.
Zha Blong, Xiong, & others, (2008), ‘Adolescents’ Problem Behaviors and Parent-Adolescent Conflicts inHmong Immigrant Families’, Hmong Studies Journal, Vol. 9.

Volume 1, No.1, January-March, 2013 105
Journal of Indian Research, Volume 1 No. 1, 2013, 105-110
Education
PEDAGOGY OF MATHEMATICS:
ROLE OF TECHNOLOGY IN TEACHING-LEARNING MATHEMATICS
Dr. Neetu Chawla*, Ashish Kumar Mittal**
ABSTRACT
Technology has become an essential tool for doing mathematics in today’s world. It can be used in avariety of ways to improve and enhance the learning of mathematics. As National Council of Teachersof Mathematics (NCTM) (2000) highlights in its standards, technology can facilitate mathematicalproblem- solving, communication, reasoning and proof; moreover technology can provide students withopportunities to explore different representations of mathematical ideas and support them in makingconnections both within and outside of mathematics (NRC, 2000). What kind of technologies can beused as tools for learning and communicating mathematics? The use of technology when studyingmathematics is not a new issue, since humankind always has been looking for solutions to avoid timeconsuming routine work. Maybe the definition of routine work has changed, since the implementationof modern computers. Today we can not only get help with long and complicated calculations, we canalso use computers and modern software to simulate and model complex situations described bymathematical structures. Preparing teachers to teach mathematics is highlighted by its complexities.What technologies are adequate tools for learning mathematics? What about teacher attitudes andbeliefs about teaching mathematics with technology? What are the barriers? These questions pose achallenge for the development of a research agenda for mathematics education that is directed towardassuring that all teachers and teacher candidates have opportunities to acquire the knowledge andexperiences needed to incorporate technology in the context of teaching and learning mathematics.
Key Words: Technology in Mathematics, Attitude Of Teachers , Role Of Technology In Mathematics,Technology In Classroom, Barriers in The Way Of Mathematics.
INTRODUCTION
Circa. September 1, 2056. Imagine the school atmosphere. And if one is entrusted with the responsibility toinvestigate the status of mathematics instruction in elementary, middle and high schools. What would one find?What kind of mathematics would be taught? How would be teachers teaching? How would students learn?Would the mathematical knowledge and skills imparted to students turn them into becoming mathematicallymore proficient? Can one estimate how much the National Council of Teachers of Mathematics’ (NCTM)vision for school mathematics has been realized?
Imagine a classroom, a school, or a school district where all students have access to high-quality,engaging mathematics instruction. There are ambitious expectations for all, with accommodation forthose who need it. Knowledgeable teachers have adequate resources to support their work and are
* Dr. Neetu Chawla [M.Sc., M.C.A., M.Ed., Ph.D.], Head, Department of Education, R.C.C.V. Girls Degree College,Ghaziabad.
**Ashish Kumar Mittal ,Head, Department of Mathematics, Indirapuram Public School, Indirapuram, Ghaziabad

106 Journal of Indian Research
continually growing as professionals. The curriculum is mathematically rich, offering studentsopportunities to learn important mathematical concepts and procedures with understanding. Technologyis an essential component of the environment. (NCTM, 2000, p.3)
Can this vision of the National Research Council (NRC, 2001) be implemented so that all students can becomemathematically proficient, a proficiency that involves an integration and balanced development of five keystrands: conceptual understanding, procedural fluency, strategic competence, adaptive reasoning, andproductive disposition? Can technology play a part in the development of mathematical proficiency? TheNational Education Technology Standards for Students (International Society for Technology in Education,ISTE, 2000) has observed that the technology is an integral component or tool for learning and communicationwithin the context of mathematics . The students may be exposed to learning about various technologies oncethey learn begin to mathematics through the usage of technologies. Once students get actively engaged inmathematics using technologies , there may be quantum jump in productivity, communication, research andproblem-solving and decision-making tools.
The challenge at hand is to make things happen to realize these visions by 2056. Perhaps one of the mostcritical respondents for actualizing this vision is the mathematics teacher. What will these teachers need toknow and be able to do? As of now, most teachers have not learned mathematics using technology tools. Theobjective herein is to identify “what” and “how” to prepare mathematics teachers to teach in the 21st century.What do teachers need to know and be able to do and how do they need to develop this knowledge forteaching mathematics?
Technology: Pedagogical Content Knowledge
In 1986, Shulman proposed a more in-depth look at what teachers must know in order to teach, highlightingthat future teachers need to be prepared to be able to transform that subject matter content through teachingstrategies to make that knowledge accessible to learners. To teach, teachers need to have developed anintegrated knowledge structure that incorporates knowledge about subject matter, learners, pedagogy, curriculum,and schools; they need to have developed a pedagogical content knowledge or PCK for teaching theirsubjects. But for technology to become an integral component or tool for learning the subject, teachers mustalso develop “an overarching conception of their subject matter with respect to technology and what itmeans to teach with technology – technology pedagogical content knowledge (TPCK)” (Niess, 2005, p.510). To be prepared to teach mathematics then, teachers need an in-depth understanding of mathematics (thecontent), teaching and learning (the pedagogy), and technology. More importantly, however, they need anintegrated knowledge of these different knowledge domains, the overlap and integration of these domains.TPCK for teaching with technology means that as they think about particular mathematics concepts, they areconcurrently considering how they might teach the important ideas embodied in the mathematical concepts insuch a way that the technology places the concept in a form understandable by their students. The challengeis to identify teacher preparation programs that lead toward the development of TPCK for teaching mathematics.Grossman (1989, 1991) developed four central components as a means of thinking about PCK; Niess (2005)extended these components as a means of clarifying TPCK development for teacher preparation programs:
(a) an overarching conception of what it means to teach a particular subject such as mathematics integratingtechnology in the learning;
(b) knowledge of instructional strategies and representations for teaching particular mathematical topics withtechnology;
(c) knowledge of students’ understandings, thinking, and learning with technology in a subject such asmathematics;
(d) knowledge of curriculum and curriculum materials that integrates technology with learning mathematics.

Volume 1, No.1, January-March, 2013 107
The availability of technology has changed enormously during the last 20-30 years. From the large and clumsydesk calculators of the 1970’s over to the functional calculators in the 1980’s and during the last two decades,we have got graphing calculators as well as symbolic calculators. There are also calculators which includesoftware for geometrical constructions. If we shift to computers, the availability of software for all kinds ofundergraduate mathematics is enormous, both commercial and freeware is easy to get. This significant changein availability naturally raise questions concerning mathematics education at all different levels, questionsconcerning content, teaching & learning, and assessment. Most curricula around the world probably includetechnology at different levels in some way. Here are some excerpts from the Swedish compulsory school:
The teaching of mathematics should strive for that students with familiarity and sound judgmentcan see and use the potentials of calculators and computers. Students should develop theirknowledge about how mathematics is used within information technology, as well as howtechnology can be used in problem solving, in visualizing, and when investigating mathematicalmodels.
The use of technology in mathematics teaching at the college and university level today is harder to describe.Most university students at Gothenburg University seem to have calculators from their upper secondarystudies, as well as easy access to computers and Internet both at campus and in their private environment.Many study halls at the universities include the possibility to make wireless network connections and sincemany students carry laptops with them in school, it is almost as if these students have instant access to toolsfor calculations and visualization. This is probably true for most university students in Sweden and in theNordic countries.
Technology in the mathematics classroom
The use of technology when studying mathematics is not a new issue, since humankind always has beenlooking for solutions to avoid time consuming routine work. Today we not only get support of technology inlong and complicated calculations, we can also use computers and modern software to simulate and modelcomplex situations described by mathematical structures. The views on how information and communicationtechnology can be used to support learning of mathematics have changed over time. When the new curriculumfor the Swedish compulsory school was implemented in 1980, there was a new subject introduced calledcomputer science. Mainly teachers of mathematics, Swedish and social science were involved in this work.Since the 1980’s, the importance of computer support in the teaching and learning of mathematics has beenemphasized more and more. It can be seen in the steering document for the curriculum for the presentSwedish compulsory school. The view on how technology should be used in the mathematical classroom isalso affected by other forces, as for instance strong expectations that present schools should mirror what goeson in the surrounding society in this respect.
In this context it is highly relevant to ask the question about how the teaching and learning of mathematics maybe affected when modern technology is available. When it comes to computer support, Samuelsson (2003)addressed the role of the computer as an agent of change and focused on the following issues:
1. What new methods will be used by the teachers because of the technology?
a. When teachers use technology to introduce the concept of the equation of a straight line (y = kx + m), theteaching will be different compared to an ordinary introduction. The students will be able to easilyinvestigate how different values for the parameters will affect the graph of the function.
b. The students learn more mathematics through visualization and models in the computer.
c. The students will learn effective procedures that help them to solve problems more efficiently, mainly dueto the element of game and competition offered by the computer.

108 Journal of Indian Research
2. What new goals/results will be in focus for the teacher thanks to the possibilities offered bytechnology?
d. The students will be able to learn to handle technology in different mathematical situations.
e. Different aspects of knowledge can be acknowledged, for instance in statistics and algebra, if technologyis used when students solve mathematical problems.
3. What in the everyday technology-enriched teaching of mathematics supports the overall visionsthat exist for school mathematics?
f. The student’s views of mathematics may be affected in a positive way if the teaching is pursued withtechnology
g. Learning oriented teaching with utility programs seems to support the vision that the teacher should focusmore on conceptual learning and less on the learning of skills and procedures.
h. See answers a, d, and e.
4. What kind of everyday technology-enriched teaching of mathematics interfere with the overallvisions that exist for school mathematics?
i. To work with drill and practice software supports an old form of teaching mathematics, which the modernschool is leaving behind. The technology could thus be assimilated into old traditions.
j. The students’ possibilities to reflect over the content in the problems are reduced by the element of gameand competition offered by the computer.
k. Technology offers a variety of different distractions, which results in students doing other things thanmathematics in the classroom, surfing on the web, checking e-mail, and so forth. Technology becomesamusement.
What about Teacher Attitudes and Beliefs about Teaching Mathematics With Technology?
These technologies are only examples. What other technologies are available or are emerging that mightsupport learning mathematics? Teachers need to be prepared for exploring the current and emerging possibilities.They need to develop a professional attitude of evaluation and reflection about tools for teaching mathematics– a profound envisioning that investigates and considers the impact of the tools for teaching mathematics.Niess, Lee and Kajder identified six important areas of questions that teachers must be prepared for:
1. Curricular needs in mathematics in the 21st century. Can the technology be used as a productivity,communication, research and or problem-solving and decision-making tool for learning in the subject area?Does the technology offer the capabilities to facilitate technology-enhanced experiences that addresssubject matter content standards and student technology standards? Does the technology offer capabilitiesthat challenge the accepted standards, opening the possibility for a shift in what students need to know tobe productive citizens in the 21st century?
2. Instructional needs in mathematics in the 21st century. Can the technology support learner-centerstrategies for learning the subject? Can use of the technology as a learning tool help students develop amore robust understanding of the content? Can the technology address the diverse needs of students inlearning the subject? How must the instruction be scaffolded to guide student learning with and about thetechnology?
3. Student learning in the 21st century. Can the technology engage students in important experiences thatsupport their learning? Can the technology provide multiple perspectives for the students to view ofmathematics? Can the technology be applied to developing students’ higher order thinking and reasoningskills? Can the technology maximize student learning?

Volume 1, No.1, January-March, 2013 109
4. Unique capabilities of the new tool. What are the capabilities of the tool? How are these capabilitiesuseful in accomplishing 21st century skills? Do the capabilities challenge accepted ways of knowing anddoing? What must be learned before incorporation of the tool as a learning tool?
5. Student knowledge, access and management concerns. Will inclusion of the new tool create studentaccess issues? What preparation must be provided for students working with the technology as a tool forlearning? What management issues need consideration if the tool is incorporated in the classroom situation?
6. Assessment and evaluation with the new tool. How will assessment of students’ learning of mathematicsbe affected by the incorporation of the new tool? Will performance assessments be important to demonstratestudents’ knowledge of the content with use of the new tool?
What are the Barriers?
While billions of dollars have been spent on technologies for schools, access continues to be labeled a majorbarrier. Many studies have documented this barrier, but, on the other hand, in some situations where technologyis readily available, some teachers do not know how to take advantage of it, and still others are against it. Thelack of knowledge of integration acts as the barrier and the teachers’ beliefs about how mathematics is to belearned becomes a pertinent issue. Norton, McRobbie and Cooper (2000) investigated this question bystudying upon a mathematics staff in a technology – rich secondary school where the technology was rarelyused in teaching mathematics. Their results suggested that these teachers’ resistance was related to theirbeliefs about mathematics teaching and learning and their existing pedagogies. In essence, knowledge andbeliefs may be the actual barriers. Perhaps these teachers are either uncomfortable with technology, or unsureabout how to incorporate technology into their curricula, or have not seen examples of effective use. Theresult challenges teacher educators as they identify requirements to support the development of TPCKthrough the student teachers’ program. While some programs simply make the requirement and provideaccess through classroom sets to be used during student teaching, others are more carefully investigating theclassroom barriers. Garofalo and Bell (2005) at the University of Virginia provided their secondary mathematicsand science student teachers with a laptop, projector and Smartboard for use during field practice with actualstudents. They studied the role of student teachers’ beliefs and TPCK on classroom use of technology, whenaccess is less of an issue. Continued research needs to be undertaken to expose real barriers so that theteacher preparation and professional development programs are able to deal with the issues.
Mathematics anxiety is certainly an issue in mathematics education. Does mathematics anxiety extend totechnology anxiety? What about the discontinuity in the mathematics curriculum from pre-college to collegelevel? Students at the precollege level have relatively few opportunities to use technology in learning mathematics.But, when they enter college, they are confronted with a ubiquitous incorporation of technology in learningmathematics. Calculators are expected. Students need to be able to readily use MATLAB as a tool fordeveloping mathematical models for solving problems. But , students’ mathematics technological toolkit cannotdevelop if teachers in the pre-college level are resistant to teaching mathematics with technology.
Another barrier that has been frequently pointed out is the knowledge base about how students learn and todesign the curriculum that supports students in learning mathematics with technology. Everett Rogers (1995)explains how teachers need to progress through a five-step process in the process of facing the ultimatedecision as to whether to accept or reject a particular innovation for teaching mathematics with technology:
1. Knowledge where teachers become aware of integrating technology with learning mathematics and hassome idea of how it functions;
2. Persuasion where teachers form a favorable or unfavorable attitude toward teaching and learningmathematics with technology;
3. Decision where teachers engage in activities that lead to a choice to adopt or reject teaching and learningmathematics with technology;

110 Journal of Indian Research
4. Implementation where teachers actively integrate teaching and learning with technology;
5. Confirmation where teachers evaluate the results of the decision to integrate teaching and learning withtechnology.
Thus, as more and more teachers teach mathematics with technology as a tool, the shift must be towards theevolving issues more directly focused on student learning of mathematics – evaluating the results of thedecision and its impact on the mathematics curriculum and instructional strategies needed so that all studentsare able to learn mathematics. Ultimately, if technology is used to improve the learning of mathematics at alllevels, students will be better prepared to use technology appropriately, fluently, and efficiently to do mathematicsin techno-rich environments in which they will study and work in the future. This might result in effectiveinstructions in the mathematics classroom Circa. 2056!
References:
Association of Mathematics Teacher Educators’ Technology Committee. (2005). Draft position statementtitled Preparing Teacher to Use Technology to Enhance the Learning of Mathematics.
Beck, J. A. & Wynn, H. C. (1998). Technology in teacher education: Progress along the continuum.ERIC Document Reproduction No. ED 424 212.
Björk, L-E. & Brolin, H. (1995). Using new technology as a tool to increase student understanding ofcalculus. Proceedings of the International Conference on Technology in Mathematics Teaching, Edinburgh.
Grossman, P. L. (1989). A study in contrast: Sources of pedagogical content knowledge for secondaryEnglish. Journal of Teachers Education, 40(5), 24-31.
Grossman, P. L. (1991). Overcoming the apprenticeship of observation in teacher education coursework.Teaching and Teacher Education, 7, 245-257.
International Society for Technology in Education. (2000). National educational technology standards forstudents: Connecting curriculum and technology. Eugene, OR: ISTE.
International Society for Technology in Education. (2002). National educational technology standards forteachers: Preparing teachers to use technology. Eugene, OR: ISTE.
Margerum-Leys, J. & Marx, R. W. (2002). Teacher knowledge of educational technology: A study ofstudent teacher/mentor teacher pairs. Journal of Educational Computing Research, 26(4), 427-462.
National Council of Teachers of Mathematics (2000). Principles and standards for school mathematics,Reston, VA: NCTM.
National Research Council, (2000). How people learn. Washington D. C.: National Academy Press.
National Research Council, (2001). Adding it up: Helping children learn mathematics. Washington D. C.:National Academy Press.
Niess, M. L. (2005). Preparing teachers to teach science and mathematics with technology: Developinga technology pedagogical content knowledge, Teaching and Teacher Education, 21, 509-523.
Utbildningsdepartementet. (2000). Kursplaner för grundskolan. Stockholm, Fritzes.
Zhao, Y. (Ed) (2003). What teachers should now about technology: Perspectives and practices. Greenwich,Ct: Information Age Publishing.

Volume 1, No.1, January-March, 2013 111
Journal of Indian Research, Volume 1 No. 1, 2013, 111-117
Education
REVAMPING TEACHER EDUCATION: CURRICULUM IN THE CONTEXT OF INCLUSIVEEDUCATION
Dr. Satveer .S. Barwal*
Seema Sharma**
ABSTRACT
Inclusion in education involves the process of increasing the participation of students in and reducingtheir exclusion from the cultures, curricula and communities of local schools. It involves restructuringthe cultures, policies and practices in schools so that they respond to the diversity of students in theirlocality. Inclusion is a dynamic process that is constantly evolving as it accommodates all childrenregardless of their physical, intellectual, social, emotional, linguistic or other conditions and thesechallenges have to be met by creating the child centred pedagogy capable of successfully educating allchildren. For empowering the pupil teachers, restructuring the curriculum of teacher education will bethe stepping stone for inclusive education. Under this context the present paper attempts to establish aframework for the knowledge, understanding and skills required by teachers to support and ensureeducational inclusion.
Keyword: Social Darwinism, Disability, Inclusive Education.
Introduction
“All children and young people of the world, with their individual strengths and weaknesses, with theirhopes and expectations, have the right to education. It is not our education system that have a right toa certain type of children. Therefore, it is the school system of a country that must be adjusted to meetthe needs of all children.”
B. Lindqvist, UN-Rapporteur, 1994
Education is a lifelong process involving many planned and unplanned experiences that enable children andadults alike to develop and learn through interaction with the society and culture in which they live. It involvesexperiences at all stages of life, from infancy to old age. Education also involves adaptations to society andculture. With all the combinations of life events, adaptation will mean that each person is subjected to uniqueset of learning and problem solving experiences that constitute an understanding of the world and the eventsthat take place in it. There are some children who, for some reason, are unable to take full advantage ofeducation as it is normally offered. These are the children with special need. When we go in the history ofeducation of special need children, there were no provisions of education. In fact, development is a plant withslow growth. Similarly the plant of special education has been nourished to foster a long gradual change ininterests, attitude and behaviour of people which made education essential, accessible and advantageous forpeople with different disabilities.
Historical Perspectives
In the earlier times, the disabled was protected with the parental instinct and also made able to cope withdisability. All these were through the informal education. In course of time there was a significant change in
*Dr. Satveer S. Barwal is Asst. Prof., D.U.
**Seema Sharma is Research Scholar, Mewar University

112 Journal of Indian Research
the people’s attitude and they viewed the disability as a punishment of God . It was based on the ‘SinTheory’; therefore the result was the expulsion of such people from the society. It was the ‘Social Darwinism’phase. The modern period of special education emanated from the ‘Educational Darwinism’, which meantfor attitudinal change in ‘Social Darwinism’ into education for disabled. But there was no such provision ofeducation for them rather the attitude was full of sympathy.This period laid the foundation of organized careand education with the emergence of humanity and charitable organizations of people in many corners of theworld.
Development in Modern India
In course of time in first 3 decades of 19th century, global change in society led to development in moderneducation and special education to much extent. Asylums were opened and training centres were established.
The outset of the constitutional obligations regarding the special education of universalisation of education inthe age group of 6-14 years under Article(41) also envisages that the state shall ‘within the limits of itseconomic capacity and development, make effective provisions for the special child, as far as possible in thenormal schools. The National Policy on Education (NPE) of India came into existence in 1968 but it becameineffective as regard to its formulation and lacking adequate financial and organizational support. AfterNationwide discussion, the New National Policy on Education (NPE) was formulated in 1986. The main aimof this policy was to integrate the diffrently abled children with the general community as equal partners andto prepare them to face the life with certitude and fortitude.
Inclusive Education: Policy and Legislative Frameworks
According to NCF 2005
“A policy of inclusion needs to be implemented in all schools and throughout our education system.The participation of all children needs to be ensured in all spheres of their life in and outside theschool. Schools need to become centres that prepare children for life and ensure that all children,especially the differently abled, children from marginalised sections, and children in difficult circumstancesget the maximum benefit of this critical area of education”.*
Inclusion is a quite broader term which is not just about providing students with disabilities access to regularclassrooms rather it means providing all children regardless of race, language, class and disability, equitableand effective education that responds to their needs as learners. At the core of inclusive education is the basicright to education which is rooted in human rights treaties. Inclusive education brings all students together inone classroom and community, regardless of their strengths or weaknesses in any area, and seek to maximizethe potential of all
students. Inclusion is an effort to make sure that diverse learners – those with disabilities, different languagesand cultures, different homes and family lives, different interests and ways of learning – are exposed toteaching strategies that reach them as individual learners.
The PWD ACT, 1995 The Person with Disabilities
The Persons with Disabilities Act, 1995 provides for access to free education in an appropriate environmentfor children with disabilities till they attain the age of 18 years. The educational needs of disabled personsbetween the ages of 14 and 18 will be covered through a range of interventions including a Revised Plan forInclusive Education of Children and Youth with Disabilities (IECYD) at an enhanced outlay of Rs. 1,000Crores. Whereas under the Scheme of Integrated Education for the Disabled Children (IEDC) as it stands atpresent, children with disabilities are placed in a regular school without making any changes in the school toaccommodate and support diverse needs, the revised IECYD will, in contrast, modify the existing physical

Volume 1, No.1, January-March, 2013 113
infrastructure and teaching methodologies to meet the needs of all children including Children with SpecialNeeds.
The Persons with Disabilities Act, 1995 further provides 3 % reservation in all institutions receiving fundsfrom Government for persons with disabilities. The implementation of these provisions in educational institutionswill be taken up as a priority activity under the Action Plan. The fulfilment of the reservation in schoolsadmissions will however not be a criterion for denial of admission of other children with disabilities.
All the schools in the country will be made disabled friendly by 2020 and all educational institutions includinghostels, libraries, laboratories and buildings will have barrier free access for the disabled. Special attention willbe given for the availability of Study material for the disabled and Talking Text Books, Reading Machines andcomputers with speech software will be introduced progressively in addition to an adequate number of Braillebooks. An adequate number of sign language interpreters, transcription services and a loop induction systemwill be introduced for the hearing handicapped students. Taking into account the special transportation needsof disabled college students, Universities will be encouraged to introduce Special shuttle services for thedisabled.
The Right To Education Act - 2009
Right to Education Act 2009 is developed to move a step ahead in the direction of 100% literacy in India. It isa concept which incorporates free elementary education to every child of the age of six to fourteen years andensures that the child belonging to weaker section and the child belonging to disadvantaged group are notdiscriminated against and prevented from pursuing and completing elementary education on any grounds. TheAct has to be implemented by 2015.
There are three basic predominating issues in current educational scenario-
• Issue of access to education by all the children,
• Retention and guarantee for their success and
• Quality in education
Role of Teacher in Inclusive Set up of Education
Students in inclusive classrooms have wide range of diversified needs as they are different in terms of abilitiesand backgrounds. It creates a wide range of diversity in the classroom and demands different inputs, such as
• Each student requires individual attention and continuous support of the teacher.
• Inclusive classrooms demands flexible learning as each student has a different pace and style of learning.
• Teacher has to be multifunctional in the classroom – they perform the role of teacher, a counsellor, aguide, a friend, a researcher, a resource person, an information provider and above all a continuous learnerwho all the times keep on updating his/her knowledge.
Some interesting data and facts revealed by the recent study of SSA throw light on the crucialissues for strategic interventions:
• More than 3 million children with disabilities have been enrolled in general schools and this constitutesaround 78% children of school going population and therefore nearly 22% of children with disabilities areyet to be enrolled.
• Though general teachers are important stakeholders in the process of inclusion, their knowledge about thedisability is not adequate to handle children with disability. Even if a Special Educator is there in a school

114 Journal of Indian Research
he is trained in single disability where as we are talking of inclusive classrooms of children which mayhave several disabilities.
• Exclusion of Special Teachers form the general system of education in most States of India has made itdifficult rather impossible for their absorption in mainstream. Special Teachers continue to be a projectmode and draw consolidated salaries from the Central Government.
• Poor linkages at all levels i.e. Administrators, Special Educators, Disability Cells, EVGCs, State andDistrict Coordinators, NCERT, SCERT, Special Schools and NGOs etc.
• UNESCO indicates that there are nearly 77 million children who are out of school system and one-third ofthem are expected to be children with disabilities. Recent initiatives and policy decision under RTE Act hasmade a breakthrough in this context by making provision for two Special Educators in each school ascompulsory and imparting training to General Teachers in Inclusive Education for developing anunderstanding towards inclusive classrooms in mainstream.
• Here the role of Teacher Training Institutes for mass training of teachers’ gains utmost importance and atthe same time poses a challenge to fill this Training Gap. Though Inclusion emerges as the Cost-effectiveModel, there are local specific factors which determine a particular approach to inclusion and therefore,factors such as accessibility, availability of trained human resource, parental support, peer-group supportetc. should be taken in to account for achieving goals of EFA.
PROFILE OF DISTRICT SOUTH- AT A GLANCE
S.No. Particulars Delhi District South
1 Tehsil 27 1. Defence Colony2. Haus Khas3. Kalkaji
2 Area (Sq. Km.) 1483 250(16.86% of Delhi)
3 Population (2011)
Total 1,67,53,235 27,33,752
Male 89,76,410 14,70,288
Female 77,76,825 12,63,464
Population of District South is 16.3% of Delhi
4 Density (per Sq. Km.)
11,297 10,935{362 people (per Sq. Km.)
less than Delhi}
5 Decadal Population Growth Rate
(1991-2001) 47.2 % 50.92%(3.90% larger than Delhi)
(2001-2011) 21.00% 20.59%(0.41% less than Delhi)
In 2001-11 decadal population growth rate reduced to lessthan half of previous growth rate. Previous decadal growthrate of District South was larger than Delhi but in 2001-2011it has been lesser than Delhi.

Volume 1, No.1, January-March, 2013 115
6 Sex Ratio (per 1000)
2011 866 (per 1000) 859 {7 Females
(per 1000 males) less than Delhi}
2001 821( per 1000) 797{24 Females
(per 1000 males) less than Delhi}
In 2011 sex ratio increased in District South as well as Delhi.InDistrict South, 62 females (per 1000 male) are more than lastdecade.
7 Literacy Rate (2011)
Total 86.34% 87.03%(0.69% larger than Delhi)
Male 91.03% 92.20%(1.17% larger than Delhi)
Female 80.93% 80.99%(0.06% larger than Delhi)
8 No. of Schools
DOE 934 142
DOE Aided 209 17
DOE Unaided 1236 117
KVS 41 06
MCD 1726 273
MCD Aided 44 08
MCD Unaided 753 143
NDMC 87 Nil
NDMC Aided 03 Nil
NDMC Unaided 04 Nil
DCB 06 Nil
JNV 02 Nil
Total 5045 706(13.99% of Delhi)
9 No. of Children With Special Need (CWSN)
Blind 196 38(19.39% of Delhi)
Visually Impaired 45 02(00.04% of Delhi)
Low vision 3,320 277(08.34% of Delhi)
Hearing Impaired 499 63(12.63% of Delhi)
Ortho Handicaps 4,222 652(15.44% of Delhi)

116 Journal of Indian Research
Mental Retardation 270 65(24.07% of Delhi)
Mental Illness 31 04(12.90% of Delhi)
Slow Learner 3,464 401(11.58% of Delhi)
Autism 12 05(41.67% of Delhi)
Cerebral Palsy 69 13(18.84% of Delhi)
Speech Impaired 498 68(13.65% of Delhi)
Learning Disability 418 157(37.56% of Delhi)
Multiple Disability 244 33(13.52% of Delhi)
Leprosy cured 08 Nil
Total (DOE + MCD) 13,296 1,778(13.37% of Delhi)
Source:
1. Census of India, 2001 & 2011
2. Directorate of Economics and Statistics, Office of Chief Registrar, Delhi
3. IEDSS, Lajpat Nagar, Delhi
4. DURC, Moti Bagh
From table it can be seen that :
Population of District South is 16.3% of Delhi.
In 2001-11 decadal population growth rate reduced to less than half of previous growth rate. Previous decadalgrowth rate of District South was larger than Delhi but in 2001-2011 it has been lesser than Delhi.
In 2011 sex ratio increased in District South as well as Delhi.
In District South, 62 females (per 1000 male) are more than last decade.
13.99% of schools of Delhi are in South District. CWSN ( blind 19.39% , Visually Impaired 00.04%, childrenwith Low Vision 08.34%, Hearing Impaired 12.63%,Mentally Retarded24.07%, Mentally ill 12.90%, SlowLearners 11.58%, Autistic 41.67% ,Cerebral Palsy 18.84%, Speech Impaired13.65%, Learning Disable 37.56%,Multiple disabled13.52%, Leprosy Cured Nil) in District South are 13.37% of Delhi.
Teacher Education and Implementation of Inclusive Education:
In India, secondary teachers are prepared through Pre Service Teacher Education Programmes, one yearBachelor of Education (B.Ed) programme. The course is being run largely by more than ten thousands teachertraining institutions and universities where as the primary teachers are trained under two years diploma coursewhich are run by Government and private DIETs (District Institute of Education and Training) under StateCouncil of Educational Research and Training (SCERT ). In India, National Council of Teacher Education(NCTE), University Grant Commission (UGC) and National Council of Educational Research and Training(NCERT) are responsible for preparing B.Ed curriculum. The curriculum was revised during 1998, 2002,2005and 2009. The B.Ed and DIET programmes have the Special Education paper as optional. Thus thisintergroup choice leaves little scope for the paper to be chosen by the pupil teachers as their elective option.Besides this the teacher educators have reported that pupil teacher do not opt for the paper: reasons are many

Volume 1, No.1, January-March, 2013 117
like- absence of experts in the teaching faculty to teach this paper, comprehensive coverage of this paper asthe teacher educators generally do not feel comfortable due to their limited orientation in the field of disability.Another potent reason as indicated by them is that special children are rarely present in regular stream: sowhy to add to the work load of pupil teachers. This notion is common among the teacher educator as well asthe pupil teacher. Thus the issues again question marks the adequacy, appropriateness and sufficiency ofPSTE curriculum under consideration for preparing teachers to fulfil the requirement of inclusive set up ofeducation. In our country all professionals like doctors advocates are trained on those skills which are requiredby their profession, but the plinth of human development, education, is being left with untrained teachers.There is an urgent need to renovate teacher education curriculum regarding pedagogy and updated learningmethodologies. Teachers in inclusive classroom are asked to vary their teaching strategies according to theneed of the child but in reality this curriculum is not empowering the pupil teachers to handle even theconventional classrooms. The curriculum of teacher education must focus on practical education; life skills andmethodologies to satisfy each and every learner irrespective of his/her diversities.
Conclusion
Thus the data reveals that there is a dire necessity and immediate need of restructuring and reorganising thepre-service teacher education curriculum. The present form of Pre Service Teacher Education programmeand the curriculum help teachers least to deal with the challenges of actual working conditions. The trainingprogrammes should contain more application based approaches and based on the various learning stylesalready researched, tested and adopted.
References
• Adam, P.R. (1987). A Review and Synthesis of teacher Competencies Necessary for EffectiveMainstreaming;
• Chadda, A. (2003). Perspective in Special Education in India: Community Based Primary EducationForum
• Julka, A. (2006) Including Children and Youth With Disabilities in Education: A Guide Practitioners; Department of Education of Groups With Special Need
• Julka. A. (2007) Meeting Special Needs in School, NCERT
• NCERT (2011) Indian Educational Review
• National Curriculum Framework for Quality Teacher Education (1998)
• National Curriculum Framework for Teacher Education(2005) Draft, NCERT

118 Journal of Indian Research
Journal of Indian Research, Volume 1 No. 1, 2013, 118-135
Education
THE RIGHT OF CHILDREN TO FREE AND COMPULSORY EDUCATION ACT, 2009:
AN EXPLORATORY STUDY
Dr. Virendra Pratap Singh*
ABSTRACT
The major objective of this study was to find out the status of implementation of RTE Act, 2009 in Statesand Union Territories of India. For this purpose, a questionnaire was prepared, and administered in allthe 29 States and 5 UTs of India. The information was obtained from the State Project Directors (SPDs)of the respective States / UTs about the steps taken for the implementation of the RTE Act. Theresponses were obtained from 24 States (Andhra Pradesh, Assam, Chhattisgarh, Delhi, Goa, Gujarat,Haryana, Himachal Pradesh, Jharkhand, Karnataka, Kerala, Madhya Pradesh, Manipur, Meghalaya,Mizoram, Odisha, Punjab, Rajasthan, Sikkim, Tamilnadu, Tripura, Uttar Pradesh, Uttarakhand, WestBengal) and 4 UTs (A & N Islands, Chandigarh, Daman & Diu, Lakshadweep, excluding Dadra andNagar Haveli). Five States viz. Arunachal Pradesh, Bihar, Nagaland, Maharashtra and Puducherryand one UT i.e. Dadra & Nagar Haveli did not provide any response.
Keywords: Right to Education, School Management, Anganwadis, State Advisory Council (SAC), shikshamitras, Teachers’ Eligibility Test (TET), Right to Education Protection Authority (REPA), Pupil TeacherRatio (PTR), RTE Act
INTRODUCTION
The Right of Children to Free and Compulsory Education Act, 2009 (RTE Act, 2009) has envisaged free andcompulsory education to all children of the age of six to fourteen years, till completion of elementary stage, ina neighbourhood school. The RTE Act has provisions for every child who is above six years of age and hasnot yet been admitted to any school or could not complete his/ her elementary education due to any reason tobe admitted in a class appropriate to his or her age. In order to be at par with other children of the class, thechild has a right to receive special training or additional instructions. There is an important concern overimplementation of RTE Act in the school system with reference to special training or instructions, its modalitiesand execution. The States/UTs are expected to respond to the situation arising out of the implementation ofRTE Act. The States/ UTs are also required to pay special attention to cope with the situation in terms ofappointment of qualified teachers, development of special training programmes for out-of-school childrenadmitted to age appropriate classes, and preparation of relevant teaching learning materials. The variousimportant provisions in the RTE Act are:• Right of disabled child to receive free and compulsory education in a neighbourhood school,• Completion of elementary education even after fourteen years of age,• Right of child to seek transfer to any other school,• Prohibition of holding back and expulsion of child,
* Dr. Virendra Pratap Singh is Associate Professor ,Department of Elementary Education,National Council ofEducational Research and Training,Sri Aurobindo Marg, New Delhi– 110016.He can be contacted [email protected],

Volume 1, No.1, January-March, 2013 119
• No child is denied admission because of lack of proof of age,
• Formulating standards and norms for school management committees,
• Qualification, terms and conditions of services of teachers,
• Filling of vacancies of teachers,
• Pre-school education (States/UTs may provide for this),
• Duties of teachers, and redressal of their grievances,
• Duties of parents/guardians,
• Prohibition of deployment of teachers for non-educational purposes,
• Maintaining pupil teacher ratio as specified,
• Prohibition of capitation fee and screening procedures,
• Prohibition of physical punishment and mental harassment,
• Norms and standards for schools,
• Preparation of school development plan,
• Laying down the curriculum and evaluation procedures,
• Monitoring child’s rights to education, and
• Constitution of State Advisory Council, among other aspects.
The present study has been designed with an objective to know the status of implementation of variousprovisions of RTE Act in States/ UTs, and also their concerns and problems to implement the same. As theRTE Act has been implemented from April 2010, the States/UTs need to take up lot of preparatory activitiesin this regard. The study would explore what steps they have been able to take so far and what further isneeded to be done. It would be important to assess the level of preparedness of States/UTs to be able to takeeffective steps for the implementation of RTE Act at various levels. It would also be important to know howfar they are ready to take steps forward in regard to the implementation of RTE Act. The readiness of States/UTs would mean awareness of various stakeholders to take advantage of the RTE Act. The present study is,therefore, exploratory in nature, and initiated with an objective to find out the status of provisions of RTE Actand implementation thereof in the 34 States/UTs (except Jammu and Kashmir).
Materials and Methods
It is proposed to approach the Secretaries (Elementary Education)/State Project Directors (SSA Mission) of34 States/UTs (except Jammu & Kashmir) for collection of information/ data on the initiatives taken or beingtaken on the various provisions of RTE Act to ensure the child’s right to education. A questionnaire wasdeveloped by the Department of Elementary Education (DEE), NCERT to seek information from the States/UTs about the steps taken so far to implement provisions of RTE Act including availability of training materials,and its suitability in the context of RTE Act. The questionnaire includes data items for assessing the status ofimplementation of RTE Act, 2009 in the States/ UTs as listed below.
1. Whether RTE has been implemented in different categories of schools?
2. Whether model rules for RTE have been framed, and if framed whether it has been approved?
3. What strategic plan has been prepared for providing free and compulsory elementary education in theState with regard to age appropriate admission of children, availability of neighbourhood schools, andprovision for child belonging to weaker section/ marginalized and disadvantaged sections of the society.
4. Whether curriculum/syllabi have been reviewed in conformity with constitutional values.

120 Journal of Indian Research
5. Whether curriculum/ syllabi have been reviewed in the light of all-round development of the child,building up child’s knowledge, potentiality and talent, and development of physical and mental abilities tothe fullest extent.
6. What steps have been taken to create awareness about RTE among teachers, parents and community?
7. What necessary arrangements are being made for providing free pre-school education to children belowsix years?
8. What steps have been taken in teaching learning process in the classroom to ensure learning throughactivities, discovery and exploration in a child centred and child friendly manner, comprehensive andcontinuous evaluation (CCE)/ assessment of ability to understand and apply knowledge, making child freefrom fear, trauma and anxiety, providing opportunity to the child to express freely, and that no child shallbe subjected to physical punishment or mental harassment?
9. What special measures have been initiated for creating child friendly learning environment in class-rooms?
10. Are there any training package/ module being developed for capacity building of teachers keeping inview the admission of out-of-school children in their age appropriate grade? If yes, details thereof.
11. What plan has been made to identify children who are out of school?
12. Whether any package of teaching-learning material or Bridge Course material has been prepared forspecial training for out-of-school children (non-enrolled or drop-outs)? If yes, details thereof.
13. What special training has been planned for the children who have been directly admitted to classappropriate to his/ her age?
14. Whether School Management Committees have been formed? If yes, details thereof.
15. Whether any initiative has been taken for preparing school development plan? If yes, details thereof.
16. What major interventions have been initiated since inception of RTE, especially for children with specialneeds?
17. What special arrangement has been made to accommodate children of transfer cases?
18. What steps have been take to recruit teachers as per RTE norms?
19. What steps have been taken to train untrained in service teachers?
20. What steps have been planned to redress the grievances of teachers?
21. Have you formed any State Advisory Council for proper implementation of RTE? If yes, details thereof.
22. What steps have been taken for monitoring of child’s right to education by State Commission forProtection of Child’s Right?
23. What steps are being taken by your state to meet the requirement of PTR 1:30?
24. What steps have been taken for rationalization of teachers’ posts?
25. Whether any guidelines and/ or action points have been prepared for ensuring 25% admission inneighbourhood schools from the weaker and marginalized sections of the society?
26. Any other important issue/ information related to the RTE Act, 2009.
The quantitative and qualitative data obtained from the above listed items of interest for assessing the status ofimplementation of RTE Act 2009 in the States/ UTs shall be subjected to the mixed analysis (qualitative andquantitative) for drawing objective based question-wise findings using simple statistical analysis approach.
Major Findings

Volume 1, No.1, January-March, 2013 121
The historic move for universalisation of Elementary Education (UEE) has resulted in development of theRight of Children to Free and Compulsory Education Act, 2009 (RTE Act, 2009) adopted by Government ofIndia on 27th August, 2009 (The Gazette of India 2009). The major thrust of this Act is to provide free andcompulsory education to all children of the age-group of 6-14 years. As per the provisions all the States andUnion Territories (UTs) in the Union of India have to mandatorily implement this Act w.e.f. 1st April, 2010.Therefore, this exploratory study of the implementation of RTE Act, 2009 in States / UTs was undertaken withthe sole objective of finding the status of implementation of RTE Act, 2009 in the 29 States (excluding J & K)and 5 UTs (Appendix-I).
The data obtained from all the responding States and UTs upto February 2012 were subjected to mixedanalysis (qualitative and quantitative). Following are the major findings drawn on the basis of objective basedquestion-wise data analysis:
1. The RTE Act has been implemented in 21 States and 4 UTs. In two States i.e. Karnataka and Tamilnaduit is “being implemented in phases”. The State of Assam has negatively responded, however on the basisof subsequent observations RTE Act is in process of implementation there.
2. (a) On the basis of the responses of other questions it can be summarised that 23 States and o n eUT (Daman & Diu) have framed model rules for RTE Act. The framing of model rules is in theprocess in the state of Tamilnadu (not yet framed) and the Union Territory of Lakshadweep. Two UTs(A & N Islands and Chandigarh) have adopted the central government rules.
(b) Framed model rules for RTE Act have been approved by 17 States and one UT (Daman & Diu).These have not been approved by four States viz. Assam, Punjab, West Bengal and Delhi and 3 UTs(A & N Islands, Lakshadweep, Chandigarh). The approval is under process in case of Tamilnaduwhereas the status has not been reported by Meghalaya.
3. Strategic plan for free and compulsory Elementary Education:
(a) Age appropriate admission of children: Notifications with regard to age appropriate admission ofchildren have been issued in different modes by the competent authority related to the schools in allresponding 24 States and four UTs.
(b) Availability of neighbourhood schools: The norms for availability of neighbourhood schools havebeen framed by 3 UTs viz. A & N Islands, Lakshadweep and Daman & Diu whereas no response inthis regard has been obtained from Chandigarh. These norms have not yet been defined by 3 Statesviz. Manipur, Sikkim and Assam, whereas as per response there is no such requirement in the State ofGujarat. The other 20 States have either identified norms or have neighbourhood schools in differentlocalities.
(c) Provision for child belonging to weaker section and disadvantaged section of the society: Outof all the responding States and UTs, 21 States and 4 UTs have issued the circular to reserve 25%seats for children belonging to weaker / marginalized sections of the society and to admit them in theneighbourhood school in age appropriate classes. Three States viz. Sikkim, Himachal Pradesh andManipur have not given any specific response.
4. Out of the responding States, 19 have revised curriculum/syllabi in conformity with constitutional valueswhereas 4 States have given negative response. Further, the State of Kerala has stated that revision ofcurriculum/syllabi in conformity with constitutional values will be done by the SCERT. All the 4 UTs eitherhave revised the syllabi or it is in the process.
5. Out of 24 States, 16 have revised curriculum / syllabi in light of all-round development of the child. FifteenStates have responded that their curriculum/syllabi has been reviewed in light of building up child’s

122 Journal of Indian Research
knowledge, potentiality and talent, and development of physical and mental abilities to the fullest extent.Chhattisgarh and Meghalaya have not given any specific response and the State of Kerala and Tamilnaduhave left the task to their respective State bodies i.e. SCERT (Kerala) and DTERT (Tamilnadu). Only theState of Jharkhand has given a negative response for the curriculum revision. In the case of UTs, Daman& Diu has not given any specific response regarding curriculum revision.
6. Various types of activities that include seminars (6 States & one UT), awareness programmes throughwebsites, newspapers etc. (14 States & 2 UTs), workshops (14 States), training programmes (14 States &2 UTs), community programmes (6 States & 2 UTs), translational act (2 States), leaflet / pamphletdistribution (8 States) and other activities like nukkad natak, dance / drama, radio and TV shows on RTE(3 States) have been carried out to create awareness about RTE Act among teachers, parents andcommunity members. No specific response had been received from Delhi.
7. Out of 24 States, 16 are providing free pre-school education to children below 6 years through ‘Anganwadi’.ECC centres are functioning to provide this facility in 4 States viz. Mizoram, Meghalaya, Gujarat andTamilnadu. In West Bengal, ICDS Centre is facilitating pre-school education. No details were obtainedfrom the States of Haryana, Jharkhand and Delhi regarding provisions on pre-school education. Further, itis noted that Assam has provision of Ka-sreni (pre-primary section attached to primary school) in additionto ‘Anganwadis’. In Goa, ‘Balwadis’ and ‘Kindergartens’ are also in function and registration of eachpre-school institution with the Directorate of Education has been made mandatory. For UTs, it has beenobserved that Chandigarh has pre-primary classes attached to all the Government schools and no fee ischarged from students. Lakshadweep has Government pre-school institutions. Similarly, Directorate ofEducation is running pre-primary classes in A & N islands whereas in Daman & Diu it is being impartedthrough ICDS.
8. Steps taken in teaching learning process in the classroom:
(a) Learning through activities, discovery and exploration in a child centred and child friendly manner hasbeen adopted in practice by all the responding States and UTs in different modes. Specifically someinteresting programmes like Kanjapuri Active Group of Learning (KAGL in Uttarakhand), Nali-Kali(Karnataka), Samadhan and Sanjog (Odisha), Activity Based Learning & Activity Learning Material(ABL & ALM in Madhya Pradesh), Learning Enhancement Activities (LEHAR in Rajasthan), ABL(Tripura), Project Based Learning (Haryana), Experience-Reflection-Application-Consolidation andPragna (Gujarat), Learning through story books and print rich classroom (Chandigarh) etc. have beenintroduced.
(b) With regard to Comprehensive and Continuous Evaluation (CCE) / assessment of ability to understandand apply knowledge, out of 24 States, 22 have already implemented it whereas Kerala and Gujaratare in process of its implementation. Out of 4 UTs, 3 have implemented the concept of CCE whereasin Daman & Diu necessary steps have been taken to initiate CCE implementation.
(c) All the 24 responding States and 4 UTs have taken different initiatives to make children free fromfear, trauma and anxiety. Some interesting initiatives such as reduction of number of paper-pen test (A& N Islands), ban on screening test (Uttarakhand), ban on corporal punishment & expulsion(Uttarakhand, Chhattisgarh, West Bengal, Manipur, Punjab, Delhi, Tripura, Uttar Pradesh), awarenessprogramme for teachers (Mizoram, Andhra Pradesh), no-detention policy (Sikkim, West Bengal,Tamilnadu, Uttar Pradesh), Ama Vidyalaya (Odisha), LEHAR Room (Rajasthan), Group Work andPeer Activity (Madhya Pradesh), Peer sensitisation and appointment of counsellors (Chandigarh),Joyful Learning (Delhi) etc. have been introduced.

Volume 1, No.1, January-March, 2013 123
(d) Regarding provision of opportunities to the children for free expression, it was found that the childrenin the 4 UTs are encouraged to participate in group discussions, extempore, debates etc. All the 24responding States, are carrying out various activities like ‘Srijan Vaadan’, Metric Mela, ‘BaalShodh’, ‘Sapno Ki Udaan’ (Uttarakhand); Pratibha Karanji Programme and Metric Melas(Karnataka); ‘Baal Sabha’, ‘Akkad Bakkad Magazine’ (Himachal Pradesh); School Cabinets,‘Meena Manch’, Child reporters & child representatives (Odisha); LEHAR Programme (Rajasthan);‘Aale Bhole Magazine’ (Punjab); ‘Baal Sabha’, Child Committees (Uttar Pradesh).
(e) Corporal punishment has been banned in all the responding States and UTs. The teachers of variousStates have been imparted training for not resorting to physical punishment and mental harassment.Advocacy of child friendly classroom activities have been initiated in the State of Tamilnadu. Karnatakahas introduced Child Protection Cell. In Odisha, toll-free school student’s helpline number has beenintroduced along with the provision of Grievance Redressal Cell. In Goa, SCPCR conducts schoollevel training programme for teachers in collaboration with NGOs.
9. In all the responding States and UTs different measures have been initiated for creating child friendlylearning environment in the classrooms. Some noteworthy measures adopted by some of the States arepresented in Table 1.
Table 1: Measures Initiated for Creating Child Friendly Learning Environmentin Class-rooms by States / UTs
S.No. Measures initiated for creating child friendly States/UTslearning environment in class-rooms
1. • Activity based learning Mizoram, Karnataka, Sikkim, Odisha, WestBengal, Tamilnadu, Goa, Manipur
2. • Use of learning corners, TLM, Interactive Uttarakhandlearning material, Srijan Vaadan, Childfriendly assessment, KAGL, ABL.·
• Use of Library, reading kits by Prathamand Room-To-Read etc.
3. • TLM, display of maps in the class room. Karnataka
• Good thoughts, proverbs, beautiful drawingswere painted on the walls.
• Project based learning.
4. • Involving the children in the preparation Andhra Pradesh, Tamilnadu
of TLM.
• Personal interaction with students.
5. • Training on creation of child friendly learning Chhattisgarh, Himachal Pradesh,environment in the class rooms. Meghalaya, Gujarat, Delhi
• Demonstration of classroom managementtechniques.
6. • Giving small prizes to children, home visits Himachal Pradeshby the teachers.
• Promotion of questioning spirit of the children

124 Journal of Indian Research
• Organisation of Bal Melas, Sports activitiesetc. by children
7. • ‘Ama Vidyalaya’: A drive for beautification Odishaof school.
8. • Implementation of BaLA West Bengal, Tripura, Chandigarh
9. • Interacting with parents, children and teachers Tamil Naduto curb corporal punish\
10. • Introduction of LEHAR room as an attractive Rajasthan“Bal-mitra” room.
11. • Promotion of reading corners. Uttar Pradesh
12. • Introduction of rotational sitting system in Tripuraclass rooms
13. • Project based learning Haryana
14. • Implementation of Pragna Gujarat
15. • ADEPTS Programme Daman & Diu
10. Out of 24 responding States 19 States and 2 UTs have taken initiatives for development of trainingpackage / module for capacity building of teachers keeping in view the admission of out-of-school childrenin their age appropriate grades. Among the States 3 have taken initiatives for capacity building programmesfor teachers through bridge course and 10 have developed special training packages whereas only 1 UT(Chandigarh) has developed capacity building programme and 1 UT (A & N Islands) has allocated extrateaching hours. On the other hand, 3 States (Jharkhand, Tripura, Meghalaya) and 2 UTs (Lakshadweep,Daman & Diu) have not taken any initiatives.
11. The major strategies adopted to identify the out-of-school children (OoSC) are Household Survey (HHS)and Child Tracking System (CTS). Out of the responding States, 16 States along with 3 UTs have adoptedHHS; 3 States have adopted Child Tracking System to identify the OoSC. Apart from these 5 States and1 UT have adopted other strategies like Village Education Register (VER), Comprehensive Survey (CS)for the same.
12. Nineteen States and 2 UTs have initiated the preparation of teaching learning materials of Bridge coursefor special training of OoSC. Three States (Odisha, Meghalaya, West Bengal) and 2 UTs (Daman & Diu,Lakshadweep) have not taken initiative. The specific details of some of the important initiatives providedby the responding States and UTs have been summarised as follows in Table 2.
Table 2: Preparation of Teaching Learning Materials for Bridge Course by States / UTs
S.No. Specific Initiatives States / UTs
1. Development of course materials A & N Islands (Languages and EVS), MadhyaPradesh (Subject-wise), Mizoram
2. Standard-wise breakup of training module Uttarakhand, Assam, Chandigarh, Uttar Pradesh
3. Chinnara and Angala Teacher’s book, KarnatakaChinnara Angala workbooks
4. Special reading materials Chhattisgarh
5. Individual Education Plan (IEP) Tamilnadu

Volume 1, No.1, January-March, 2013 125
6. Condensed course Rajasthan, Tamilnadu, Assam, Tripura, Uttar Pradesh
7. PYAS (Text + Exercise book) Jharkhand
13. Two States (Uttarakhand & Assam) and 2 UTs (Lakshadweep, Daman & Diu) have not planned forimparting special training for directly admitted children to age-appropriate class. The details of SpecialTraining Programmes (STPs) in different States are given Table 3.
Table 3: Planning of Special Training for Directly AdmittedChildren to Age Appropriate Class by States / UTs
S.No. Special Training Programmes Planned States / UTs
1. Residential Special Training Centres (RSTCs) Mizoram, Karnataka, Andhra Pradesh, Chhattisgarh,and Non-Residential Special Training Centres Kerala, Tripura, Manipur (NRSTCs), Uttar Pradesh,(NRSTCs) Goa, Gujarat, A & N Islands, Chandigarh, Odisha
2. Residential Bridge Courses (RBCs) and Mizoram, Himachal Pradesh, Madhya Pradesh,Non-Residential Bridge Courses (NRBCs) Rajasthan, Jharkhand, Punjab
3. Preparation of Teaching Learning Materials Mizoram, Meghalaya, Himachal Pradesh, Kerala(TLMs) (age-appropriate TLMs)
4. Activity Based Learning (ABL) Sikkim
5. Field visits, discussion, linkages with local Himachal Pradeshknowledge
6. Assessment sheets based evaluation Jharkhand (Buniyad & Buniyad plus)
7. Condensed curriculum Uttar Pradesh
14. SMCs have been formed in 17 States and all the 4 UTs. Three States i.e. Delhi, Punjab and Tamilnaduhave not yet formed SMCs, other two States viz. Kerala and Chhattisgarh are in the process of formationof SMCs whereas two States viz. Goa and Manipur have not responded.
15. Fifteen States have formulated the School Development Plan (SDP) whereas 6 States are in the process.Three States (Manipur, Sikkim, Meghalaya) have not taken any initiative for development of school plan.In case of UTs, three have developed the plan. One UT i.e. Chandigarh has started the process andtraining to the members of SMCs for preparation of School Development Plan (SDP) has been imparted.Some of the specific initiatives related to SDP preparation are mentioned in Table 4.
Table 4: Initiatives for Preparing School Development Plan by States / UTs
S.No. Details of Initiatives for preparation of States / UTsSchool Development Plan
1. Training on SDP preparation Daman & Diu, Odisha (Sahajog), West Bengal,Chandigarh, Tamilnadu, Rajasthan, Assam, UttarPradesh, Goa
2. Community mobilisation Chhattisgarh, Odisha,
3. Issue of directions / guidelines on SDP Himachal Pradesh, Kerala, Uttarakhand
4. Orientation Programme Odisha, Madhya Pradesh, Uttar Pradesh
5. Workshop Tripura

126 Journal of Indian Research
16. Out of 28 responding States and UTs, 4 States (Delhi, Karnataka, Kerala, Haryana) and 1 UT(Lakshadweep) did not furnish information regarding interventions for Children With Special Needs (CWSN)since introduction of RTE Act. On the basis of data received from different States and UTs, the interventionshave been initiated for CWSN as described in Table 5.
Table 5: Intervention Initiatives for Children With Special Needs by States / UTs
S.No. Interventions initiated for CWSN States / UTs
1. Barrier free access A & N Islands, Andhra Pradesh, Uttarakhand, Odisha,Tamilnadu, Madhya Pradesh, Rajasthan, Assam, Punjab, UttarPradesh, Tripura, Gujarat
2. Inclusion in normal school A & N Islands, Tamilnadu, Tripura, Gujarat
3. Scholarships A & N Islands
4. Health Camps/Assessment and Daman & Diu, Uttarakhand, Andhra Pradesh, Sikkim,Screening camps Madhya Pradesh, Rajasthan, Tripura, Manipur
5. Training Programme for Teachers Daman & Diu, Uttarakhand (PGPD for in-service teachers),Andhra Pradesh, Chhattisgarh, Himachal Pradesh & UttarPradesh (Foundation course), West Bengal, Madhya Pradesh,Rajasthan, Assam, Jharkhand, Tripura
6. Distribution of Aids and Appliances Daman & Diu, Mizoram, Uttarakhand, Odisha, West Bengal,Madhya Pradesh, Assam, Uttar Pradesh, Tripura
7. Identification and personal profile Uttarakhand, Uttar Pradeshpreparation, Development of separatedatabase, Pre-integration camps forCWSN
8. Resource teacher appointments Uttarakhand, Andhra Pradesh, Sikkim (Inclusive Educationvolunteers), Himachal Pradesh (Special educators), Odisha,West Bengal, Rajasthan, Meghalaya & Manipur (I.Evolunteers), Chandigarh
9. Home based education Uttarakhand, Andhra Pradesh, Sikkim, Chhattisgarh, MadhyaPradesh, Assam, Jharkhand, Tripura, Chandigarh, Manipur
10. Transport and Escort facility Uttarakhand, Chandigarh, Odisha, Madhya Pradesh,Rajasthan, Chandigarh
11. Enrolment in neighbourhood schools Sikkim
12. Parent counselling Sikkim, Assam, Manipur
13. Provision of Resource Room Chhattisgarh, Himachal Pradesh, West Bengal, MadhyaPradesh, Jharkhand, Uttar Pradesh (Resource Centres),Tripura
14. Mobile resource consultants Chhattisgarh, Madhya Pradesh, Uttar Pradesh (itinerantteachers)
15. School Readiness Programme Chandigarh

Volume 1, No.1, January-March, 2013 127
17. Admission to the children of transfer cases is given throughout the year in 21 States and 3 UTs. However,3 States i.e., Uttarakhand, Punjab, Meghalaya and Lakshadweep UT have no such provisions toaccommodate such students.
18. The scenario of recruitment of teachers as per RTE norms is not so encouraging among the respondingStates and UTs. Out of the responding States, in 10 States, the recruitment procedure is still under wayalong with one UT. The States of Chhattisgarh, Odisha and UP have taken permission from MHRD/NCTE in connection to the recruitment of teachers as per RTE norms. The States of Haryana, Gujaratand Punjab have shown appreciative gestures and already completed Teachers’ Eligibility Test (TET). Inthe States of West Bengal, Madhya Pradesh, Rajasthan, Gujarat and in UTs of A & N Islands andLakshadweep, recruitment rules of teachers have been amended as per RTE norms. The remaining 4States have not provided specific information in this regard.
19. Almost all the responding States and UTs either did not have untrained teachers or steps have been takento train untrained teachers. The States, Karnataka, Andhra Pradesh, Rajasthan, Goa, Haryana, Gujaratand Delhi have not appointed any untrained teacher. Similarly in all the 4 UTs all appointed teachers aretrained. Training to the in-service teachers is being provided through CTEs / DIETs / IGNOU (DPE) /NIOS with State Boards / DPEP / TTIs / SCERTs / Directorate of Teacher Education / DistanceEducation Programme particularly in the States of Mizoram, Uttarakhand, Sikkim, Chhattisgarh, Odisha,West Bengal, Jharkhand, Tripura, Uttar Pradesh and Manipur.
20. Provisions have been made in the RTE rules adopted by the States to redress the grievances of theteachers. These provisions, as adopted by various States, include - constitution of Grievance RedressalCommittee / Forum, functioning of RTI cell, online Redressal mechanism, monitoring committees at block/ district / State level, State Administrative Tribunal, RTE Appellate Authority, meetings of teacher unionsunder the chairmanship of Education ministers, School Managing Committee and posting of grievances toDirectorate of Education through proper channel. In UT, Daman & Diu ‘Complaint/Suggestion box’ arekept in the schools and toll free number has been introduced in the education office for redressing thegrievances of the teachers.
21. The State Advisory Council (SAC), for implementation of RTE, has been formed in five States namelyKarnataka, Punjab, Mizoram, Tripura and Goa. Twelve States viz. Uttarakhand, Andhra Pradesh, Sikkim,Chhattisgarh, Kerala, Madhya Pradesh, Odisha, Rajasthan, Tamilnadu, Meghalaya, Delhi and Manipurhave not formed SAC. Six States viz. Himachal Pradesh, West Bengal, Assam, UP, Haryana and Gujaratand UT Lakshadweep are under the process of forming SAC. The State of Jharkhand has not respondedin this regard. In case of UTs, SAC has been constituted only in A & N Islands. Daman & Diu andChandigarh have not constituted SAC.
22. Right to Education Protection Authority (REPA) has been constituted in the States of Mizoram andHaryana whereas it is in the process of constitution in Tripura and Tamilnadu. On the other hand, StateCommission for Protection of Child Rights (SCPCR) has been constituted in 8 States viz. Karnataka,Chhattisgarh, Madhya Pradesh, Assam, Jharkhand, Goa, Gujarat and Manipur. In Goa, SCPCR with theNGOs conducts school level training programme to create awareness among the teachers and children onthe Child Rights Act and also on the provisions against the physical punishment and mental harassment ofchildren in the schools. In case of UTs, REPA has been constituted only in A & N Islands whereasSCPCR is under the process of constitution in Chandigarh.
23. The provision of Pupil Teacher Ratio (PTR) 1:30, as prescribed by RTE Act, in 6 States (Mizoram,Karnataka, Uttarakhand, Goa, Tripura and Meghalaya) and 1 UT (A & N Islands), it is below theprescribed ratio. Further in 9 States i.e. Andhra Pradesh, Sikkim, Chhattisgarh, Tamilnadu, Madhya

128 Journal of Indian Research
Pradesh, Rajasthan, Assam, Punjab, UP and in one UT i.e. Chandigarh the process is underway toachieve the prescribed PTR. In four States i.e. West Bengal, Haryana, Gujarat, Himachal Pradesh andtwo UTs i.e. Lakshadweep and Daman & Diu, the PTR of 1:30 has been achieved after the implementationof RTE Act. States of Manipur, Delhi, Jharkhand, Kerala and Odisha did not provide any specificinformation regarding PTR.
24. Rationalization of teachers’ posts after implementation of RTE Act, has already been carried out in 7States (Karnataka, Andhra Pradesh, Himachal Pradesh, Madhya Pradesh, Punjab, Tripura and Gujarat)and in one UT (Lakshadweep). It is under the process in 9 States (Mizoram, Uttarakhand, Chhattisgarh,Odisha, West Bengal, Tamilnadu, Assam, Uttar Pradesh and Haryana) and in 3 UTs (Daman & Diu, A &N Islands and Chandigarh). The remaining 7 States did not provide any specific information regarding this.
25. Eleven States viz. Uttarakhand, Andhra Pradesh, Chhattisgarh, Kerala, Odisha, West Bengal, MadhyaPradesh, Rajasthan, Punjab, Uttar Pradesh and Haryana have prepared the guidelines for ensuring 25%admission in neighbourhood schools. The States of Sikkim, Jharkhand, Manipur and Tamilnadu have notprepared the guidelines. Remaining 6 States viz. Karnataka, Himachal Pradesh, Assam, Tripura, Meghalayaand Gujarat, the guidelines are under the process of preparation. In case of Mizoram and Goa, preparationof such guidelines has not been perceived as a necessity and in the State of Delhi, no specific informationwas obtained. In case of UTs guidelines have been issued in A & N Islands and Chandigarh whereas inDaman & Diu they are under the process of preparation. In case of Lakshadweep, administration ensuredthe availability of school facility to all sections therefore no such guidelines have been framed.
26. Some of the States and UTs have also undertaken some important additional steps regarding implementationof RTE Act, 2009. The important ones have been summarised in Table 6.
Table 6: Additional Steps Regarding Implementation of RTE Act, 2009 by States/UTs
S.No. Additional Steps Related to RTE Act, 2009 States/UTs
1. • The State Council of Educational Research and Training, Uttarakhand Uttarakhandhas been notified as Academic Authority.
2. • Residential Schools have been established for urban deprived children Andhra Pradeshat Hyderabad, Vijayawada, Visakhapatnam and Khammam.
3. • Web blog has been created to obtain more information on the Odishainitiatives and programmes under RTE in Odisha i.e.http://rteodisha.blogspot.com.
4. • State has issued guideline to ensure 25% admission in neighbourhood Jharkhandschools for the weaker and marginalised sections of the society. Statehas also organised several meetings with private school managementand Principals in this regard to ensure admission from 2011-12 onwards.
5. • State has issued various notifications to implement of RTE Act, 2009 Punjaband a cell has been created at State level and District level.
6. • The training of first batch of 62000 graduate shiksha mitras Uttar Pradeshalreadyscheduled at 880 Block Resource Centre and will be completedby June, 2013. The training of remaining shiksha mitras will be startedin July, 2013 and will be completed by June, 2015.
• Thus, as required by the Act, all the untrained teachers will be given

Volume 1, No.1, January-March, 2013 129
requisite teacher training by end of 2014-15.
The above findings related to this exploratory study of the implementation of RTE Act, 2009 in States / UTsare based on the information obtained from State Project Directors (SPDs) of respective States & UTs.Finally, the findings have been drawn from the analysis provided in Chapter III under this report. Further, anexecutive summary based on these findings have been given in the beginning of this report.
Conclusion
Based on the question-wise analysis and the respective findings of this study presented in the previous sectionsof this report, following are the major conclusions:
• RTE Act, 2009 has been implemented in 21 States (Andhra Pradesh, Chhattisgarh, Delhi, Goa, Gujarat,Haryana, Himachal Pradesh, Jharkhand, Kerala, Madhya Pradesh, Manipur, Meghalaya, Mizoram, Odisha,Punjab, Rajasthan, Sikkim, Tripura, Uttar Pradesh, Uttarakhand, West Bengal), and 4 UTs (A & N Islands,Chandigarh, Daman & Diu, Lakshadweep). In the States of Karnataka, Tamilnadu and Assam, it is in theprocess.
• Model rules for RTE Act, 2009 have been framed by 23 States (Andhra Pradesh, Assam, Chhattisgarh,Delhi, Goa, Gujarat, Haryana, Himachal Pradesh, Jharkhand, Karnataka, Kerala, Madhya Pradesh, Manipur,Meghalaya, Mizoram, Odisha, Punjab, Rajasthan, Sikkim, Tripura, Uttar Pradesh, Uttarakhand, WestBengal), and 2 UTs (A & N Islands, Chandigarh). Eighteen States and 1 UT have approved these rules.
• Notifications with regard to age appropriate admission of children have been issued by all the responding24 States and 4 UTs. Twenty States except Manipur, Sikkim, Assam and Gujarat and 3 UTs exceptChandigarh have framed norms for availability of neighbourhood schools. Twenty-one States exceptSikkim, Himachal Pradesh, Manipur and 4 UTs have provisions for children belonging to weaker sectionsand disadvantaged sections of the society.
• Nineteen States and 3 UTs have revised their curriculum / syllabi. Revisions have been done with respectto all round development of the child (16 States and 3 UTs), building up child’s knowledge, potentiality andtalent (15 States and 3 UTs) and development of physical and mental abilities to the fullest extent (15States and 3 UTs).
• Various types of activities like seminars (6 States and one UT), awareness programmes through websites,newspapers etc. (14 States and 2 UTs), workshops (14 States), training programmes (14 States and 2UTs), community programmes (6 States and 2 UTs), translational act (2 States), leaflet / pamphletdistribution (8 States) and other activities like nukkad natak, dance / drama, radio and TV shows on RTEetc. (3 States) have been carried out to create awareness about RTE Act among teachers, parents andcommunity members.
• Out of 24 States, 16 are providing free pre-school education to children below 6 years through ‘Anganwadi’.ECC centres are functioning to provide this facility in 4 States viz. Mizoram, Meghalaya, Gujarat andTamilnadu. In West Bengal, ICDS Centre is facilitating pre-school education. The States of Haryana,Jharkhand and Delhi could not provide information on provisions of pre-school education. Assam hasprovision of Ka-sreni (pre-primary section) in addition to ‘Anganwadis’, Goa has ‘Balwadis’ and‘Kindergartens’. All the 4 UTs have made provisions for pre-school education to children.
• As per RTE provisions, actions have been taken for ensuring learning through activities, discovery andexploration in a child centred and child friendly manner by all responding States and UTs in differentmodes. Specifically some interesting programmes like Kanjapuri Active Group of Learning (KAGL inUttarakhand), Nali-Kali (Karnataka), Samadhan and Sanjog (Odisha), Activity Based Learning (ABL)& Activity Learning Material (ALM) (Madhya Pradesh), LEHAR (Learning Enhancement Activities in

130 Journal of Indian Research
Rajasthan), ABL (Tripura), Project Based Learning (Haryana), Experience-Reflection-Application-Consolidation and Pragna (Gujarat), Learning through story books and print rich classroom (Chandigarh)etc. have been introduced. Similarly, action has been taken with regard to Comprehensive and ContinuousEvaluation (CCE) / assessment of ability to understand and apply knowledge and 22 States (except Keralaand Gujarat) and 3 UTs (except Daman & Diu) have already implemented it. All the 24 responding Statesand 4 UTs have taken interesting initiatives such as reduction of number of paper-pen test (A & NIslands), ban on screening test (Uttarakhand), corporal punishment, expulsion (Uttarakhand, Chhattisgarh,West Bengal, Manipur, Punjab, Delhi, Tripura, Uttar Pradesh), awareness programme for teachers (Mizoram,Andhra Pradesh), no detention policy (Sikkim, West Bengal, Tamilnadu, Uttar Pradesh), Ama Vidyalaya(Odisha), LEHAR Room (Rajasthan), Group Work and Peer Activity (Madhya Pradesh), Peer sensitisationand appointment of counsellors (Chandigarh), Joyful Learning (Delhi) etc. to make children free from fear,trauma and anxiety. Further practical action has also been taken by 24 States and 4 UTs for providingopportunity of free expression to children through participation in group discussions, extempore, debate,organisation of activities like ‘Srijan Vaadan’, Metric Mela, ‘Baal Shodh’, ‘Sapno Ki Udaan’(Uttarakhand); Pratibha Karanji Programme and Metric Melas (Karnataka); ‘Baal Sabha’, ‘AkkadBakkad Magazine’ (Himachal Pradesh); School cabinets, ‘Meena Manch’, Child reporters & childrepresentatives (Odisha); LEHAR Programme (Rajasthan); ‘Aale Bhole Magazine’ (Punjab); ‘BaalSabha’, Child Committees (Uttar Pradesh). Corporal punishment has been banned in all the respondingStates and UTs. The teachers of various States have been imparted training for not using physicalpunishment and mental harassment. In Odisha, toll-free school students’ helpline number has been introduced.
• Schools in various States have initiated various measures for creation of child friendly learning environment.Some important initiatives are such as– Activity based learning (Mizoram, Karnataka, Sikkim, Odisha,West Bengal, Tamilnadu, Goa, Manipur), Use of learning, corners, TLM, Interactive learning material,Srijan Vaadan, Child friendly assessment, KAGL, ABL. and use of Library, reading kits by Pratham andRoom-to-Read etc. (Uttarakhand), TLM, maps displayed in the class room, good thoughts, proverbs,beautiful drawings were painted on the walls and project based learning (Karnataka) and involving thechildren in the preparation of TLM and personal interaction with students (Andhra Pradesh, Tamilnadu),Training on creation of child friendly learning environment in the class rooms and demonstration ofclassroom management techniques (Chhattisgarh, Himachal Pradesh, Meghalaya, Gujarat, Delhi), givingsmall prizes to children, home visits by the teachers, specific books would be designed for promoting thequestioning spirit of the children and organisation of Bal Melas, Sports activities etc. by children (HimachalPradesh), ‘Ama Vidyalaya’: A drive for beautification of school (Odisha), implementation of BaLA (WestBengal, Tripura, Chandigarh), interacting with parents, children and teachers to curb corporal punishmentand mental harassment to children (Tamilnadu), introduction of LEHAR room as an attractive “Bal-mitra”room (Rajasthan), promotion of reading corners (Uttar Pradesh), introduction of rotational sitting system inclass rooms (Tripura), project based learning (Haryana), implementation of Pragna (Gujarat), ADEPTSProgramme (Daman & Diu).
• Some significant strategies adopted to identify the out-of-school children (OoSC) by States and UTs areHousehold Survey (HHS – 16 States and 3 UTs) and Child Tracking System (CTS – 3 States) and VillageEducation Register (VER) and Comprehensive Survey (CS – 5 States and 1 UT). It is quite motivating tofind that 19 States and 2 UTs have taken initiatives for development of training package / module forcapacity building of teachers keeping in view the admission of out-of-school children in their age appropriategrades. Bridge course, special training package allocating extra teaching hours are some importantprogrammes for capacity building adopted by some States and UTs.
• Nineteen States and 2 UTs have taken initiatives for preparation of teaching learning materials of Bridgecourse for special training of out-of-school children (OoSC). The specific initiatives are: development of

Volume 1, No.1, January-March, 2013 131
course materials [A & N Islands (Languages and EVS), Madhya Pradesh (Subject-wise), Mizoram],standard-wise breakup of training module (Uttarakhand, Assam, Chandigarh, Uttar Pradesh), Chinnaraand Angala teacher’s book, Chinnara Angala workbooks (Karnataka), special reading materials(Chhattisgarh), Individual Education Plan (IEP) (Tamilnadu), condensed course (Rajasthan, Tamilnadu,Assam, Tripura, Uttar Pradesh), PYAS [Jharkhand (Text + Exercise book)].
• Some important provisions have been made by the States and UTs regarding planning of Special Trainingfor directly admitted children to age appropriate class such as: Residential Special Training Centres(RSTCs) and Non-Residential Special Training Centres (NRSTCs) (Mizoram, Karnataka, Andhra Pradesh,Chhattisgarh, Kerala, Tripura, Manipur (NRSTCs), Uttar Pradesh, Goa, Gujarat, A & N Islands, Chandigarh,Odisha), Residential Bridge Courses (RBCs) and Non-Residential Bridge Courses (NRBCs) (Mizoram,Himachal Pradesh, Madhya Pradesh, Rajasthan, Jharkhand, Punjab), Preparation of Teaching LearningMaterials (TLMs) [Mizoram, Meghalaya, Himachal Pradesh, Kerala (age-appropriate TLMs)], ActivityBased Learning (ABL) (Sikkim), field visits, discussion, linkages with local knowledge (Himachal Pradesh),Assessment sheets based evaluation [Jharkhand (Buniyad & Buniyad plus)], Condensed curriculum (UttarPradesh).
• School Management Committees (SMCs) have been constituted in 17 States and 4 UTs. Three States i.e.Delhi, Punjab and Tamilnadu have not yet formed SMCs, other 2 States viz. Kerala and Chhattisgarh arein the process of formation of SMCs whereas 2 States viz. Goa and Manipur did not respond.
• School Development Plan (SDP) has been formulated in 15 States and 3 UTs. Some specific initiativesrelated to SDP preparation by different States are such as: training on SDP preparation [Daman & Diu,Odisha (Sahajog), West Bengal, Chandigarh, Tamilnadu, Rajasthan, Assam, Uttar Pradesh, Goa], communitymobilisation (Chhattisgarh, Odisha), issuance of directions / guidelines on SDP (Himachal Pradesh, Kerala,Uttarakhand), orientation programmes (Odisha, Madhya Pradesh, Uttar Pradesh), workshops (Tripura).
• Some important interventions for Children With Special Needs (CWSN) as adopted by different States /UTs are: barrier free access (A & N Islands, Andhra Pradesh, Uttarakhand, Odisha, Tamilnadu, MadhyaPradesh, Rajasthan, Assam, Punjab, Uttar Pradesh, Tripura, Gujarat), inclusion in normal schools (A & NIslands, Tamilnadu, Tripura, Gujarat), scholarships (A & N Islands), health camps/ assessment and screeningcamps (Daman & Diu, Uttarakhand, Andhra Pradesh, Sikkim, Madhya Pradesh, Rajasthan, Tripura,Manipur), training programme for teachers [Daman & Diu, Uttarakhand (PGPD for in-service teachers),Foundation course (Andhra Pradesh), Chhattisgarh, Himachal Pradesh & Uttar Pradesh, West Bengal,Madhya Pradesh, Rajasthan, Assam, Jharkhand, Tripura], distribution of aids and appliances (Daman &Diu, Mizoram, Uttarakhand, Odisha, West Bengal, Madhya Pradesh, Assam, Uttar Pradesh, Tripura),identification and personal profile preparation (Uttarakhand), Resource teacher appointments [Uttarakhand,Andhra Pradesh, Sikkim (Inclusive Education Volunteers), Special educators (Himachal Pradesh), Odisha,West Bengal, Rajasthan, Meghalaya & Manipur (I.E volunteers), Chandigarh], home-based education(Uttarakhand, Andhra Pradesh, Sikkim, Chhattisgarh, Madhya Pradesh, Assam, Jharkhand, Tripura,Chandigarh, Manipur), transport and escort facility (Uttarakhand, Chandigarh, Odisha, Madhya Pradesh,Rajasthan, Chandigarh), enrolment in neighbourhood schools (Sikkim), parent counselling (Sikkim, Assam,Manipur), provision of Resource Room [Chhattisgarh, Himachal Pradesh, West Bengal, Madhya Pradesh,Jharkhand, Resource Centres, itinerant teachers (Uttar Pradesh), Tripura], Mobile resource consultants[Chhattisgarh, Madhya Pradesh], development of separate database (Uttar Pradesh), pre-integration campsfor CWSN (Uttar Pradesh), school readiness programme (Chandigarh).
• Admission to the children of transfer cases is given throughout the year in 21 States and 3 UTs. However,3 States i.e., Uttarakhand, Punjab, Meghalaya and 1 UT Lakshadweep have no such provisions toaccommodate such students.

132 Journal of Indian Research
• The scenario of recruitment of teachers as per RTE norms is not so encouraging among the respondingStates and UTs. In 10 States and 1 UT the recruitment procedure is still in the process. The States ofChhattisgarh, Odisha and UP have taken permission from MHRD/ NCTE in connection to the recruitmentof teachers as per RTE norms. The States of Haryana, Gujarat and Punjab have shown appreciativegestures and already completed Teachers’ Eligibility Test (TET). In the States of West Bengal, MadhyaPradesh, Rajasthan, Gujarat and in UTs of A & N Islands and Lakshadweep, recruitment rules of teachershave been amended as per RTE norms.
• All the four UTs and the States of Karnataka, Andhra Pradesh, Rajasthan, Goa, Haryana, Gujarat andDelhi have not appointed any untrained teacher. In the remaining States training to the in-service teachersis being provided through these institution: CTEs / DIETs / IGNOU (DPE) / NIOS with State Boards /DPEP / TTIs / SCERTs / Directorate of Teacher Education / Distance Education Programme.
• Provisions regarding redressal of the grievances of the teachers adopted by various States, include -constitution of Grievance Redressal Committee/Forum, functioning of RTI cell, online Redressal mechanism,monitoring committees at block/district/ State level, State Administrative Tribunal, RTE Appellate Authority,meetings of teacher unions under the chairmanship of Education ministers, School Managing Committeeand posting of grievances to Directorate of Education through proper channel. In UT, Daman & Diu‘Complaint/Suggestion box’ are kept in the schools and toll free number has been introduced in theeducation office for the redressal.
• The State Advisory Council (SAC), for implementation of RTE, has been constituted in one UT (A & NIslands) and 5 States viz. Karnataka, Punjab, Mizoram, Tripura and Goa. Twelve States viz. Uttarakhand,Andhra Pradesh, Sikkim, Chhattisgarh, Kerala, Madhya Pradesh, Odisha, Rajasthan, Tamilnadu, Meghalaya,Delhi and Manipur have not formed SAC. Other 6 States viz. Himachal Pradesh, West Bengal, Assam,Uttar Pradesh, Haryana and Gujarat and UT Lakshadweep are under the process of forming SAC.
• Monitoring of Child’s Right to Education is being done by Right to Education Protection Authority (REPA)in the UT A & N Islands & States of Mizoram and Haryana. It is under the process in Tripura andTamilnadu. In 8 States viz. Karnataka, Chhattisgarh, Madhya Pradesh, Assam, Jharkhand, Goa, Gujaratand Manipur the State Commission for Protection of Child Rights (SCPCR) is acting as monitoringagency.
• Six States viz. Mizoram, Karnataka, Uttarakhand, Goa, Tripura and Meghalaya and one UT A & NIslands have Pupil Teacher Ratio below the prescribed norm. Other 9 States i.e. Andhra Pradesh, Sikkim,Chhattisgarh, Tamilnadu, Madhya Pradesh, Rajasthan, Assam, Punjab, UP and one UT i.e. Chandigarhalso lie below the norm but are striving to achieve the target. Remaining 4 States i.e. West Bengal,Haryana, Gujarat, Himachal Pradesh and 2 UTs i.e. Lakshadweep and Daman & Diu have achieved theprescribed ratio. Further, it has also been found that rationalization of teachers’ posts after implementationof RTE Act, has already been carried out in 7 States (Karnataka, Andhra Pradesh, Himachal Pradesh,Madhya Pradesh, Punjab, Tripura and Gujarat) and in one UT (Lakshadweep). It is in under the processin 9 States viz. Mizoram, Uttarakhand, Chhattisgarh, Odisha, West Bengal, Tamilnadu, Assam, UttarPradesh and Haryana and in 3 UTs viz. Daman & Diu, A & N Islands and Chandigarh.
• The guidelines for ensuring 25% admission in neighbourhood schools have been prepared by 11 States viz.Uttarakhand, Andhra Pradesh, Chhattisgarh, Kerala, Odisha, West Bengal, Madhya Pradesh, Rajasthan,Punjab, Uttar Pradesh and Haryana. The States of Sikkim, Jharkhand, Manipur and Tamilnadu have notprepared the guidelines. Remaining 6 States viz. Karnataka, Himachal Pradesh, Assam, Tripura, Meghalayaand Gujarat, the guidelines are under the process of preparation. In case of Mizoram and Goa, preparationof such guidelines has not been perceived as a necessity and in the State of Delhi, no specific informationwas obtained. In case of UTs guidelines have been issued in A & N Islands and Chandigarh whereas in

Volume 1, No.1, January-March, 2013 133
Daman & Diu they are under the process of preparation. In case of Lakshadweep, administration hasensured the availability of school facility to all sections therefore no such guidelines have been framed.
• Some of the States and UTs have also undertaken some important additional steps regarding implementationof RTE Act, 2009. The important ones are: Notification of SCERT as academic authority in Uttarakhand,establishment of residential schools for urban deprived children in Andhra Pradesh, creation of Web blogon RTE in Odisha, issuance of guidelines for ensuring 25% admission of children from weaker / marginalisedsections of the society, organisation of several meetings with private school managements and principals inJharkhand, setting up of District and State level cells in Punjab, training of 62,000 graduate shiksha mitrasin Uttar Pradesh.
On the whole, the conclusions in the above section have been derived on the basis of information obtainedfrom the SPDs of different States/UTs. The conclusions clearly reflect a positive and motivating picture aboutthe status of implementation of RTE Act, 2009. However, for attaining Universalization of Elementary Educationand goals of RTE Act, 2009, more stringent measures should be taken uniformly by all the States / UTs,especially those lagging behind must take inspiration from the others.
Acknowledgment
The author is thankful to the Head, DEE, NCERT, New Delhi for her constant encouragement and support atevery stage of the study. The States/UTs Project Offices on SSA Mission and their Officers deserve thespecial thanks for providing information/data in bringing out this study. The author is also thankful to theDirector, NCERT and Joint Director, NCERT including the Faculty Members of DEE as well as others whoare directly and indirectly associated and involved in providing valuable support during this study.
Reference:
1. GOI (2010). Report of the Committee on implementation of the Right of Children to Free & CompulsoryEducation Act, 2009 and the Resultant Revamp of Sarva Shiksha Abhiyan. Ministry of Human ResourcesDevelopment, Department of School Education & Literacy, New Delhi.
2. GOI (2011). Sarva Shiksha Abhiyan – Framework for Implementation (Based on the Right of Childrento Free and Compulsory Education Act, 2009). Ministry of Human Resource Development, Departmentof School Education and Literacy, New Delhi.
Appendix I
List of States/UTs which were Included in the Study of Implementationof RTE Act, 2009 and Date of Receipt of Response from the States/UTs
S.No. States / UTs Date of Receipt of Response
1. A & N Islands 16.05.2011
2. Chandigarh 04.10.2011
3. Daman & Diu 11.05.2011
4. Lakshadweep 25.04.2011
5. Andhra Pradesh 09.05.2011
6. Assam 19.07.2011
7. Chhattisgarh 28.06.2011
8. Delhi 15.11.2011

134 Journal of Indian Research
9. GOA 14.10.2011
10. Gujarat 05.10.2011
11. Haryana 27.09.2011
12. Himachal Pradesh 01.07.2011
13. Jharkhand 12.07.2011
14. Karnataka 07.06.2011
15. Kerala Not Available
16. Madhya Pradesh 20.09.2011
17. Manipur 27.01.2012
18. Meghalaya 21.09.2011
19. Mizoram 10.06.2011
20. Orissa Not Available
21. Punjab 18.08.2011
22. Rajasthan 11.07.2011
23. Sikkim 14.06.2011
24. Tamil Nadu 12.07.2011
25. Tripura 12.09.2011
26. Uttar Pradesh 20.09.2011
27. Uttarakhand 31.05.2011
28. West Bengal 22.07.2011
List of Acronyms
ABL Activity Based Learning
ALM Activity Learning Material
BaLA Building As Learning Aid
BRC Block level Resource Person
BRT Block Resource Teacher
CBSE Central Board of Secondary Education
CCE Comprehensive and Continuous Evaluation
CPC Circle Project Coordinator
CRP Cluster level Resource Person
CS Comprehensive Survey
CTE College of Teachers Education
CTS Child Tracking System
CWSN Children With Special Needs
DEE Department of Elementary Education

Volume 1, No.1, January-March, 2013 135
DEP Distance Education Programme
DIET District Institute of Education Training
HHS Household Survey
IEP Individual Education Plan
IEP Individual Education Plan
IGNOU Indira Gandhi National Open University
KAGL Kanjapuri Active Group of Learning
KRPF Key Resource Person of Family
LEHAR Learning Enhancement Activities
NCERT National Council of Educational Research and Training
NCTE National Council of Teacher Education
NIOS National Institute of Open Schooling
NRBC Non-Residential Bridge Course
NRSTC Non-Residential Special Training Centre
OoSC Out-of-School Children
PTR Pupil Teacher Ratio
RBC Residential Bridge Course
REPA Right to Education Protection Authority
RSTC Residential Special Training Centre
RTE Act, 2009 Right of Children to Free and Compulsory Education Act, 2009
SAC State Advisory Council
SCERT State Council of Educational Research and Training
SCPCR State Commission for Protection of Child Rights
SDP School Development Plan
SMC School Management Committee
SPD State Project Director
SSA Sarva Shiksha Abhiyan
STP Special Training Programme
STR Special Training
TE Teacher Education
TET Teachers’ Eligibility Test
TLM Teaching Learning Material
TTI Teacher Training Institute
UEE Universalisation of Elementary Education
UT Union Territory
VER Village Education Register

136 Journal of Indian Research
Journal of Indian Research, Volume 1 No. 1, 2013, 136-141
Environment
HINDU FESTIVALS: HAZARDS TO ENVIRONMENT AND ECOLOGY
V. S.Khan*
ABSTRACT
India is known for religious festivities. The Hindu religion is polycentric allowing multiple sects andinnumerable gods to co-exist. These gods are ritually consecrated and the cycle renewed throughannually held festival. Since, Hindu belief system posit for endless flow of matter, energy and symbolism;much of the festivals involve the act of visarjana(immersion). Just like the Universe which is boundunder the cycle of creation, maintenance and dissolution for renewal afresh, the immersion of idols andthe accompanying celebration through fire crackers or colours, does cause ecological overload in thewater bodies, particularly the rivers . River bank is the ‘tira’, the point of crossing over intotranscendental time.Idols cross over into another time through dissolution in river water. Henceforth,rivers are getting inundated with the high pollutants . The paper examines the hazards caused to theecology due to the increasing usage of non-bio-degradable substances during Hindu festivities.
KEY WORDS: Pollution, Festivals, Hinduism, Pandal, Idol, Environment
India is described as a land of many religions and festivals. It’s a multi-ethnic, multi- lingual and multi-religiouscountry. In India, festivals are spread throughout the year and people find resource and time to celebrate thesefestivals with great enthusiasm. Besides main festivals, there are many local festivals. These festivals involverituals and expenses. With increased culture of consumerism, these are often sponsored by the corporate forpublicity. Behind the pomp and show of great celebration hides the painful tales of impending environmentalhazards. The deadly impacts of such celebrations are the main postulates of this research article. Certainmeasures have been suggested to overcome this problem.
The environment pollution affects the health of more than hundred millions of people all over the world.Pollution is injected into a natural environment usually by humans. When foreign bodies like oxides of nitrogenand sulphur or lead containing fumes and fluids are added in significant quantities it becomes harmful to plantsanimals and human beings directly or through food chain. India is one of the worst performer in causingecological degradation. Added to this story are various reasons deeply rooted in its traditions, customs, religionsand practices. Festivals are celebrated at regular interval throughout the year. No one gives thought to theeffects of such festivals upon the flora and fauna of this country. Among the Hindus, the biggest festivals areDurga Pooja, Ganesh Chaturthi, Deepawali, Holi etc.
Durga Pooja is one of the biggest festivals of Hindus particularly those living in the Eastern parts of India. Inplaces like Kolkata, it becomes an all-out affair with thousands of pandal or temporary temple structures setup all over the city and its outskirts to worship Goddess Durga. Besides loud live music, musical performancesand feasting create lot of problem for the environmentally conscious people. People from all corners travelinto the city and visit the Pooja Pandal to participate in the festivals. This causes serious traffic problems andair pollution. The month long festivities end by the immersions of richly decorated figures of the GoddessDurga with huge processions, in the river.
*V.S.Khan is Research Scholar in History, Mewar University Rajasthan

Volume 1, No.1, January-March, 2013 137
However, the immersions of thousands of statues every year into the Indian rivers, lagoons and lakes duringfestivals such as Durga Pooja and Ganesh Chaturthi, cause a potential hazard to environment. The Indianenvironmentalists have always raised serious questions about the dangerous level of toxic contents of thesestatues. The campaigners for Green Peace India have also raised a question mark on the bigger and brighteridols for which toxic material such as colour coats are used. Traditionally, the idols were made from clay, mudand vegetable based dyes, but with the commercialization of these festivals and increased interest of corporatehouses, who sponsor the Idols for their own gain and publicity; more and more harmful paints and colour areused. Materials such as plastic, plaster of paris are used which do not dissolve in water, consequently loweringoxygen to a level that is harmful to aquatic bodies. Aquatic pollution happens because of the presence ofundesirable foreign materials either dissolved or suspended which are harmful to living things. Carcinogenicheavy metals like lead, mercury and chromium are present in the paints used to decorate the sculptures. Thesecontaminate water affecting the life cycle. The need of the hour is to issue strict guidelines for the organizersof these festivals not to use toxic materials and use of eco-friendly raw materials. This must be encouraged tocheck this ever increasing social menace. Sujoy Chatterjee and Dr. Prashant Mehta in their study titled“Festivals: A Time of Celebration or Impending Environmental Disaster” 1 have pointed out various types ofpollutions generated in large amount all over the country during the time of celebration. They have also raisedthe question on the sustainability of other creatures living in water. They have shown the impact of variousmaterials on aquatic environment during the Idol immersion. Similarly, P.K. Goel and K.P. Sharma haveenumerated the impact of immersion of idols in water bodies in their voluminous study EnvironmentalGuidelines and Standards in India(1996). The result of their study is reproduced herein as Table 1.
Table 1: Changes in Concentration (mg/l) of some chemical pollutants after idol immersion inwater bodies2
Chemical Mean Concentration Concentration before Concentration afterPollutants In Water Immersion of Idols Immersion of Idols
Calcium 25.14 43.77 68.4*
Magnesium 7.785 6.590 10.02*
Molybdenum 0.090 0.149 0.534*
Silicon 3.537 2.954 3.826**
Arsenic 0.124 0.121 0.497
Iron 0.212 0.125 0.22**
Lead 0.289 0.351 0.45**
Mercury 0.689 0.553 0.778**
Threshold Limit Value (TLV): *TLV = 0.01; **TLV=0.05
(TLV is the permissible level of a toxic pollutant to which a healthy person is exposed during an eighthour day without any adverse effect).
The study reflect how the polluted water includes a list of decoration materials such as cloth, polish, paint,ornaments, cosmetic items, flowers, garlands, oily substances besides bamboo sticks, polythene bags and otherplastic items. The impact of these materials on the aquatic body is very hazardous. The chemicals and non-degradable substances affect various species living in water. These water creatures further contaminate thefood chain consumed by human beings.

138 Journal of Indian Research
Another Indian festival of importance is Ganesh Chaturthi usually celebrated in Maharashtra and some partsof Northern India. The practice of immersion of Ganesh Idols after the Ganesh Festival in various cities is alsocausing great danger to the aquatic bodies which leads to the death of tons of fish and other precious waterinhabitants. Repeated warnings and cautions sounded by the ecologists and environmental scientists towardsthe possible hazard inflicted by Plaster of Paris are mostly ignored both by the idol makers and its buyers. Thechemical dyes and colours being used to dye the idols contains poisonous elements particularly red, blue,orange and green colours containing Mercury, Zinc oxide chromium and lead, the potential causes for thedevelopment of cancer. Let us see the magnitude of this hazard in terms of figure. More than 7500 Idols ofGanesh weighing more than 20 tons are immersed every year in Mumbai alone. According to a rough estimateabout 1.5 lakh idols are immersed in Mumbai seashore every year. Chemicals from the paints, polish and POPhave posed a serious threat to the existence of aquatic bodies. Reckless conduct of festivals like Durga Poojaand Ganesh Chaturthi have become a major threat to human beings who depend on water and fish of thesewater bodies as the same river, pond and lake water is also used by millions for bathing, working and drinkingpurposes. High levels of lead can damage heart, liver and kidney. It can also affect circulatory and centralnervous system.
Holi is a festival of vibrant colours that brings with it a variety of colours harmful to human beings. Nowadays,the colours used are synthetic and toxic because of the presence of cheap materials like mica, acids alkalineand pieces of glass. These harmful chemicals cause skin disorder like irritation and itching. These can alsoimpair vision and cause respiratory problems and even cancer. In the joy of celebration nobody pays attentionto these fatal hazards. Every year school children and younger ones develop skin disorders immediately aftercelebration of festival especially Holi. Environmentalists have always warned people against use of suchhazardous materials. People should rather use natural colours and vegetable based dyes for making colours.
Deepawali is celebrated with utmost pomp and show all over India. This is a festival which has got the dubiousdistinction of causing noise and air pollution of the environment . One of the greatest sources of pollutionduring this festival is the crackers being used by the children and young alike. Noise pollution from Deepawalijumps between 67.7 db and 88.3 db. which is higher than the prescribed level of 50 db. Studies by the Centrefor Science and Environment (CSE) around Delhi conclude that in 2008, RSPM levels during Diwali doubledcompared to 2006. Various study suggests that in the case of metros, noise pollution may reach upto 100 db.Crackers are manufactured using barium sulphate, sodium nitrate, sulphur and potassium chloride and when burnt emit gasses such as Sulphar dioxide, oxides of nitrogen, oxides of heavy metals and pollution in the air.These chemicals also cause eye irritation, respiratory disorder and other allergies. Deepawali is a festivalwhich celebrate the Goddess of prosperity but people unknowingly make their surrounding polluted in spite ofwarnings given by the Government and environment conscious organizations. Even strict warnings are given topublic to refrain from bursting crackers named interestingly for its ferocity as an environmental pollutant likeatom bombs, hydrogen bomb and bullet bombs. But nothing seems to work with the fest- intoxicated people.There is a need for change of attitude and taking the social responsibility for discouraging people from burstingsuch lethal crackers. There are many colonies where people collectively arrange fireworks and bursting ofcrackers. These shows not only cause noise pollution and disturbance in the civic life of that locality but alsocause various respiratory and eye disorders in the aftermath of festivals.
Table 2: Comparison of Ambient Air Quality on Diwali during 2006 & 20083
Parameter (ug/m3) Recording in 2006 Recording in 2008 Normal residential standard
SPM 246 243 200
RPM 133 129 100

Volume 1, No.1, January-March, 2013 139
Not only festival, but even growth in pilgrimage has left the pilgrim places teething under massive ecologicaldegradation. Kiran A. Shinde4 has examined environmental change at the Hindu pilgrimage site of Vrindavanin Uttar Pradesh. Vrindavan is home to more than 5000 temples and receives more than 6 million visitorsevery year. Shinde interviewed various social groups, including religious gurus, priests, visitors, governmentofficials, local residents, and community leaders, and discovered tetra-layered response to the ecological crisisin Vrindavan- denial, indifference, helplessness, and stewardship. “Denial” and “indifference” are commonwith those engaged in the pilgrimage rituals as they use the language of transcendence framed through myths,religious ideologies, and ritual practices. Hose outside economy of religious ritual recognize environmentalimpacts but feel “helpless”. Only a handful of the residents demonstrate environmental stewardship.
Kelly D Alley has done extensive work on the water pollution of the Ganges caused by the pilgrimage. In anethnographic study, “On the Banks of the Ganga: When Wastewater Meets a Sacred River”, 5 Alleyprovides an overview of the Ganges in terms of waste disposal, and its impact on the sacred river. Alley alsoexamines the arguments defending both the sacred purity and pollution of the Ganga river put forth by thegovernment authorities and religious people. 6 She uses Benaras as an example, and find how each groupviews this age as a degenerate one(kaliyuga), but they differ on the loci of degeneracy. The government citespopulation growth, urbanization, industrialization, and technological development as the source of the degeneracy, while religious people focus on moral degeneracy. Interestingly, it may appear but Alley found how the peoplecontinue to look to the government for infrastructural improvements in sewage treatment and managementalthough they clearly assess the problems through different prism. She further defines waste as “a socialconstruct or problem,” 7 and examines various interpretations and “ideologies” of pollution and waste bydifferently situated Hindu residents of Benares in order to analyze the ways in which theories of purity andpollution influence public debates and governmental policies about the uses and condition of the Ganges.
Purushottama Bilimoria have studied environment ethics of various Indian religious traditions. He does discovertraditional approaches to the issue of environment . In an essay , “Environmental Ethics of Indian ReligiousTraditions”(1998) 8, he states:
“The Indian religious traditions are intertwined with equally disparate cultural, social, linguistic,philosophical and ethical systems that have developed over a vast history, compounded withmovement of peoples, foreign interventions, and internal transformations in structures andidentities experienced over time. How does one then begin to talk about environmental valuesand concerns in the Indian religious traditions? Well one can, albeit, randomly and selectively;and so this essay will be confined to tracing the contours of certain highlights and tensions inthe traditional approaches to the question of the environment”
He concluded in his essay that traditional wisdom for environment regeneration is available and there is needto rethink over traditional resources for course-correction over growing degradation of our ecology. Bilimoriawrites:
“The suggestion is that there are indeed resources within the traditional systems - Yoga, Jaina,Buddhist, Hindu, Sikh, Islamic, Christian, Gandhian, all of which have helped give shape to amodern, secular India - to increase awareness of environmental concerns and to instigate theextension of ecological values and modal practices to the plethora of environmental problemsfacing Indians, as they do most human beings in other parts of the world.” 9
Festivals are celebrated for happiness and celebration of life. If a festival becomes a threat to life ,one has tobe alerted about its celebrations. The new trend make it apparent that money is wasted in the name offestivals and ultimately this become vicious trap for the commoner. There is a need to rethink the entire modesof celebrations so that the festivals do not become hazards to our life. Hence some plausible solutions havebeen suggested.

140 Journal of Indian Research
Community Celebration in place of individual celebration should be preferred and encouraged. This will notonly reduce the cost of the celebration but reduce the use of materials causing pollution. Thus there would beless noise, water and air pollution. The celebration should be time framed extending maximum upto 3 to 5 hrs.Instead of buying chemically prepared fast colours, vegetable based, eco- friendly colours should be usedduring Holi. Eco- friendly Diwali crackers can be made by using recycled papers that will help to reduce thedecibel level. In decorating the houses, instead of electrical decoration, the traditional lighting of earthen lampsshould be preferred. This will not only enhance the beauty of the house but cut down the enormous electricconsumption. The earthen lamps use less quantity of oil and it could light up for three to four hours. Thetendency to show off should be avoided. This is because it leads to unbridled consumerism exploiting thenatural resources. During Deepawali, we dispose off old garments, old glass items and other plastic decorativematerials which are unused or unwanted. Some of these remain in nearby dump post causing pollution anddamage to the environment. It is therefore, advised to identify needy people who could find some of theseitems useful to them. In Durga Pooja and Ganesh Chaturthi the idols should be painted with herbal colours.The ornaments should be eco-friendly. Above all there is a need to be more environment conscious so that wedo not sacrifice our long term interest for small short term gains and pleasures. There is also a need to changethe mindset of the people.
Let us be responsible, identify the crisis before it is too late. We are answerable to the generations to come forbeing so reckless and irresponsible. Stop burning crackers and use of synthetic colour, stop polluting the riversand water-bodies, and exercise our wisdom, else we would be compelled to welcome a generation of crippledoff-springs for no fault of theirs. The swelling number of disabled people-both mentally and physically- is atestimony of our failure to check avoidable manmade disasters resulting out of generous loopholes available inthe existing systems of governance. Stringent punishment of highest order should be implemented and invokedagainst those who violate norms to check the growth of defaulters who wilfully pollute the nature, eco-systemand its water bodies. Advent of globalization and free market economy has played havoc with the lives ofIndian masses. Sudden availability of cheap goods which contains pollutants, in the market has taken over theotherwise traditional forms of material available in the Indian market. Traditional mode of celebration wasmore indigenous and eco-friendly. The globalization of economy has left its impact all over the world includingIndia. Strong political will coupled with support from judiciary and community leaders can certainly make adifference in the lives of people, protection of environment, its ecology and precious water bodies and creationof a better world to live in.
Footnotes & References:
1. Sujoy Chatterjee and Dr. Prashant Mehta. Festivals: A Time of Celebration or Impending EnvironmentalDisaster-A Comprehensive Analysis on Degradation of Indian Environment available on
http://www.slideshare.net/prashantmehta371/festivals-a-time-of-celebration-or-impending-environmental-disaster
2. Goel, P.K. and Sharma, K.P., Environmental Guidelines and Standards in India, TechnosciencePublications, Jaipur,1996
3. ibid.
4. Kiran A. Shinde, “This Is Religious Environment” Sacred Space, Environmental Discourses, andEnvironmental Behavior at a Hindu Pilgrimage Site in India. Space and Culture November 2011vol.14 ( 4),pp. 448-463
5. Alley, Kelly D. On the Banks of the Ganga: When Wastewater Meets a Sacred River. Ann Arbor:University of Michigan Press, 2002.

Volume 1, No.1, January-March, 2013 141
6. Alley, Kelly D. “Idioms of Degeneracy: Assessing Ganga’s Purity and Pollution.” In Purifying theEarthly Body of God: Religion and Ecology in Hindu India, ed. Lance E. Nelson, 297–329. Albany, N.Y.:State University of New York Press, 1998.
7. Alley, Kelly D. “Ganga and Gandagi: Interpretations of Pollution and Waste in Banaras.” Ethnology33, no. 2 (spring 1994): 127–45.
8. Purushottama Bilimoria , Environmental Ethics of Indian Religious Traditions
http://home.cogeco.ca/~drheault/ee_readings/East/Suggested/Bilimoria.pdf
Abridged version appeared as ‘Indian Religious Traditions’. In David E Cooper and Joy A Palmer (eds.)Spirit of the Environment, Religion, Value and Environmental Concern. London and New York: Routledge,1998, pp. 1-14
9. ibid.

142 Journal of Indian Research
Journal of Indian Research, Volume 1 No. 1, 2013, 142-145
Literature
SENSUALITY – A CATALYST IN THE GOD OF SMALL THINGS
Rakhi Sharma *,Dr. Pradeep Kumar Talan**
ABSTRACT
Arundhati Roy’s sensational novel, The God of Small Things, which won the Booker Prize(1997),revolves around sensuality. The whole universe appears to fulfill the role of gratification of senses.Sensuality mainly serves as a stimulus to sexuality, the carnal desire of a human being. For Roy,sensuality is an art. She employs it very skillfully and keeps it away from vulgarity. A comparison hasbeen made between John Keats expression of sensuality vis-a-vis Roy’s expressions. The paper examinesthe two writers upon this vital aspect of expression meant to generate aesthetic savouring amongreaders.
Keywords: Sensuality, goosebump, sexual perk, Ammu, Velutha, metaphor“Sensuality, my lovelies, is much more encompassing than just a mere sexual perk. To be sensual means to beacutely aware of your surroundings. It’s the joyous preoccupation with what you smell, touch, hear, taste andsee. With the right state of mind, you can make anything a sensual experience—eating, walking, dancing,gardening, laundry—you name it.” L. B. WoolridgeThe moment we hear the term ‘sensuality’, the very first word that pops into our mind is often ‘sex’. If it is so,we are not wrong; we are not much close to the polysemy characteristics of the term. Most of us thinksensuality and sexuality are synonymous. Our minds are trained that way. The former is an ingredient of thelatter. The first is a free agent that influences the process of sexuality and remains unaffected all through thereaction. Sexuality is not possible without sensuality. To be sensual is not necessarily to be sexual. But it is anecessary condition for a sexual person first to be sensual. So only a sensual person can be sexual. Sensualityworks like a catalyst in the process of sense gratification. It is “a key ingredient in achieving a richer, moresatisfying sexual experience”(Woolridge). It’s not a sexual experience in itself, while it catalyses the humansenses. As per Merriam- Webster’s Collegiate Dictionary, “sensuality” pertains to “senses” and “sensual”explicitly implies “preoccupied with senses” or “devoted to senses”. Thus a sensual person is caught up in hisall five senses and enthralled by them. What he does is credited to the satisfaction of the senses. For aninstance, a person is proclaimed to be a sensualist, if he is fascinated by the beauty of a wild rose, is enchantedby its sweet fragrance and exalted to extreme bliss by its soft touch on the cheeks, on the breasts and on othersensitive organs of the body. The objects which gratify the senses are named as sensuous and the personsgratified are called sensual. Woolridge adds: “Sensual people savor the world around them, not simply observeit. They experience each task rather than rush through it to get at some imagined end, and in so doing, live amore passionate and appreciative existence”(Woolridge). The moment one starts living sensually one begins toexperience the world in all hues and hilarity.
* Rakhi Sharma is Assistant Professor, English, Department of Applied Sciences & Humanities ITS, EngineeringCollege, Greater Noida and research scholar, Mewar University.
** Dr. Pradeep Kumar Talan is Professor of English

Volume 1, No.1, January-March, 2013 143
Roy has adeptly dealt with “sensuality” in the captioned novel The God of Small Things (for which she wasconferred with the Booker Prize circa 1997). If a person, who has read the novel, would call her ‘the queenof sensuality’, it is not a hyperbole. She confirms everyone is sensual more or less, only degree matters. To besensual is to be an epitome of leading fulsome life. In the novel, sensuality mainly serves as a stimulus tosexuality, the carnal desire of a human being. It aids to satisfy genital hunger of Ammu and Velutha. For Roy,sensuality is an art. She employs it very skillfully and keeps away it from vulgarity. She doesn’t allow her manand woman to make love openly. They are never seen making love. They make love either in the dream orimagination of one another. Thus sensuality is not in the activities of the characters-in-chief but lies in theirthoughts and dreams as well. It is in the dream of Ammu or in her melancholy speculation. It is in thecontempt of Mammachi for her daughter and in her bitter disdain for the Paravan. It is in the interrogation ofSHO Thomas Mathew. It lives in the thoughts of Velutha and in his impatient waiting for his beloved Ammu.In the chapter “The God of Small Things”, the novelist paints on canvas, Ammu’s sensual images nude. Thelady sensual is described walking by the light of the oil lamp towards the riverside cottage of her subalternlover. She approaches the place and crouches with her lover, not in actual but in her feel and imagination. Roybeautifully paints her trying to touch the lover and never touching him. Her desire is ever young. The scenereminds us “Ode on A Grecian Urn” wherein the “Bold Lover, never, never canst thou kiss” (Keats). Ammusits there on the river bank and envisages her man with “chocolate ridges” and “strength in the arms”. Shetouches his body “lightly with her fingers” and his ebony skin turns to all goosebumps. She relishes on how herman sighs and responds to her every twist and turn. She slides her seductive fingers on the “chocolate ridges”to “the base of his stomach”. As she moves on, she experiences the “trails of bumpy gooseflesh on his body,like flat chalk on a black board, like a swathe of breeze in a paddy-field, like jet streaks in a blue church-sky”(Roy).The lady envisages him and touches his sensitive organs; she feels her body shudder. As if a sweetshivering seeps through the fingers to her brain. In another scene, Ammu sips “the last of the river from thehollow of his navel” (Roy).She calls up the happy days enjoyed with Velutha. She feels totally desperate andignored by all. She feels alone and unsafe without her man in “mundu” and with “might”. Velutha is brutallykilled and departs from her life forever. Ammu conjures her “God of small things” – Velutha who used to giveher small things like reed toys and other tiny things made of wood when she was a small girl and he also asmall boy –and is sensualized by his presence. She finds her twins who she used to call “millstones” no moreburdens but calls them “twin midwives”. They come forth to assist her mother in her sublime deed. Theyappear to “prepare the ground for them” for their love making. Velutha collects her hair and makes a hide forthe safe play. He touches on and around her swanlike neck and goes all crazy. The lady is mesmerized andfinds herself “naked” and “crouches over him” slowly and urgently. She slides further down and forceintroduces herself to “the rest of him”. As a true sensual, she revels in every part of him and enjoys his every‘coil and curve’ in the darkness beyond “the oil lamp”. Then she tastes him “salty in the mouth”. She lick-cools down his sensual fire and experiences the bliss in the act.
As in the novel, it seems that Roy herself has experienced the world around from “a sensual perspective”. Shedoesn’t seem to take “sensuality” as “a sexual perk”, but enjoys it all the time in its every aspect and spec. Wefind it in the way Ammu serves herself to her “luminous man”. It lies in the metaphors, the novelist uses todepict the seductive images of the lovers. Ammu feels herself as ‘a wide and deep river’ and her lover as ‘arower of the deep waters’. She envisages her man with “chocolate chest” sailing on her waters. He sails forthand back, sideways and across Ammu, the deep and silent river. She enjoys the moments the sailor dives deep,deeper and the deepest, and exhausts his all strength to fathom her depth. The farther she lets him delve anddive, more she enjoys him rowing upon herself. The farther he sails on her the more she gets wayward andsot. They perform foreplay under the deep waters. How much sensuous is to imagine about the water fore-play! She lies against him on the sandy bank of the river. He gently but “urgently” turns her over the back.Then he “wipes the sweat and grit from her” (Roy).The lover shows his prudence during the play while to dothat is a tough job. He proves himself a man of senses, not as of animal instincts. He handles his beloved very

144 Journal of Indian Research
carefully and holds up her softly on his arms and softly but “urgently” gets into her. Ammu as the river isbottomless and Velutha as the rower has his limits –of skill and strength. The moment he touches “the deepestof her”; he is all tired of the excursion. Yet he regrets over his failure not to touch the bottom of the river. Heknows that none could gauge the depth of the lady river and none can ever do, yet like a fly around the flamehe goes deeper and much deeper, and finally drowns and dies.
Dance is a sense- triggering and tension -exorcising exercise. It is an art to arouse sexual desire at spur. Royhas beautifully employed “dance” in this book. Ammu dances for her lover. One dances to display one’sstrong passion of grief, gaiety, love, hatred etc. Kunti (of The Mahabharata) dances for expressing her ‘utterhumiliation’ and ‘penitence’ she committed having let her first son live life of a waif. Ammu dances here toexpress her passionate love for the sailor. She dances and involves the lover in her dance and pulls him todance with her. She dancingly drags in and bends him to suck joy from “the innermost part of her” (Roy). Hedrinks “long and deep from the bowl of her” (Roy).She lived “seven years of oblivion”(Roy)at the sublimemoment and cried with pleasure and laughed insanely. She reached the apex of the bliss from where shecouldn’t go ahead anymore and similarly was impossible for her to come down too. Thus Ammu and her manenjoyed to the fullest, the eternity of the “five minutes”. But this carnal journey leads to “Age and Death”. Itprovided the lovers five immortal minutes to live whole life and ultimately took Velutha to his tragic end. It wasvery late when he realized the act anti-social and felt himself guilty: “Slowly, felt he, the terror seeped backinto him. At what he had done. At what he knew he would do again” (Roy).Despite the man finds himself inthe clutch of sensuality. He is aware of the deed but finds helpless to do it again and again. Because he can’trun away from his nature and that is his Ammu. He confesses his guilt and also foresees its deadly consequence;but can’t stop to rethink of it. She is the source of energy, as he confirms, to recharge him every night. Hebelieves he can not live another round the clock if she doesn’t let him suck the revival juice from “theinnermost part of her”. The lady is also aware of her illicit relation with a low caste Paravan and its fatalconsequence. So she seems a bit worried about her safety and social image. But simultaneously she cannotkeep away from sensual bliss. She feels unsafe everywhere in “the old house” and in the society for whereshe is mentally and physically tortured by her own kiths and outsiders too. That’s why she finds relatively safein the arms of her lover.
Velutha wants to nibble on the bait but fears the hook at the same time. A person, who eats the dish, can’tspare it. If the man wishes to eye-drink “the seductive nudity” of the lady, he can’ be deprived of beingsensualized. As Velutha dares enjoy the scene, terror seeps into his veins: I could lose everything, My job.My family. My livelihood, Everything (Roy).Sensation subjugates reason. He is tempted to touch her, feelher shuddering and her “aching desire”. He is required urgently to take “the bait”. He wants to feed on herurgently without caring for his brutal end. Her “brownness” against his “blackness” electrified desire. Her“softness” against his “hardness” made him more careful and considerate towards her. Her “slant gaze”across the succinct breast made him rock from inside out. The vista served a sensuous dinner to his sensualeyes. He listens to the throbs of her heart fast and faster. She likes “smooth ebony chest” and relishes untothe core and savors the saltiness of the river on him. She savors his “particular smell”; the same which wasdisgusted by Baby Kochamma, her aunt. Ammu puts her tongue and tastes it in “the hollow of his throat” andon “the lobe of his ear”. She gathers him into her, pulls his head and drinks his salty lips. Unlike Rahel, herdaughter, she demands “a kiss-back”. Rahel, as a child kissed Velutha several times for the small things hegave her and her brother Estha; but she never demanded “a kiss-back” from him. Velutha returns it (toAmmu) “First cautiously and Then urgently” (Roy).He remains careful how to avoid any hurts during the play.A rough and black Paravan should ever be cautious against a soft brownish Syrian Christian. To give any hurtto a high born tender and tidy girl is a more serious crime than the deed. It will rather deeply stain his soul,which can never be blotted away. So he is all considerate for her, her beloved. She also cannot imagine herexistence without him. She experienced herself alive only in those parts which he sensually touched –and “the

Volume 1, No.1, January-March, 2013 145
rest was smoke”. In another tryst the lovers are envisaged coiled and lip-locked. The view flows thrill in theonlookers too. Velutha touches her on “haunches” and”shudder” flows into her body. She falls into the“strength of his arms” and feels her lips automatically pulled unto his. Then she thinks to know how much hewants her and measures her fidelity towards him.
Keats is studied as the gratifier of five human senses –touch, taste, smell, sight and hearing. The poet everintends to sensualize the readers on the sensuous objects in his works. Roy sensually portrays the seductiveimages of Ammu; similarly Keats also beautifully draws bewitching poses of Madeline (of The Eve of St.Agnes). Like Ammu, Madeline undresses herself and electrifies sensuality in her lover Porphyro. Keatsinspires ‘senses’ gradually and steadily while Roy seems impatient; so she ever gets ready to gratify them“urgently”. Mammachi’s rage at “the old one eyed Paravan” displays her cold contempt for her daughter andbitter disgust for her lover. The old lady also envisages her daughter untying her top and letting the lower creep‘rustling to the knees’; and then coupling “in the mud with a man who was nothing but a filthy coolie”(Roy).Theman was “filthy” only for the old lady; but for Ammu a man with “chocolate ridges” and “the carpenter’sarms”. The more the old lady depicts her contempt the more Ammu rejoices in. The former further imaginesgrope for “a Paravan’s coarse black hand on her daughter’s breast” (Roy).
Hence Roy is discovered as a lady of quick senses and the queen of sensuality as well. Unlike Roy, Keatswho suggests his people relish on sensuous things gradually and steadily is a man of slow and steady senses.Apart from, one thing is common: both are the great dealers of sensual pleasure and both are preoccupied withand devoted to the five human senses. Thus Roy has successfully employed ‘sensuality’ as a catalyst in theprocess of ‘sense gratification’ and especially in ‘genital satiation’. So a sensual person can be sexual but it isnot a necessary condition for a sexual person to be sensual. Really the world is awesome if we experience itfrom “a sensual perspective”.
References:
Woolridge, L Bryant. Weapons of Mass Seduction. United States: Broadway, 2007.
Ramji Lal.ed. John Keats, Studies in Poets: An Evaluation of His Poetry. New Delhi: Rama Brothers,1998.
Roy, Arundhati. The God of Small Things. New Delhi: Penguin Books, 2002.
(All citations in the text are from the same book)

BOOK REVIEW
SCHOOL EDUCATION, PLURALISM AND MARGINALITY:COMPARATIVE PERSPECTIVES
Edited by Christine Sleeter, Shashi Bhushan Upadhyay, Arvind K. Mishra and Sanjay Kumar
Orient Blackswan, New Delhi, 2012, pp. 480, Price not mentioned
Review by Pankaj K Deo
Multiculturalism and plurality have emerged as major challenges for the policy planners associated with schooleducation and curriculum. This book, which is the outcome of an international conference on School Education,Pluralism and Marginality: Comparative Perspectives, tries to bring into focus issues of pluralism andmarginality related to school education. The articles in the book present a cornucopia of critical theories andopinions from a global perspective on pedagogical complexities involved in the delivery of education in amulticultural society. The introduction in the book puts the entire issue succinctly, “Large scale migrations, inthe wake of expanding global capitalism, are repopulating schools and communities on a grand scale.”Societies are perforce becoming multicultural the world over and presenting a plethora of pedagogical perplexitiesfor curriculum designers. Christine Sleeter in her essay explains, “Since textbooks in the USA today appearmulticultural on the surface, many teachers see no need for further work on curriculum.” Sleeter cites theexample of a white teacher named Kelly who found that students’ engagement went up considerably in a classhaving students from multicultural backgrounds once she revamped her lesson plan with historical materialrepresenting Native Americans, African Americans, and Mexican Americans.
The problem of bringing subjugated knowledge into the curriculum and handling it pedagogically is far morechallenging in India which has been a multicultural society for centuries. The articles by prominent Indianauthors in the book mainly explore the problems of pedagogy and the challenges of developing a curriculumthat will have an inclusive approach towards the diverse strands of Indian population. While discussing theeducation system in India, the book does acquire a discursive framework through the viewpoints of prominentpractitioners of pedagogy and discuss threadbare the issues of hegemony and empowerment related toeducation system. Alternative viewpoints and pedagogical practices from countries like the USA, the UK,Europe, South Africa and South Asia have been presented cogently in the book.
Many of the papers included in the book deal with how students learn within the framework of an educationsystem wherein dominant pedagogical practices seem to prevail and marginalization in plural context isconsidered nearly inevitable. In such an education scenario, the essays within the book seem to challengemarginalization by offering insights into the role played by culture, power and pedagogy in the delivery ofeducation. The book questions the notion propagated by certain power groups that have historically subjugatedcertain pockets of population that these groups or pockets suffer from certain inherent deficiencies. The bookanalyzes at micro and macro levels how dominant power structure has ensured that such marginalized groupsare represented negatively. Different chapters of the book offer multifarious ways of addressing schooleducation in plural contexts.
What we fail to get from this book as a whole is a single comprehensive framework for a nationalistic/pluralistic system of multicultural education that can be applicable to India/South Asia. However, it is atreasure trove of perspectives for those engaged in designing inclusive and critical multicultural/plural curriculum.The book is comprised of four sections; however, these sections are not coherently clubbed as the chapters/papers have near similar themes running across though with different ‘texts’ and ‘contexts’. The Introductionalso falls short of giving a comprehensive account of the discourses which interweave various strands of thedebate and point out trends and paradigm shifts taking placing in this arena.

Volume 1
Num
ber 1January-M
arch 2013