volume 3 travel demand model documentation and user's guide
DESCRIPTION
LRTP 2035 Travel Demand Model Documentation and User's GuideTRANSCRIPT
Volume 3 Travel Demand Model Documentation
and User’s Guide
February 16, 2010
p r e p a r e d b y


Chattanooga TPO 2035 LRTP – Volume 3: Travel Demand Model Documentation & User’s Guide
i
TABLE OF CONTENTS
1.0 Introduction ........................................................................................................................... 1 1.1 Model Certification Process ......................................................................................... 1 1.2 Datasets Available ......................................................................................................... 2 1.3 Overview of Model Performance and Documentation ........................................... 3
2.0 Data Development and Review ......................................................................................... 5 2.1 Traffic Analysis Zones .................................................................................................. 5 2.2 Socioeconomic Data ...................................................................................................... 9 2.3 Updating Highway Network to 2007 Conditions .................................................... 20 2.4 Traffic Count Data ......................................................................................................... 29 2.5 Screenline Locations ..................................................................................................... 29 2.6 Travel Surveys ............................................................................................................... 33
3.0 External Trips ........................................................................................................................ 35 3.1 External Model .............................................................................................................. 35 3.2 External Validation Adjustments ................................................................................ 39 3.3 External Validation Results ......................................................................................... 39
4.0 Trip Generation..................................................................................................................... 41 4.1 Trip Generation Process ............................................................................................... 41 4.2 Trip Generation Validation Adjustments .................................................................. 42 4.3 Trip Generation Validation Results ............................................................................ 45
5.0 Trip Distribution .................................................................................................................. 47 5.1 Trip Distribution Model Structure .............................................................................. 47 5.2 Trip Distribution Model Development and Validation ........................................... 48 5.3 Trip Distribution Model Results ................................................................................. 51
6.0 Mode Choice .......................................................................................................................... 55 6.1 Mode Choice Model Structure for General Highway Assignment ........................ 55 6.2 Mode Choice Model Structure for Exclusive HOV or Truck Lanes ....................... 56 6.3 Mode Choice Model Structure for Time-of-Day Model .......................................... 57
7.0 Highway Assignment .......................................................................................................... 59 7.1 Highway Assignment Model Structure ..................................................................... 59 7.2 Development and Validation of Highway Assignment Model .............................. 59 7.3 Highway Assignment Validation Results ................................................................. 60
8.0 Summary and Conclusions ................................................................................................. 67 8.1 Summary of 2007 Model Validation Observations .................................................. 67 8.2 Future Model Enhancements....................................................................................... 68
Chattanooga TPO 2035 LRTP – Volume 3: Travel Demand Model Documentation & User’s Guide
ii
TABLE OF CONTENTS (continued)
Appendix A: Network Project Lists
Appendix B: Technical Memorandum #1
Appendix C: Technical Memorandum #2
Appendix D: Technical Memorandum #3
Appendix E: 2007 Volume-to-Count Ratios
Appendix F: User’s Guide

Chattanooga TPO 2035 LRTP – Volume 3: Travel Demand Model Documentation and User’s Guide
i
LIST OF TABLES
2.1 Number of TAZs in TransCAD Model .............................................................................. 5
2.2 Regional Summary of Socioeconomic Data for 2035 LRTP Update............................... 11
2.3 Facility Type Codes ............................................................................................................... 21
2.4 Area Type Codes ................................................................................................................... 21
3.1 Internal-External (IE) and External-External (EE) Percentage Splits ............................. 36
4.1 New Chattanooga Trip Production and Attraction Rates ............................................... 43
4.2 Special Generator Locations ................................................................................................ 44
4.3 Aggregate Trip Rates ............................................................................................................ 45
4.4 2007 Trips per Household by Trip Purpose ...................................................................... 46
4.5 Percent of Trips by Purpose ................................................................................................. 46
5.1 Terminal Times ...................................................................................................................... 48
5.2 2007 Trips Between K-Factor Districts ............................................................................... 49
5.3 2035 Trips Between K-Factor Districts ............................................................................... 50
5.4 Penalties .................................................................................................................................. 50
5.5 Average Trip Length (in Minutes) ...................................................................................... 52
5.6 Intrazonal Trips by Trip Purpose ........................................................................................ 53
6.1 Auto Occupancy Rates ......................................................................................................... 56
6.2 Vehicle Occupancy Allocation by Trip Purpose ............................................................... 57
6.3 Temporal Distribution of Trips ........................................................................................... 58
7.1 Volume Over Count Ratios by Facility Type, Area Type and Number of Lanes ........ 61
7.2 Comparison of Volume-to-Count Ratios by Screenline................................................... 62
7.3 Percent Difference for Daily Volumes (Calculated for Links with Counts) ................. 63
7.4 Root Mean Square Error (RMSE) by Volume Group ....................................................... 64
7.5 Vehicle Miles Traveled by Model Facility Type ............................................................... 65

Chattanooga TPO 2035 LRTP – Volume 3: Travel Demand Model Documentation and User’s Guide
ii
This Page Intentionally Left Blank
Chattanooga TPO 2035 LRTP – Volume 3: Travel Demand Model Documentation and User’s Guide
iii
LIST OF FIGURES
2.1 TAZ Splits ............................................................................................................................... 7
2.2 Regional Summary of Socioeconomic Data for 2035 LRTP Update............................... 11
2.3 Comparison of Households Between 2030 and 2035 LRTP Models .............................. 12
2.4 Comparison of Households Between All 2035 LRTP Model Years ............................... 12
2.5 Comparison of Population Between 2030 and 2035 LRTP Models ................................ 13
2.6 Comparison of Population Between All 2035 LRTP Model Years ................................. 14
2.7 Comparison of Employees Between 2030 and 2035 LRTP Models ................................ 15
2.8 Comparison of Employment Between All 2035 LRTP Model Years .............................. 15
2.9 Comparison of Hotel-Motel Units Between 2030 and 2035 LRTP Models ................... 16
2.10 Comparison of Hotel-Motel Units Between All 2035 LRTP Model Years .................... 17
2.11 Comparison of School Enrollment Between 2030 and 2035 LRTP Models ................... 18
2.12 Comparison of School Enrollment Between All 2035 LRTP Model Years .................... 18
2.13 Comparison of College Enrollment Between 2030 and 2035 LRTP Models ................. 19
2.14 Comparison of College Enrollment Between All 2035 LRTP Model Years .................. 20
2.15 2007 Model Network by Facility Type ............................................................................... 23
2.16 2007 Model Network by Area Type ................................................................................... 25
2.17 2007 Model Network by Number of Lanes ....................................................................... 27
2.18 Screenline Locations ............................................................................................................. 31
3.1 External Station Locations ................................................................................................... 37
7.1 Correlation of Assigned Versus Observed Volumes ....................................................... 63

Chattanooga TPO 2035 LRTP – Volume 3: Travel Demand Model Documentation and User’s Guide
iv
This Page Intentionally Left Blank

Chattanooga TPO 2035 LRTP – Volume 3: Travel Demand Model Documentation and User’s Guide
1
1.0 Introduction As part of Chattanooga-Hamilton County/North Georgia (CHCNGA) 2035 Long-Range Transportation Plan (LRTP) Update, the TransCAD travel demand model was updated and revalidated to the base year 2007 with a horizon year 2035. The first phase of the LRTP update includes the development and review of base year 2007 input data and validation of the model to base year conditions. Subsequent phases of this study include the forecasting of future year 2035 external trips, the preparation of an existing-plus-committed (E+C) network, and an evaluation of future travel demand within the CHGNGA Transportation Planning Organization (TPO) boundary. The TPO boundary includes all of Hamilton County in Tennessee and portions of Catoosa, Dade, and Walker Counties in Georgia. The validated 2007 model and CHCNGA 2035 transportation recommendations were utilized in the development of the CHCNGA Transportation Planning Organization’s (TPO) 2035 LRTP. The LRTP was conducted for the TPO housed within the Chattanooga-Hamilton County Regional Planning Agency (RPA) using a consultant team led by Cambridge Systematics. Cambridge Systematics developed and validated the base and future year model, while RPA staff developed the socioeconomic data for input into the travel demand model.
1.1 Model Certification Process
The base year 2007 Chattanooga-North Georgia travel demand forecasting model uses procedures and model accuracy requirements consistent with state and national standards. National standards are documented in the Model Validation and Reasonableness Checking Manual coauthored by Cambridge Systematics for the Federal Highway Administration (FHWA). Effective March 1, 2008, the Tennessee Department of Transportation (TDOT) Long-Range Planning Division, Systems Planning and Policy Office implemented a Division Procedure for the MPO model approval process. On August 20, 2008, the TPO met with its consultants along with TDOT, GDOT, and CARTA to discuss the TransCAD modeling efforts for the CHCNGA 2035 LRTP Update. It was agreed at that time that the following four submittals would be provided to TDOT and GDOT as part of TDOT’s model approval process:
1. Outline of the model, planning assumptions to date, and model validation worksheet template;
2. Year 2007 and 2035 socioeconomic data files (TransCAD and GIS) for the TPO region, including any maps, graphs, charts, or tables developed as part of the TPO’s internal review;
3. Populated validation worksheet upon completion of draft validated model. This worksheet will include statistics for Trip Generation, Trip Distribution, Mode Choice (if applicable), and Traffic Assignment. If the assumptions included in submittal #1 change

Chattanooga TPO 2035 LRTP – Volume 3: Travel Demand Model Documentation and User’s Guide
2
as part of the validation process, they will be documented and submitted for approval at this time; and
4. Full model documentation report and user’s guide, along with all TransCAD files, after the draft LRTP has been documented.
Submittal #1 was submitted and approved by TDOT in September 2008. Subsequently, Regional Planning Agency (RPA) staff and its consultant, Cambridge Systematics, held a teleconference with the Georgia Department of Transportation (GDOT) and TDOT on June 30, 2009 to discuss the draft socioeconomic data and preliminary validation statistics, as outlined in this submittal.
Submittal #2, which included the 2007 and 2035 socioeconomic data, was submitted to TDOT, GDOT, and the air quality Interagency Consultation Committee (ICC) in July 2009 and approved during the ICC meeting on August 6, 2009.
Preliminary validation statistics were provided to the Interagency Consultation Committee (ICC) for review in advance of the September 3, 2009 ICC meeting. Submittal #3 was submitted to TDOT, GDOT, and the ICC on September 28, 2009. Comments were received by TDOT on October 8, 2009 and addressed via teleconference between TDOT and Cambridge Systematics on October 12, 2009.
This full report constitutes Submittal #4, provided to TDOT and GDOT for review and approval in early December 2009.
1.2 Datasets Available
Several datasets were created for the purpose of developing the 2035 LRTP, as well as for demonstrating air quality conformity for Particulate Matter (PM2.5). Air quality emissions are documented in the Conformity Determination Report (CDR) which constitutes Volume 2 of the three-volume LRTP series. Transportation projects included in each of the model networks are listed in Appendix A of this document. The following model datasets are available:
• 2002 – Used for air quality baseline emissions.
• 2007 – Base year validated model.
• 2009 – Used to compare with emissions in the State Implementation Plan (SIP) for PM2.5.
• 2015 Existing-Plus-Committed (E+C) – Used to determine what congestion would be in the year 2015 if no further transportation improvements were funded above and beyond what currently is in the FY ‘08-‘11 Transportation Improvement Program (TIP). Nonexempt (new road or widening) projects expected to complete construction by the end of calendar year 2011 are included in the E+C transportation network.

Chattanooga TPO 2035 LRTP – Volume 3: Travel Demand Model Documentation and User’s Guide
3
• 2015 Fiscally Constrained LRTP (Tier 1) – Includes all nonexempt projects funded for construction prior to or during year 2015 (Tier 1) of the fiscally constrained LRTP.
• 2025 E+C – Used to determine what congestion would be in the year 2025 if no further transportation improvements were funded above and beyond what currently is in the FY ‘08-‘11 Transportation Improvement Program (TIP). Nonexempt (new road or widening) projects expected to complete construction by the end of calendar year 2011 are included in the E+C transportation network.
• 2025 Fiscally Constrained LRTP (Tier 2) – Includes all nonexempt projects funded for construction prior to or during year 2025 (Tier 2) of the fiscally constrained LRTP.
• 2035 E+C – Used to determine what congestion would be in the year 2035 if no further transportation improvements were funded above and beyond what currently is in the FY ‘08-‘11 Transportation Improvement Program (TIP). Nonexempt (new road or widening) projects expected to complete construction by the end of calendar year 2011 are included in the E+C transportation network.
• 2035 Fiscally Constrained LRTP (Tier 3) – Includes all nonexempt projects funded for construction prior to or during year 2035 (Tier 3) of the fiscally constrained LRTP.
The above nine datasets have been provided to TDOT and GDOT as part of this Volume 3 submittal.
1.3 Overview of Model Performance and Documentation
This technical report, which constitutes Volume 3 of the three-volume LRTP series, provides detailed information on the development and validation of the TransCAD travel demand model. Section 2.0 describes the data development and review process, including traffic analysis zones (TAZs) and highway network information. Section 3.0 describes the estimation of base year external trips. Section 4.0 provides information on the trip generation model while Section 5.0 explains the trip distribution model. Section 6.0 describes the mode choice model while Section 7.0 provides information on the highway assignment model. The report concludes with a summary and discussion of next steps and future model enhancements in Section 8.0. Section 8.0 also includes a summary bullet list of the overall model performance. Overall, the 2007 model is performing within acceptable limits with an overall volume-to-count ratio of 0.96 and a Root Mean Square Error (RMSE) of 34.6 percent.

Chattanooga TPO 2035 LRTP – Volume 3: Travel Demand Model Documentation and User’s Guide
4
This Page Intentionally Left Blank

Chattanooga TPO 2035 LRTP – Volume 3: Travel Demand Model Documentation and User’s Guide
5
2.0 Data Development and Review Section 2.0 describes in detail the traffic analysis zone (TAZ) structure, socioeconomic data, highway network, traffic count data, screenline locations, and travel surveys.
2.1 Traffic Analysis Zones
As part of the previous 2030 LRTP Update, the TPO converted the old MINUTP model to TransCAD and refined the TAZ structure significantly resulting in 445 total TAZs for the entire model region. After the 2030 LRTP was adopted, the TPO added more TAZs to Catoosa County as the remaining sliver of Catoosa County not in the previous model was added for the purpose of calculating emissions for air quality conformity. This addition resulted in a total of 450 TAZs for the entire model region. As part of this current 2035 LRTP Update, the TPO has further refined the TAZ structure by splitting internal zones mostly in the outlying regions of the model and within the downtown area of Chattanooga. Previously, the Enterprise South Industrial Park (ESIP) area was included within one TAZ. As part of this update, the ESIP TAZ has been split into eight TAZs based on the ESIP future site plan. In addition to splitting several internal zones, eight more external zones were added to the current model, as indicated in Table 2.1 below. All of these TAZ splits have resulted in a current total of 628 TAZs (590 internal + 38 external) in the entire model region, an increase of 178 TAZs, or 40 percent more zones. Maps illustrating the TAZ splits are attached.
Table 2.1 Number of TAZs in TransCAD Model
2030 LRTP Model Expanded Catoosa
Model 2035 LRTP Model
Internal TAZs 415 420 590
External TAZs 30 30 38
Total TAZs 445 450 628
The following criteria were used to determine if a TAZ should be split, when feasible:
• Greater than 15,000 productions per TAZ in 2030;
• Irregular shaped or large sized TAZs;
• Major existing or planned roads bisecting TAZ; and
• Potential special generator located in TAZ (i.e., isolated TN Aquarium).

Chattanooga TPO 2035 LRTP – Volume 3: Travel Demand Model Documentation and User’s Guide
6
The following guidelines were used to split the TAZ boundaries, when feasible:
• Existing and future roadways;
• Existing and future land use;
• Railroads;
• Water bodies; and
• Census block group boundaries.

Chattanooga TPO 2035 LRTP – Volume 3: Travel Demand Model Documentation and User’s Guide
7
Figure 2.1 TAZ Splits

Chattanooga TPO 2035 LRTP – Volume 3: Travel Demand Model Documentation and User’s Guide
8
This Page Intentionally Left Blank

Chattanooga TPO 2035 LRTP – Volume 3: Travel Demand Model Documentation and User’s Guide
9
2.2 Socioeconomic Data
RPA staff developed the 2007 and 2035 socioeconomic data as part of the Chattanooga-Hamilton County/North Georgia 2035 LRTP Update. Historically, the Coosa Valley Regional Development Center (RDC) has developed the socioeconomic data for the Georgia portion of the TPO. However, development of the socioeconomic data for the Georgia side has since become the responsibility of the TPO due to funding limitations. Year 2015 and 2025 socioeconomic data used to develop the Tier 1 and 2 models, respectively, were interpolated using 2007 and 2025 socioeconomic data and then adjusted in the Enterprise South area to reflect build-out of the Volkswagen manufacturing plant by model year 2015. Since model years 2002 and 2009 are used for air quality conformity purposes only, they are documented in the Conformity Determination Report constituting Volume 2 of the three-volume LRTP series.
Variables
The socioeconomic data included in the TransCAD travel demand model can be broken in to four categories, as follows:
• Household Data – Includes total population, school-age children (population between ages 3 and 18), and total housing units.
• Employment – Includes total number of employees and number of employees for each of the five employment categories:
- Agricultural/mining/construction;
- Manufacturing/transportation;
- Retail;
- Service; and
- Government.
• School Enrollment – Includes number of grade school students at the location of the school, number of university students at the location of the university, and total school enrollment (grade school students plus university students). University student enrollment includes community, technical, or vocational colleges and universities.
• Hotel-Motel Units – Includes number of hotel-motel units.
Methodology
The RPA collected the number of building permits issued between 2000 and 2007 for each of the four counties, geocoded their locations, and added the new building permits to the 2000 households by TAZ to achieve 2007 households. Population for the year 2007 was
Chattanooga TPO 2035 LRTP – Volume 3: Travel Demand Model Documentation and User’s Guide
10
calculated by applying the persons per household ratio in each of the year 2000 zones to the total number of households in 2007. If a zone was split, the persons per household ratio from the parent zone in the year 2000 was applied for each split zone. However, subsequent logic checks determined that some manual adjustments were necessary in Dade and Hamilton Counties to reflect more reasonable persons per household ratios and thus, the overall persons per household ratio for the entire county were applied to those specific zones. The proportion of the total population attributable to school-age children was calculated using 2007 American Community Survey (ACS) data for each of the four counties, with the exception of Dade County, which utilized the same school-aged children factor in Walker County as ACS data was not available for Dade County. Building permit data for Hamilton County were acquired from the municipal building permit files, whereas building permit data for Catoosa and Walker Counties were acquired from The Market Edge, an information reporting service. Since building permits are not required in Dade County, electrical inspection records were acquired from the County as proxy for building permits.
As part of the current 2035 LRTP Update, the RPA evaluated a number of sources for employment data as there were significant discrepancies in the employment control totals between the different data sources within the region. After careful review, it was determined that year 2007 ES202 employment data from the Bureau of Labor Statistics (BLS) be used. Previously, as part of the 2030 LRTP Update, RPA staff utilized the employment control totals from the Bureau of Economic Analysis (BEA) while using Dun & Bradstreet point data to distribute the BEA employment by TAZ. This previous method was used due to some of the suspect employment numbers in the Dun & Bradstreet data. Since then, it has been determined that the ES202 employment data is more comparable to other data sources and the BEA control totals for the year 2000 may have been overestimated. As a result, when comparing the 2000 employment to the 2007 employment, there is a significant decrease in employment from the year 2000 to 2007. However, as mentioned above, it is likely that the 2000 employment was erroneous.
School enrollment data were collected from local school boards, the phone book, Internet, and applying local knowledge.
The number of hotel-motel units were collected from the Visitors Bureau, in-house Geographic Information Systems (GIS) file, a field survey, as well as the phone book and the Internet.
Observations
As indicated in Table 2.2, between the years 2007 and 2035, the Chattanooga region is expected to grow by approximately 39 percent in population and employment. Since the number of school-age children is decreasing in the region, school enrollment is only expected to increase by 16 percent. Although employment decreased from the year 2000 to 2007, as discussed earlier, employment does increase by 39 percent from the year 2007 to 2035, consistent with household and population forecasts. Figure 2.2 compares the regional

Chattanooga TPO 2035 LRTP – Volume 3: Travel Demand Model Documentation and User’s Guide
11
summary of each socioeconomic variable between the years 2007 and 2035. As expected, all variables increase from the year 2007 and 2035.
Table 2.2 Regional Summary of Socioeconomic Data for 2035 LRTP Update
Variable
Total Region Percent Growth
from 2007 to 2035 2007 2015 2025 2035
Households 178,557 199,570 225,878 252,148 41%
Population 425,724 473,614 533,492 593,335 39%
Employment 218,612 251,377 278,244 305,061 40%
Hotel-Motel Units 9,693 10,274 11,001 11,729 21%
School Enrollment 69,102 72,547 76,851 80,357 16%
College Enrollment 24,459 25,679 27,202 29,520 21%
Figure 2.2 Regional Summary of Socioeconomic Data for 2035 LRTP Update
0
100,000
200,000
300,000
400,000
500,000
600,000
700,000
Households Population Employment Hotel-Motel Units
School Enrollment
College Enrollment
2007
2015
2025
2035
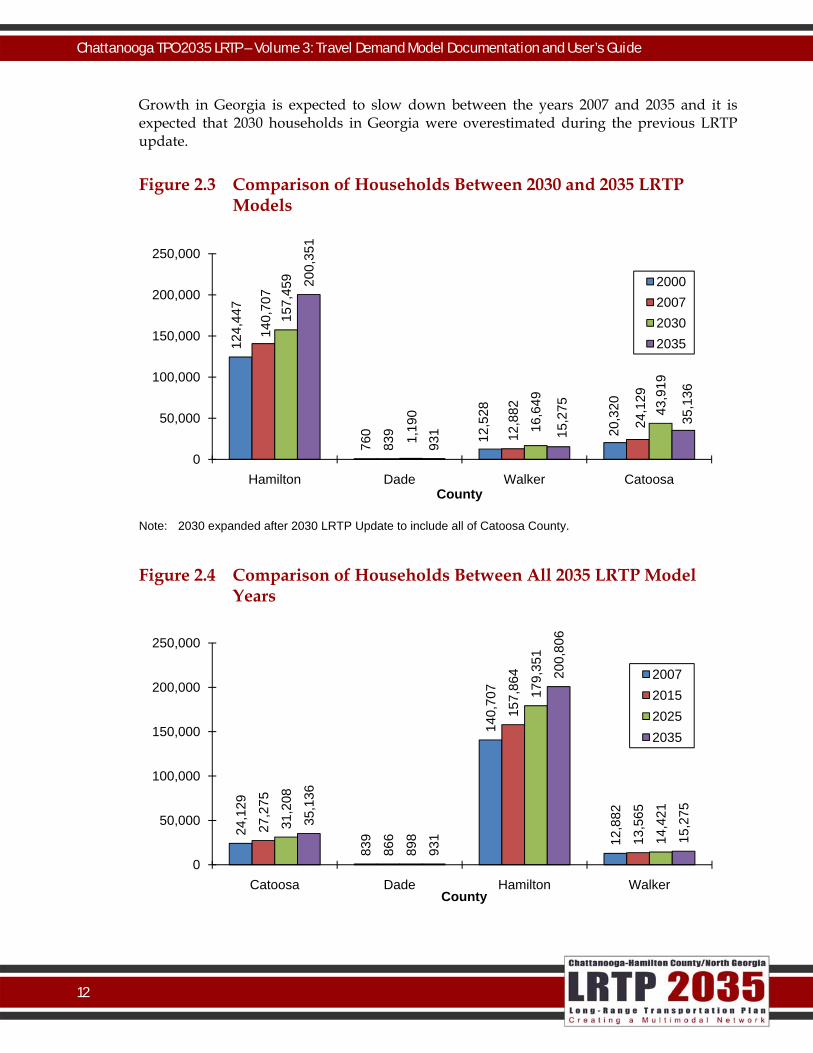
Households
Figure 2.3 below compares the number of households between the previous 2030 LRTP (years 2000 and 2030) and the current 2035 LRTP Update (years 2007 and 2035). With the exception of the Georgia counties in the year 2030, the households increase for each year.
Chattanooga TPO 2035 LRTP – Volume 3: Travel Demand Model Documentation and User’s Guide
12
Growth in Georgia is expected to slow down between the years 2007 and 2035 and it is expected that 2030 households in Georgia were overestimated during the previous LRTP update.
Figure 2.3 Comparison of Households Between 2030 and 2035 LRTP Models
124,
447
760 12
,528
20,3
20
140,
707
839 12
,882
24,1
29
157,
459
1,19
0
16,6
49
43,9
19
200,
351
931 15
,275
35,1
36
0
50,000
100,000
150,000
200,000
250,000
Hamilton Dade Walker CatoosaCounty
2000200720302035
Note: 2030 expanded after 2030 LRTP Update to include all of Catoosa County.
Figure 2.4 Comparison of Households Between All 2035 LRTP Model Years
24,1
29
839
140,
707
12,8
82
27,2
75
866
157,
864
13,5
65
31,2
08
898
179,
351
14,4
2135,1
36
931
200,
806
15,2
75
0
50,000
100,000
150,000
200,000
250,000
Catoosa Dade Hamilton WalkerCounty
2007201520252035

Chattanooga TPO 2035 LRTP – Volume 3: Travel Demand Model Documentation and User’s Guide
13
Population
As indicated in Figure 2.5, population in Hamilton County increases each year, regardless of which LRTP update. However, Dade County population decreased from the year 2000 to 2007, even though the number of households increased. This is as a result of adjusting the number of persons per household ratio to more accurately reflect existing conditions in Dade County, which are more consistent with the other counties in the TPO region. In addition, it is suspected that the year 2030 population in the Georgia counties was overestimated during the previous 2030 LRTP as growth is expected to slow down in Georgia.
Figure 2.5 Comparison of Population Between 2030 and 2035 LRTP Models
307,
897
2,46
0
31,7
49
52,9
55
328,
674
2,14
0
32,6
66
62,2
44
362,
330
3,83
7
42,0
85 114,
556
463,
347
2,35
4
38,5
75 88,0
58
050,000
100,000150,000200,000250,000300,000350,000400,000450,000500,000
Hamilton Dade Walker CatoosaCounty
2000
2007
2030
2035
Note: 2030 expanded after 2030 LRTP Update to include all of Catoosa County.

Chattanooga TPO 2035 LRTP – Volume 3: Travel Demand Model Documentation and User’s Guide
14
Figure 2.6 Comparison of Population Between All 2035 LRTP Model Years
62,2
44
2,14
0
328,
674
32,6
66
69,6
16
2,20
2
367,
443
34,3
5378,8
43
2,27
7
415,
905
36,4
6788,0
58
2,35
4
464,
348
38,5
75
050,000
100,000150,000200,000250,000300,000350,000400,000450,000500,000
Catoosa Dade Hamilton WalkerCounty
2007201520252035
Employment
As mentioned earlier, the source of the employment data has changed since the previous LRTP and thus, there is a significant reduction in employees from the year 2000 to 2007 due to suspected overestimation in the year 2000. Year 2007 employment data was based on ES202 records from the BLS and was supplemented by records from the Chamber of Commerce, schools, motel in-house records, and job announcements from the newspaper. Year 2000 data was compiled from the Dun & Bradstreet database and was factored up to BEA employment control totals. BEA derived the employment data in part from the BLS data which accounts for about 80 percent of its employment data. The difference between the BEA data and the BLS data is attributed to BLS only reporting employment covered by the State UI and UCFE programs while BEA also estimates employment for farms, part-time employees, private households, schools, religious organizations, railroads, military, and international organizations. Since BEA data did not include addresses and the 2000 approach would exacerbate errors from misgeocoding and misreporting, the RPA decided to geocode the BLS data and supplement it with the additional sources mentioned above for 2007 employment.
Figure 2.7 compares the new 2007 and 2035 employment control totals to the old 2000 and 2030 employment control totals. Due to the change in data sources, there are significant differences between LRTP datasets. However, it is suspected that the new 2007 employment estimates and 2035 forecasts are more accurate.

Chattanooga TPO 2035 LRTP – Volume 3: Travel Demand Model Documentation and User’s Guide
15
Figure 2.7 Comparison of Employees Between 2030 and 2035 LRTP Models
240,
320
331 21
,465
26,3
02
194,
977
108
8,24
3
15,2
84
308,
469
516 27
,904 56
,598
274,
622
195
8,36
3
20,0
40
0
50,000
100,000
150,000
200,000
250,000
300,000
350,000
Hamilton Dade Walker CatoosaCounty
2000
2007
2030
2035
Note: 2030 expanded after 2030 LRTP Update to include all of Catoosa County.
Figure 2.8 Comparison of Employment Between All 2035 LRTP Model Years
15,2
84
108
194,
977
8,24
3
16,6
43
132
226,
326
8,27
6
18,3
49
165
251,
404
8,32
6
20,0
40
195
276,
463
8,36
3
0
50,000
100,000
150,000
200,000
250,000
300,000
Catoosa Dade Hamilton Walker
County
2007201520252035
Chattanooga TPO 2035 LRTP – Volume 3: Travel Demand Model Documentation and User’s Guide
16
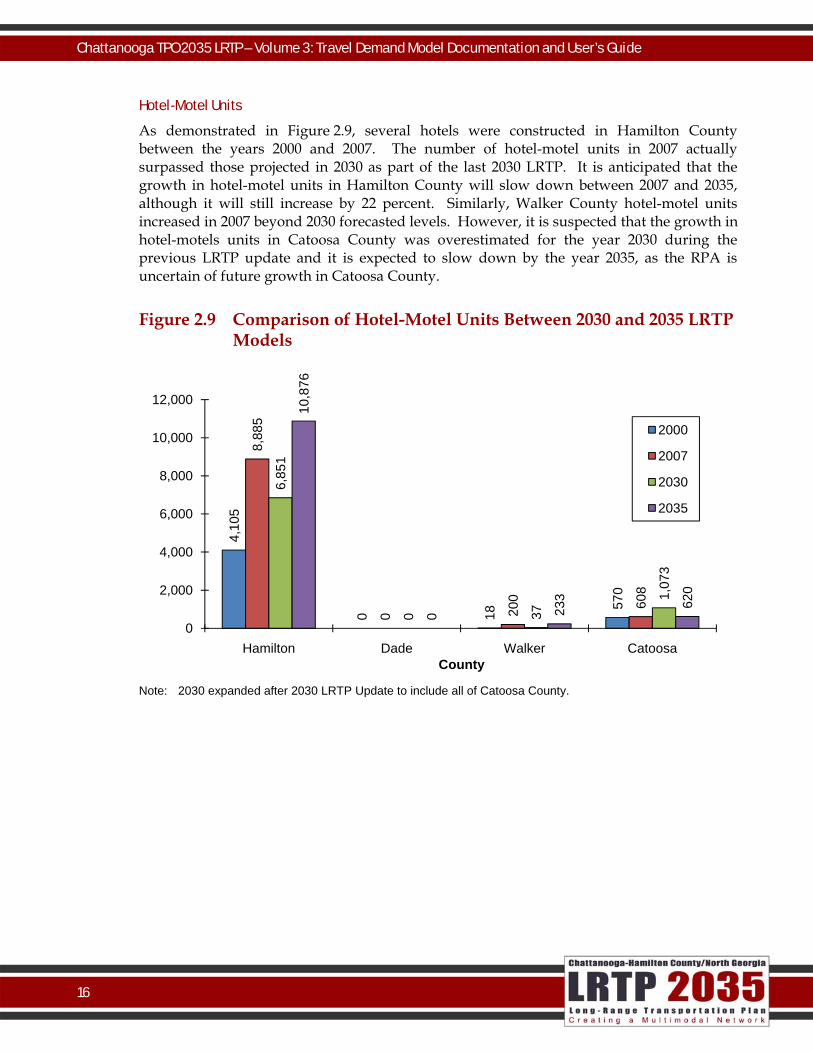
Hotel-Motel Units
As demonstrated in Figure 2.9, several hotels were constructed in Hamilton County between the years 2000 and 2007. The number of hotel-motel units in 2007 actually surpassed those projected in 2030 as part of the last 2030 LRTP. It is anticipated that the growth in hotel-motel units in Hamilton County will slow down between 2007 and 2035, although it will still increase by 22 percent. Similarly, Walker County hotel-motel units increased in 2007 beyond 2030 forecasted levels. However, it is suspected that the growth in hotel-motels units in Catoosa County was overestimated for the year 2030 during the previous LRTP update and it is expected to slow down by the year 2035, as the RPA is uncertain of future growth in Catoosa County.
Figure 2.9 Comparison of Hotel-Motel Units Between 2030 and 2035 LRTP Models
4,10
5
0 18
570
8,88
5
0 200 60
8
6,85
1
0 37
1,07
3
10,8
76
0 233 620
0
2,000
4,000
6,000
8,000
10,000
12,000
Hamilton Dade Walker CatoosaCounty
2000
2007
2030
2035
Note: 2030 expanded after 2030 LRTP Update to include all of Catoosa County.
Chattanooga TPO 2035 LRTP – Volume 3: Travel Demand Model Documentation and User’s Guide
17
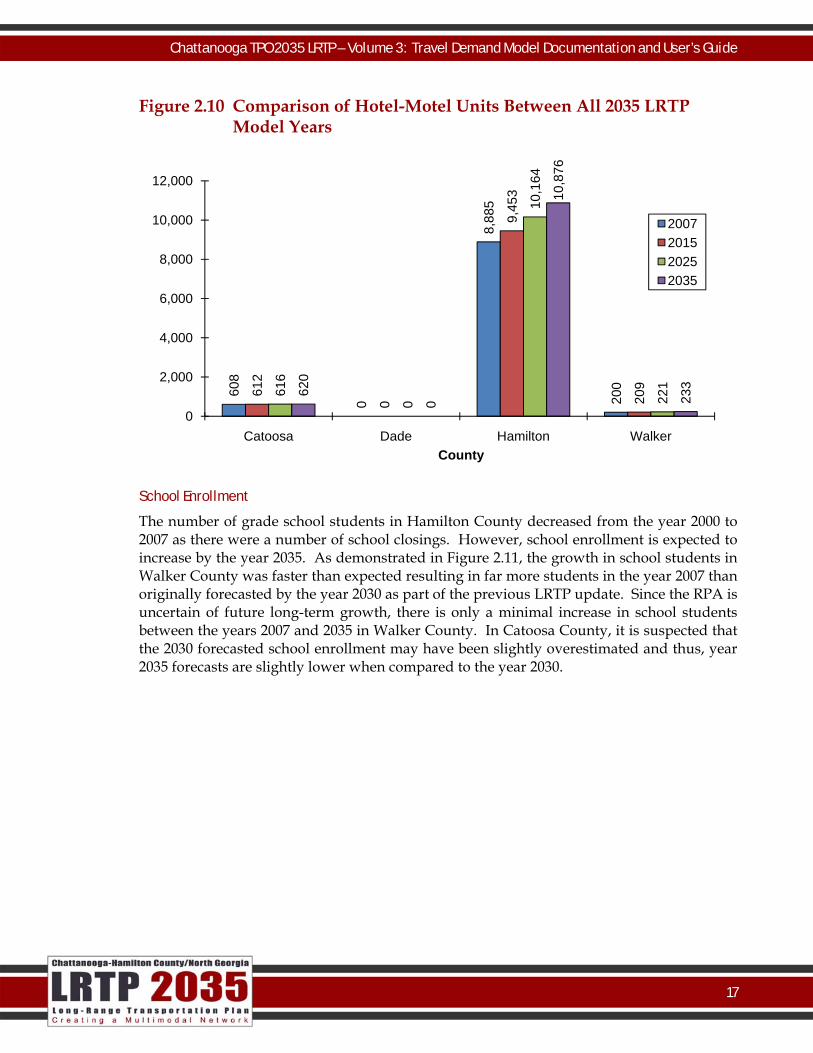
Figure 2.10 Comparison of Hotel-Motel Units Between All 2035 LRTP Model Years
608
0
8,88
5
20061
2
0
9,45
3
20961
6
0
10,1
64
22162
0
0
10,8
76
233
0
2,000
4,000
6,000
8,000
10,000
12,000
Catoosa Dade Hamilton WalkerCounty
2007201520252035
School Enrollment
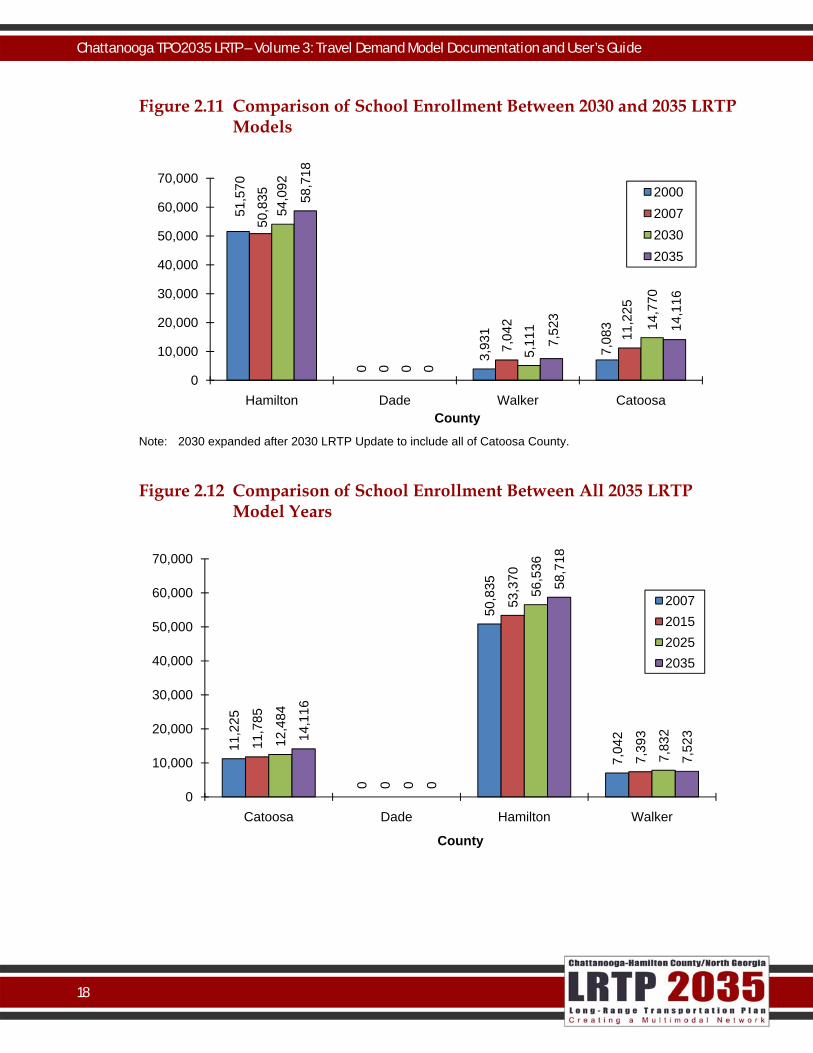
The number of grade school students in Hamilton County decreased from the year 2000 to 2007 as there were a number of school closings. However, school enrollment is expected to increase by the year 2035. As demonstrated in Figure 2.11, the growth in school students in Walker County was faster than expected resulting in far more students in the year 2007 than originally forecasted by the year 2030 as part of the previous LRTP update. Since the RPA is uncertain of future long-term growth, there is only a minimal increase in school students between the years 2007 and 2035 in Walker County. In Catoosa County, it is suspected that the 2030 forecasted school enrollment may have been slightly overestimated and thus, year 2035 forecasts are slightly lower when compared to the year 2030.
Chattanooga TPO 2035 LRTP – Volume 3: Travel Demand Model Documentation and User’s Guide
18
Figure 2.11 Comparison of School Enrollment Between 2030 and 2035 LRTP Models
51,5
70
0
3,93
1
7,08
3
50,8
35
0
7,04
2
11,2
25
54,0
92
0
5,11
1 14,7
70
58,7
18
0
7,52
3
14,1
16
0
10,000
20,000
30,000
40,000
50,000
60,000
70,000
Hamilton Dade Walker CatoosaCounty
2000200720302035
Note: 2030 expanded after 2030 LRTP Update to include all of Catoosa County.
Figure 2.12 Comparison of School Enrollment Between All 2035 LRTP Model Years
11,2
25
0
50,8
35
7,04
2
11,7
85
0
53,3
70
7,39
312,4
84
0
56,5
36
7,83
214,1
16
0
58,7
18
7,52
3
0
10,000
20,000
30,000
40,000
50,000
60,000
70,000
Catoosa Dade Hamilton Walker
County
2007201520252035

Chattanooga TPO 2035 LRTP – Volume 3: Travel Demand Model Documentation and User’s Guide
19
College Enrollment
College enrollment in Hamilton County increased by 23 percent between the years 2000 and 2007. However, growth is expected to slow down by the years 2030 and 2035, as indicated in Figure 2.13. Since the last LRTP update, the TPO TransCAD model was expanded to include all of Catoosa County. As a result, Harvest Deaf Bible College in Catoosa County is now included in the model, which accounts for the 27 college students in the year 2007 not previously in the model. In addition, Covenant College in Dade County was not included in the previous LRTP update and has since been added to the model.
Figure 2.13 Comparison of College Enrollment Between 2030 and 2035 LRTP Models
18,7
80
0 0 0
23,0
82
1,35
0
0 27
25,0
59
0 0 0
27,9
32
1,55
3
0 35
0
5,000
10,000
15,000
20,000
25,000
30,000
Hamilton Dade Walker CatoosaCounty
2000
2007
2030
2035
Note: 2030 expanded after 2030 LRTP Update to include all of Catoosa County.

Chattanooga TPO 2035 LRTP – Volume 3: Travel Demand Model Documentation and User’s Guide
20
Figure 2.14 Comparison of College Enrollment Between All 2035 LRTP Model Years
27
1,35
0
23,0
82
028
1,41
7
24,2
33
030
1,50
1
25,6
70
035
1,55
3
27,9
32
0
0
5,000
10,000
15,000
20,000
25,000
30,000
Catoosa Dade Hamilton WalkerCounty
2007201520252035
2.3 Updating Highway Network to 2007 Conditions
In order to update the year 2000 model network to the year 2007, a list of capacity-adding transportation improvements completed between the years 2001 and 2007 was developed and distributed to the ICC for review and approval. Maps of these projects and the corresponding list are included in Appendix A. These projects were coded on top of the previously validated 2000 model network to reflect 2007 transportation network conditions.
In addition, several roads were added to the model network to more accurately depict travel patterns and to assist with splitting several of the larger traffic analysis zones (TAZs). TRIMS and Roadway Characteristics (RC) data were obtained from TDOT and GDOT, respectively, to assist with reviewing the link characteristics (facility type and number of lanes) in the model network. To supplement this information, several windshield surveys were conducted to obtain area type, facility type, and number of lanes data for those roads being added to the model.
Maps of the 2007 model network by area type, facility type, and number of lanes are provided in Figures 2.15, 2.16, and 2.17 below. As part of the 2007 model update, a new area type code representing industrial land uses were added to the model. This new area type provided the ability to reduce speeds in areas serving industrial facilities. The TPO conducted a windshield survey in 2008, during which time areas representing industrial

Chattanooga TPO 2035 LRTP – Volume 3: Travel Demand Model Documentation and User’s Guide
21
land uses were noted and revised accordingly in the 2007 model. In addition, topography data was overlayed on top of the 2007 model network to assist with updating the mountainous area type codes added during the previous model/LRTP update. A complete list of facility type and area type codes is included in Tables 2.3 and 2.4, respectively.
Table 2.3 Facility Type Codes
Code Description 1 Interstate
2 Expressway
3 Principal Arterial, Divided
4 Principal Arterial, Undivided
5 Minor Arterial
6 Collector
7 Ramp
8 One-Way
90 External Centroid Connector
99 Internal Centroid Connector
Table 2.4 Area Type Codes
Code Description 1 Central Business District (CBD)
2 Central Business District Fringe
3 Residential
4 Outlying Business District
5 Rural
6 Urban Undeveloped
7 Mountainous
8 Industrial

Chattanooga TPO 2035 LRTP – Volume 3: Travel Demand Model Documentation and User’s Guide
22
This Page Intentionally Left Blank

Chattanooga TPO 2035 LRTP – Volume 3: Travel Demand Model Documentation and User’s Guide
23
Figure 2.15 2007 Model Network by Facility Type

Chattanooga TPO 2035 LRTP – Volume 3: Travel Demand Model Documentation and User’s Guide
24
This Page Intentionally Left Blank

Chattanooga TPO 2035 LRTP – Volume 3: Travel Demand Model Documentation and User’s Guide
25
Figure 2.16 2007 Model Network by Area Type

Chattanooga TPO 2035 LRTP – Volume 3: Travel Demand Model Documentation and User’s Guide
26
This Page Intentionally Left Blank

Chattanooga TPO 2035 LRTP – Volume 3: Travel Demand Model Documentation and User’s Guide
27
Figure 2.17 2007 Model Network by Number of Lanes
Chattanooga TPO 2035 LRTP – Volume 3: Travel Demand Model Documentation and User’s Guide
28
This Page Intentionally Left Blank

Chattanooga TPO 2035 LRTP – Volume 3: Travel Demand Model Documentation and User’s Guide
29
2.4 Traffic Count Data
The validation of any travel demand model relies upon the existence of extensive base year traffic count data. Volume-to-count ratios generated by the model are used to measure the ability of a travel demand highway assignment model to simulate known traffic conditions. Traffic counts are needed for a variety of different roadway categories distributed throughout the study area in order to validate highway assignment performance among screenlines, facility types, area types, and lane configurations.
As part of the 2007 model update and Congestion Management Plan Update, the TPO identified locations along CMP routes and in the 2007 model where additional counts were needed. The TPO collected these supplemental counts in 2008 to assist with validation. As a result, year 2007 traffic counts available from TDOT, GDOT, Hamilton County, and the City of Chattanooga were included in the 2007 traffic count field used to calculate validation statistics. However, a year 2008 traffic count field was added to the model network to include these supplemental traffic counts collected in 2008. Since the base year of the model was 2007, these 2008 counts were not included in the validation statistics. However, they were used to supplement validation efforts and compare to 2007 traffic counts for accuracy.
2.5 Screenline Locations
Screenlines are drawn across the model network throughout various parts of the study area to summarize traffic volumes in subareas and along major corridors. These screenlines are used to report an aggregate volume-to-count ratio for all of the links that comprise any given screenline. This allows for measurement of travel flows between subareas of the study area. Screenlines typically follow natural features, major transportation facilities, or political boundaries. Also, screenlines can be used to cordon off certain portions of the study area in order to measure the flows into and out of those areas (such as measuring the flow of travel demand into and out of central business districts (CBDs) or the external model boundary).
As part of the previous 2030 LRTP update, 10 screenlines were identified and added to the TransCAD model network. These screenlines were checked to ensure that their orientation coincided with traffic count locations. Included in these 10 screenlines is an external cordon line that measures behavior of the external model. Also included is a partial cordon line around downtown Chattanooga and a variety of cut lines to allow for more detail in observing trip flow behaviors. The model network includes a field to indicate screenline codes one through 10, which are illustrated in Figure 2.19.

Chattanooga TPO 2035 LRTP – Volume 3: Travel Demand Model Documentation and User’s Guide
30
This Page Intentionally Left Blank

Chattanooga TPO 2035 LRTP – Volume 3: Travel Demand Model Documentation and User’s Guide
31
Figure 2.18 Screenline Locations

Chattanooga TPO 2035 LRTP – Volume 3: Travel Demand Model Documentation and User’s Guide
32
This Page Intentionally Left Blank

Chattanooga TPO 2035 LRTP – Volume 3: Travel Demand Model Documentation and User’s Guide
33
2.6 Travel Surveys
Household Travel Diary Survey
In 2002, a household travel diary survey was conducted to determine trip generation rates, average trip lengths, auto occupancy factors, and other characteristics used in model development and validation. The same rates and parameters derived from the 2002 household travel diary survey for the last model update were used for the 2007 model update as part of this 2035 LRTP. Typically, household travel diary surveys are conducted every 10 years to accurately reflect travel characteristics of the region. Pending funding availability, the TPO intends to conduct a new household travel diary survey in calendar year 2011. The results of the 2011 travel diary survey will be incorporated into the new 2010 base year model for the next LRTP update.
External Origin and Destination Survey
In 2002, a roadside origin-destination intercept survey designed to obtain characteristics of travelers entering, exiting, and passing through the region from locations outside the CHCNGA study area was conducted. During the last 2030 LRTP Update, it was determined that the results from the 2002 external origin and destination survey were biased. It was determined that the percentage of through trips were not reliable as the interstate surveys were conducted on ramps at interchanges and rest areas. Vehicles were not pulled off to the side of the road on the mainline interstate segments where most External-External (EE) trips occur. The vehicles that were surveyed already were stopping at the interchange or rest area. Therefore, the results provide a significant bias towards Internal-External (IE) trips and EE trips were thus underestimated. The percent IE/EE splits from the origin and destination survey were subsequently compared to the old 2000 MINUTP model and it was determined that the old 2000 MINUTP model percent splits appeared more reasonable. The MINUTP splits were used as a starting point for the previous 2000 model validation conducted in 2005 and were later modified during the 2000 model validation process.
As a result, the 2002 roadside origin-destination intercept survey was not used within the TransCAD model for this current 2035 LRTP Update,. With the exception of new external stations, the updated model as part of this 2035 LRTP Update used the same IE/EE splits from the last model. Any new external stations, which are minor roads with low traffic counts, assumed 100 percent IE trips. However, the TPO intends to conduct a new external origin and destination survey during the fall of 2010. In the meantime, the TPO will be designing the sampling plan and survey instrument. The results of the 2010 external origin and destination survey will be used to validate the external model for the 2010 base year validation as part of the next LRTP update.

Chattanooga TPO 2035 LRTP – Volume 3: Travel Demand Model Documentation and User’s Guide
34
This Page Intentionally Left Blank
Chattanooga TPO 2035 LRTP – Volume 3: Travel Demand Model Documentation and User’s Guide
35
3.0 External Trips
3.1 External Model
Initial development of an external model requires that external trips be divided into at least two categories: internal to external (IE) trips and external to external (EE) trips. IE trips are those trips that either have an origin outside of the study area and a destination within the study area or vice versa. EE trips have both an origin and a destination outside of the study area, but pass through the study area. EE trips are preloaded in the CHCNGA model, as it is not usually expected that EE trips will reroute due to congestion. This is because EE trips generally consist of long-distance travelers not familiar with the local street system. There are two input files that describe external trips in the model. These are the TAZ geography file and the EE trips matrix file.
Although the TAZ geography input file is part of the trip generation process, it is integral to generating the IE trips for the external model. As noted in Section 2.6, the percent IE/EE splits for each external zone were initially derived from the old MINUTP 2000 external model and refined during the last model update. The percent IE trips were applied to the 2007 AADT to calculate the total number of IE trips at each external zone for the TAZ geography file.
The EE trips input matrix file (year_EXTERNAL-EXTERNAL.mtx) is generally the residual left after estimating IE trips in the TAZ geography file (TAZ_2007.dbd). The percentage of EE trips was applied to the AADT per external zone and then distributed from each origin zone to each destination zone using distribution patterns from the 2000 model EE trips file. Eight new external stations were added to the 2007 model above and beyond the 30 external stations included in the previous 2000 model. Year 2007 traffic counts at each of the 38 external stations were utilized to determine the total external trips. The same percent distribution of external-external (EE), or through trips, versus internal-external (IE) trips at each of the original 30 external zones used in the 2000 model was used for the 2007 model. Since the eight new external stations in the 2007 model were located along minor facilities, it was assumed that 100 percent of the external trips were attributed to IE trips, or those with one trip end inside the TPO region and one trip end outside the TPO region.
It should be noted that traffic counts for the external stations were coded in to the adjacent link to the external centroid connector in the model network so that the correct area type, facility type, and number of lanes is associated with the link.
Table 3.1 below demonstrates the percentage of IE and EE trips at each of the 38 external stations in the 2007 model.

Chattanooga TPO 2035 LRTP – Volume 3: Travel Demand Model Documentation and User’s Guide
36
Table 3.1 Internal-External (IE) and External-External (EE) Percentage Splits
Zone 2007 Description
Percent Split
IE EE 800 (I-75 S) 67% 33% 801 (US-41 Chattanooga Road) 69% 31% 802 Old Ringgold Road 98% 2% 803 (GA SR 151 Alabama Highway) 81% 19% 804 GA SR 95 100% 0% 805 Ringgold Road 65% 35% 806 (GA SR 1, U.S. 27 S) 58% 42% 807 Straight Gut Rd. 100% 0% 808 (GA SR 341 Cove Road) 93% 7% 809 GA SR 193 92% 8% 810 Lula Lake Road 91% 9% 811 (GA SR 157/ 189 Lookout Mountain Scenic Highway) 97% 3% 812 (GA SR 58 , U.S. 11, Birmingham Pike) 75% 25% 813 I-59 82% 18% 814 I-24 64% 36% 815 TN SR 134 98% 2% 816 U.S. 64, U.S. 72, U.S. 41, TN SR 2 63% 37% 817 TN SR 27 Suck Creek Road 98% 2% 818 (TN SR 8, U.S. 127 Taft Highway) 58% 42% 820 (U.S. 111) 62% 38% 821 Retro Hughes Road 2% 98% 822 (TN SR 309 Leggett Road) 12% 88% 823 (TN SR 29, U.S. 27 N, Rhea Co. Highway) 31% 69% 825 TN SR 58 72% 28% 826 Old State Highway 58 66% 34% 827 TN SR 60 Georgetown Road 23% 77% 828 TN SR 312 Harrison Pike 100% 0% 829 (I-75 N) 71% 29% 830 (U.S. 11, U.S. 64, SR 2 S. Lee Highway) 94% 6% 831 McDonald Road 100% 0% 832 Old Alabama Road SW 100% 0% 833 Candies Creek Road SW 100% 0% 834 Tunnel Hill Road 100% 0% 835 TN SR 317 Weatherly Switch Trail SW 95% 5% 836 Bill Stewart Road 98% 2% 837 TN SR 2 Varnell Road 94% 6%

Chattanooga TPO 2035 LRTP – Volume 3: Travel Demand Model Documentation and User’s Guide
37
Figure 3.1 External Station Locations

Chattanooga TPO 2035 LRTP – Volume 3: Travel Demand Model Documentation and User’s Guide
38
This Page Intentionally Left Blank
Chattanooga TPO 2035 LRTP – Volume 3: Travel Demand Model Documentation and User’s Guide
39
3.2 External Validation Adjustments
Validation adjustments to the external model consisted of modifying the TAZ geography and EE trips files. Several iterations of the external model were executed in order to balance volumes at the external stations in such a manner so the addition of IE and EE trips matched the total AADT of each external station.
Special generator attractions were added to some of the external stations in an attempt to correct overassignments that were occurring in their vicinity. In the south of the model, there was major overassignment on several north-south arteries and the thought was that some of the trips trying to go north into Chattanooga should really be headed towards Dalton and areas to the South. To correct that, attractions were added to some of the external stations, such as I-75 South, to pull the trips in that direction. Similarly, the roads coming off the Cumberland Escarpment (Walden Ridge) into the Tennessee River Valley and I-75 and SR 60 leading into the Cleveland, Tennessee area received the same treatment with attractors being placed to pull some trips in that direction, rather than going into Chattanooga.
3.3 External Validation Results
Model validation results are described later in Section 7.0 on the highway assignment. In particular, a review of the external cordon line and other screenlines close to the model boundary indicate a reasonable match of external travel movements. The external cordon line achieves a volume-over-count ratio of 1.00.

Chattanooga TPO 2035 LRTP – Volume 3: Travel Demand Model Documentation and User’s Guide
40
This Page Intentionally Left Blank
Chattanooga TPO 2035 LRTP – Volume 3: Travel Demand Model Documentation and User’s Guide
41
4.0 Trip Generation Just as with the previous 2000 model, the CHCNGA 2007 model uses a cross-classification trip generation process for trip productions along with trip rate equations for trip attractions. Trip productions and attractions are generated by zone using trip production rates derived from the Chattanooga household travel survey and trip attraction rates borrowed from the Knoxville household travel survey. This section discusses the Trip Generation model step.
4.1 Trip Generation Process
During the previous 2030 LRTP Update adopted in 2005, the 2002 Chattanooga Household Travel Survey data was evaluated to determine what variables impact travel patterns the most in the Chattanoga region. As a result, a cross-classification method based on auto availability and children per household was implemented. This same method was used during this 2035 LRTP update. Other potential explanatory variables from the survey, such as household size and income, were evaluated. However, trip rate matrices derived from these variables showed inconsistent patterns. Therefore, both the CHCNGA 2000 and 2007 models used trip rates developed for the four following auto availability categories:
• Zero autos per household;
• One auto per household;
• Two autos per household; and
• Three or more autos per household.
Trip rates for the four auto availability categories are cross-classified by categories, as follows:
• Zero children per household;
• One child per household; and
• Two or more children per household.
Auto availability and children per household data were derived from the 2000 Census.
Trip production rates were developed for the following trip purposes:
• Home-Based Work (HBW);
• Home-Based School (HBSchool);
• Home-Based Shop (HBShop);

Chattanooga TPO 2035 LRTP – Volume 3: Travel Demand Model Documentation and User’s Guide
42
• Home-Based Social/Recreation (HBSR);
• Home-Based Other (HBO); and
• Nonhome Based (NHB).
Trip production rates by purpose are provided in Table 4.1. Trip production rates for hotel-motel units are provided in Table 4.2. Trip attraction rates for HBW, HBSchool, HBShop, HBSR, HBO, and NHB purposes were borrowed from the Knoxville model as these rates were more appropriate for use in Chattanooga than the Northeast Florida Regional Planning Model trip attraction rates used in the previous 2000 model. New trip attraction rates for the CHCNGA model specific to Chattanooga would have required an employer survey in addition to the household travel survey. Trip attraction rates for the light-duty truck, medium-duty truck, and heavy-duty truck trip purposes were derived from the FHWA Quick Response Freight Manual and did not change since the last 2000 model. Trip attraction rates are depicted in Table 4.3. Further detail on adjustments made to trip rates are included in the following section.
The productions and attractions output from the trip generation process are stored by zone by trip purpose in the TAZ geography file (TAZ_2007.dbd). This same master file includes the socioeconomic data for each model year. As a result, the number or density of productions and attractions can be illustrated by TAZ within TransCAD or a GIS.
4.2 Trip Generation Validation Adjustments
Adjustments were made to the trip attraction rates and special generators in order to validate the trip generation step in the travel demand model. Further detail is provided below.
Trip Attraction Rates
As noted above, trip production rates utilized in the 2007 model are the same as those utilized in the 2000 model. However, trip attraction rates were modified in the 2007 model as they were borrowed from the Jacksonville, Florida region for the previous 2000 model. Trip attractions for some purposes, such as HBW, differed appreciably from the trip productions and it was therefore decided to borrow trip attraction rates from the Knoxville model and adjust where appropriate in an attempt to achieve closer matches. Utilizing Knoxville trip attraction rates is likely more appropriate for the Chattanooga region due to potential differences in travel characteristics in the Jacksonville, Florida region. The Knoxville trip attraction rates documented in the Knoxville Regional Travel Demand Model Validation Report of March 2004 were based on their household travel survey using regression analysis. Using the Knoxville attraction rates resulted in some improvement in the unbalanced ratios for most trip purposes in Chattanooga. Adjustments were necessary to some of the trip attraction rates as trip purposes did not correlate perfectly between the

Chattanooga TPO 2035 LRTP – Volume 3: Travel Demand Model Documentation and User’s Guide
43
Knoxville and Chattanooga models. The final Chattanooga 2007 model trip production and attraction rates are listed below.
Table 4.1 New Chattanooga Trip Production and Attraction Rates
Tota
l Hou
seho
lds
Tota
l Em
ploy
men
t
Agr
icul
tura
l/Min
ing/
Con
stru
ctio
n
Man
ufac
turin
g/Tr
ansp
orta
tion
Ret
ail
Serv
ice
Gov
ernm
ent
Scho
ol E
nrol
lmen
t
Tota
l Pop
ulat
ion
Home-Based Work
0.00 0.51 0.00 0.00 0.00 0.00 0.00 0.00 0.00
Home-Based School
0.00 0.00 0.00 0.00 0.00 0.00 0.00 1.72 0.00
Home-Based Shop
0.00 0.00 0.00 0.00 0.78 0.11 0.19 0.00 0.20
Home-Based Social Recreation
0.00 0.00 0.00 0.00 0.48 0.06 0.12 0.00 0.12
Home-Based Other
0.00 0.00 0.00 0.00 1.38 0.19 0.35 0.00 0.36
Nonhome-Based 1.54 0.36 0.00 0.00 3.83 0.31 0.64 0.00 0.00
Light-Truck 0.10 0.00 0.30 0.25 0.25 0.15 0.15 0.00 0.00
Medium-Truck 0.05 0.00 0.10 0.10 0.10 0.05 0.05 0.00 0.00
Heavy-Truck 0.05 0.00 0.05 0.05 0.05 0.05 0.05 0.00 0.00
Special Generators
The addition of special generators is a subjective and iterative process. Ideally, a model should only have special generators where standard trip rate equations would not calculate any trips (e.g., recreational areas and group quarters). However, most models also need special generators to account for locations where trips are significantly under- or over-estimated due to the unique nature of the land use (airports, colleges, universities, and tourist attractions typically fall into this category). Volume-to-count ratios in the areas surrounding each of these potential special generators were reviewed to determine whether or not special generators were needed. Special generator trips are derived by manually calculating trips using special generator trip rates and substituting the manual results for the machine-generated results.

Chattanooga TPO 2035 LRTP – Volume 3: Travel Demand Model Documentation and User’s Guide
44
Although the 2000 TransCAD model included special generators at the airport, the University of Tennessee at Chattanooga, Chattanooga State College, and Chester Frost National Park, no special generators were assumed at the beginning of 2007 model validation effort. During the validation process, several of the special generators included in the 2000 model were added back in to the 2007 model, as well as several new special generators. A complete listing of special generators used in the model is provided in Table 4.2.
Table 4.2 Special Generator Locations
Zone Description 17a UTC Dorms
18 UTC Dorms
19 UTC Dorms
48* UTC Dorms
49 UTC Dorms and students
50 UTC Dorms and students
135 Lovell Field (CHA) Chattanooga Metro Airport
157a Newly added – Hamilton Place Mall
190 Chattanooga State College
197 Chester Frost Park
800a I-75 South External Station
801a U.S. 41/Chattanooga Road External Station
805a Ringgold Road External Station
806a GA SR 1/U.S. 27 South External Station
818a TN SR 8/U.S. 127/Taft Highway External Station
820a U.S. 111 External Station
822a TN SR 309/Leggett Road External Station
823a TN SR 29/U.S. 27/N. Rhea Co. Hwy. External Station
827a TN SR 60/Georgetown Road External Station
829a I-75 North External Station
a Indicates new special generator added to 2007 model.
As noted in Section 3.2, special generator attractions were added to some of the external stations in an attempt to correct overassignments that were occurring in their vicinity. In the south of the model, there was major overassignment on several north-south arteries and the thought was that some of the trips traveling north into Chattanooga should really be traveling towards Dalton and areas to the South. To correct that, attractions were added to

Chattanooga TPO 2035 LRTP – Volume 3: Travel Demand Model Documentation and User’s Guide
45
some of the external stations, such as I-75 South, to attract trips in that direction. Similarly, the roads coming off the Cumberland Escarpment (Walden Ridge) into the Tennessee River Valley and I-75 and SR 60 leading into the Cleveland, Tennessee area received the same treatment with attractors being placed to pull some trips in that direction, rather than going into Chattanooga.
Special generators are contained in the special generator input file in the format of number of productions or attractions by trip purpose by TAZ. The special generators input file is specific to each year and is titled, year_SPGEN.bin.
4.3 Trip Generation Validation Results
Table 4.3 provides comparisons of aggregate trips per household, person, and employee, along with persons per household between the CHCNGA 2007 TransCAD model and the previous 2000 model. There were approximately nine person trips per household in the Chattanooga region in the 2007 model, within TDOT’s target range of 8.5 to 10.5.
Table 4.3 Aggregate Trip Rates
Chattanooga Standards
Unit of Measure 2007 2000 TDOT FHWA
Persons per Household 2.38 2.50 n/a n/a
Internal Trips per Household
9.00 9.44 8.5-10.5 8.0-14.0
Internal Trips per Person 3.78 3.78 n/a 3.5-4.0
HBW Trips per Employee 1.12 0.74 n/a n/a
Employees per Person 0.51 0.73 n/a n/a
Total Population 425,666 395,061
Total Households 178,905 158,055
Total Employment 218,612 287,918
Table 4.4 demonstrates the average number of trips per household by trip purpose in the 2007 model.

Chattanooga TPO 2035 LRTP – Volume 3: Travel Demand Model Documentation and User’s Guide
46
Table 4.4 2007 Trips per Household by Trip Purpose
Trip Purpose 2007 Trips Per Household Home-Based Work 1.37
Home-Based School 0.55
Home-Based Shop 1.05
Home-Based Socrec. 0.64
Home-Based Other 1.87
Non Home-Based 2.75
As indicated in Table 4.5 below, HBW trips represent approximately 16.6 percent of all the trips generated in the Chattanooga region, slightly below TDOT’s target of 18 percent (excludes commercial vehicle and external trips). Approximately 50 percent of trips in the Chattanooga region can be attributed to HBSchool, HBShopping, HBSR, and HBO trips purposes, within TDOT’s target of 47 to 54 percent. NHB trips are slightly higher than the desired range of 22 to 31 percent at 33 percent. Commercial vehicles represent approximately seven percent of the trips in the 2007 model, a reduction compared to the 2000 model. It must be noted, however, that employment in the 2007 model is lower than for the 2000 model, contributing to the reduced commercial vehicles, as demonstrated in technical submittal #2. It should be noted that part of this low-simulation problem is a function of the household travel survey which has shown somewhat surprising results based on previous trip rate analyses of the survey data. The TPO intends to conduct a new household survey when the budget is available so that a new cross classification matrix of trip rates might be calculated.
Table 4.5 Percent of Trips by Purpose
Trip Purpose
Percent Trips
2007 TDOT Target Home-Based Work 17% 17% 18-27%
Home-Based School 7%
50% 47-54% Home-Based Shop 13%
Home-Based Socrec. 8%
Home-Based Other 23%
Non Home-Based 33% 33% 21-31%
Total 100% 100% 100%

Chattanooga TPO 2035 LRTP – Volume 3: Travel Demand Model Documentation and User’s Guide
47
5.0 Trip Distribution Trip Distribution models link trip productions and attractions between pairs of TAZs. These interchanges are typically calculated through application of a Gravity Model. Gravity Models distribute trips among zones directly proportional to the relative attractiveness of each individual zone and inversely proportional to the friction between zones (i.e., distance). The result is a matrix of person trips that is later balanced in order to be defined in terms of origins and destinations (as opposed to productions and attractions). Resulting person trip matrices are processed later in the model chain during mode choice to convert these to balanced vehicle trips.
5.1 Trip Distribution Model Structure
The trip distribution step of the model estimates or predicts the spatial pattern of trips between origin and destination zone pairs. The general distribution process includes the building of highway networks and travel-time skims as well as application of the Gravity Model. This includes updating the travel-time skims with intrazonal and terminal times, distributing trips between zones using a Gravity Model, and producing a set of congested highway skims. The primary input data used for trip distribution is the friction factor (F_FACTORS.bin) file. This file is used by the Gravity Model to measure the effects of spatial separation between zones for the purpose of trip distribution. It is generally assumed that trips are less likely to be allocated to destinations with greater travel times if alternative destinations with lesser travel times and similar attractiveness are available.
Friction factors from the previous CHCNGA 2000 model were used as a starting point for the new CHCNGA 2007 TransCAD model. They were further modified during the model validation process as discussed in Section 5.2.
Intrazonal times represent the travel time within or across a zone. These times are calculated as one-half the travel time from one zone to the nearest adjacent zone. Terminal times represent the time involved at either end of a trip to travel from an origin to a vehicle or from the vehicle to a final destination. More specifically, this accounts for the time necessary to walk to or from the vehicle used for any given trip. Table 5.1 lists the terminal times by area type used in the CHCNGA 2007 TransCAD model. Terminal times inside the study area are typically greatest in central business districts.

Chattanooga TPO 2035 LRTP – Volume 3: Travel Demand Model Documentation and User’s Guide
48
Table 5.1 Terminal Times
Terminal Times Area Types Area Type Descriptions 5 1 Central Business District (CBD)
3 2 Central Business District (CBD) Fringe
1 3 Residential
2 4 Outlying Business District
1 5 Rural
1 6 Urban Undeveloped
1 7 Mountainous
2 8 Industrial
10 9 External Centroid Connector
5.2 Trip Distribution Model Development and Validation
Validation of the CHCNGA 2007 trip distribution model primarily involved modification of the highway network, friction factors, and K-factors. Evaluation of the trip distribution model was accomplished by comparing statistics for average trip length and the percentage of intrazonal trips between the CHCNGA 2007 model and other comparable models in the southeast, including the previous CHCNGA 2000 model.
Network Link Attributes
As part of the model validation process, the TPO conducted an in depth review of the highway network, particularly in downtown Chattanooga and in the Enterprise South Industrial Park. Network characteristics were updated to more accurately reflect the conditions of the roadway system in the CHCNGA study area for the year 2007. In addition to updating existing roadway characteristics, the TPO added a new area type (8-Industrial). Field review also resulted in some changes to network characteristics. The master network, which includes all network years, is titled LRTP_MASTER_NETWORK.dbd.
Friction Factors
Initially, friction factors from the previous 2000 model, which were borrowed from the earlier MINUTP model, were used as part of the validation of the 2007 model. However, upon review of the average trip lengths, it was determined that adjustments to the friction factors were necessary. As a result, the TPO first developed and calibrated new friction factors to match the Chattanooga 2002 Household Travel Diary Survey data. However,

Chattanooga TPO 2035 LRTP – Volume 3: Travel Demand Model Documentation and User’s Guide
49
these new friction factors resulted in unsatisfactory results. Average trip lengths were proving to be shorter than expected and overall validation results were consequently worse. As a result, the original friction factors from the previous 2000 model were iteratively adjusted to achieve better trip length distribution characteristics. Several iterative runs were performed to arrive at the final friction factors used for the remainder of the model validation runs. The final friction factors (F_FACTORS.bin) are included in the complete model dataset that is being provided to TDOT and GDOT as part of this submittal.
K-Factors
K-Factors are sometimes used during the validation process to adjust the trip patterns estimated or predicted by the Gravity Model. K-Factors are typically used at water crossings and between areas with different socioeconomic characteristics, (e.g., rural verses urban conditions). Just as was included in the previous 2000 model, K-factors were necessary between areas north and west of the Tennessee River and areas south and east of the Tennessee River, as well as between Georgia and Tennessee. However, unlike the previous model, the K-factors were not directionally skewed to/from Georgia and Tennessee. K-Factors are stored in a zone-to-zone matrix file (K_FACTORS.mtx) in TransCAD.
Tables 5.2 and 5.3 demonstrate the number of trips between K-Factor districts for the years 2007 and 2035, respectively.
Table 5.2 2007 Trips Between K-Factor Districts
2007 K-Factor District Trip Interchanges
District North of River South of River in Tennessee Georgia
External Stations
North of River 295,216 48,598 13,033 54,204
South of River in Tennessee 124,147 717,149 115,740 110,646
Georgia 13,969 59,732 187,369 40,186
External Stations 12,768 12,938 9,754 34,391
Chattanooga TPO 2035 LRTP – Volume 3: Travel Demand Model Documentation and User’s Guide
50
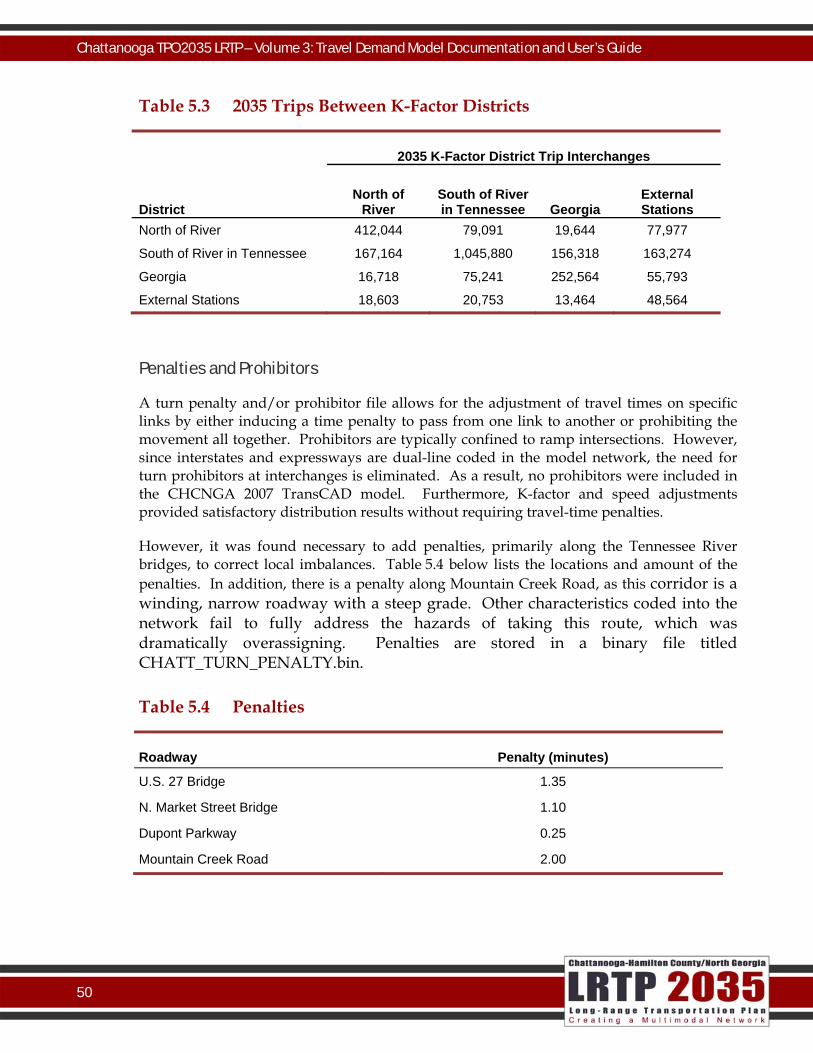
Table 5.3 2035 Trips Between K-Factor Districts
2035 K-Factor District Trip Interchanges
District North of
River South of River in Tennessee Georgia
External Stations
North of River 412,044 79,091 19,644 77,977
South of River in Tennessee 167,164 1,045,880 156,318 163,274
Georgia 16,718 75,241 252,564 55,793
External Stations 18,603 20,753 13,464 48,564
Penalties and Prohibitors
A turn penalty and/or prohibitor file allows for the adjustment of travel times on specific links by either inducing a time penalty to pass from one link to another or prohibiting the movement all together. Prohibitors are typically confined to ramp intersections. However, since interstates and expressways are dual-line coded in the model network, the need for turn prohibitors at interchanges is eliminated. As a result, no prohibitors were included in the CHCNGA 2007 TransCAD model. Furthermore, K-factor and speed adjustments provided satisfactory distribution results without requiring travel-time penalties.
However, it was found necessary to add penalties, primarily along the Tennessee River bridges, to correct local imbalances. Table 5.4 below lists the locations and amount of the penalties. In addition, there is a penalty along Mountain Creek Road, as this corridor is a winding, narrow roadway with a steep grade. Other characteristics coded into the network fail to fully address the hazards of taking this route, which was dramatically overassigning. Penalties are stored in a binary file titled CHATT_TURN_PENALTY.bin.
Table 5.4 Penalties
Roadway Penalty (minutes)
U.S. 27 Bridge 1.35
N. Market Street Bridge 1.10
Dupont Parkway 0.25
Mountain Creek Road 2.00

Chattanooga TPO 2035 LRTP – Volume 3: Travel Demand Model Documentation and User’s Guide
51
5.3 Trip Distribution Model Results
The two fundamental Gravity Model checks discussed in this section are the average trip length by purpose and the percentage of intrazonal trips. An analysis of volume-to-count summaries along screenlines also can be helpful in establishing the accuracy of trip distribution. However, as screenline summaries apply more significantly to the analysis of traffic assignment, these will be discussed later in Section 7.0.
Average Trip Length by Purpose
Table 5.5 demonstrates the final average trip lengths for each trip purpose in comparison to the old 2000 model. In addition, year 2007 HBW trip lengths were compared to those included in the Census Transportation Planning Package (CTPP) for the year 2000 in Hamilton, Catoosa, and Walker Counties. HBW trip lengths improved in the 2007 model compared to the 2000 model as they are closer to the CTPP trip lengths. However, the 2007 model HBW trip lengths are still slightly shorter when compared to the CTPP trip lengths. This is as a result of the daily nature of the model compared to the highly peak hour-weighted CTPP figure. The modest expansion of the model to include all of Catoosa County since the last LRTP partially explains the reduction in Internal-External trip times. All of the 2007 trip lengths are within acceptable limits provided by the Federal Highway Administration (FHWA). No trip length targets have been established by TDOT at this time.

Chattanooga TPO 2035 LRTP – Volume 3: Travel Demand Model Documentation and User’s Guide
52
Table 5.5 Average Trip Length (in Minutes)
2007 2000
Purpose Chattanooga (TransCAD)
Chattanooga (TransCAD)
CTPP (Hamilton)
CTPP (Catoosa)
CTPP (Walker)
FHWA Target
Home-Based Work 18.26 16.36 21.20 23.70 26.50 11.2-35.4
Home-Based School 13.85 14.48 n/a n/a n/a 8.9-15.9
Home-Based Shop 12.84 13.78 n/a n/a n/a 8.6-18.7
Home-Based Social Recreation
13.55 11.38 n/a n/a n/a 10.4-17.3
Home-Based Other 12.44 14.41 n/a n/a n/a
Nonhome-Based 14.18 15.44 n/a n/a n/a 8.1-17.1
Commercial Vehicles
17.88 19.64 n/a n/a n/a n/a
Light-Truck 17.78 18.79
Medium-Truck 17.20 17.95
Heavy-Truck 20.75 22.17
Internal-External 37.38 41.04 n/a n/a n/a n/a
Total 14.53 18.68 n/a n/a n/a n/a
Intrazonal Trip Distribution
The 2007 model validation effort involved significant splitting of zones, particularly towards the periphery. This reduced the average size of zones. Consequently, as indicated in Table 5.6, the percent intrazonal trips fell slightly to below nine percent as compared to above nine percent for the 2000 model. As expected, given the tendency of individuals to travel further for work purposes, the percent intrazonal trips for HBW are lower than for other purposes at just under two percent. Providing the percent of intrazonal trips by purpose assists with assessing zone size and the attenuation of trips.

Chattanooga TPO 2035 LRTP – Volume 3: Travel Demand Model Documentation and User’s Guide
53
Table 5.6 Intrazonal Trips by Trip Purpose
Chattanooga (TransCAD) Percent Intrazonal
Purpose 2007 2000
Home-Based Work 1.93% 7.04%
Home-Based School 6.63% 11.12%
Home-Based Shop 12.51% 9.93%
Home-Based Social Recreation
11.98% 21.08%
Home-Based Other 12.96% 11.16%
Nonhome-Based 9.61% 8.02%
Commercial Vehicles 2.77% 3.06%
Light-Truck 2.74% 2.95%
Medium-Truck 3.46% 4.15%
Heavy-Truck 1.27% 1.19%
Total 8.89% 9.18%

Chattanooga TPO 2035 LRTP – Volume 3: Travel Demand Model Documentation and User’s Guide
54
This Page Intentionally Left Blank

Chattanooga TPO 2035 LRTP – Volume 3: Travel Demand Model Documentation and User’s Guide
55
6.0 Mode Choice Currently, the Chattanooga TransCAD model does not include a transit network/pathbuilding component. At the beginning of the 2035 LRTP Update, the TPO intended to add transit to the TransCAD model contingent upon the availability of existing data to validate the new transit component. However, upon review of the data, it was determined that an on-board transit survey was needed in order to validate a new transit model. The TPO will be developing the survey instrument for the on-board transit survey shortly after the adoption of the 2035 LRTP Update. Subsequently, the TPO will conduct the on-board survey in the fall of 2010, in preparation for the next base year 2010 model for the LRTP Update to be adopted in 2014. The TPO intends to add the transit network/pathbuilding component to the next generation of the TransCAD model in time for the next LRTP update. In the interim, the same auto occupancy model used in the model from the previous 2030 LRTP Update is being used for the current 2035 LRTP Update. Ratios of persons per vehicle were derived from the local household diary survey conducted in the Chattanooga region in 2002. These persons per vehicle ratios by trip purpose were used to convert person trips to vehicle trips.
Although the current model does not include a transit network, it does include a vehicle occupancy allocation component that disaggregates vehicle trips by single occupancy vehicle (SOV) and high-occupancy vehicle (HOV) categories. Trips also are allocated by truck categories. This is useful in evaluating HOV lanes or truck-exclusive lanes.
This section of the report describes the different mode choice structures used to generate the three types of trip tables for input into their respective assignment processes, as follows:
• General Highway Assignment;
• Exclusive HOV or Truck Lane Assignment; and
• Time-of-Day Assignment.
Each of the three mode choice processes are detailed below.
6.1 Mode Choice Model Structure for General Highway Assignment
The CHCNGA 2007 model was validated using the General Highway Assignment process. The CHCNGA 2007 mode choice model first balances the External-External (EE) trip table and then adds these preloaded EE trips to the trip table, including all of the other trip purposes. The six internal passenger vehicle trip purposes (HBW, HBSchool, HBShop, HBSR, HBO, and NHB) are then converted from person trips to vehicle trips using the auto occupancy rates included in Table 6.1. Auto occupancy rates were calculated by purpose

Chattanooga TPO 2035 LRTP – Volume 3: Travel Demand Model Documentation and User’s Guide
56
from the household travel characteristics survey. The three truck purposes (LDTK, MDTK, and HDTK) and the Internal-External (IE) trip purpose already are in vehicle trips and are therefore not converted during mode choice.
Table 6.1 Auto Occupancy Rates
Purpose Persons/Auto
Home-Based Work 1.12
Home-Based School 1.12
Home-Based Shop 1.48
Home-Based Social/Recreational 1.72
Home-Based Other 1.65
Nonhome-Based 1.68
Auto occupancy rates are only applied when running the General Highway Assignment option. This model option was used to produce the validation summary statistics found in Section 7.0 of this report.
6.2 Mode Choice Model Structure for Exclusive HOV or Truck Lanes
As noted earlier, a vehicle occupancy allocation component is included in the mode choice model in order to evaluate the impact of exclusive HOV or truck lanes. This component disaggregates vehicle trips into the following three categories:
• SOVs;
• HOVs with two persons per vehicle; and
• HOVs with three or more persons per vehicle.
The share of SOV and HOV trips were generated from the Chattanooga household travel diary survey and are provided by trip purpose in Table 6.2 below. An iterative process was used to adjust the factors during the last model update, as the initial run using the factors directly from the survey were significantly overestimating the number of trips in the model. As a result, the factors were adjusted proportionately to achieve the correct number of trips. The same factors used in the final 2000 model were used in the current 2007 model.
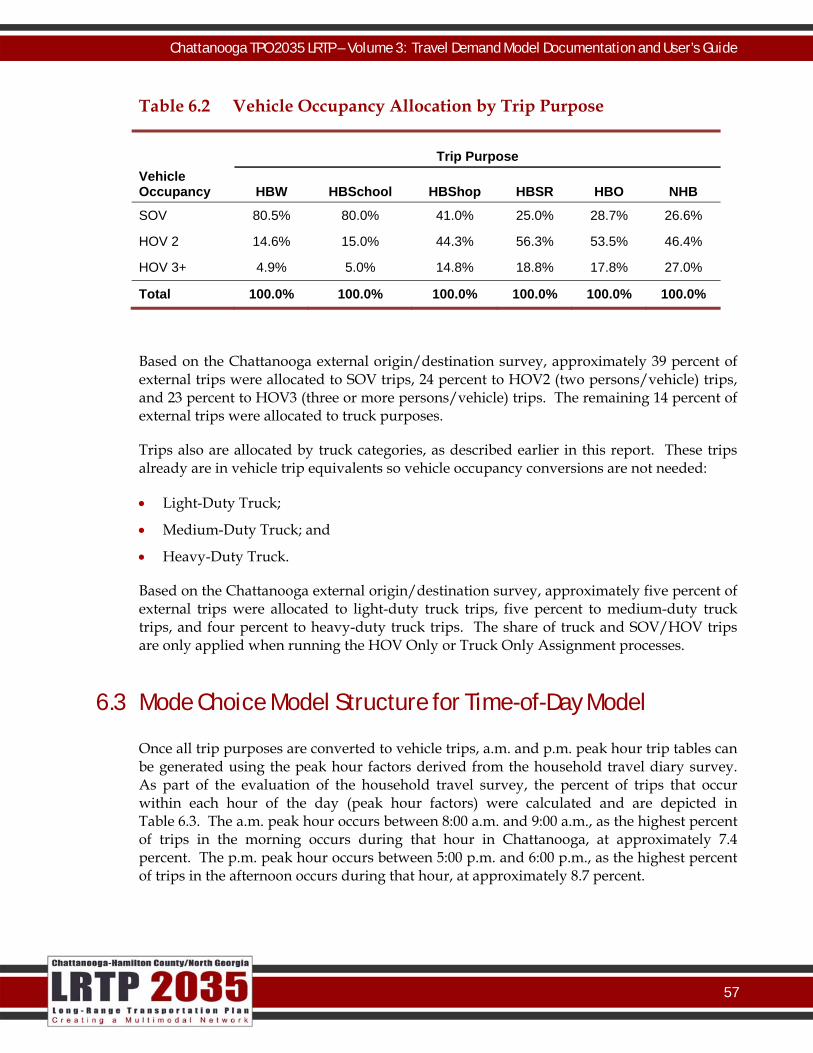
Chattanooga TPO 2035 LRTP – Volume 3: Travel Demand Model Documentation and User’s Guide
57
Table 6.2 Vehicle Occupancy Allocation by Trip Purpose
Vehicle Occupancy
Trip Purpose
HBW HBSchool HBShop HBSR HBO NHB
SOV 80.5% 80.0% 41.0% 25.0% 28.7% 26.6%
HOV 2 14.6% 15.0% 44.3% 56.3% 53.5% 46.4%
HOV 3+ 4.9% 5.0% 14.8% 18.8% 17.8% 27.0%
Total 100.0% 100.0% 100.0% 100.0% 100.0% 100.0%
Based on the Chattanooga external origin/destination survey, approximately 39 percent of external trips were allocated to SOV trips, 24 percent to HOV2 (two persons/vehicle) trips, and 23 percent to HOV3 (three or more persons/vehicle) trips. The remaining 14 percent of external trips were allocated to truck purposes.
Trips also are allocated by truck categories, as described earlier in this report. These trips already are in vehicle trip equivalents so vehicle occupancy conversions are not needed:
• Light-Duty Truck;
• Medium-Duty Truck; and
• Heavy-Duty Truck.
Based on the Chattanooga external origin/destination survey, approximately five percent of external trips were allocated to light-duty truck trips, five percent to medium-duty truck trips, and four percent to heavy-duty truck trips. The share of truck and SOV/HOV trips are only applied when running the HOV Only or Truck Only Assignment processes.
6.3 Mode Choice Model Structure for Time-of-Day Model
Once all trip purposes are converted to vehicle trips, a.m. and p.m. peak hour trip tables can be generated using the peak hour factors derived from the household travel diary survey. As part of the evaluation of the household travel survey, the percent of trips that occur within each hour of the day (peak hour factors) were calculated and are depicted in Table 6.3. The a.m. peak hour occurs between 8:00 a.m. and 9:00 a.m., as the highest percent of trips in the morning occurs during that hour in Chattanooga, at approximately 7.4 percent. The p.m. peak hour occurs between 5:00 p.m. and 6:00 p.m., as the highest percent of trips in the afternoon occurs during that hour, at approximately 8.7 percent.

Chattanooga TPO 2035 LRTP – Volume 3: Travel Demand Model Documentation and User’s Guide
58
The time-of-day model is an optional step that can only be applied to the General Highway Assignment model and is done by checking the a.m. Assignment and/or p.m. Assignment boxes in the user interface before running the General Highway Assignment.
It should be noted that the time-of-day factors are applied after the trips are assigned and thus, do not account for diversion in trips as a result of peak hour congestion. Therefore, it is not a true time-of-day component. The TPO is exploring the possibility of developing a true time-of-day model for the Chattanooga region that will be validated based on traffic counts by time-of-day. Since time-of-day models are necessary for transit modeling, it will likely be a combined model enhancement effort.
Table 6.3 Temporal Distribution of Trips
Hour Percent of Trips 12:00 to 1:00 a.m. 0.4%
1:00 to 2:00 a.m. 0.1%
2:00 to 3:00 a.m. 0.2%
3:00 to 4:00 a.m. 0.0%
4:00 to 5:00 a.m. 0.1%
5:00 to 6:00 a.m. 0.5%
6:00 to 7:00 a.m. 2.3%
7:00 to 8:00 a.m. 7.0%
8:00 to 9:00 a.m. 7.4%
9:00 to 10:00 a.m. 4.7%
10:00 to 11:00 a.m. 5.3%
11:00 a.m. to 12:00 p.m. 6.1%
12:00 to 1:00 p.m. 6.9%
1:00 to 2:00 p.m. 6.8%
2:00 to 3:00 p.m. 6.6%
3:00 to 4:00 p.m. 8.0%
4:00 to 5:00 p.m. 7.5%
5:00 to 6:00 p.m. 8.7%
6:00 to 7:00 p.m. 8.1%
7:00 to 8:00 p.m. 5.3%
8:00 to 9:00 p.m. 3.5%
9:00 to 10:00 p.m. 2.6%
10:00 to 11:00 p.m. 1.3%
11:00 p.m. to 12:00 a.m. 0.5%
Total 100.0%
Note: Percent of trips based on trips ending during time period.
Chattanooga TPO 2035 LRTP – Volume 3: Travel Demand Model Documentation and User’s Guide
59
7.0 Highway Assignment The purpose of highway assignment models is to load vehicle trips onto the highway network. This results in traffic estimates on individual links that ultimately attempt to simulate general vehicular travel throughout the study area. Supplemental assignment processes were generated for simulating HOV and truck exclusive facilities, and time-of-day simulations.
Validation of the highway assignment involved iterative modifications to centroid locations, verification of counts, and adjustment of speeds, capacities, K-Factors and other parameters related to trip distribution. A number of key evaluation statistics are generated during the assignment phase of the model. Volume-to-count ratios are compared by area type, facility type, laneage, and screenlines. Along with these statistics, the root mean squared error (RMSE) was generated by volume group.
This section describes validation of the highway assignment model. It includes an overview of the model structure, development and adjustment of model parameters, and a review of model results.
7.1 Highway Assignment Model Structure
Trips are loaded onto the network by means of an iterative equilibrium highway load program based on an all-or-nothing capacity restrained assignment. A total of 11 iterations are conducted during base year model execution (maximum iterations are set to 15) and the convergence parameter is set to 0.001. A series of statistical summaries are subsequently generated as a result of code added to the model script to report validation statistics. The supplemental exclusive lane assignment model is used to test scenarios where selected vehicle classes (e.g., single-occupant autos) are restricted from using selected lanes and ramps (e.g., HOV lanes). The time-of-day assignment model is used to obtain assignment volumes for specific time periods. These supplemental models are not normally executed when conducting a general traffic assignment where only total daily traffic volumes are desired.
7.2 Development and Validation of Highway Assignment Model
In total, 23 major model runs were executed in order to validate the CHCNGA 2000 TransCAD model. In addition, several model runs were made inbetween major model runs to iterate minor adjustments. Model validation was accomplished by minimizing the difference between model simulated volumes and observed counts for the year 2007 on network links throughout the study area. As many count locations were accounted for as

Chattanooga TPO 2035 LRTP – Volume 3: Travel Demand Model Documentation and User’s Guide
60
possible in order to ensure a wide range of coverage geographically as well as to incorporate as many examples of facilities and land uses located within the study area.
Adjustments were made to key elements in the modeling process to achieve this validation. After each run, a summary of the results was compiled and analyzed in order to identify areas for improvement in the model and successful strategies toward validation. Appropriate changes consistent with the discoveries revealed during analysis were then implemented and subsequent runs were executed. This iterative process was continued until validation was achieved.
Changes made to the model during highway assignment validation consisted mainly of iterative adjustments to speeds and highway network editing, including adjustment of centroids and centroid connectors. Other adjustments discussed elsewhere in this report also impacted highway assignment results.
7.3 Highway Assignment Validation Results
In validating traffic assignment, final outcome of a travel demand model, common performance metrics include the following:
• Systemwide volume-to-count ratio;
• Volume-to-count ratios by link group (area type, facility type, and number of lanes);
• Volume-to-count ratios along screenlines;
• Percent difference in model volumes and counts by volume group;
• Systemwide coefficient of determination between assigned volumes and counts;
• Systemwide percent root mean square error; and
• Percent root mean square error by volume group.
Table 7.1 includes the volume-to-count ratios by facility type, area type, and number of lanes. Overall, the model is validating at 0.96, within acceptable limits. This also is an improvement in the overall validation since the 2000 model with a volume-to-count ratio of 0.95. Although the validation of expressways improved in the 2007 model, the validation of undivided principal arterials, minor arterials, and one-way facilities got worse when compared to the 2000 model. This can be attributed to the correction in the network coding in the 2007 model reflecting the 3rd and 4th Street one-way facilities in downtown Chattanooga. Furthermore, additional network detail was included in some portions of the model as a result of further TAZ splits, as well as a significant amount of more traffic counts being provided in the 2007 model. Therefore, although the 2007 model may indicate lower volume-to-count ratios for some facility type categories, it is likely more accurate than the 2000 model due to the additional traffic counts. In addition, no ramp counts were available in the 2000 model and have since been added to the 2007 model validating at a 2007 volume-
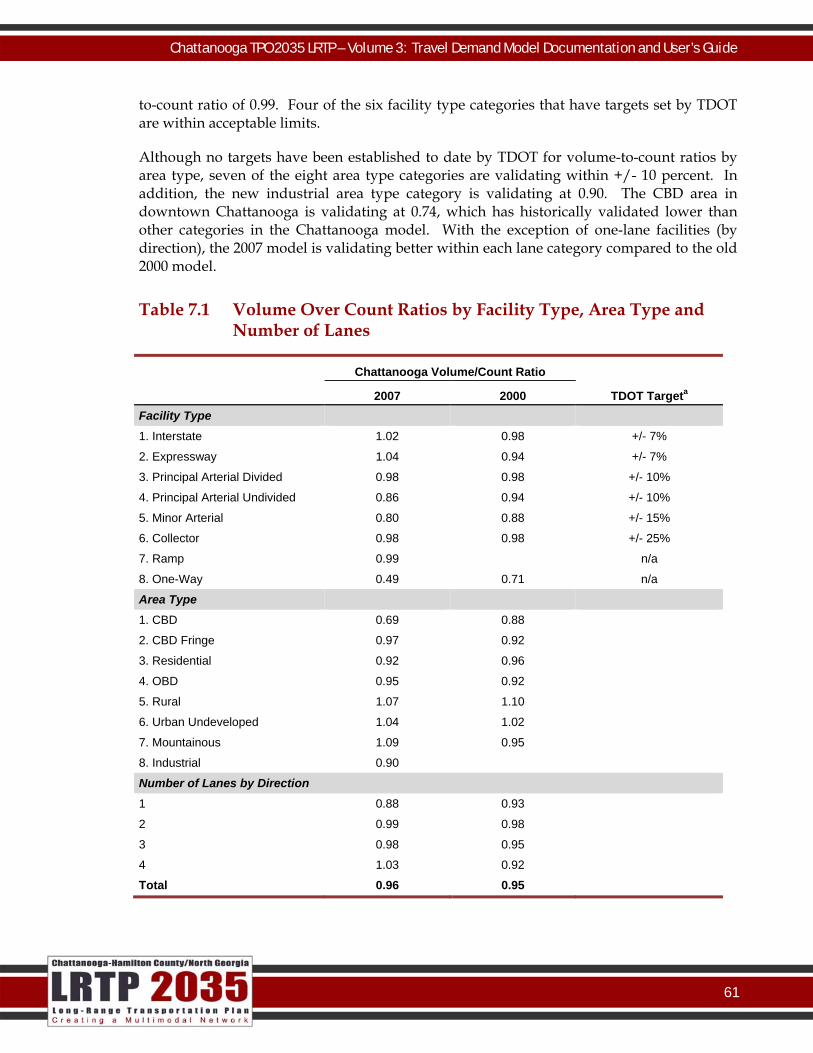
Chattanooga TPO 2035 LRTP – Volume 3: Travel Demand Model Documentation and User’s Guide
61
to-count ratio of 0.99. Four of the six facility type categories that have targets set by TDOT are within acceptable limits.
Although no targets have been established to date by TDOT for volume-to-count ratios by area type, seven of the eight area type categories are validating within +/- 10 percent. In addition, the new industrial area type category is validating at 0.90. The CBD area in downtown Chattanooga is validating at 0.74, which has historically validated lower than other categories in the Chattanooga model. With the exception of one-lane facilities (by direction), the 2007 model is validating better within each lane category compared to the old 2000 model.
Table 7.1 Volume Over Count Ratios by Facility Type, Area Type and Number of Lanes
Chattanooga Volume/Count Ratio 2007 2000 TDOT Targeta Facility Type
1. Interstate 1.02 0.98 +/- 7%
2. Expressway 1.04 0.94 +/- 7%
3. Principal Arterial Divided 0.98 0.98 +/- 10%
4. Principal Arterial Undivided 0.86 0.94 +/- 10%
5. Minor Arterial 0.80 0.88 +/- 15%
6. Collector 0.98 0.98 +/- 25%
7. Ramp 0.99 n/a
8. One-Way 0.49 0.71 n/a
Area Type
1. CBD 0.69 0.88
2. CBD Fringe 0.97 0.92
3. Residential 0.92 0.96
4. OBD 0.95 0.92
5. Rural 1.07 1.10
6. Urban Undeveloped 1.04 1.02
7. Mountainous 1.09 0.95
8. Industrial 0.90
Number of Lanes by Direction 1 0.88 0.93
2 0.99 0.98
3 0.98 0.95
4 1.03 0.92
Total 0.96 0.95

Chattanooga TPO 2035 LRTP – Volume 3: Travel Demand Model Documentation and User’s Guide
62
The 10 screenlines from the previous model were kept and utilized to assist in model validation for the 2007 model. Their positions capture all the major traffic flows in the Chattanooga Region and thus further adjustments and additions were deemed unnecessary. A map of the screenline locations was provided in Section 2.0 (Figure 2.18). Maps of volume-to-count ratios on each link in the model with a count are included in Appendix E. For eight of the 10 screenlines, the volume-to-count ratios fall within the +/- 10 percent target range of TDOT. Table 7.2 compares the volume-to-count ratio for each screenline in the 2007 model against the old 2000 model.
Table 7.2 Comparison of Volume-to-Count Ratios by Screenline
Chattanooga Volume/Count Ratio
Screenline 2007 2000
1 1.00 0.97
2 1.01 0.94
3 0.88 0.97
4 0.99 0.91
5 0.82 0.90
6 0.93 0.99
7 1.10 1.09
8 0.91 1.06
9 1.06 1.02
10 1.00 1.00
Table 7.3 indicates the percent difference in model volumes and observed counts by volume group. All volume groups within the 2007 model achieve the established TDOT targets.

Chattanooga TPO 2035 LRTP – Volume 3: Travel Demand Model Documentation and User’s Guide
63
Table 7.3 Percent Difference for Daily Volumes (Calculated for Links with Counts)
AADT Chattanooga 2007TransCAD TDOT Targeta
<1,000 48.90% +/- 60%
1,000-2,500 19.20% +/- 47%
2,500-5,000 -2.80% +/- 36%
5,000-10,000 -10.30% +/- 29%
10,000-25,000 -8.90% +/- 25%
25,000-50,000 1.50% +/- 22%
>50,000 -5.90% +/- 21%
The correlation coefficient of observed counts to model volumes (R2) is performing well at 0.95, exceeding TDOT’s target of 0.88, as demonstrated below in Figure 7.1.
Figure 7.1 Correlation of Assigned Versus Observed Volumes
0
10,000
20,000
30,000
40,000
50,000
60,000
70,000
0 10,000 20,000 30,000 40,000 50,000 60,000 70,000
Assigned Volume
2007 AADT
As indicated in Table 7.4, the overall RMSE for the 2007 model is 34.6 percent, within acceptable Federal limits. TDOT has established an overall RMSE target of 30 percent. However, based on discussion with TDOT during the June 30, 2009 teleconference, it was

Chattanooga TPO 2035 LRTP – Volume 3: Travel Demand Model Documentation and User’s Guide
64
determined that 30 percent was just a target and was not required as Federal standards indicate a RMSE range of 32 to 39 percent is within acceptable limits (according to the FHWA Model Validation and Reasonableness Checking Manual). Although the previous 2000 model indicated an overall RMSE of 23 percent, it is suspected that it was not as accurate due to the reduced amount of traffic counts available at that time. All volume groups within the 2007 model achieved a RMSE value close to or within Federal and/or TDOT targets.
It should be noted that volume-over-count ratio charts relative accuracy and whether there is a systemwide under- or over-assignment, whereas RMSE measures assignment accuracy irrespective of whether these are generally over- or under-assignments. Achieving 0.96 in the 2007 model instead of 0.95 in the 2000 model is indicative of higher traffic assignments overall, which might not impact the overall percent error in a positive manner. The 0.96 overall volume/count ratio is reflective of the possibly low simulation of HBW trips, discussed earlier. Another consideration is that several outlying lower volume roads were added to the model near the boundary which could potentially negatively affect the 2007 RMSE results in particular.
Table 7.4 Root Mean Square Error (RMSE) by Volume Group
Count Range
Chattanooga TransCAD
TDOT Target
FHWA and New FDOT Guidelines
and Standards 2007 2000
0-4,999 83.70% 73.10% 115.76 45-100
5,000-9,999 46.30% 33.60% 43.14 35-45
10,000-14,999 36.40% 18.10% 28.27 27-35
15,000-19,999
25.40% 21.70%
25.38
25-30
20,000-29,999 15-27
30,000-39,999 16.90% 15-25
40,000-49,999 12.10%
4.40% 30.25
50,000-59,999 7.20% 10-20
60,000-69,999
15.50% n/a 19.20 10-19
70,000-79,999
79,999-89,999
Overall 34.60% 23.40% 30.00% 32-39%
Table 7.5 summarizes the vehicle miles traveled (VMT) by model facility type, as well as the percent of VMT that falls within each model facility type compared to TDOT targets. With the exception of minor arterials, all of the facility types fall within or close to TDOT’s targets

Chattanooga TPO 2035 LRTP – Volume 3: Travel Demand Model Documentation and User’s Guide
65
for percent of VMT by facility type. In addition, the overall ratio of VMT to Highway Performance Monitoring System (HPMS) VMT is 1.06 (excluding external centroid connectors). While this general VMT distribution might be off for freeways and arterials, volume-over-count ratios show a favorable validation of these links. As a result, the only way to better match the VMT distribution would be to worsen the volume-over-count statistics.
Table 7.5 Vehicle Miles Traveled by Model Facility Type
Facility Type Chattanooga 2007 Model VMT TDOT Target
Interstate 4,228,041 (31.4%) 33-38%
Expressway 1,496,818 (11.1%)
Principal Arterial Divided 2,067,224 (15.4%) 27-33%
Principal Arterial Undivided 835,239 (6.2%)
Minor Arterial 1,384,961 (10.3%) 18-22%
Collector 1,465,718 (10.9%) 8-12%
Ramp 215,118 n/a
One-Way 16,672 n/a
External Connectors 921,730 n/a
Centroid Connectors 827,412 n/a
Total 13,458,933
Comparison to Observed Speeds
During November 2008, the TPO conducted travel time runs during the a.m. and p.m. peak-periods along all routes in their Congestion Management Plan (CMP). The results of these travel time runs were used to calculate average peak-period congested speeds. These observed speeds were then compared to the daily congested speeds in the model during the 2007 model validation process. Appendix D includes a map of the observed 2008 a.m. peak-period congested speeds, as well as a map of the daily congested speeds from the 2007 model. As expected, the model speeds compared to the observed speeds are slightly different in some instances since the model speeds are daily and the observed speeds are peak-period. However, there was a significant improvement in congested speeds along interstates in the 2007 model as they were too low in the 2000 model.

Chattanooga TPO 2035 LRTP – Volume 3: Travel Demand Model Documentation and User’s Guide
66
This Page Intentionally Left Blank

Chattanooga TPO 2035 LRTP – Volume 3: Travel Demand Model Documentation and User’s Guide
67
8.0 Summary and Conclusions Section 8.0 provides a bullet list summary of the 2007 model validation observations, as well as details on future model enhancements and data collection efforts planned by the TPO.
8.1 Summary of 2007 Model Validation Observations
Below is a summary of 2007 model validation observations:
• The overall 2007 model is validating at an RMSE of 34.6 percent, within acceptable Federal limits;
• The 2007 model is validating at a systemwide volume-to-count ratio of 0.96, within acceptable limits and improved since the 2000 model;
• The correlation coefficient of observed counts to model volumes (R2) is performing well at 0.95, exceeding TDOT’s target of 0.88;
• Eight of 10 screenlines are validating within acceptable limits;
• The overall ratio of model VMT to HPMS VMT is 1.06;
• Average trip lengths increased for some trip purposes and decreased for others, although HBW trip lengths did improve;
• The percent of intrazonal trips attributed to HBW trips are now within a more reasonable range;
• Congested speeds along the interstate and other higher facilities are improved compared to the 2000 model and observed congested speeds;
• Overall, higher facilities are generally comparable to the 2000 model, however, minor facilities got worse in the 2007 model due to additional traffic count availability and network detail;
• Overall, the 2007 model has more counts with almost 10 percent of the network having counts. As a result, the 2007 model includes improved accuracy and reliability of the model statistics;
• Employment in the 2007 model is lower than in the 2000 model, resulting in lower commercial trips; and
• As with all models, there is always room for improvement. However, this model should be sufficient for updating the 2030 LRTP to the year 2035.

Chattanooga TPO 2035 LRTP – Volume 3: Travel Demand Model Documentation and User’s Guide
68
8.2 Future Model Enhancements
Several enhancements are planned for the next generation of the Chattanooga travel demand model to be used for the next LRTP update scheduled for adoption in 2014. These enhancements, as well as the planned data collection efforts necessary to support these enhancements, are detailed below.
Data Collection
In preparation for the next LRTP Update due for adoption in 2014, the TPO is planning for multiple data collection and compilation efforts over the next two years. Below are some of the data collection efforts planned:
• Socioeconomic Data – Once the Census 2010 population and household data is released, likely in 2012, the TPO will use the data to develop the base year 2010 model socioeconomic data. In the meantime, the TPO will be providing guidelines to the counties and municipalities in the TPO region stating what socioeconomic data is required to assist with compiling the data. Additionally, proprietary employment datasets for the year 2010 may be evaluated for accuracy to determine the most appropriate data source for the Chattanooga region. In addition to year 2010, the TPO will be forecasting socioeconomic data to the horizon year for the next LRTP Update, likely year 2040.
• Traffic Counts – During calendar year 2010, the TPO will be identifying and collecting traffic counts at key locations throughout the TPO to assist with validating the 2010 base year model as part of the next LRTP update. The traffic counts will be collected by vehicle class and 15-minute intervals in order to validate trips at the truck level and to include a new time-of-day component in the model.
• External Origin and Destination Survey – In 2002, a roadside origin-destination intercept survey designed to obtain characteristics of travelers entering, exiting, and passing through the region from locations outside the CHCNGA study area was conducted. During the last 2030 LRTP Update, it was determined that the results from the 2002 external origin and destination survey were biased. As a result, during the last 2030 LRTP Update, as well as this current 2035 LRTP Update, the 2002 roadside origin-destination intercept survey was not used within the TransCAD model. Therefore, the TPO intends to conduct a new external origin and destination survey during the fall of 2010. In the meantime, the TPO will be designing the sampling plan and survey instrument. The results of the 2010 external origin and destination survey will be used to validate the external model for the 2010 base year validation as part of the next LRTP update.
• On-Board Transit Survey – As mentioned earlier, the TPO intends to conduct an on-board transit survey in order to validate a new mode choice/transit component in the TransCAD travel demand model. The TPO will be designing the sampling plan and

Chattanooga TPO 2035 LRTP – Volume 3: Travel Demand Model Documentation and User’s Guide
69
survey instrument in the spring/summer of 2010 with the survey being conducted in the fall of 2010.
• Household Travel Diary Survey – In 2002, a household travel diary survey was conducted to determine trip generation rates, average trip lengths, auto occupancy factors, and other characteristics used in model development and validation. Typically, household travel diary surveys are conducted every 10 years to accurately reflect travel characteristics of the region. Pending funding availability, the TPO intends to conduct a new household travel diary survey in calendar year 2011. The results of the 2011 travel diary survey will be incorporated into the new 2010 base year model for the next LRTP update.
• Bicycle and Pedestrian Counts – If a nonmotorized component is added to the travel demand model prior to validating the 2010 base year model for the next LRTP Update, the TPO will collect bicycle and pedestrian counts. Currently, the TPO owns three bicycle and pedestrian counters and has begun collecting counts in key locations.
Travel Demand Model Enhancements
The above mentioned data collection efforts will be used to incorporate several enhancements to the current CHCNGA TPO TransCAD model. These enhancements could potentially include the following additions to the TransCAD model prior to the next LRTP Update:
• Updated external model based on 2010 external data;
• Updated trip generation structure based on 2011 household travel diary survey data;
• New mode choice/transit component not previously included in the model to be used to forecast transit ridership;
• New nonmotorized component not previously included in the model to be used to forecast bicycle and pedestrian trips;
• New time-of-day component used to disaggregate daily trips into three to four time periods. This will improve the accuracy in calculating air quality emissions and is typically necessary for transit models; and
• Validate truck trips in addition to total trips, whereas in the past, only total trips were validated.

Chattanooga TPO 2035 LRTP – Volume 3: Travel Demand Model Documentation and User’s Guide
70
This Page Intentionally Left Blank

Chattanooga TPO 2035 LRTP – Volume 3: Travel Demand Model Documentation & User’s Guide
Appendix A: Network Project Lists
Chattanooga TPO 2035 LRTP – Volume 3: Travel Demand Model Documentation & User’s Guide
This Page Intentionally Left Blank
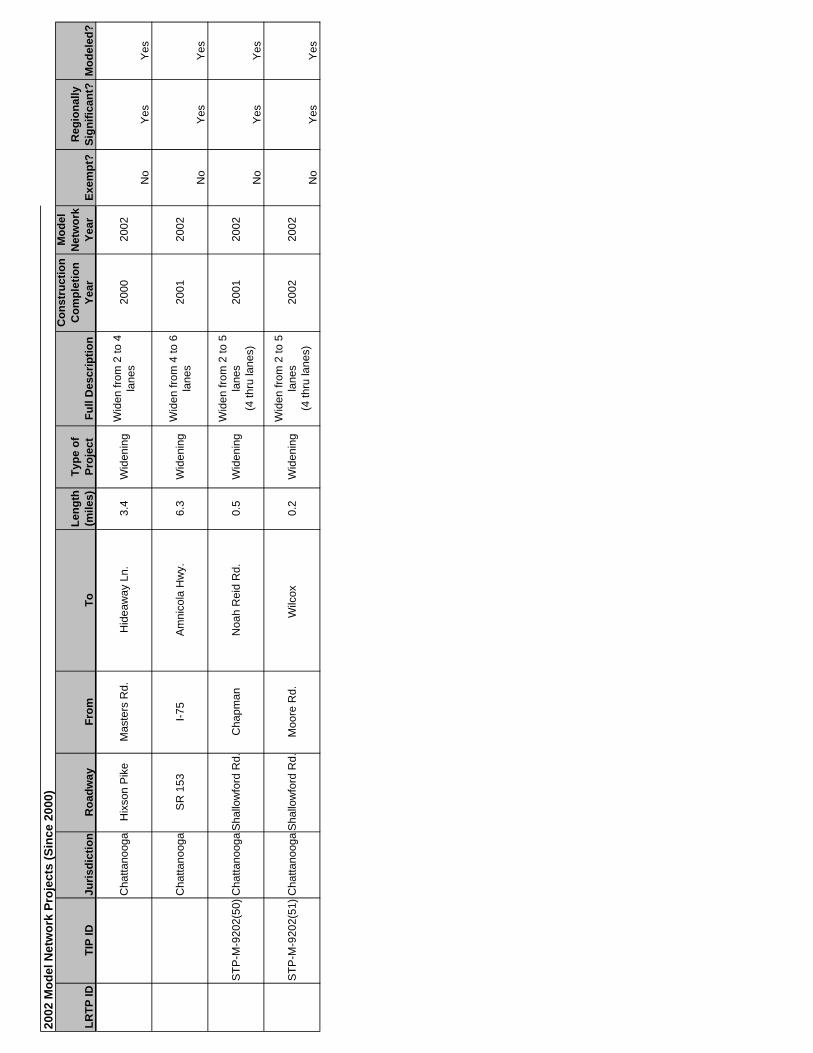
2002
Mod
el N
etw
ork
Proj
ects
(Sin
ce 2
000)
Cha
ttano
oga
Hix
son
Pik
eM
aste
rs R
d.H
idea
way
Ln.
3.4
Wid
enin
gW
iden
from
2 to
4
lane
s20
0020
02
No
Yes
Yes
Cha
ttano
oga
SR
153
I-75
Am
nico
la H
wy.
6.3
Wid
enin
gW
iden
from
4 to
6
lane
s20
0120
02
No
Yes
Yes
STP
-M-9
202(
50)C
hatta
noog
aS
hallo
wfo
rd R
d.C
hapm
anN
oah
Rei
d R
d.0.
5W
iden
ing
Wid
en fr
om 2
to 5
la
nes
(4 th
ru la
nes)
2001
2002
No
Yes
Yes
STP
-M-9
202(
51)C
hatta
noog
aS
hallo
wfo
rd R
d.M
oore
Rd.
Wilc
ox
0.2
Wid
enin
gW
iden
from
2 to
5
lane
s (4
thru
lane
s)20
0220
02
No
Yes
Yes
Roa
dway
Juris
dict
ion
TIP
IDLR
TP ID
Leng
th
(mile
s)
Con
stru
ctio
n C
ompl
etio
n Ye
ar
Mod
el
Net
wor
k Ye
arEx
empt
?R
egio
nally
Si
gnifi
cant
?M
odel
ed?
ToFr
omTy
pe o
f Pr
ojec
tFu
ll D
escr
iptio
n

2009
Mod
el N
etw
ork
Proj
ects
(Sin
ce 2
002)
Cha
ttano
oga
SR
8/U
S 1
27U
S 2
7S
uck
Cre
ek R
d.1.
4W
iden
ing
Wid
en fr
om 4
to 6
lane
s20
0520
07 &
200
9
No
Yes
Yes
Cha
ttano
oga
Hix
son
Pik
eH
idea
way
Ln.
Dal
las
Hol
low
Rd.
2.4
Wid
enin
gW
iden
from
2 to
6 la
nes
2005
2007
& 2
009
No
Yes
Yes
Cha
ttano
oga
I-75
Sha
llow
ford
Rd.
S
R 3
171.
2W
iden
ing
Wid
en fr
om 4
to 6
lane
s20
0520
07 &
200
9
No
Yes
Yes
Cha
ttano
oga
I-75
SR
317
1.1
mile
sou
th o
f SR
2/U
S 1
13.
1W
iden
ing
Wid
en fr
om 4
to 8
lane
s20
0720
07 &
200
9
No
Yes
Yes
3301
5C
hatta
noog
aI-7
5N
ew In
terc
hang
e at
Mile
9
(Ent
erpr
ise
Sou
th)
New
In
terc
hang
eN
ew In
terc
hang
e at
Mile
9 (E
nter
pris
e S
outh
)20
0720
07 &
200
9
No
Yes
Yes
107*
STP
-M-9
202(
52)
Cha
ttano
oga
3rd
St./
4th
St.
Lind
say
Bro
ad S
t./G
eorg
ia A
ve.
0.5
Wid
enin
gW
iden
from
2 to
4 la
nes
2003
2007
& 2
009
No
Yes
Yes
21c
TN07
-LO
C01
Cha
ttano
oga
Ent
erpr
ise
Blv
d.E
nter
pris
e P
kwy.
For
kE
nter
pris
e S
outh
Blv
d. c
ul-d
e-sa
c1.
1N
ew
Con
stru
ctio
nC
onst
ruct
new
4-la
ne ro
adw
ay fr
om E
nter
pris
e P
kwy
to e
xist
ing
cul-d
e-sa
c20
0820
09N
oY
esY
es
21d
3304
110
7637
.02
Cha
ttano
oga
SR
317
C
onne
ctor
(P
ropo
sed)
I-75
Ent
erpr
ise
Sou
th
Inte
rcha
nge
Api
son
Pik
e @
Old
Lee
Hw
y.0.
6N
ew
Con
stru
ctio
nN
ew 4
-lane
faci
lity
2009
2009
No
Yes
Yes
58TN
01-M
C01
110
1432
Cha
ttano
oga
Sha
llow
ford
Rd.
Sta
ndife
r Gap
Wes
t of C
ente
r St.
1.2
Wid
enin
gW
iden
ing
from
2 to
5 la
nes
(4 th
ru la
nes)
2008
2009
No
Yes
Yes
96S
TP-9
9-2
6504
40C
atoo
sa C
ount
yS
R 1
46La
kevi
ew D
r.I-7
51.
3W
iden
ing
Wid
en fr
om 2
to 4
lane
s, in
clud
ing
brid
ge
reco
nstru
ctio
n
2009
(rem
ove
from
20
09 n
etw
ork
for a
ir qu
ality
)
2009
(c
onst
ruct
ion
won
't be
co
mpl
ete
until
20
10)
No
Yes
Yes
98S
TP-9
8-3
6422
10C
atoo
sa C
ount
yS
R 1
46I-7
5 S
R 3
/US
41
0.6
Wid
enin
gW
iden
from
2 to
4 la
nes
2009
(rem
ove
from
20
09 n
etw
ork
for a
ir qu
ality
)
2009
(c
onst
ruct
ion
won
't be
co
mpl
ete
until
20
10)
No
Yes
Yes
102
TN01
-MC
002
(TN
)/S
TP-9
9-1
(GA
)10
1029
(TN
)/65
0430
(GA
)E
ast R
idge
(TN
)/Cat
oosa
C
ount
y (G
A)
Rin
ggol
d R
d.C
R 4
0 Fr
awle
y R
d.0.
03W
iden
ing
Wid
en fr
om 2
to 5
lane
s (4
thro
ugh
lane
s)20
0820
09N
oY
esY
es
111*
STP
-M-9
202
(36)
/TN
01-M
C00
610
1557
Cha
ttano
oga
Ash
land
Ter
race
Nor
cros
s R
d.
Kno
llwoo
d D
rive
1.3
Wid
enin
gW
iden
from
2 to
4 la
nes
2008
2009
No
Yes
Yes
Mod
el
Net
wor
k Ye
arLe
ngth
(m
iles)
Type
of
Proj
ect
Full
Des
crip
tion
Con
stru
ctio
n C
ompl
etio
n Ye
arEx
empt
?M
odel
ed?
Reg
iona
lly
Sign
ifica
nt?
LRTP
ID
TIP/
STIP
ID
DO
T PI
NJu
risdi
ctio
nR
oadw
ayFr
omTo

2015
Mod
el N
etw
ork
Proj
ects
(Sin
ce 2
009)
City
(Cou
nty)
Stat
eFr
omTo
15C
hatta
noog
aTN
SR 3
17/B
onny
Oak
s D
rive
SR 1
7I-7
5W
iden
ing
Wid
en fr
om 2
to 4
lane
s (a
lread
y fo
ur la
nes
eith
er d
irect
ion
of li
sted
te
rmin
i spe
cific
ally
from
Silv
erda
le
Roa
d ea
st to
I-75
and
from
Pr
eser
vatio
n D
rive
wes
t to
SR 1
7)4.
920
1020
11 E
+C &
20
15N
oYe
sYe
s
17a
3304
2C
hatta
noog
a/C
olle
geda
leTN
SR 3
17/A
piso
n Pi
keO
ld L
ee H
wy.
SR 3
21W
iden
ing
Wid
en fr
om 2
to 4
lane
s2.
1720
1020
11 E
+C &
20
15N
oYe
sYe
s
21b
8190
8.2
Cha
ttano
oga
TNEn
terp
rise
Pkw
y.En
terp
rise
Pkw
y./I-
75
Inte
rcha
nge
Ente
rpris
e Bl
vd./P
kwy.
Fo
rkN
ew
Con
stru
ctio
n
Con
stru
ct n
ew 4
-lane
road
way
(E
nter
pris
e Pk
wy.
) fro
m E
nter
pris
e Pk
wy.
/I-75
Inte
rcha
nge
to
Ente
rpris
e Bl
vd./P
kwy.
For
k20
1020
11 E
+C &
20
15N
oYe
sYe
s
101
3302
0C
hatta
noog
aTN
I-75
1.1
Mi s
outh
of S
R
2/U
S 11
0.
2 M
i nor
th o
f SR
2/U
S 11
Wid
enin
gW
iden
from
4 to
8 la
nes
1.3
2010
2011
E+C
&
2015
No
Yes
Yes
108
TN01
-MC
007
Cha
ttano
oga
TNSh
allo
wfo
rd R
d. G
unba
rrel
Rd.
Jenk
ins
Rd.
Wid
enin
gW
iden
ing
from
2 to
5 la
nes
(4 th
ru
lane
s)1.
120
1020
11 E
+C &
20
15N
oYe
sYe
s
3C
hatta
noog
a (H
amilt
on C
o.)
TNU
S 27
Nor
th o
f Ten
ness
ee
Riv
er B
ridge
SR 8
/Sig
nal M
ount
ain
Blvd
.W
iden
ing
Wid
en fr
om 4
to 8
lane
s2.
720
15N
oYe
sYe
s
4Fo
rt O
glet
horp
eG
AD
eitz
Rd.
SR 1
46/C
loud
Spr
ings
R
d.R
eeds
Brid
ge
Rd.
/Boy
nton
Rd.
Wid
enin
g/
Rea
lignm
ent
Wid
en fr
om 2
to 4
lane
s2.
120
15N
oYe
sYe
s
562
1530
Rin
ggol
d (C
atoo
sa
Co.
)G
ASR
151
/Ala
bam
a H
wy.
Hol
com
b R
d.U
S 41
/Nas
hvill
e St
.W
iden
ing
Wid
en fr
om 2
to 4
lane
s w
ith tu
rn
lane
s as
nee
ded
1.7
2015
No
Yes
Yes
10C
hatta
noog
a (H
amilt
on C
o.)
TNG
add
Rd.
Nor
cros
s R
d.
SR 1
53W
iden
ing
Wid
en fr
om 2
to 4
lane
s0.
220
15N
oYe
sYe
s
11C
hatta
noog
a (H
amilt
on C
o.)
TNC
entra
l Ave
. Ext
ensi
on3r
d St
.R
iver
side
Driv
eN
ew R
oadw
ay
(Ext
ensi
on)
2-la
ne e
xten
sion
0.6
2015
No
Yes
Yes
17a
3304
2
Cha
ttano
oga/
Col
lege
dale
(H
amilt
on C
o.)
TNSR
317
/Api
son
Pike
Old
Lee
Hw
y.SR
321
Wid
enin
gW
iden
from
2 to
4 la
nes
2.1
2015
No
Yes
Yes
17b
3304
3C
olle
geda
le
(Ham
ilton
Co.
)TN
SR 3
17/A
piso
n Pi
keSR
321
East
Bra
iner
d R
d.W
iden
ing
Wid
en fr
om 2
to 4
lane
s4.
020
15N
oYe
sYe
s
21e
Cha
ttano
oga
(Ham
ilton
Co.
)TN
Ente
rpris
e Pa
rkw
ayH
icko
ry V
alle
y R
oad
1 m
ile s
outh
of H
ighw
ay
58N
ew A
lignm
ent
0.6
2015
No
Yes
Yes
Juris
dict
ion
Con
stru
ctio
n C
ompl
etio
n Ye
arLe
ngth
(m
iles)
Mod
eled
?
Mod
el
Net
wor
k Ye
arEx
empt
?R
egio
nally
Si
gnifi
cant
?LR
TP
IDTy
pe o
f Pr
ojec
tPr
ojec
t Des
crip
tion
In
FY '0
8-'1
1 TI
P (A
men
ded
Feb
'09)
Term
ini
Roa
d N
ame
e(
ato
Co
)te
pse
aay
co
ya
eyoa
d58
eg
et
06
05
oes
es23
Fort
Ogl
etho
rpe
GA
Lake
view
Dr.
Page
Rd.
Cro
ss S
t.W
iden
ing
Wid
en fr
om 2
to 4
lane
s0.
720
15N
oYe
sYe
s
8833
025
Cha
ttano
oga
(Ham
ilton
Co.
)TN
US
27/I-
124
I-24
Sout
h of
Ten
ness
ee
Riv
erW
iden
ing
Wid
en fr
om 4
to 8
lane
s1.
520
15N
oYe
sYe
s91
Cat
oosa
Co.
GA
Thre
e Kn
otch
Rd.
Boyn
ton
Rd.
SR 2
Wid
enin
gW
iden
from
2 to
4 la
nes
0.3
2015
No
Yes
Yes
9433
045
Cha
ttano
oga
(Ham
ilton
Co.
)TN
SR 3
20/E
ast B
rain
erd
Rd.
East
of G
rays
ville
Rd.
Be
l Air
Rd.
Wid
enin
gW
iden
from
2 to
4 la
nes
1.9
2015
No
Yes
Yes
108
TN01
-MC
007
Cha
ttano
oga
(Ham
ilton
Co.
)TN
Shal
low
ford
Rd.
Gun
barr
el R
d.Je
nkin
s R
d.W
iden
ing
Wid
enin
g fro
m 2
to 5
lane
s (4
thru
la
nes)
1.0
2015
No
Yes
Yes
126
Cha
ttano
oga
(Ham
ilton
Co.
)TN
Hic
kory
Val
ley
Rd.
Ente
rpris
e Pa
rkw
ay
Exte
nsio
nH
ighw
ay 5
8W
iden
ing
Wid
en fr
om 2
to 4
lane
s1.
120
15N
oYe
sYe
s
128*
**C
hatta
noog
a (H
amilt
on C
o.)
TNSt
reet
ASt
reet
ASt
reet
CN
ew R
oadw
ayN
ew tw
o la
ne ro
ad0.
720
15N
oYe
sYe
s
129*
**C
hatta
noog
a (H
amilt
on C
o.)
TNSt
reet
BSt
reet
ASt
reet
AN
ew R
oadw
ayN
ew tw
o la
ne ro
ad0.
120
15N
oYe
sYe
s
130*
**C
hatta
noog
a (H
amilt
on C
o.)
TNSt
reet
CSt
reet
ASt
reet
EN
ew R
oadw
ayN
ew tw
o la
ne ro
ad0.
420
15N
oYe
sYe
s
131*
**C
hatta
noog
a (H
amilt
on C
o.)
TNSt
reet
DI-2
4C
hest
nut
New
Roa
dway
New
two
lane
col
lect
or ro
ad0.
620
15N
oYe
sYe
s
132*
**C
hatta
noog
a (H
amilt
on C
o.)
TNSt
reet
ESt
reet
FBr
oad
stN
ew R
oadw
ayN
ew tw
o la
ne c
olle
ctor
road
0.4
2015
No
Yes
Yes
133*
**C
hatta
noog
a (H
amilt
on C
o.)
TNSt
reet
FSt
reet
DW
28t
h st
.N
ew R
oadw
ayN
ew tw
o la
ne c
olle
ctor
road
0.3
2015
No
Yes
Yes
134*
**C
hatta
noog
a (H
amilt
on C
o.)
TNSt
reet
GSt
reet
FSt
reet
HN
ew R
oadw
ayN
ew tw
o la
ne ro
ad0.
120
15N
oYe
sYe
s
135*
**C
hatta
noog
a (H
amilt
on C
o.)
TNSt
reet
HSt
reet
DSt
reet
FN
ew R
oadw
ayN
ew tw
o la
ne ro
ad0.
220
15N
oYe
sYe
s
136*
**C
hatta
noog
a (H
amilt
on C
o.)
TNSt
reet
ISt
reet
DW
28t
h st
.N
ew R
oadw
ayN
ew tw
o la
ne ro
ad0.
220
15N
oYe
sYe
s
137*
**C
hatta
noog
a (H
amilt
on C
o.)
TNSt
reet
JSt
reet
DSt
reet
EN
ew R
oadw
ayN
ew tw
o la
ne ro
ad0.
120
15N
oYe
sYe
s
138*
**C
hatta
noog
a (H
amilt
on C
o.)
TNSt
reet
KSt
reet
DC
hest
nut
New
Roa
dway
New
two
lane
road
0.2
2015
No
Yes
Yes
139*
**C
hatta
noog
a (H
amilt
on C
o.)
TNSt
reet
LC
hest
nut
W 2
6th
st.
New
Roa
dway
New
two
lane
road
0.1
2015
No
Yes
Yes
140*
**C
hatta
noog
a (H
amilt
on C
o.)
TNSt
reet
MSi
ndey
St
Broa
d st
.N
ew R
oadw
ayN
ew tw
o la
ne ro
ad0.
120
15N
oYe
sYe
s
141*
**C
hatta
noog
a (H
amilt
on C
o.)
TNSt
reet
NM
iddl
e St
reet
Mid
dle
Stre
etN
ew R
oadw
ayN
ew tw
o la
ne ro
ad0.
320
15N
oYe
sYe
s
142*
**C
hatta
noog
a (H
amilt
on C
o.)
TNSt
reet
OSt
reet
NSt
reet
NN
ew R
oadw
ayN
ew tw
o la
ne ro
ad0.
120
15N
oYe
sYe
s
170*
***
Cha
ttano
oga
(Ham
ilton
Co.
)TN
SIA
Roa
d fo
r VW
(In
dust
rial A
cces
s R
d.)
Ente
rpris
e Bo
ulev
ard/
Dis
cove
ry
Dr.
SR 5
8N
ew R
oadw
ayIn
dust
rial a
cces
s ro
ad fo
r Vo
lksw
agen
2.3
2015
No
Yes
Yes
178
3302
7C
hatta
noog
a (H
amilt
on C
o.)
TNU
S 27
/Olg
iati
Brid
geR
iver
front
Pkw
y.M
anuf
actu
rer's
Rd.
Wid
enin
gW
iden
from
4 to
6 la
nes
2015
No
Yes
Yes

2025
Mod
el N
etw
ork
Proj
ects
(Sin
ce 2
015)
City
(Cou
nty)
Stat
eFr
omTo
5Y
esR
ingg
old
(Cat
oosa
C
o.)
GA
SR
151
/Ala
bam
a H
wy.
Hol
com
b R
d.U
S 4
1/N
ashv
ille
St.
Wid
enin
g
Wid
en fr
om 2
to 4
la
nes
with
turn
lane
s as
nee
ded
1.7
2025
No
Yes
Yes
6R
ingg
old
TN/G
A
SR
321
(TN
)/SR
151
(G
A)/O
olte
wah
-Rin
ggol
d R
d.Le
e H
wy.
US
41/
US
76
Wid
enin
gW
iden
from
2 to
4
lane
s12
.120
25N
oY
esY
es
15Y
esC
hatta
noog
a (H
amilt
on C
o.)
TNS
R 3
17/B
onny
Oak
s D
rive
SR
17
I-75
Wid
enin
g
Wid
en fr
om 2
to 4
la
nes
(alre
ady
four
la
nes
eith
er d
irect
ion
of li
sted
term
ini
spec
ifica
lly fr
om
Silv
erda
le R
oad
east
to
I-75
and
from
P
rese
rvat
ion
Driv
e w
est t
o S
R 1
7)5.
120
25N
oY
esY
es
18C
hatta
noog
a (H
amilt
on C
o.)
TNU
S 1
1/U
S 6
4/Le
e H
wy.
McC
utch
eron
Rd.
SR
317
Wid
enin
gW
iden
from
2 to
4
lane
s1.
620
25N
oY
esY
es
20C
hatta
noog
a (H
amilt
on C
o.)
TNS
now
Hill
Rd.
I-75
SR
312
/Mah
an G
ap R
d.W
iden
ing
Wid
en fr
om 2
to 4
la
nes
6.7
2025
No
Yes
Yes
33C
hatta
noog
a (H
amilt
on C
o.)
TNW
auha
tchi
e P
ike
US
11
US
41/
US
64
Wid
enin
gW
iden
from
2 to
4
lane
s2.
820
25N
oY
esY
es
39C
hatta
noog
a (H
amilt
on C
o.)
TNE
ast B
rain
erd
Rd.
Ban
ks R
d.S
R 3
21/O
olte
wah
-R
ingg
old
Rd.
Wid
enin
gW
iden
from
2 to
4
lane
s1.
620
25N
oY
esY
es
64C
hatta
noog
a (H
amilt
on C
o.)
TNJe
nkin
s R
d.S
tand
ifer G
apS
hallo
wfo
rd R
d.W
iden
ing
Wid
en fr
om 2
to 4
la
nes
0.8
2025
No
Yes
Yes
71C
hatta
noog
a (H
amilt
on C
o.)
TNM
ahan
Gap
Rd.
/SR
312
SR
58
Sno
w H
ill R
d.W
iden
ing
Wid
en fr
om 2
to 4
la
nes
0.7
2025
No
Yes
Yes
104
Cha
ttano
oga
(Ham
ilton
Co.
)TN
I-75
north
boun
d to
I-24
w
estb
ound
lane
ex
tens
ion
Bey
ond
Bel
voir
Roa
d O
verp
ass
Inte
rcha
nge
Rec
onst
ruct
ion
From
1 to
2 la
nes
2.0
2025
No
Yes
Yes
106
Yes
Cha
ttano
oga
(Ham
ilton
Co.
)TN
3rd
St./
4th
St.
Lind
say
St.
Ham
pton
St.
Wid
enin
g &
E
xten
sion
Wid
enin
g of
3rd
/4th
fro
m L
inds
ay S
t. to
H
ampt
on S
t. to
two-
1.2
2025
No
Yes
Yes
107
Cha
ttano
oga
(Ham
ilton
Co.
)TN
Cen
tral A
ve.
3rd
St.
I-24
Ope
ratio
nal (
Cen
ter
Turn
Lan
e)
Wid
en fr
om 4
to 5
la
nes
to in
clud
e ce
nter
turn
lane
1.9
2025
No
Yes
Yes
116
Cha
ttano
oga
(Ham
ilton
Co.
)TN
Hic
kory
Val
ley
Rd
Sta
ndife
r Gap
Rd
Ent
erpr
ise
Par
kway
Wid
enin
gW
iden
from
2 to
4
lane
s1.
420
25N
oY
esY
es
Juris
dict
ion
Exem
pt?
Leng
th
(mile
s)R
egio
nally
Si
gnifi
cant
?M
odel
ed?
Mod
el
Net
wor
k Ye
arLR
TP
IDTy
pe o
f Pr
ojec
tPr
ojec
t Des
crip
tion
In
FY '0
8-'1
1 TI
P (A
men
ded
Feb
'09)
Term
ini
Roa
d N
ame

2035
Mod
el N
etw
ork
Proj
ects
(Sin
ce 2
025)
City
(Cou
nty)
Stat
eFr
omTo
8C
hatta
noog
a (H
amilt
on C
o.)
TNC
entra
l Ave
. Ext
ensi
onLe
e S
t.S
R 1
93N
ew R
oadw
ayN
ew 2
-lane
faci
lity
(ext
ensi
on)
1.0
2035
No
Yes
Yes
13C
hatta
noog
a (H
amilt
on C
o.)
TNS
hallo
wfo
rd R
d.A
irpor
t Rd.
N M
oore
Rd
Wid
enin
g
Wid
en fr
om 2
-4 la
nes
from
Airp
ort R
d to
W
est o
f SR
153
at
Pal
mer
Rd
or T
DO
T B
ridge
Rep
lace
men
t P
roje
ct s
hallo
wfo
rd
RD
ove
r SR
153
- 4
lane
s0.
620
35N
oY
esY
es
13b
Cha
ttano
oga
(Ham
ilton
Co.
)TN
Sha
llow
ford
Rd
Airp
ort R
dJe
rsey
Pik
eW
iden
ing
Wid
en fr
om 2
to 4
lane
0.9
2035
No
Yes
Yes
19C
hatta
noog
a (H
amilt
on C
o.)
TNA
mni
cola
Hw
y.R
iver
port
Rd.
SR
153
Wid
enin
gW
iden
from
4 to
6
lane
s3.
320
35N
oY
esY
es
24_2
5R
ossv
ille
GA
McF
arla
nd A
ve.
Chi
ckam
auga
Ave
.S
R 3
41W
iden
ing
Wid
en fr
om 2
to 4
la
nes
6.6
2035
No
Yes
Yes
28b
Cha
ttano
oga
(Ham
ilton
Co.
)TN
Gra
ysvi
lle R
oad
E B
rain
ard
Dug
Roa
dW
iden
ing
Wid
en fr
om 2
to 4
la
nes
2.0
2035
No
Yes
Yes
35Fo
rt O
glet
horp
eG
AS
R 2
/Bat
tlefie
ld P
kwy.
Sou
th C
edar
Ln.
I-75
Wid
enin
gW
iden
from
4 to
6
lane
s5.
020
35N
oY
esY
es
38E
ast R
idge
TNC
amp
Jord
an P
kwy.
E
xten
sion
Cam
p Jo
rdan
Rd.
Gun
barr
el R
d.N
ew R
oadw
ayN
ew 2
-lane
faci
lity
(ext
ensi
on)
2.5
2035
No
Yes
Yes
54C
hatta
noog
a (H
amilt
on C
o.)
TND
odso
n A
ve.
Wilc
ox B
lvd.
Gla
ss S
t.W
iden
ing
Wid
en fr
om 2
to 4
la
nes
0.8
2035
No
Yes
Yes
55C
hatta
noog
a (H
amilt
on C
o.)
TNS
R 1
53G
otha
rd R
d.D
ayto
n B
lvd.
Wid
enin
gW
iden
from
4 to
6
lane
s1.
520
35N
oY
esY
es
63C
hatta
noog
a (H
amilt
on C
o.)
TNS
tand
ifer G
apW
alke
r Rd.
Bill
Ree
d R
d.W
iden
ing
Wid
en fr
om 2
to 4
la
nes
1.6
2035
No
Yes
Yes
67C
hatta
noog
a (H
amilt
on C
o.)
TNS
R 1
53S
R 3
19/H
ixso
n P
ike
SR
17/
SR
58
Wid
enin
gW
iden
from
4 to
6
lane
s5.
920
35N
oY
esY
es
70C
hatta
noog
a (H
amilt
on C
o.)
TNS
R 5
8C
ham
pion
Rd.
SR
312
Wid
enin
gW
iden
from
4 to
6
lane
s8.
720
35N
oY
esY
es
73E
ast R
idge
TNM
oore
Rd.
Rin
ggol
d R
d.N
orth
Ter
race
Rd.
Wid
enin
gW
iden
from
2 to
4
lane
s0.
920
35N
oY
esY
es
81a
Cha
ttano
oga
(Ham
ilton
Co.
)TN
Goo
dwin
Rd.
Ext
ensi
onG
unba
rrel
Ham
ilton
Pla
ce B
lvd.
New
Roa
dway
New
4-la
ne fa
cilit
y (e
xten
sion
)0.
320
35N
oY
esY
es
92C
hatta
noog
a (H
amilt
on C
o.)
TND
upon
t Pkw
y. E
xten
sion
SR
153
Hix
son
Pik
eN
ew R
oadw
ayN
ew 2
-lane
faci
lity
(ext
ensi
on)
1.2
2035
No
Yes
Yes
LRTP
ID
Type
of
Proj
ect
Proj
ect D
escr
iptio
n
In
FY '0
8-'1
1 TI
P (A
men
ded
Feb
'09)
Term
ini
Roa
d N
ame
Juris
dict
ion
Reg
iona
lly
Sign
ifica
nt?
Mod
eled
?
Mod
el
Net
wor
k Ye
arLe
ngth
(m
iles)
Exem
pt?


Chattanooga TPO 2035 LRTP – Volume 3: Travel Demand Model Documentation & User’s Guide
Appendix B: Technical Memorandum #1

Chattanooga TPO 2035 LRTP – Volume 3: Travel Demand Model Documentation & User’s Guide
This Page Intentionally Left Blank

Memorandum
TO: Bob Rock, TDOT Jerry Yuknavage, TDOT Tyrhonda Edwards, GDOT
CC: Angie Midgett, TDOT
FROM: Melissa Taylor, CHCNGA TPO Keli Paul, AICP, Cambridge Systematics
DATE: September 18, 2008
RE: Model Certification Submittal #1: Outline of TransCAD Model Assumptions Chattanooga-Hamilton County/North Georgia 2035 LRTP Update
Effective March 1, 2008, the Tennessee Department of Transportation (TDOT) Long Range Planning Division, Systems Planning and Policy Office, implemented a Division Procedure for the MPO model approval process. On August 20, 2008, the RPA met with its consultants along with TDOT, GDOT, and CARTA to discuss the TransCAD modeling efforts for the CHCNGA 2035 LRTP Update. It was agreed at that time that the following four submittals would be provided to TDOT and GDOT as part of TDOT’s model approval process:
1. Outline of the model, planning assumptions to date, and model validation worksheet template;
2. Year 2007 and 2035 socioeconomic data files (TransCAD and GIS) for the TPO region, including any maps, graphs, charts, or tables developed as part of the RPA’s internal review;
3. Populated validation worksheet upon completion of draft validated model. This worksheet will include statistics for Trip Generation, Trip Distribution, Mode Choice (if applicable), and Traffic Assignment. If the assumptions included in submittal #1 change as part of the validation process, they will be documented and submitted for approval at this time; and
4. Full model documentation report and user’s guide, along with all TransCAD files, after the draft LRTP has been documented.
This technical memorandum constitutes Submittal #1 defined above. Below is an outline of modeling inputs and structure for each step of the traditional four-step modeling process. Further details addressing each output statistic or map required as a result of the TDOT Division Procedure are attached, both for the previous 2000 model and what is anticipated as part of the 2007 model. The attached table also incorporates recommendations from the report developed by the University of Tennessee, Center for Transportation Research, titled “Minimum
2457 Care Dr ive, Sui te 101 Tal lahassee, FL 32308
te l 850 219 6388 www.camsys.com fax 850 219 6389

Travel Demand Model Calibration and Validation Guidelines for State of Tennessee.” This report is also referenced in the TDOT Division Procedure.
1.0 TRIP GENERATION (includes Network data)
1.1 Network Data – The base year model network is being updated from year 2000 to 2007.
1.1.1 Network Refinement - Several roads are being added to the model network to more accurately depict travel patterns and to assist with splitting several of the larger traffic analysis zones (TAZs). TRIMS and Roadway Characteristics (RC) data were obtained from TDOT and GDOT, respectively, to assist with reviewing the link characteristics (facility type and number of lanes) currently in the model network. In addition, several windshield surveys were conducted to obtain area type, facility type, and number of lanes data for those roads being added to the model.
1.1.2 Traffic Counts – Daily traffic counts will also be updated in the 2007 network
using available count data from TDOT, GDOT, Hamilton County and the City of Chattanooga. Count data was not available from Catoosa, Dade, or Walker Counties. Supplemental 24-hour count data by vehicle classification will be collected in late September 2008 to supplement model validation efforts and assist with evaluating existing conditions for the Congestion Management Plan (CMP). Transportation Projects – Several lists of capacity-adding transportation projects included in each model year are being or will be developed as part of the LRTP update process. Each of these project lists will be provided upon completion to TDOT and GDOT, as well as the entire Interagency Consultation Committee (ICC). They are as follows:
• Year 2007 Projects - Projects that completed construction between the years
2000 and 2007 (currently being developed)
• Existing-Plus-Committed (E+C) Projects - Projects that are expected to complete construction between the years 2008 and 2011 (i.e. those in the Transportation Improvement Program (TIP)) (currently being developed)
• Year 2035 Financially Feasible Plan Projects – Projects funded in LRTP
• Year 2025 Funded Projects – Interim year 2025 funded projects
• Year 2015 Funded Projects – Interim year 2015 funded projects
1.2 Socioeconomic Data – The Regional Planning Agency (RPA) is currently developing the 2007 and 2035 socioeconomic data for the entire TPO region. Upon completion, Cambridge Systematics (CS) will conduct a thorough review of the data at the TAZ level, including the development of population, household, employment, hotel-motel, and school enrollment density maps. The TransCAD and GIS files, as well as the maps and any tables, charts, or graphs, will be provided to TDOT and GDOT for review as part of Submittal #2.
- 2 -

1.3 TAZ Refinement – The RPA is taking this opportunity to refine the TAZ structure in the
current TransCAD model. Many of the TAZs are rather large in the outlying areas. Additional network detail being added to the model will also effect the TAZ structure, including external zones.
1.4 Travel Survey Data – During the 2030 LRTP Update adopted in 2005, the Chattanooga
Household Travel Diary Survey conducted in 2002 was used to determine trip production rates for person trips. The Federal Highway Administration (FHWA) Quick Response Freight Manual (QRFM) was used to supply trip production rates for the truck trip purposes. Trip attraction rates were borrowed from the Northeast Regional Planning Model (NERPM) in Jacksonville, FL, as local data was not available. These same trip production and attraction rates will be used for this model update. Although the percent split of Internal-External (IE)/External-External (EE) trips at each external station was developed from the Chattanooga Urban Area Origin-Destination Study conducted in 2002, it was found that the original MinUTP model had more reasonable IE/EE splits due to how the O-D study was conducted. With the exception of new external stations, the updated model as part of the 2035 LRTP Update will use the same IE/EE splits from the MinUTP model. Any new external stations, which will likely be minor roads with low traffic counts, will likely assume 100 percent IE trips.
1.5 Trip Generation Method – During the 2030 LRTP Update adopted in 2005, the 2002
Chattanooga Household Travel Survey data was evaluated to determine what variables impact travel patterns the most in the Chattanoga region. As a result, a cross-classification method based on auto availability and children per household was implemented. This same method will be using during this update.
1.6 Trip Purposes – The current TransCAD model includes the following trip purposes,
which will remain the same during this update:
• Home-Based Work (HBW)
• Home-Based School (HBSchool)
• Home-Based Shop (HBShop)
• Home-Based Social/Recreation (HBSR)
• Home-Based Other (HBO)
• Non-Home Based (NHB)
• Light-Duty Truck (LDTK)
• Medium-Duty Trucks (MDTK)
• Heavy-Duty Trucks (HDTK)
1.7 Special Generators – The current TransCAD model includes special generators at the
airport, the University of Tennessee at Chattanooga, Chattanooga State College, and
- 3 -

Chester Frost National Park. No special generators will be assumed at the beginning of 2007 model validation effort, however, it is anticipated that some special generators may eventually be necessary.
2.0 TRIP DISTRIBUTION
2.1 Friction Factors - The friction factor file used in the new CHCNGA 2000 TransCAD model is similar to the file used in the CHCNGA 2000 MINUTP model. The key difference is the number of trip purposes. Since separate friction factors were not available for the expanded home-based other purposes, the same home-based other friction factors were used for home-based school, home-based shop, and home-based social recreation trips. Gamma functions from the Quick Response Freight Manual were used for truck purposes. These same friction factors will be assumed for the 2007 model and future years. If time permits, the friction factors may be calibrated.
2.2 Terminal Times – Terminal times were used in the 2000 model and will also be used in
the 2007 model. 2.3 K-Factors – K-Factors were used in the 2000 model. To improve the
Georgia/Tennessee State Line screenline in the 2000 model, a 0.25 K-Factor was added from zones in Georgia to zones in Tennessee. To improve the Tennessee River Crossing screenline, a 0.25 K-Factor was added to zones from the north side of the bridges to the rest of the model region. No K-Factors will be assumed at the beginning of the 2007 model validation process, however, they may be added if necessary.
3.0 MODE CHOICE The current TransCAD model for Chattanooga does not include a mode choice/transit component. Instead, it includes an auto occupancy model that converts person trips to vehicle trips using auto occupancy factors by trip purpose derived from the 2002 Household Travel Diary Survey conducted in the Chattanooga region. Dependent upon available data, the RPA was considering adding a mode choice/transit pathbuilding component to the TransCAD model as part of the 2035 LRTP Update. However, since the August 20, 2008 modeling workshop referenced above, it was determined that there is not enough data currently available to validate a mode choice/transit pathbuilding model. As a result, the RPA, in coordination with CARTA, is considering conducting an on-board transit survey in the Spring of 2009 with the intention of building a mode choice model in the Summer and Fall of 2009. However, it will not be included as part of the 2035 LRTP Update. Therefore, the current auto occupancy model will remain in place for the 2035 LRTP Update. 4.0 TRIP ASSIGNMENT
4.1 Time-of-Day – Currently, the Chattanooga model does not include a true time-of-day component. Instead, peak hour factors based on the temporal distribution from the 2002 Household Travel Diary Survey are applied to the daily volumes after the assignment process to achieve AM and PM peak hour volumes. There is the potential
- 4 -
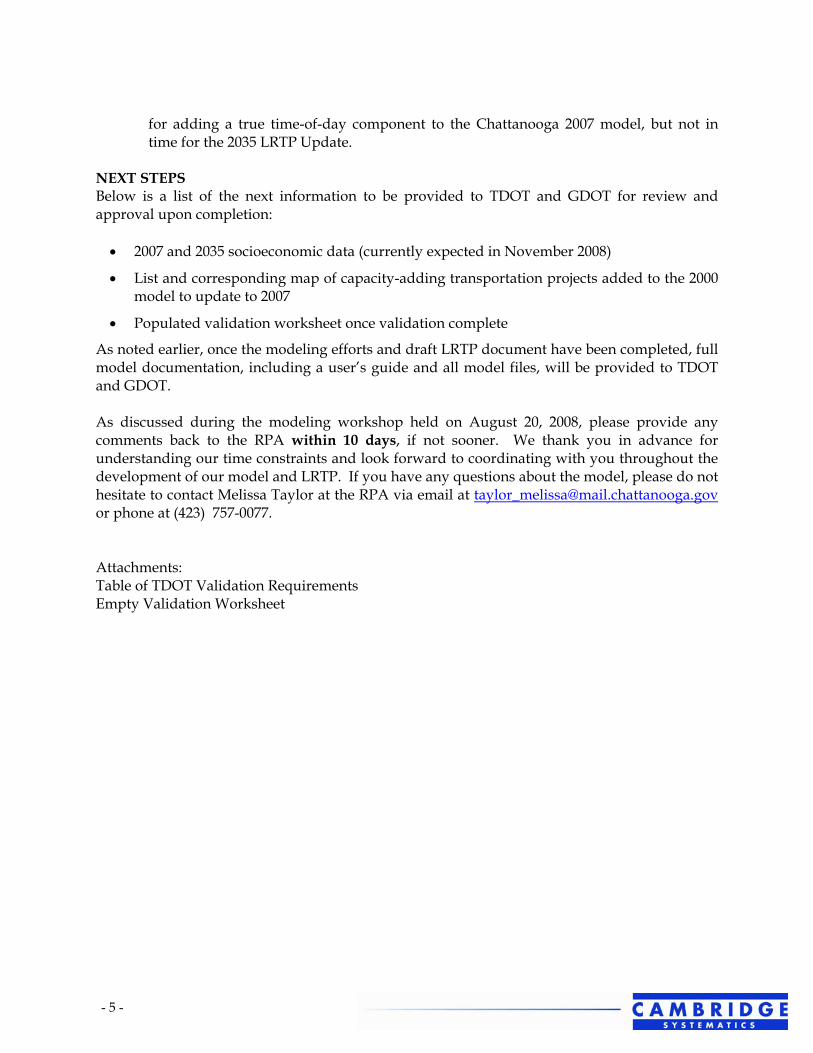
- 5 -
for adding a true time-of-day component to the Chattanooga 2007 model, but not in time for the 2035 LRTP Update.
NEXT STEPS Below is a list of the next information to be provided to TDOT and GDOT for review and approval upon completion: • 2007 and 2035 socioeconomic data (currently expected in November 2008)
• List and corresponding map of capacity-adding transportation projects added to the 2000 model to update to 2007
• Populated validation worksheet once validation complete
As noted earlier, once the modeling efforts and draft LRTP document have been completed, full model documentation, including a user’s guide and all model files, will be provided to TDOT and GDOT. As discussed during the modeling workshop held on August 20, 2008, please provide any comments back to the RPA within 10 days, if not sooner. We thank you in advance for understanding our time constraints and look forward to coordinating with you throughout the development of our model and LRTP. If you have any questions about the model, please do not hesitate to contact Melissa Taylor at the RPA via email at [email protected] or phone at (423) 757-0077. Attachments: Table of TDOT Validation Requirements Empty Validation Worksheet

Attachment #1
Model Validation Documentation Requirements
Specified in TDOT Division Procedure: MPO Model Approval
and
“Minimum Travel Demand Model Calibration and Validation Guidelines for State of Tennessee,” University of Tennessee, Center for Transportation Research


Attachment #1: MPO Model Certification RequirementsCHCNGA 2035 LRTP
Socioeconomic DataTAZ Maps with corresponding existing and futureSE data, including external stations PDF Maps TDOT*
Person trips/household by purposeValidation Worksheet U Tenn**
Travel Survey Data
Source, year, and type of travel survey information
Text (overview provided in
Submittal #1) TDOT*
Household travel diary survey (2002) used to determine trip generation rates, average trip lengths, auto occupancy factors, and
other characteristics used in 2000 model development and validation.Percent IE/EE splits were calculated from the Chattanooga Urban Area Origin-Destination Study conducted in 2002. However, it was
determined that these percentages were not reliable as the interstate surveys were conducted on ramps at interchanges and rest areas. Vehicles were not pulled off to the side of the road on the mainline interstate segments where most EE trips occur. The vehicles that
were surveyed were already stopping at the interchange or rest area. Therefore, the results provide a significant bias towards IE trips and EE trips are underestimated. The percent IE/EE splits from the origin and destination survey were subsequently compared to the old 2000
MINUTP model and it was determined that the old 2000 MINUTP model percent splits appeared more reasonable.
Will need to modify TAZ structure to
account for new minor roads
added that may represent external stations; if so, will assume 100% IE
split.
If no survey, provide source of trip data
Text (overview provided in
Submittal #1) TDOT* QRFM used for truck trip production rates; NERPM for attraction ratesNetwork DataProvide files (networks, turn penalties/prohibitors, speed/cap, FT codes) Files TDOT*Table of significant projects added to network by model year Excel Table TDOT*Explanation of how MPO dealing with cross-border traffic Text TDOT* K-factor and screenline at state line
Determine during validation
Trip Generation
Description of trip generation method (P/A, O/D, Special Generators; Cross-Class, Regression, or Discrete Choice)
Text (overview provided in
Submittal #1) TDOT*
Cross-Classification method based on auto availability and children per household; Trip production rates for HBW, HBSCHOOL,
HBSHOP, HBSR, HBO, and NHB calculated using 2002 HH Travel Diary Survey; Truck production rates from QRFM; Attraction rates
from NERPM; Special generators included same
Description of trip purposes
Text (overview provided in
Submittal #1) TDOT*HBW, HBSCHOOL, HBSHOP, HBSR, HBO, NHB, LTTK, MDTK,
HDTK same
Description of how EE and EI trips addressed Text TDOT*
The MINUTP splits were used as a starting point and were later modified during the validation process.
The percent IE trips were applied to the 2000 AADT to calculate the total number of IE trips at each external zone for the TAZ geography file. The EETRIPS input matrix file is generally the residual left after estimating IE trips in the TAZ geography file. The percentage of EE trips was applied to the AADT per external zone and then distributed
from each origin zone to each destination zone using distribution patterns from the old MINUTP 2000 model EETRIPS file. For externalzones added to the TransCAD model, and not in the MINUTP model,
it was assumed that 100 percent of these trips were EE trips since these were low volume roadways.
Adding new external stations;
For external zones added to the TransCAD model, assume that 100 percent of these trips are
EE trips since these were low
volume roadways.Whether trip rates developed for vehicle and/or person trips Text TDOT* Person trips same
Special generators (how and where) Text TDOT* Yes; Airport, UTC, Chatt State College, Chester Frost National ParkDetermine during
validationTrip DistributionFiles (friction factors, terminal time, and K-factors) Files TDOT*Trip length by trip purpose for base and future year
Validation Worksheet TDOT*
Comparison of HBW mean trip length compared to Census JTW mean trip length
Validation Worksheet TDOT*
Trip Length Frequency Distribution (TLFD) by Trip Purpose Compared to Census JTW and Household Travel Survey (Charts)
Validation Worksheet (add
charts) U Tenn**Area-to-Area Flow of Trips Map U Tenn**
2007 ModelTDOT's MPO Model Approval Requirements (Effective 3/1/08)
Source of Requirement
Type of Submittal 2000 Model
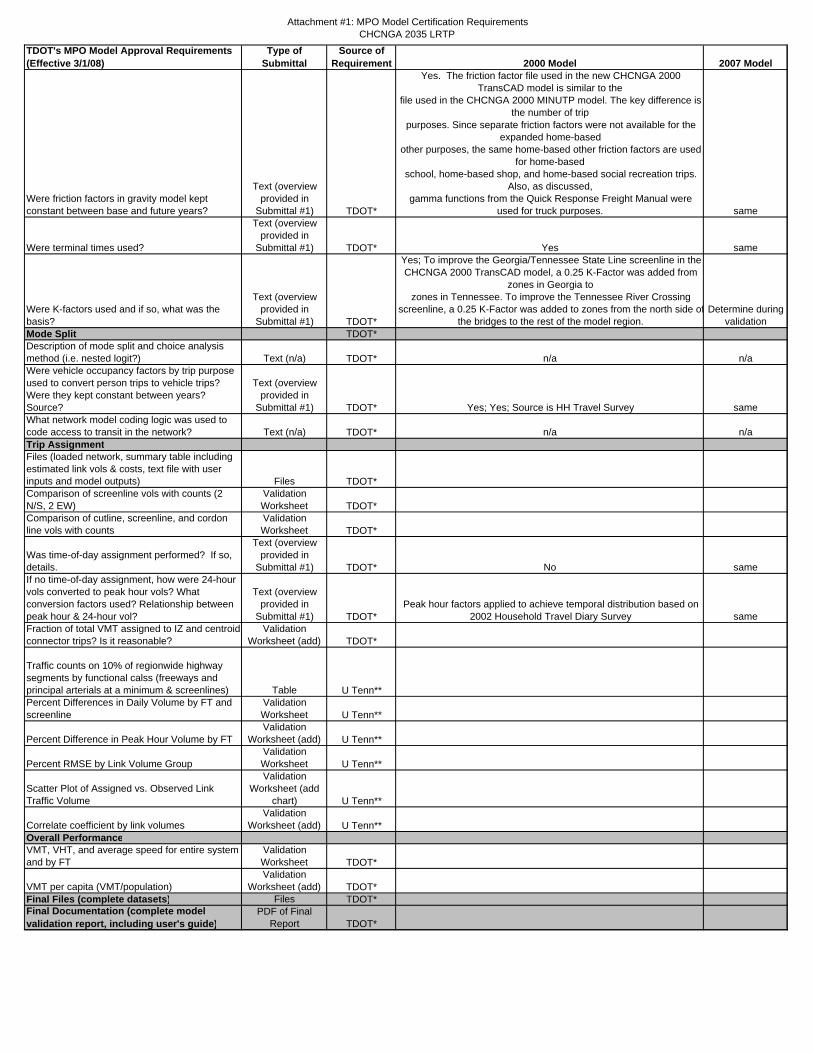
Attachment #1: MPO Model Certification RequirementsCHCNGA 2035 LRTP
2007 ModelTDOT's MPO Model Approval Requirements (Effective 3/1/08)
Source of Requirement
Type of Submittal 2000 Model
Were friction factors in gravity model kept constant between base and future years?
Text (overview provided in
Submittal #1) TDOT*
Yes. The friction factor file used in the new CHCNGA 2000 TransCAD model is similar to the
file used in the CHCNGA 2000 MINUTP model. The key difference is the number of trip
purposes. Since separate friction factors were not available for the expanded home-based
other purposes, the same home-based other friction factors are used for home-based
school, home-based shop, and home-based social recreation trips. Also, as discussed,
gamma functions from the Quick Response Freight Manual were used for truck purposes. same
Were terminal times used?
Text (overview provided in
Submittal #1) TDOT* Yes same
Were K-factors used and if so, what was the basis?
Text (overview provided in
Submittal #1) TDOT*
Yes; To improve the Georgia/Tennessee State Line screenline in the CHCNGA 2000 TransCAD model, a 0.25 K-Factor was added from
zones in Georgia tozones in Tennessee. To improve the Tennessee River Crossing
screenline, a 0.25 K-Factor was added to zones from the north side ofthe bridges to the rest of the model region.
Determine during validation
Mode Split TDOT*Description of mode split and choice analysis method (i.e. nested logit?) Text (n/a) TDOT* n/a n/aWere vehicle occupancy factors by trip purpose used to convert person trips to vehicle trips? Were they kept constant between years? Source?
Text (overview provided in
Submittal #1) TDOT* Yes; Yes; Source is HH Travel Survey sameWhat network model coding logic was used to code access to transit in the network? Text (n/a) TDOT* n/a n/aTrip AssignmentFiles (loaded network, summary table including estimated link vols & costs, text file with user inputs and model outputs) Files TDOT*Comparison of screenline vols with counts (2 N/S, 2 EW)
Validation Worksheet TDOT*
Comparison of cutline, screenline, and cordon line vols with counts
Validation Worksheet TDOT*
Was time-of-day assignment performed? If so, details.
Text (overview provided in
Submittal #1) TDOT* No sameIf no time-of-day assignment, how were 24-hour vols converted to peak hour vols? What conversion factors used? Relationship between peak hour & 24-hour vol?
Text (overview provided in
Submittal #1) TDOT*Peak hour factors applied to achieve temporal distribution based on
2002 Household Travel Diary Survey sameFraction of total VMT assigned to IZ and centroid connector trips? Is it reasonable?
Validation Worksheet (add) TDOT*
Traffic counts on 10% of regionwide highway segments by functional calss (freeways and principal arterials at a minimum & screenlines) Table U Tenn**Percent Differences in Daily Volume by FT and screenline
Validation Worksheet U Tenn**
Percent Difference in Peak Hour Volume by FTValidation
Worksheet (add) U Tenn**
Percent RMSE by Link Volume GroupValidation Worksheet U Tenn**
Scatter Plot of Assigned vs. Observed Link Traffic Volume
Validation Worksheet (add
chart) U Tenn**
Correlate coefficient by link volumesValidation
Worksheet (add) U Tenn**Overall PerformanceVMT, VHT, and average speed for entire system and by FT
Validation Worksheet TDOT*
VMT per capita (VMT/population)Validation
Worksheet (add) TDOT*Final Files (complete datasets) Files TDOT*Final Documentation (complete model validation report, including user's guide)
PDF of Final Report TDOT*

Attachment #2
Model Validation Worksheets
(Template – Not Populated with 2007 Statistics)


Cha
ttano
oga
2007
MO
DE
L V
AL
IDA
TIO
N S
UM
MA
RY
Run
# T
EM
PLA
TE
DA
TE
: 9/
18/2
008
= S
tati
stic
s in
gre
en-c
olor
ed c
ells
wil
l be
upda
ted
whe
n 20
07 v
alid
ated
mod
el is
rea
dy.
Des
crip
tion:
Tri
p G
ener
atio
n
Com
pari
son
of T
otal
Tri
ps b
y P
urpo
se
Unb
alan
ced
2004
2004
2000
New
FD
OT
Purp
ose
Prod
uctio
ns%
by
Prod
uctio
nsA
ttrac
tions
Prod
uctio
ns%
by
Prod
uctio
nsN
ashv
ille
Mem
phis
Mon
tgom
ery
Gui
delin
es*2
Hom
e-B
ased
Wor
k0
#DIV
/0!
021
2,11
312
.72%
16.7
9%25
.15%
16.0
0%18
-27%
12-2
4%H
ome-
Bas
ed S
choo
l0
#DIV
/0!
085
,068
5.10
%11
.02%
5-8%
Hom
e-B
ased
Sho
p0
#DIV
/0!
015
9,42
09.
56%
7.17
%10
-20%
Hom
e-B
ased
Soc
rec.
0#D
IV/0
!0
92,9
195.
57%
7.67
%9-
12%
Hom
e-B
ased
Oth
er0
#DIV
/0!
028
9,01
317
.33%
28.1
0%14
-28%
Non
Hom
e-B
ased
0#D
IV/0
!0
434,
513
26.0
6%26
.42%
18.0
0%22
-31%
20-3
3% *
4
Com
mer
cial
Veh
icle
s0
#DIV
/0!
016
3,33
09.
80%
8.79
%11
.00%
Lig
ht-T
ruck
#DIV
/0!
120,
286
73.6
5%M
ediu
m-T
ruck
#DIV
/0!
31,5
8019
.34%
Hea
vy-T
ruck
#DIV
/0!
11,4
647.
02%
Inte
rnal
-Ext
erna
l0
#DIV
/0!
023
0,90
613
.85%
8.82
%13
.00%
Ext
erna
l-E
xter
nal
030
,025
3.00
%SO
V#D
IV/0
!0.
00%
HO
V#D
IV/0
!0.
00%
Lig
ht-T
ruck
#DIV
/0!
0.00
%H
eavy
-Tru
ck#D
IV/0
!0.
00%
TO
TA
L0
#DIV
/0!
1,66
7,28
210
0.00
%10
0.00
%10
0.00
%10
0.00
%
Agg
rega
te T
rip
Rat
es &
Soc
ioec
onom
ic S
umm
arie
s
2007
2000
2002
2004
2000
2000
2001
TD
OT
New
FD
OT
FHW
AU
nit o
f Mea
sure
Nas
hvill
eM
emph
isM
ontg
omer
y*5
Kno
xvill
eSa
vann
ahT
arge
t*1
Gui
delin
es*2
Tar
get*
3
Pers
ons
per H
ouse
hold
#DIV
/0!
2.50
2.56
2.65
2.68
2.45
2.53
n/a
2.0-
2.7
n/a
Inte
rnal
Tri
ps p
er H
ouse
hold
0.00
9.44
8.59
8.20
8.64
8.40
7.66
8.5-
10.5
8.0-
10.0
8.0-
14.0
Inte
rnal
Tri
ps p
er P
erso
n0.
003.
783.
363.
093.
233.
433.
03n/
a3.
3-4.
03.
5-4.
0In
tern
al T
rips
per
Em
ploy
ee0.
005.
184.
866.
414.
915.
705.
54n/
an/
an/
aE
mpl
oyee
s pe
r Per
son
#DIV
/0!
0.73
0.69
0.51
0.66
0.60
0.55
n/a
n/a
n/a
Tot
al P
opul
atio
n0
395,
061
1,20
6,66
576
1,34
61,
181,
701
299,
180
232,
011
Tot
al H
ouse
hold
s0
158,
055
471,
298
310,
412
416,
830
111,
793
91,8
34T
otal
Em
ploy
men
t0
287,
918
833,
862
457,
796
604,
578
196,
799
127,
000
Per
son
Tri
ps /
Hou
seho
ldR
egio
nY
ear
Pers
on T
rip/
HH
Cha
ttano
oga
(Tra
nsC
AD
)20
070.
00C
hatta
noog
a (T
rans
CA
D)
2000
9.44
Cha
ttano
oga
(MIN
UT
P)20
007.
44
*1 TD
OT
Tar
get
8.50
to 1
0.50
*2 New
FD
OT
Gui
delin
es8.
00 to
10.
00
*2 FH
WA
Tar
get
n/a
2007
2000
Cha
ttano
oga
(Tra
nsC
AD
)
Cha
ttano
oga
2007
(T
rans
CA
D)
Cha
ttano
oga
(Tra
nsC
AD
)FH
WA
T
arge
t *3
TD
OT
Tar
get *
1
47-5
4%
20.8
9%
39.0
0%39
.18%

Tri
p D
istr
ibut
ion
Ave
rage
Tri
p L
engt
h (i
n M
inut
es) 20
0720
0020
0020
0020
0020
0220
0020
0420
0020
01T
DO
TN
ew F
DO
TFH
WA
Pur
pose
Cha
ttano
oga
(Tra
nsC
AD
)C
hatta
noog
a (T
rans
CA
D)
CT
PP
(H
amilt
on)
CT
PP
(C
atoo
sa)
CT
PP
(W
alke
r)N
ashv
ille
Kno
xvill
e *6
Mem
phis
Mon
tgom
ery
Sava
nnah
*7
Tar
get*
1G
uide
lines
*2T
arge
t*3
Hom
e-B
ased
Wor
k0.
0016
.36
21.2
023
.70
26.5
019
.26
12.0
519
.00
19.9
019
.80
12-3
511
.2-3
5.4
Hom
e-B
ased
Sch
ool
0.00
14.4
8n/
an/
an/
an/
a6.
82n/
an/
an/
an/
a8.
9-15
.9H
ome-
Bas
ed S
hop
0.00
13.7
8n/
an/
an/
an/
an/
a12
.30
n/a
15.1
09-
198.
6-18
.7H
ome-
Bas
ed S
ocre
c.0.
0011
.38
n/a
n/a
n/a
n/a
n/a
13.9
0n/
an/
a11
-19
Hom
e-B
ased
Oth
er0.
0014
.41
n/a
n/a
n/a
11.4
87.
9813
.40
17.4
015
.40
8-20
Non
Hom
e-B
ased
0.00
15.4
4n/
an/
an/
a12
.36
7.14
13.2
016
.70
13.4
06-
198.
1-17
.1C
omm
erci
al V
ehic
les
0.00
19.6
4n/
an/
an/
a17
.20
15.8
0n/
an/
aL
ight
-Tru
ck0.
0018
.79
Med
ium
-Tru
ck0.
0017
.95
Hea
vy-T
ruck
0.00
22.1
7In
tern
al-E
xter
nal
0.00
41.0
4n/
an/
an/
a27
.80
19.9
526
-58
n/a
TO
TA
L0.
0018
.68
n/a
n/a
n/a
14.3
78.
5014
.36
19.8
016
.58
n/a
n/a
Intr
azon
al T
rave
l20
0720
00
Tw
o-D
igit
TD
OT
New
FD
OT
FHW
A
Pur
pose
Tot
al T
rips
Intr
azon
al
Tri
ps%
Int
razo
nal
Tot
al T
rips
Intr
azon
al
Tri
ps%
Int
razo
nal
Tar
get*
1G
uide
lines
*2T
arge
t*3
Hom
e-B
ased
Wor
k0
0#D
IV/0
!21
2,11
314
,931
7.04
%1-
4%H
ome-
Bas
ed S
choo
l0
0#D
IV/0
!85
,068
9,45
911
.12%
10-1
2%H
ome-
Bas
ed S
hop
00
#DIV
/0!
159,
420
15,8
289.
93%
3-9%
Hom
e-B
ased
Soc
rec.
00
#DIV
/0!
92,9
1919
,585
21.0
8%4-
10%
Hom
e-B
ased
Oth
er0
0#D
IV/0
!28
9,01
332
,266
11.1
6%3-
7%N
on H
ome-
Bas
ed0
0#D
IV/0
!43
4,51
334
,853
8.02
%5-
9%C
omm
erci
al V
ehic
les
00
#DIV
/0!
163,
330
4,99
53.
06%
Lig
ht-T
ruck
00
#DIV
/0!
120,
286
3,55
02.
95%
Med
ium
-Tru
ck0
0#D
IV/0
!31
,580
1,30
94.
15%
Hea
vy-T
ruck
00
#DIV
/0!
11,4
6413
61.
19%
TO
TA
L0
0#D
IV/0
!1,
436,
376
131,
917
9.18
%3-
5%
10.4
-17.
3
Cha
ttano
oga
2007
(T
rans
CA
D)
Cha
ttano
oga
2000
(T
rans
CA
D)
Tw
o-D
igit

Tra
ffic
Ass
ignm
ent
(1st
of
3 pa
ges)
Dai
ly T
raff
ic o
n Sc
reen
line
sT
DO
TN
ewC
hatt
anoo
ga 2
007
2000
Acc
urac
yFD
OT
FHW
ASc
reen
line
Tot
al V
olum
eT
otal
Cou
ntV
ol/C
ount
Rat
ioV
ol/C
ount
Rat
ioL
evel
*1
Gui
delin
es *
2 * 8
T
arge
t * 3
10
00.
000.
971
Cen
tral
Cit
y P
arti
al C
ordo
n+
/- 1
0%+
/- 5
%+
/- 1
0-20
%2
00
0.00
0.94
2 T
enne
ssee
Riv
er C
ross
ing
+/-
10%
+/-
5%
+/-
10-
20%
30
00.
000.
973
Nor
th-S
outh
Dow
ntow
n+
/- 1
0%+
/- 5
%+
/- 1
0-20
%4
00
0.00
0.91
4 E
ast-
Wes
t Dow
ntow
n+
/- 1
0%+
/- 5
%+
/- 1
0-20
%5
00
0.00
0.90
5 M
issi
onar
y R
idge
+/-
10%
+/-
5%
+/-
10-
20%
60
00.
000.
996
Sou
th C
hick
amau
ga C
reek
+/-
10%
+/-
5%
+/-
10-
20%
70
00.
001.
097
Nor
th-S
outh
Nor
th H
amil
ton
Co.
+/-
10%
+/-
5%
+/-
10-
20%
80
00.
001.
068
Rin
ggol
d+
/- 1
0%+
/- 5
%+
/- 1
0-20
%9
00
0.00
1.02
9 T
N/G
A S
tate
Lin
e+
/- 1
0%+
/- 5
%+
/- 1
0-20
%10
00
0.00
1.00
10 E
xter
nal C
ordo
n Li
ne+
/- 1
0%+
/- 0
%+
/- 1
0-20
%
TD
OT
N
ew F
DO
TFH
WA
Faci
lity
Typ
eV
olum
es O
ver
Cou
nts
% D
iffe
renc
eV
olum
es O
ver
Cou
nts
% D
iffe
renc
eA
ccur
acy
Lev
el *
1 G
uide
lines
*2
Tar
get *
3
1In
ters
tate
1.00
00.
98-1
.6+
/- 7
%+
/- 5
% (
+/-
6%
)+
/- 7
%2
Exp
ress
way
1 .00
00.
94-5
.6+
/- 7
%+
/- 5
% (
+/-
6%
)+
/- 7
%3
Pri
ncip
al A
rter
ial D
ivid
ed1 .
000.
00.
98-2
.1+
/- 1
0%+
/- 7
% (
+/-
10%
)+
/- 1
0%4
Pri
ncip
al A
rter
ial U
ndiv
ided
1.00
0.0
0.94
-6.1
+/-
10%
+/-
7%
(+
/- 1
0%)
+/-
10%
5M
inor
Art
eria
l1.
000
0.88
-12
+/-
15%
n/a
+/-
15%
6C
olle
ctor
1.00
00.
98-2
.2+
/- 2
5%+
/- 1
0% (
+/-
15%
)+
/- 2
5%7
Ram
pn/
an/
an/
a8
One
-Way
1.00
00.
71-2
9.1
n/a
+/-
15%
(+
/- 2
0%)
n/a
Are
a T
ype
1C
BD
1.00
00.
88-1
1.8
2C
BD
Fri
nge
1.00
00.
92-8
.23
Res
iden
tial
1.00
00.
96-4
.04
OB
D1.
000
0.92
-8.4
5R
ural
1.
000
1.10
9.7
6U
rban
Und
evel
oped
1.00
01.
021.
97
Mou
ntai
nous
1.00
00.
95-5
.0N
umbe
r1
1.00
0.0
0.93
-6.8
of L
anes
21.
000.
00.
98-1
.6B
y D
irec
tion
31.
000.
00.
95-5
.34
1.00
0.0
0.92
-7.8
5T
otal
1.00
00.
95-4
.7
Per
cent
Dif
fere
nce
for
Dai
ly V
olum
es (
calc
ulat
ed f
or L
inks
wit
h C
ount
s)
Cha
ttan
ooga
200
7 T
DO
TN
ew F
DO
TFH
WA
AA
DT
Tra
nsC
AD
Tar
get *
1 *9
Gui
delin
es *
2 T
arge
t *3
<1,
000
0.00
%60
%60
%1,
000
- 2,
500
0.00
%47
%47
%2,
500
- 5,
000
0.00
%36
%36
%5,
000
- 10
,000
0.00
%29
%29
%10
,000
- 2
5,00
00.
00%
25%
20-3
0% *
1025
%25
,000
- 5
0,00
00 .
00%
22%
15-2
5% *
1022
%>
50,0
000 .
00%
21%
5-20
% *
1121
%
Coe
ffic
ient
of
Det
erm
inat
ion
R2
(C
orre
lati
on C
oeff
icie
nt o
f A
ctua
l Cou
nts
and
Mod
el V
olum
es)
*1 TD
OT
Tar
get:
R2 m
ore
than
0.8
8
*2 New
FD
OT
Tar
get:
N/A
*3 FH
WA
Tar
get:
R2 m
ore
than
0.8
8
25-5
0%
2000
Cha
ttan
ooga
200
7V
olum
es O
ver
Cou
nts

Tra
ffic
Ass
ignm
ent
(2nd
of
3 pa
ges)
Roo
t Mea
n Sq
uare
Err
or
TD
OT
FHW
AC
ount
Ran
geT
rans
CA
DT
rans
CA
DT
arge
t*1
Tar
get*
3
0-4,
999
0.00
%73
.10%
115.
7645
-100
5,00
0-9,
999
0.00
%33
.60%
43.1
435
-45
10,0
00-1
4,99
90.
00%
18.1
0%28
.27
27-3
515
,000
-19,
999
25-3
020
,000
-29,
999
21.7
0%15
-27
30,0
00-3
9,99
916
.90%
40,0
00-4
9,99
94.
40%
50,0
00-5
9,99
97.
20%
10-2
060
,000
-69,
999
70,0
00-7
9,99
979
,999
-89,
999
Ove
rall
0.00
%23
.40%
30.0
032
-39
Veh
icle
Mil
es T
rave
led
Reg
ion
Yea
rV
MT
HP
MS*
12
Cha
ttan
ooga
(T
rans
CA
D)
2007
00
Nas
hvill
e (T
rans
CA
D)
2004
31,7
96,8
7533
,316
,412
Mem
phis
(T
rans
CA
D)
2004
26,8
81,5
5026
,980
,700
Kno
xvill
e (T
rans
CA
D)
2000
24,1
59,5
07n/
aM
ontg
omer
y (T
ranp
lan)
2000
8,29
6,86
6n/
aSa
vann
ah (
TP
+)
2001
5,69
7,42
35,
743,
828
TD
OT
Tar
get *
1
FHW
A T
arge
t *3
(sam
e as
FD
OT
)
31.7
2 8.0
VM
T /
Per
son
026
.42 4
.4
0V
MT
/ H
H
Cha
ttan
ooga
200
7C
hatt
anoo
ga
2000
n/a
0.00
%
0.00
%15
-25
10-1
9
New
FD
OT
G
uide
lines
&
Stan
dard
s*2
64.5
67.5
74.2
77.8
62.0
24.6
10-1
6 fo
r sm
all u
rban
are
a /
17
-24
for
larg
e ur
ban
area
New
FD
OT
Gui
ldel
ines
*2
30-4
0 fo
r sm
all u
rban
are
a /
40
-60
for
larg
e ur
ban
area
+/-
5%
dif
fere
nce
b/w
mod
el a
nd e
stim
ate
25.3
8
30.2
5
19.2
00.
00%
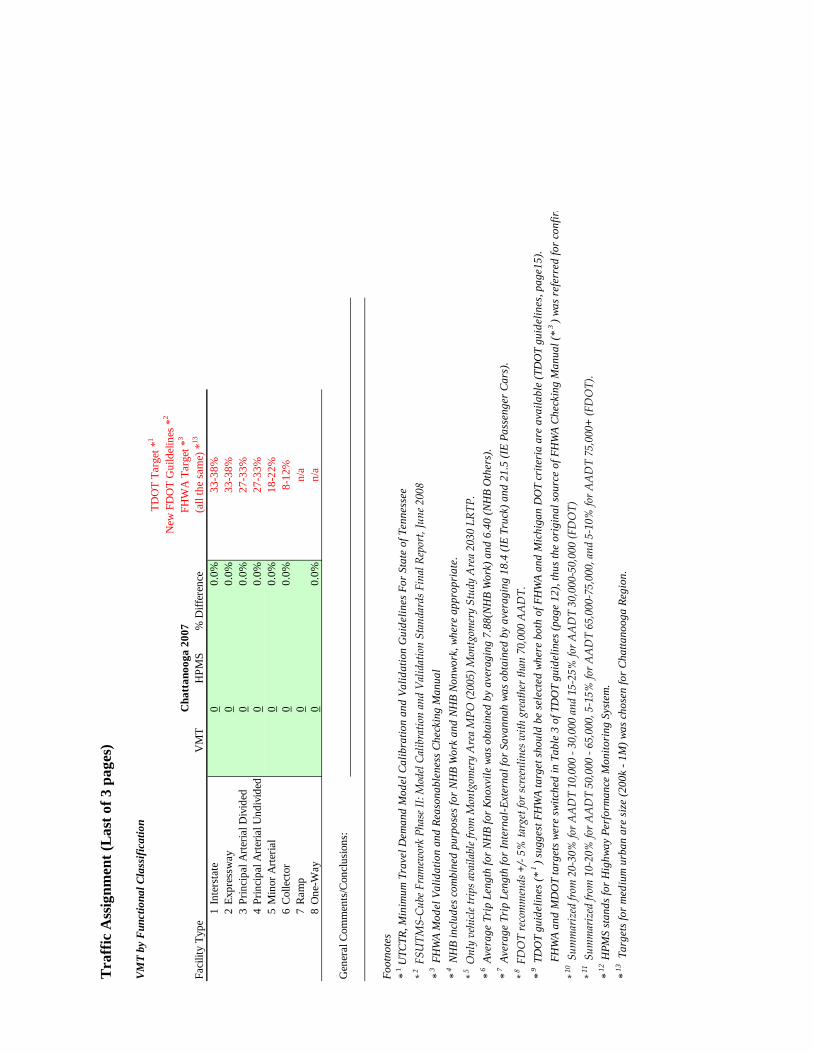
Tra
ffic
Ass
ignm
ent
(Las
t of
3 p
ages
)
VM
T b
y F
unct
iona
l Cla
ssif
icat
ion
Faci
lity
Typ
eV
MT
HP
MS
% D
iffe
renc
e1
Inte
rsta
te0
0.0%
2E
xpre
ssw
ay0
0.0%
3P
rinc
ipal
Art
eria
l Div
ided
00.
0%4
Pri
ncip
al A
rter
ial U
ndiv
ided
00.
0%5
Min
or A
rter
ial
00.
0%6
Col
lect
or0
0.0%
7R
amp
08
One
-Way
00.
0%
Gen
eral
Com
men
ts/C
oncl
usio
ns:
Foo
tnot
es
*1 U
TCTR
, Min
imum
Tra
vel D
eman
d M
odel
Cal
ibra
tion
and
Val
idat
ion
Gui
deli
nes
For
Sta
te o
f Ten
ness
ee
*2 FSUTMS-Cube Framew
ork Phase II: M
odel Calibration and Validation Standards Final Report, June 2008
*3
FH
WA
Mod
el V
alid
atio
n an
d R
easo
nabl
enes
s C
heck
ing
Man
ual
*4
NH
B in
clud
es c
ombi
ned
purp
oses
for
NH
B W
ork
and
NH
B N
onw
ork,
whe
re a
ppro
pria
te.
*5 O
nly vehicle trips available from M
ontgom
ery Area MPO (2005) Montgom
ery Study Area 2030 LRTP.
*6
Ave
rage
Tri
p Le
ngth
for
NH
B fo
r K
noxv
ile
was
obt
aine
d by
ave
ragi
ng 7
.88(
NH
B W
ork)
and
6.4
0 (N
HB
Oth
ers)
.
*7
Ave
rage
Tri
p Le
ngth
for
Inte
rnal
-Ext
erna
l for
Sav
anna
h w
as o
btai
ned
by a
vera
ging
18.
4 (I
E T
ruck
) an
d 21
.5 (
IE P
asse
nger
Car
s).
*8 FDOT recom
mends +/- 5% target for screenlines with greather than 70,000 AADT.
*9
TD
OT
guid
elin
es (
*1
) su
gges
t FH
WA
targ
et s
houl
d be
sel
ecte
d w
here
bot
h of
FH
WA
and
Mic
higa
n D
OT
crit
eria
are
ava
ilab
le (
TDO
T gu
idel
ines
, pag
e15)
.
FH
WA
and
MD
OT
targ
ets
wer
e sw
itch
ed in
Tab
le 3
of T
DO
T gu
idel
ines
(pa
ge 1
2), t
hus
the
orig
inal
sou
rce
of F
HW
A C
heck
ing
Man
ual (
*3
) w
as r
efer
red
for
conf
irm
atio
n.
*10 Summarized from 20-30% for AADT 10,000 - 30,000 and 15-25%
for AADT 30,000-50,000 (FDOT)
*11 Summarized from 10-20% for AADT 50,000 - 65,000, 5-15%
for AADT 65,000-75,000, and 5-10% for AADT 75,000+
(FDOT).
*12
HP
MS
stan
ds fo
r H
ighw
ay P
erfo
rman
ce M
onit
orin
g Sy
stem
.
*13
Ta
rget
s fo
r m
ediu
m u
rban
are
siz
e (2
00k
- 1M
) w
as c
hose
n fo
r C
hatt
anoo
ga R
egio
n.
n/a
New
FD
OT
Gui
ldel
ines
*2
TD
OT
Tar
get *
1
27-3
3%18
-22%
8-12
%n/
a
(all
the
sam
e) *
13
33-3
8%33
-38%
27-3
3%
FHW
A T
arge
t *3
Cha
ttan
ooga
200
7


Chattanooga TPO 2035 LRTP – Volume 3: Travel Demand Model Documentation & User’s Guide
Appendix C: Technical Memorandum #2

Chattanooga TPO 2035 LRTP – Volume 3: Travel Demand Model Documentation & User’s Guide
This Page Intentionally Left Blank
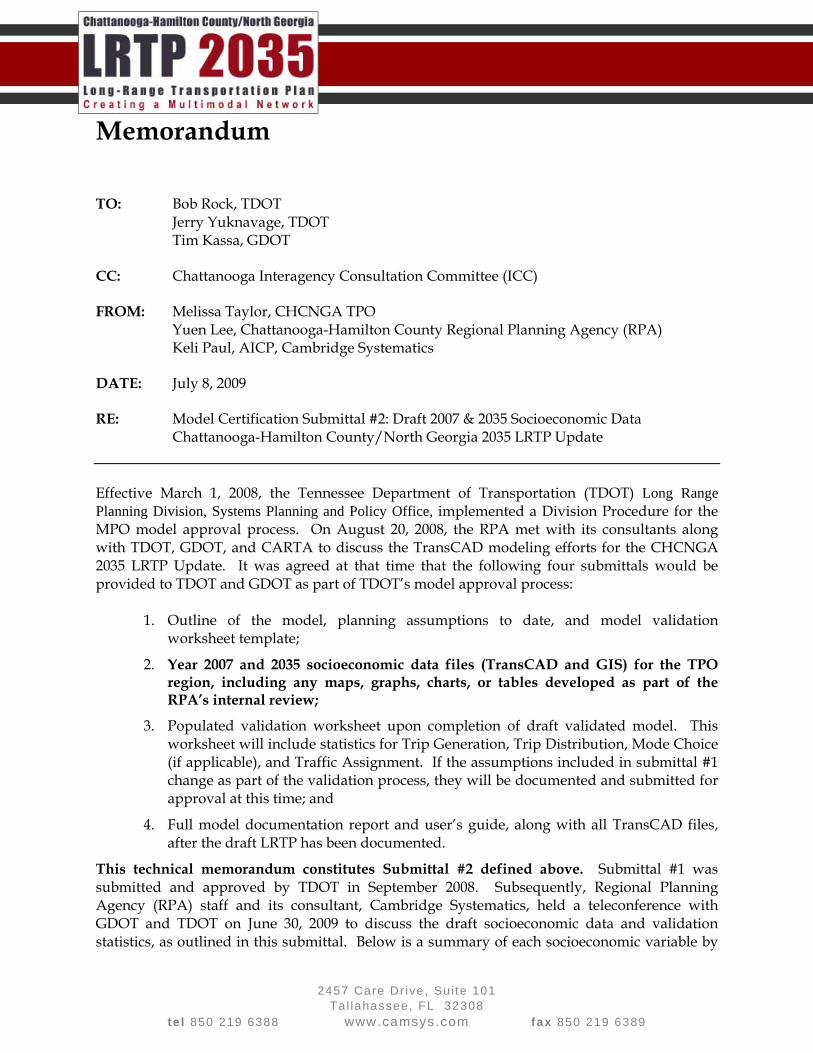
2457 Care Dr ive, Sui te 101 Tal lahassee, FL 32308
te l 850 219 6388 www.camsys.com fax 850 219 6389
Memorandum
TO: Bob Rock, TDOT Jerry Yuknavage, TDOT Tim Kassa, GDOT
CC: Chattanooga Interagency Consultation Committee (ICC)
FROM: Melissa Taylor, CHCNGA TPO Yuen Lee, Chattanooga-Hamilton County Regional Planning Agency (RPA) Keli Paul, AICP, Cambridge Systematics
DATE: July 8, 2009
RE: Model Certification Submittal #2: Draft 2007 & 2035 Socioeconomic Data Chattanooga-Hamilton County/North Georgia 2035 LRTP Update
Effective March 1, 2008, the Tennessee Department of Transportation (TDOT) Long Range Planning Division, Systems Planning and Policy Office, implemented a Division Procedure for the MPO model approval process. On August 20, 2008, the RPA met with its consultants along with TDOT, GDOT, and CARTA to discuss the TransCAD modeling efforts for the CHCNGA 2035 LRTP Update. It was agreed at that time that the following four submittals would be provided to TDOT and GDOT as part of TDOT’s model approval process:
1. Outline of the model, planning assumptions to date, and model validation worksheet template;
2. Year 2007 and 2035 socioeconomic data files (TransCAD and GIS) for the TPO region, including any maps, graphs, charts, or tables developed as part of the RPA’s internal review;
3. Populated validation worksheet upon completion of draft validated model. This worksheet will include statistics for Trip Generation, Trip Distribution, Mode Choice (if applicable), and Traffic Assignment. If the assumptions included in submittal #1 change as part of the validation process, they will be documented and submitted for approval at this time; and
4. Full model documentation report and user’s guide, along with all TransCAD files, after the draft LRTP has been documented.
This technical memorandum constitutes Submittal #2 defined above. Submittal #1 was submitted and approved by TDOT in September 2008. Subsequently, Regional Planning Agency (RPA) staff and its consultant, Cambridge Systematics, held a teleconference with GDOT and TDOT on June 30, 2009 to discuss the draft socioeconomic data and validation statistics, as outlined in this submittal. Below is a summary of each socioeconomic variable by

- 2 -
County for each base and horizon year, both from the previous 2030 LRTP Update in comparison to the current 2035 LRTP Update. RPA staff created the socioeconomic data, while its consultant reviewed the socioeconomic data above and beyond the RPA’s internal review. In addition, several traffic analysis zone (TAZ) splits were made within the TransCAD travel demand model and are documented below.
1.0 TAZ SPLITS As part of the previous 2030 LRTP Update, the RPA converted the old MinuTP model to TransCAD and refined the TAZ structure significantly resulting in 445 total TAZs for the entire model region. After the 2030 LRTP was adopted, the RPA added more TAZs to Catoosa County as the remaining sliver of Catoosa County not in the previous model was added for the purpose of calculating emissions for air quality conformity. This addition resulted in a total of 450 TAZs for the entire model region. As part of this current 2035 LRTP Update, the RPA has further refined the TAZ structure by splitting internal zones mostly in the outlying regions of the model and within the downtown area of Chattanooga. Previously, the Enterprise South Industrial Park (ESIP) area was included within one TAZ. As part of this update, the ESIP TAZ has been split into eight TAZs based on the ESIP future site plan. In addition to splitting several internal zones, eight more external zones were added to the current model, as indicated in Table 1 below. All of these TAZ splits have resulted in a current total of 628 TAZs (590 internal + 38 external) in the entire model region, an increase of 178 TAZs, or 40 percent more zones. Maps illustrating the TAZ splits are attached.
Table 1. Number of TAZs in TransCAD Model
2030 LRTP Model
Expanded Catoosa
Model
2035 LRTP Model
Internal TAZs 415 420 590 External TAZs 30 30 38 Total TAZs 445 450 628
The following criteria were used to determine if a TAZ should be split, when feasible:
Greater than 15,000 productions per TAZ in 2030;
Irregular shaped or large sized TAZs;
Major existing or planned roads bisecting TAZ; and
Potential special generator located in TAZ (i.e. isolated TN Aquarium).
The following guidelines were used to split the TAZ boundaries, when feasible:
Existing and future roadways;
Existing and future land use;
Railroads;
Water bodies; and
Census block group boundaries.
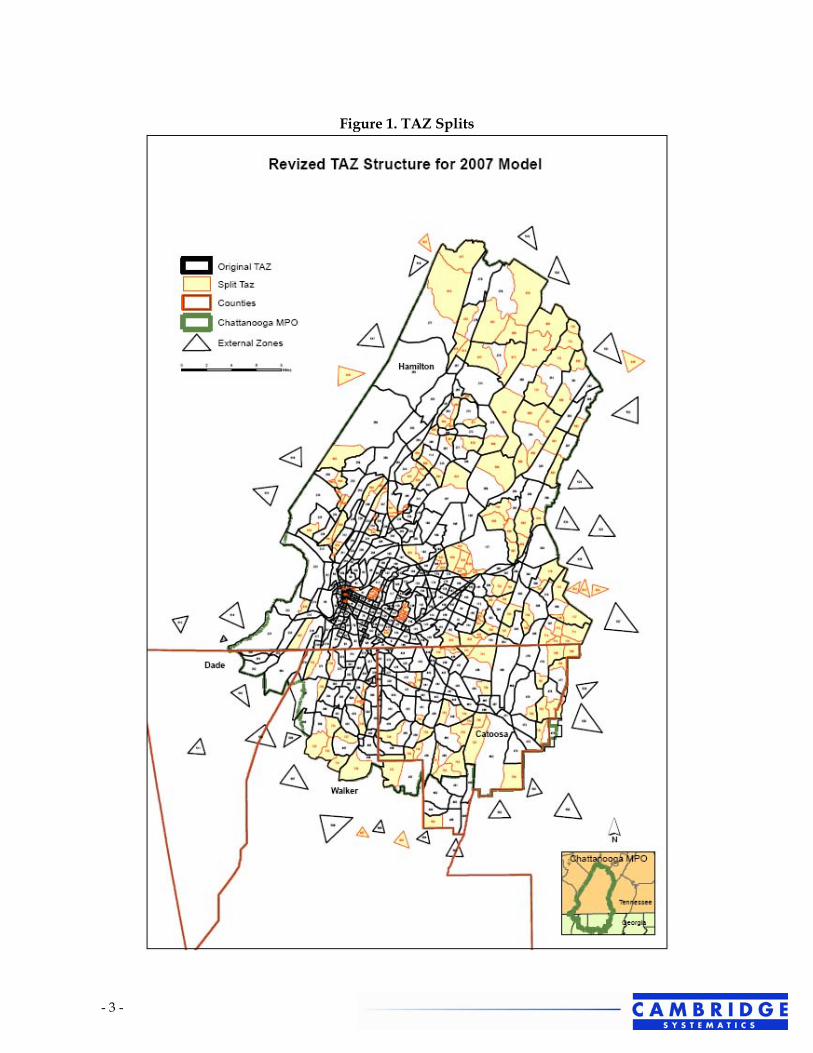
- 3 -
Figure 1. TAZ Splits

- 4 -
2.0 SUMMARY OF SOCIOECONOMIC DATA RPA staff developed the 2007 and 2035 socioeconomic data as part of the Chattanooga-Hamilton County/North Georgia 2035 LRTP Update. Historically, the Coosa Valley Regional Development Center (RDC) has developed the socioeconomic data for the Georgia portion of the TPO. However, development of the socioeconomic data for the Georgia side has since become the responsibility of the TPO due to funding limitations. Variables The socioeconomic data included in the TransCAD travel demand model can be broken in to four categories, as follows:
• Household Data – Includes total population, school-age children (population between ages 3 and 18), and total housing units.
• Employment – Includes total number of employees and number of employees for each of the five employment categories:
o Agricultural/mining/construction;
o Manufacturing/transportation;
o Retail;
o Service; and
o Government.
• School Enrollment – Includes number of grade school students at the location of the school, number of university students at the location of the university, and total school enrollment (grade school students plus university students). University student enrollment includes community, technical, or vocational colleges and universities.
• Hotel-Motel Units – Includes number of hotel-motel units.
Methodology The RPA collected the number of building permits issued between 2000 and 2007 for each of the four counties, geocoded their locations, and added the new building permits to the 2000 households by TAZ to achieve 2007 households. Population for the year 2007 was calculated by applying the persons per household ratio in each of the year 2000 zones to the total number of households in 2007. If a zone was split, the persons per household ratio from the parent zone in the year 2000 was applied for each split zone. However, subsequent logic checks determined that some manual adjustments were necessary in Dade and Hamilton Counties to reflect more reasonable persons per household ratios and thus, the overall persons per household ratio for the entire county were applied to those specific zones. The proportion of the total population attributable to school-age children was calculated using 2007 American Community Survey (ACS) data for each of the four counties, with the exception of Dade County, which utilized the same school-aged children factor in Walker County as ACS data was not available for Dade County. Building permit data for Hamilton County were acquired from the municipal building permit files, whereas building permit data for Catoosa and Walker Counties were acquired from The Market Edge, an information reporting service. Since building permits are not
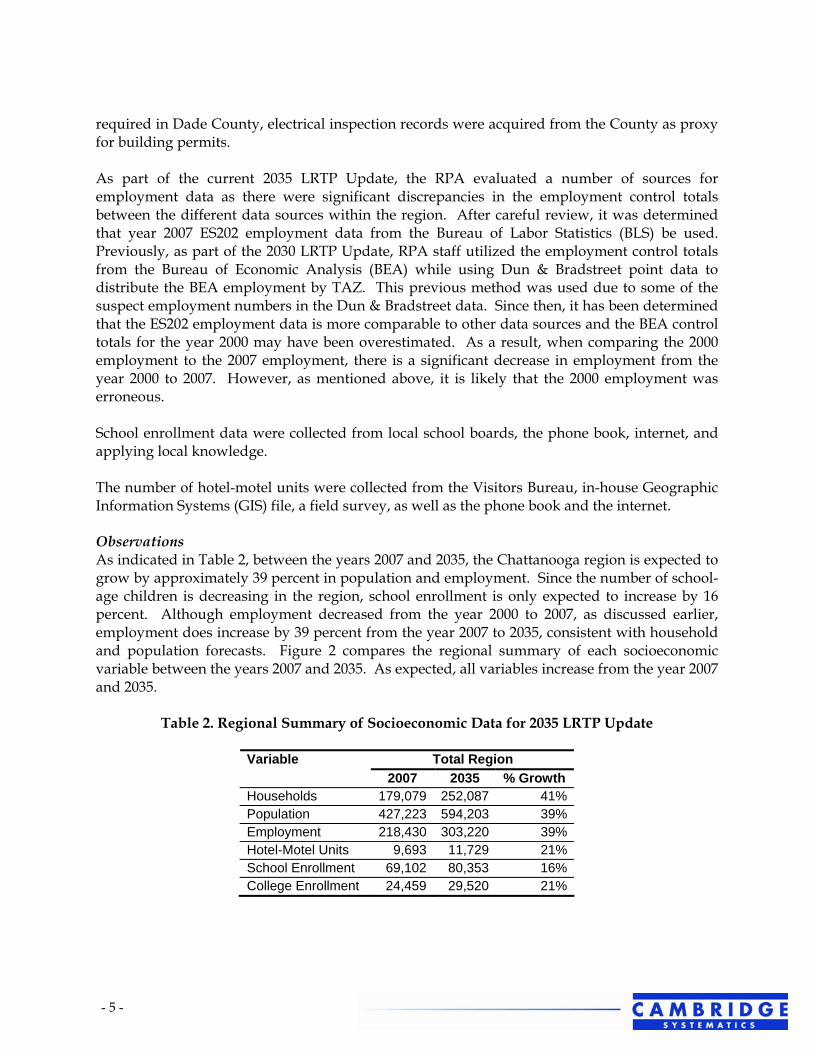
- 5 -
required in Dade County, electrical inspection records were acquired from the County as proxy for building permits. As part of the current 2035 LRTP Update, the RPA evaluated a number of sources for employment data as there were significant discrepancies in the employment control totals between the different data sources within the region. After careful review, it was determined that year 2007 ES202 employment data from the Bureau of Labor Statistics (BLS) be used. Previously, as part of the 2030 LRTP Update, RPA staff utilized the employment control totals from the Bureau of Economic Analysis (BEA) while using Dun & Bradstreet point data to distribute the BEA employment by TAZ. This previous method was used due to some of the suspect employment numbers in the Dun & Bradstreet data. Since then, it has been determined that the ES202 employment data is more comparable to other data sources and the BEA control totals for the year 2000 may have been overestimated. As a result, when comparing the 2000 employment to the 2007 employment, there is a significant decrease in employment from the year 2000 to 2007. However, as mentioned above, it is likely that the 2000 employment was erroneous. School enrollment data were collected from local school boards, the phone book, internet, and applying local knowledge. The number of hotel-motel units were collected from the Visitors Bureau, in-house Geographic Information Systems (GIS) file, a field survey, as well as the phone book and the internet. Observations As indicated in Table 2, between the years 2007 and 2035, the Chattanooga region is expected to grow by approximately 39 percent in population and employment. Since the number of school-age children is decreasing in the region, school enrollment is only expected to increase by 16 percent. Although employment decreased from the year 2000 to 2007, as discussed earlier, employment does increase by 39 percent from the year 2007 to 2035, consistent with household and population forecasts. Figure 2 compares the regional summary of each socioeconomic variable between the years 2007 and 2035. As expected, all variables increase from the year 2007 and 2035.
Table 2. Regional Summary of Socioeconomic Data for 2035 LRTP Update
Total Region Variable 2007 2035 % Growth
Households 179,079 252,087 41%Population 427,223 594,203 39%Employment 218,430 303,220 39%Hotel-Motel Units 9,693 11,729 21%School Enrollment 69,102 80,353 16%College Enrollment 24,459 29,520 21%

- 6 -
Figure 2. Regional Summary of Socioeconomic Data for 2035 LRTP Update
Regional Summary
179,079
427,223
218,430252,087
594,203
303,220
80,353
24,45969,102
9,69329,520
11,7290
100,000
200,000
300,000
400,000
500,000
600,000
700,000
Households Population Employment Hotel-Motel Units SchoolEnrollment
CollegeEnrollment
20072035
3.0 HOUSEHOLDS Table 3 below compares the number of households between the previous 2030 LRTP (years 2000 and 2030) and the current 2035 LRTP Update (years 2007 and 2035). With the exception of the Georgia counties in the year 2030, the households increase for each year. Growth in Georgia is expected to slow down between the years 2007 and 2035 and it is expected that 2030 households in Georgia were overestimated during the previous LRTP update.
Table 3. Comparison of Households Between 2030 and 2035 LRTP Models
Households County 2000 2007 2030* 2035
Hamilton 124,447 141,229 157,459 200,748Dade 760 839 1,190 931Walker 12,528 12,882 16,649 15,272Catoosa 20,320 24,129 43,919 35,136GA Total 33,608 37,850 61,758 51,339 Region 158,055 179,079 219,217 252,087
* 2030 expanded after 2030 LRTP Update to include all of Catoosa County

- 7 -
Figure 3. Comparison of Households Between 2030 and 2035 LRTP Models
Households by County
760 83912,882
157,459
43,919
200,748
93120,320
12,528
124,447
24,129
141,229
1,19016,649
35,13615,272
0
50,000
100,000
150,000
200,000
250,000
Hamilton Dade Walker Catoosa
County
2000 2007 2030* 2035
4.0 POPULATION As indicated in Table 4, population in Hamilton County increases each year, regardless of which LRTP update. However, Dade County population decreased from the year 2000 to 2007, even though the number of households increased. This is as a result of adjusting the number of persons per household ratio to more accurately reflect existing conditions in Dade County, which are more consistent with the other counties in the TPO region. In addition, it is suspected that the year 2030 population in the Georgia counties was overestimated during the previous 2030 LRTP as growth is expected to slow down in Georgia.
Table 4. Comparison of Population Between 2030 and 2035 LRTP Models
Population County 2000 2007 2030* 2035
Hamilton 307,897 330,173 362,330 465,215Dade 2,460 2,140 3,837 2,354Walker 31,749 32,666 42,085 38,576Catoosa 52,955 62,244 114,556 88,058GA Total 87,164 97,050 160,478 128,988 Region 395,061 427,223 522,808 594,203
* 2030 expanded after 2030 LRTP Update to include all of Catoosa County

- 8 -
Figure 4. Comparison of Population Between 2030 and 2035 LRTP Models
Population by County
307,897
52,955
330,173
2,140
362,330
114,556
465,215
2,354
38,57631,749
2,46062,244
32,66642,085
3,837
88,058
0
50,000
100,000
150,000
200,000
250,000
300,000
350,000
400,000
450,000
500,000
Hamilton Dade Walker Catoosa
County
2000 2007 2030* 2035
5.0 EMPLOYMENT As mentioned earlier, the source of the employment data has changed since the previous LRTP and thus, there is a significant reduction in employees from the year 2000 to 2007 due to suspected overestimation in the year 2000. Year 2007 employment data was based on ES202 records from the BLS and was supplemented by records from the Chamber of Commerce, schools, motel in-house records, and job announcements from the newspaper. Year 2000 data was compiled from the Dun & Bradstreet database and was factored up to BEA employment control totals. BEA derived the employment data in part from the BLS data which accounts for about 80 percent of its employment data. The difference between the BEA data and the BLS data is attributed to BLS only reporting employment covered by the State UI and UCFE programs while BEA also estimates employment for farms, part-time employees, private households, schools, religious organizations, railroads, military, and international organizations. Since BEA data did not include addresses and the 2000 approach would exacerbate errors from mis-geocoding and misreporting, the RPA decided to geocode the BLS data and supplement it with the additional sources mentioned above for 2007 employment. Table 5 compares the new 2007 and 2035 employment control totals to the old 2000 and 2030 employment control totals. Due to the change in data sources, there are significant differences between LRTP datasets. However, it is suspected that the new 2007 employment estimates and 2035 forecasts are more accurate.
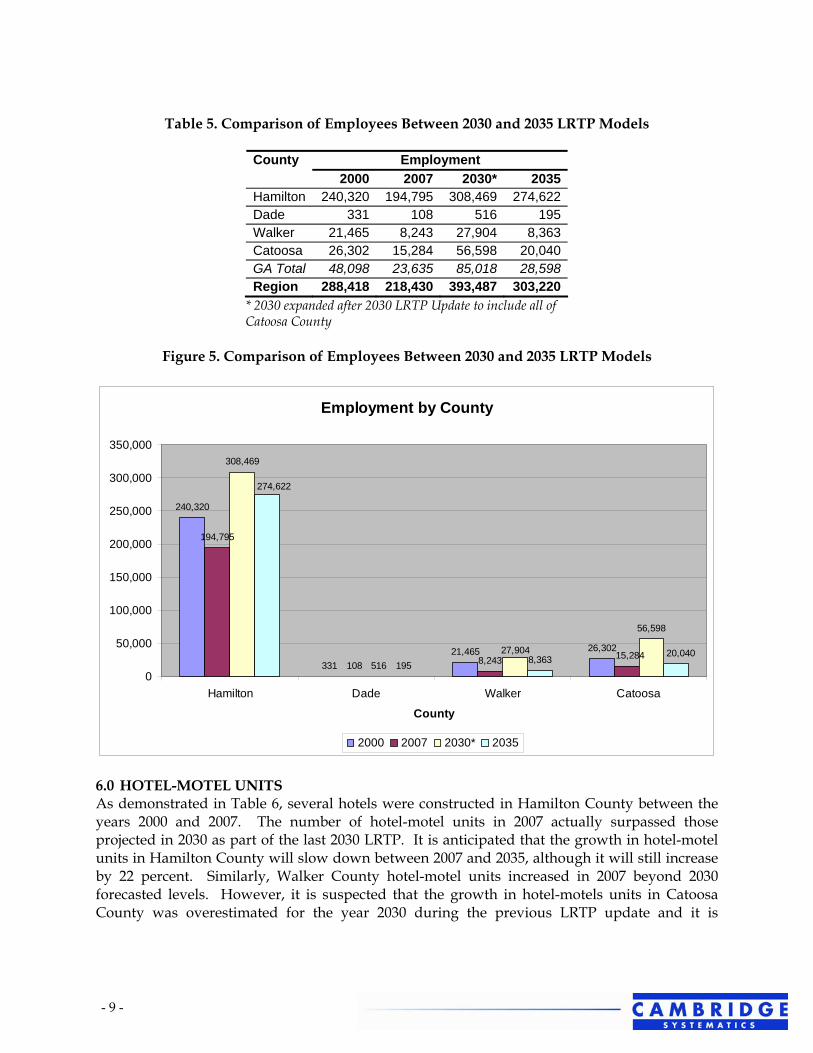
- 9 -
Table 5. Comparison of Employees Between 2030 and 2035 LRTP Models
Employment County 2000 2007 2030* 2035
Hamilton 240,320 194,795 308,469 274,622Dade 331 108 516 195Walker 21,465 8,243 27,904 8,363Catoosa 26,302 15,284 56,598 20,040GA Total 48,098 23,635 85,018 28,598 Region 288,418 218,430 393,487 303,220
* 2030 expanded after 2030 LRTP Update to include all of Catoosa County
Figure 5. Comparison of Employees Between 2030 and 2035 LRTP Models
Employment by County
240,320
33121,465 26,302
194,795
108 8,243
308,469
516
56,598
195 8,363 15,28427,904
274,622
20,040
0
50,000
100,000
150,000
200,000
250,000
300,000
350,000
Hamilton Dade Walker Catoosa
County
2000 2007 2030* 2035
6.0 HOTEL-MOTEL UNITS As demonstrated in Table 6, several hotels were constructed in Hamilton County between the years 2000 and 2007. The number of hotel-motel units in 2007 actually surpassed those projected in 2030 as part of the last 2030 LRTP. It is anticipated that the growth in hotel-motel units in Hamilton County will slow down between 2007 and 2035, although it will still increase by 22 percent. Similarly, Walker County hotel-motel units increased in 2007 beyond 2030 forecasted levels. However, it is suspected that the growth in hotel-motels units in Catoosa County was overestimated for the year 2030 during the previous LRTP update and it is

- 10
expected to slow down by the year 2035, as the RPA is uncertain of future growth in Catoosa County.
Table 6. Comparison of Hotel-Motel Units Between 2030 and 2035 LRTP Models
Hotel-Motel Units County 2000 2007 2030* 2035
Hamilton 4,105 8,885 6,851 10,876Dade 0 0 0 0Walker 18 200 37 233Catoosa 570 608 1,073 620GA Total 588 808 1,110 853 Region 4,693 9,693 7,961 11,729
* 2030 expanded after 2030 LRTP Update to include all of Catoosa County
Figure 6. Comparison of Hotel-Motel Units Between 2030 and 2035 LRTP Models
Hotel Motel Units by County
4,105
0 18570
8,885
0 200608
6,851
0 37
1,073
10,876
0 233620
0
2,000
4,000
6,000
8,000
10,000
12,000
Hamilton Dade Walker Catoosa
County
2000 2007 2030* 2035

- 11
7.0 SCHOOL ENROLLMENT The number of grade school students in Hamilton County decreased from the year 2000 to 2007 as there were a number of school closings. However, school enrollment is expected to increase by the year 2035. As demonstrated in Table 7, the growth in school students in Walker County was faster than expected resulting in far more students in the year 2007 than originally forecasted by the year 2030 as part of the previous LRTP update. Since the RPA is uncertain of future long-term growth, there is only a minimal increase in school students between the years 2007 and 2035 in Walker County. In Catoosa County, it is suspected that the 2030 forecasted school enrollment may have been slightly overestimated and thus, year 2035 forecasts are slightly lower when compared to the year 2030.
Table 7. Comparison of School Enrollment Between 2030 and 2035 LRTP Models
School Enrollment County 2000 2007 2030* 2035
Hamilton 51,570 50,835 54,092 58,715Dade 0 0 0 0Walker 3,931 7,042 5,111 7,522Catoosa 7,083 11,225 14,770 14,116GA Total 11,014 18,267 19,881 21,638 Region 62,584 69,102 73,973 80,353
* 2030 expanded after 2030 LRTP Update to include all of Catoosa County
Figure 7. Comparison of School Enrollment Between 2030 and 2035 LRTP Models
School Enrollment by County
03,931
0
7,042
0
5,111
14,770
58,715
0
7,083
51,570
11,225
50,83554,092
14,1167,522
0
10,000
20,000
30,000
40,000
50,000
60,000
70,000
Hamilton Dade Walker Catoosa
County
2000 2007 2030* 2035

- 12
8.0 COLLEGE ENROLLMENT College enrollment in Hamilton County increased by 23 percent between the years 2000 and 2007. However, growth is expected to slow down by the years 2030 and 2035, as indicated in Table 8. Since the last LRTP update, the TPO TransCAD model was expanded to include all of Catoosa County. As a result, Harvest Deaf Bible College in Catoosa County is now included in the model, which accounts for the 27 college students in the year 2007 not previously in the model. In addition, Covenant College in Dade County was not included in the previous LRTP update and has since been added to the model.
Table 8. Comparison of College Enrollment Between 2030 and 2035 LRTP Models
College Enrollment County 2000 2007 2030* 2035
Hamilton 18,780 23,082 25,059 27,932Dade 0 1,350 0 1,553Walker 0 0 0 0Catoosa 0 27 0 35GA Total 0 1,377 0 1,588 Region 18,780 24,459 25,059 29,520
* 2030 expanded after 2030 LRTP Update to include all of Catoosa County
Figure 8. Comparison of College Enrollment Between 2030 and 2035 LRTP Models
College Enrollment by County
0 0 0
23,082
1,3500 27
25,059
0 0 0
27,932
1,5530 35
18,780
0
5,000
10,000
15,000
20,000
25,000
30,000
Hamilton Dade Walker Catoosa
County
2000 2007 2030* 2035

- 13
NEXT STEPS Below is a list of the next information to be provided to TDOT and GDOT for review and approval upon completion:
List and corresponding map of capacity-adding transportation projects added to the 2000 model to update to 2007; and
Populated validation worksheet once validation complete.
As noted earlier, once the modeling efforts and draft LRTP document have been completed, full model documentation, including a user’s guide and all model files, will be provided to TDOT and GDOT. As discussed during the modeling workshop held on August 20, 2008, please provide any comments back to the RPA within 10 days, if not sooner. We thank you in advance for understanding our time constraints and look forward to coordinating with you throughout the development of our model and LRTP. If you have any questions about the model, please do not hesitate to contact Melissa Taylor at the RPA via email at [email protected] or phone at (423) 757-0077. Attachments: Year 2007 and 2035 Density Maps by Variable Map of TAZ splits TAZ boundary shapefile with 2007 and 2035 socioeconomic data


678
679
684
683
681 66
8
677
682
662
672
673
747
757
736
723
758
680
688
634
722 68
6
733
695
676
718
741
687
717
669
711
691
689
721
753
700
699
693
715
746
755
630
637
765
670
819
763
752
675
703
768
685
702
762
620
725
734
690
732
826
698
619
694
731
697
766
743
631
737
640
692
714
654
639
744
709
696
759
761
756
647
644
764
641
750
674
751
671
706
760
625
767
735
652
730
720
726
665
660
740
664
707
701
710
748
712
609
656
749
805
646
738
704
74262
6
638
632
624
822
719
628
705
834
621
645
623
833
713
708
643
667 73
9
651
666
655
622
745
832
633
728
635
754
627
716
650
663
807
610
661
605
724
653
659
727
636
617
658
657
642
611
729
648
61661
5
629
606
613 61
4
6086
07
612
618
649
603
604
601
602
769
255
258
462
277
224
177
221
274
223
468
354
279
293
253
278
397
269
470
197
260
195
457
280
482
284
196
285
56
312
281
262
469
458
270
436
222
289
461
527
474
306
198
259
506
250
475
481
479
288
352
283
290
273
252
529
472
485
213
521
477
305
446
275
216
303
398
522
433
371
407
220
452
478
500
300
225
450
65
287
453
286
245
272
509
517
244
476
507
294
456
62
268
454
480
514
150
473
276
464
525
402
405
372
246
267
199
526
282
524
64
204
261
390
399
459
242
271
192
520
263
430
384
455
424
392
308
63
114
444
515
523
35 437
88
161
9
395
451
431
226
516
256
484
396
58
406
403
449
486
432
301
93
248
79
92
241
190
302
249
460
96
291
87
502
238
370
247
519
117
228
133
310
154
135
351
172
298
200
257
136
380
211
206
191
510
201
243
153
463
229
251
374
445
38
217
518
483
467
429
393
151
212
189
51
203
214
215
350
503
239
528
174
296
160
440
438
377
205 30
511
233
265
156
232
166
60
304
426
297
66
144
501
113
168
236
264
307
143
146
422
299
471
152
373
394
181
131
512
378
61
155
230
124
187
75
466
184
442
158
425
266
423
142
218
448
443
383
465
102
508
231
386
235
441
175
382
435
385
254
240
208
178
401
132
185
309
193
80
147
379
134
72
210
209
83
421
447
98
188
130
148
157
434
139
149
202
504
16207
176
85
427
122
505
169
77
128
99
194
73
389
179
404
119
234
353
89
125
74
381
219
408
68
375
106
162
91
120
76
26
167
107
439
32
12612
7129
84
171
90
69
8110
8
123
25
183
54
110
292
111
170
163
112
116
138
57
186
388
237
145
59
159
115
8210
486
50
391
118
165
173
31
387
94
164
101
7136
311
95
420
67
53
48
52
4947
141
140
78
376
227
182
34
513
180
70
105
40
1
37
55
137
103
428
19
109
8
33
100
121
295
17
296
Reviz
ed TA
Z Stru
cture
for 20
07 M
odel
02
46
8 Mile
s
Hami
lton
Walke
r
Catoo
sa
Dade
Cha
ttano
oga
MP
O
Tenn
esse
e
Geo
rgia
Split
Taz
Orig
inal
TA
Z C
ount
ies
Cha
ttano
oga
MP
O
Exte
rnal
Zon
es


Chattanooga TPO 2035 LRTP – Volume 3: Travel Demand Model Documentation & User’s Guide
Appendix D: Technical Memorandum #3

Chattanooga TPO 2035 LRTP – Volume 3: Travel Demand Model Documentation & User’s Guide
This Page Intentionally Left Blank
2457 Care Dr ive , Su ite 101 Ta l lahassee, FL 32308
te l 850 219 6388 www.camsys.com fax 850 219 6389
Memorandum
TO: Bob Rock, TDOT Jerry Yuknavage, TDOT Tim Kassa, GDOT
CC: Chattanooga Interagency Consultation Committee (ICC)
FROM: Melissa Taylor, CHCNGA TPO Keli Paul, AICP, Cambridge Systematics Sheldon Harrison, Cambridge Systematics
DATE: September 28, 2009
RE: Model Certification Submittal #3: Draft 2007 TransCAD Model Validation Chattanooga-Hamilton County/North Georgia 2035 LRTP Update
Effective March 1, 2008, the Tennessee Department of Transportation (TDOT) Long-Range Planning Division, Systems Planning and Policy Office implemented a Division Procedure for the MPO model approval process. On August 20, 2008, the RPA met with its consultants along with TDOT, GDOT, and CARTA to discuss the TransCAD modeling efforts for the CHCNGA 2035 LRTP Update. It was agreed at that time that the following four submittals would be provided to TDOT and GDOT as part of TDOT’s model approval process:
• Outline of the model, planning assumptions to date, and model validation worksheet template;
• Year 2007 and 2035 socioeconomic data files (TransCAD and GIS) for the TPO region, including any maps, graphs, charts, or tables developed as part of the RPA’s internal review;
• Populated validation worksheet upon completion of draft validated model. This worksheet will include statistics for Trip Generation, Trip Distribution, Mode Choice (if applicable), and Traffic Assignment. If the assumptions included in submittal #1 change as part of the validation process, they will be documented and submitted for approval at this time; and
• Full model documentation report and user’s guide, along with all TransCAD files, after the draft LRTP has been documented.
This technical memorandum constitutes Submittal #3 defined above. Submittal #1 was submitted and approved by TDOT in September 2008. Subsequently, Regional Planning
- 2 -
Agency (RPA) staff and its consultant, Cambridge Systematics, held a teleconference with GDOT and TDOT on June 30, 2009 to discuss the draft socioeconomic data and preliminary validation statistics, as outlined in this submittal. Submittal #2, which included the 2007 and 2035 socioeconomic data, was submitted to TDOT, GDOT, and the ICC in July 2009 and approved during the ICC meeting on August 6, 2009. Preliminary validation statistics were provided to the Interagency Consultation Committee (ICC) for review in advance of the September 3, 2009 ICC meeting. In addition, this technical memorandum will be discussed at the October 1, 2009 ICC meeting.
As part of this submittal #3, below is a summary of the year 2007 model network, 2007 model validation, statistics and observations for each step of the modeling process, a comparison of model congested speeds to observed speeds, and next steps. In addition, a bullet list summary of the model validation results and observations is provided at the end of this technical memorandum. Overall, the 2007 model is performing within acceptable limits with an overall volume-to-count ratio of 0.96 and a Root Mean Square Error (RMSE) of 34.6 percent.
1.0 Year 2007 Model Network
In order to update the year 2000 model network to the year 2007, a list of capacity-adding transportation improvements completed between the years 2001 and 2007 was developed and distributed to the ICC for review and approval. Maps of these projects and the corresponding list are included in Appendix A. These projects were coded on top of the previously validated 2000 model network to reflect 2007 transportation network conditions.
Maps of the 2007 model network by area type, facility type, and number of lanes also are included in Appendix B. As part of the 2007 model update, a new area type code representing industrial land uses were added to the model. This new area type provided the ability to reduce speeds in areas serving industrial facilities. The TPO conducted a windshield survey in 2008, during which time areas representing industrial land uses were noted and revised accordingly in the 2007 model. In addition, topography data was overlayed on top of the 2007 model network to assist with updating the mountainous area type codes added during the previous model/LRTP update.
As part of the 2007 model update and Congestion Management Plan Update, the TPO identified locations along CMP routes and in the 2007 model where additional counts were needed. The TPO collected these supplemental counts in 2008 to assist with validation. As a result, year 2007 traffic counts available from TDOT, GDOT, Hamilton County, and the City of Chattanooga were included in the 2007 traffic count field used to calculate validation statistics. However, a year 2008 traffic count field was added to the model network to include these supplemental traffic counts collected in 2008. Since the base year of the model was 2007, these 2008 counts were not included in the validation statistics. However, they were used to supplement validation efforts and compare to 2007 traffic counts for accuracy.

- 3 -
2.0 Year 2007 Model Validation
2.1 External Trips
As noted in technical submittal #2, eight new external stations were added to the 2007 model above and beyond the 30 external stations included in the previous 2000 model. Year 2007 traffic counts at each of the 38 external stations were utilized to determine the total external trips. The same percent distribution of external-external (EE), or through trips, versus internal-external (IE) trips at each of the original 30 external zones used in the 2000 model was used for the 2007 model. Since the eight new external stations in the 2007 model were located along minor facilities, it was assumed that 100 percent of the external trips were attributed to IE trips, or those with one trip end inside the TPO region and one trip end outside the TPO region.
2.2 Trip Generation
Trip production rates utilized in the 2007 model are the same as those utilized in the 2000 model, as trip production rates were developed using local data from the Chattanooga 2002 Household Travel Diary Survey. However, trip attraction rates were modified in the 2007 model as they were borrowed from the Jacksonville, Florida region for the previous 2000 model. Trip attractions for some purposes, such as Home-Based Work (HBW), differed appreciably from the trip productions and it was therefore decided to borrow trip attraction rates from the Knoxville model and adjust where appropriate in an attempt to achieve closer matches. Utilizing Knoxville trip attraction rates is likely more appropriate for the Chattanooga region due to potential differences in travel characteristics in the Jacksonville, Florida region. The Knoxville trip attraction rates documented in the Knoxville Regional Travel Demand Model Validation Report of March 2004 resulted in some improvement in the unbalanced ratios for most trip purposes in Chattanooga. Adjustments were necessary to some of the trip attraction rates as trip purposes did not correlate perfectly between the Knoxville and Chattanooga models. The final Chattanooga 2007 model trip production and attraction rates are listed below.

- 4 -
Table 1. New Chattanooga Trip Production and Attraction Rates
To
tal
Ho
use
ho
lds
To
tal
Em
plo
ym
en
t
Ag
ricu
ltu
ral
/ M
inin
g /
Co
nst
ruct
ion
Ma
nu
fact
uri
ng
/
Tra
nsp
ort
ati
on
Re
tail
Se
rvic
e
Go
ver
nm
ent
Sch
oo
l E
nro
llm
en
t
To
tal
Po
pu
lati
on
Home-Based Work 0.00 0.51 0.00 0.00 0.00 0.00 0.00 0.00 0.00
Home-Based School 0.00 0.00 0.00 0.00 0.00 0.00 0.00 1.72 0.00
Home-Based Shop 0.00 0.00 0.00 0.00 0.78 0.11 0.19 0.00 0.20
Home-Based Social Recreation
0.00 0.00 0.00 0.00 0.48 0.06 0.12 0.00 0.12
Home-Based Other 0.00 0.00 0.00 0.00 1.38 0.19 0.35 0.00 0.36
Nonhome-Based 1.54 0.36 0.00 0.00 3.83 0.31 0.64 0.00 0.00
Light-Truck 0.10 0.00 0.30 0.25 0.25 0.15 0.15 0.00 0.00
Medium-Truck 0.05 0.00 0.10 0.10 0.10 0.05 0.05 0.00 0.00
Heavy-Truck 0.05 0.00 0.05 0.05 0.05 0.05 0.05 0.00 0.00
As demonstrated in Table 2, there were approximately nine person trips per household in the Chattanooga region in the 2007 model, within TDOT’s target range of 8.5 to 10.5, also comparing favorably with other cities in the region. Other aggregate trip rates are shown in Table 2 below.
Table 2. Aggregate Trip rates
Chattanooga Standards
Unit of Measure 2007 2000 TDOT FHWA
Persons per Household 2.38 2.50 n/a n/a
Internal Trips per Household 9.00 9.44 8.5-10.5 8.0-14.0
Internal Trips per Person 3.78 3.78 n/a 3.5-4.0
HBW Trips per Employee 1.12 0.74 n/a n/a
Employees per Person 0.51 0.73 n/a n/a
Total Population 425,666 395,061
Total Households 178,905 158,055
Total Employment 218,612 287,918
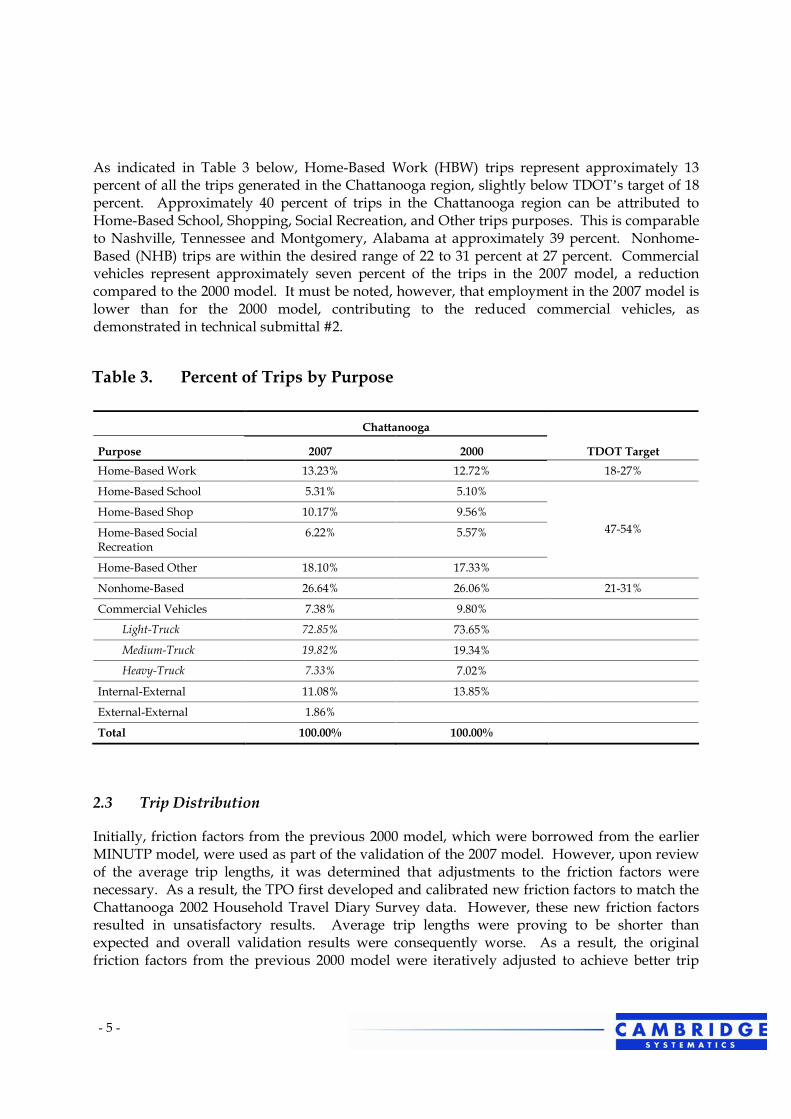
- 5 -
As indicated in Table 3 below, Home-Based Work (HBW) trips represent approximately 13 percent of all the trips generated in the Chattanooga region, slightly below TDOT’s target of 18 percent. Approximately 40 percent of trips in the Chattanooga region can be attributed to Home-Based School, Shopping, Social Recreation, and Other trips purposes. This is comparable to Nashville, Tennessee and Montgomery, Alabama at approximately 39 percent. Nonhome-Based (NHB) trips are within the desired range of 22 to 31 percent at 27 percent. Commercial vehicles represent approximately seven percent of the trips in the 2007 model, a reduction compared to the 2000 model. It must be noted, however, that employment in the 2007 model is lower than for the 2000 model, contributing to the reduced commercial vehicles, as demonstrated in technical submittal #2.
Table 3. Percent of Trips by Purpose
Chattanooga
Purpose 2007 2000 TDOT Target
Home-Based Work 13.23% 12.72% 18-27%
Home-Based School 5.31% 5.10%
Home-Based Shop 10.17% 9.56%
Home-Based Social Recreation
6.22% 5.57%
Home-Based Other 18.10% 17.33%
47-54%
Nonhome-Based 26.64% 26.06% 21-31%
Commercial Vehicles 7.38% 9.80%
Light-Truck 72.85% 73.65%
Medium-Truck 19.82% 19.34%
Heavy-Truck 7.33% 7.02%
Internal-External 11.08% 13.85%
External-External 1.86%
Total 100.00% 100.00%
2.3 Trip Distribution
Initially, friction factors from the previous 2000 model, which were borrowed from the earlier MINUTP model, were used as part of the validation of the 2007 model. However, upon review of the average trip lengths, it was determined that adjustments to the friction factors were necessary. As a result, the TPO first developed and calibrated new friction factors to match the Chattanooga 2002 Household Travel Diary Survey data. However, these new friction factors resulted in unsatisfactory results. Average trip lengths were proving to be shorter than expected and overall validation results were consequently worse. As a result, the original friction factors from the previous 2000 model were iteratively adjusted to achieve better trip

- 6 -
length distribution characteristics. Several iterative runs were performed to arrive at the final friction factors used for the remainder of the model validation runs. The final friction factors are included in the complete model dataset that is being provided to TDOT and GDOT as part of this submittal.
Just as was included in the previous 2000 model, K-factors were necessary between areas north and west of the Tennessee River and areas south and east of the Tennessee River, as well as between Georgia and Tennessee. However, unlike the previous model, the K-factors were not directionally skewed to/from Georgia and Tennessee. In addition to the K-factors (0.8 for each), it was found necessary to add penalties, primarily along the Tennessee River bridges to correct local imbalances. Table 4 below lists the locations and amount of the penalties.
Table 4. Penalties
Roadway Penalty (minutes)
U.S. 27 Bridge 1.35
N. Market Street Bridge 1.10
Dupont Parkway 0.25
Mountain Creek Road 2.00
Table 5 demonstrates the final average trip lengths for each trip purpose in comparison to the old 2000 model. In addition, year 2007 Home-Based Work (HBW) trip lengths were compared to those included in the Census Transportation Planning Package (CTPP) for the year 2000 in Hamilton, Catoosa, and Walker Counties. HBW trip lengths improved in the 2007 model compared to the 2000 model as they are closer to the CTPP trip lengths. However, the 2007 model HBW trip lengths are still slightly shorter when compared to the CTPP trip lengths. This is as a result of the daily nature of the model compared to the highly peak hour weighted CTPP figure. The modest expansion of the model to include all of Catoosa County since the last LRTP partially explains the reduction in Internal-External trip times. All of the 2007 trip lengths are within acceptable limits provided by the Federal Highway Administration (FHWA). No trip length targets have been established by TDOT at this time.
The 2007 model validation effort involved significant splitting of zones, particularly towards the periphery. This reduced the average size of zones. Consequently, as indicated in Table 6, the percent intrazonal trips fell slightly to below nine percent as compared to above nine percent for the 2000 model. As expected, given the tendency of individuals to travel further for work purposes, the percent intrazonal trips for HBW are lower than for other purposes at just under two percent.

- 7 -
Table 5. Average Trip Length (in Minutes)
2007 2000
Purpose Chattanooga (TransCAD)
Chattanooga (TransCAD)
CTPP (Hamilton)
CTPP (Catoosa)
CTPP (Walker)
FHWA Target
Home-Based Work 18.26 16.36 21.20 23.70 26.50 11.2-35.4
Home-Based School 13.85 14.48 n/a n/a n/a 8.9-15.9
Home-Based Shop 12.84 13.78 n/a n/a n/a 8.6-18.7
Home-Based Social Recreation
13.55 11.38 n/a n/a n/a
Home-Based Other 12.44 14.41 n/a n/a n/a
10.4-17.3
Nonhome-Based 14.18 15.44 n/a n/a n/a 8.1-17.1
Commercial Vehicles 17.88 19.64 n/a n/a n/a n/a
Light-Truck 17.78 18.79
Medium-Truck 17.20 17.95
Heavy-Truck 20.75 22.17
Internal-External 37.38 41.04 n/a n/a n/a n/a
Total 14.53 18.68 n/a n/a n/a n/a
Table 6. Intrazonal Trips by Trip Purpose
Chattanooga (TransCAD) Percent Intrazonal
Purpose 2007 2000
Home-Based Work 1.93% 7.04%
Home-Based School 6.63% 11.12%
Home-Based Shop 12.51% 9.93%
Home-Based Social Recreation
11.98% 21.08%
Home-Based Other 12.96% 11.16%
Nonhome-Based 9.61% 8.02%
Commercial Vehicles 2.77% 3.06%
Light-Truck 2.74% 2.95%
Medium-Truck 3.46% 4.15%
Heavy-Truck 1.27% 1.19%
Total 8.89% 9.18%

- 8 -
2.4 Mode Choice
Currently, the Chattanooga TransCAD model does not include a transit network/pathbuilding component. At the beginning of the 2035 LRTP Update, the RPA intended to add transit to the TransCAD model contingent upon the availability of existing data to validate the new transit component. However, upon review of the data, it was determined that an on-board transit survey was needed in order to validate a new transit model. The RPA will be developing the survey instrument for the on-board transit survey shortly after the adoption of the 2035 LRTP Update. Subsequently, the RPA will conduct the on-board survey in the Fall of 2010, in preparation for the next base year 2010 model for the LRTP Update to be adopted in 2014. The RPA intends to add the transit network/pathbuilding component to the next generation of the TransCAD model in time for the next LRTP update. In the interim, the same auto occupancy model used in the model from the previous 2030 LRTP Update is being used for the current 2035 LRTP Update. Ratios of persons per vehicle were derived from the local household diary survey conducted in the Chattanooga region in 2002.
2.5 Traffic Assignment
In validating traffic assignment, final outcome of a travel demand model, common performance metrics include the following:
• Systemwide volume-to-count ratio;
• Volume-to-count ratios by link group (area type, facility type, and number of lanes);
• Volume-to-count ratios along screenlines;
• Percent difference in model volumes and counts by volume group;
• Systemwide coefficient of determination between assigned volumes and counts;
• Systemwide percent root mean square error; and
• Percent root mean square error by volume group.
Table 7 includes the volume-to-count ratios by facility type, area type, and number of lanes. Overall, the model is validating at 0.96, within acceptable limits. This is also an improvement in the overall validation since the 2000 model with a volume-to-count ratio of 0.95. Although the validation of expressways improved in the 2007 model, the validation of undivided principal arterials, minor arterials, and one-way facilities got worse when compared to the 2000 model. This can be attributed to the correction in the network coding in the 2007 model reflecting the 3rd and 4th Street one-way facilities in downtown Chattanooga. Furthermore, additional network detail was included in some portions of the model as a result of further TAZ splits, as well as a significant amount of more traffic counts being provided in the 2007 model. Therefore, although the 2007 model may indicate lower volume-to-count ratios for some facility type categories, it is likely more accurate than the 2000 model due to the additional traffic counts. In addition, no ramp counts were available in the 2000 model and have since been added to the 2007 model validating at a 2007 volume-to-count ratio of 0.99. Four of the six facility type categories that have targets set by TDOT are within acceptable limits.

- 9 -
Although no targets have been established to date by TDOT for volume-to-count ratios by area type, seven of the eight area type categories are validating within +/- 1 ten percent. In addition, the new industrial area type category is validating at 0.90. The CBD area in downtown Chattanooga is validating at 0.74, which has historically validated lower than other categories in the Chattanooga model. With the exception of one lane facilities (by direction), the 2007 model is validating better within each lane category compared to the old 2000 model.
Table 7. Volume Over Count Ratios by Facility Type, Area Type and Number of Lanes
Chattanooga Volume/Count Ratio
2007 2000 TDOT Targeta
Facility Type
1. Interstate 1.02 0.98 +/- 7%
2. Expressway 1.04 0.94 +/- 7%
3. Principal Arterial Divided 0.98 0.98 +/- 10%
4. Principal Arterial Undivided 0.86 0.94 +/- 10%
5. Minor Arterial 0.80 0.88 +/- 15%
6. Collector 0.98 0.98 +/- 25%
7. Ramp 0.99 n/a
8. One-Way 0.49 0.71 n/a
Area Type
1. CBD 0.69 0.88
2. CBD Fringe 0.97 0.92
3. Residential 0.92 0.96
4. OBD 0.95 0.92
5. Rural 1.07 1.10
6. Urban Undeveloped 1.04 1.02
7. Mountainous 1.09 0.95
8. Industrial 0.90
Number of Lanes by Direction
1 0.88 0.93
2 0.99 0.98
3 0.98 0.95
4 1.03 0.92
Total 0.96 0.95

- 10 -
The 10 screenlines from the previous model were kept and utilized to assist in model validation for the 2007 model. Their positions capture all the major traffic flows in the Chattanooga Region and thus further adjustments and additions were deemed unnecessary. A map of the screenline locations is provided in Appendix C. Maps of volume-to-count ratios on each link in the model with a count are included in Appendix D. For eight of the 10 screenlines, the volume-to-count ratios fall within the +/- 10 percent target range of TDOT. Table 8 compares the volume-to-count ratio for each screenline in the 2007 model against the old 2000 model.
Table 8. Comparison of Volume-to-Count Ratios by Screenline
Chattanooga Volume/Count Ratio
Screenline 2007 2000
1 1.00 0.97
2 1.01 0.94
3 0.88 0.97
4 0.99 0.91
5 0.82 0.90
6 0.93 0.99
7 1.10 1.09
8 0.91 1.06
9 1.06 1.02
10 1.00 1.00
Table 9 indicates the percent difference in model volumes and observed counts by volume group. All volume groups within the 2007 model achieve the established TDOT targets.

- 11 -
Table 9. Percent Difference for Daily Volumes (Calculated for Links with Counts)
AADT Chattanooga 2007TransCAD TDOT Targeta
<1,000 48.90% +/- 60%
1,000-2,500 19.20% +/- 47%
2,500-5,000 -2.80% +/- 36%
5,000-10,000 -10.30% +/- 29%
10,000-25,000 -8.90% +/- 25%
25,000-50,000 1.50% +/- 22%
>50,000 -5.90% +/- 21%
The correlation coefficient of observed counts to model volumes (R2) is performing well at 0.95, exceeding TDOT’s target of 0.88, as demonstrated below in Figure 1.
Figure 1. Correlation of Assigned Versus Observed Volumes
0
10000
20000
30000
40000
50000
60000
70000
0 10000 20000 30000 40000 50000 60000 70000
2007 AADT
2007
Ass
ign
ed V
olu
mes
As indicated in Table 10, the overall RMSE for the 2007 model is 34.6 percent, within acceptable federal limits. TDOT has established an overall RMSE target of 30 percent. However, based on discussion with TDOT during the June 30, 2009 teleconference, it was determined that 30 percent was just a target and was not required as federal standards indicate a RMSE range of 32-39 percent is within acceptable limits. Although the previous 2000 model indicated an overall RMSE of 23 percent, it is suspected that it was not as accurate due to the reduced

- 12 -
amount of traffic counts available at that time. All volume groups within the 2007 model achieved a RMSE value close to or within federal and/or TDOT targets.
Table 10. Root Mean Square Error (RMSE) by Volume Group
Chattanooga TransCAD
Count Range 2007 2000 TDOT Target
FHWA & New FDOT Guidelines
and Standards
0-4,999 83.70% 73.10% 115.76 45-100
5,000-9,999 46.30% 33.60% 43.14 35-45
10,000-14,999 36.40% 18.10% 28.27 27-35
15,000-19,999 25-30
20,000-29,999 21.70%
15-27
30,000-39,999
25.40%
16.90%
25.38
40,000-49,999 4.40% 15-25
50,000-59,999 12.10%
7.20% 30.25
10-20
60,000-69,999
70,000-79,999 10-19
79,999-89,999
15.50% n/a 19.20
Overall 34.60% 23.40% 30.00% 32-39%
Table 11 summarizes the vehicle miles traveled (VMT) by model facility type, as well as the percent of VMT that falls within each model facility type compared to TDOT targets. With the exception of minor arterials, all of the facility types fall within or close to TDOT’s targets for percent of VMT by facility type. In addition, the overall ratio of VMT to Highway Performance Monitoring System (HPMS) VMT is 1.06 (excluding external centroid connectors).

- 13 -
Table 11. Vehicle Miles Traveled by Model Facility Type
Facility Type Chattanooga 2007 Model VMT TDOT Target
Interstate 4,228,041 (31.4%)
Expressway 1,496,818 (11.1%) 33-38%
Principal Arterial Divided 2,067,224 (15.4%)
Principal Arterial Undivided 835,239 (6.2%) 27-33%
Minor Arterial 1,384,961 (10.3%) 18-22%
Collector 1,465,718 (10.9%) 8-12%
Ramp 215,118 n/a
One-Way 16,672 n/a
External Connectors 921,730 n/a
Centroid Connectors 827,412 n/a
Total 13,458,933
2.6 Comparison to Observed Speeds
During November 2008, the RPA conducted travel time runs during the AM and PM peak periods along all routes in their Congestion Management Plan (CMP). The results of these travel time runs were used to calculate average peak period congested speeds. These observed speeds were then compared to the daily congested speeds in the model during the 2007 model validation process. Appendix E includes a map of the observed 2008 AM peak period congested speeds, as well as a map of the daily congested speeds from the 2007 model. As expected, the model speeds compared to the observed speeds are slightly different in some instances since the model speeds are daily and the observed speeds are peak period. However, there was a significant improvement in congested speeds along interstates in the 2007 model as they were too low in the 2000 model.
3.0 Summary of 2007 Model Validation Observations
• The overall 2007 model is validating at 34.6 percent, within acceptable federal limits;
• The 2007 model is validating at a systemwide volume-to-count ratio of 0.96, within acceptable limits and improved since the 2000 model;
• The correlation coefficient of observed counts to model volumes (R2) is performing well at 0.95, exceeding TDOT’s target of 0.88;
• Eight of ten screenlines are validating within acceptable limits;

- 14 -
• The overall ratio of model VMT to HPMS VMT is 1.06;
• Average trip lengths increased for some trip purposes and decreased for others, although Home-based Work (HBW) trip lengths did improve;
• The percent of intrazonal trips attributed to Home-based Work (HBW) trips are now within a more reasonable range;
• Congested speeds along the interstate and other higher facilities are improved compared to the 2000 model and observed congested speeds;
• Overall, higher facilities are generally comparable to the 2000 model, however, minor facilities got worse in the 2007 model due to additional traffic count availability and network detail;
• Overall, the 2007 model has more counts with almost 10 percent of the network having counts. As a result, the 2007 model includes improved accuracy and reliability of the model statistics;
• Employment in the 2007 model is lower than in the 2000 model, resulting in lower commercial trips; and
• As with all models, there is always room for improvement. However, this model should be sufficient for updating the 2030 LRTP to 2035.
4.0 Future Model Enhancements
Several enhancements are planned for the next generation of the Chattanooga travel demand model to be used for the next LRTP update scheduled for adoption in 2014. These enhancements, as well as the planned data collection efforts necessary to support these enhancements, are detailed below.
4.1 Data Collection
In preparation for the next LRTP Update due for adoption in 2014, the RPA is planning for multiple data collection and compilation efforts over the next two years. Below are some of the data collection efforts planned:
• Socioeconomic Data – Once the Census 2010 population and household data is released, likely in 2012, the RPA will use the data to develop the base year 2010 model socioeconomic data. In the meantime, the RPA will be providing guidelines to the counties and municipalities in the TPO region stating what socioeconomic data is required to assist with compiling the data. Additionally, proprietary employment datasets for the year 2010 may be evaluated for accuracy to determine the most appropriate data source for the

- 15 -
Chattanooga region. In addition to year 2010, the RPA will be forecasting socioeconomic data to the horizon year for the next LRTP Update, likely year 2040.
• Traffic Counts – During calendar year 2010, the RPA will be identifying and collecting traffic counts at key locations throughout the TPO to assist with validating the 2010 base year model as part of the next LRTP update. The traffic counts will be collected by vehicle class and 15-minute intervals in order to validate trips at the truck level and to include a new time-of-day component in the model.
• External Origin and Destination Survey – In 2002, a roadside origin-destination intercept survey designed to obtain characteristics of travelers entering, exiting, and passing through the region from locations outside the CHCNGA study area was conducted. During the last 2030 LRTP Update, it was determined that the results from the 2002 external origin and destination survey were biased. As a result, during the last 2030 LRTP Update, as well as this current 2035 LRTP Update, the 2002 roadside origin-destination intercept survey was not used within the TransCAD model. Therefore, the RPA intends to conduct a new external origin and destination survey during the fall of 2010. In the meantime, the RPA will be designing the sampling plan and survey instrument. The results of the 2010 external origin and destination survey will be used to validate the external model for the 2010 base year validation as part of the next LRTP update.
• On-Board Transit Survey – As mentioned earlier, the RPA intends to conduct an on-board transit survey in order to validate a new mode choice/transit component in the TransCAD travel demand model. The RPA will be designing the sampling plan and survey instrument in the spring/summer of 2010 with the survey being conducted in the fall of 2010.
• Household Travel Diary Survey – In 2002, a household travel diary survey was conducted to determine trip generation rates, average trip lengths, auto occupancy factors, and other characteristics used in model development and validation. Typically, household travel diary surveys are conducted every 10 years to accurately reflect travel characteristics of the region. Pending funding availability, the RPA intends to conduct a new household travel diary survey in calendar year 2011. The results of the 2011 travel diary survey will be incorporated into the new 2010 base year model for the next LRTP update.
• Bicycle and Pedestrian Counts – If a nonmotorized component is added to the travel demand model prior to validating the 2010 base year model for the next LRTP Update, the RPA will collect bicycle and pedestrian counts. Currently, the RPA owns three bicycle and pedestrian counters and has begun collecting counts in key locations.
4.2 Travel Demand Model Enhancements
The above mentioned data collection efforts will be used to incorporate several enhancements to the current CHCNGA TPO TransCAD model. These enhancements could potentially include the following additions to the TransCAD model prior to the next LRTP Update:
• Updated external model based on 2010 external data;

- 16 -
• Updated trip generation structure based on 2011 household travel diary survey data;
• New mode choice/transit component not previously included in the model to be used to forecast transit ridership;
• New nonmotorized component not previously included in the model to be used to forecast bicycle and pedestrian trips;
• New time-of-day component used to disaggregate daily trips into three to four time periods. This will improve the accuracy in calculating air quality emissions and is typically necessary for transit models; and
• Validate truck trips in addition to total trips, whereas in the past, only total trips were validated.
5.0 Next Steps
Below is a list of the remaining information to be provided to TDOT and GDOT for review and approval, once the draft LRTP has been documented:
• Full model documentation report and user’s guide; and
• All TransCAD files (future years).
The 2007 model files are being provided to TDOT and GDOT as part of this technical submittal.
As discussed during the modeling workshop held on August 20, 2008, please provide any comments back to the RPA within 10 days, if not sooner. We thank you in advance for understanding our time constraints and look forward to coordinating with you throughout the development of our model and LRTP. If you have any questions about the model, please do not hesitate to contact Melissa Taylor at the RPA via e-mail at [email protected] or phone at (423) 757-0077.
Appendices:
Appendix A: Table and Maps of 2007 Network Projects
Appendix B: Maps of 2007 Model Network Area Type, Facility Type, and Number of Lanes
Appendix C: Map of Screenline Locations
Appendix D: Maps of 2007 Volume-to-Count Ratios
Appendix E: Maps of Congested Speeds (Daily Model and Observed Peak-Period)
Appendix F: Year 2007 Validation Worksheets
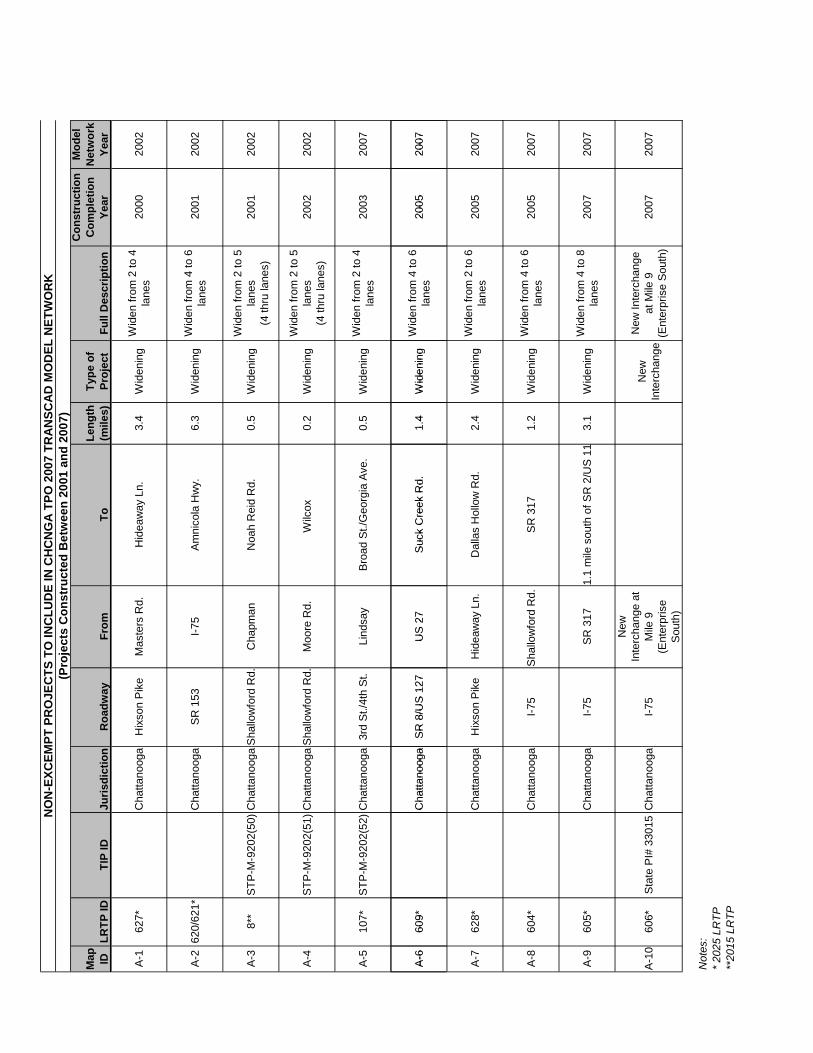
Con
stru
ctio
n C
ompl
etio
n Ye
ar
Mod
el
Net
wor
k Ye
ar
1
NO
N-E
XCEM
PT P
RO
JEC
TS T
O IN
CLU
DE
IN C
HC
NG
A T
PO 2
007
TRA
NSC
AD
MO
DEL
NET
WO
RK
(Pro
ject
s C
onst
ruct
ed B
etw
een
2001
and
200
7)
Map ID
LRTP
TIP
ID ID
Juri
Roa
sdic
tion
dway
TFr
omo
Len
(mgt
h ile
s)Ty
pe o
f Pr
ojec
tFu
ll D
escr
iptio
n
A-1
627*
Cha
ttano
oga
Hix
son
Pik
eM
aste
rs R
d.H
idea
way
Ln.
3.4
Wid
enin
gW
iden
fr lane
som
2 to
4
2000
2002
A-2
620/
621*
Cha
ttano
oga
SR
153
I-75
Am
nico
la H
wy.
6.3
Wid
enin
gW
iden
fr lane
som
4 to
6
2001
2002
A-3
8**
STP
-M-9
202(
50)C
hatta
noog
aS
hallo
wfo
rd R
d.C
hapm
anN
oah
Rei
d R
d.0.
5W
iden
ing
Wid
en fr la
nes
(4 th
ru
om 2
to 5
lane
s)20
0120
02
A-4
STP
-M-9
202(
51)C
hatta
noog
aS
hallo
wfo
rd R
d.M
oore
Rd.
Wilc
ox
0.2
Wid
enin
gW
iden
fr lane
s(4
thru
om 2
to 5
lane
s)20
0220
02
A-5
107*
STP-
M-9
202(
52)C
hatta
noog
a3r
d St
./4th
St.
Lind
say
Broa
d St
./Geo
rgia
Ave
.0.
5W
iden
ing
Wid
en fr la
nes
om 2
to 4
20
0320
07
A-6
A-6
609*
609
CCha
ttano
oga
SR
hatta
noog
aS
R 8
/US
127
8/U
S 1
27U
S27
US
27
ck C
Suc
kC
reek
Su
reek
Rd
Rd.
14
Wid
enin
g.4
Wid
enin
gW
iden
fr lane
som
4 to
6
2005
2007
2005
2007
A-7
628*
Cha
ttano
oga
Hix
son
Pik
eH
idea
way
Ln.
Dal
las
Hol
low
Rd.
2.4
Wid
enin
gW
iden
fr lane
som
2 to
6
2005
2007
A-8
604*
Cha
ttano
oga
I-75
Sha
llow
ford
Rd.
S
R 3
171.
2W
iden
ing
Wid
en fr la
nes
om 4
to 6
20
0520
07
A-9
605*
Cha
ttano
oga
I-75
SR
317
1.1
mile
sou
th o
f SR
2/U
S 1
13.
1W
iden
ing
Wid
en fr la
nes
om 4
to 8
20
0720
07
A-1
060
6*S
tate
PI#
330
15C
hatta
noog
aI-7
5
New
In
terc
hang
e at
M
ile 9
(E
nter
pris
e S
outh
)
New
In
terc
hang
e
New
Inte
rc
(Ent
erpr
ise
hang
e at
Mile
9
Sou
th)
2007
2007
Not
es:
* 20
25 L
RTP
**20
15 L
RTP

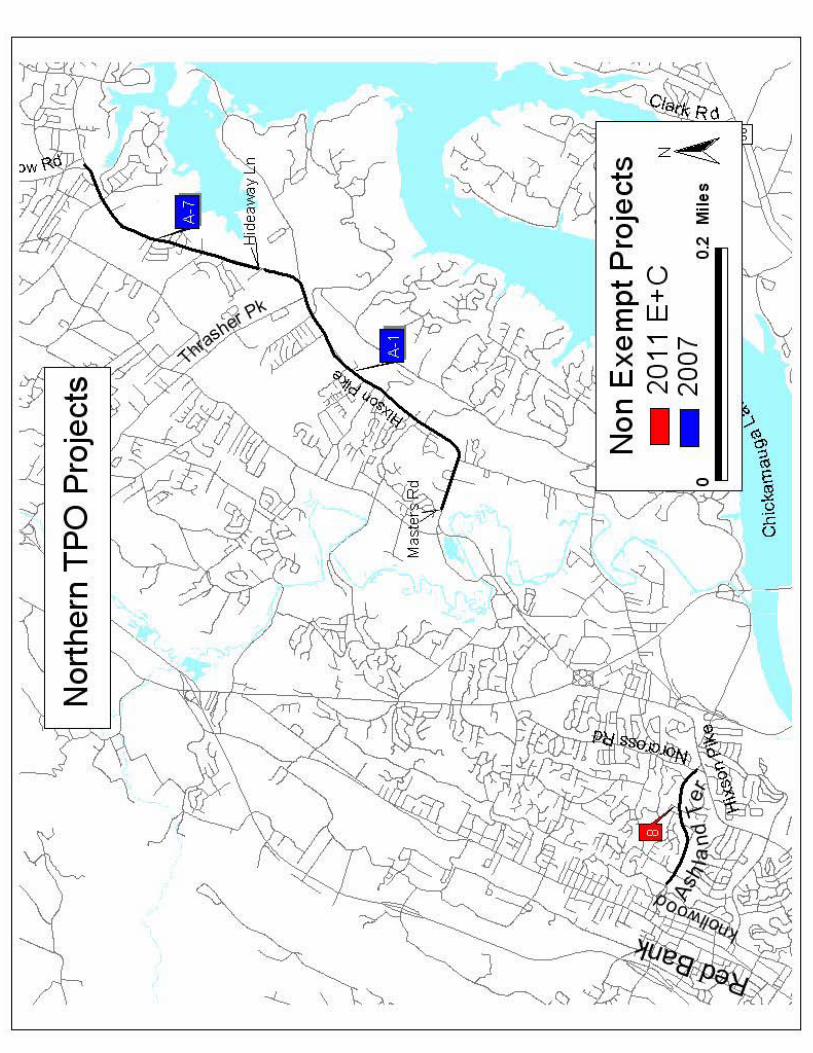


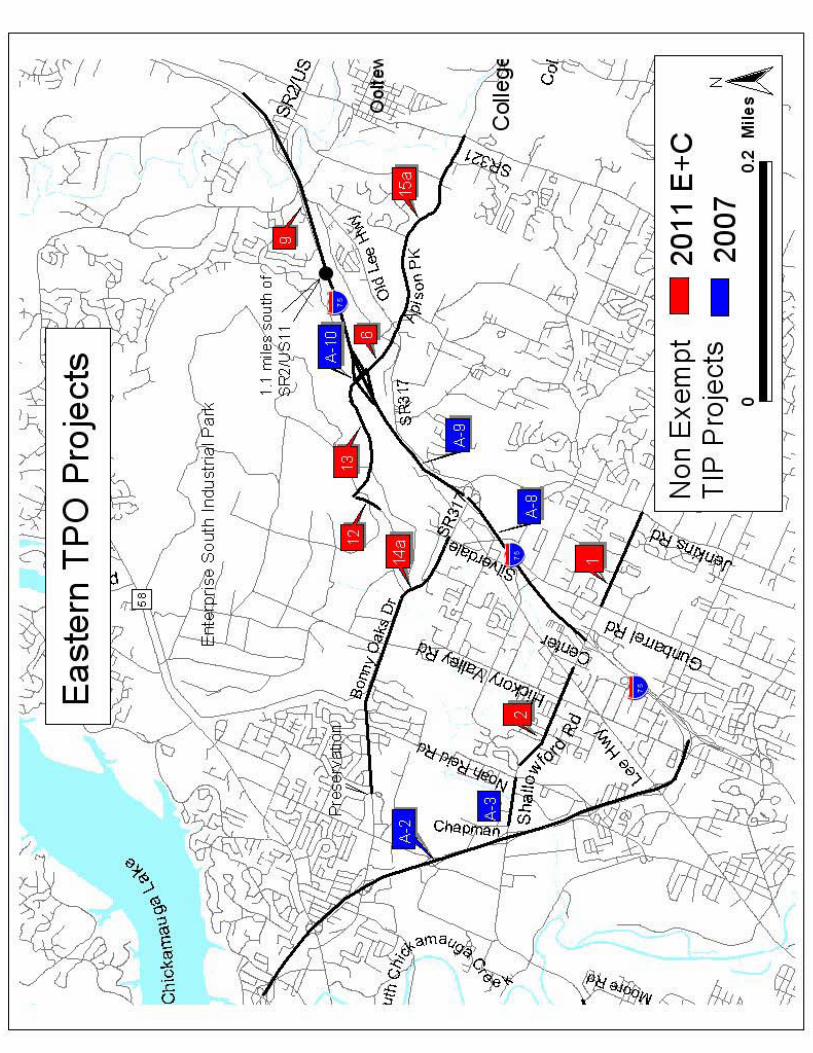

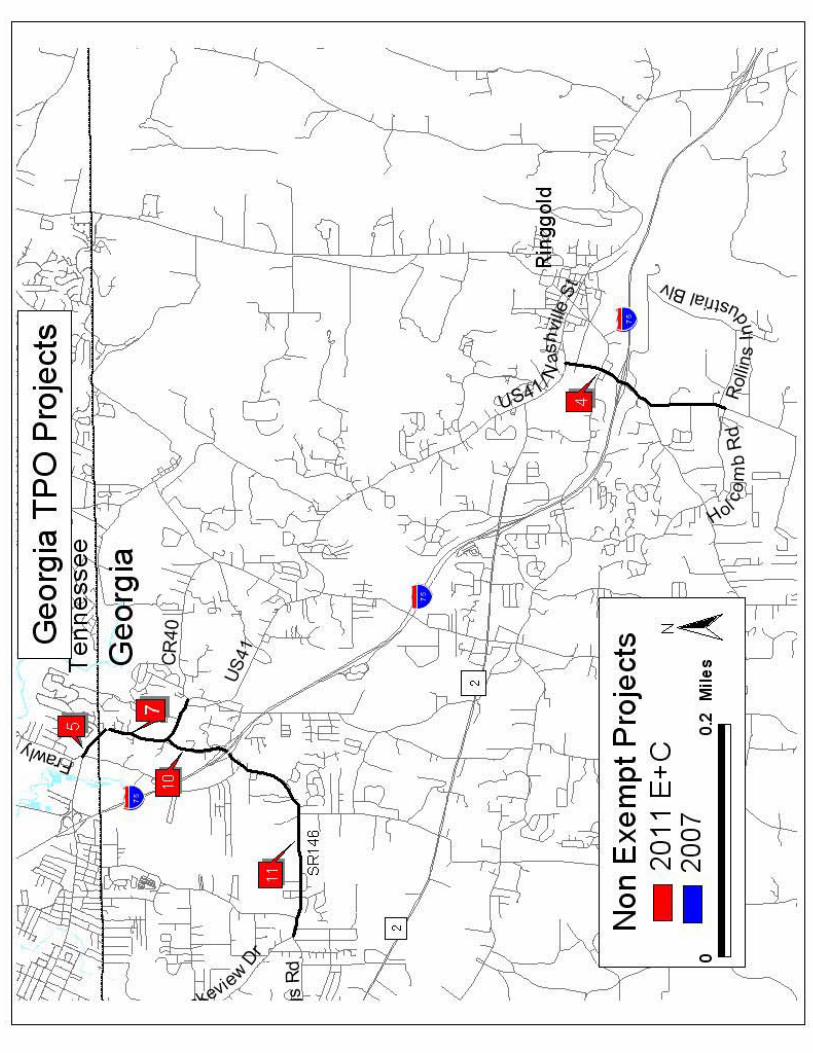

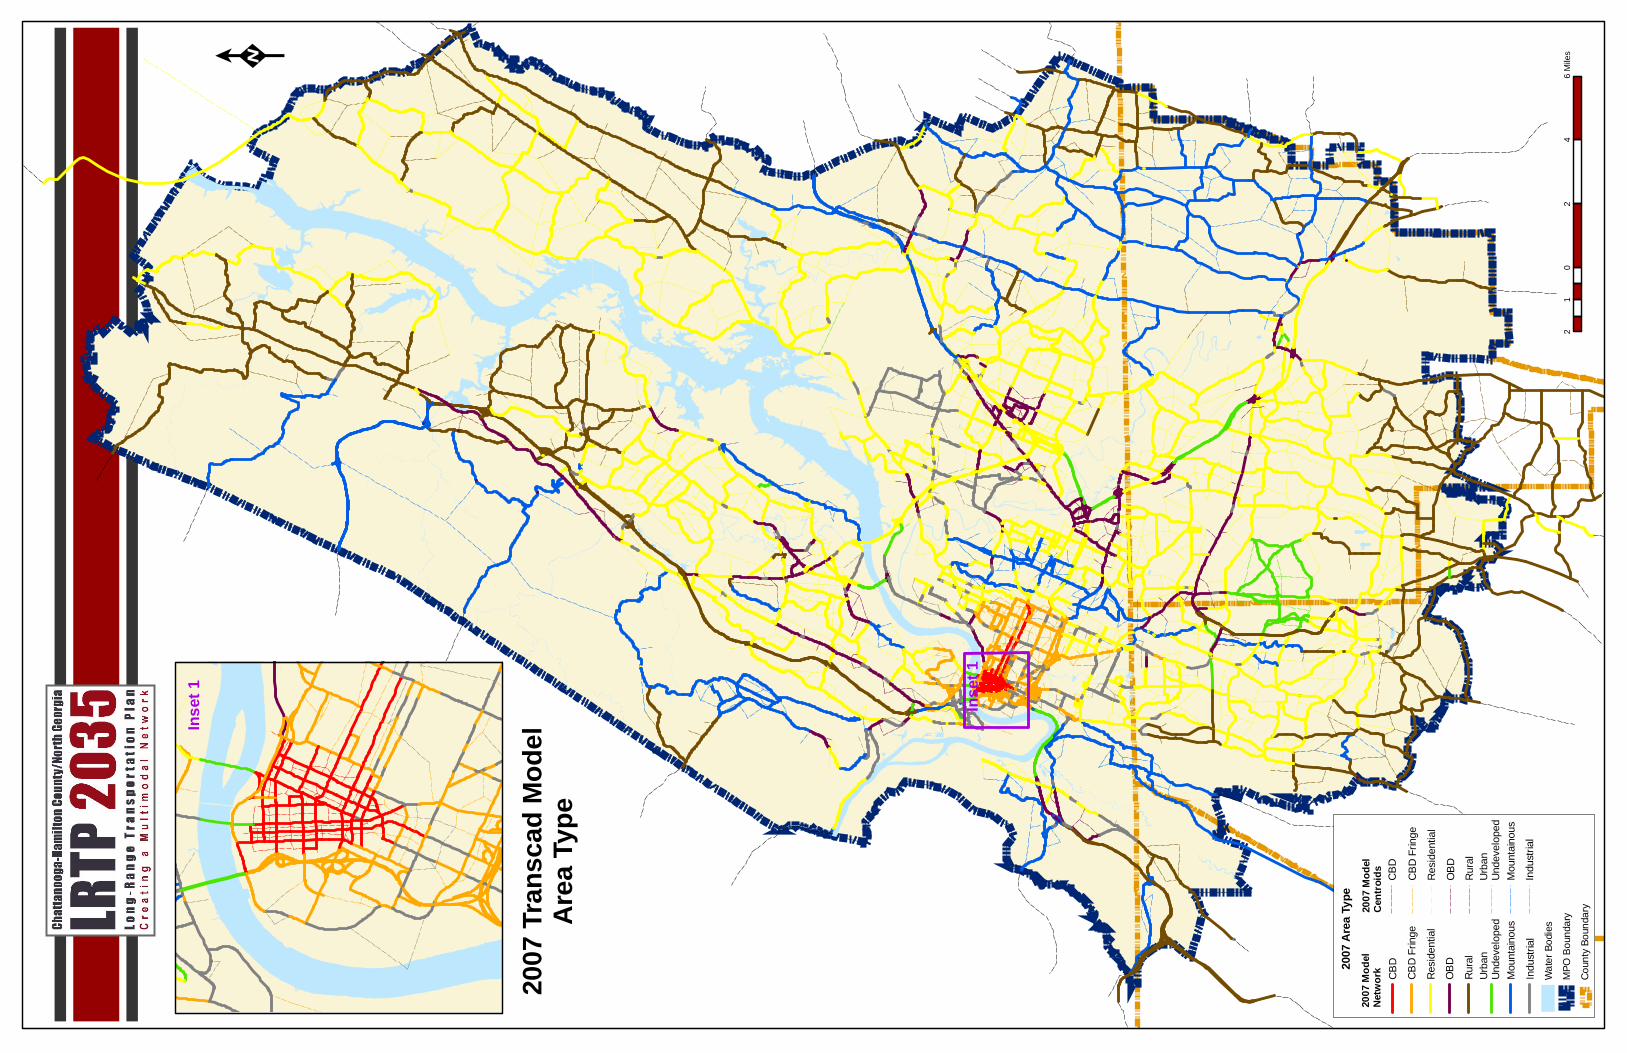
2007
Tran
scad
Mod
elAr
ea Ty
pe
20
24
61
Mile
sK
Inset
1
Inset
1
MPO
Bou
ndar
y
Cou
nty
Boun
dary
Wat
er B
odie
s
2007
Mod
el Ne
twor
k2007
Area
Type
2007
Mod
elCe
ntroid
sC
BD
CB
D F
ringe
OB
D
Rur
al
Mou
ntai
nous
Indu
stria
l
Res
iden
tial
Urb
an
Und
evel
oped
Res
iden
tial
CB
D F
ringe
OB
D
Rur
alU
rban
Und
evel
oped
Mou
ntai
nous
Indu
stria
l
CB
D


2007
Tran
scad
Mod
elFa
cility
Type
20
24
61
Mile
sK
Inset
1
Inset
1
2007
Mod
el Ne
twor
k20
07 Fa
cility
Type
Inte
rsta
te
Expr
essw
ay
Prin
cipa
l Arte
rial,
Div
ided
Min
or A
rteria
l
Ram
p
One
way
Net
wor
k C
onne
ctor
s
MPO
Bou
ndar
y
Cou
nty
Boun
dary
Wat
er B
odie
s
Prin
cipa
l Arte
rial,
Und
ivid
ed
Col
lect
or


24
24
75
75
75
75
27
27
27
153
153
Ha
mil
ton
Pla
ce
Ha
mil
ton
Pla
ce
No
rth
ga
te M
all
No
rth
ga
te M
all
En
terp
ris
e S
ou
thE
nte
rpri
se
So
uth
Na
tio
na
l M
ilit
ary
Pa
rkN
ati
on
al
Mil
ita
ry P
ark
2007
Tran
scad
Mod
el
Numb
er of
Lane
s(O
ne - W
ay)
20
24
61
Mile
s
Inset
1
Inset
1
2007
Mod
el Ne
twor
k20
07 N
umbe
r of
Lane
s (On
e-Way
)
MP
O B
ound
ary
Cou
nty
Bou
ndar
y
Wat
er B
odie
s
1 2 3 4


24
24
75
75
75
75
27
27
27
153
153
153
Ham
ilton
Pla
ceHa
milt
on P
lace
Nort
hgat
e M
all
Nort
hgat
e M
all
Ente
rpris
e So
uth
Ente
rpris
e So
uth
Chat
tano
oga
Airp
ort
Chat
tano
oga
Airp
ort
Natio
nal M
ilita
ry P
ark
Natio
nal M
ilita
ry P
ark
2007
Tran
scad
Mod
elSc
reenli
nes
20
24
61
Miles
MPO
Boun
dary
Co
unty
Boun
dary
Water
Bodie
s
Scree
nline
sId
1 - C
entra
l City
Part
ial C
ordon
2 - Te
nnes
see R
iver C
rossin
g3 -
Nort
h-Sou
th Do
wntow
n4 -
East-
West
Down
town
5 - M
ission
ary R
idge
6 - So
uth C
hicka
maug
a Cree
k7 -
Nort
h-Sou
th No
rth H
amilto
n Cou
nty8 -
Ring
gold
9 - Te
nnes
see/G
eorgi
a Stat
e Line
10 - E
xterna
l Cord
on
1
1 4
4
2
2
6
6
5
5
7
7
9
9
33
33 4
4
2
1
1
5
5
2
8
8
10
10


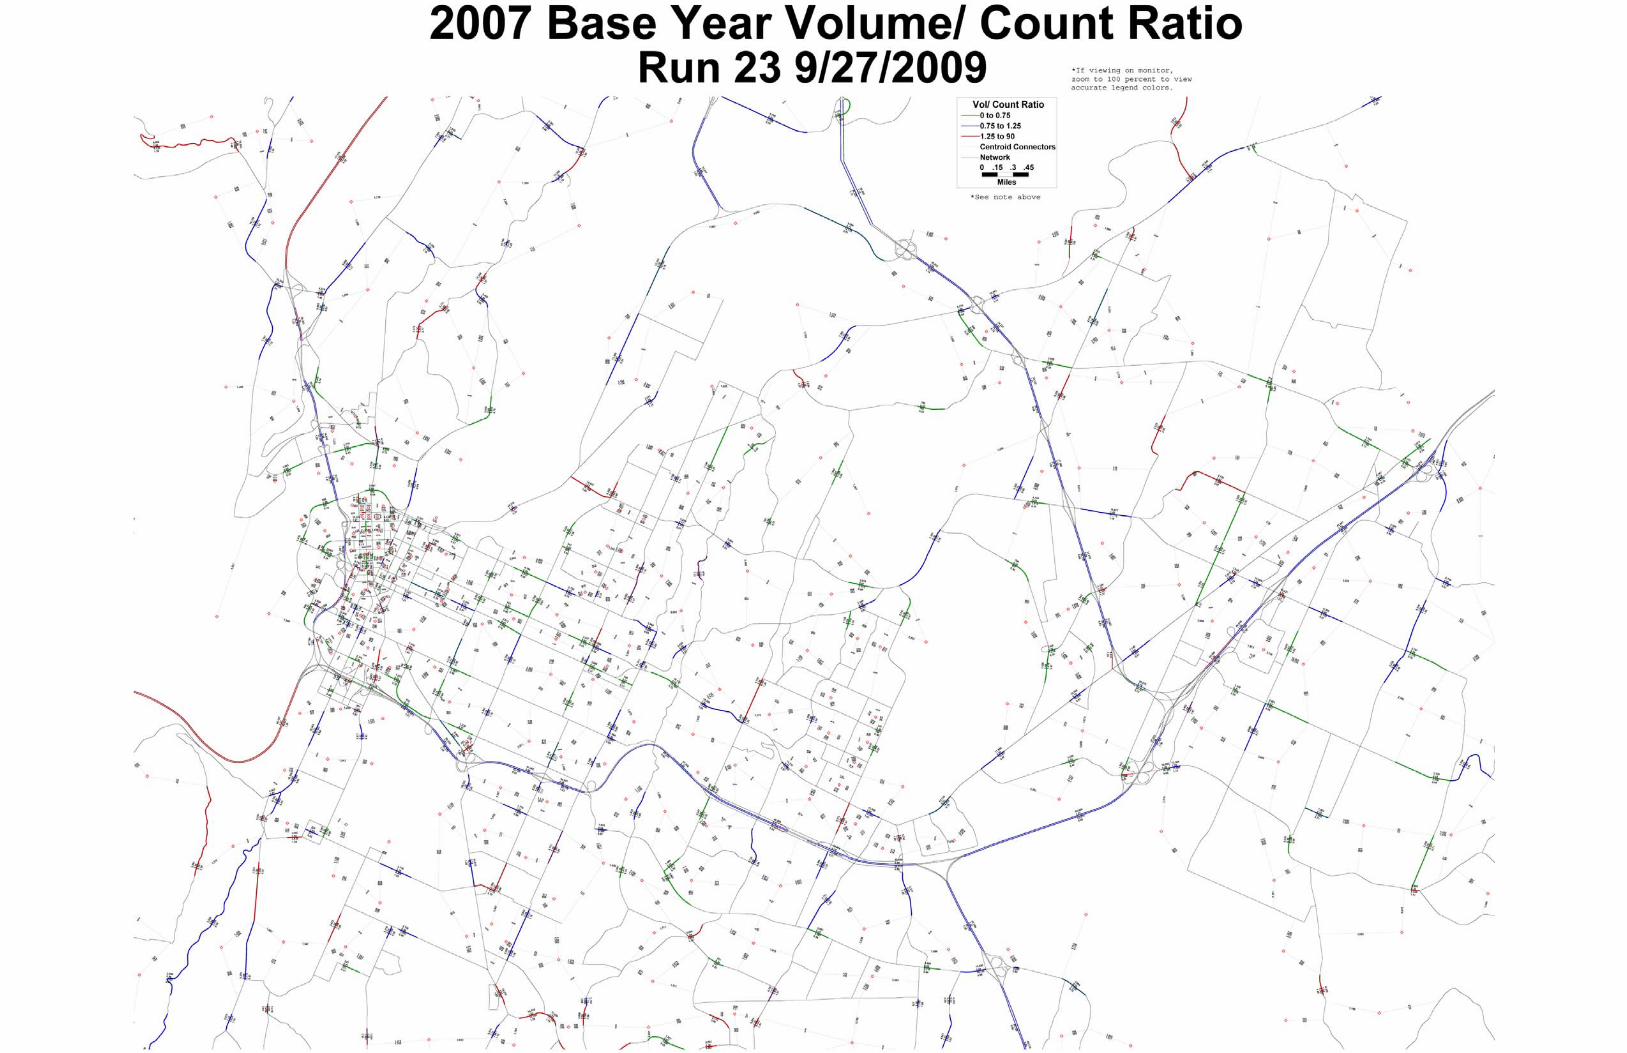

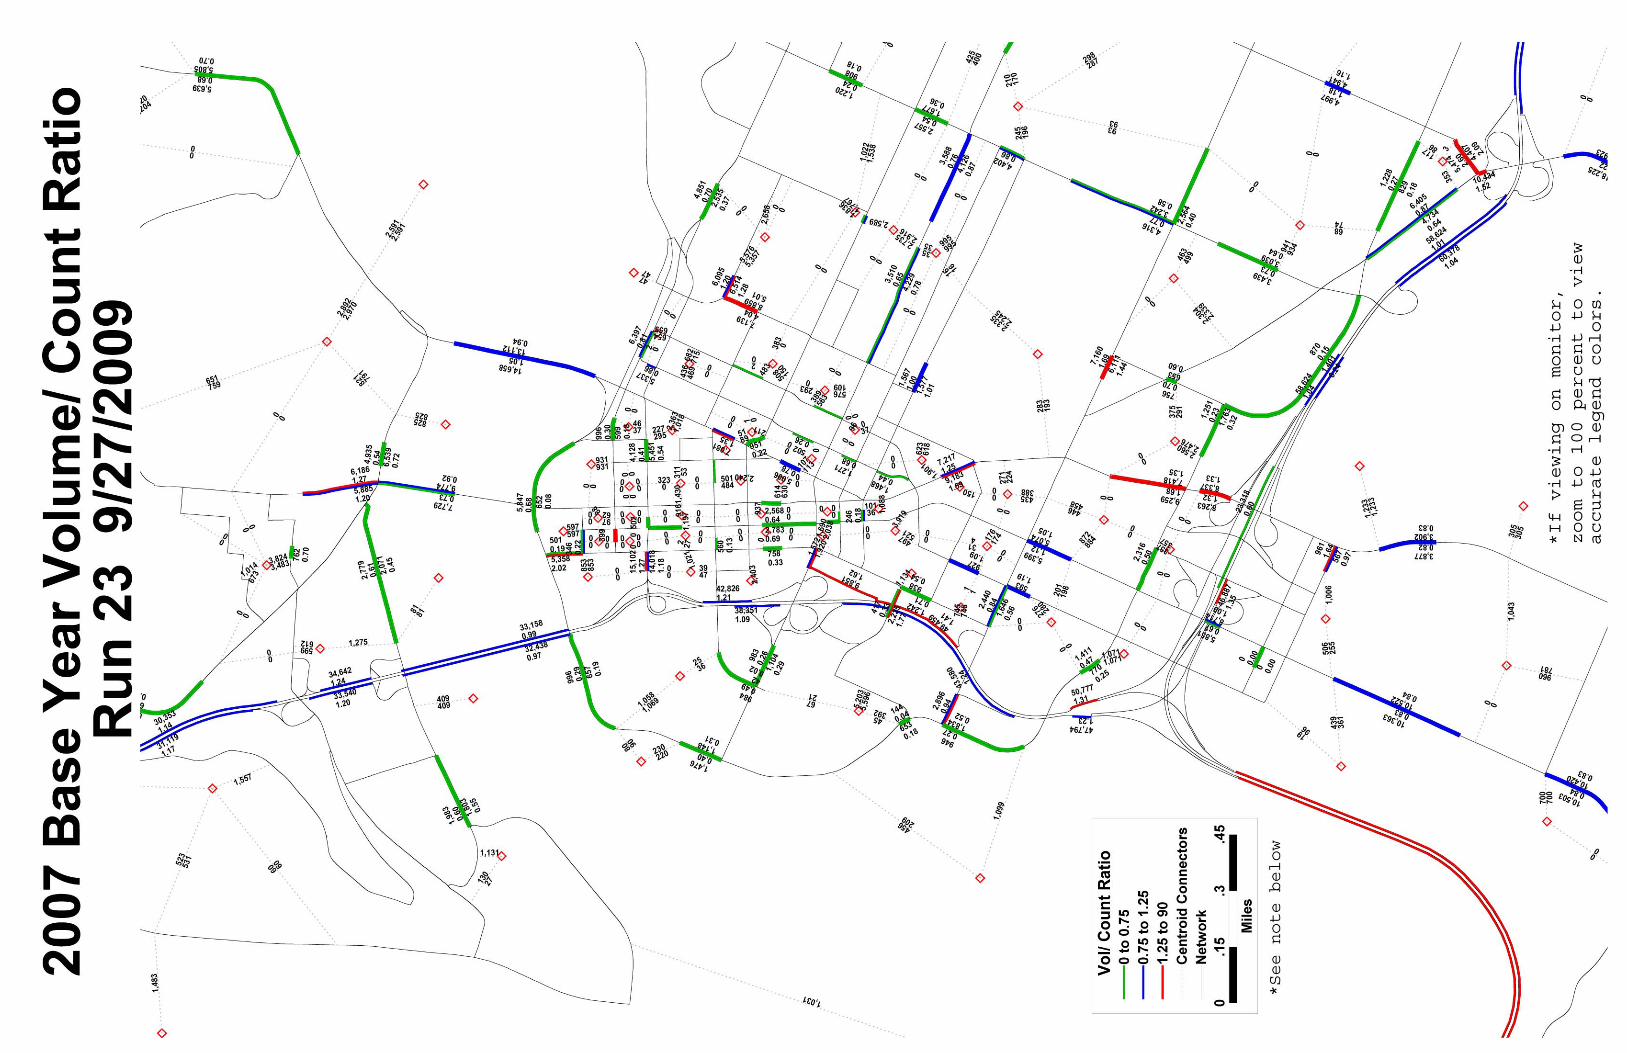


2008
Avera
ge
Obse
rved S
peed
sDu
ring A
M Pe
ak
Perio
d Alon
g Co
nges
tion
Mana
geme
nt Pla
n (CM
P)Ro
utes
20
24
61
Mile
sK39.72 / 36.83
41.18 / 37.21
Inset
1
Inset
1
MPO
Bou
ndar
y
Cou
nty
Boun
dary
Wat
er B
odie
s
2007
Mod
el Ne
twork
AM C
MP R
outes
Nor
thbo
und
and
East
boun
d D
irect
ion
Sout
hbou
nd a
ndW
estb
ound
Dire
ctio
n<
15
15.0
1 - 2
5.00
25.0
1 - 3
5.00
35.0
1 - 4
5.00
45.0
1 - 5
5.00
55.0
1 - 6
5.00
> 65
< 15
15.0
1 - 2
5.00
25.0
1 - 3
5.00
35.0
1 - 4
5.00
45.0
1 - 5
5.00
55.0
1 - 6
5.00
> 65


24
24
75
75
75
75
27
27
27
153
153
153
Ha
mil
ton
Pla
ce
Ha
mil
ton
Pla
ce
No
rth
ga
te M
all
No
rth
ga
te M
all
En
terp
ris
e S
ou
thE
nte
rpri
se
So
uth
Ch
att
an
oo
ga
Air
po
rtC
ha
tta
no
og
a A
irp
ort
Na
tio
na
l M
ilit
ary
Pa
rkN
ati
on
al
Mil
ita
ry P
ark
2007
Tran
scad
Mod
elDa
ily C
onge
sted S
peed
s
20
24
61
Mile
s
Inset
1
Inset
1
2007
Mod
el Ne
twor
kCo
nges
ted Sp
eed (
MPH)
MPO
Bou
ndar
y
Cou
nty
Boun
dary
Wat
er B
odie
s
55.0
1 - 6
5.00
< 15
.00
15.0
1 - 2
5.00
25.0
1 - 3
5.00
35.0
1 - 4
5.00
45.0
1 - 5
5.00
> 65
.00


Cha
ttano
oga
2007
MO
DE
L V
ALI
DA
TIO
N S
UM
MA
RY
Run
# 23
DA
TE:
9/27
/200
9D
escr
iptio
n:A
s for
Run
21a
but
a fe
w o
utst
andi
ng 2
007
SE is
sues
fixe
d af
ter c
onsu
latio
n w
ith Y
uen.
Som
e ve
ry sh
ort n
etw
ork
link
area
type
s and
num
ber o
f lan
es a
lso
fixed
.
Tri
p G
ener
atio
n
Com
pari
son
of T
otal
Tri
ps b
y Pu
rpos
e
Unb
alan
ced
2004
2004
2000
2000
Targ
et *
1N
ew F
DO
TPu
rpos
ePr
oduc
tions
% b
y Pr
oduc
tions
Attr
actio
nsPr
oduc
tions
% b
y Pr
oduc
tions
Nas
hvill
eM
emph
isM
ontg
omer
yK
noxv
ille
Gui
delin
es*2
Hom
e-B
ased
Wor
k24
4,72
813
.23%
111,
374
212,
113
12.7
2%16
.79%
25.1
5%16
.00%
13.0
9%18
-27%
12-2
4%37
6294
Hom
e-B
ased
Sch
ool
98,3
035.
31%
160,
925
85,0
685.
10%
11.0
2%8.
16%
47-5
4%5-
8%23
4650
Hom
e-B
ased
Sho
p18
8,09
210
.17%
124,
929
159,
420
9.56
%7.
17%
10-2
0%H
ome-
Bas
ed S
ocre
c.11
5,14
86.
22%
74,8
5592
,919
5.57
%7.
67%
9-12
%H
ome-
Bas
ed O
ther
334,
833
18.1
0%22
3,35
728
9,01
317
.33%
28.1
0%37
.72%
14-2
8%10
8421
5N
on H
ome-
Bas
ed49
2,79
026
.64%
523,
037
434,
513
26.0
6%26
.42%
18.0
0%31
.78%
22-3
1%20
-33%
*4
9136
65C
omm
erci
al V
ehic
les
136,
524
7.38
%13
6,52
416
3,33
09.
80%
8.79
%11
.00%
Ligh
t-Tru
ck99
,457
72.8
5%99
,435
120,
286
73.6
5%M
ediu
m-T
ruck
27,0
6019
.82%
27,0
6431
,580
19.3
4%H
eavy
-Tru
ck10
,007
7.33
%10
,010
11,4
647.
02%
Inte
rnal
-Ext
erna
l20
5,03
611
.08%
237,
104
230,
906
13.8
5%8.
82%
13.0
0%8.
06%
2315
69Ex
tern
al-E
xter
nal
34,3
911.
86%
30,0
253.
00%
1.19
%34
278
SOV
#DIV
/0!
0.00
%H
OV
#DIV
/0!
0.00
%Li
ght-T
ruck
#DIV
/0!
0.00
%H
eavy
-Tru
ck#D
IV/0
!0.
00%
TOTA
L1,
849,
845
100.
00%
1,59
2,10
51,
667,
282
100.
00%
100.
00%
100.
00%
100.
00%
2874
671
Agg
rega
te T
rip
Rat
es &
Soc
ioec
onom
ic S
umm
arie
s
2007
2000
Cha
ttano
oga
2007
(Tra
nsC
AD
)C
hatta
noog
a (T
rans
CA
D)
FHW
A
Targ
et *
3
20.8
9%
39.0
0%39
.18%
2007
2000
2002
2004
2000
2000
2001
TDO
TN
ew F
DO
TFH
WA
Uni
t of M
easu
reN
ashv
ille
Mem
phis
Mon
tgom
ery*
5K
noxv
ille
Sava
nnah
Targ
et*1
Gui
delin
es*2
Targ
et*3
Pers
ons p
er H
ouse
hold
2.38
2.50
2.56
2.65
2.68
2.45
2.53
n/a
2.0-
2.7
n/a
Inte
rnal
Trip
s per
Hou
seho
ld9.
009.
448.
598.
208.
648.
407.
668.
5-10
.58.
0-10
.08.
0-14
.0In
tern
al T
rips p
er P
erso
n3.
783.
783.
363.
093.
233.
433.
03n/
a3.
3-4.
03.
5-4.
0H
BW
Trip
s per
Em
ploy
ee1.
120.
740.
991.
710.
755.
701.
42n/
an/
an/
aEm
ploy
ees p
er P
erso
n0.
510.
730.
690.
510.
660.
600.
55n/
an/
an/
aTo
tal P
opul
atio
n42
5,66
639
5,06
11,
206,
665
1,10
3,53
929
9,18
076
1,34
623
2,01
1To
tal H
ouse
hold
s17
8,90
515
8,05
547
1,29
841
6,83
011
1,79
331
0,41
291
,834
Tota
l Em
ploy
men
t21
8,61
228
7,91
883
3,86
253
3,37
819
6,79
945
7,79
612
7,00
0
Pers
on T
rips
/ H
ouse
hold
Reg
ion
Yea
rPe
rson
Trip
/HH
Cha
ttano
oga
(Tra
nsC
AD
)20
079.
00C
hatta
noog
a (T
rans
CA
D)
2000
9.44
Cha
ttano
oga
(MIN
UTP
)20
007.
44*1 T
DO
T Ta
rget
8.50
to 1
0.50
*2 New
FD
OT
Gui
delin
es8.
00 to
10.
00
*2 FH
WA
Tar
get
n/a
Cha
ttano
oga
(Tra
nsC
AD
)

Run
# 23
TEM
PLA
TEPa
ge 2
of 4
DA
TE:
9/27
/200
9T
rip
Dis
trib
utio
n
Ave
rage
Tri
p Le
ngth
(in
Min
utes
) 2007
2000
2000
2000
2000
2002
2000
2004
2000
2001
TDO
TN
ew F
DO
TFH
WA
Purp
ose
C
hatta
noog
a (T
rans
CA
D)
Cha
ttano
oga
(Tra
nsC
AD
)C
TPP
(Ham
ilton
)C
TPP
(Cat
oosa
)C
TPP
(Wal
ker)
Nas
hvill
eK
noxv
ille
*6M
emph
isM
ontg
omer
ySa
vann
ah *
7Ta
rget
*1G
uide
lines
*2Ta
rget
*3
Hom
e-B
ased
Wor
k18
.26
16.3
621
.20
23.7
026
.50
19.2
612
.05
19.0
019
.90
19.8
012
-35
11.2
-35.
4H
ome-
Bas
ed S
choo
l13
.85
14.4
8n/
an/
an/
an/
a6.
82n/
an/
an/
an/
a8.
9-15
.9H
ome-
Bas
ed S
hop
12.8
413
.78
n/a
n/a
n/a
n/a
n/a
12.3
0n/
a15
.10
9-19
8.6-
18.7
Hom
e-B
ased
Soc
rec.
13.5
511
.38
n/a
n/a
n/a
n/a
n/a
13.9
0n/
an/
a11
-19
Hom
e-B
ased
Oth
er12
.44
14.4
1n/
an/
an/
a11
.48
7.98
13.4
017
.40
15.4
08-
20N
on H
ome-
Bas
ed14
.18
15.4
4n/
an/
an/
a12
.36
7.14
13.2
016
.70
13.4
06-
198.
1-17
.1C
omm
erci
al V
ehic
les
17.8
819
.64
n/a
n/a
n/a
17.2
015
.80
n/a
n/a
Ligh
t-Tru
ck17
.78
18.7
9M
ediu
m-T
ruck
17.2
017
.95
Hea
vy-T
ruck
20.7
522
.17
Inte
rnal
-Ext
erna
l37
.38
41.0
4n/
an/
an/
a27
.80
19.9
526
-58
n/a
TOTA
L14
.53
18.6
8n/
an/
an/
a14
.37
8.50
14.3
619
.80
16.5
8n/
an/
a
Com
men
ts:
CTP
P tr
ip le
ngth
s lon
ger s
ince
they
wer
e ba
sed
on p
eak
peri
od a
nd T
rans
CA
D m
odel
is d
aily
Intr
azon
al T
rave
l20
0720
00
Two-
Dig
itTD
OT
New
FD
OT
FHW
A
Pur p
ose
Tota
lTrip
sIn
trazo
nal
Trip
s%
Intra
zona
lTo
talT
rips
Intra
zona
l Tr
ips
%In
trazo
nal
Targ
et*1
Gui
delin
es*2
Targ
et*3
10.4
-17.
3
Cha
ttano
oga
2007
(Tra
nsC
AD
)C
hatta
noog
a 20
00 (T
rans
CA
D)
Two-
Dig
it
pTo
tal T
rips
Trip
s%
Intra
zona
lTo
tal T
rips
Trip
s%
Intra
zona
lH
ome-
Bas
ed W
ork
244,
728
4,73
01.
93%
212,
113
14,9
317.
04%
1-4%
Hom
e-B
ased
Sch
ool
98,3
036,
517
6.63
%85
,068
9,45
911
.12%
10-1
2%H
ome-
Bas
ed S
hop
188,
092
23,5
3412
.51%
159,
420
15,8
289.
93%
3-9%
Hom
e-B
ased
Soc
rec.
115,
148
13,7
9511
.98%
92,9
1919
,585
21.0
8%4-
10%
Hom
e-B
ased
Oth
er33
4,83
343
,379
12.9
6%28
9,01
332
,266
11.1
6%3-
7%N
on H
ome-
Bas
ed49
2,79
047
,349
9.61
%43
4,51
334
,853
8.02
%5-
9%C
omm
erci
al V
ehic
les
136,
524
3,78
62.
77%
163,
330
4,99
53.
06%
Ligh
t-Tru
ck99
,457
2,72
32.
74%
120,
286
3,55
02.
95%
Med
ium
-Tru
ck27
,060
936
3.46
%31
,580
1,30
94.
15%
Hea
vy-T
ruck
10,0
0712
71.
27%
11,4
6413
61.
19%
TOTA
L1,
610,
418
143,
090
8.89
%1,
436,
376
131,
917
9.18
%3-
5%
Com
men
ts:
Smal
ler p
erce
ntag
e of
HB
W in
traz
onal
trip
s due
to sm
alle
r zon
e si
zes (
zone
split
s)

Run
# 23
TEM
PLA
TEPa
ge 3
of 4
DA
TE:
9/27
/200
9T
raff
ic A
ssig
nmen
t (1s
t of 2
pag
es)
Dai
ly T
raff
ic o
n Sc
reen
lines
TDO
TN
ewC
hatt
anoo
ga 2
007
2000
Acc
urac
yFD
OT
FHW
ASc
reen
line
Tota
l Vol
ume
Tota
l Cou
ntV
ol/C
ount
Rat
ioV
ol/C
ount
Rat
ioLe
vel *
1 G
uide
lines
*2 * 8
Ta
rget
*3
134
5,07
234
3,47
21.
000.
971
Cen
tral
City
Par
tial C
ordo
n+/
- 10%
+/- 1
0%+/
- 10-
20%
220
0,10
119
8,57
61.
010.
942
Ten
ness
ee R
iver
Cro
ssin
g+/
- 10%
+/- 1
0%+/
- 10-
20%
358
,310
67,0
590.
880.
973
Nor
th-S
outh
Dow
ntow
n+/
- 10%
+/- 1
0%+/
- 10-
20%
415
7,69
715
8,85
60.
990.
914
Eas
t-Wes
t Dow
ntow
n+/
- 10%
+/- 1
0%+/
- 10-
20%
516
1,84
519
8,51
40.
820.
905
Mis
sion
ary
Ridg
e+/
- 10%
+/- 1
0%+/
- 10-
20%
618
6,88
220
2,07
00.
930.
996
Sou
th C
hick
amau
ga C
reek
+/- 1
0%+/
- 10%
+/- 1
0-20
%7
86,8
1079
,242
1.10
1.09
7 N
orth
-Sou
th N
orth
Ham
ilton
Co.
+/- 1
0%+/
- 10%
+/- 1
0-20
%8
79,8
9187
,602
0.91
1.06
8 R
ingg
old
+/- 1
0%+/
- 10%
+/- 1
0-20
%9
335,
995
316,
594
1.06
1.02
9 T
N/G
A St
ate
Line
+/- 1
0%+/
- 10%
+/- 1
0-20
%10
298,
244
298,
668
1.00
1.00
10 E
xter
nal C
ordo
n Li
ne+/
- 10%
+/- 1
%+/
- 10-
20%
TDO
T N
ew F
DO
TFH
WA
Faci
lity
Type
Vol
umes
Ove
r C
ount
s%
Diff
eren
ceV
olum
es O
ver
Cou
nts
% D
iffer
ence
Acc
urac
y Le
vel *
1 G
uide
lines
*2 Ta
rget
*3
1In
ters
tate
1.02
2%0.
98-1
.6+/
- 7%
+/- 5
% (+
/- 6%
)+/
- 7%
2Ex
pres
sway
1.04
4%0.
94-5
.6+/
- 7%
+/- 5
% (+
/- 6%
)+/
- 7%
3Pr
inci
pal A
rteria
l Div
ided
0.98
-2%
0.98
-2.1
+/- 1
0%+/
- 7%
(+/-
10%
)+/
- 10%
4Pr
inci
pal A
rteria
l Und
ivid
ed0.
86-1
4%0.
94-6
.1+/
- 10%
+/- 7
% (+
/- 10
%)
+/- 1
0%5
Min
or A
rteria
l0.
80-2
0%0.
88-1
2+/
- 15%
n/a
+/- 1
5%6
Col
lect
or0.
98-2
%0.
98-2
.2+/
- 25%
+/- 1
0% (+
/- 15
%)
+/- 2
5%7
Ram
p0.
99-1
%n/
an/
an/
a8
One
-Way
0.49
-51%
0.71
-29.
1n/
a+/
- 15%
(+/-
20%
)n/
aA
rea
Type
1C
BD
0.69
-31%
0.88
-11.
82
CB
D F
ringe
0.97
-3%
0.92
-8.2
3R
esid
entia
l 0.
92-8
%0.
96-4
.04
OB
D0.
95-5
%0.
92-8
.45
Rur
al
1.07
7%1.
109.
76
Urb
an U
ndev
elop
ed1.
044%
1.02
1.9
7M
ount
aino
us1.
099%
0.95
-5.0
8In
dust
rial
090
10%
2000
Cha
ttan
ooga
200
7V
olum
es O
ver C
ount
s
8In
dust
rial
0.90
-10%
Num
ber
10.
88-1
2%0.
93-6
.8of
Lan
es2
0.99
-1%
0.98
-1.6
By
Dire
ctio
n3
0.98
-2%
0.95
-5.3
41.
033%
0.92
-7.8
5To
tal
0.96
-4%
0.95
-4.7
Perc
ent D
iffer
ence
for D
aily
Vol
umes
(cal
cula
ted
for L
inks
with
Cou
nts)
Cha
ttano
oga
2007
TDO
TN
ew F
DO
TFH
WA
AA
DT
Tran
sCA
DTa
rget
*1
*9G
uide
lines
*2 Ta
rget
*3
<1,0
0048
.90%
60%
60%
1,00
0 - 2
,500
19.2
0%47
%47
%2,
500
- 5,0
00-2
.80%
36%
36%
5,00
0 - 1
0,00
0-1
0.30
%29
%29
%10
,000
- 25
,000
-8.9
0%25
%20
-30%
*10
25%
25,0
00 -
50,0
001.
50%
22%
15-2
5% *
1022
%>5
0,00
0-5
.90%
21%
5-20
% *
1121
%
Coe
ffic
ient
of D
eter
min
atio
n R
2 (C
orre
latio
n C
oeff
icie
nt o
f Act
ual C
ount
s and
Mod
el V
olum
es)
R2
0.95
*1 TD
OT
Targ
et: R
2 mor
e th
an 0
.88
*2 New
FD
OT
Targ
et: N
/A*3 F
HW
A T
arge
t: R
2 mor
e th
an 0
.88
25-5
0%
0
1000
0
2000
0
3000
0
4000
0
5000
0
6000
0
7000
0
010
000
2000
030
000
4000
050
000
6000
070
000
Assigned Volume
2007
AAD
T
Cor
rela
tion

Run
# 23
TEM
PLA
TEPa
ge 4
of 4
DA
TE:
9/27
/200
9T
raff
ic A
ssig
nmen
t (2n
d of
2 p
ages
)
Roo
t Mea
n Sq
uare
Err
or
TDO
TFH
WA
Foot
note
s
Cou
nt R
ange
Tran
sCA
DTr
ansC
AD
Targ
et*1
Targ
et*3
Kno
xvill
eM
emph
isN
ashv
ille
*1 U
TCTR
, Min
imum
Tra
vel D
eman
d M
odel
Cal
ibra
tion
and
Valid
atio
n G
uide
lines
For
Sta
te o
f Ten
ness
ee
0-4,
999
83.7
0%73
.10%
115.
7645
-100
83.8
0%*2
FSU
TMS-
Cube
Fra
mew
ork
Phas
e II:
Mod
el Ca
libra
tion
and
Val
idat
ion
Stan
dard
s Fin
al R
epor
t, Ju
ne 2
008
5,00
0-9,
999
46.3
0%33
.60%
43.1
435
-45
35.3
0%*
3 F
HW
A M
odel
Val
idat
ion
and
Reas
onab
lene
ss C
heck
ing
Man
ual
10,0
00-1
4,99
936
.40%
18.1
0%28
.27
27-3
5*
4 N
HB
incl
udes
com
bine
d pu
rpos
es fo
r NH
B W
ork
and
NH
B N
onw
ork,
whe
re a
ppro
pria
te.
15,0
00-1
9,99
925
-30
*5 O
nly
vehi
cle t
rips a
vaila
ble f
rom
Mon
tgom
ery
Are
a M
PO (2
005)
Mon
tgom
ery
Stud
y A
rea
2030
LRT
P.20
,000
-29,
999
21.7
0%15
-27
*6
Ave
rage
Tri
p Le
ngth
for N
HB
for K
noxv
ile w
as o
btai
ned
by a
vera
ging
7.8
8(N
HB
Wor
k) a
nd 6
.40
(NH
B O
ther
s).
30,0
00-3
9,99
916
.90%
*7
Ave
rage
Tri
p Le
ngth
for I
nter
nal-E
xter
nal f
or S
avan
nah
was
obt
aine
d by
ave
ragi
ng 1
8.4
(IE
Truc
k) a
nd 2
1.5
(IE
Pass
enge
r Car
s).
40,0
00-4
9,99
94.
40%
*8 F
DO
T re
com
men
ds +
/- 5%
targ
et fo
r scr
eenl
ines
with
gre
athe
r tha
n 70
,000
AA
DT.
50,0
00-5
9,99
97.
20%
10-2
0*
9 T
DO
T gu
idel
ines
(*1
) sug
gest
FH
WA
targ
et sh
ould
be
sele
cted
whe
re b
oth
of F
HW
A an
d M
ichi
gan
DO
T cr
iteri
a ar
e av
aila
ble
(TD
OT
guid
elin
es, p
age1
5).
60,0
00-6
9,99
9
FH
WA
and
MD
OT
targ
ets w
ere
switc
hed
in T
able
3 o
f TD
OT
guid
elin
es (p
age
12),
thus
the
orig
inal
sour
ce o
f FH
WA
Che
ckin
g M
anua
l (*
3) w
as re
ferr
ed fo
r con
firm
atio
n.
70,0
00-7
9,99
9*10
Sum
mar
ized
from
20-
30%
for A
AD
T 10
,000
- 30
,000
and
15-
25%
for A
AD
T 30
,000
-50,
000
(FD
OT)
79,9
99-8
9,99
9*11
Sum
mar
ized
from
10-
20%
for A
AD
T 50
,000
- 65
,000
, 5-1
5% fo
r AA
DT
65,0
00-7
5,00
0, a
nd 5
-10%
for A
AD
T 75
,000
+ (F
DO
T).
Ove
rall
34.6
0%23
.40%
30.0
032
-39
31.9
6%30
.00%
27.7
0%*
12 H
PMS
stan
ds fo
r Hig
hway
Per
form
ance
Mon
itori
ng S
yste
m.
*13
Ta
rget
s for
med
ium
urb
an a
re si
ze (2
00k
- 1M
) was
cho
sen
for C
hatta
noog
a Re
gion
.
Veh
icle
Mile
s Tra
vele
d*
14 VM
T re
pres
ents
faci
litie
s gre
ater
than
loca
l.
Reg
ion
Yea
rV
MT
HPM
S*12
Cha
ttano
oga
(Tra
nsC
AD
)20
0713
,458
,933
13,2
56,1
38N
ashv
ille
(Tra
nsC
AD
)20
0431
,796
,875
33,3
16,4
12M
emph
is (T
rans
CA
D)
2004
26,8
81,5
5026
,980
,700
Kno
xvill
e (T
rans
CA
D)
2000
24,1
59,5
07n/
aM
ontg
omer
y (T
ranp
lan)
2000
8,29
6,86
6n/
aSa
vann
ah (T
P+)
2001
5,69
7,42
35,
743,
828
TDO
T Ta
rget
*1
FHW
A T
arge
t *3
(sam
e as
FD
OT)
VM
T by
Mod
el F
acili
ty T
ype
Faci
lity
Type
Mod
el V
MT
1In
ters
tate
4,22
8,04
131
.4%
(all
the
sam
e) *
13
3338
%
New
FD
OT
Gui
ldel
ines
*2TD
OT
Targ
et *
1
Cha
ttano
oga
2007
Cha
ttano
oga
2000
n/a
12.1
0%
25.4
0%
15-2
5
10-1
9
New
FD
OT
Gui
delin
es
&
2
VM
T / H
HV
MT
/ Per
son
31.6
26.4
24.4
67.5
75.2
+/- 5
% d
iffer
ence
b/w
mod
el a
nd H
PMS
estim
ate
64.5
74.2
77.8
Cha
ttan
ooga
200
7
62.0
FHW
A T
arge
t *3
25.3
8
30.2
5
19.2
015
.50%
New
FD
OT
Gui
ldel
ines
*230
-40
for s
mal
l urb
an a
rea
/
40-6
0 fo
r lar
ge u
rban
are
a
29.5
0%
23.3
0%
17.8
0%
14.5
0%
24.6
10-1
6 fo
r sm
all u
rban
are
a /
17
-24
for l
arge
urb
an a
rea
31.7
28.0
,,
2Ex
pres
sway
1,49
6,81
811
.1%
3Pr
inci
pal A
rteria
l Div
ide
2,06
7,22
415
.4%
4Pr
inci
pal A
rteria
l Und
iv83
5,23
96.
2%5
Min
or A
rteria
l1,
384,
961
10.3
%6
Col
lect
or1,
465,
718
10.9
%7
Ram
p21
5,11
88
One
-Way
16,6
7290
Exte
rnal
Con
nect
ors
921,
730
99C
entro
id C
onne
ctor
s82
7,41
2To
tal
13,4
58,9
33In
clud
ing
exte
rnal
cen
troid
con
12,5
37,2
02Ex
clud
ing
exte
rnal
cen
troid
con
nect
ors
VM
T by
Fun
ctio
nal C
lass
ifica
tion
HPM
S V
MT
Func
Cla
ss V
MT
% b
y C
lass
1 &
11
Inte
rsta
te4,
060,
922
4,93
1,26
630
.6%
12Fr
eew
ay o
r Exp
ress
way
1,21
3,03
492
5,61
89.
2%2
& 1
4Pr
inci
pal A
rteria
l2,
408,
304
2,68
2,98
518
.2%
6 &
16
Min
or A
rteria
l3,
141,
926
2,73
6,52
923
.7%
7, 8
& 1
7C
olle
ctor
806,
997
969,
686
6.1%
9 &
19
Loca
l1,
624,
955
986,
914
12.3
%13
,256
,138
13,2
32,9
98O
vera
ll M
odel
VM
T/H
PMS
VM
T0.
98In
clud
ing
exte
rnal
cen
troid
con
nect
ors
1.06
Excl
udin
g ex
tern
al c
entro
id c
onne
ctor
sG
ener
al C
omm
ents
/Con
clus
ions
:O
vera
ll, re
ason
able
mat
ch b
etw
een
Tota
l Mod
el a
nd H
PMS
VM
T. M
odel
VM
T by
FT
diff
ers f
rom
Mod
elV
MT
by F
unc.
Cla
ss d
ue to
exc
lusi
on o
f ram
ps e
tc.
33-3
8%
27-3
3%
n/a
18-2
2%8-
12%
n/a
HPM
S C
odes
/ Fu
nctio
nal C
lass
Cha
ttan
ooga
200
7FH
WA
Tar
get *
3
(all
the
sam
e) *
13
n/a
n/a
27-3
3%18
-22%
TDO
T Ta
rget
*1
New
FD
OT
Gui
ldel
ines
*2
33-3
8%
8-12
%n/
a

Chattanooga TPO 2035 LRTP – Volume 3: Travel Demand Model Documentation & User’s Guide
Appendix E: 2007 Volume-to-Count Ratios

Chattanooga TPO 2035 LRTP – Volume 3: Travel Demand Model Documentation & User’s Guide
This Page Intentionally Left Blank


Chattanooga TPO 2035 LRTP – Volume 3: Travel Demand Model Documentation & User’s Guide
Appendix F: User’s Guide

Chattanooga TPO 2035 LRTP – Volume 3: Travel Demand Model Documentation & User’s Guide
This Page Intentionally Left Blank
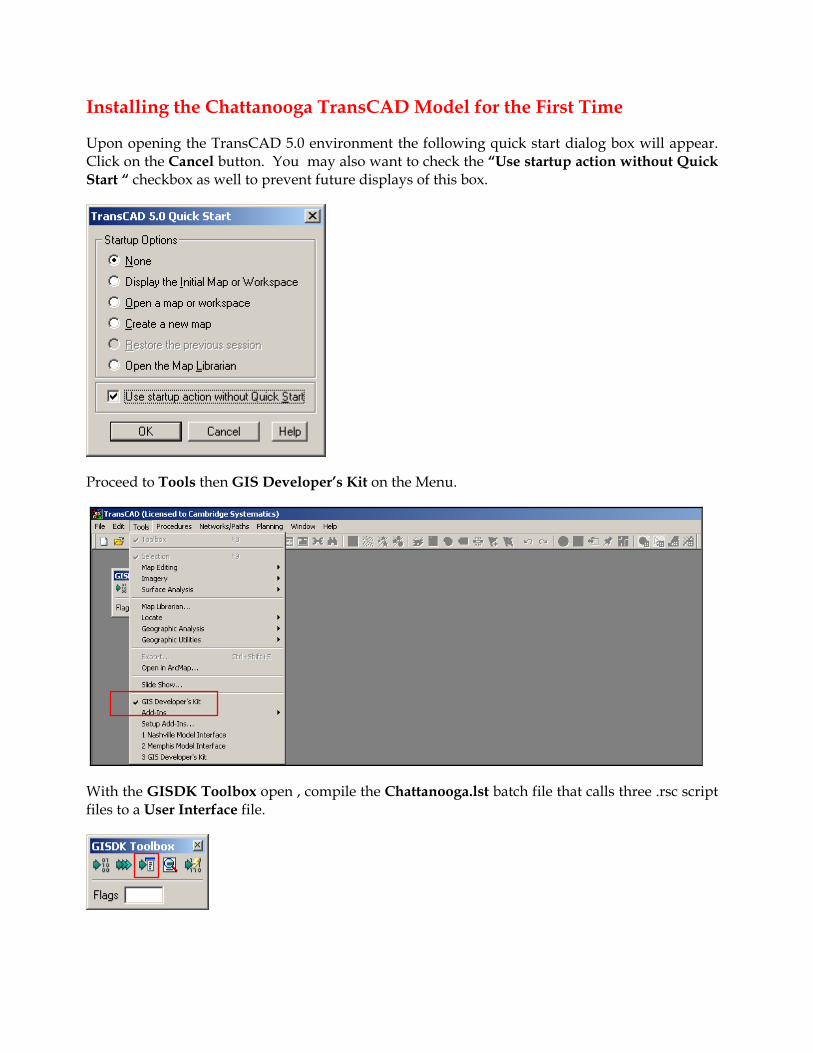
Installing the Chattanooga TransCAD Model for the First Time
Upon opening the TransCAD 5.0 environment the following quick start dialog box will appear. Click on the Cancel button. You may also want to check the “Use startup action without Quick Start “ checkbox as well to prevent future displays of this box.
Proceed to Tools then GIS Developer’s Kit on the Menu.
With the GISDK Toolbox open , compile the Chattanooga.lst batch file that calls three .rsc script files to a User Interface file.
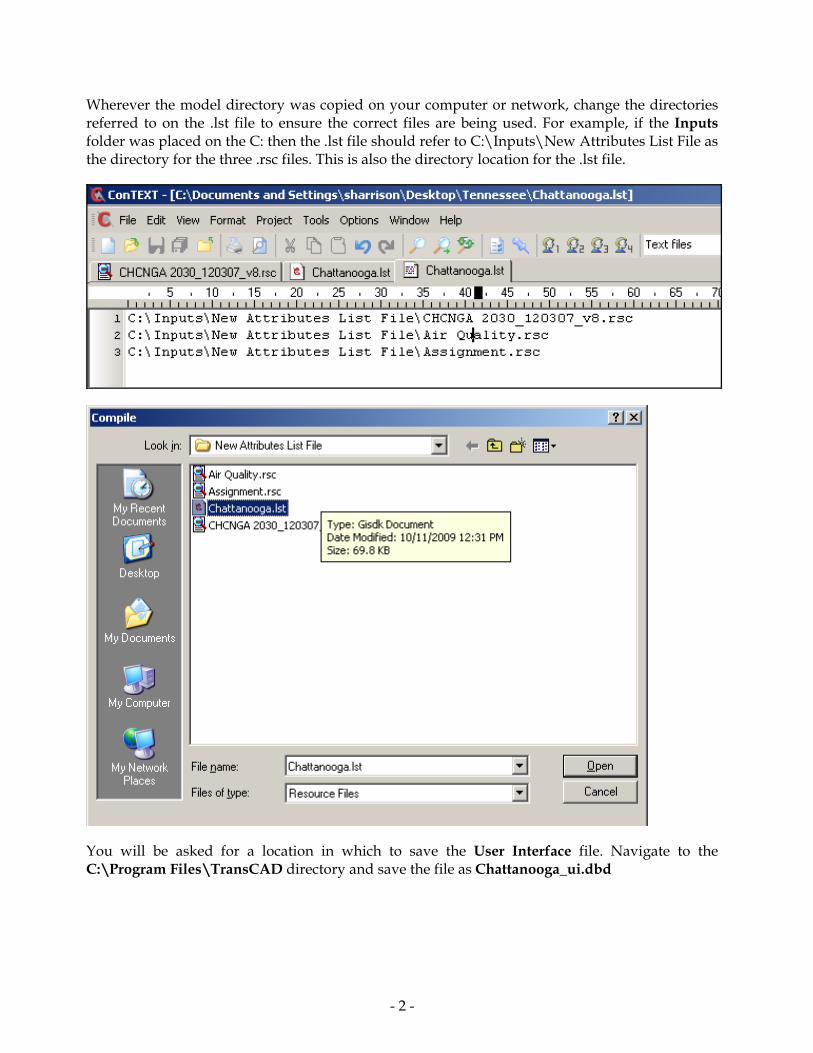
- 2 -
Wherever the model directory was copied on your computer or network, change the directories referred to on the .lst file to ensure the correct files are being used. For example, if the Inputs folder was placed on the C: then the .lst file should refer to C:\Inputs\New Attributes List File as the directory for the three .rsc files. This is also the directory location for the .lst file.
You will be asked for a location in which to save the User Interface file. Navigate to the C:\Program Files\TransCAD directory and save the file as Chattanooga_ui.dbd

- 3 -
Once the User interface file has been created, proceed to Tools then Setup Add-Ins to bring up the respective dialog box. Select Add and proceed to enter a description for the Chattanooga Model. Any meaningful description will suffice. A name like “Chattanooga Model Interface” will do. Select the Dialog Box radio button. Enter the value “Chattanooga” under the Name list box. This name must match exactly the described dialog box name in the script file. Browse to the stored location of the compiled User Interface file (C:\Program Files\TransCAD) and open the Chattanooga_ui.dbd. Click OK.

- 4 -
The model has now been set up to run on the User’s machine. Subsequent model runs will not require the setup of the Chattanooga User Interface Add-In.
To run the model, go to Tools then click on “Chattanooga Model Interface” and click OK. The model interface dialog box will now be displayed.

- 5 -
Click on Reset Directories to see the input files for the Chattanooga model. The inputs are now ready to be selected.

- 6 -
To run the 2007 Base Year for example, enter the values as illustrated, remembering to use the base model directory to which you copied all the model files.
The LRTP_Master_Network.dbd file is a master network that includes all model network years. It is the only file that should be selected within the Network Database window.
The TAZ.dbd file is a master socioeconomic data file that includes all socioeconomic data years and should be the only file selected within the TAZ Geography window.
The SPGEN.bin file is a master special generators file that includes special generators for each model year. It is the only file that should be selected within the Special Generators window.
Select the desired socioeconomic data year from the SocEc Year window. Note that socioeconomic data has been developed for 2002, 2007, 2009, 2015, 2025, and 2035. Any interim years are automatically interpolated using the interface.
The Chatt_Turn_Penalty.bin files is a master turn penalty file that includes turn penalties for all model network years. It is the only file that should be selected within the Turn Penalty window.
Select the desired transportation network from the Network Scenario window. The following network scenarios are available:
o 2002 AQ – Used for air quality baseline emissions.
o 2007 Base – Base year validated model.

- 7 -
o 2009 Interim – Used to compare with emissions in the State Implementation Plan (SIP) for PM2.5.
o 2011 E+C (Existing-Plus-Committed) – Used to determine what congestion would be if no further transportation improvements were funded above and beyond what currently is in the FY ‘08-‘11 Transportation Improvement Program (TIP). Nonexempt (new road or widening) projects expected to complete construction by the end of calendar year 2011 are included in the E+C transportation network.
o 2015 FFP (Financially Feasible Plan or Fiscally Constrained LRTP (Tier 1)) – Includes all nonexempt projects funded for construction prior to or during year 2015 (Tier 1) of the fiscally constrained LRTP.
o 2025 FFP (Financially Feasible Plan or Fiscally Constrained LRTP (Tier 2)) – Includes all nonexempt projects funded for construction prior to or during year 2025 (Tier 2) of the fiscally constrained LRTP.
o 2035 FFP (Financially Feasible Plan or Fiscally Constrained LRTP (Tier 3)) – Includes all nonexempt projects funded for construction prior to or during year 2035 (Tier 3) of the fiscally constrained LRTP.
If the user chooses to run the time-of-day assignment to get AM and/or PM peak hour volumes (time-of-day factors derived from 2002 Chattanooga Household Travel Survey are applied AFTER assignment), the AM Assignment and/or PM Assignment boxes should be checked.
Once all the desired inputs have been selected, the model can be run all at once by clicking on Run All (Gen Asgn). This runs the general assignment and does not account for HOV or truck-only lanes. None of the model networks in the fiscally constrained LRTP include projects for HOV or truck-only lanes and thus, General Assignment can be run on all model networks listed above. Should a model user decide to test HOV or truck-only lanes, the user should select Run All (Truck Asgn) or Run All (HOV Asgn).
If the user wants to test each individual model step, the user should click on each individual model step in the following sequence:
• Highway Skims • Trip Generation • Trip Distribution • Mode Split • General Highway Assignment (if no HOV or truck-only lanes) • Truck Only Assignment (if testing truck lanes) • HOV Only Assignment (if testing HOV lanes)
Once the model is run, the assigned volumes are stored in the master network. See the attached attribute list for a description of each network attribute.


Chattanooga Year 2007 Model
DATA DICTIONARY
Developed as Part of 2035 LRTP Update

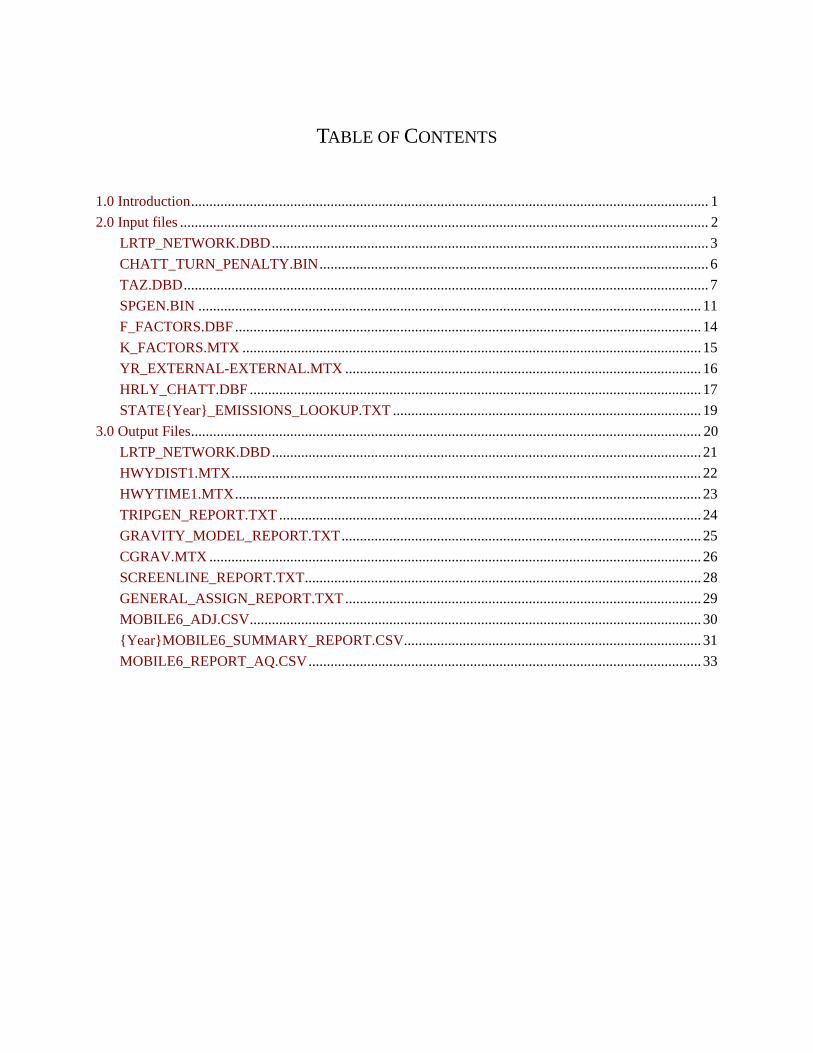
TABLE OF CONTENTS
1.0 Introduction ............................................................................................................................................. 1 2.0 Input files ................................................................................................................................................ 2
LRTP_NETWORK.DBD ....................................................................................................................... 3 CHATT_TURN_PENALTY.BIN .......................................................................................................... 6 TAZ.DBD ............................................................................................................................................... 7 SPGEN.BIN ......................................................................................................................................... 11 F_FACTORS.DBF ............................................................................................................................... 14 K_FACTORS.MTX ............................................................................................................................. 15 YR_EXTERNAL-EXTERNAL.MTX ................................................................................................. 16 HRLY_CHATT.DBF ........................................................................................................................... 17 STATE{Year}_EMISSIONS_LOOKUP.TXT .................................................................................... 19
3.0 Output Files ........................................................................................................................................... 20 LRTP_NETWORK.DBD ..................................................................................................................... 21 HWYDIST1.MTX ................................................................................................................................ 22 HWYTIME1.MTX ............................................................................................................................... 23 TRIPGEN_REPORT.TXT ................................................................................................................... 24 GRAVITY_MODEL_REPORT.TXT .................................................................................................. 25 CGRAV.MTX ...................................................................................................................................... 26 SCREENLINE_REPORT.TXT ............................................................................................................ 28 GENERAL_ASSIGN_REPORT.TXT ................................................................................................. 29 MOBILE6_ADJ.CSV ........................................................................................................................... 30 {Year}MOBILE6_SUMMARY_REPORT.CSV ................................................................................. 31 MOBILE6_REPORT_AQ.CSV ........................................................................................................... 33


1
1.0 Introduction The purpose of this document is to describe the input and output files for the Chattanooga 2007 TransCAD model updated as part of the 2035 Long Range Transportation Plan. This data dictionary defines the input network, socioeconomic data, and other files and attributes required to run the Chattanooga model. Attributes within each of the output files are also defined. The following are the file formats that are used for inputs, outputs and script compilation. • CSV – Tabular format readable in Excel (comma separated values). • DBF – Database format readable by a variety of software programs. • MTX – TransCAD format matrix file in which several sub matrix cores can be placed. • NET – TransCAD binary network database. • TXT – ASCII text file. • RSC – TransCAD GISDK text script file. • LST – TransCAD GISDK text list batch run file. • DBD – TransCAD geographic file. • BIN – TransCAD binary data file.
Files are listed in order by: • HIGHWAY SKIMS - Highway network and path building. • TRIP GENERATION – Trip generation and external-external trips. • TRIP DISTRIBUTION – Trip distribution and congested skims. • MODE SPLIT – Mode choice and auto occupancy. • HIGHWAY ASSIGNMENT – Highway assignment.

2
2.0 Input files The following are the input files used to run the Chattanooga model.They represent the zone data, network data, and required files in trip distribution, such as K-factor matrices, friction factors, daily adjustment factors, and external-external matrices. Additionally, the Mobile6.2 emissions factor lookup files are necessary to calculate emissions in the air quality post processor .

3
LRTP_NETWORK.DBD FILE TYPE: TransCAD Geographic File DBD MODEL STEP: HIGHWAY SKIMS PRIMARY FUNCTION: Line geographic file used to create TransCAD model network. DATA FORMAT: Abbreviations: yr = year time# = peak hour (AM or PM) VARIABLE (FIELD) NAME DESCRIPTION Inputs: * LENGTH Link Length in miles. * DIR One way or two-way link flag. * COUNTY Link County.
* STATE Link State. * AB_LNyr Number of lanes in AB direction for year and scenario if applicable (i.e. FFP =
financially feasible plan, EC = Existing-Plus-Committed).
* BA_LNyr Number of lanes in BA direction for year and
scenario if applicable (i.e. FFP = financially feasible plan, EC = Existing-Plus-Committed).
* TOT_LNyr Total lanes for year and scenario if applicable (i.e. FFP = financially feasible plan, EC = Existing-Plus-Committed).
* FT_yr Facility type for year and scenario if applicable (i.e. FFP = financially feasible plan, EC = Existing-Plus-Committed).
* AT_yr Area type for year and scenario if applicable (i.e. FFP = financially feasible plan, EC = Existing-Plus-Committed).
. * Added Road Road added in 2007 model network compared to 2000. * Screenline Screenline flag.

4
* AB/BA_CNT_yr Directional link counts for 2007, 2008 or 2009. * SRCE Source of count data.
* HPMS_FCyr HPMS functional class for 1990, 2000 and 2007 * HOV_Only_Lane Flag to indicate link is an exclusive HOV
lane. * Truck_Only_Lane Flag to indicate link is an exclusive truck
lane. * Exec_Area_Type Working area type field populated
depending on scenario year specified. Any edits will be overwritten when the model is executed.
* Exec_Facility_Type Working facility type field populated depending on scenario year specified. Any
edits will be overwritten when the model is executed.
* Exec_AB_Lanes Working AB direction lane field populated depending on scenario year specified. Any
edits will be overwritten when the model is executed.
* Exec_BA_Lanes Working BA direction lane field populated depending on scenario year specified. Any
edits will be overwritten when the model is executed.
* yr_AADT Annual average daily traffic (2007, 2008 or 2009). * year_Count Link count (2007, 2008 or 2009). * DOT_CNT_FLAG DOT count source flag. * CITY_CNT_FLAG City count source flag. * CSATD_CNT_FLAG TPO 2008 source count flag.
Outputs: * TerminalTime Terminal times for link. * AB/BA_FF_Time Directional free flow travel times. * AB/BA_Cong_Time Directional congested travel times. * Table_Speed Free-flow speeds from input lookup table. * Model_Speed Congested speeds following assignment. * AB/BA_Table_HrCap Directional hourly capacities from
input lookup table.
* AB/BA_Model_HrCap Directional hourly capacities for model execution.

5
* AB_BA_Model_DlyCap Directional daily capacities for model. * Alpha BPR delay function alpha parameter. * Beta BPR delay function beta parameter. * AB/BA_Model_VMT Directional link vehicle miles traveled
(VMT) * AB/BA_Model_VMT_Adj Directional link VMT adjusted with HPMS factors for air quality purposes. * AB/BA_Daily_EEHT Directional external-external heavy truck
trips. * AB/BA_time#_EEHT Directional external-external heavy truck
trips (AM or PM). * AB/BA_TOTPASSVEH Directional total passenger vehicle volumes. * AB/BA_time#_PassV Directional passenger vehicle volumes (AM
or PM) * AB/BA_Daily_Allveh Directional daily vehicle volumes. * Tot_Daily_Allveh Total daily vehicle volumes. * AB/BA_time#_Allveh Directional peak hour vehicle volumes (AM
or PM) * AB/BA_SOV Directional single occupancy vehicle (SOV)
volumes. * AB/BA_HOV2 Directional 2 person high occupany vehicle
(HOV) vehicle volumes. * AB/BA_HOV3 Directional 3 person+ HOV vehicle
volumes. * AB/BA_ALLHOV Directional 2 or more person HOV vehicle volumes (all HOV). * AB/BA_LTTRK Directional light-duty truck volumes. * AB/BA_MDTRK Directional medium-duty truck volumes. * AB/BA_HDTRK Directional heavy-duty duty truck volumes. * AB/BA_TOTTRK Directional total truck volume. * AB/BA_TOTEE Directional total external-external volume. * AB/BA_VoverC Directional volume-over-capacity ratios. SPECIAL NOTES: The AM and PM values (time#) represent values collected over the peak hour rather than a 3 or 4 hour peak period. The peak hour values are based on the temporal distribution of trips from the household travel survey conducted in the Chattanooga region in 2002. These peak hour factors are applied after assignment and thus, do not account for diversion of trips as a result of congestion. In addition, the 2007 model was validated to the total trip level, not peak hour or truck trip level.

6
CHATT_TURN_PENALTY.BIN FILE TYPE: TransCAD Binary (BIN) MODEL STEP: HIGHWAY SKIMS PRIMARY FUNCTION: Contains link penalty data. DATA FORMAT: VARIABLE (FIELD) NAME DESCRIPTION * FROM_ID TransCAD link ID from which trips enduring the penalty pass.
* TO_ID TransCAD link ID to which trips enduring the penalty proceed.
* PENALTY Value of the penalty in minutes. SPECIAL NOTES: If PENALTY is 0, the movement is prohibited.
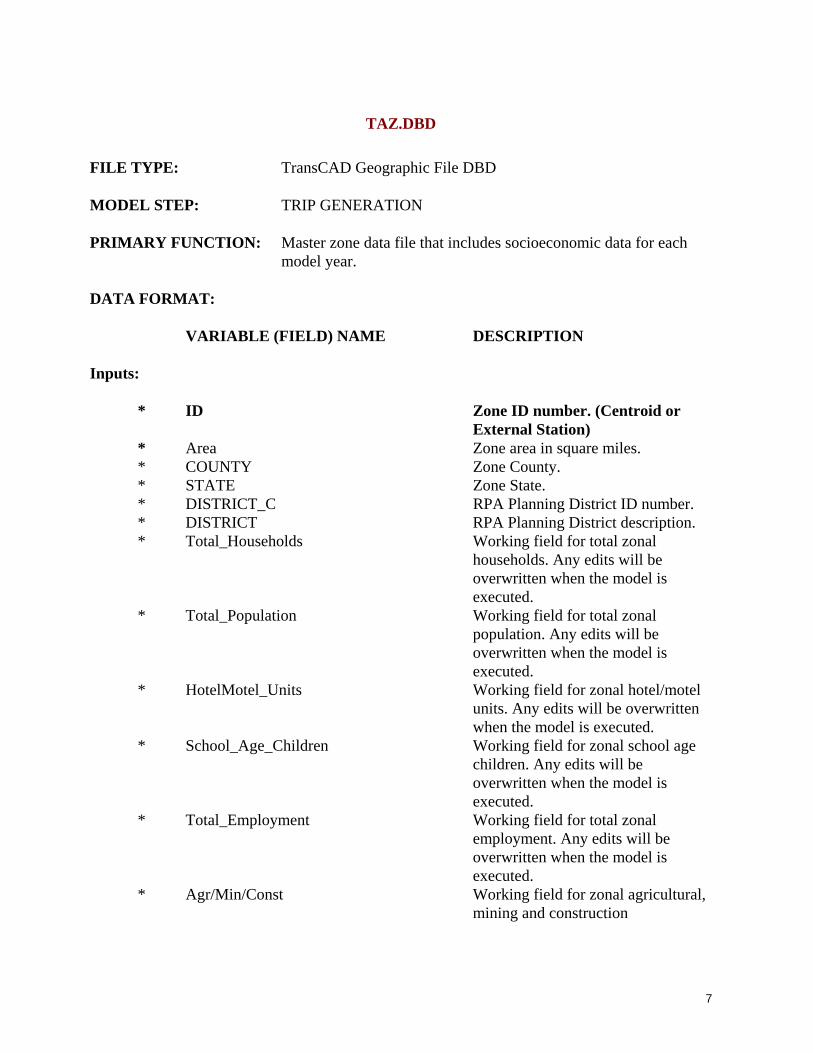
7
TAZ.DBD FILE TYPE: TransCAD Geographic File DBD MODEL STEP: TRIP GENERATION PRIMARY FUNCTION: Master zone data file that includes socioeconomic data for each
model year. DATA FORMAT: VARIABLE (FIELD) NAME DESCRIPTION Inputs: * ID Zone ID number. (Centroid or External Station) * Area Zone area in square miles. * COUNTY Zone County. * STATE Zone State. * DISTRICT_C RPA Planning District ID number. * DISTRICT RPA Planning District description. * Total_Households Working field for total zonal
households. Any edits will be overwritten when the model is executed.
* Total_Population Working field for total zonal population. Any edits will be overwritten when the model is executed.
* HotelMotel_Units Working field for zonal hotel/motel units. Any edits will be overwritten
when the model is executed. * School_Age_Children Working field for zonal school age children. Any edits will be
overwritten when the model is executed.
* Total_Employment Working field for total zonal employment. Any edits will be
overwritten when the model is executed.
* Agr/Min/Const Working field for zonal agricultural, mining and construction

8
employment. Any edits will be overwritten when the model is executed.
* Manu/Trans Working field for zonal manufacturing and transportation employment. Any edits will be overwritten when the model is executed.
* Retail Working field for zonal retail employment. Any edits will be
overwritten when the model is executed.
* Service Working field for zonal service employment. Any edits will be
overwritten when the model is executed.
* Government Working field for zonal government employment. Any edits will be
overwritten when the model is executed.
* School_Enrollment Working field for zonal school enrollment. Any edits will be
overwritten when the model is executed.
* College_Enrollment Working field for zonal college enrollment. Any edits will be
overwritten when the model is executed.
* Total_School_Enrollment Working field for total school enrollmment. (school + college) Any
edits will be overwritten when the model is executed.
* External_Internal Working field for zonal external- internal trips. Any edits will be overwritten when the model is executed.
* yr_TOTHH Zonal households for scenario year. * yr_TOTPOP Zonal population for scenario year. * yr_HOTMOT Zonal hotel/motel units for scenario
year. * yr_TOTEMP Zonal employment for scenario year. * yr_CHILD Zonal school age children for
scenario year.

9
* yr_AMC Zonal agricultural, mining and construction employment for scenario year. * yr_MANTRN Zonal manufacturing and
transportation employment for scenario year.
* yr_RETAIL Zonal retail employment for scenario year. * yr_SERV Zonal service employment for
scenario year. * yr_GOVT Zonal government employment for scenario year. * yr_GRSCH Zonal grade school enrollment for scenario year. * yr_COL Zonal college enrollment for scenario year. * yr_TOTSCH Zonal total school enrollment ( grade school + college) for scenario year. * yr_EXTINT Zonal external to internal trips for
scenario year. * PERC_#_VEH Percent (0, 1, 2 or 3+) vehicle households in zone. Outputs: * HBWork_p Home Based Work productions. * HBWork_a Home Based Work attractions. * HBSchool_p Home Based School productions. * HBSchool_a Home Based School attractions. * HBShop_p Home Based Shopping productions. * HBShop_a Home Based Shopping attractions. * HBSocRec_p Home Based Social/Recreational
Work productions. * HBSocRec_a Home Based Social/Recreational
Work attractions. * HBOther_p Home Based Other productions. * HBOther_a Home Based Other attractions. * NHB_p Non Home Based productions. * NHB_a Non Home Based attractions. * LgtTruck_p Light Truck productions. * LgtTruck_a Light Truck attractions. * MedTruck_p Medium Truck productions. * MedTruck_a Medium Truck attractions. * HvyTruck_p Heavy Truck productions.

10
* HvyTruck_a Heavy Truck attractions. * LATITUDE Latitude in decimal degrees. * LONGITUDE Longitude in decimal degrees.
SPECIAL NOTES: The working field variables are populated initially upon running the trip generation scenario and the values are obtained from the scenario year fields for whichever year is selected.
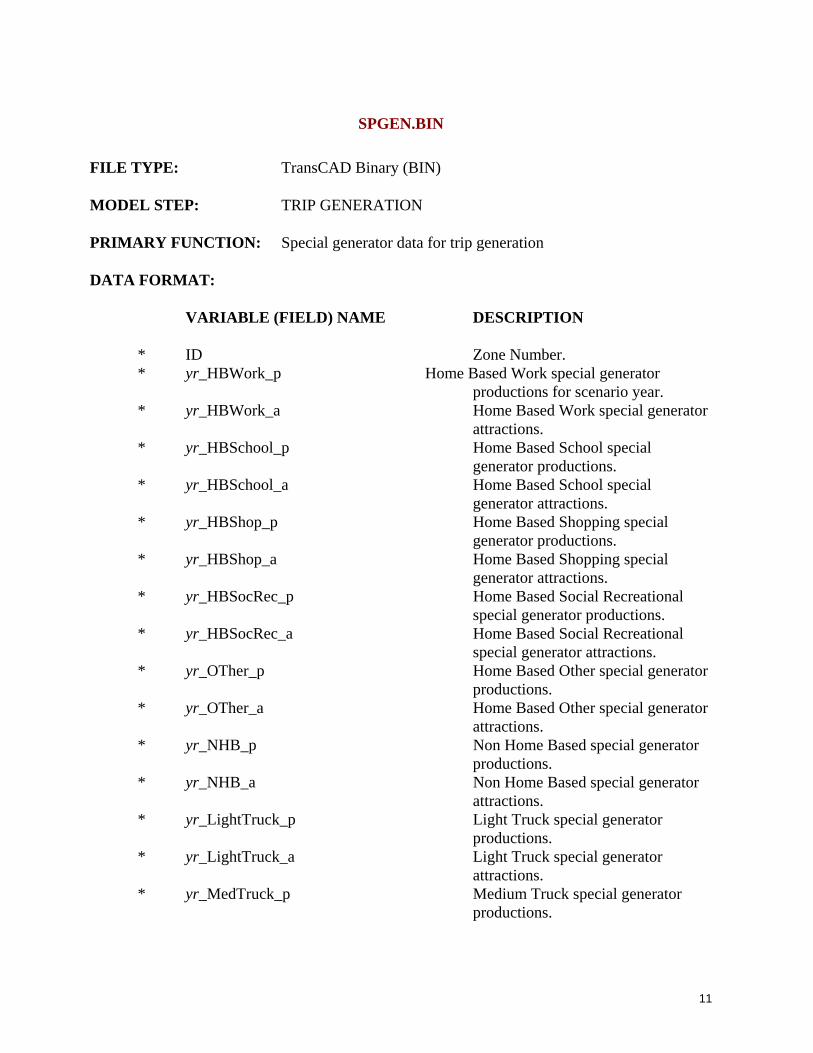
11
SPGEN.BIN FILE TYPE: TransCAD Binary (BIN) MODEL STEP: TRIP GENERATION PRIMARY FUNCTION: Special generator data for trip generation DATA FORMAT: VARIABLE (FIELD) NAME DESCRIPTION * ID Zone Number. * yr_HBWork_p Home Based Work special generator productions for scenario year. * yr_HBWork_a Home Based Work special generator attractions. * yr_HBSchool_p Home Based School special generator productions. * yr_HBSchool_a Home Based School special generator attractions. * yr_HBShop_p Home Based Shopping special
generator productions. * yr_HBShop_a Home Based Shopping special
generator attractions. * yr_HBSocRec_p Home Based Social Recreational
special generator productions. * yr_HBSocRec_a Home Based Social Recreational
special generator attractions. * yr_OTher_p Home Based Other special generator productions. * yr_OTher_a Home Based Other special generator attractions. * yr_NHB_p Non Home Based special generator productions. * yr_NHB_a Non Home Based special generator attractions. * yr_LightTruck_p Light Truck special generator productions. * yr_LightTruck_a Light Truck special generator attractions. * yr_MedTruck_p Medium Truck special generator productions.

12
* yr_MedTruck_a Medium Truck special generator attractions. * yr_HeavTruck_p Heavy Truck special generator productions. * yr_HeavTruck_a Heavy Truck special generator attractions.
* HBWork_p Working variable for Home Based Work special generator productions. Any edits will be overwritten when the model is executed.
* HBWork_a Working variable for Home Based Work special generator attractions. Any edits will be overwritten when the model is executed.
* HBSchool_p Working variable for Home Based School special generator productions. Any edits will be overwritten when the model is executed.
* HBSchool_a Working variable for Home Based School special generator attractions. Any edits will be overwritten when the model is executed.
* HBShop_p Working variable for Home Based Shopping special generator productions. Any edits will be overwritten when the model is executed.
* HBShop_a Working variable for Home Based Shopping special generator attractions. Any edits will be overwritten when the model is executed.
* HBSocRec_p Working variable for Home Based Social Recreational special generator
productions. Any edits will be overwritten when the model is executed.
* HBSocRec_a Working variable for Home Based Social Recreational special generator
attractions. Any edits will be overwritten when the model is executed.
* OTher_p Working variable for Home Based

13
Other. Any edits will be overwritten when the model is executed.
special generator productions. * OTher_a Working variable for Home Based
Other special generator attractions. Any edits will be overwritten when the model is executed.
* NHB_p Working variable for Non Home Based special generator productions. Any edits will be overwritten when the model is executed.
* NHB_a Working variable for Non Home Based special generator attractions. Any edits will be overwritten when the model is executed.
* LightTruck_p Working variable for Light Truck special generator productions. Any edits will be overwritten when the model is executed.
* LightTruck_a Working variable for Light Truck special generator attractions. Any edits will be overwritten when the model is executed.
* MedTruck_p Working variable for Medium Truck special generator productions. Any
edits will be overwritten when the model is executed.
* MedTruck_a Working variable for Medium Truck special generator attractions. Any
edits will be overwritten when the model is executed.
* HeavTruck_p Working variable for Heavy Truck special generator productions. Any
edits will be overwritten when the model is executed.
* HeavTruck_a Working variable for Heavy Truck special generator attractions. Any edits will be overwritten when the model is executed.
SPECIAL NOTES: The working field variables are populated initially upon running the trip generation scenario and the values are obtained from the scenario year fields for whichever year is selected. Balncing trip productions with attractions is done after the special generator values have been included.

14
F_FACTORS.DBF FILE TYPE: DBF MODEL STEP: TRIP DISTRIBUTION PRIMARY FUNCTION: Friction factors by trip purpose by travel time for input to Gravity Model DATA FORMAT: VARIABLE (FIELD) NAME DESCRIPTION * TIME Skimmed network travel time.
* HBW_FF Home-based Work Friction Factors. * HBSCH_FF Home-based School Friction Factors. * HBSHOP_FF Home-based Shopping Friction Factors.
* HBSR_FF Home-based Social/Recreational Friction Factors.
* HBOTHER_FF Home-based Other Friction Factors. * NHB_FF Non Home-Based Friction Factors. * LTRUCK_FF Light Truck Friction Factors. * MTRUCK_FF Medium Truck Friction Factors. * HTRUCK_FF Heavy Truck Friction Factors. * INTEXT_FF Internal-External Friction Factors. SPECIAL NOTES: Users should not edit this file as it will impact model validation.

15
K_FACTORS.MTX FILE TYPE: TransCAD Matrix File (MTX) MODEL STEP: TRIP DISTRIBUTION PRIMARY FUNCTION: K-Factor trip table used to assist with validating the trip
distribution step. DATA FORMAT: TABLE NAME DESCRIPTION * K-Factor K-factor matrix core. (#zones by #zones) SPECIAL NOTES: #Zones represent total of internal zones and external stations. Do not edit this file as it will impact validation.
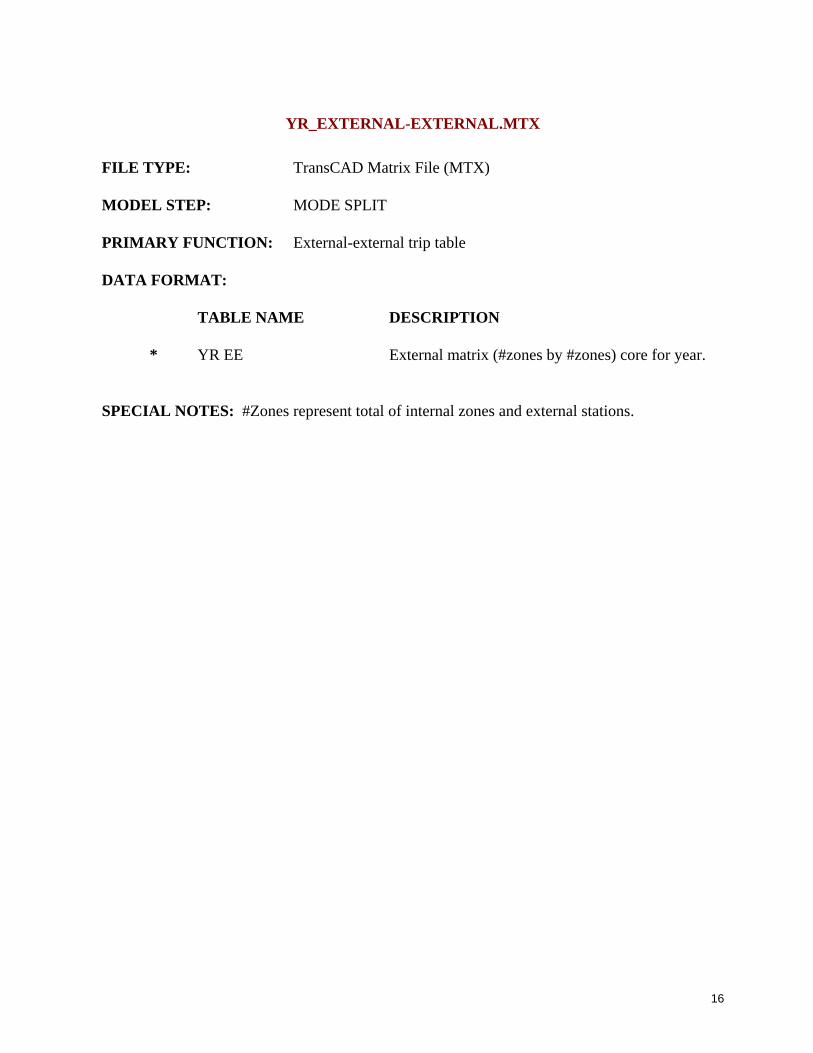
16
YR_EXTERNAL-EXTERNAL.MTX FILE TYPE: TransCAD Matrix File (MTX) MODEL STEP: MODE SPLIT PRIMARY FUNCTION: External-external trip table DATA FORMAT: TABLE NAME DESCRIPTION * YR EE External matrix (#zones by #zones) core for year. SPECIAL NOTES: #Zones represent total of internal zones and external stations.

17
HRLY_CHATT.DBF FILE TYPE: DBF MODEL STEP: MODE SPLIT PRIMARY FUNCTION: Daily-to-hourly lookup table by occupancy level. DATA FORMAT: VARIABLE (FIELD) NAME DESCRIPTION * HOUR Hour of the day from 0 to 23 (i.e. 0 = 12-1
AM) * F_FLOW_ALL Percentage of daily origin-destination (O-D)
trips that occur during the hour. * F_FLOW_HBW Percentage of daily HBW O-D trips that
occur during the hour. * F_FLOW_HBN Percentage of daily HBNW O-D trips that occur during the hour. * F_FLOW_HBO Percentage of daily HBO O-D trips that occur during the hour. * F_FLOW_NHB Percentage of daily NHB O-D trips that occur during the hour. * DEP_ALL Percentage of daily P-A trips that depart
during the hour. * RET_ALL Percentage of daily P-A trips that return
during the hour. * DEP_HBW Percentage of daily HBW P-A trips that
depart during the hour. * RET_HBW Percentage of daily HBW P-A trips that
return during the hour. * DEP_HBSC Percentage of daily HBSC P-A trips that
depart during the hour. * RET_HBSC Percentage of daily HBSC P-A trips that
return during the hour. * DEP_HBSH Percentage of daily HBSH P-A trips that
depart during the hour. * RET_HBSH Percentage of daily HBSH P-A trips that
return during the hour. * DEP_HBSR Percentage of daily HBSR P-A trips that
depart during the hour. * RET_HBSR Percentage of daily HBSR P-A trips that

18
return during the hour. * DEP_HBO Percentage of daily HBO P-A trips that
depart during the hour. * RET_HBO Percentage of daily HBO P-A trips that return during the hour. * DEP_NHB Percentage of daily NHB P-A trips that
depart during the hour. * RET_NHB Percentage of daily NHB P-A trips that return during the hour. * OCCADJ_HBW Absolute hourly vehicle adjustment factor for HBW trips. * OCCADJ_HBN Absolute hourly vehicle adjustment factor for HBNW trips. * OCCADJ_HBO Absolute hourly vehicle adjustment factor for HBO trips. * OCCADJ_NHB Absolute hourly vehicle adjustment factor for NHB trips. * OCCADJ_ALL Absolute hourly vehicle adjustment factor for all trip types. SPECIAL NOTES: • HBW – Home based work. • HBNW – Home based non-work. • HBO –Home based other. • NHB – Non home based. • HBSC - Home based school. • HBSH – Home based shopping. • HBSR – Home based social recreational.

19
STATE{Year}_EMISSIONS_LOOKUP.TXT FILE TYPE: Comma delimited text file. MODEL STEP: HIGHWAY ASSIGNMENT PRIMARY FUNCTION: Emissions factor lookup table from Mobile6.2 for each state by
model scenario year. DATA FORMAT: VARIABLE (FIELD) NAME DESCRIPTION * PM2.5 Particulate matter (2.5 micron) emissions
factor for freeways in grams. * NOX Oxides of Nitrogen emissions factor for
for freeways in grams. * VOC Volatile Organic Compounds (Non-methane hydrocarbon) emissions factor for freeways
in grams. SPECIAL NOTES: Repeated for arterial, local and freeway ramps (MOBILE6.2 road types). Values delimited by a comma. For VOC, a placeholder value of 1 has been included as actual factors for VOC were not obtained from MOBILE 6.2.

20
3.0 Output Files The following are the output files produced from the Chattanooga model. They primarily represent the output reporting text files, the emission factor summary and other related air quality files. Please note that the assignment outputs are stored directly in the TransCAD geographic network line input file and thus a separate output network is not created. A copy of the network file is, however, automatically copied in to the OUT directory.
21
LRTP_NETWORK.DBD FILE TYPE: TransCAD Geographic File DBD MODEL STEP: HIGHWAY SKIMS PRIMARY FUNCTION: Line geographic file used to create TransCAD model network. The LRTP_NETWORK.DBD is a master transportation network that includes both the input and output network attributes. See the LRTP_NETWORK.DBD file in the Input Files section for specific data format.

22
HWYDIST1.MTX FILE TYPE: TransCAD Matrix File (MTX) MODEL STEP: HIGHWAY SKIMS PRIMARY FUNCTION: Interzonal and intrazonal network skim distance (distance between
each pair of zones). DATA FORMAT: TABLE NAME DESCRIPTION * Distance Skim-Length Matrix (#zones by #zones) core. SPECIAL NOTES: #Zones represent total of internal zones and external stations.

23
HWYTIME1.MTX FILE TYPE: TransCAD Matrix File (MTX) MODEL STEP: HIGHWAY SKIMS PRIMARY FUNCTION: Interzonal and intrazonal network skim travel time (time in
minutes between each pair of zones). DATA FORMAT: TABLE NAME DESCRIPTION * Distance Skim-Length Matrix (#zones by #zones) core. SPECIAL NOTES: #Zones represent total of internal zones and external stations.

24
TRIPGEN_REPORT.TXT FILE TYPE: ASCII text file (TXT) MODEL STEP: TRIP GENERATION PRIMARY FUNCTION: Summary of trip generation. DATA FORMAT: SPECIAL NOTES: Text summary table of trip productions and balanced/unbalanced attractions by trip purpose. Included are the special generator trips, summary population, and household trip data.

25
GRAVITY_MODEL_REPORT.TXT FILE TYPE: ASCII text file (TXT) MODEL STEP: TRIP DISTRIBUTION PRIMARY FUNCTION: Summary of trip distribution. DATA FORMAT: SPECIAL NOTES: Text summary report of average travel times/distnaces by trip purpose, as well as the number of intrazonal trips.
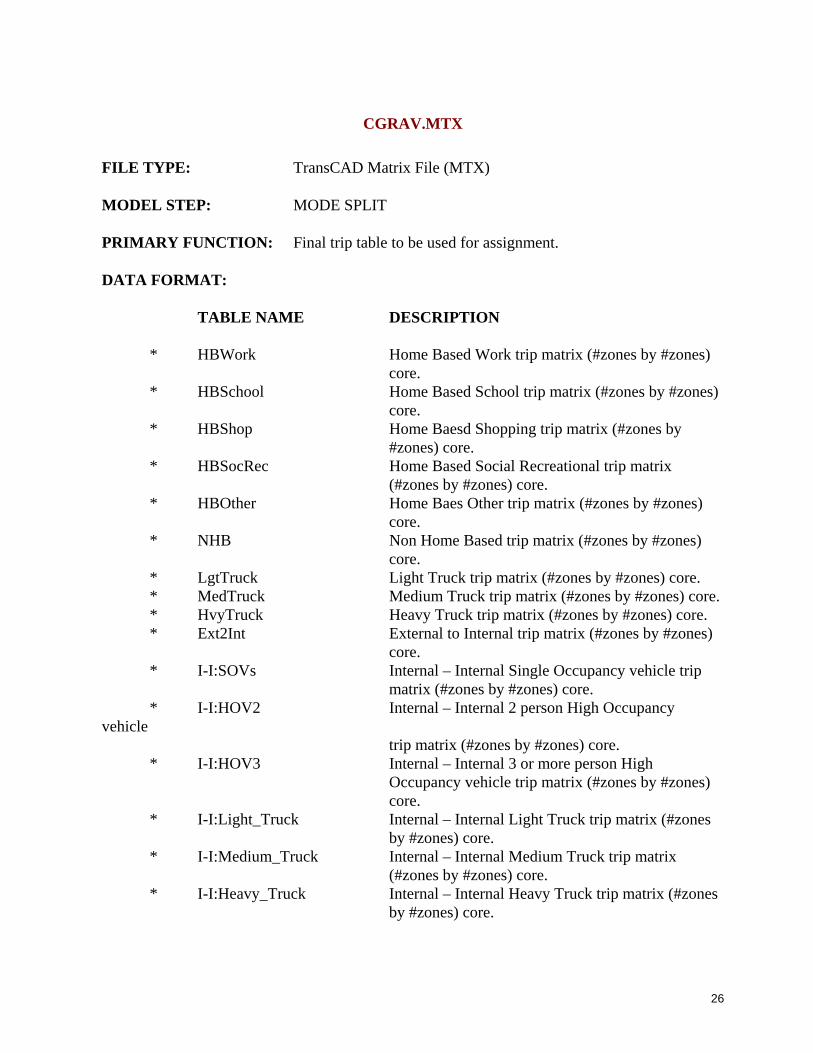
26
CGRAV.MTX FILE TYPE: TransCAD Matrix File (MTX) MODEL STEP: MODE SPLIT PRIMARY FUNCTION: Final trip table to be used for assignment. DATA FORMAT: TABLE NAME DESCRIPTION * HBWork Home Based Work trip matrix (#zones by #zones) core. * HBSchool Home Based School trip matrix (#zones by #zones) core. * HBShop Home Baesd Shopping trip matrix (#zones by #zones) core.
* HBSocRec Home Based Social Recreational trip matrix (#zones by #zones) core.
* HBOther Home Baes Other trip matrix (#zones by #zones) core. * NHB Non Home Based trip matrix (#zones by #zones) core. * LgtTruck Light Truck trip matrix (#zones by #zones) core. * MedTruck Medium Truck trip matrix (#zones by #zones) core. * HvyTruck Heavy Truck trip matrix (#zones by #zones) core. * Ext2Int External to Internal trip matrix (#zones by #zones)
core. * I-I:SOVs Internal – Internal Single Occupancy vehicle trip matrix (#zones by #zones) core. * I-I:HOV2 Internal – Internal 2 person High Occupancy vehicle trip matrix (#zones by #zones) core. * I-I:HOV3 Internal – Internal 3 or more person High Occupancy vehicle trip matrix (#zones by #zones) core. * I-I:Light_Truck Internal – Internal Light Truck trip matrix (#zones by #zones) core. * I-I:Medium_Truck Internal – Internal Medium Truck trip matrix (#zones by #zones) core. * I-I:Heavy_Truck Internal – Internal Heavy Truck trip matrix (#zones by #zones) core.

27
* I-I:Light_Truck Internal – Internal Light Truck trip matrix (#zones by #zones) core. * E-E:SOVs External – External Single Occupancy vehicle trip
matrix (#zones by #zones) core. * E-E:HOV2 External – External 2 person High Occupancy vehicle trip matrix (#zones by #zones) core. * E-E:HOV3 External – External 3 or more person High
Occupancy vehicle trip matrix (#zones by #zones) core.
* E-E:Light_Truck External – External Light Truck trip matrix (#zones by #zones) core. * E-E:Medium_Truck External – External Medium Truck trip matrix (#zones by #zones) core. * E-E:Heavy_Truck External – External Heavy Truck trip matrix (#zones by #zones) core. SPECIAL NOTES: #Zones represent total of internal zones and external stations. This trip table is used in a multi-modal multi-class assignment routine to assign separate categories, such as E-E trips, truck trips, etc.

28
SCREENLINE_REPORT.TXT FILE TYPE: ASCII text file (TXT) MODEL STEP: HIGHWAY ASSIGNMENT PRIMARY FUNCTION: Summary of screenline validation statistics. DATA FORMAT: SPECIAL NOTES: Text summary report of total screenline volumes/observed counts and derived volume-over-count ratios.

29
GENERAL_ASSIGN_REPORT.TXT FILE TYPE: ASCII text file (TXT) MODEL STEP: HIGHWAY ASSIGNMENT PRIMARY FUNCTION: Summary of trip assignment results. DATA FORMAT: SPECIAL NOTES: Text summary report of assignment results. Included statistics are volume-over-count ratios, root mean square error (RMSE), vehicle miles traveled (VMT), and vehicle hours traveled (VHT) by various categories. Categories include facility type, area type, Highway Performance Monitoring System (HPMS) functional classification, number of lanes, and volume assignment group.

30
MOBILE6_ADJ.CSV
FILE TYPE: CSV (Comma Delimited) MODEL STEP: AIR QUALITY POST PROCESSOR IN HIGHWAY ASSIGNMENT PRIMARY FUNCTION: Stores HPMS adjustment factors from base year (2007) model run. DATA FORMAT: VARIABLE (FIELD) NAME DESCRIPTION * FACTOR HPMS adjustment factor by county
and HPMS functional class code. SPECIAL NOTES: The adjustment factors are reported for each of Hamilton, Catoosa, Dade, and Walker counties by HPMS functional classification.

31
{Year}MOBILE6_SUMMARY_REPORT.CSV
FILE TYPE: CSV (Comma Delimited) MODEL STEP: AIR QUALITY POST PROCESSOR IN HIGHWAY ASSIGNMENT PRIMARY FUNCTION: Reports air quality post processor summary emissions information by county and HPMS Federal Functional Classification. DATA FORMAT: VARIABLE (FIELD) NAME DESCRIPTION * YEAR Model Run Year * DESCRIPTION HPMS Functional Class description. * FUNCTIONAL CLASS(ES) HPMS Functional Class code. (0, 1, 2, 6, 7, 8, 9, 11, 12, 14, 16, 17 and 19) * DAILY MODEL VMT Daily vehicle miles traveled from model for county and fucntional class. * DAILY MODEL VHT Daily vehicle hours traveled from model for county and functional class. * DAILY MODEL PM2.5(grams) Daily 2.5 micron and greater particulate matter in grams for county and functional class. * DAILY MODEL Nox (grams) Daily Oxides of Nitrogen emissions in grams for county and functional class. * DAILY MODEL VOC (grams) Daily Volatile Organic Compound (Non-methane hydrocarbon) emissions in grams for county and functional class. * MODEL AVG SPEED Average speed by county and functional class in miles per hour. * DAILY 2007 HPMS Daily HPMS reported volumes by county and functional class * 2007 HPMS ADJ FACTOR HPMS adjustment factor to align HPMS volumes with model volumes. * DAILY ADJ. MODEL PM2.5(grams) Daily 2.5 micron and greater

32
particulate matter in grams for county and functional class adjusted by HPMS factor. * DAILY ADJ. MODEL NOx (grams) Daily Oxides of Nitrogen emissions in grams for county and functional class adjusted by HPMS factor. * DAILY ADJ. MODEL VOC (grams) Daily Volatile Organic Compound (Non-methane hydrocarbon) emissions in grams for county and functional class adjusted by HPMS factor. SPECIAL NOTES: The adjustment factors are reported for each of Hamilton, Catoosa, Dade and Walker counties by HPMS functional classification in sequential order. Please note, the VOC values are a placeholder until local emission factors are obtained for VOCs through interagency consultation.

33
MOBILE6_REPORT_AQ.CSV
FILE TYPE: CSV (Comma Delimited) MODEL STEP: AIR QUALITY POST PROCESSOR IN HIGHWAY
ASSIGNMENT PRIMARY FUNCTION: Reports link level emissions output from the air quality post processor. DATA FORMAT: VARIABLE (FIELD) NAME DESCRIPTION * ID TransCAD link ID number. * CNTY County ID (47-Catoosa, 65- Hamilton,83-Dade and 295-Walker) * DIR Link directionality. (1 – one way AB, 0 – two way, -1 – one way BA) * A/B TransCAD A and B node ID numbers. * MILES Link distance in miles. * FTYPE Link facility type 1 – 9. * HPMS Link HPMS functional classification code (0 – 18). * CONGTIME Link congested travel time. * AUTOLT Auto and Light Truck assigned volume. * MT Medium Truck assigned volume. * HT Heavy Truck assigned volume. * COMPVOL Total assigned volumes on link. * COMPVMT VMT for all vehicles on link. * CONGSPD Link congested speed. * PMFAC Particulate matter emission factor used for specific link. (Obtained from lookup table for speed, county and functional class) * NOXFAC Oxides of nitrogen emission factor used for specific link. (Obtained from lookup table for speed, county and functional class) * PM25 2.5 micron and greater particulate

34
matter emissions on link in grams. * NOX Oxides of nitrogen emissions on link in grams.