volume 47, number 24 september 14, 1999 trends in twin and
TRANSCRIPT

Trends in Twin and Triplet Births: 1980–97by Joyce A. Martin, M.P.H., and Melissa M. Park, B.S., Division of Vital Statistics
Figure 1. Number of twin births: United States, 1980–97
National Vital Statistics ReportsFrom the CENTERS FOR DISEASE CONTROL AND PREVENTIONNational Center for Health StatisticsNational Vital Statistics System
NVSSNVSSNVSSNVSSVolume 47, Number 24 September 14, 1999
AbstractThis report presents data from U.S. birth certificates on the
numbers and rates of twin and triplet and other higher order multiplebirths for 1980–97. Over the study period, the number of twin birthsrose 52 percent (from 68,339 to 104,137) and triplet and other higherorder multiple births (heretofore referred to as ‘‘triplet/+’’) climbed404 percent (from 1,337 to 6,737 births). Comparable but lesspronounced rises were observed in twin and triplet/+ birth rates.
Growth in twin and triplet/+ birth rates was most marked amongwomen aged 30 years and over. Between 1980–82 and 1995–97, thetwin rate rose 63 percent for women aged 40–44 years, and soarednearly 1,000 percent for women 45–49 years. (As one result, there weremore twins born to women 45–49 years of age in 1997, than during theentire decade of the 1980’s.) The triplet/+ birth rate rose nearly 400 per-cent for women in their thirties and exploded by more than 1,000 percentfor women in their forties. The extraordinary rise in multiple birthsresulted in a shift in age-specific patterns, and the highest twin andtriplet/+ birth rates now are for women 45–49 years of age.
Historical differences in twinning rates between non-Hispanic whiteand black mothers have been largely eliminated (28.8 per 1,000 non-Hispanic white compared with 30.0 for black women). Non-Hispanicwhite women were more than twice as likely as non-Hispanic black orHispanic women to have a triplet/+ birth.
Rates of low birthweight, very low birthweight, and infant mortalitywere 4 to 33 times higher for twins and triplet/+ compared with singletonbirths. The risk for these adverse outcomes was lowest for twins andtriplet/+ born to women 35–44 years of age.
Twin birth rates for Massachusetts and Connecticut were at least25 percent higher than the U.S. rate; triplet/+ rates for Nebraska andNew Jersey were twice the national level.
Keywords: twin births c triplet births c infant mortality
Acknowledgments
This report was prepared in the Division of Vital Statistics (DVS). The authorsthank Anjani Chandra, Reproductive Statistics Branch (RSB), for data fromthe Survey of Family Growth and Stephanie J. Ventura and Ken Keppel,Acting Chief, RSB, DVS, for their helpful comments. The report was edited byPatricia Keaton-Williams, typeset by Jacqueline M. Davis, and graphics wereproduced by Gail Ogburn of the Publications Branch, Division of DataServices.
U.S. DEPARTMENT OF HEALTH AND HUMAN SERVICESCenters for Disease Control and Prevention
National Center for Health Statistics
IntroductionThe number and rate of twin and triplet and other higher order
multiple births have climbed at an unprecedented pace over the lasttwo decades. Between 1980 and 1997, the number of live births intwin deliveries rose 52 percent and the number of live births in tripletand other higher order multiple deliveries soared 404 percent.Singleton births, in contrast, rose 6 percent. During the 1990’s twinbirths rose 11 percent and triplet and other higher order multiple births
Figure 2. Number of triplet/+ births: United States,1980–97
CENTERS FOR DISEASE CONTROL
AND PREVENTION
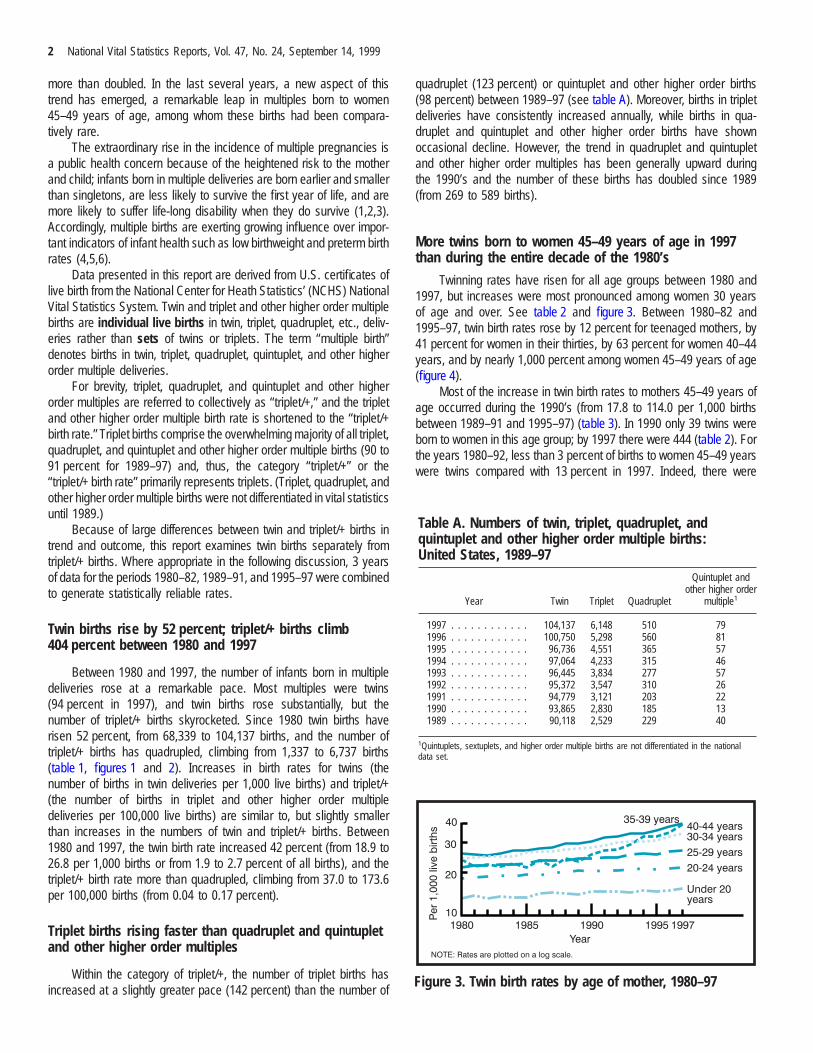
Table A. Numbers of twin, triplet, quadruplet, andquintuplet and other higher order multiple births:United States, 1989–97
Year Twin Triplet Quadruplet
Quintuplet andother higher order
multiple1
1997 . . . . . . . . . . . . 104,137 6,148 510 791996 . . . . . . . . . . . . 100,750 5,298 560 811995 . . . . . . . . . . . . 96,736 4,551 365 571994 . . . . . . . . . . . . 97,064 4,233 315 461993 . . . . . . . . . . . . 96,445 3,834 277 571992 . . . . . . . . . . . . 95,372 3,547 310 261991 . . . . . . . . . . . . 94,779 3,121 203 221990 . . . . . . . . . . . . 93,865 2,830 185 131989 . . . . . . . . . . . . 90,118 2,529 229 40
1Quintuplets, sextuplets, and higher order multiple births are not differentiated in the nationaldata set.
Figure 3. Twin birth rates by age of mother, 1980–97
2 National Vital Statistics Reports, Vol. 47, No. 24, September 14, 1999
more than doubled. In the last several years, a new aspect of thistrend has emerged, a remarkable leap in multiples born to women45–49 years of age, among whom these births had been compara-tively rare.
The extraordinary rise in the incidence of multiple pregnancies isa public health concern because of the heightened risk to the motherand child; infants born in multiple deliveries are born earlier and smallerthan singletons, are less likely to survive the first year of life, and aremore likely to suffer life-long disability when they do survive (1,2,3).Accordingly, multiple births are exerting growing influence over impor-tant indicators of infant health such as low birthweight and preterm birthrates (4,5,6).
Data presented in this report are derived from U.S. certificates oflive birth from the National Center for Heath Statistics’ (NCHS) NationalVital Statistics System. Twin and triplet and other higher order multiplebirths are individual live births in twin, triplet, quadruplet, etc., deliv-eries rather than sets of twins or triplets. The term ‘‘multiple birth’’denotes births in twin, triplet, quadruplet, quintuplet, and other higherorder multiple deliveries.
For brevity, triplet, quadruplet, and quintuplet and other higherorder multiples are referred to collectively as ‘‘triplet/+,’’ and the tripletand other higher order multiple birth rate is shortened to the ‘‘triplet/+birth rate.’’ Triplet births comprise the overwhelming majority of all triplet,quadruplet, and quintuplet and other higher order multiple births (90 to91 percent for 1989–97) and, thus, the category ‘‘triplet/+’’ or the‘‘triplet/+ birth rate’’ primarily represents triplets. (Triplet, quadruplet, andother higher order multiple births were not differentiated in vital statisticsuntil 1989.)
Because of large differences between twin and triplet/+ births intrend and outcome, this report examines twin births separately fromtriplet/+ births. Where appropriate in the following discussion, 3 yearsof data for the periods 1980–82, 1989–91, and 1995–97 were combinedto generate statistically reliable rates.
Twin births rise by 52 percent; triplet/+ births climb404 percent between 1980 and 1997
Between 1980 and 1997, the number of infants born in multipledeliveries rose at a remarkable pace. Most multiples were twins(94 percent in 1997), and twin births rose substantially, but thenumber of triplet/+ births skyrocketed. Since 1980 twin births haverisen 52 percent, from 68,339 to 104,137 births, and the number oftriplet/+ births has quadrupled, climbing from 1,337 to 6,737 births(table 1, figures 1 and 2). Increases in birth rates for twins (thenumber of births in twin deliveries per 1,000 live births) and triplet/+(the number of births in triplet and other higher order multipledeliveries per 100,000 live births) are similar to, but slightly smallerthan increases in the numbers of twin and triplet/+ births. Between1980 and 1997, the twin birth rate increased 42 percent (from 18.9 to26.8 per 1,000 births or from 1.9 to 2.7 percent of all births), and thetriplet/+ birth rate more than quadrupled, climbing from 37.0 to 173.6per 100,000 births (from 0.04 to 0.17 percent).
Triplet births rising faster than quadruplet and quintupletand other higher order multiples
Within the category of triplet/+, the number of triplet births hasincreased at a slightly greater pace (142 percent) than the number of
quadruplet (123 percent) or quintuplet and other higher order births(98 percent) between 1989–97 (see table A). Moreover, births in tripletdeliveries have consistently increased annually, while births in qua-druplet and quintuplet and other higher order births have shownoccasional decline. However, the trend in quadruplet and quintupletand other higher order multiples has been generally upward duringthe 1990’s and the number of these births has doubled since 1989(from 269 to 589 births).
More twins born to women 45–49 years of age in 1997than during the entire decade of the 1980’s
Twinning rates have risen for all age groups between 1980 and1997, but increases were most pronounced among women 30 yearsof age and over. See table 2 and figure 3. Between 1980–82 and1995–97, twin birth rates rose by 12 percent for teenaged mothers, by41 percent for women in their thirties, by 63 percent for women 40–44years, and by nearly 1,000 percent among women 45–49 years of age(figure 4).
Most of the increase in twin birth rates to mothers 45–49 years ofage occurred during the 1990’s (from 17.8 to 114.0 per 1,000 birthsbetween 1989–91 and 1995–97) (table 3). In 1990 only 39 twins wereborn to women in this age group; by 1997 there were 444 (table 2). Forthe years 1980–92, less than 3 percent of births to women 45–49 yearswere twins compared with 13 percent in 1997. Indeed, there were
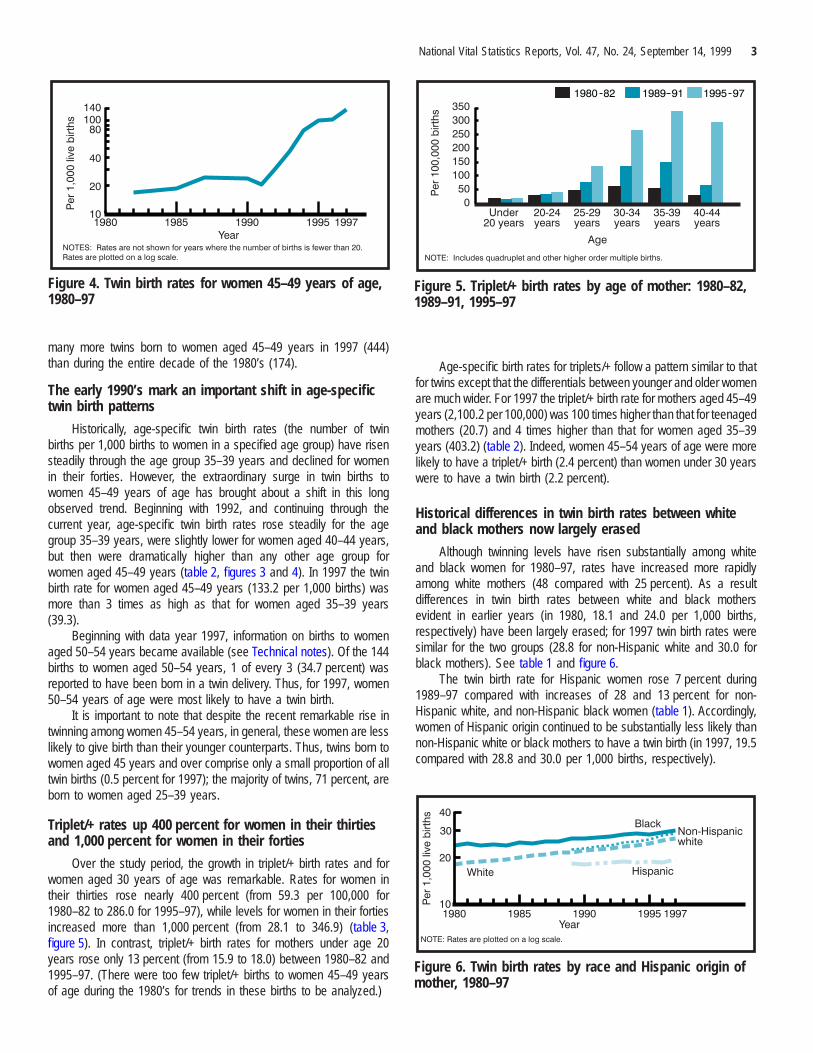
Figure 4. Twin birth rates for women 45–49 years of age,1980–97
Figure 5. Triplet/+ birth rates by age of mother: 1980–82,1989–91, 1995–97
Figure 6. Twin birth rates by race and Hispanic origin ofmother, 1980–97
National Vital Statistics Reports, Vol. 47, No. 24, September 14, 1999 3
many more twins born to women aged 45–49 years in 1997 (444)than during the entire decade of the 1980’s (174).
The early 1990’s mark an important shift in age-specifictwin birth patterns
Historically, age-specific twin birth rates (the number of twinbirths per 1,000 births to women in a specified age group) have risensteadily through the age group 35–39 years and declined for womenin their forties. However, the extraordinary surge in twin births towomen 45–49 years of age has brought about a shift in this longobserved trend. Beginning with 1992, and continuing through thecurrent year, age-specific twin birth rates rose steadily for the agegroup 35–39 years, were slightly lower for women aged 40–44 years,but then were dramatically higher than any other age group forwomen aged 45–49 years (table 2, figures 3 and 4). In 1997 the twinbirth rate for women aged 45–49 years (133.2 per 1,000 births) wasmore than 3 times as high as that for women aged 35–39 years(39.3).
Beginning with data year 1997, information on births to womenaged 50–54 years became available (see Technical notes). Of the 144births to women aged 50–54 years, 1 of every 3 (34.7 percent) wasreported to have been born in a twin delivery. Thus, for 1997, women50–54 years of age were most likely to have a twin birth.
It is important to note that despite the recent remarkable rise intwinning among women 45–54 years, in general, these women are lesslikely to give birth than their younger counterparts. Thus, twins born towomen aged 45 years and over comprise only a small proportion of alltwin births (0.5 percent for 1997); the majority of twins, 71 percent, areborn to women aged 25–39 years.
Triplet/+ rates up 400 percent for women in their thirtiesand 1,000 percent for women in their forties
Over the study period, the growth in triplet/+ birth rates and forwomen aged 30 years of age was remarkable. Rates for women intheir thirties rose nearly 400 percent (from 59.3 per 100,000 for1980–82 to 286.0 for 1995–97), while levels for women in their fortiesincreased more than 1,000 percent (from 28.1 to 346.9) (table 3,figure 5). In contrast, triplet/+ birth rates for mothers under age 20years rose only 13 percent (from 15.9 to 18.0) between 1980–82 and1995–97. (There were too few triplet/+ births to women 45–49 yearsof age during the 1980’s for trends in these births to be analyzed.)
Age-specific birth rates for triplets/+ follow a pattern similar to thatfor twins except that the differentials between younger and older womenare much wider. For 1997 the triplet/+ birth rate for mothers aged 45–49years (2,100.2 per 100,000) was 100 times higher than that for teenagedmothers (20.7) and 4 times higher than that for women aged 35–39years (403.2) (table 2). Indeed, women 45–54 years of age were morelikely to have a triplet/+ birth (2.4 percent) than women under 30 yearswere to have a twin birth (2.2 percent).
Historical differences in twin birth rates between whiteand black mothers now largely erased
Although twinning levels have risen substantially among whiteand black women for 1980–97, rates have increased more rapidlyamong white mothers (48 compared with 25 percent). As a resultdifferences in twin birth rates between white and black mothersevident in earlier years (in 1980, 18.1 and 24.0 per 1,000 births,respectively) have been largely erased; for 1997 twin birth rates weresimilar for the two groups (28.8 for non-Hispanic white and 30.0 forblack mothers). See table 1 and figure 6.
The twin birth rate for Hispanic women rose 7 percent during1989–97 compared with increases of 28 and 13 percent for non-Hispanic white, and non-Hispanic black women (table 1). Accordingly,women of Hispanic origin continued to be substantially less likely thannon-Hispanic white or black mothers to have a twin birth (in 1997, 19.5compared with 28.8 and 30.0 per 1,000 births, respectively).

fm1Nt
Nh
mfr1(bHHc
beotf11
wfpeHabmm
Fo
Figure 8. Percent very low and low birthweight byplurality: United States, 1995–97
4 National Vital Statistics Reports, Vol. 47, No. 24, September 14, 1999
The overall rise in twinning among women in their mid-to-lateorties is primarily attributable to increases among non-Hispanic whiteothers among whom the rate jumped more than sevenfold between989–91 and 1995–97 (from 20.2 to 149.8 per 1,000 births) (table 3).on-Hispanic white mothers accounted for 85 percent of all twin births
o women in this age group for the most current 3-year period.
on-Hispanic white mothers more than twice as likely toave a triplet/+ birth
In the early 1980’s triplet/+ birth rates for white and blackothers were essentially the same (37.6 and 37.1 per 100,000 births
or 1980), but by 1988 the rate for white births had doubled while theate among black mothers had risen only 21 percent. Steep rises for989–97 were observed for the three major racial/ethnic groups168 percent for non-Hispanic white, 124 percent for non-Hispaniclack, and 105 percent for Hispanic mothers). However, in 1997 non-ispanic white mothers were more than twice as likely as non-ispanic black and Hispanic mothers to have a triplet/+ birth (230.8ompared with 90.0 and 72.7, respectively) (table 1).
Triplet/+ birth rates for women under 25 years of age continue toe very comparable among the three groups, but wide differencesmerge at older ages. For 1995–97 among women aged 30 years andver, triplet/+ birth rates for non-Hispanic white were more than twice
hose of non-Hispanic black or Hispanic mothers. For example, the rateor non-Hispanic white mothers aged 40–49 years was 439.1 per00,000 births compared with levels of 181.6 for non-Hispanic black and43.2 for Hispanic mothers. See table 3 and figure 7.
The peak age group for triplet/+ childbearing among non-Hispanichite mothers was 45–49 years compared with a peak at 40–44 years
or non-Hispanic black and 35–39 years for Hispanic women. This latereak among non-Hispanic white mothers represents a change fromarlier years when the highest age-specific triplet/+ birth rate for non-ispanic white occurred at 35–39 years of age. In 1997, 3.4 percent ofll births to non-Hispanic white mothers aged 45–54 years were triplet/+irths (77 total triplet/+ births); there were no triplet/+ births to blackothers of this age group and only six triplet/+ were born to Hispanicothers.
igure 7. Triplet/+ birth rates by race and Hispanic originf mother: 1995–97
Twin and triplet/+ rates of very low birthweight and lowbirthweight were lowest for women aged 35–44 years
Twins are 8 times and triplet/+ 33 times more likely thansingletons to be born at a weight of less than 1,500 grams or very lowbirthweight (VLBW). More than one-half of all twins and nearly alltriplet/+, compared with only 6 percent of singletons, are born lowbirthweight (LBW) (less than 2,500 grams). See table 4 and figure 8.LBW, and especially VLBW births, are at greater risk of early deathand life-long morbidity than heavier infants (7).
For 1995–97 the risk of having an LBW or VLBW twin or triplet/+was highest for mothers under age 20 years and lowest among mothersaged 35–44 years. Rates of VLBW and LBW for women 45–49 yearsof age were lower than or similar to those of women in their twenties.Low birthweight patterns by maternal age were quite different amongsingletons; levels were lowest among mothers aged 25–34 years andhighest among mothers under ages 20 and 45–49 years. Age-specificinfant mortality rates were also lowest for twins and triplet/+ born towomen aged 35–44 years; the number of infant deaths to women aged45–49 years was too small to compute a reliable rate. See table B.
Table B. Infant mortality rates by plurality and age ofmother: United States, 1995–97
Age of mother Twin Triplet/+1 Singleton
Infant deaths per 1,000 live births
All ages . . . . . . . . . . . . . . 32.0 71.8 6.6
Under 20 years . . . . . . . . . 63.1 172.2 9.820–24 years . . . . . . . . . . . 42.0 133.8 7.425–29 years . . . . . . . . . . . 30.1 96.4 5.530–34 years . . . . . . . . . . . 25.2 60.7 5.235–39 years . . . . . . . . . . . 22.6 46.7 6.240–44 years . . . . . . . . . . . 20.4 38.5 8.145–49 years2. . . . . . . . . . . * * 10.0
* Figure does not meet standards of reliability or precision.1Includes quadruplets and other higher order multiple births.2For 1997, births to women aged 50–54 years were not included in the calculation of rates.See Technical notes.
NOTE: Unpublished data from the linked birth/infant death data set, 1995, 1996, and 1997 birthcohorts.
National Vital Statistics Reports, Vol. 47, No. 24, September 14, 1999 5
The only statistically significant change in VLBW or LBW between1980–82 and 1995–97 was for triplet/+ births, among whom the LBWrate increased from 87.98 to 93.08 percent (table 4). This rise may beat least partly explained by an increased proportion of quadruplet andother higher order multiples (LBW risk rises with plurality). Unfortunately,it is not possible to directly measure this influence because quadruplets,quintuplets, and other higher order multiples were not differentiated fromtriplet births in vital statistics data before 1989.
Although the rise in twin LBW was not statistically significant, it isimportant to note that the increase in multiple births has not onlyinfluenced overall LBW rates but has had a large impact on the numbersof at-risk infants born each year (4,5,6). For example, had twin andtriplet/+ rates not risen from levels reported for 1980, there would havebeen at least 20,000 fewer LBW infants born in 1997.
Nebraska and New Jersey triplet/+ birth rates were twicethe national rate
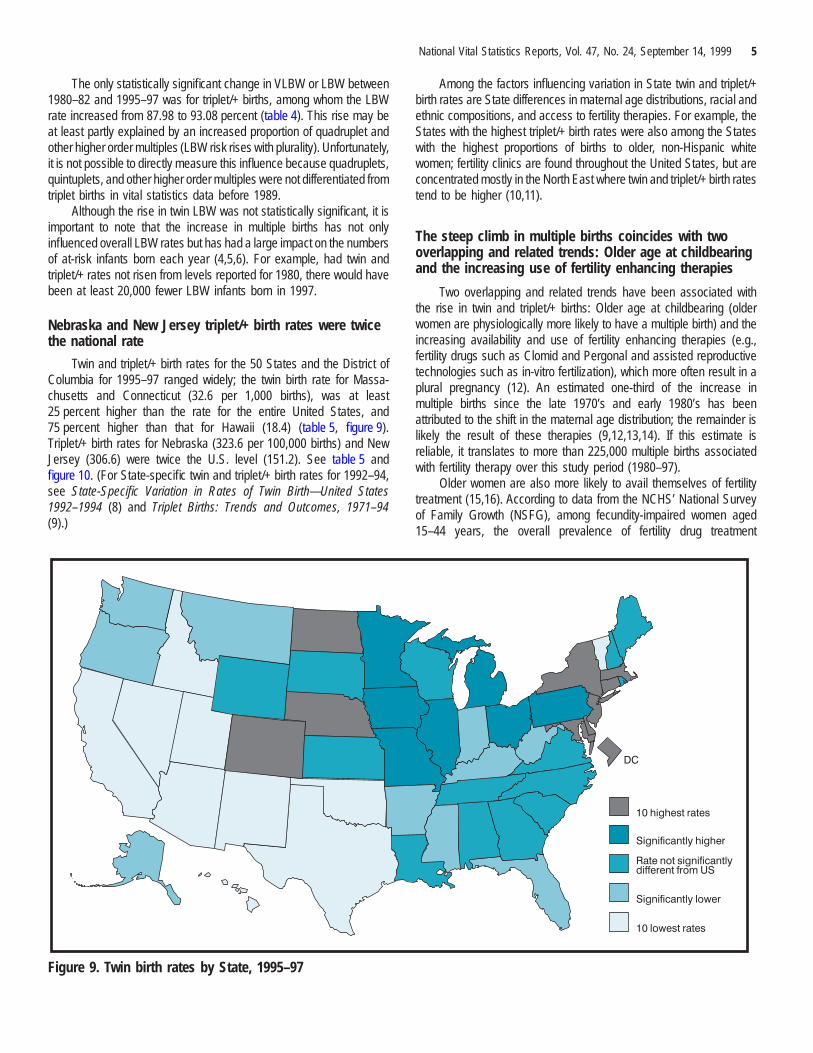
Twin and triplet/+ birth rates for the 50 States and the District ofColumbia for 1995–97 ranged widely; the twin birth rate for Massa-chusetts and Connecticut (32.6 per 1,000 births), was at least25 percent higher than the rate for the entire United States, and75 percent higher than that for Hawaii (18.4) (table 5, figure 9).Triplet/+ birth rates for Nebraska (323.6 per 100,000 births) and NewJersey (306.6) were twice the U.S. level (151.2). See table 5 andfigure 10. (For State-specific twin and triplet/+ birth rates for 1992–94,see State-Specific Variation in Rates of Twin Birth—United States1992–1994 (8) and Triplet Births: Trends and Outcomes, 1971–94(9).)
Figure 9. Twin birth rates by State, 1995–97
Among the factors influencing variation in State twin and triplet/+birth rates are State differences in maternal age distributions, racial andethnic compositions, and access to fertility therapies. For example, theStates with the highest triplet/+ birth rates were also among the Stateswith the highest proportions of births to older, non-Hispanic whitewomen; fertility clinics are found throughout the United States, but areconcentrated mostly in the North East where twin and triplet/+ birth ratestend to be higher (10,11).
The steep climb in multiple births coincides with twooverlapping and related trends: Older age at childbearingand the increasing use of fertility enhancing therapies
Two overlapping and related trends have been associated withthe rise in twin and triplet/+ births: Older age at childbearing (olderwomen are physiologically more likely to have a multiple birth) and theincreasing availability and use of fertility enhancing therapies (e.g.,fertility drugs such as Clomid and Pergonal and assisted reproductivetechnologies such as in-vitro fertilization), which more often result in aplural pregnancy (12). An estimated one-third of the increase inmultiple births since the late 1970’s and early 1980’s has beenattributed to the shift in the maternal age distribution; the remainder islikely the result of these therapies (9,12,13,14). If this estimate isreliable, it translates to more than 225,000 multiple births associatedwith fertility therapy over this study period (1980–97).
Older women are also more likely to avail themselves of fertilitytreatment (15,16). According to data from the NCHS’ National Surveyof Family Growth (NSFG), among fecundity-impaired women aged15–44 years, the overall prevalence of fertility drug treatment
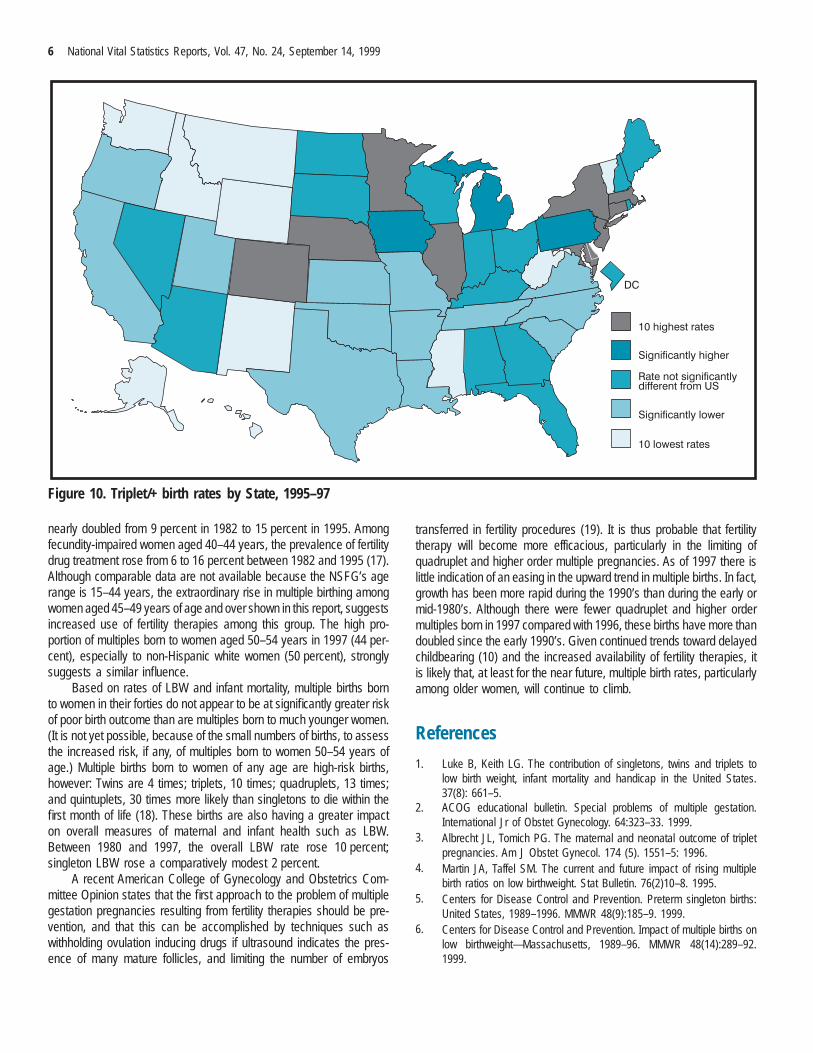
Figure 10. Triplet/+ birth rates by State, 1995–97
6 National Vital Statistics Reports, Vol. 47, No. 24, September 14, 1999
nearly doubled from 9 percent in 1982 to 15 percent in 1995. Amongfecundity-impaired women aged 40–44 years, the prevalence of fertilitydrug treatment rose from 6 to 16 percent between 1982 and 1995 (17).Although comparable data are not available because the NSFG’s agerange is 15–44 years, the extraordinary rise in multiple birthing amongwomen aged 45–49 years of age and over shown in this report, suggestsincreased use of fertility therapies among this group. The high pro-portion of multiples born to women aged 50–54 years in 1997 (44 per-cent), especially to non-Hispanic white women (50 percent), stronglysuggests a similar influence.
Based on rates of LBW and infant mortality, multiple births bornto women in their forties do not appear to be at significantly greater riskof poor birth outcome than are multiples born to much younger women.(It is not yet possible, because of the small numbers of births, to assessthe increased risk, if any, of multiples born to women 50–54 years ofage.) Multiple births born to women of any age are high-risk births,however: Twins are 4 times; triplets, 10 times; quadruplets, 13 times;and quintuplets, 30 times more likely than singletons to die within thefirst month of life (18). These births are also having a greater impacton overall measures of maternal and infant health such as LBW.Between 1980 and 1997, the overall LBW rate rose 10 percent;singleton LBW rose a comparatively modest 2 percent.
A recent American College of Gynecology and Obstetrics Com-mittee Opinion states that the first approach to the problem of multiplegestation pregnancies resulting from fertility therapies should be pre-vention, and that this can be accomplished by techniques such aswithholding ovulation inducing drugs if ultrasound indicates the pres-ence of many mature follicles, and limiting the number of embryos
transferred in fertility procedures (19). It is thus probable that fertilitytherapy will become more efficacious, particularly in the limiting ofquadruplet and higher order multiple pregnancies. As of 1997 there islittle indication of an easing in the upward trend in multiple births. In fact,growth has been more rapid during the 1990’s than during the early ormid-1980’s. Although there were fewer quadruplet and higher ordermultiples born in 1997 compared with 1996, these births have more thandoubled since the early 1990’s. Given continued trends toward delayedchildbearing (10) and the increased availability of fertility therapies, itis likely that, at least for the near future, multiple birth rates, particularlyamong older women, will continue to climb.
References
1. Luke B, Keith LG. The contribution of singletons, twins and triplets tolow birth weight, infant mortality and handicap in the United States.37(8): 661–5.
2. ACOG educational bulletin. Special problems of multiple gestation.International Jr of Obstet Gynecology. 64:323–33. 1999.
3. Albrecht JL, Tomich PG. The maternal and neonatal outcome of tripletpregnancies. Am J Obstet Gynecol. 174 (5). 1551–5: 1996.
4. Martin JA, Taffel SM. The current and future impact of rising multiplebirth ratios on low birthweight. Stat Bulletin. 76(2)10–8. 1995.
5. Centers for Disease Control and Prevention. Preterm singleton births:United States, 1989–1996. MMWR 48(9):185–9. 1999.
6. Centers for Disease Control and Prevention. Impact of multiple births onlow birthweight—Massachusetts, 1989–96. MMWR 48(14):289–92.1999.
National Vital Statistics Reports, Vol. 47, No. 24, September 14, 1999 7
7. MacDorman MF, Atkinson JO. Infant mortality statistics from the 1996period linked birth/infant death data set. Monthly vital statistics report;vol 46 no 12, supp. Hyattsville, Maryland: National Center for HealthStatistics. 1998.
8. Centers for Disease Control and Prevention. State-specific variation inrates of twin births—United States 1992–1994. MMWR 46(6):121–5.1997.
9. Martin JA, MacDorman MJ, Mathews TJ. Triplet births: Trends andoutcomes, 1971–94. National Center for Health Statistics. Vital HealthStat 21(55). 1997.
10. Ventura SJ, Martin JA, Curtin SC, Mathews TJ. Births: Final Data for1997. National vital statistics reports; vol 47 no.18. Hyattsville, Mary-land: National Center for Health Statistics. 1998.
11. Centers for Disease Control, American Society for Reproductive Medi-cine, RESOLVE. 1996 Assisted Reproductive Technology SuccessRates. National Summary and Fertility Clinic Reports. 1998.
12. Wilcox LS, Kiely JL, Melvin CL, Martin MC. Assisted reproductivetechnologies: Estimates of their contribution to multiple births andnewborn hospital days in the United States. Fertility and Sterility65(2):362–6. 1996.
13. Kiely JL. Kleinman JC, Kiely M. Triplets and higher-order multiple births:Time trends and infant mortality. AJDC. 146:862–8. 1992.
14. Jewell SE, Yip R. Increasing trends in plural births in the United States.Obstetrics and Gynecology 85 (2): 229–32. 1995.
15. Abma J, Chandra A, Mosher W, et al. Fertility, family planning andwomen’s health: New data from the 1995 National Survey of FamilyGrowth. National Center for Health Statistics. Vital Health Stat 23(19).1997.
16. Chandra A, Stephan EH. Impaired Fecundity in the United States:1982–1995. Family Planning Perspectives. 30(1): 34–42. 1998.
17. National Center for Health Statistics. Unpublished data from the 1995National Survey of Family Growth.
18. National Center for Health Statistics. Unpublished data from the linkedbirth/infant death data set, 1996 birth cohort.
19. American College of Obstetricians and Gynecologists. Nonselectiveembryo reduction: ethical guidance for the obstetrician-gynecologist.ACOG Committee Opinion 215. Washington: American College ofObstetricians and Gynecologists. 1999.
List of detailed tables1. Number and rate of twin and triplet/+ births by race and Hispanic
origin of mother, United States, 1980–97 . . . . . . . . . . . . . . . . 82. Number and rate of twin and triplet/+ births by age of mother,
1980–97 . . . . . . . . . . . . . . . . . . . . . . . . . . . . . . . . . . . . . . 103. Twin and triplet/+ birth rates by age, race, and Hispanic origin of
mother: United States, 1980–82, 1989–91, 1995–97 . . . . . . . . 124. Percent very low and low birthweight by plurality and age of
mother: United States, 1980–82 and 1995–97 . . . . . . . . . . . . 145. Twin and triplet/+ birth rates by State: United States and each
State, 1995–97 . . . . . . . . . . . . . . . . . . . . . . . . . . . . . . . . . 15

Table 1. Number and rate of twin and triplet/+ births by race and Hispanic origin of mother, United States,1980–97
Race, Hispanic origin, and yearTotalbirths Twin Triplet/+1 Twin Triplet/+1
All races2 NumberRate per 1,000
live birthsRate per 100,000
live births
1997 . . . . . . . . . . . . . . . . . . . 3,880,894 104,137 6,737 26.8 173.61996 . . . . . . . . . . . . . . . . . . . 3,891,494 100,750 5,939 25.9 152.61995 . . . . . . . . . . . . . . . . . . . 3,899,589 96,736 4,973 24.8 127.51994 . . . . . . . . . . . . . . . . . . . 3,952,767 97,064 4,594 24.6 116.21993 . . . . . . . . . . . . . . . . . . . 4,000,240 96,445 4,168 24.1 104.21992 . . . . . . . . . . . . . . . . . . . 4,065,014 95,372 3,883 23.5 95.51991 . . . . . . . . . . . . . . . . . . . 4,110,907 94,779 3,346 23.1 81.41990 . . . . . . . . . . . . . . . . . . . 4,158,212 93,865 3,028 22.6 72.81989 . . . . . . . . . . . . . . . . . . . 4,040,958 90,118 2,798 22.3 69.21988 . . . . . . . . . . . . . . . . . . . 3,909,510 85,315 2,385 21.8 61.01987 . . . . . . . . . . . . . . . . . . . 3,809,394 81,778 2,139 21.5 56.21986 . . . . . . . . . . . . . . . . . . . 3,756,547 79,485 1,814 21.2 48.31985 . . . . . . . . . . . . . . . . . . . 3,760,561 77,102 1,925 20.5 51.21984 . . . . . . . . . . . . . . . . . . . 3,669,141 72,949 1,653 19.9 45.11983 . . . . . . . . . . . . . . . . . . . 3,638,933 72,287 1,575 19.9 43.31982 . . . . . . . . . . . . . . . . . . . 3,680,537 71,631 1,484 19.5 40.31981 . . . . . . . . . . . . . . . . . . . 3,629,238 70,049 1,385 19.3 38.21980 . . . . . . . . . . . . . . . . . . . 3,612,258 68,339 1,337 18.9 37.0
White, total3
1997 . . . . . . . . . . . . . . . . . . . 3,072,640 82,090 6,018 26.7 195.91996 . . . . . . . . . . . . . . . . . . . 3,093,057 79,677 5,383 25.8 174.01995 . . . . . . . . . . . . . . . . . . . 3,098,885 76,196 4,505 24.6 145.41994 . . . . . . . . . . . . . . . . . . . 3,121,004 75,318 4,127 24.1 132.21993 . . . . . . . . . . . . . . . . . . . 3,149,833 74,643 3,748 23.7 119.01992 . . . . . . . . . . . . . . . . . . . 3,201,678 73,547 3,444 23.0 107.61991 . . . . . . . . . . . . . . . . . . . 3,241,273 73,045 2,905 22.5 89.61990 . . . . . . . . . . . . . . . . . . . 3,290,273 72,617 2,639 22.1 80.21989 . . . . . . . . . . . . . . . . . . . 3,192,355 69,373 2,483 21.7 77.81988 . . . . . . . . . . . . . . . . . . . 3,102,083 66,383 2,048 21.4 66.01987 . . . . . . . . . . . . . . . . . . . 3,043,828 64,005 1,821 21.0 59.81986 . . . . . . . . . . . . . . . . . . . 3,019,175 62,396 1,585 20.7 52.51985 . . . . . . . . . . . . . . . . . . . 3,037,913 60,351 1,648 19.9 54.21984 . . . . . . . . . . . . . . . . . . . 2,967,100 57,274 1,416 19.3 47.71983 . . . . . . . . . . . . . . . . . . . 2,946,468 56,604 1,319 19.2 44.81982 . . . . . . . . . . . . . . . . . . . 2,984,817 56,035 1,199 18.8 40.21981 . . . . . . . . . . . . . . . . . . . 2,947,679 54,341 1,188 18.4 40.31980 . . . . . . . . . . . . . . . . . . . 2,936,351 53,104 1,104 18.1 37.6
Non-Hispanic white
1997 . . . . . . . . . . . . . . . . . . . 2,333,363 67,191 5,386 28.8 230.81996 . . . . . . . . . . . . . . . . . . . 2,358,989 65,523 4,885 27.8 207.11995 . . . . . . . . . . . . . . . . . . . 2,382,638 62,370 4,050 26.2 170.01994 . . . . . . . . . . . . . . . . . . . 2,438,855 62,476 3,721 25.6 152.61993 . . . . . . . . . . . . . . . . . . . 2,472,031 61,525 3,360 24.9 135.919924 . . . . . . . . . . . . . . . . . . . 2,527,207 60,640 3,115 24.0 123.319914 . . . . . . . . . . . . . . . . . . . 2,589,878 60,904 2,612 23.5 100.919905 . . . . . . . . . . . . . . . . . . . 2,626,500 60,210 2,358 22.9 89.819896 . . . . . . . . . . . . . . . . . . . 2,526,367 56,798 2,172 22.5 86.0
See footnotes at end of table.
8 National Vital Statistics Reports, Vol. 47, No. 24, September 14, 1999

Table 1. Number and rate of twin and triplet/+ births by race and Hispanic origin of mother, United States,1980–97—Con.
Race, Hispanic origin, and yearTotalbirths Twin Triplet/+1 Twin Triplet/+1
Black, total3 NumberRate per 1,000
live birthsRate per 100,000
live births
1997 . . . . . . . . . . . . . . . . . . . 599,913 17,989 530 30.0 88.31996 . . . . . . . . . . . . . . . . . . . 594,781 17,285 439 29.1 73.81995 . . . . . . . . . . . . . . . . . . . 603,139 17,000 352 28.2 58.41994 . . . . . . . . . . . . . . . . . . . 617,689 18,344 358 28.8 56.31993 . . . . . . . . . . . . . . . . . . . 658,875 18,551 327 28.2 49.61992 . . . . . . . . . . . . . . . . . . . 673,633 18,619 361 27.6 53.61991 . . . . . . . . . . . . . . . . . . . 682,602 18,593 368 27.2 53.91990 . . . . . . . . . . . . . . . . . . . 684,336 18,164 321 26.5 46.91989 . . . . . . . . . . . . . . . . . . . 673,124 17,844 262 26.5 38.91988 . . . . . . . . . . . . . . . . . . . 638,562 16,334 286 25.6 44.81987 . . . . . . . . . . . . . . . . . . . 611,173 15,450 246 25.3 40.31986 . . . . . . . . . . . . . . . . . . . 592,910 14,662 199 24.7 33.61985 . . . . . . . . . . . . . . . . . . . 581,824 14,646 240 25.2 41.21984 . . . . . . . . . . . . . . . . . . . 568,138 13,616 195 24.0 34.31983 . . . . . . . . . . . . . . . . . . . 562,624 13,711 216 24.4 38.41982 . . . . . . . . . . . . . . . . . . . 568,506 13,592 240 23.9 42.21981 . . . . . . . . . . . . . . . . . . . 564,955 13,928 172 24.7 30.41980 . . . . . . . . . . . . . . . . . . . 568,080 13,638 211 24.0 37.1
Non-Hispanic black
1997 . . . . . . . . . . . . . . . . . . . 581,431 17,472 523 30.0 90.01996 . . . . . . . . . . . . . . . . . . . 578,099 16,873 425 29.2 73.51995 . . . . . . . . . . . . . . . . . . . 587,781 16,622 340 28.3 57.81994 . . . . . . . . . . . . . . . . . . . 619,198 17,934 357 29.0 57.71993 . . . . . . . . . . . . . . . . . . . 641,273 18,115 314 28.2 49.019924 . . . . . . . . . . . . . . . . . . . 657,450 18,294 346 27.8 52.619914 . . . . . . . . . . . . . . . . . . . 666,758 18,243 367 27.4 55.019905 . . . . . . . . . . . . . . . . . . . 661,701 17,646 306 26.7 46.219896 . . . . . . . . . . . . . . . . . . . 611,269 16,266 246 26.6 40.2
Hispanic
1997 . . . . . . . . . . . . . . . . . . . 709,767 13,821 516 19.5 72.71996 . . . . . . . . . . . . . . . . . . . 701,339 13,014 409 18.6 58.31995 . . . . . . . . . . . . . . . . . . . 679,768 12,685 355 18.7 52.21994 . . . . . . . . . . . . . . . . . . . 665,026 12,206 348 18.4 52.31993 . . . . . . . . . . . . . . . . . . . 654,418 12,294 321 18.8 49.119924 . . . . . . . . . . . . . . . . . . . 643,271 11,932 239 18.5 37.219914 . . . . . . . . . . . . . . . . . . . 623,085 11,356 235 18.2 37.719905 . . . . . . . . . . . . . . . . . . . 595,073 10,713 235 18.0 39.519896 . . . . . . . . . . . . . . . . . . . 532,249 9,701 189 18.2 35.5
1Includes quadruplets and other higher order multiple births.2Includes races other than white and black and origin not stated.3Includes births to women of Hispanic origin.4Excludes data for New Hampshire, which did not report Hispanic origin.5Excludes data for New Hampshire and Oklahoma, which did not report Hispanic origin.6Excludes data for Louisiana, New Hampshire, and Oklahoma, which did not report Hispanic origin.
NOTES: Race and Hispanic origin are reported separately on birth certificates. Persons of Hispanic origin may be of any race.
National Vital Statistics Reports, Vol. 47, No. 24, September 14, 1999 9

Table 2. Number and rate of twin and triplet/+ births by age of mother, 1980–97
Plurality and yearAll
agesUnder 20
years20–24years
25–29years
30–34years
35–39years
40–44years
45–49years
50–54years
Twin Number
1997 . . . . . . . . . . . . . . . . . . . 104,137 7,415 19,188 28,083 29,905 16,113 2,939 444 501996 . . . . . . . . . . . . . . . . . . . 100,750 7,300 19,134 27,612 28,963 14,958 2,467 316 - - -1995 . . . . . . . . . . . . . . . . . . . 96,736 7,273 19,235 26,385 27,699 13,693 2,173 278 - - -1994 . . . . . . . . . . . . . . . . . . . 97,064 7,483 20,106 27,418 27,275 12,523 2,061 198 - - -1993 . . . . . . . . . . . . . . . . . . . 96,445 7,252 20,599 27,788 26,957 12,042 1,698 109 - - -1992 . . . . . . . . . . . . . . . . . . . 95,372 7,361 20,790 28,089 26,434 11,159 1,477 62 - - -1991 . . . . . . . . . . . . . . . . . . . 94,779 7,618 21,171 28,909 25,156 10,522 1,368 35 - - -1990 . . . . . . . . . . . . . . . . . . . 93,865 7,605 20,945 30,020 24,466 9,587 1,203 39 - - -1989 . . . . . . . . . . . . . . . . . . . 90,118 7,082 20,928 29,564 22,891 8,572 1,067 14 - - -1988 . . . . . . . . . . . . . . . . . . . 85,315 6,742 20,258 28,156 21,388 7,870 882 19 - - -1987 . . . . . . . . . . . . . . . . . . . 81,778 6,625 20,265 27,707 19,603 6,823 721 34 - - -1986 . . . . . . . . . . . . . . . . . . . 79,485 6,507 20,044 27,268 18,709 6,260 680 17 - - -1985 . . . . . . . . . . . . . . . . . . . 77,102 6,212 20,931 25,969 17,750 5,638 580 22 - - -1984 . . . . . . . . . . . . . . . . . . . 72,949 6,228 20,211 24,890 15,920 5,106 581 13 - - -1983 . . . . . . . . . . . . . . . . . . . 72,287 6,625 20,951 24,597 14,995 4,564 539 16 - - -1982 . . . . . . . . . . . . . . . . . . . 71,631 6,717 21,530 24,300 14,459 4,082 522 21 - - -1981 . . . . . . . . . . . . . . . . . . . 70,049 7,265 21,320 23,610 13,718 3,644 482 10 - - -1980 . . . . . . . . . . . . . . . . . . . 68,339 7,212 21,374 22,712 12,944 3,559 530 8 - - -
Rate per 1,000 live births in specified group
1997 . . . . . . . . . . . . . . . . . . . 26.8 15.0 20.4 26.3 33.7 39.3 38.6 133.2 347.21996 . . . . . . . . . . . . . . . . . . . 25.9 14.5 20.2 25.8 32.3 37.4 34.4 103.8 - - -1995 . . . . . . . . . . . . . . . . . . . 24.8 14.2 19.9 24.8 30.6 35.7 32.3 101.9 - - -1994 . . . . . . . . . . . . . . . . . . . 24.6 14.4 20.1 25.2 30.1 33.7 32.5 79.0 - - -1993 . . . . . . . . . . . . . . . . . . . 24.1 14.1 19.8 24.6 29.9 33.7 28.7 46.8 - - -1992 . . . . . . . . . . . . . . . . . . . 23.5 14.2 19.4 23.8 29.5 32.4 26.5 30.9 - - -1991 . . . . . . . . . . . . . . . . . . . 23.1 14.3 19.4 23.7 28.4 31.8 26.3 20.5 - - -1990 . . . . . . . . . . . . . . . . . . . 22.6 14.3 19.2 23.5 27.6 30.2 24.7 23.8 - - -1989 . . . . . . . . . . . . . . . . . . . 22.3 13.7 19.4 23.4 27.2 29.2 24.0 * - - -1988 . . . . . . . . . . . . . . . . . . . 21.8 13.8 19.0 22.7 26.6 29.2 22.4 * - - -1987 . . . . . . . . . . . . . . . . . . . 21.5 14.0 18.8 22.8 25.8 27.5 20.7 24.7 - - -1986 . . . . . . . . . . . . . . . . . . . 21.2 13.8 18.2 22.7 25.9 27.2 22.8 * - - -1985 . . . . . . . . . . . . . . . . . . . 20.5 13.0 18.3 21.6 25.5 26.3 20.5 18.9 - - -1984 . . . . . . . . . . . . . . . . . . . 19.9 13.0 17.7 21.4 24.2 26.1 21.6 * - - -1983 . . . . . . . . . . . . . . . . . . . 19.9 13.3 18.1 21.4 24.0 25.3 20.8 * - - -1982 . . . . . . . . . . . . . . . . . . . 19.5 12.8 17.9 21.1 23.9 24.3 21.2 17.0 - - -1981 . . . . . . . . . . . . . . . . . . . 19.3 13.5 17.6 20.9 23.6 24.9 20.7 * - - -1980 . . . . . . . . . . . . . . . . . . . 18.9 12.8 17.4 20.5 23.5 25.3 23.0 * - - -
Triplet/+1 Number
1997 . . . . . . . . . . . . . . . . . . . 6,737 102 441 1,615 2,604 1,652 240 70 131996 . . . . . . . . . . . . . . . . . . . 5,939 80 372 1,455 2,546 1,242 210 34 - - -1995 . . . . . . . . . . . . . . . . . . . 4,973 90 341 1,258 1,965 1,095 184 40 - - -1994 . . . . . . . . . . . . . . . . . . . 4,594 76 335 1,223 1,913 874 143 30 - - -1993 . . . . . . . . . . . . . . . . . . . 4,168 81 364 1,031 1,858 714 113 7 - - -1992 . . . . . . . . . . . . . . . . . . . 3,883 74 412 1,118 1,462 731 77 9 - - -1991 . . . . . . . . . . . . . . . . . . . 3,346 82 400 1,019 1,262 555 28 – - - -1990 . . . . . . . . . . . . . . . . . . . 3,028 85 354 944 1,119 498 28 – - - -1989 . . . . . . . . . . . . . . . . . . . 2,798 76 299 938 1,089 353 36 7 - - -1988 . . . . . . . . . . . . . . . . . . . 2,385 48 356 862 740 346 33 – - - -1987 . . . . . . . . . . . . . . . . . . . 2,139 69 312 876 665 196 21 – - - -1986 . . . . . . . . . . . . . . . . . . . 1,814 68 282 718 582 158 6 – - - -1985 . . . . . . . . . . . . . . . . . . . 1,925 66 400 797 496 150 16 – - - -1984 . . . . . . . . . . . . . . . . . . . 1,653 55 365 589 480 152 11 1 - - -1983 . . . . . . . . . . . . . . . . . . . 1,575 91 336 624 410 114 – – - - -1982 . . . . . . . . . . . . . . . . . . . 1,484 79 369 524 406 103 3 – - - -1981 . . . . . . . . . . . . . . . . . . . 1,385 96 309 566 323 80 11 – - - -1980 . . . . . . . . . . . . . . . . . . . 1,337 83 385 474 321 67 6 1 - - -
See footnotes at end of table.
10 National Vital Statistics Reports, Vol. 47, No. 24, September 14, 1999
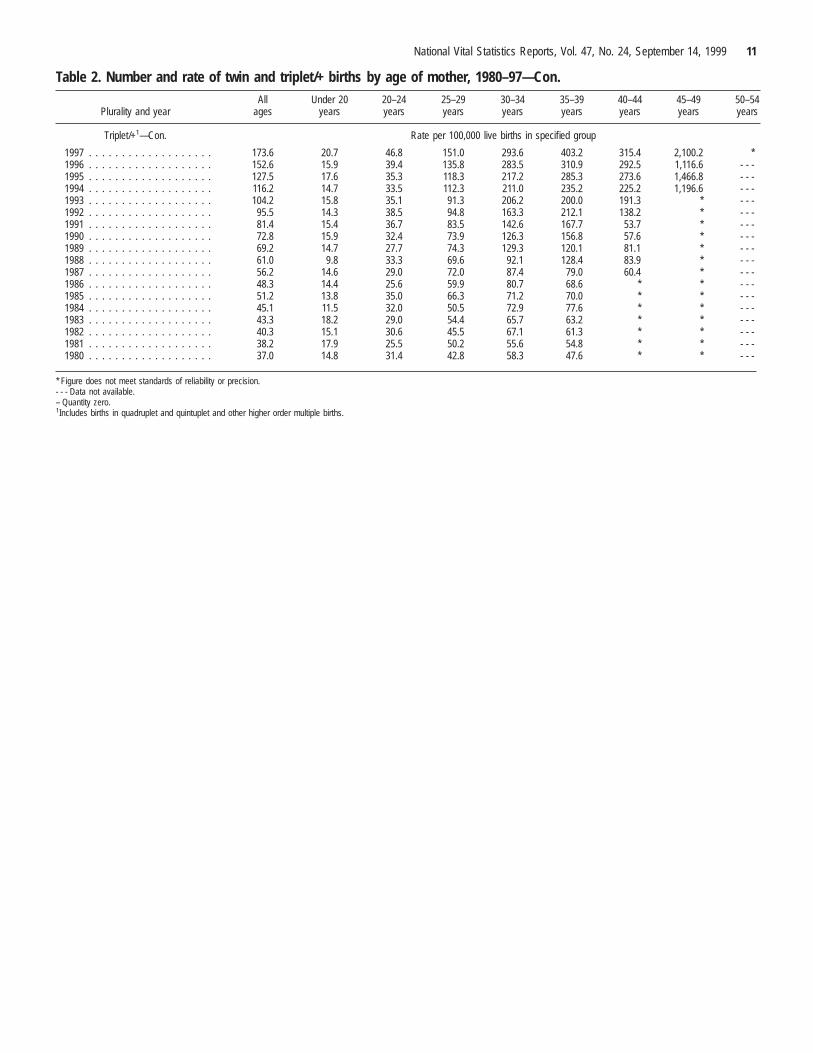
Table 2. Number and rate of twin and triplet/+ births by age of mother, 1980–97—Con.
Plurality and yearAll
agesUnder 20
years20–24years
25–29years
30–34years
35–39years
40–44years
45–49years
50–54years
Triplet/+1—Con. Rate per 100,000 live births in specified group
1997 . . . . . . . . . . . . . . . . . . . 173.6 20.7 46.8 151.0 293.6 403.2 315.4 2,100.2 *1996 . . . . . . . . . . . . . . . . . . . 152.6 15.9 39.4 135.8 283.5 310.9 292.5 1,116.6 - - -1995 . . . . . . . . . . . . . . . . . . . 127.5 17.6 35.3 118.3 217.2 285.3 273.6 1,466.8 - - -1994 . . . . . . . . . . . . . . . . . . . 116.2 14.7 33.5 112.3 211.0 235.2 225.2 1,196.6 - - -1993 . . . . . . . . . . . . . . . . . . . 104.2 15.8 35.1 91.3 206.2 200.0 191.3 * - - -1992 . . . . . . . . . . . . . . . . . . . 95.5 14.3 38.5 94.8 163.3 212.1 138.2 * - - -1991 . . . . . . . . . . . . . . . . . . . 81.4 15.4 36.7 83.5 142.6 167.7 53.7 * - - -1990 . . . . . . . . . . . . . . . . . . . 72.8 15.9 32.4 73.9 126.3 156.8 57.6 * - - -1989 . . . . . . . . . . . . . . . . . . . 69.2 14.7 27.7 74.3 129.3 120.1 81.1 * - - -1988 . . . . . . . . . . . . . . . . . . . 61.0 9.8 33.3 69.6 92.1 128.4 83.9 * - - -1987 . . . . . . . . . . . . . . . . . . . 56.2 14.6 29.0 72.0 87.4 79.0 60.4 * - - -1986 . . . . . . . . . . . . . . . . . . . 48.3 14.4 25.6 59.9 80.7 68.6 * * - - -1985 . . . . . . . . . . . . . . . . . . . 51.2 13.8 35.0 66.3 71.2 70.0 * * - - -1984 . . . . . . . . . . . . . . . . . . . 45.1 11.5 32.0 50.5 72.9 77.6 * * - - -1983 . . . . . . . . . . . . . . . . . . . 43.3 18.2 29.0 54.4 65.7 63.2 * * - - -1982 . . . . . . . . . . . . . . . . . . . 40.3 15.1 30.6 45.5 67.1 61.3 * * - - -1981 . . . . . . . . . . . . . . . . . . . 38.2 17.9 25.5 50.2 55.6 54.8 * * - - -1980 . . . . . . . . . . . . . . . . . . . 37.0 14.8 31.4 42.8 58.3 47.6 * * - - -
* Figure does not meet standards of reliability or precision.- - - Data not available.– Quantity zero.1Includes births in quadruplet and quintuplet and other higher order multiple births.
National Vital Statistics Reports, Vol. 47, No. 24, September 14, 1999 11
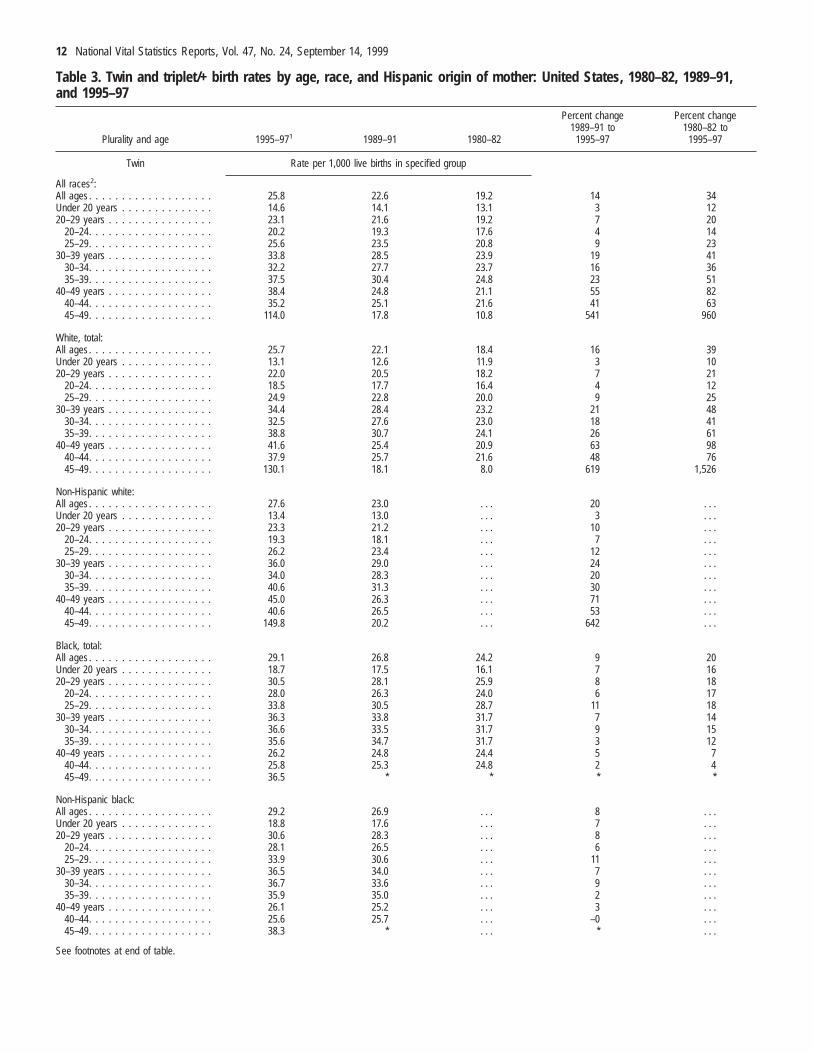
Table 3. Twin and triplet/+ birth rates by age, race, and Hispanic origin of mother: United States, 1980–82, 1989–91,and 1995–97
Plurality and age 1995–971 1989–91 1980–82
Percent change1989–91 to
1995–97
Percent change1980–82 to
1995–97
Twin Rate per 1,000 live births in specified group
All races2:All ages . . . . . . . . . . . . . . . . . . . 25.8 22.6 19.2 14 34Under 20 years . . . . . . . . . . . . . . 14.6 14.1 13.1 3 1220–29 years . . . . . . . . . . . . . . . . 23.1 21.6 19.2 7 20
20–24. . . . . . . . . . . . . . . . . . . 20.2 19.3 17.6 4 1425–29. . . . . . . . . . . . . . . . . . . 25.6 23.5 20.8 9 23
30–39 years . . . . . . . . . . . . . . . . 33.8 28.5 23.9 19 4130–34. . . . . . . . . . . . . . . . . . . 32.2 27.7 23.7 16 3635–39. . . . . . . . . . . . . . . . . . . 37.5 30.4 24.8 23 51
40–49 years . . . . . . . . . . . . . . . . 38.4 24.8 21.1 55 8240–44. . . . . . . . . . . . . . . . . . . 35.2 25.1 21.6 41 6345–49. . . . . . . . . . . . . . . . . . . 114.0 17.8 10.8 541 960
White, total:All ages . . . . . . . . . . . . . . . . . . . 25.7 22.1 18.4 16 39Under 20 years . . . . . . . . . . . . . . 13.1 12.6 11.9 3 1020–29 years . . . . . . . . . . . . . . . . 22.0 20.5 18.2 7 21
20–24. . . . . . . . . . . . . . . . . . . 18.5 17.7 16.4 4 1225–29. . . . . . . . . . . . . . . . . . . 24.9 22.8 20.0 9 25
30–39 years . . . . . . . . . . . . . . . . 34.4 28.4 23.2 21 4830–34. . . . . . . . . . . . . . . . . . . 32.5 27.6 23.0 18 4135–39. . . . . . . . . . . . . . . . . . . 38.8 30.7 24.1 26 61
40–49 years . . . . . . . . . . . . . . . . 41.6 25.4 20.9 63 9840–44. . . . . . . . . . . . . . . . . . . 37.9 25.7 21.6 48 7645–49. . . . . . . . . . . . . . . . . . . 130.1 18.1 8.0 619 1,526
Non-Hispanic white:All ages . . . . . . . . . . . . . . . . . . . 27.6 23.0 . . . 20 . . .Under 20 years . . . . . . . . . . . . . . 13.4 13.0 . . . 3 . . .20–29 years . . . . . . . . . . . . . . . . 23.3 21.2 . . . 10 . . .
20–24. . . . . . . . . . . . . . . . . . . 19.3 18.1 . . . 7 . . .25–29. . . . . . . . . . . . . . . . . . . 26.2 23.4 . . . 12 . . .
30–39 years . . . . . . . . . . . . . . . . 36.0 29.0 . . . 24 . . .30–34. . . . . . . . . . . . . . . . . . . 34.0 28.3 . . . 20 . . .35–39. . . . . . . . . . . . . . . . . . . 40.6 31.3 . . . 30 . . .
40–49 years . . . . . . . . . . . . . . . . 45.0 26.3 . . . 71 . . .40–44. . . . . . . . . . . . . . . . . . . 40.6 26.5 . . . 53 . . .45–49. . . . . . . . . . . . . . . . . . . 149.8 20.2 . . . 642 . . .
Black, total:All ages . . . . . . . . . . . . . . . . . . . 29.1 26.8 24.2 9 20Under 20 years . . . . . . . . . . . . . . 18.7 17.5 16.1 7 1620–29 years . . . . . . . . . . . . . . . . 30.5 28.1 25.9 8 18
20–24. . . . . . . . . . . . . . . . . . . 28.0 26.3 24.0 6 1725–29. . . . . . . . . . . . . . . . . . . 33.8 30.5 28.7 11 18
30–39 years . . . . . . . . . . . . . . . . 36.3 33.8 31.7 7 1430–34. . . . . . . . . . . . . . . . . . . 36.6 33.5 31.7 9 1535–39. . . . . . . . . . . . . . . . . . . 35.6 34.7 31.7 3 12
40–49 years . . . . . . . . . . . . . . . . 26.2 24.8 24.4 5 740–44. . . . . . . . . . . . . . . . . . . 25.8 25.3 24.8 2 445–49. . . . . . . . . . . . . . . . . . . 36.5 * * * *
Non-Hispanic black:All ages . . . . . . . . . . . . . . . . . . . 29.2 26.9 . . . 8 . . .Under 20 years . . . . . . . . . . . . . . 18.8 17.6 . . . 7 . . .20–29 years . . . . . . . . . . . . . . . . 30.6 28.3 . . . 8 . . .
20–24. . . . . . . . . . . . . . . . . . . 28.1 26.5 . . . 6 . . .25–29. . . . . . . . . . . . . . . . . . . 33.9 30.6 . . . 11 . . .
30–39 years . . . . . . . . . . . . . . . . 36.5 34.0 . . . 7 . . .30–34. . . . . . . . . . . . . . . . . . . 36.7 33.6 . . . 9 . . .35–39. . . . . . . . . . . . . . . . . . . 35.9 35.0 . . . 2 . . .
40–49 years . . . . . . . . . . . . . . . . 26.1 25.2 . . . 3 . . .40–44. . . . . . . . . . . . . . . . . . . 25.6 25.7 . . . –0 . . .45–49. . . . . . . . . . . . . . . . . . . 38.3 * . . . * . . .
See footnotes at end of table.
12 National Vital Statistics Reports, Vol. 47, No. 24, September 14, 1999
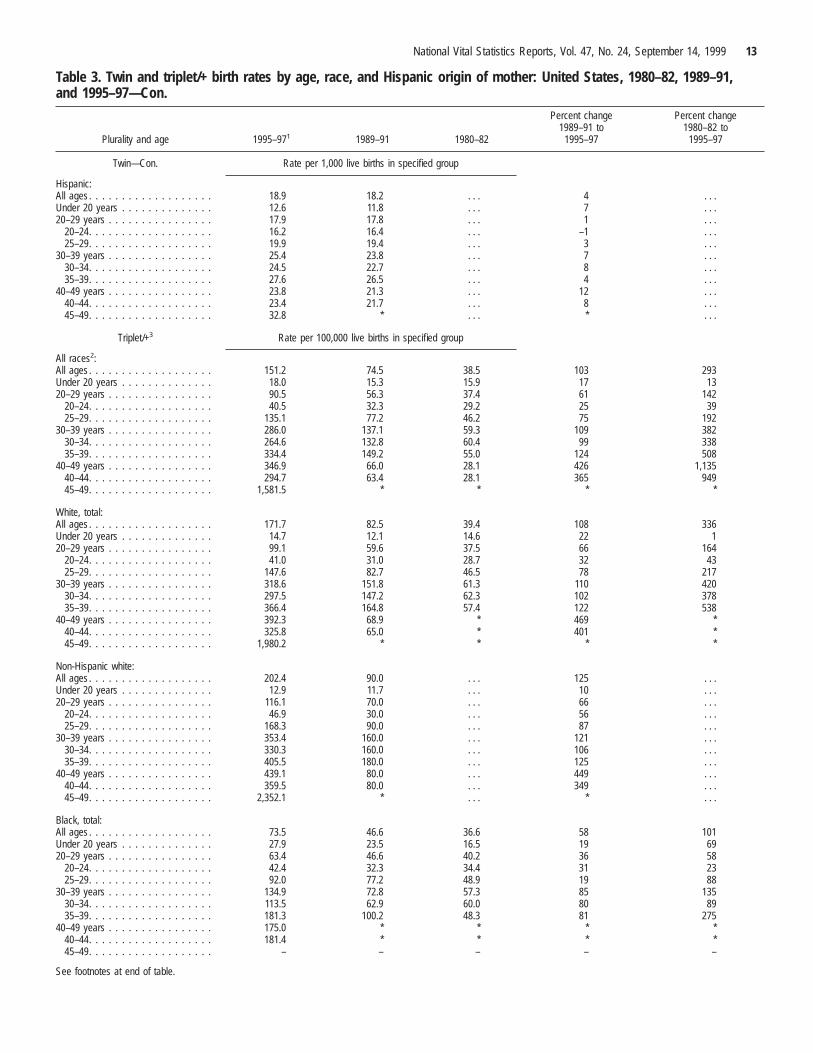
Table 3. Twin and triplet/+ birth rates by age, race, and Hispanic origin of mother: United States, 1980–82, 1989–91,and 1995–97—Con.
Plurality and age 1995–971 1989–91 1980–82
Percent change1989–91 to
1995–97
Percent change1980–82 to
1995–97
Twin—Con. Rate per 1,000 live births in specified group
Hispanic:All ages . . . . . . . . . . . . . . . . . . . 18.9 18.2 . . . 4 . . .Under 20 years . . . . . . . . . . . . . . 12.6 11.8 . . . 7 . . .20–29 years . . . . . . . . . . . . . . . . 17.9 17.8 . . . 1 . . .
20–24. . . . . . . . . . . . . . . . . . . 16.2 16.4 . . . –1 . . .25–29. . . . . . . . . . . . . . . . . . . 19.9 19.4 . . . 3 . . .
30–39 years . . . . . . . . . . . . . . . . 25.4 23.8 . . . 7 . . .30–34. . . . . . . . . . . . . . . . . . . 24.5 22.7 . . . 8 . . .35–39. . . . . . . . . . . . . . . . . . . 27.6 26.5 . . . 4 . . .
40–49 years . . . . . . . . . . . . . . . . 23.8 21.3 . . . 12 . . .40–44. . . . . . . . . . . . . . . . . . . 23.4 21.7 . . . 8 . . .45–49. . . . . . . . . . . . . . . . . . . 32.8 * . . . * . . .
Triplet/+3 Rate per 100,000 live births in specified group
All races2:All ages . . . . . . . . . . . . . . . . . . . 151.2 74.5 38.5 103 293Under 20 years . . . . . . . . . . . . . . 18.0 15.3 15.9 17 1320–29 years . . . . . . . . . . . . . . . . 90.5 56.3 37.4 61 142
20–24. . . . . . . . . . . . . . . . . . . 40.5 32.3 29.2 25 3925–29. . . . . . . . . . . . . . . . . . . 135.1 77.2 46.2 75 192
30–39 years . . . . . . . . . . . . . . . . 286.0 137.1 59.3 109 38230–34. . . . . . . . . . . . . . . . . . . 264.6 132.8 60.4 99 33835–39. . . . . . . . . . . . . . . . . . . 334.4 149.2 55.0 124 508
40–49 years . . . . . . . . . . . . . . . . 346.9 66.0 28.1 426 1,13540–44. . . . . . . . . . . . . . . . . . . 294.7 63.4 28.1 365 94945–49. . . . . . . . . . . . . . . . . . . 1,581.5 * * * *
White, total:All ages . . . . . . . . . . . . . . . . . . . 171.7 82.5 39.4 108 336Under 20 years . . . . . . . . . . . . . . 14.7 12.1 14.6 22 120–29 years . . . . . . . . . . . . . . . . 99.1 59.6 37.5 66 164
20–24. . . . . . . . . . . . . . . . . . . 41.0 31.0 28.7 32 4325–29. . . . . . . . . . . . . . . . . . . 147.6 82.7 46.5 78 217
30–39 years . . . . . . . . . . . . . . . . 318.6 151.8 61.3 110 42030–34. . . . . . . . . . . . . . . . . . . 297.5 147.2 62.3 102 37835–39. . . . . . . . . . . . . . . . . . . 366.4 164.8 57.4 122 538
40–49 years . . . . . . . . . . . . . . . . 392.3 68.9 * 469 *40–44. . . . . . . . . . . . . . . . . . . 325.8 65.0 * 401 *45–49. . . . . . . . . . . . . . . . . . . 1,980.2 * * * *
Non-Hispanic white:All ages . . . . . . . . . . . . . . . . . . . 202.4 90.0 . . . 125 . . .Under 20 years . . . . . . . . . . . . . . 12.9 11.7 . . . 10 . . .20–29 years . . . . . . . . . . . . . . . . 116.1 70.0 . . . 66 . . .
20–24. . . . . . . . . . . . . . . . . . . 46.9 30.0 . . . 56 . . .25–29. . . . . . . . . . . . . . . . . . . 168.3 90.0 . . . 87 . . .
30–39 years . . . . . . . . . . . . . . . . 353.4 160.0 . . . 121 . . .30–34. . . . . . . . . . . . . . . . . . . 330.3 160.0 . . . 106 . . .35–39. . . . . . . . . . . . . . . . . . . 405.5 180.0 . . . 125 . . .
40–49 years . . . . . . . . . . . . . . . . 439.1 80.0 . . . 449 . . .40–44. . . . . . . . . . . . . . . . . . . 359.5 80.0 . . . 349 . . .45–49. . . . . . . . . . . . . . . . . . . 2,352.1 * . . . * . . .
Black, total:All ages . . . . . . . . . . . . . . . . . . . 73.5 46.6 36.6 58 101Under 20 years . . . . . . . . . . . . . . 27.9 23.5 16.5 19 6920–29 years . . . . . . . . . . . . . . . . 63.4 46.6 40.2 36 58
20–24. . . . . . . . . . . . . . . . . . . 42.4 32.3 34.4 31 2325–29. . . . . . . . . . . . . . . . . . . 92.0 77.2 48.9 19 88
30–39 years . . . . . . . . . . . . . . . . 134.9 72.8 57.3 85 13530–34. . . . . . . . . . . . . . . . . . . 113.5 62.9 60.0 80 8935–39. . . . . . . . . . . . . . . . . . . 181.3 100.2 48.3 81 275
40–49 years . . . . . . . . . . . . . . . . 175.0 * * * *40–44. . . . . . . . . . . . . . . . . . . 181.4 * * * *45–49. . . . . . . . . . . . . . . . . . . – – – – –
See footnotes at end of table.
National Vital Statistics Reports, Vol. 47, No. 24, September 14, 1999 13

Table 3. Twin and triplet/+ birth rates by age, race, and Hispanic origin of mother: United States, 1980–82, 1989–91,and 1995–97—Con.
Plurality and age 1995–971 1989–91 1980–82
Percent change1989–91 to
1995–97
Percent change1980–82 to
1995–97
Triplet/+3—Con. Rate per 100,000 live births in specified group
Non-Hispanic black:All ages . . . . . . . . . . . . . . . . . . . 73.7 50.0 . . . 47 . . .Under 20 years . . . . . . . . . . . . . . 27.0 24.6 . . . 10 . . .20–29 years . . . . . . . . . . . . . . . . 64.7 50.0 . . . 29 . . .
20–24. . . . . . . . . . . . . . . . . . . 43.1 40.0 . . . 8 . . .25–29. . . . . . . . . . . . . . . . . . . 94.2 60.0 . . . 57 . . .
30–39 years . . . . . . . . . . . . . . . . 134.1 70.0 . . . 92 . . .30–34. . . . . . . . . . . . . . . . . . . 115.0 60.0 . . . 92 . . .35–39. . . . . . . . . . . . . . . . . . . 175.6 110.0 . . . 60 . . .
40–49 years . . . . . . . . . . . . . . . . 181.6 * . . . * . . .40–44. . . . . . . . . . . . . . . . . . . 188.2 * . . . * . . .45–49. . . . . . . . . . . . . . . . . . . – – . . . – . . .
Hispanic:All ages . . . . . . . . . . . . . . . . . . . 61.2 40.0 . . . 53 . . .Under 20 years . . . . . . . . . . . . . . 19.8 12.8 . . . 54 . . .20–29 years . . . . . . . . . . . . . . . . 45.2 30.0 . . . 51 . . .
20–24. . . . . . . . . . . . . . . . . . . 25.1 20.0 . . . 26 . . .25–29. . . . . . . . . . . . . . . . . . . 68.4 50.0 . . . 37 . . .
30–39 years . . . . . . . . . . . . . . . . 124.0 70.0 . . . 77 . . .30–34. . . . . . . . . . . . . . . . . . . 114.5 70.0 . . . 64 . . .35–39. . . . . . . . . . . . . . . . . . . 146.9 60.0 . . . 145 . . .
40–49 years . . . . . . . . . . . . . . . . 143.2 * . . . * . . .40–44. . . . . . . . . . . . . . . . . . . 128.9 – . . . – . . .45–49. . . . . . . . . . . . . . . . . . . * * . . . * . . .
. . . Category not applicable.* Figure does not meet standards of reliability or precision.– Quantity zero.1For 1997, births to women aged 50–54 years are not included in the calculation of rates for 1995–97. See Technical notes.2Includes races other than white and black.3Includes births in quadruplet and quintuplet and other higher order multiple births.
NOTES: Race and Hispanic origin are reported separately on birth certificates. Persons of Hispanic origin may be of any race.
Table 4. Percent very low and low birthweight by plurality and age of mother: United States, 1980–82 and 1995–97
Age and race of mother
Twin Triplet /+1 Singleton
1995–97 1980–82 1995–97 1980–82 1995–97 1980–82
Very low birthweight2
All ages . . . . . . . . . . . . . . . . . . . 10.20 10.36 36.92 36.42 1.09 0.97
Under 20 years . . . . . . . . . . . . . . 16.96 17.64 55.35 50.40 1.54 1.5120–24 years . . . . . . . . . . . . . . . . 11.91 11.84 47.07 46.33 1.10 0.9425–29 years . . . . . . . . . . . . . . . . 9.93 8.86 42.39 35.60 0.92 0.7930–34 years . . . . . . . . . . . . . . . . 8.76 7.82 35.15 26.46 0.94 0.8435–39 years . . . . . . . . . . . . . . . . 8.34 7.56 31.44 29.20 1.22 1.0240–44 years . . . . . . . . . . . . . . . . 8.02 6.85 27.17 * 1.57 1.1845–49 years . . . . . . . . . . . . . . . . 8.49 * 40.14 * 1.71 1.65
Low birthweight3
All ages . . . . . . . . . . . . . . . . . . . 53.44 50.80 93.08 87.98 6.05 5.91
Under 20 years . . . . . . . . . . . . . . 68.08 65.07 96.31 93.55 8.59 8.7420–24 years . . . . . . . . . . . . . . . . 58.72 55.82 95.37 91.40 6.29 6.0225–29 years . . . . . . . . . . . . . . . . 53.16 47.34 94.72 88.46 5.17 4.8930–34 years . . . . . . . . . . . . . . . . 49.33 43.80 92.90 83.70 5.16 4.8935–39 years . . . . . . . . . . . . . . . . 48.65 43.73 91.31 82.80 6.30 5.9940–44 years . . . . . . . . . . . . . . . . 49.24 43.80 89.57 * 7.81 7.5845–49 years . . . . . . . . . . . . . . . . 54.19 * 93.66 * 9.18 9.59
* Figure does not meet standards of reliability or precision.1Includes quadruplet and other higher order multiple births.2Very low birthweight is less than 1,500 grams.3Low birthweight is less than 2,500 grams.
NOTES: For 1997, births to women aged 50–54 years are not included in the calculation of rates for 1995–97. See Technical notes.
14 National Vital Statistics Reports, Vol. 47, No. 24, September 14, 1999
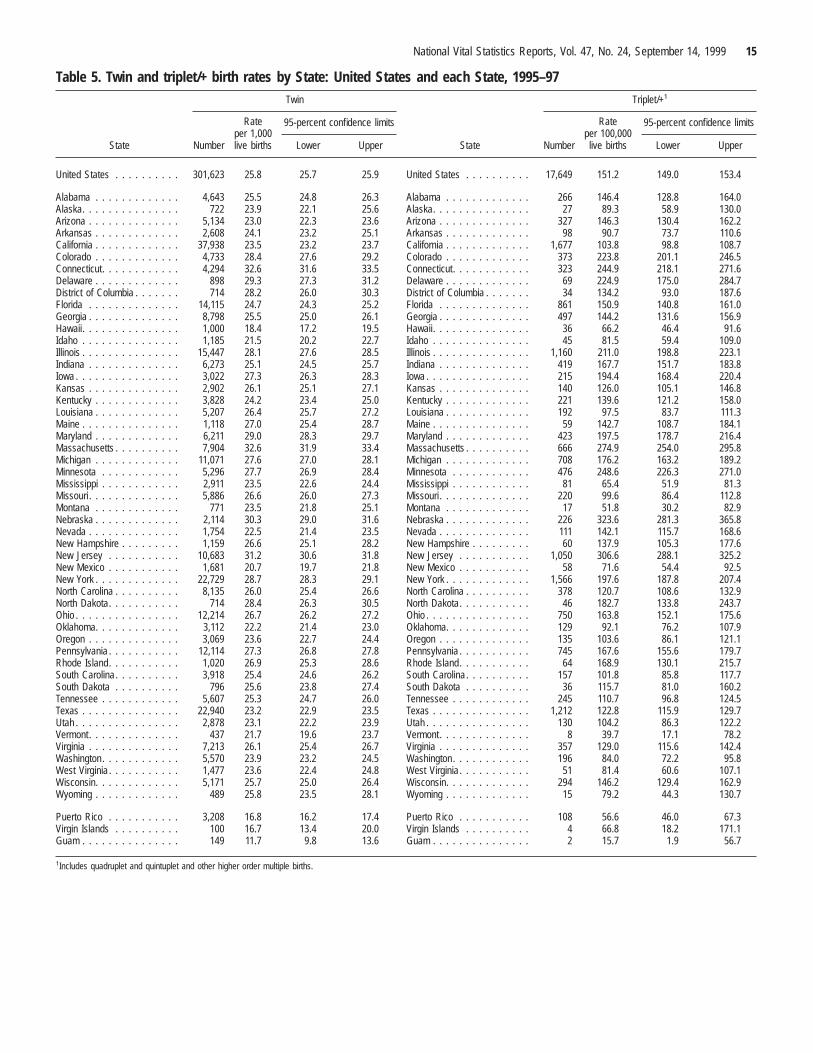
Table 5. Twin and triplet/+ birth rates by State: United States and each State, 1995–97
State
Twin
State
Triplet/+1
Number
Rateper 1,000live births
95-percent confidence limits
Number
Rateper 100,000
live births
95-percent confidence limits
Lower Upper Lower Upper
United States . . . . . . . . . . 301,623 25.8 25.7 25.9 United States . . . . . . . . . . 17,649 151.2 149.0 153.4
Alabama . . . . . . . . . . . . . 4,643 25.5 24.8 26.3 Alabama . . . . . . . . . . . . . 266 146.4 128.8 164.0Alaska. . . . . . . . . . . . . . . 722 23.9 22.1 25.6 Alaska. . . . . . . . . . . . . . . 27 89.3 58.9 130.0Arizona . . . . . . . . . . . . . . 5,134 23.0 22.3 23.6 Arizona . . . . . . . . . . . . . . 327 146.3 130.4 162.2Arkansas . . . . . . . . . . . . . 2,608 24.1 23.2 25.1 Arkansas . . . . . . . . . . . . . 98 90.7 73.7 110.6California . . . . . . . . . . . . . 37,938 23.5 23.2 23.7 California . . . . . . . . . . . . . 1,677 103.8 98.8 108.7Colorado . . . . . . . . . . . . . 4,733 28.4 27.6 29.2 Colorado . . . . . . . . . . . . . 373 223.8 201.1 246.5Connecticut. . . . . . . . . . . . 4,294 32.6 31.6 33.5 Connecticut. . . . . . . . . . . . 323 244.9 218.1 271.6Delaware . . . . . . . . . . . . . 898 29.3 27.3 31.2 Delaware . . . . . . . . . . . . . 69 224.9 175.0 284.7District of Columbia . . . . . . . 714 28.2 26.0 30.3 District of Columbia . . . . . . . 34 134.2 93.0 187.6Florida . . . . . . . . . . . . . . 14,115 24.7 24.3 25.2 Florida . . . . . . . . . . . . . . 861 150.9 140.8 161.0Georgia . . . . . . . . . . . . . . 8,798 25.5 25.0 26.1 Georgia . . . . . . . . . . . . . . 497 144.2 131.6 156.9Hawaii. . . . . . . . . . . . . . . 1,000 18.4 17.2 19.5 Hawaii. . . . . . . . . . . . . . . 36 66.2 46.4 91.6Idaho . . . . . . . . . . . . . . . 1,185 21.5 20.2 22.7 Idaho . . . . . . . . . . . . . . . 45 81.5 59.4 109.0Illinois . . . . . . . . . . . . . . . 15,447 28.1 27.6 28.5 Illinois . . . . . . . . . . . . . . . 1,160 211.0 198.8 223.1Indiana . . . . . . . . . . . . . . 6,273 25.1 24.5 25.7 Indiana . . . . . . . . . . . . . . 419 167.7 151.7 183.8Iowa . . . . . . . . . . . . . . . . 3,022 27.3 26.3 28.3 Iowa . . . . . . . . . . . . . . . . 215 194.4 168.4 220.4Kansas . . . . . . . . . . . . . . 2,902 26.1 25.1 27.1 Kansas . . . . . . . . . . . . . . 140 126.0 105.1 146.8Kentucky . . . . . . . . . . . . . 3,828 24.2 23.4 25.0 Kentucky . . . . . . . . . . . . . 221 139.6 121.2 158.0Louisiana . . . . . . . . . . . . . 5,207 26.4 25.7 27.2 Louisiana . . . . . . . . . . . . . 192 97.5 83.7 111.3Maine . . . . . . . . . . . . . . . 1,118 27.0 25.4 28.7 Maine . . . . . . . . . . . . . . . 59 142.7 108.7 184.1Maryland . . . . . . . . . . . . . 6,211 29.0 28.3 29.7 Maryland . . . . . . . . . . . . . 423 197.5 178.7 216.4Massachusetts . . . . . . . . . . 7,904 32.6 31.9 33.4 Massachusetts . . . . . . . . . . 666 274.9 254.0 295.8Michigan . . . . . . . . . . . . . 11,071 27.6 27.0 28.1 Michigan . . . . . . . . . . . . . 708 176.2 163.2 189.2Minnesota . . . . . . . . . . . . 5,296 27.7 26.9 28.4 Minnesota . . . . . . . . . . . . 476 248.6 226.3 271.0Mississippi . . . . . . . . . . . . 2,911 23.5 22.6 24.4 Mississippi . . . . . . . . . . . . 81 65.4 51.9 81.3Missouri. . . . . . . . . . . . . . 5,886 26.6 26.0 27.3 Missouri . . . . . . . . . . . . . . 220 99.6 86.4 112.8Montana . . . . . . . . . . . . . 771 23.5 21.8 25.1 Montana . . . . . . . . . . . . . 17 51.8 30.2 82.9Nebraska . . . . . . . . . . . . . 2,114 30.3 29.0 31.6 Nebraska . . . . . . . . . . . . . 226 323.6 281.3 365.8Nevada . . . . . . . . . . . . . . 1,754 22.5 21.4 23.5 Nevada . . . . . . . . . . . . . . 111 142.1 115.7 168.6New Hampshire . . . . . . . . . 1,159 26.6 25.1 28.2 New Hampshire . . . . . . . . . 60 137.9 105.3 177.6New Jersey . . . . . . . . . . . 10,683 31.2 30.6 31.8 New Jersey . . . . . . . . . . . 1,050 306.6 288.1 325.2New Mexico . . . . . . . . . . . 1,681 20.7 19.7 21.8 New Mexico . . . . . . . . . . . 58 71.6 54.4 92.5New York . . . . . . . . . . . . . 22,729 28.7 28.3 29.1 New York . . . . . . . . . . . . . 1,566 197.6 187.8 207.4North Carolina . . . . . . . . . . 8,135 26.0 25.4 26.6 North Carolina . . . . . . . . . . 378 120.7 108.6 132.9North Dakota. . . . . . . . . . . 714 28.4 26.3 30.5 North Dakota. . . . . . . . . . . 46 182.7 133.8 243.7Ohio . . . . . . . . . . . . . . . . 12,214 26.7 26.2 27.2 Ohio . . . . . . . . . . . . . . . . 750 163.8 152.1 175.6Oklahoma. . . . . . . . . . . . . 3,112 22.2 21.4 23.0 Oklahoma. . . . . . . . . . . . . 129 92.1 76.2 107.9Oregon . . . . . . . . . . . . . . 3,069 23.6 22.7 24.4 Oregon . . . . . . . . . . . . . . 135 103.6 86.1 121.1Pennsylvania . . . . . . . . . . . 12,114 27.3 26.8 27.8 Pennsylvania . . . . . . . . . . . 745 167.6 155.6 179.7Rhode Island. . . . . . . . . . . 1,020 26.9 25.3 28.6 Rhode Island. . . . . . . . . . . 64 168.9 130.1 215.7South Carolina . . . . . . . . . . 3,918 25.4 24.6 26.2 South Carolina . . . . . . . . . . 157 101.8 85.8 117.7South Dakota . . . . . . . . . . 796 25.6 23.8 27.4 South Dakota . . . . . . . . . . 36 115.7 81.0 160.2Tennessee . . . . . . . . . . . . 5,607 25.3 24.7 26.0 Tennessee . . . . . . . . . . . . 245 110.7 96.8 124.5Texas . . . . . . . . . . . . . . . 22,940 23.2 22.9 23.5 Texas . . . . . . . . . . . . . . . 1,212 122.8 115.9 129.7Utah . . . . . . . . . . . . . . . . 2,878 23.1 22.2 23.9 Utah . . . . . . . . . . . . . . . . 130 104.2 86.3 122.2Vermont. . . . . . . . . . . . . . 437 21.7 19.6 23.7 Vermont. . . . . . . . . . . . . . 8 39.7 17.1 78.2Virginia . . . . . . . . . . . . . . 7,213 26.1 25.4 26.7 Virginia . . . . . . . . . . . . . . 357 129.0 115.6 142.4Washington. . . . . . . . . . . . 5,570 23.9 23.2 24.5 Washington. . . . . . . . . . . . 196 84.0 72.2 95.8West Virginia . . . . . . . . . . . 1,477 23.6 22.4 24.8 West Virginia . . . . . . . . . . . 51 81.4 60.6 107.1Wisconsin. . . . . . . . . . . . . 5,171 25.7 25.0 26.4 Wisconsin. . . . . . . . . . . . . 294 146.2 129.4 162.9Wyoming . . . . . . . . . . . . . 489 25.8 23.5 28.1 Wyoming . . . . . . . . . . . . . 15 79.2 44.3 130.7
Puerto Rico . . . . . . . . . . . 3,208 16.8 16.2 17.4 Puerto Rico . . . . . . . . . . . 108 56.6 46.0 67.3Virgin Islands . . . . . . . . . . 100 16.7 13.4 20.0 Virgin Islands . . . . . . . . . . 4 66.8 18.2 171.1Guam . . . . . . . . . . . . . . . 149 11.7 9.8 13.6 Guam . . . . . . . . . . . . . . . 2 15.7 1.9 56.7
1Includes quadruplet and quintuplet and other higher order multiple births.
National Vital Statistics Reports, Vol. 47, No. 24, September 14, 1999 15

T
rPSS
tatmT(a
bmbwHr
(tr(
16 National Vital Statistics Reports, Vol. 47, No. 24, September 14, 1999
echnical notes
Data for this report are based on 100 percent of birth certificatesegistered to U.S. residents for 1980–97. Tabulations by State includeuerto Rico, the Virgin Islands, and Guam but the totals for the Unitedtates do not include these areas. Data by plurality for Americanamoa were not available.
For 1997 the editing procedures for maternal age were changedo include ages 50–54 years. For 1963–96 mother’s age was edited forges 10–49 years; births reported to have occurred to mothers younger
han 10 and older than 49 were imputed according to the age of theother from the previous record with the same race and total birth order.he number of births to women aged 50–54 years in 1997 was small144) and, thus, this change results in essentially no discontinuity inge-specific birth rates for women aged 10–49 years (10).
Maternal race and Hispanic origin are reported separately on theirth certificate. Although most Hispanic births (97 percent) are to whiteothers, there are important differences in twin and triplet/+ birth ratesetween Hispanic and non-Hispanic white women. Therefore, startingith data year 1989 when information for the vast majority of theispanic origin reporting area became available, data are shown sepa-
ately for these groups.Except where accompanied by 95-percent confidence limits
table 5), rates are not computed if fewer than 20 events occurred inhe numerator or the denominator. Information on the calculation ofandom variation and relative standard error is provided in earlier reports7,10).
Suggested citation
Martin JA, Park MM. Trends in twin and triplet births: 1980–97. Nationalvital statistics reports; vol 47 no. 24. Hyattsville, Maryland: National Centerfor Health Statistics. 1999.
To receive this publication regularly, contact the National Center for HealthStatistics by calling 301-436-8500 E-mail: [email protected]: www.cdc.gov/nchswww/
National Center for Health Statistics
Director, Edward J. Sondik, Ph.D.Deputy Director, Jack R. Anderson
Division of Vital Statistics
Director, Mary Anne Freedman
Copyright information
All material appearing in this report is in the public domain and may bereproduced or copied without permission; citation as to source, however,is appreciated.
U.S. DEPARTMENT OFHEALTH & HUMAN SERVICESCenters for Disease Control and PreventionNational Center for Health Statistics6525 Belcrest RoadHyattsville, Maryland 20782-2003
DHHS Publication No. (PHS) 99–11209-0701 (9/99)
OFFICIAL BUSINESSPENALTY FOR PRIVATE USE, $300
ContentsAbstract . . . . . . . . . . . . . . . . . . . . . . . . . . . . . . . . . . . . . 1Introduction . . . . . . . . . . . . . . . . . . . . . . . . . . . . . . . . . . 1Twin births rise 52 percent; triplet/+ births 404 percent. . . 2Triplet births rise faster than quadruplets and otherhigher order multiples . . . . . . . . . . . . . . . . . . . . . . . . . . 2
More twins born to women 45–49 in 1997 thanduring the decade of the 1980’s . . . . . . . . . . . . . . . . . . 2
Early 1990’s marks shift in age-specific twin births . . . . . 3Triplet/+ rates rise 400 percent for women in their 30’s;1,000 percent for women in their 40’s . . . . . . . . . . . . . . 3
Historic differences in white and black twin birth rateserased . . . . . . . . . . . . . . . . . . . . . . . . . . . . . . . . . . . . . 3
Non-Hispanic white mothers more likely to have a triplet/+birth . . . . . . . . . . . . . . . . . . . . . . . . . . . . . . . . . . . . . . 4
Twin and triplet/+ rates of very low birthweight and lowbirthweight lowest for women 35–44 years . . . . . . . . . . 4
Nebraska and New Jersey triplet/+ rates twice thenational . . . . . . . . . . . . . . . . . . . . . . . . . . . . . . . . . . . . 5
Rise in multiples coincides with older childbearingand fertility therapies . . . . . . . . . . . . . . . . . . . . . . . . . . 5
References. . . . . . . . . . . . . . . . . . . . . . . . . . . . . . . . . . . 6List of detailed tables . . . . . . . . . . . . . . . . . . . . . . . . . . . 7Technical notes . . . . . . . . . . . . . . . . . . . . . . . . . . . . . . . 16
20 National Vital Statistics Reports, Vol. 47, No. 24, September 14, 1999
FIRST CLASS MAILPOSTAGE & FEES PAID
CDC/NCHSPERMIT NO. G-284